Initial volume of a drug before it reaches the volume of distribution: Pharmacokinetics of F(ab′)...
13
Toxicon 50 (2007) 653–665 Initial volume of a drug before it reaches the volume of distribution: Pharmacokinetics of F(ab 0 ) 2 antivenoms and other drugs Carlos Sevcik a, , Victor Salazar b , Patricia Dı´az a , Gina D’Suze a a Laboratory of Cellular Neuropharmacology, Apartado 21827, Caracas 1020A, Venezuela b Histology Service from the Centre de Biofı´sica y Bioquı´mica Institute Venezolano de Investigaciones Cientificas (IVIC), Apartado 21827, Caracas 1020A, Venezuela Received 16 March 2007; received in revised form 15 May 2007; accepted 29 May 2007 Available online 12 June 2007 Abstract Fast disappearance of F(ab 0 ) 2 antivenoms from the plasma compartment [Sevcik et al., 2004. Modelling Tityus scorpion venom and antivenom pharmacokinetics. Evidence of active immunoglobulin G’s F(ab 0 ) 2 extrusion mechanism from blood to tissues. Toxicon 44, 731–734; Vazquez et al., 2005. Pharmacokinetics of a F(ab 0 ) 2 scorpion antivenom in healthy human volunteers. Toxicon 46, 797–805] suggests a quick time course to reach its final distribution volume. An equation was developed to describe how the volume occupied by a drug in the body grows with time. As discussed in the paper this equation is free of some shortcomings of an equation developed for the same purpouse by Niazi [1976. Volume of distribution as a function of time. J. Pharm. Sci. 65, 452–454]. Fluorescence microscopy showed that the rapid initial decay in plasmatic F(ab 0 ) 2 concentration may be related to uptake of F(ab 0 ) 2 by vascular endothelium which, in combination with accumulation in the vascular wall connective tissue, may produce an intermediate plateau in F(ab 0 ) 2 V sl (t), which reached its final value after 10 h. The V sl (t) equation predicts that the plasma concentration half-time of decay has little use to estimate how a drug distributes through the body to exert its action, and predicts that, in some instances, intermediate plateaus in the time course of V sl (t) exist. Data from the literature showed that the kinetic considerations for V sl (t) also apply to clevidipine, digoxin, digitoxin, lidocaine and thiopentone. r 2007 Published by Elsevier Ltd. Keywords: Distribution volume; Antivenom; Pharmacokinetics; F(ab 0 ) 2 ; Immunotherapy 1. Introduction Two recent papers (Sevcik et al., 2004; Va´ zquez et al., 2005) suggest that scorpion F(ab 0 ) 2 antive- noms leave plasma in humans and in rams with a half-time ðt 1=2t 1 Þ of ¼ 15 min. In rams, F(ab 0 ) 2 ’s extravasation is about 4-fold faster than venom extravasation. The faster antivenom outflow can only be explained in terms of the existence of some kind of active mechanism of extrusion of F(ab 0 ) 2 through the vascular endothelium. The plasmatic F(ab 0 ) 2 concentration time course after a bolus in humans is represented by a multi- exponential equation (Va´zquez et al., 2005) such as CðtÞ¼ X z i¼1 C i e t=t i . (1) ARTICLE IN PRESS www.elsevier.com/locate/toxicon 0041-0101/$ - see front matter r 2007 Published by Elsevier Ltd. doi:10.1016/j.toxicon.2007.05.011 Corresponding author. Tel.: +58 212 504 1399; +58 412 931 9162 (mobile); fax: +58 212 504 1093. E-mail address: [email protected] (C. Sevcik).
-
Upload
independent -
Category
Documents
-
view
0 -
download
0
Transcript of Initial volume of a drug before it reaches the volume of distribution: Pharmacokinetics of F(ab′)...
ARTICLE IN PRESS
0041-0101/$ - see
doi:10.1016/j.tox
�Correspondi+58 412 931 916
E-mail addre
Toxicon 50 (2007) 653–665
www.elsevier.com/locate/toxicon
Initial volume of a drug before it reaches the volumeof distribution: Pharmacokinetics of F(ab0)2 antivenoms
and other drugs
Carlos Sevcika,�, Victor Salazarb, Patricia Dıaza, Gina D’Suzea
aLaboratory of Cellular Neuropharmacology, Apartado 21827, Caracas 1020A, VenezuelabHistology Service from the Centre de Biofısica y Bioquımica Institute Venezolano de Investigaciones Cientificas (IVIC),
Apartado 21827, Caracas 1020A, Venezuela
Received 16 March 2007; received in revised form 15 May 2007; accepted 29 May 2007
Available online 12 June 2007
Abstract
Fast disappearance of F(ab0)2 antivenoms from the plasma compartment [Sevcik et al., 2004. Modelling Tityus scorpion
venom and antivenom pharmacokinetics. Evidence of active immunoglobulin G’s F(ab0)2 extrusion mechanism from blood to
tissues. Toxicon 44, 731–734; Vazquez et al., 2005. Pharmacokinetics of a F(ab0)2 scorpion antivenom in healthy human
volunteers. Toxicon 46, 797–805] suggests a quick time course to reach its final distribution volume. An equation was developed
to describe how the volume occupied by a drug in the body grows with time. As discussed in the paper this equation is free of
some shortcomings of an equation developed for the same purpouse by Niazi [1976. Volume of distribution as a function of time.
J. Pharm. Sci. 65, 452–454]. Fluorescence microscopy showed that the rapid initial decay in plasmatic F(ab0)2 concentration may
be related to uptake of F(ab0)2 by vascular endothelium which, in combination with accumulation in the vascular wall connective
tissue, may produce an intermediate plateau in F(ab0)2 Vsl(t), which reached its final value after 10h. The Vsl(t) equation predicts
that the plasma concentration half-time of decay has little use to estimate how a drug distributes through the body to exert its
action, and predicts that, in some instances, intermediate plateaus in the time course of Vsl(t) exist. Data from the literature
showed that the kinetic considerations for Vsl(t) also apply to clevidipine, digoxin, digitoxin, lidocaine and thiopentone.
r 2007 Published by Elsevier Ltd.
Keywords: Distribution volume; Antivenom; Pharmacokinetics; F(ab0)2; Immunotherapy
1. Introduction
Two recent papers (Sevcik et al., 2004; Vazquezet al., 2005) suggest that scorpion F(ab0)2 antive-noms leave plasma in humans and in rams with ahalf-time ðt1=2t1Þ of ¼ 15min. In rams, F(ab0)2’sextravasation is about 4-fold faster than venom
front matter r 2007 Published by Elsevier Ltd.
icon.2007.05.011
ng author. Tel.: +58212 504 1399;
2 (mobile); fax: +58212 504 1093.
ss: [email protected] (C. Sevcik).
extravasation. The faster antivenom outflow canonly be explained in terms of the existence of somekind of active mechanism of extrusion of F(ab0)2through the vascular endothelium.
The plasmatic F(ab0)2 concentration time courseafter a bolus in humans is represented by a multi-exponential equation (Vazquez et al., 2005) such as
CðtÞ ¼Xz
i¼1
Cie�t=ti . (1)
ARTICLE IN PRESSC. Sevcik et al. / Toxicon 50 (2007) 653–665654
Setting z ¼ 3 and using the median human valuesof the Ci, and ti (Vazquez et al., 2005), afteradministering a F(ab0)2 bolus (D) of 47.5mg:C1, ¼ 8.6 mg/ml, C2 ¼ 5.7 mg/ml, C3 ¼ 2.4 mg/ml,t1 ¼ 0.36 h, t2 ¼ 4.7 h and t3 ¼ 232.7 h [C3 and t3as used here appear as C4 and t4 in Vazquez et al.(2005)]. With these parameters and Eq. (1), theinitial concentration in the central compartment is
Cp0 ¼ limt!0
CðtÞ ¼X3i¼1
Ci ¼ 16:7mg=ml: (2)
Other common pharmacokinetics (PK) para-meters may be defined as follows (Gibaldi andPerrier, 1982). The area under the curve at t ¼N is
AUC1 ¼
Z 10
CðtÞdt ¼X3i¼1
ðtiCiÞ ¼ 588:4 mg h=l:
(3)
The initial plasmatic distribution volume (alsocalled central compartment volume) is
Vc ¼DP3
i¼1Ci
¼ 2:84 l: (4)
The apparent volume of distribution during theslowest component is
Vz ¼Dt3
AUC1¼ 18:79 l: (5)
Another parameter of interest is the area underthe first moment curve
AUMC1 ¼
Z 10
tCðtÞ dt ¼X3i¼1
ðt2i CiÞ ¼ 130:1mg h2=l:
(6)
Finally, the mean residence time (mean time amolecule stays in the body) is
MRT ¼
R10 tCðtÞdtR10 CðtÞdt
¼AUMC1
AUC1¼ 221:2 h: (7)
From the PK of F(ab0)2 in humans it wasconcluded that ‘‘F(ab0)2 antivenoms are the bestchoice treatment for their fast extravasation ðt1=2;t1 Þ,their ample distribution into the extracellular space(Vss and Vz) and their prolonged MRT’’ (Vazquezet al., 2005). We now study the dynamics of thevolume occupied by a drug from administration timeto its final distribution volume. We use both PKconsiderations and fluorescent microscopy of F(ab0)2labelled with fluorescein isothiocyanate (FITC) invivo and in frozen sections of tissues, in mice.
2. Methods and materials
2.1. Labalelling F(ab0)2
Labelling with FITC was done (Sevcik et al.,2004) using 2 ampoules (10ml) of a horse F(ab0)2antivenom (Suero AntiescorpionicoTM, Centro deBiotecnologıa, Facultad de Farmacia, UniversidadCentral de Venezuela, Caracas), which were mixedwith 4.5ml of 50mM sodium borate buffer, pH 9.6,and 0.5ml of a solution of 4% FITC in acetone wasadded under vigorous agitation in a vortex stirrer.The tube was then completely covered with alumi-nium foil and the mixture was left at roomtemperature (E22 1C) for 6 h and then at 4 1C for12–36 h. The mixture was then washed by ultra-fitration with 150ml of 50mM sodium boratebuffer, pH 8, through an AMICON-Milliporemembrane (PBDK type, 50 kDa cut-off, 25mmdiameter) under nitrogen pressure (4 bar) at 10 1C indarkness. The labelled material was thus reduced tobetween 5 and 6ml and washing buffer was addedto make 10ml. The final product was kept in a smallballoon wrapped in aluminium foil and stored at4 1C for not more than 24 h before using it.
2.2. Animal source and care
Male white mice (Balb/C mice (25–30 g) n ¼ 8,IVIC strain) were obtained from the central IVICanimal facility and kept with food and water adlibitum in our centre’s animal room. Mice wereanaesthetized injecting SQ 100 ml of a mixture 1mlof ketamine solution (100mg/ml), 1ml of xilazinesolution (100mg/ml) and 4.6ml of saline (NaCI0.9%), which is equivalent to 50mg/kg of eachdrug. Immediately, a catheter was introduced in atail vein or the right carotid vein (the last route waspreferred) or for administration of Evans Blue,saline or FITC-labelled F(ab0)2 [E2.9 mg/g, FITC-F(ab0)2] (Bucci et al., 2000). Control animalsreceived either sterile saline or Evans Blue in sterilesaline (33 mg/g, Sigma Chemical Co., St. Louis, MO)(Corada et al., 1999). Fifteen minutes after injectionvital observation of intestinal loop capillaries wasperformed, or the animals were killed and processedfor histology and imaging.
2.3. Fluorescence microscopy of F(ab0)2
Vital video microscopy of fluorescent probecirculation in the intestinal loop was done as by
ARTICLE IN PRESSC. Sevcik et al. / Toxicon 50 (2007) 653–665 655
Yamamoto et al. (2002) with some modifications:15min after injecting the probes a laparotomy wasperformed and an intestinal loop was exposed; ajejunum portion, was placed in a Lucite sheet andkept continuously moist with sterile saline. Thecapillaries were visualized by epifluorescence usingthe filters for FITC and Evans Blue and the imageswere captured using the conditions and systems asindicated below; for qualitative purposes the videoswere digitally recorded, as indicated below. Liver,spleen and kidney were excised and washed inphosphate-buffered saline (PBS) to wash blood;samples of each organ were cryoprotected beforefreezing, embedded in Shandon CryomatrixTM
(Thermo Electron Corporation, Anatomical Patho-logy, Pittsburg, PA), frozen in liquid nitrogen andthen stored at �80 1C until used (Bhatti et al., 2003).Sections (8 mm thick) were cut with a cryostatmicrotome at �20 1C and mounted on glass slidescoated with poly-L-lysine (Zhu et al., 2000). Sectionswere air dried, directly mounted in immersion oil forfluorescence microscopy (Nikon type A) with nonuclear staining or other treatment. Another groupof sections was fixed in acetone at �20 1C for 5minand washed in PBS for 6min (three changes). Thenuclear stain 4,6-diamidino-2-phenylindole dihy-drochloride (DAPI; 1 mg/ml in PBS) was used aftercell fixation, and unincorporated probe was re-moved by rinsing with PBS. Sections were mountedin PBS or 25% glycerol in PBS. For histologicalstudies, a random sample was obtained by analysingat least five well-prepared sections of each specimen.Sections were viewed using phase contrast andstandard epifluorescence on a Nikon E600 uprightmicroscope (Nippon Kogahu KK, Tokyo, Japan)with a 40� plan-apochromatic objective with 0.75numerical aperture. Filter UV-2A was used forDAPI, and filter B2A for FITC or Evans Blueepifluorescence. The DAPI counterstaining proce-dure somewhat washed out the fluorescence corre-sponding to FITC-F(ab0)2. The ImageJ (version1.34s) public domain Java image processing pack-age (National Institute of Health, Bethesda, MD,USA) was used.
2.4. Mathematical methods
All equations not referred to the PK literature inthis work were deduced or verified using theMathematica v5.1 for Linux (Wolfram ResearchInc., Champaign, IL, USA). Data were plottedusing the Scilab (v4 rcl) free Scientific Software
Package (The Scilab Consortium, INRIA, LeChesnay Cedex, France, http://www.scilab.org).
3. Results
3.1. Time course of F(ab0)2 distribution volume from
slope
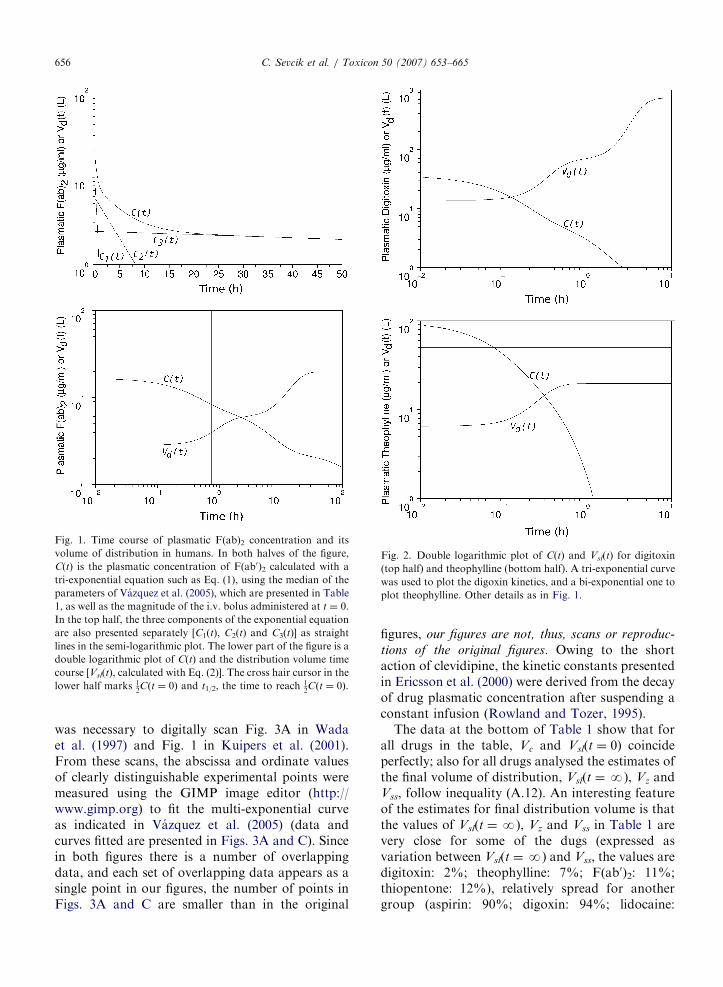
In Fig. 1 (top panel), we present a plot oflogarithm of C(t) versus time for F(ab0)2 in humanscalculated with the parameters indicated in Section 1;three straight lines present the time course of each ofthe tri-exponential components of C(t). The lowerpanel of Fig. 1 is a double logarithmic plot of C(t)and Vsl(t) calculated with Eqs. (1) and (A.7) (deducedin the mathematical Appendix A), respectively, withthe same parameters used in the top panel. There arethree features worth noticing. Firstly, in spite of theshort tlt, Vsl(t) increases only from 2.8 to 3.8 l (35%)while C(t) decreases from 18.8 ðCP0
Þ to 9.4 ng/ml.Secondly, after C(t) reaches 1=2CP0
, Vsl(t)’s rate ofchange first increases and then decreases for sometime in a semi-plateau with Vsl(t)E8 l in �2 h.Thirdly, after the semi-plateau, the rate of changeof Vsl(t) increases until the distribution volume slopesoff to its final steady value of 19.7 l in ¼ 20h. Theshort t1, thus, does not mean that F(ab0)2 reaches itsfinal volume of distribution rapidly.
3.2. Time course of other drugs’ Vsl(t)
The top of Fig. 2 is a plot of C(t) and Vsl(t) fordigitoxin (Ochs et al., 1981) and theophylline(Rowland and Tozer, 1995) using the parametersin Table 1. As it may be appreciated, Vsl(t) fordigitoxin has a semi-plateau, centred at about 1 hpost-injection, and reaches the final volume ofdistribution after 8 h. The intermediate plateauis absent in the case of theophylline. Digitoxin PKis tri-exponential while theophylline is bi-exponen-tial; still, although the theophylline plasmatic half-time of decay is between 7 and 8min, it takes closeto 1 h for its distribution volume reach a steadystate.
We scanned the PK literature and found fiveadditional examples interesting to the present work(summarized in Table 1): aspirin (Rowland andTozer, 1995), clevidipine (Ericsson et al, 2000),digitoxin (Ochs et al., 1981), digoxin (Ochs et al.,1981), lidocaine (Kuipers et al., 2001) and thiopen-tone (Wada et al., 1997). To build a multi-exponential model for thiopentone and lidocaine it
ARTICLE IN PRESS
Fig. 1. Time course of plasmatic F(ab)2 concentration and its
volume of distribution in humans. In both halves of the figure,
C(t) is the plasmatic concentration of F(ab0)2 calculated with a
tri-exponential equation such as Eq. (1), using the median of the
parameters of Vazquez et al. (2005), which are presented in Table
1, as well as the magnitude of the i.v. bolus administered at t ¼ 0.
In the top half, the three components of the exponential equation
are also presented separately [C1(t), C2(t) and C3(t)] as straight
lines in the semi-logarithmic plot. The lower part of the figure is a
double logarithmic plot of C(t) and the distribution volume time
course [Vsl(t), calculated with Eq. (2)]. The cross hair cursor in the
lower half marks 12Cðt ¼ 0Þ and t1/2, the time to reach 1
2Cðt ¼ 0Þ.
Fig. 2. Double logarithmic plot of C(t) and Vsl(t) for digitoxin
(top half) and theophylline (bottom half). A tri-exponential curve
was used to plot the digoxin kinetics, and a bi-exponential one to
plot theophylline. Other details as in Fig. 1.
C. Sevcik et al. / Toxicon 50 (2007) 653–665656
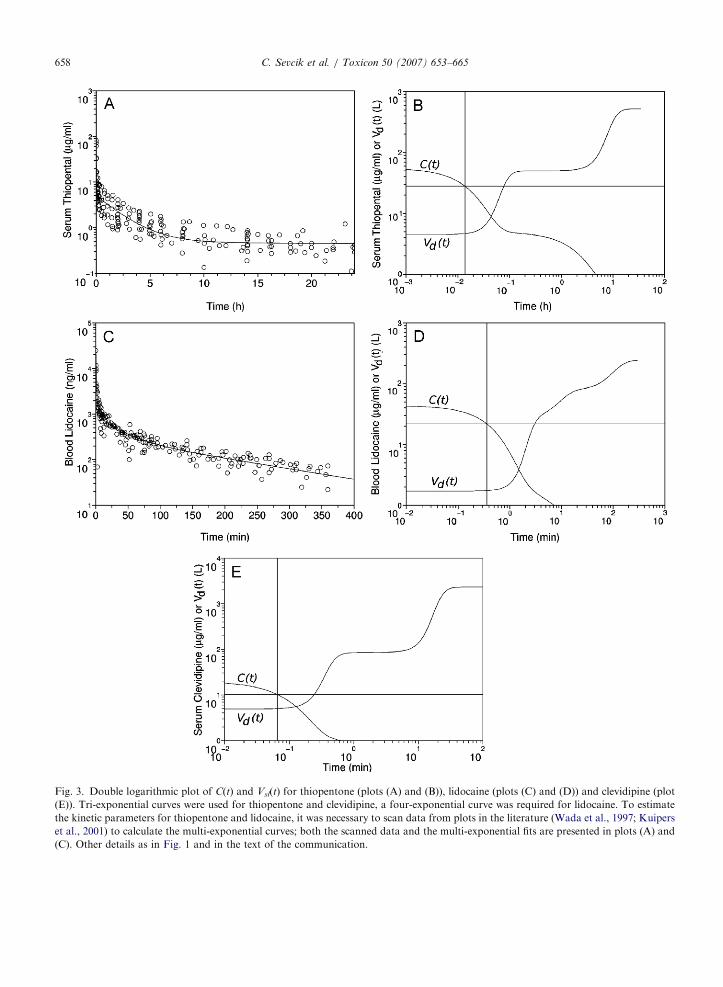
was necessary to digitally scan Fig. 3A in Wadaet al. (1997) and Fig. 1 in Kuipers et al. (2001).From these scans, the abscissa and ordinate valuesof clearly distinguishable experimental points weremeasured using the GIMP image editor (http://www.gimp.org) to fit the multi-exponential curveas indicated in Vazquez et al. (2005) (data andcurves fitted are presented in Figs. 3A and C). Sincein both figures there is a number of overlappingdata, and each set of overlapping data appears as asingle point in our figures, the number of points inFigs. 3A and C are smaller than in the original
figures, our figures are not, thus, scans or reproduc-
tions of the original figures. Owing to the shortaction of clevidipine, the kinetic constants presentedin Ericsson et al. (2000) were derived from the decayof drug plasmatic concentration after suspending aconstant infusion (Rowland and Tozer, 1995).
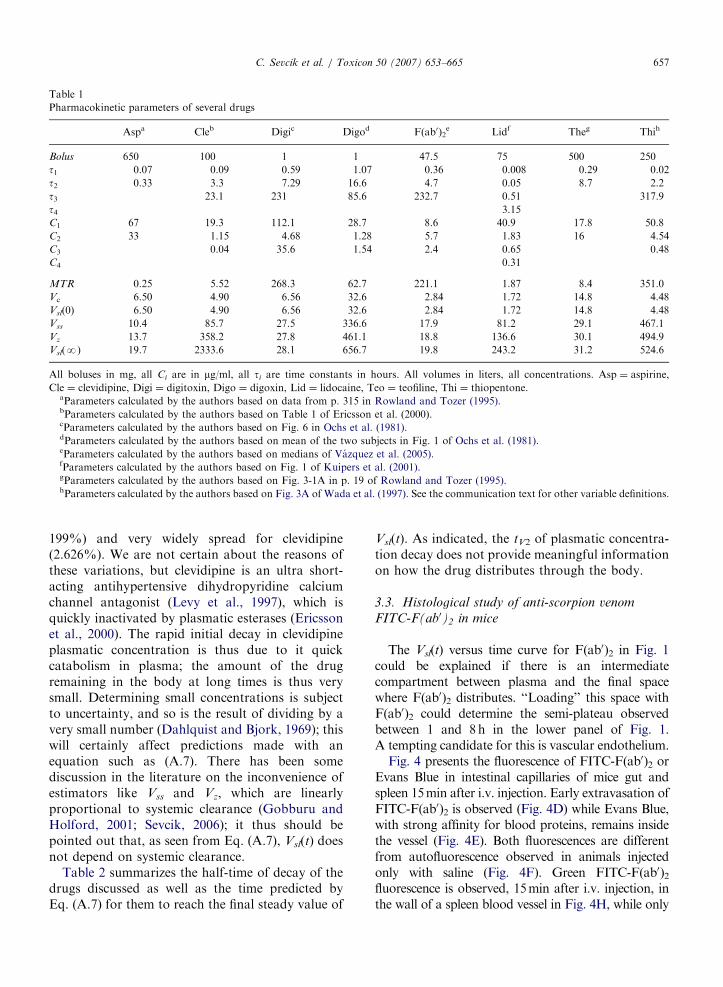
The data at the bottom of Table 1 show that forall drugs in the table, Vc and Vsl(t ¼ 0) coincideperfectly; also for all drugs analysed the estimates ofthe final volume of distribution, Vsl(t ¼N), Vz andVss, follow inequality (A.12). An interesting featureof the estimates for final distribution volume is thatthe values of Vsl(t ¼N), Vz and Vss in Table 1 arevery close for some of the dugs (expressed asvariation between Vsl(t ¼N) and Vss, the values aredigitoxin: 2%; theophylline: 7%; F(ab0)2: 11%;thiopentone: 12%), relatively spread for anothergroup (aspirin: 90%; digoxin: 94%; lidocaine:
ARTICLE IN PRESS
Table 1
Pharmacokinetic parameters of several drugs
Aspa Cleb Digic Digod F(ab0)2e Lidf Theg Thih
Bolus 650 100 1 1 47.5 75 500 250
t1 0.07 0.09 0.59 1.07 0.36 0.008 0.29 0.02
t2 0.33 3.3 7.29 16.6 4.7 0.05 8.7 2.2
t3 23.1 231 85.6 232.7 0.51 317.9
t4 3.15
C1 67 19.3 112.1 28.7 8.6 40.9 17.8 50.8
C2 33 1.15 4.68 1.28 5.7 1.83 16 4.54
C3 0.04 35.6 1.54 2.4 0.65 0.48
C4 0.31
MTR 0.25 5.52 268.3 62.7 221.1 1.87 8.4 351.0
Vc 6.50 4.90 6.56 32.6 2.84 1.72 14.8 4.48
Vsl(0) 6.50 4.90 6.56 32.6 2.84 1.72 14.8 4.48
Vss 10.4 85.7 27.5 336.6 17.9 81.2 29.1 467.1
Vz 13.7 358.2 27.8 461.1 18.8 136.6 30.1 494.9
Vsl(N) 19.7 2333.6 28.1 656.7 19.8 243.2 31.2 524.6
All boluses in mg, all Ci are in mg/ml, all ti are time constants in hours. All volumes in liters, all concentrations. Asp ¼ aspirine,
Cle ¼ clevidipine, Digi ¼ digitoxin, Digo ¼ digoxin, Lid ¼ lidocaine, Teo ¼ teofiline, Thi ¼ thiopentone.aParameters calculated by the authors based on data from p. 315 in Rowland and Tozer (1995).bParameters calculated by the authors based on Table 1 of Ericsson et al. (2000).cParameters calculated by the authors based on Fig. 6 in Ochs et al. (1981).dParameters calculated by the authors based on mean of the two subjects in Fig. 1 of Ochs et al. (1981).eParameters calculated by the authors based on medians of Vazquez et al. (2005).fParameters calculated by the authors based on Fig. 1 of Kuipers et al. (2001).gParameters calculated by the authors based on Fig. 3-1A in p. 19 of Rowland and Tozer (1995).hParameters calculated by the authors based on Fig. 3A of Wada et al. (1997). See the communication text for other variable definitions.
C. Sevcik et al. / Toxicon 50 (2007) 653–665 657
199%) and very widely spread for clevidipine(2.626%). We are not certain about the reasons ofthese variations, but clevidipine is an ultra short-acting antihypertensive dihydropyridine calciumchannel antagonist (Levy et al., 1997), which isquickly inactivated by plasmatic esterases (Ericssonet al., 2000). The rapid initial decay in clevidipineplasmatic concentration is thus due to it quickcatabolism in plasma; the amount of the drugremaining in the body at long times is thus verysmall. Determining small concentrations is subjectto uncertainty, and so is the result of dividing by avery small number (Dahlquist and Bjork, 1969); thiswill certainly affect predictions made with anequation such as (A.7). There has been somediscussion in the literature on the inconvenience ofestimators like Vss and Vz, which are linearlyproportional to systemic clearance (Gobburu andHolford, 2001; Sevcik, 2006); it thus should bepointed out that, as seen from Eq. (A.7), Vsl(t) doesnot depend on systemic clearance.
Table 2 summarizes the half-time of decay of thedrugs discussed as well as the time predicted byEq. (A.7) for them to reach the final steady value of
Vsl(t). As indicated, the tV2 of plasmatic concentra-tion decay does not provide meaningful informationon how the drug distributes through the body.
3.3. Histological study of anti-scorpion venom
FITC-F(ab0)2 in mice
The Vsl(t) versus time curve for F(ab0)2 in Fig. 1could be explained if there is an intermediatecompartment between plasma and the final spacewhere F(ab0)2 distributes. ‘‘Loading’’ this space withF(ab0)2 could determine the semi-plateau observedbetween 1 and 8h in the lower panel of Fig. 1.A tempting candidate for this is vascular endothelium.
Fig. 4 presents the fluorescence of FITC-F(ab0)2 orEvans Blue in intestinal capillaries of mice gut andspleen 15min after i.v. injection. Early extravasation ofFITC-F(ab0)2 is observed (Fig. 4D) while Evans Blue,with strong affinity for blood proteins, remains insidethe vessel (Fig. 4E). Both fluorescences are differentfrom autofluorescence observed in animals injectedonly with saline (Fig. 4F). Green FITC-F(ab0)2fluorescence is observed, 15min after i.v. injection, inthe wall of a spleen blood vessel in Fig. 4H, while only
ARTICLE IN PRESS
Fig. 3. Double logarithmic plot of C(t) and Vsl(t) for thiopentone (plots (A) and (B)), lidocaine (plots (C) and (D)) and clevidipine (plot
(E)). Tri-exponential curves were used for thiopentone and clevidipine, a four-exponential curve was required for lidocaine. To estimate
the kinetic parameters for thiopentone and lidocaine, it was necessary to scan data from plots in the literature (Wada et al., 1997; Kuipers
et al., 2001) to calculate the multi-exponential curves; both the scanned data and the multi-exponential fits are presented in plots (A) and
(C). Other details as in Fig. 1 and in the text of the communication.
C. Sevcik et al. / Toxicon 50 (2007) 653–665658

ARTICLE IN PRESS
Table 2
Approximate plasmatic half-time of decay and time to reach Vsl(N)
Asp Cle Digi Digo F(ab0)2 Lid Teo Thi
�t1/2 0.7 0.001 0.1 0.5 0.7 0.04 1 0.01
T-Vsl(N) X8 X0.6 X80 X200 X20 X200 X1 X10
Asp ¼ aspirine, Cle ¼ clevidipine, Digi ¼ digitoxin, Digo ¼ digoxin, Lid ¼ lidocaine, Teo ¼ teofiline, Thi ¼ thiopentone.
All times in hours.
C. Sevcik et al. / Toxicon 50 (2007) 653–665 659
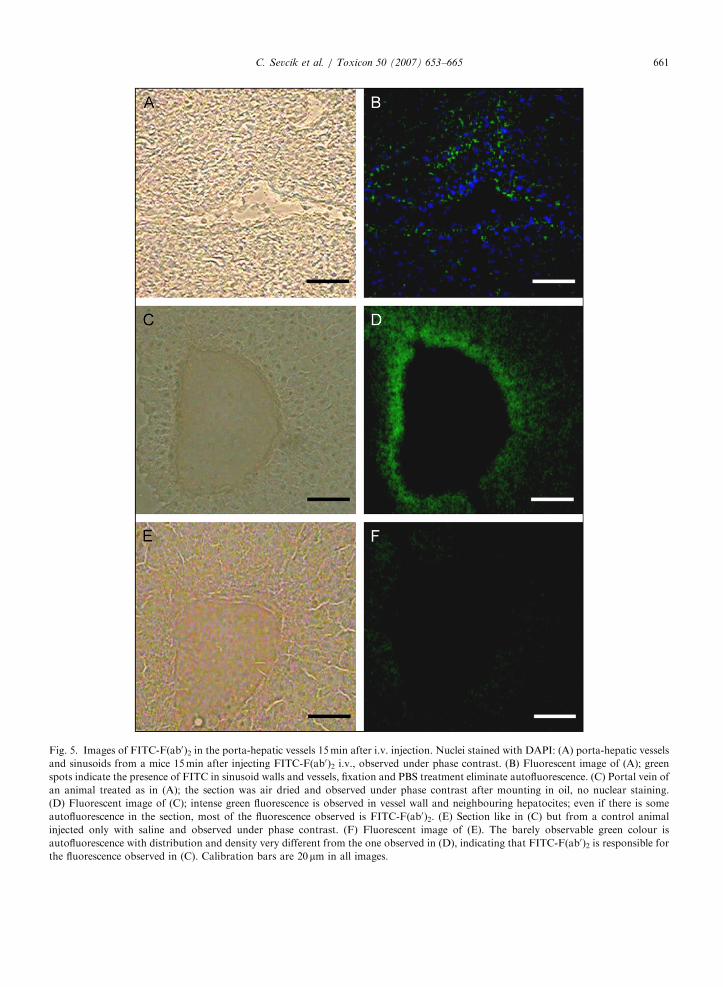
minimal autofluorescence spots are appreciated in aspleen section similar to the one shown in Figs. 4Gand H, and from a control mouse injected only withsaline (Fig. 4J). Fig. 5 shows that, on top of someautofluorescence, a neat green fluorescence appears insinusoid endothelium (Fig. 5B) and porta-hepaticvessel walls (Fig. 5D) 15min after FITC-F(ab0)2 i.v.injection. FITC-F(ab0)2 fluorescence spreads even intothe neighbouring hepatocytes (Figs. 5B and D). Fig. 6shows that kidney vascular epithelium also showsFITC-F(ab0)2 fluorescence 15min after i.v. injection.Enlargements E and F in Fig. 6 show that it is possibleto differentiate between autofluorescence of elasticfibres and of FITC-F(ab0)2-loaded endothelial cells.
4. Discussion
An attempt to describe the changes of distribu-tion volume to estimate the amount of drugremaining in the body at any given time after ani.v. injection was done by Niazi (1976) using anequation proposed by Chiou (1972). Three assump-tions are crucial to obtain Niazi’s equation. First,when a drug is introduced in the body byintravenous injection, it begins to be eliminatedand to be distributed to other parts of the bodyinstantaneously; second, the model is a multi-compartment system where the drug is eliminatedonly from the central compartment (blood); third,the concentration of drug that is free in the centralcompartment is in instantaneous equilibrium withthe free drug in all the compartments. Using thedefinition of fractional area of Chiou (1972), theamount of drug remaining in the body (DB) (Niazi,1976) as function of time may be expressed as
DB ¼ DA
AUCt!1
AUC1¼ DA
R1t
CðtÞdt
AUC1
¼ DA
R1t
Pzi¼1Cie
�t=ti� �
dt
AUC1¼ DA
Pzi¼1Cite�t=ti
AUC1,
ð8Þ
where DA is the mass of drug available in the bodyafter administering a bolus D. Under this assump-tion according to Niazi (1976) and for a tri-exponential situation we should have that
VnzðtÞ ¼DB
CðtÞ¼
DA
AUC1
X3i¼1
Cite�t=ti
! X3i¼1
Cie�t=ti
!�1.
(9)
For very long times, if
t1ot2o � � �otz�1 o�tz, (10)
where the symbol o�
means ‘‘tz�1, is sufficientlysmaller than tz’’, then
limt!1
VnzðtÞ ~4DAtz
AUC1¼ V z, (11)
where Vz is the volume in the terminal phase(Gobburu and Holford, 2001; Anonymous, 2004;Sevcik, 2006). A severe shortcoming of Eqs. (9) and(11) is the second of the assumptions above;there are very few drugs thath are eliminatedonly, or even mainly, from the plasma compart-ment. Furthermore, if (for example) the rate ofelimination of the drug is extremely slow or closeto nil, the kinetics of distribution may still bemulti-exponential but in this case Eq. (9) lacksmeaning, and Eq. (11) is thus also meaningless.Such a situation may happen for slowly eliminateddrugs, for drugs that distribute mostly into fattytissues (Brodie et al., 1952; Wada et al., 1997) ordrugs with a high density of vascular and extravascular high-affinity sites such as digoxin (Ochset al., 1981). An example of drugs extremelyslowly eliminated are i.v. iron agents; after injectingi.v. up to 500mg of a medically useful ironcompound, plasma Fe concentration decays withfirst-order kinetics and a t1/2 of 20 and 60 h(Danielson, 2004); for any practical purpose,no iron is eliminated from the body in such time.In the absence of bleeding, the iron eliminationfrom the body is E1mg/day (Green et al., 1968); it

ARTICLE IN PRESS
Fig. 4. Fluorescence of FITC-F(ab0)2 in intestinal capillaries of mice gut and spleen. Nuclei were stained with DAPI: (A) Intestinal
capillaries treated with FITC-F(ab0)2. (B) Intestinal capillaries of an animal injected with Evans Blue. (C) Intestinal capillaries of an animal
injected with 0.9% NaCI. (D) Digitally processed fluorescent image of (A); green spots indicate probe extravasation. (E) Digitally
processed fluorescent image of (B). (F) Digitally processed fluorescent image of (C) showing autofluorescence. (G) Spleen section of a
mouse injected with FITC-F(ab0)2, the section was air died without nuclear staining, mounted in immersion oil and observed under phase
contrast; an arrow points to a splenic vessel. (H) Fluorescent image of (G), an arrow points to a vessel and to the green FITC-F(ab0)2fluorescence. (I) Air-dried oil-mounted spleen section of a control animal injected only with saline with no nuclear staining. (J) Fluorescent
image of I, an arrow points to the vessel, a few green autofluorescence spots may be seen. Calibration bars are 20mm for (G)–(J), and are
40mm for other micrographs.
C. Sevcik et al. / Toxicon 50 (2007) 653–665660
ARTICLE IN PRESS
Fig. 5. Images of FITC-F(ab0)2 in the porta-hepatic vessels 15min after i.v. injection. Nuclei stained with DAPI: (A) porta-hepatic vessels
and sinusoids from a mice 15min after injecting FITC-F(ab0)2 i.v., observed under phase contrast. (B) Fluorescent image of (A); green
spots indicate the presence of FITC in sinusoid walls and vessels, fixation and PBS treatment eliminate autofluorescence. (C) Portal vein of
an animal treated as in (A); the section was air dried and observed under phase contrast after mounting in oil, no nuclear staining.
(D) Fluorescent image of (C); intense green fluorescence is observed in vessel wall and neighbouring hepatocites; even if there is some
autofluorescence in the section, most of the fluorescence observed is FITC-F(ab0)2. (E) Section like in (C) but from a control animal
injected only with saline and observed under phase contrast. (F) Fluorescent image of (E). The barely observable green colour is
autofluorescence with distribution and density very different from the one observed in (D), indicating that FITC-F(ab0)2 is responsible for
the fluorescence observed in (C). Calibration bars are 20mm in all images.
C. Sevcik et al. / Toxicon 50 (2007) 653–665 661

ARTICLE IN PRESS
Fig. 6. Kidney artery sections. Nuclei stained with DAPI: (A) Longitudinal artery section from an a mouse 15min after injecting
FITC-F(ab0)2 i.v., observation under phase contrast. (B) Fluorescent image of (A); the green colour corresponds to extravasated probe and
to elastic fibres, blue colour marks nuclei. (C) Transversal section of an artery from a control mouse injected only with saline observed
under phase contrast, an arrow points to the elastic lamina. (D) Fluorescent image of (C), most of the green fluorescence (pointed with an
arrow) comes from elastic fibres. (E) Enlargement of the vessel wall near the lumen of the artery shown in (B); an arrow points to the
endothelium with a thick fluorescent zone. This thick fluorescence does not exist in the same zone of a control mouse injected with saline
(arrow in (F)), where only a thin layer of fluorescent elastic fibres appears. FITC-F(ab0)2 extravasation is also marked in with an
arrowhead in (E); the last extravasation is absent from the controls as indicated (arrowhead) in (F) in a zone neighbouring the elastic layer.
Calibration bars are 40 mm for (A)–(D), and are 20mm in (E) and (F).
C. Sevcik et al. / Toxicon 50 (2007) 653–665662
will thus take 250 days (6000 h) to eliminate halfthe maximum dose indicated above, and 50 days(1200 h) to eliminate half of 100mg iron, the usualdaily dose of ferric saccharate, which according toGeisser et al. (1992) has a plasmatic t1/2p10 h. Insuch instances, drug PK is mostly due to drugdistribution during relatively long times, and thefractional area as, defined by Chiou (1972), does not
estimate the drug remaining in the body, except inthe limit condition when tEN. The fluorescencemicroscopy evidence on FITC-F(ab0)2 extravasationpresented in this communication, also shows thatthe third condition required by Eq. (9) to hold isuntrue. The concentration in the different compart-ments does not reach equilibrium, neither instanta-neously nor simultaneously.

ARTICLE IN PRESSC. Sevcik et al. / Toxicon 50 (2007) 653–665 663
Eq. (A.7) describes the time dependency of thePK volume of distribution and is less constrainedthan Niazi’s (1976) equation. Eq. (A.7) predicts thatthe transition between the initial volume of dis-tribution [Vsl(0)] and its final steady value mayinvolve intermediate semi-stable plateaus in drugs,where the dependence between plasmatic concen-tration and time is multi-exponential. The equationalso indicates that the time to half initial plasmaticconcentration provides very limited information onthe way drugs distribute in the body, since the timeto final steady volume of distribution may be ordersof magnitude more prolonged than t1/2.
The time course of Vsl(t) calculated for i.v. aspirin(not shown) was qualitatively similar to theophyl-line. The time course of Vsl(t) for i.v. digoxin (notshown) was slower but qualitatively similar todigitoxin, had an almost completely steady plateaubetween 8 and 20 h and then increased to reach afinal steady value after 200 h. Fig. 3 presents thetime course of C(t) and Vsl(t) for thiopentone(Figs. 3A and B), lidocaine (Figs. 3C and D) andclevidipine (Fig. 3E). As may be appreciated, boththiopentone and clevidipine, with tri-exponentialPK, have very neat plateaus between the onset ofplasmatic concentration decay after the i.v. bolusand the final steady state of Vsl(t). Lidocaine, on theother hand, has a four-exponential kinetics, butwith only one neat final plateau in the time course ofVsl(t). Still, lidocaine Vsl(t) reaches this final plateaufollowing a slow ‘‘bumpy’’ time course. Pleasenotice that, in Fig. 3, lidocaine and clevidipine timescales are in minutes, while the time scale is in hoursfor thiopentone.
This paper also presents evidence indicating thevascular endothelium loads with FITC-F(ab0)2at times as short as 15min, and may thus beresponsible for the fast component of plasmaticconcentration decay of F(ab0)2 observed in rams(Sevcik et al., 2004) and in humans (Vazquez et al.,2005), as well as the plateau in Vsl(t) predicted byEq. (A.7) for F(ab0)2. The very rapid extravasationmechanism seem to be absent from some results inthe literature, where the fastest component t1/2,a isclose to 2 h (see Table 2 of Gutierrez et al. (2003) fora convenient summary). In some instances, this isdue to the experimental protocol chosen, which didnot include enough points at short times; this is thecase, for example, of Pepin et al. (1995), Pepin-Covata et al. (1996) and Riviere et al. (1997). Ismailand Abd-Elsalam (1998) measured PK of 125l-antisnake venom F(ab0)2; in their experimental situation
a three-component kinetics was identified. Theycalled t1/2,p, t1/2,a and t1/2,b as t1=2;t1 ; t1=2;t2 and t1=2;t3 ;respectively, in Vazquez et al. (2005). The values ofthe half-times of decay in Ismail and Abd-Elsalam(1998) are in excellent agreement with those inVazquez et al. (2005). All these PK studies werecarried out in rabbits; thus, the results of Ismail andAbd-Elsalam (1998) show than besides of humansand rams, the fast F(ab0)2 component also exists inrabbits. The absence of the fast component inseveral F(ab0)2 PK studies may stem from theexperimental design. Still, the PK analysis of horseIgG antivenom in a recent communication byQuesada et al. (2006) in rabbits suggests that thefast component may not exist when whole IgG isused.
Taken together with the data on F(ab0)2 kineticsin rams (Sevcik et al., 2004) and in humans(Vazquez et al., 2005), as well as in Fig. 1, theevidence of Figs. 4–6 suggests that vascular en-dothelium and perhaps the connective tissue sur-rounding blood vessels may act as a compartmentthat traps FITC-F(ab0)2, and perhaps other drugs,and may explain the intermediate plateau in theplots of Vsl(t) versus time. Vascular endotheliumcovers between 20,000 and 40,000 km of bloodvessels, with a diameter between 4 and 8 mmcapillary surface may be estimated to be between500 and 1000m2, and if endothelial thickness istaken as 0.1 mm its total volume lies between 0.24and 2.4 l (Freitas, 1999).
Acknowledgements
This manuscript was entirely written using theOpenOffice.org 2.0 office suite (www.Openoffi-ce.org): the authors are indebted to the opensoftware community for providing this free softwareas well as for Kubuntu Linux (www.ubuntu.com),Scilab (www.scilab.org) and The GIMP (www.gim-p.org). This work was partly financed by Labor-atorios Silanes SA de CV and Institute Bioclon SAde CV, Mexico.
Appendix A. Mathematical appendix
A.1. Distribution volume time dependence
If Eq. (1) is plotted as the natural logarithm ofC(t) versus time and
t1 o�ti o�� � �o
�tz, (A.1)
ARTICLE IN PRESSC. Sevcik et al. / Toxicon 50 (2007) 653–665664
the plot will have semi-linear segments when tEti.The slope of the semi-logarithmic curve is
d ln½CðtÞ�� �
dt¼
1
CðtÞ
d½CðtÞ�
dt
¼ �1
CðtÞ
Xz
i¼1
Ci
ti
e�t=ti
� �: ðA:2Þ
Since for a straight line with slope b such as
ln½CðtÞ� ¼ ln½C0ðtÞ� þ bt, (A.3)
we have that the log intercept with the ordinate axis is
ln½CðtÞ� � bt ¼ ln½C0ðtÞ�: (A.4)
Taking exponentials at both sides
C0ðtÞ ¼ CðtÞe�tb (A.5)
and replacing b with the slope given in Eq. (A.2) weobtain
C0ðtÞ ¼ CðtÞet=CðtÞPm
i¼1Ci=tie
�t=ti, (A.6)
which with Eq. (1) results in
V slðtÞ ¼D
C0ðtÞ¼ D
e�t=CðtÞPz
i¼1Ci=tie
�t=ti
CðtÞ
¼ De�tPz
i¼1Ci=tie
�t=ti� Pz
i¼1Cie�t=ti
� �1 Xz
i¼1
Cie�t=ti
" #�1,
ðA:7Þ
an expression for the time dependence of theapparent distribution volume, which we will calldistribution volume from slope. The validity of thisexpression may be demonstrated by mathematicalinduction (Apostol, 1961) as follows. Let z ¼ l, then
C0ðtÞ ¼ CðtÞeðt=C1e�t=t1 Þ
ðC1e�t=t1 =t1 Þ
¼ C1e�t=t1et=t1 ¼ C1 ¼ Cp0
and
limt!0
V slðtÞ ’D
Cp0
¼ V c,
which corresponds to the initial plasmatic distribu-tion volume (also called central compartmentvolume) (Gibaldi and Perrier, 1982). Thus, with z ¼ l,Eqs. (A.6) and (A.7) correctly predict the initialconcentration of the drug in plasma and the initialplasmatic distribution volume, respectively. As z
increases, if condition (A.1) holds, Eq. (A.6) results in
C0ðt1 o�� � �o
�tz5tÞ ffi CðtÞeðt=Cze
�t=tz ÞðCze�t=tz =tzÞ
¼ Cze�t=tzet=tz ¼ Cz ðA:8Þ
(where ffi means ‘‘is approximately equal to’’) and
Vslðt1 o�� � �o
�tz5tÞ ffi
D
Cz
. (A.9)
Thus for all values of z, the initial and finaldistribution volumes will be estimated in a convergentmanner and the upper bound of Vsl at long times willbe given by Eq. (A.9).
Since V z ¼ Dtz=AUC1 ¼ CL tz and V ss ¼
DAUMC1=AUC21 ¼ CLMRT (where CL is the
systemic clearance, see Gibaldi and Perrier, 1982;Sevcik, 2006), we have that
V z
Vss
¼tzAUC1
AUMC1¼ tz
Xz
i¼1
Citi
! Xz
i¼1
Cit2i
!�1
¼Xz
i¼1
Cititz
! Xz
i¼1
Cit2i
!�1.
Then if
tz ¼ max ftigi¼1;...;z )Vz
V ss
X1,
thus
Vz4V ss for all z41. (A.10)
From the derivations above and with Eq. (A.9)we see that
V slðt1 o�� � �o
�tz5tÞ
Vz
ffiAUC1
tzCz
X1
) V slðt1 o�� � �o
�tz5tÞXV z if z41. ðA:11Þ
The relationship between Vsl(t), Vz and Vss maynow be visualized by putting together inequalities(10) and (11) to produce
Vslðt1 o�� � �o
�tz5tÞXV zXVss. (A.12)
References
Anonymous, 2004. Collection of terms, symbols, equations,
and explanations of common pharmacokinetic and pharmaco-
dynamic parameters and some statistical functions. In: Pech-
stein, B., Cawello, W. (Eds.), Association for Applied Human
Pharmacology (AGAH). AGAH Working Group on PK-PD
modeling. /http://www.agah.info/uploads/media/PK-glossary_
PKworking_group_2004_Ol.pdfS.Apostol, T.M., 1961. Calculus, vol. I. Blaisdell Publishing Co.,
Waltham, MA, pp. 34–37.
Bhatti, R.A., Yu, S., Boulanger, A., Fariss, R.N., Guo, Y.,
Bernstein, S.L., Gentleman, S., Redmond, T.M., 2003.
Expression of 3-carotene 15,15-monooxygenase in retina
and RPE-choroid. Invest. Ophthalmol. Vis. Sci. 44, 44–49.
ARTICLE IN PRESSC. Sevcik et al. / Toxicon 50 (2007) 653–665 665
Brodie, B.B., Bernstein, E., Mark, L., 1952. The role of body fat
in limiting the duration of action of thiopental. J. Pharmacol.
Exp. Ther. 105, 421–426.
Bucci, M.R., Gratton, J.-P., Rudic, R.D., Acevedo, L., Roviezzo,
F., Cirino, G., Sessa, W.C., 2000. In vivo delivery of the
caveolin-1 scaffolding domain inhibits nitric oxide synthesis
and reduces inflammation. Nat. Med. 6, 1362–1367.
Chiou, W.L., 1972. A simple equation to estimate the fraction of
drug remaining in the body after an intravenous injection.
J. Pharm. Pharmacol. 34, 342–343.
Corada, M., Mariotti, M., Thurston, G., Smith, K., Kunkel, R.,
Brockhaus, M., Lampugnani, M.G., Martin-Padura, I.,
Stoppacciaro, A., Ruco, L., McDonald, D.M., Ward, P.A.,
Dejana, E., 1999. Vascular endothelial-cadherin is an
important determinant of microvascular integrity in vivo.
Proc. Natl. Acad. Sci. USA 96, 9815–9820.
Dahlquist, D., Bjork, A., 1969. Numerical Methods. Prentice-
Hall, Inc., Englewood Cliffs, NJ, pp. 26–36.
Danielson, B.G., 2004. Structure, chemistry, and pharmacokinetics
of intravenous iron agents. J. Am. Soc. Neprol. 15, S93–S98.
Ericsson, H., Bredberg, U., Ericsson, U., Jolin-Mellgard, A.,
Nordlander, M., Regardt, C.G., 2000. Pharmacokinetics and
arteriovenous differences in clevidipine concentration follow-
ing a short- and a long-term intravenous infusion in healthy
volunteers. Anesthesiology 92, 993–2001.
Freitas Jr., R.A., 1999. Nanomedicine, vol. 1: Basic Capabilities.
Landes Biosciences, Georgetown, TX (Chapter 8, Section
8.2.1.2).
Geisser, P., Baer, M., Schaub, E., 1992. Structure/histotoxicity
relationship of parenteral iron preparations. Aezheim.
Forsch. 42, 1439–1452.
Gibaldi, M., Perrier, D., 1982. Pharmacokinetics, second ed.
Marcel Dekker Inc., New York, NY.
Gobburu, J.V.S., Holford, N.H.G., 2001. Vz, the terminal phase
volume: time for its terminal phase. J. Biopharm. Stat. 11,
373–375.
Green, R., Charlton, R.W., Seftel, H., Bothwell, T., Mayet, F.,
Adams, B., Finch, C., Layrisse, M., 1968. Body iron excression
in man. A collaborative study. Am. J. Med. 45, 336–353.
Gutierrez, J.-M., Leon, G., Lomonte, B., 2003. Pharmacokine-
tic–pharmacodynamic relationships of immunoglobulin ther-
apy for envenomation. Clin. Pharmacokinet. 42, 721–741.
Ismail, M., Abd-Elsalam, M.A., 1998. Pharmacokinetics of125l-labelled IgG, F(ab0)2 and F(ab) fractions of scorpion
and snake antivenins: merits and potential for therapeutic use.
Toxicon 36, 1523–1528.
Kuipers, J.A., Boer, F., de Roode, A., Olofsen, E., Bovill, J.G.,
Burm, A.G.L., 2001. Modelling population pharmacokinetics
of lidocaine. Should cardiac output be included as a patient
factor? Anesthesiology 94, 566–573.
Levy, J.H., Huraux, C., Norlander, M., 1997. Treatment of
perioperative hypertension. In: Epstein, M. (Ed.), Calcium
Antagonists in Clinical Medicine. Hanley and Belfus,
Philadelphia pp. 345–358.
Niazi, F., 1976. Volume of distribution as a function of time.
J. Pharm. Sci. 65, 452–454.
Pepin, S., Lutsch, C., Grandgeorge, M., Lang, J., Scherrmann,
J.M., 1995. Snake F(ab0)2 antivenom from hyperimmunized
horse: pharmacokinetics following intravenous and intramus-
cular administration. Pharmaceut. Res. 12, 1470–1473.
Pepin-Covata, S., Lutsch, C., Grandgeorge, M., Lang, J.,
Scherrmann, J.M., 1996. Immunoreactivity and pharmacoki-
netics of horse anti-scorpion venom F(ab0)2–scorpion venom
interactions. Toxicol. Appl. Pharmacol. 141, 272–277.
Ochs, H.R., Grube, E., Greenblat, D.J., Arendt, R., Bodem, G.,
1981. Pharmacokinetics and pharmacodynamics of intrave-
nous digoxin and digitoxin. Klin. Wochenschr. 59, 889–897.
Quesada, L., Sevcik, C., Lomonte, B., Rojas, E., Gutierrez, J.M.,
2006. Pharmacokinetics of whole IgG equine antivenom:
comparison between normal and envenomed rabbits. Toxicon
48, 255–263.
Riviere, G., Choumet, V., Audebert, V., Saboraud, A., Debray,
M., Scherrmann, J.-M., Bon, C., 1997. Effect of antivenom
on venom pharmacokinetics in experimentally envenomed
rabbits: toward an optimization of antivenom therapy.
J. Pharmacol. Exp. Ther. 281, 1–8.
Rowland, M., Tozer, T.N., 1995. Clinical Pharmacokinetics.
Concepts and Applications, third ed. Lippincott, Williams &
Wilkins, Philadelphia.
Sevcik, C., 2006. Letter to the, editor. J. Biopharm. Stat. 16,
123–124.
Sevcik, C., D’Suze, G., Diaz, P., Salazar, V., Hidalgo, C.,
Azpurua, H., Bracho, N., 2004. Modelling Tityus scorpion
venom and antivenom pharmacokinetics. Evidence of active
immunoglobulin G0s F(ab0)2 extrusion mechanism from blood
to tissues. Toxicon 44, 731–734.
Vazquez, H., Chavez-Haro, A., Garcfa-Ubbelohde, W., Mancilla-
Nava, R., Paniagua-Solfs, J., Alagon, A., Sevcik, C., 2005.
Pharmacokinetics of a F(ab0)2 scorpion antivenom in healthy
human volunteers. Toxicon 46, 797–805.
Wada, R.D., Bjorkman, S., Ebling, W.F., William, F., Hara-
shima, H., Harapat, S.R., Stanski, D.R., 1997. Computer
simulation of the effects of alterations in blood flows and
body composition on thiopental pharmacokinetics in humans.
Anesthesiology 87, 884–899.
Yamamoto, T., Tada, T., Brodsky, S.V., Tanaka, H., Noiri, E.,
Kajiya, F., Goligorsky, M.S., 2002. Intravital videomicro-
scopy of peritubular capillaries in renal ischemia. Am.
J. Physiol. Renal Physiol. 282, F1150–F1155.
Zhu, L.-J., Hardy, M.P., Inigo, I.V., Huhtaniemi, I., Bardin,
C.W., Moo-Young, A.J., 2000. Effects of androgen
on androgen receptor expression in rat testicular and
epididymal cells: a quantitative immunohistochemical study.
Biol. Reprod. 63, 368–376.