Initial fuel temperature effects on burning rate of pool fire
6
Journal of Hazardous Materials 188 (2011) 369–374 Contents lists available at ScienceDirect Journal of Hazardous Materials journal homepage: www.elsevier.com/locate/jhazmat Initial fuel temperature effects on burning rate of pool fire Bing Chen a , Shou-Xiang Lu a,∗ , Chang-Hai Li a , Quan-Sheng Kang a,b , Vivien Lecoustre c a State Key Laboratory of Fire Science, University of Science and Technology of China, Hefei, Anhui 230027, China b Zhejiang University of Technology, Hangzhou, Zhejiang 310014, China c Department of Fire Protection Engineering, University of Maryland, College Park, MD 20742, USA article info Article history: Received 21 May 2010 Received in revised form 17 January 2011 Accepted 30 January 2011 Available online 4 February 2011 Keywords: Pool fire Burning rate Temperature distribution Initial fuel temperature abstract The influence of the initial fuel temperature on the burning behavior of n-heptane pool fire was exper- imentally studied at the State Key Laboratory of Fire Science (SKLFS) large test hall. Circular pool fires with diameters of 100 mm, 141 mm, and 200 mm were considered with initial fuel temperatures ranging from 290 K to 363 K. Burning rate and temperature distributions in fuel and vessel wall were recorded during the combustion. The burning rate exhibited five typical stages: initial development, steady burn- ing, transition, bulk boiling burning, and decay. The burning rate during the steady burning stage was observed to be relatively independent of the initial fuel temperature. In contrast, the burning rate of the bulk boiling burning stage increases with increased initial fuel temperature. It was also observed that increased initial fuel temperature decreases the duration of steady burning stage. When the initial tem- perature approaches the boiling point, the steady burning stage nearly disappears and the burning rate moves directly from the initial development stage to the transition stage. The fuel surface temperature increases to its boiling point at the steady burning stage, shortly after ignition, and the bulk liquid reaches boiling temperature at the bulk boiling burning stage. No distinguished cold zone is formed in the fuel bed. However, boiling zone is observed and the thickness increases to its maximum value when the bulk boiling phenomena occurs. © 2011 Elsevier B.V. All rights reserved. 1. Introduction Pool fires are frequently involved in fire accidents [1]. The pool fire burning rate is uttermost information when predicting the rel- ative hazard of such fire. Its unawareness hinders the evaluation of fire behavior and exact prediction of fire effects. The burning characteristics of liquid pool fires have been stud- ied in detail during the past decades. Experiments were conducted to measure pool fire burning rate for different fuels and pool diam- eters. The work of Blinov and Khudiakov [2,3] and Burgess et al. [4] showed that the burning rate of single-component fuels varies with the pool diameter before reaching their asymptotic value when the diameter reaches a critical value, typically of the order of the meter m for most common fuel. Hayasaka [5] studied the burning rate of non-replenishing small pool fires. It was observed that the fuel temperature influences the burning rate and the reason for various burning rate changes is the difference in the evaporation heat of fuel. Other effects such as wind and boilover phenomena can greatly change a pool’s burn- ing rate. Increased wind speed has been shown to decrease the burning rate of aviation fuel, as reported by Apter et al. [6]. But ∗ Corresponding author. Tel.: +86 551 3603141; fax: +86 551 3603449. E-mail address: [email protected] (S.-X. Lu). wind and size effects on pool fire may be more complex than indicated by Apter et al. Boilover can occur for certain grades of petroleum crude and for petroleum products that are contami- nated with moisture. Boilover typically involves the violent boiling of water, which is relatively at a shallow depth, as the heat from the conductive container and liquid fuel heats the water to boiling. This phenomenon can increase the burning rate by a factor of two or more [7–9]. Finally, experiments have shown the nearly pro- portionality of the pool fire burning rate on atmospheric pressure [10,11], along with the effects of ventilation in enclosure pool fire [12–14]. Predicting burning rate models have been developed. Consid- ering a quasi-steady assumption, the burning rate of a deep pool is simply expressed as the ratio of the net heat transfer to the fuel surface and the fuel heat of gasification. A global model, presented by Hamins et al. [15], predicts the burning rate of pool fires in qui- escent environments. Its predicted values for many fuels are within a factor of two from measured burning rates. Heat transfer and heat balance models in the fuel had been reported by Nakakuki [16,17], along with the heat transfer mechanisms in pool fires. Nakakuki also analyzed the heat transfer between the fuel and the surround- ing, focusing on the radiative heat from the flame to the fuel surface and the convective heat from the wall to fuel. Mu ˜ noz et al. [18,19] studied the radiative characteristics of large gasoline and diesel pool fires. The maximum burning rates obtained were higher than 0304-3894/$ – see front matter © 2011 Elsevier B.V. All rights reserved. doi:10.1016/j.jhazmat.2011.01.122
-
Upload
independent -
Category
Documents
-
view
0 -
download
0
Transcript of Initial fuel temperature effects on burning rate of pool fire
I
Ba
b
c
a
ARRAA
KPBTI
1
fiafi
itestdm
pbtwib
0d
Journal of Hazardous Materials 188 (2011) 369–374
Contents lists available at ScienceDirect
Journal of Hazardous Materials
journa l homepage: www.e lsev ier .com/ locate / jhazmat
nitial fuel temperature effects on burning rate of pool fire
ing Chena, Shou-Xiang Lua,∗, Chang-Hai Li a, Quan-Sheng Kanga,b, Vivien Lecoustrec
State Key Laboratory of Fire Science, University of Science and Technology of China, Hefei, Anhui 230027, ChinaZhejiang University of Technology, Hangzhou, Zhejiang 310014, ChinaDepartment of Fire Protection Engineering, University of Maryland, College Park, MD 20742, USA
r t i c l e i n f o
rticle history:eceived 21 May 2010eceived in revised form 17 January 2011ccepted 30 January 2011vailable online 4 February 2011
eywords:ool fireurning rate
a b s t r a c t
The influence of the initial fuel temperature on the burning behavior of n-heptane pool fire was exper-imentally studied at the State Key Laboratory of Fire Science (SKLFS) large test hall. Circular pool fireswith diameters of 100 mm, 141 mm, and 200 mm were considered with initial fuel temperatures rangingfrom 290 K to 363 K. Burning rate and temperature distributions in fuel and vessel wall were recordedduring the combustion. The burning rate exhibited five typical stages: initial development, steady burn-ing, transition, bulk boiling burning, and decay. The burning rate during the steady burning stage wasobserved to be relatively independent of the initial fuel temperature. In contrast, the burning rate of thebulk boiling burning stage increases with increased initial fuel temperature. It was also observed that
emperature distributionnitial fuel temperature
increased initial fuel temperature decreases the duration of steady burning stage. When the initial tem-perature approaches the boiling point, the steady burning stage nearly disappears and the burning ratemoves directly from the initial development stage to the transition stage. The fuel surface temperatureincreases to its boiling point at the steady burning stage, shortly after ignition, and the bulk liquid reachesboiling temperature at the bulk boiling burning stage. No distinguished cold zone is formed in the fuelbed. However, boiling zone is observed and the thickness increases to its maximum value when the bulk
s.
boiling phenomena occur. Introduction
Pool fires are frequently involved in fire accidents [1]. The poolre burning rate is uttermost information when predicting the rel-tive hazard of such fire. Its unawareness hinders the evaluation ofre behavior and exact prediction of fire effects.
The burning characteristics of liquid pool fires have been stud-ed in detail during the past decades. Experiments were conductedo measure pool fire burning rate for different fuels and pool diam-ters. The work of Blinov and Khudiakov [2,3] and Burgess et al. [4]howed that the burning rate of single-component fuels varies withhe pool diameter before reaching their asymptotic value when theiameter reaches a critical value, typically of the order of the meter
for most common fuel.Hayasaka [5] studied the burning rate of non-replenishing small
ool fires. It was observed that the fuel temperature influences theurning rate and the reason for various burning rate changes is
he difference in the evaporation heat of fuel. Other effects such asind and boilover phenomena can greatly change a pool’s burn-ng rate. Increased wind speed has been shown to decrease theurning rate of aviation fuel, as reported by Apter et al. [6]. But
∗ Corresponding author. Tel.: +86 551 3603141; fax: +86 551 3603449.E-mail address: [email protected] (S.-X. Lu).
304-3894/$ – see front matter © 2011 Elsevier B.V. All rights reserved.oi:10.1016/j.jhazmat.2011.01.122
© 2011 Elsevier B.V. All rights reserved.
wind and size effects on pool fire may be more complex thanindicated by Apter et al. Boilover can occur for certain grades ofpetroleum crude and for petroleum products that are contami-nated with moisture. Boilover typically involves the violent boilingof water, which is relatively at a shallow depth, as the heat fromthe conductive container and liquid fuel heats the water to boiling.This phenomenon can increase the burning rate by a factor of twoor more [7–9]. Finally, experiments have shown the nearly pro-portionality of the pool fire burning rate on atmospheric pressure[10,11], along with the effects of ventilation in enclosure pool fire[12–14].
Predicting burning rate models have been developed. Consid-ering a quasi-steady assumption, the burning rate of a deep poolis simply expressed as the ratio of the net heat transfer to the fuelsurface and the fuel heat of gasification. A global model, presentedby Hamins et al. [15], predicts the burning rate of pool fires in qui-escent environments. Its predicted values for many fuels are withina factor of two from measured burning rates. Heat transfer and heatbalance models in the fuel had been reported by Nakakuki [16,17],along with the heat transfer mechanisms in pool fires. Nakakuki
also analyzed the heat transfer between the fuel and the surround-ing, focusing on the radiative heat from the flame to the fuel surfaceand the convective heat from the wall to fuel. Munoz et al. [18,19]studied the radiative characteristics of large gasoline and dieselpool fires. The maximum burning rates obtained were higher than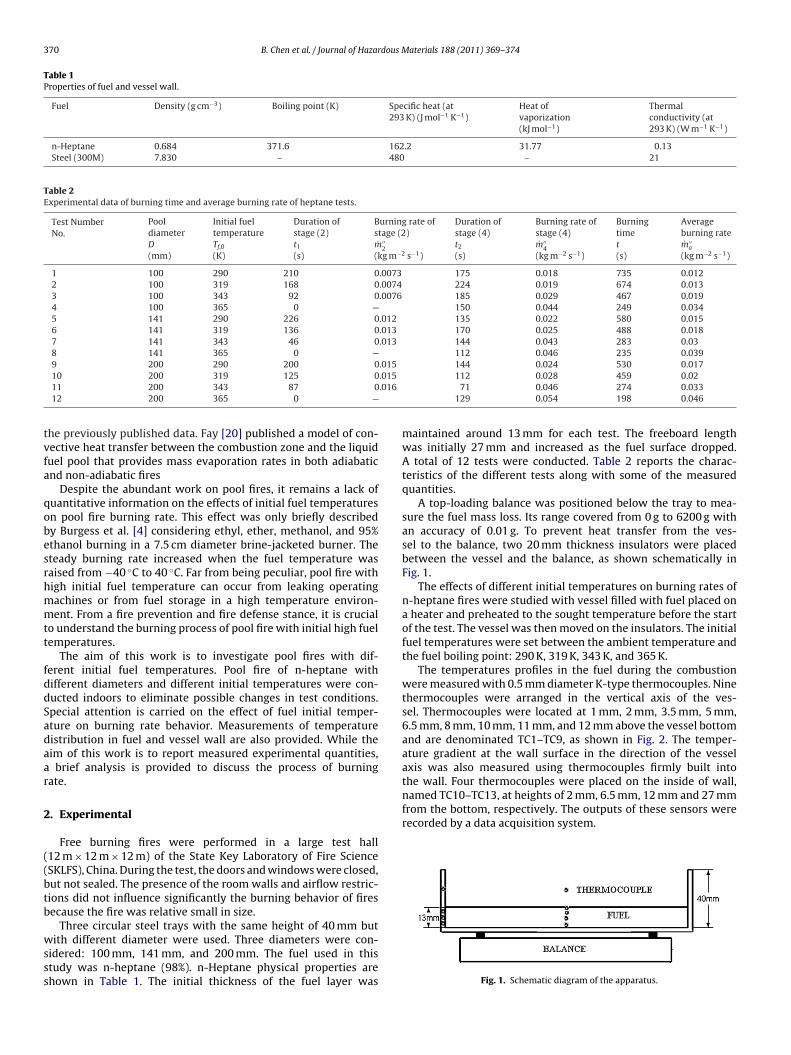
370 B. Chen et al. / Journal of Hazardous Materials 188 (2011) 369–374
Table 1Properties of fuel and vessel wall.
Fuel Density (g cm−3) Boiling point (K) Specific heat (at293 K) (J mol−1 K−1)
Heat ofvaporization(kJ mol−1)
Thermalconductivity (at293 K) (W m−1 K−1)
n-Heptane 0.684 371.6 162.2 31.77 0.13Steel (300M) 7.830 – 480 – 21
Table 2Experimental data of burning time and average burning rate of heptane tests.
Test NumberNo.
Pooldiameter
Initial fueltemperature
Duration ofstage (2)
Burning rate ofstage (2)
Duration ofstage (4)
Burning rate ofstage (4)
Burningtime
Averageburning rate
D Tf,0 t1 m′′2 t2 m′′
4 t m′′a
(mm) (K) (s) (kg m−2 s−1) (s) (kg m−2 s−1) (s) (kg m−2 s−1)
1 100 290 210 0.0073 175 0.018 735 0.0122 100 319 168 0.0074 224 0.019 674 0.0133 100 343 92 0.0076 185 0.029 467 0.0194 100 365 0 — 150 0.044 249 0.0345 141 290 226 0.012 135 0.022 580 0.0156 141 319 136 0.013 170 0.025 488 0.0187 141 343 46 0.013 144 0.043 283 0.038 141 365 0 — 112 0.046 235 0.039
.015
.015
.016
tvfa
qobesrhmmtt
fddSadaar
2
((btb
wsss
the wall. Four thermocouples were placed on the inside of wall,named TC10–TC13, at heights of 2 mm, 6.5 mm, 12 mm and 27 mmfrom the bottom, respectively. The outputs of these sensors wererecorded by a data acquisition system.
9 200 290 200 010 200 319 125 011 200 343 87 012 200 365 0 —
he previously published data. Fay [20] published a model of con-ective heat transfer between the combustion zone and the liquiduel pool that provides mass evaporation rates in both adiabaticnd non-adiabatic fires
Despite the abundant work on pool fires, it remains a lack ofuantitative information on the effects of initial fuel temperaturesn pool fire burning rate. This effect was only briefly describedy Burgess et al. [4] considering ethyl, ether, methanol, and 95%thanol burning in a 7.5 cm diameter brine-jacketed burner. Theteady burning rate increased when the fuel temperature wasaised from −40 ◦C to 40 ◦C. Far from being peculiar, pool fire withigh initial fuel temperature can occur from leaking operatingachines or from fuel storage in a high temperature environ-ent. From a fire prevention and fire defense stance, it is crucial
o understand the burning process of pool fire with initial high fuelemperatures.
The aim of this work is to investigate pool fires with dif-erent initial fuel temperatures. Pool fire of n-heptane withifferent diameters and different initial temperatures were con-ucted indoors to eliminate possible changes in test conditions.pecial attention is carried on the effect of fuel initial temper-ture on burning rate behavior. Measurements of temperatureistribution in fuel and vessel wall are also provided. While theim of this work is to report measured experimental quantities,brief analysis is provided to discuss the process of burning
ate.
. Experimental
Free burning fires were performed in a large test hall12 m × 12 m × 12 m) of the State Key Laboratory of Fire ScienceSKLFS), China. During the test, the doors and windows were closed,ut not sealed. The presence of the room walls and airflow restric-ions did not influence significantly the burning behavior of firesecause the fire was relative small in size.
Three circular steel trays with the same height of 40 mm butith different diameter were used. Three diameters were con-
idered: 100 mm, 141 mm, and 200 mm. The fuel used in thistudy was n-heptane (98%). n-Heptane physical properties arehown in Table 1. The initial thickness of the fuel layer was
144 0.024 530 0.017112 0.028 459 0.02
71 0.046 274 0.033129 0.054 198 0.046
maintained around 13 mm for each test. The freeboard lengthwas initially 27 mm and increased as the fuel surface dropped.A total of 12 tests were conducted. Table 2 reports the charac-teristics of the different tests along with some of the measuredquantities.
A top-loading balance was positioned below the tray to mea-sure the fuel mass loss. Its range covered from 0 g to 6200 g withan accuracy of 0.01 g. To prevent heat transfer from the ves-sel to the balance, two 20 mm thickness insulators were placedbetween the vessel and the balance, as shown schematically inFig. 1.
The effects of different initial temperatures on burning rates ofn-heptane fires were studied with vessel filled with fuel placed ona heater and preheated to the sought temperature before the startof the test. The vessel was then moved on the insulators. The initialfuel temperatures were set between the ambient temperature andthe fuel boiling point: 290 K, 319 K, 343 K, and 365 K.
The temperatures profiles in the fuel during the combustionwere measured with 0.5 mm diameter K-type thermocouples. Ninethermocouples were arranged in the vertical axis of the ves-sel. Thermocouples were located at 1 mm, 2 mm, 3.5 mm, 5 mm,6.5 mm, 8 mm, 10 mm, 11 mm, and 12 mm above the vessel bottomand are denominated TC1–TC9, as shown in Fig. 2. The temper-ature gradient at the wall surface in the direction of the vesselaxis was also measured using thermocouples firmly built into
Fig. 1. Schematic diagram of the apparatus.

B. Chen et al. / Journal of Hazardous Materials 188 (2011) 369–374 371
Fig. 2. Distribution of the thermocouples: (a) top view; (b) location of thermocouples; (c) vessel wall.
e 200
3
3
itodlFtAs
Fig. 3. Distribution of bubbles in fuel -for th
. Results and discussion
.1. Burning behavior of the pool fire
After ignition, fire rapidly spread until it became developedn the whole pool and reached a steady state regime for a cer-ain period of time. A sharp increase of the flame height was thenbserved until a second steady regime was reached. The fire thenecreased until it reached extinction due to burn out of fuel. The
iquid fuel in the vessel was also observed during the experiments.
or the cases under lower initial fuel temperature, during the ini-ial development stage, the fuel remained unaffected and calm.fter a quiet steady burning stage following initial stage, bubblestarted to appear near the vessel wall and they eventually roseFig. 4. Temporal evolution of n-heptane pool fire burning rate of same diameter D
mm pool fire: (a) Tf,0 = 290 K; (b) Tf,0 = 365 K.
to the fuel surface. As the combustion evolved, more and morebubbles were observed in the entire liquid, as shown in Fig. 3a.These modes of burning can be defined: (1) unsteady followingignition, (2) steady burning with surface boiling, (3) transition tobulk boiling, (4) steady burning at bulk boiling, and (5) decrease toextinction. However, as observed in the experiments, the bubblesappeared more quickly and in greater amount and size when theinitial fuel temperature was raised. For the case of initial fuel tem-perature of 365 K, large bubbles could be seen shortly after ignition(see Fig. 3b). The quiet steady burning, which appeared in lower
initial temperature case, was not found.The variation of fuel mass during combustion was obtainedusing the balance and then converted into mass burning rate. Forthe tests under different initial fuel temperature, two typical burn-
= 200 mm, but different initial temperature: (a) Tf,0 = 290 K; (b) Tf,0 = 365 K.

3 dous Materials 188 (2011) 369–374
ibo
(
(
(
(
(
Tcdnbttpiosb
3
3ttdtasp
fm30bftcfiob(tci
same diameter. The value in the previous study [5] is also plot inFig. 6.
BRR shows the difference of the burning rate between the steadyburning stage and bulk boiling burning stage. A similar ratio wasintroduced by Hayasaka [5] to model the influence of the fuel
72 B. Chen et al. / Journal of Hazar
ng rate histories were observed. Fig. 4a shows the history of massurning rate in a 200 mm pool fire with an initial fuel temperaturef 290 K. Five possible stages can be identified:
1) Initial development stage, corresponding to the fire develop-ment in the vessel. In this stage, fire size and burning rateincrease. The duration of this stage depends on various param-eters, such as vessel diameter and fuel type [21]. In our tests,this stage lasted about 20–30 s.
2) Steady burning stage, corresponding to the developed fire thatfollows the initial development stage. In this stage, surface boil-ing starts to appear, and the burning rate during this stage isnearly constant.
3) Transition stage, corresponding to a sudden increase of theburning rate. Big bubbles start to appear near the vessel walland rise to the fuel surface.
4) Bulk boiling burning stage, corresponding to the entire boil-ing fuel and fully developed fire, while bubbles could befound everywhere in the fuel. The burning rate in thisstage is about two or more times that of steady burningstage.
5) Decay stage, corresponding to end of the combustion. In thisperiod, both of the fire size and burning rate decreases andfinally extinguishes due to the burnout of fuel.
his burning process is similar to the one reported in Ref. [5], whichonsidered a 50.5 mm of diameter n-heptane pool with an 11 mmepth. However, in present study, some different kinds of phe-omenon are observed. From Fig. 4b, it can be seen that the steadyurning stage (the second stage), disappears when the initial fuelemperature is 365 K. Transition process occurs following the ini-ial development stage.These two burning rate histories obtained inresent study are different from previous work, which was reported
n Refs. [21,22]. In their research, only three stages have beenbserved: initial development, steady burning, and decay. The pos-ible reason for this difference in burning process will be discussedelow.
.2. Burning rates of fires with increased initial fuel temperatures
Four different initial fuel temperatures, i.e. Tf,0 = 290 K, 319 K,43 K, 365 K, were considered in n-heptane pool fires. Experimen-al results are summarized in Table 2. Note here m′′
a denotes theime-average burning rate per area unit for the whole test duration,efined as the average value of burning rate for the total burningime. The mass burning rates m′′
2 and m′′4 are the burning rates per
rea unit for steady burning stage (2), and bulk boiling burningtage (4), respectively. Fig. 5 presents the burning rates of 100 mmool fires with different initial fuel temperatures.
For the 100 mm diameter pool, the case with an initialuel temperature of Tf,0 = 290 K presents a steady burning rate˙ ′′
2 of 0.0073 kg m−2 s−1. Cases with initial fuel temperature of19 K and 343 K present nearly similar steady burning rates m′′
2:.0074 kg m−2 s−1 and 0.0076 kg m−2 s−1, respectively. The steadyurning rates, m′′
2, are about 0.013 kg m−2 s−1 and 0.015 kg m−2 s−1
or the 141 mm and 200 mm pool fires for the different initial fuelemperatures considered in this study and does not vary signifi-antly with increased initial fuel temperature. This indicates thator a given pan size and fuel thickness, the steady burning rate isndependent of the initial fuel temperature. However, the decreasef the second stage duration under different initial temperature can
e seen in Fig. 5 and Table 1. The duration is reduced from 210 sTf,0 = 290 K) to 92 s (Tf,0 = 343 K) for 100 mm pool fires. As men-ioned above, the steady burning stage almost disappears for thease of 365 K. Thus it is believed that the duration of steady burn-ng stage is shortened with increasing initial fuel temperature andFig. 5. Burning rates for the 100 mm heptanes pool fires.
becomes zero when the initial fuel temperature approaches theboiling point of the fuel used.
The value of burning rate during the stage (4), m′′4, increases with
the increase of initial fuel temperature, as shown in Fig. 5. For theinitial temperatures of 290 K and 365 K, the burning rate increasesfrom 0.018 kg m−2 s−1 to 0.046 kg m−2 s−1. The phenomenon thatthe burning rate depends on the initial fuel temperature is alsoobserved in the 141 mm and 200 mm pool fires, (see Table 2). More-over, the burning rate during the bulk boiling stage increases morethan twice when the initial fuel temperature is elevated from 290 Kto 365 K.
Table 2 shows the burning rate during the stage (4) increasessignificantly from the value of stage 2. The Burning Rate Ratio, BRRfor short, is defined as the ratio of the bulk boiling burning rateobserved in stage (4) over the steady burning rate observed in stage(2). The BRR for various dimensionless initial fuel temperatures areplotted in Fig. 6. In this figure, Tf,0 is the initial fuel temperature, Tf,bis the fuel boiling point, and Ta is the ambient temperature. For aninitial fuel temperature of 365 K, the steady burning rates of poolfires are assumed to equal the values those change slightly in the
Fig. 6. Relation of the burning rate ratio and dimensionless initial fuel temperature.
B. Chen et al. / Journal of Hazardous Materials 188 (2011) 369–374 373
FD
ctepcatptbas
3
iiumlt
t(iFdpfccfUi
hiar5Aitfi
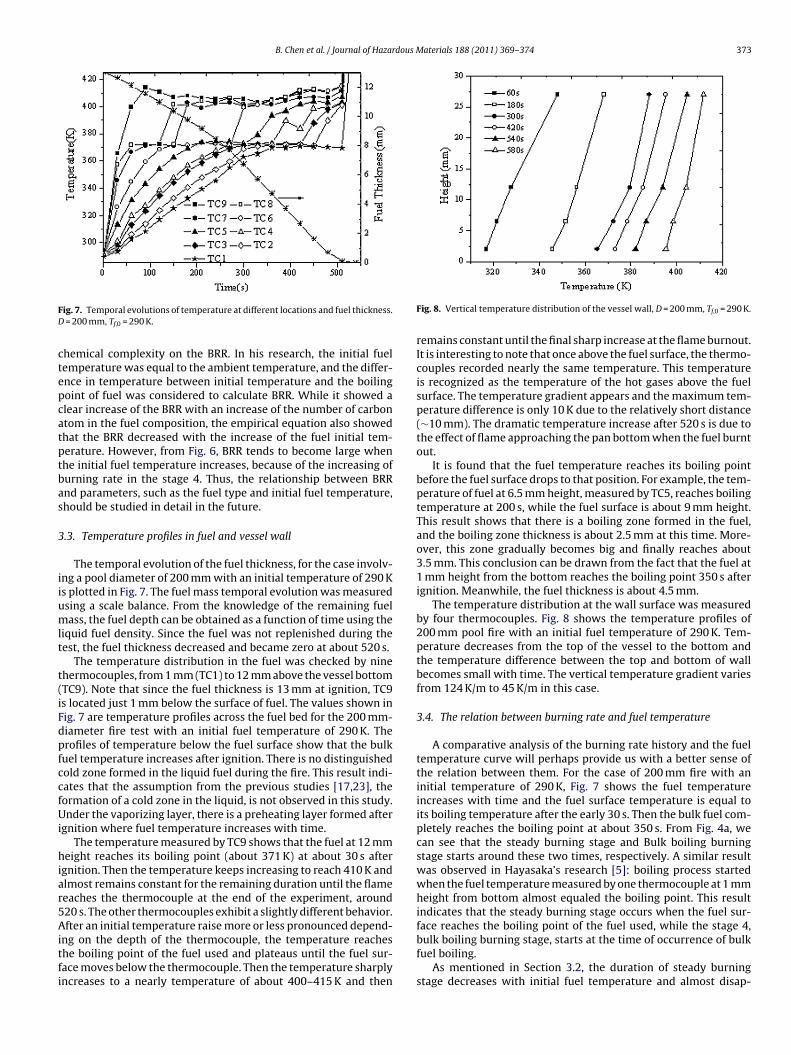
ig. 7. Temporal evolutions of temperature at different locations and fuel thickness.= 200 mm, Tf,0 = 290 K.
hemical complexity on the BRR. In his research, the initial fuelemperature was equal to the ambient temperature, and the differ-nce in temperature between initial temperature and the boilingoint of fuel was considered to calculate BRR. While it showed alear increase of the BRR with an increase of the number of carbontom in the fuel composition, the empirical equation also showedhat the BRR decreased with the increase of the fuel initial tem-erature. However, from Fig. 6, BRR tends to become large whenhe initial fuel temperature increases, because of the increasing ofurning rate in the stage 4. Thus, the relationship between BRRnd parameters, such as the fuel type and initial fuel temperature,hould be studied in detail in the future.
.3. Temperature profiles in fuel and vessel wall
The temporal evolution of the fuel thickness, for the case involv-ng a pool diameter of 200 mm with an initial temperature of 290 Ks plotted in Fig. 7. The fuel mass temporal evolution was measuredsing a scale balance. From the knowledge of the remaining fuelass, the fuel depth can be obtained as a function of time using the
iquid fuel density. Since the fuel was not replenished during theest, the fuel thickness decreased and became zero at about 520 s.
The temperature distribution in the fuel was checked by ninehermocouples, from 1 mm (TC1) to 12 mm above the vessel bottomTC9). Note that since the fuel thickness is 13 mm at ignition, TC9s located just 1 mm below the surface of fuel. The values shown inig. 7 are temperature profiles across the fuel bed for the 200 mm-iameter fire test with an initial fuel temperature of 290 K. Therofiles of temperature below the fuel surface show that the bulkuel temperature increases after ignition. There is no distinguishedold zone formed in the liquid fuel during the fire. This result indi-ates that the assumption from the previous studies [17,23], theormation of a cold zone in the liquid, is not observed in this study.nder the vaporizing layer, there is a preheating layer formed after
gnition where fuel temperature increases with time.The temperature measured by TC9 shows that the fuel at 12 mm
eight reaches its boiling point (about 371 K) at about 30 s aftergnition. Then the temperature keeps increasing to reach 410 K andlmost remains constant for the remaining duration until the flameeaches the thermocouple at the end of the experiment, around20 s. The other thermocouples exhibit a slightly different behavior.
fter an initial temperature raise more or less pronounced depend-ng on the depth of the thermocouple, the temperature reacheshe boiling point of the fuel used and plateaus until the fuel sur-ace moves below the thermocouple. Then the temperature sharplyncreases to a nearly temperature of about 400–415 K and then
Fig. 8. Vertical temperature distribution of the vessel wall, D = 200 mm, Tf,0 = 290 K.
remains constant until the final sharp increase at the flame burnout.It is interesting to note that once above the fuel surface, the thermo-couples recorded nearly the same temperature. This temperatureis recognized as the temperature of the hot gases above the fuelsurface. The temperature gradient appears and the maximum tem-perature difference is only 10 K due to the relatively short distance(∼10 mm). The dramatic temperature increase after 520 s is due tothe effect of flame approaching the pan bottom when the fuel burntout.
It is found that the fuel temperature reaches its boiling pointbefore the fuel surface drops to that position. For example, the tem-perature of fuel at 6.5 mm height, measured by TC5, reaches boilingtemperature at 200 s, while the fuel surface is about 9 mm height.This result shows that there is a boiling zone formed in the fuel,and the boiling zone thickness is about 2.5 mm at this time. More-over, this zone gradually becomes big and finally reaches about3.5 mm. This conclusion can be drawn from the fact that the fuel at1 mm height from the bottom reaches the boiling point 350 s afterignition. Meanwhile, the fuel thickness is about 4.5 mm.
The temperature distribution at the wall surface was measuredby four thermocouples. Fig. 8 shows the temperature profiles of200 mm pool fire with an initial fuel temperature of 290 K. Tem-perature decreases from the top of the vessel to the bottom andthe temperature difference between the top and bottom of wallbecomes small with time. The vertical temperature gradient variesfrom 124 K/m to 45 K/m in this case.
3.4. The relation between burning rate and fuel temperature
A comparative analysis of the burning rate history and the fueltemperature curve will perhaps provide us with a better sense ofthe relation between them. For the case of 200 mm fire with aninitial temperature of 290 K, Fig. 7 shows the fuel temperatureincreases with time and the fuel surface temperature is equal toits boiling temperature after the early 30 s. Then the bulk fuel com-pletely reaches the boiling point at about 350 s. From Fig. 4a, wecan see that the steady burning stage and Bulk boiling burningstage starts around these two times, respectively. A similar resultwas observed in Hayasaka’s research [5]: boiling process startedwhen the fuel temperature measured by one thermocouple at 1 mmheight from bottom almost equaled the boiling point. This resultindicates that the steady burning stage occurs when the fuel sur-
face reaches the boiling point of the fuel used, while the stage 4,bulk boiling burning stage, starts at the time of occurrence of bulkfuel boiling.As mentioned in Section 3.2, the duration of steady burningstage decreases with initial fuel temperature and almost disap-

3 dous M
ptatqiboa
sitIer
4
cdac
(
(
(
(
[
[
[
[
[
[
[
[
[
[
[
74 B. Chen et al. / Journal of Hazar
ears in the case with the initial temperature of 365 K, Based onhe discussion above, this result can be explained as follows: forgiven amount of liquid fuel, less heat flux is needed to heat fuel
o the boiling point and the bulk boiling phenomena occurs muchuicker if the fuel has a higher temperature. Similarly, the bulk boil-
ng burning stage would not occur if the bulk fuel could not reach itsoiling temperature. Hence, in the cases with semi-infinite liquid,nly three stages, initial development, steady burning, and decay,re expected.
Moreover, as the initial temperature increased, little fuel is con-umed during the steady burning stage, and more fuel remainsn the vessel when the bulk liquid boiling occurs. In this situa-ion, the boiling becomes more violent, as observed in the tests.t is believable that more and bigger bubbles in the liquid wouldnhance the heat exchange, resulting in the increasing of burningate.
. Conclusion
An experimental study of n-heptane pool fires was conductedonsidering different initial fuel temperatures for three differentiameter trays. Temperature distributions in fuel and vessel wall,nd burning rate were measured during the test. The major con-lusions are summarized below:
1) Five possible stages were identified: initial developmentstage, steady burning stage, transition stage, bulk boilingburning stage and decay stage. Experimental results showthat the duration of steady burning stage decreases withthe initial fuel temperature and would become zero whenthe initial temperature approaches the boiling point of fuelused.
2) For a given pool diameter, the burning rate in the steady burn-ing stage is constant regardless of the initial fuel temperature.However, its value increases during the bulk boiling stage, withmore intensity as the increased initial fuel temperature is high.The bulk boiling burning rate, m′′
4, has been observed to be twiceor more greater than the steady burning stage burning rate,m′′
2.3) The fuel surface temperature increases rapidly after ignition
and remains equal to its boiling point during the combustion.Vertical temperature gradient in the liquid is observed afterignition, but bulk temperature becomes almost uniform in thelatter stages. Boiling zone is formed and its thickness becomes
bigger with time until bulk boiling occurs.4) Steady burning stage starts at the time that the fuel surface tem-perature equals the boiling point; while bulk boiling burningstage occurs when the bulk liquid fuel reaches boiling temper-ature.
[
[[
aterials 188 (2011) 369–374
Acknowledgments
This work was sponsored by National Natural Science Founda-tion of China with Projects no. 51036007 and no. 50976109 and bythe CAS Special Grant for Postgraduate Research, Innovation andPractice. The authors also thank Prof. James. G. Quintiere for hishelp with the discussion.
References
[1] E. Planas–Cuchi, H. Montiel, J. Casal, A survey of the origin, type and con-sequences of fire accidents in process plants and in the transportation ofhazardous materials, Trans. IchemE. 75 (1997) 3–8.
[2] V.I. Blinov, G.N. Khudiakov, Certain laws governing diffusive burning of liquids,Academmiia Nauk, SSSR Doklady 113 (1957) 1094–1098.
[3] I.V. Blinov, G.N. Khudiakov, Diffusive burning of liquids, Report No. T-1490a-c,ASTIA, AD296762, US Army Engineering and Research Laboratories, 1961.
[4] D. Burgess, A. Strasser, J. Grumer, Division of Fuel Chemistry American Chem-ical Society, Symposium on Fire Control Research, Chicago, Illinois, 1961, pp.177–192.
[5] H. Hayasaka, Unsteady burning rates of small pool fires, in: Proc.5th Symp. (Int.)on Fire Safety Sci., Melbourne, 1997, pp. 499–510.
[6] V.B. Apter, A.R. Green, J.H. Kent, Pool Fire Plume Flow in a Large-scale WindTunnel, in: Proc. 3rd Symp. (Int.) on Fire Safety Sci., London, 1991, pp. 425–434.
[7] Hiroshi Koseki, G.W. Mulholland, The effect of diameter on the burning of crudeoil pool fires, Fire Technol. 27 (1) (1991) 54–65.
[8] J.L. Torero, S.M. Olenick, J.P. Garo, J.P. Vantelon, Determination of the burn-ing characteristics of a slick of oil on water, Spill Sci. Technol. Bull. 8 (2003)379–390.
[9] F.M. Ferrero, B. Kozanoglu, J. Casal, J. Arnaldos, Experimental study of thin-layerboilover in large-scale pool fires, J. Hazard. Mater. 137 (2006) 1293–1302.
10] J. Fang, C.Y. Yu, R. Tu, The influence of low atmospheric pressure on carbonmonoxide of n-heptane pool fires, J. Hazard. Mater. 154 (2008) 476–483.
11] Z.H. Li, Y.P. He, H. Zhang, J. Wang, Combustion characteristics of n-heptane andwood crib fires at different altitudes, Proc. Combust. Inst. 32 (2009) 2481–2488.
12] L.H. Hu, S. Liu, W. Peng, R. Huo, Experimental study on burning rates ofsquare/rectangular gasoline and methanol pool fires under longitudinal air flowin a wind tunnel, J. Hazard. Mater. 169 (2009) 972–979.
13] J.S. Roh, S.S. Yang, H.S. Ryou, Tunnel fires: experiments on critical velocity andburning rate in pool fire during longitudinal ventilation, J. Fire Sci. 25 (2007)161–176.
14] Y. Utiskula, J.G. Quintiere, A.S. Rangwala, B.A. Ringwelski, K. Wakatsuki, T.Naruse, Compartment fire phenomena under limited ventilation, Fire SafetyJ. 40 (2005) 367–390.
15] A. Hamins, J. Yang, T. Kashiwagi, A Global model for predicting the burningrates of liquid pool fires, Report No. NISTIR 6381, US Department of Commerce,1999.
16] A. Nakakuki, Heat transfer in small scale pool fires, Combust. Flame 96 (1994)311–324.
17] A. Nakakuki, Heat transfer in hot-zone-forming pool fires, Combust. Flame 109(1997) 353–369.
18] M. Munoz, J. Arnaldos, J. Casal, E. Planas, Analysis of the geometric and radiativecharacteristics of hydrocarbon pool fires, Combust. Flame 139 (2004) 263–277.
19] M. Munoz, E. Planas, F. Ferrero, J. Casal, Predicting the emissive power of hydro-carbon pool fires, J. Hazard. Mater. 144 (2007) 725–729.
20] J.A. Fay, Model of large pool fires, J. Hazard. Mater. 136 (2006) 219–232.
21] J.M. Chatris, J. Quintela, J. Folch, E. Planas, J. Arnaldos, J. Casal, Experimentalstudy of burning rate in hydrocarbon pool fires, Combust. Flame 126 (2001)1373–1383.
22] J.G. Quintiere, Fundamentals of Fire Phenomena, Wiley, West Sussex, 2006.23] A. Nakakuki, Heat transfer in pool fires at a certain small lip height, Combust.
Flame 131 (2002) 259–272.