
Initial Demonstration of in Vivo Tracing of Axonal Projections in the Macaque Brain and Comparison...
13
Initial Demonstration of in Vivo Tracing of Axonal Projections in the Macaque Brain and Comparison with the Human Brain Using Diffusion Tensor Imaging and Fast Marching Tractography Geoffrey J. M. Parker,* , † ,1 Klaas E. Stephan,‡ , § , ¶ ,1 Gareth J. Barker,* James B. Rowe,‡ David G. MacManus,* Claudia A. M. Wheeler-Kingshott,* Olga Ciccarelli,* Richard E. Passingham,‡ , Rachel L. Spinks,** Roger N. Lemon,** and Robert Turner‡ *NMR Research Unit, ‡Wellcome Department of Cognitive Neurology, and **Sobell Department of Neurophysiology, Institute of Neurology, University College London, Queen Square, London WC1N 3BG, United Kingdom; †Imaging Science and Biomedical Engineering, University of Manchester, Oxford Road, Manchester M13 9PT, United Kingdom; §C. & O. Vogt Brain Research Institute, Heinrich-Heine- University, 40225 Du ¨ sseldorf, Germany; ¶Department of Psychology, University of Newcastle-upon-Tyne, Newcastle NE1 7RU, United Kingdom; and Department of Experimental Psychology, University of Oxford, Oxford OX1 3UD, United Kingdom Received March 20, 2001 Diffusion tensor imaging (DTI), a magnetic reso- nance imaging technique, is used to infer major axonal projections in the macaque and human brain. This study investigates the feasibility of using known ma- caque anatomical connectivity as a “gold-standard” for the evaluation of DTI tractography methods. Con- nectivity information is determined from the DTI data using fast marching tractography (FMT), a novel tract- tracing (tractography) method. We show for the first time that it is possible to determine, in an entirely noninvasive manner, anatomical connection path- ways and maps of an anatomical connectivity metric in the macaque brain using a standard clinical scan- ner and that these pathways are consistent with known anatomy. Analogous human anatomical con- nectivity is also presented for the first time using the FMT method, and the results are compared. The cur- rent limitations of the methodology and possibilities available for further studies are discussed. © 2002 Elsevier Science (USA) Key Words: diffusion tensor imaging; tractography; macaque; anatomical connectivity. INTRODUCTION Detailed knowledge of the complex anatomical inter- connections of the central nervous system (CNS) plays an important role in the understanding of brain func- tion, both in physiological and in pathological condi- tions. Anatomical connectivity 2 mediates the integra- tion of the functions of spatially remote brain modules and thus is an essential component for the analysis of brain systems. Major insights into organizational brain principles have already been gained from the analysis of connectivity data available for primates using invasive techniques (Felleman and Van Essen, 1991; Young, 1992, 1993; Hilgetag et al., 1996). Fur- thermore, models based on real anatomical connectiv- ity have provided new methods for explaining clinical phenomena (Hilgetag et al., 1999; Young et al., 2000) and predicted functional properties of brain structures that were later confirmed experimentally (Scannell et al., 1996). Common neurological diseases, such as mul- tiple sclerosis, are associated with damaged anatomi- cal connectivity. Furthermore, some psychiatric dis- eases, most prominently schizophrenia, have been postulated to result from neurodevelopmental distur- bances of connectivity at a structural and/or functional level (Andreasen et al., 1999; Bullmore et al., 1998; Friston, 1998). Little is known about human brain anatomical con- nectivity to date. This lack of information is due to the fact that the powerful, but invasive, tract-tracing methods successfully used for determining connections in animal brains cannot be applied to humans. There- fore, most human connectivity data available to date stem from gross dissection of the human brain (Ta- lairach and Tournoux, 1988), histological staining techniques of major fiber bundles (Bu ¨ rgel et al., 1999), and degeneration studies in patients (Miklossy and van der Loos, 1991; Pujol et al., 1990; Di Vigilio and Clarke, 1997; Werring et al., 2000). However, none of these techniques delivers connectivity data at the level of detail required to elucidate the course of any but the more major tracts. In addition, dissection and histolog- 1 These authors contributed equally to this work. 2 We use the terms “connection” and “connectivity” to describe the presence of axonal projections between areas of the brain. We do not use the terms in a functional context either at the interaxonal or at the interregional level. NeuroImage 15, 797– 809 (2002) doi:10.1006/nimg.2001.0994, available online at http://www.idealibrary.com on 797 1053-8119/02 $35.00 © 2002 Elsevier Science (USA) All rights reserved.
-
Upload
manchester -
Category
Documents
-
view
0 -
download
0
Transcript of Initial Demonstration of in Vivo Tracing of Axonal Projections in the Macaque Brain and Comparison...
NeuroImage 15, 797–809 (2002)doi:10.1006/nimg.2001.0994, available online at http://www.idealibrary.com on
Initial Demonstration of in Vivo Tracing of Axonal Projections in theMacaque Brain and Comparison with the Human Brain Using Diffusion
Tensor Imaging and Fast Marching TractographyGeoffrey J. M. Parker,*,†,1 Klaas E. Stephan,‡,§,¶,1 Gareth J. Barker,* James B. Rowe,‡
David G. MacManus,* Claudia A. M. Wheeler-Kingshott,* Olga Ciccarelli,* Richard E. Passingham,‡,�Rachel L. Spinks,** Roger N. Lemon,** and Robert Turner‡
*NMR Research Unit, ‡Wellcome Department of Cognitive Neurology, and **Sobell Department of Neurophysiology, Institute of Neurology,University College London, Queen Square, London WC1N 3BG, United Kingdom; †Imaging Science and Biomedical Engineering,
University of Manchester, Oxford Road, Manchester M13 9PT, United Kingdom; §C. & O. Vogt Brain Research Institute, Heinrich-Heine-University, 40225 Dusseldorf, Germany; ¶Department of Psychology, University of Newcastle-upon-Tyne, Newcastle NE1 7RU, United
Kingdom; and �Department of Experimental Psychology, University of Oxford, Oxford OX1 3UD, United Kingdom
Diffusion tensor imaging (DTI), a magnetic reso-nance imaging technique, is used to infer major axonalprojections in the macaque and human brain. Thisstudy investigates the feasibility of using known ma-caque anatomical connectivity as a “gold-standard”for the evaluation of DTI tractography methods. Con-nectivity information is determined from the DTI datausing fast marching tractography (FMT), a novel tract-tracing (tractography) method. We show for the firsttime that it is possible to determine, in an entirelynoninvasive manner, anatomical connection path-ways and maps of an anatomical connectivity metricin the macaque brain using a standard clinical scan-ner and that these pathways are consistent withknown anatomy. Analogous human anatomical con-nectivity is also presented for the first time using theFMT method, and the results are compared. The cur-rent limitations of the methodology and possibilitiesavailable for further studies are discussed. © 2002 Elsevier
Science (USA)
Key Words: diffusion tensor imaging; tractography;macaque; anatomical connectivity.
INTRODUCTION
Detailed knowledge of the complex anatomical inter-connections of the central nervous system (CNS) playsan important role in the understanding of brain func-tion, both in physiological and in pathological condi-tions. Anatomical connectivity2 mediates the integra-
1 These authors contributed equally to this work.2 We use the terms “connection” and “connectivity” to describe the
presence of axonal projections between areas of the brain. We do notuse the terms in a functional context either at the interaxonal or atthe interregional level.
797
tion of the functions of spatially remote brain modulesand thus is an essential component for the analysis ofbrain systems. Major insights into organizationalbrain principles have already been gained from theanalysis of connectivity data available for primatesusing invasive techniques (Felleman and Van Essen,1991; Young, 1992, 1993; Hilgetag et al., 1996). Fur-thermore, models based on real anatomical connectiv-ity have provided new methods for explaining clinicalphenomena (Hilgetag et al., 1999; Young et al., 2000)and predicted functional properties of brain structuresthat were later confirmed experimentally (Scannell etal., 1996). Common neurological diseases, such as mul-tiple sclerosis, are associated with damaged anatomi-cal connectivity. Furthermore, some psychiatric dis-eases, most prominently schizophrenia, have beenpostulated to result from neurodevelopmental distur-bances of connectivity at a structural and/or functionallevel (Andreasen et al., 1999; Bullmore et al., 1998;Friston, 1998).
Little is known about human brain anatomical con-nectivity to date. This lack of information is due to thefact that the powerful, but invasive, tract-tracingmethods successfully used for determining connectionsin animal brains cannot be applied to humans. There-fore, most human connectivity data available to datestem from gross dissection of the human brain (Ta-lairach and Tournoux, 1988), histological stainingtechniques of major fiber bundles (Burgel et al., 1999),and degeneration studies in patients (Miklossy andvan der Loos, 1991; Pujol et al., 1990; Di Vigilio andClarke, 1997; Werring et al., 2000). However, none ofthese techniques delivers connectivity data at the levelof detail required to elucidate the course of any but the
Received M
h 20, 2001more major tracts. In addition, dissection and histolog-
arc
1053-8119/02 $35.00© 2002 Elsevier Science (USA)
All rights reserved.
ical techniques cannot be applied in vivo (for example,in patients for diagnostic and prognostic means) butcan only be used postmortem. Degeneration studiesrequire brain lesions in patients, which are beyondexperimental control, and lesions are often too large toallow unambiguous relationships to be drawn betweenspecific degenerated areas and distinct brain struc-tures, such as single cortical areas.
In contrast, diffusion tensor imaging (DTI) (Basser etal., 1994) seems to provide a method by which it maybecome possible to obtain in vivo human connectivitydata noninvasively and rapidly. Diffusion tensor imag-
ing probes the random thermal motion of water mole-cules in tissue. Obstructions to this motion, includingcell cytostructure and membranes, cause restricted dif-fusion. When these microscopic obstacles are arrangedcoherently over the scale of an imaging voxel, the bulkdiffusion properties within that voxel become direc-tional or anisotropic; water molecules may be less re-stricted in their motion in certain orientations thanothers. DTI is sensitive to this anisotropy. The infor-mation gained from a DTI study may therefore beinterpreted to provide information concerning the ori-entation of tissue microstructure. This microstructure
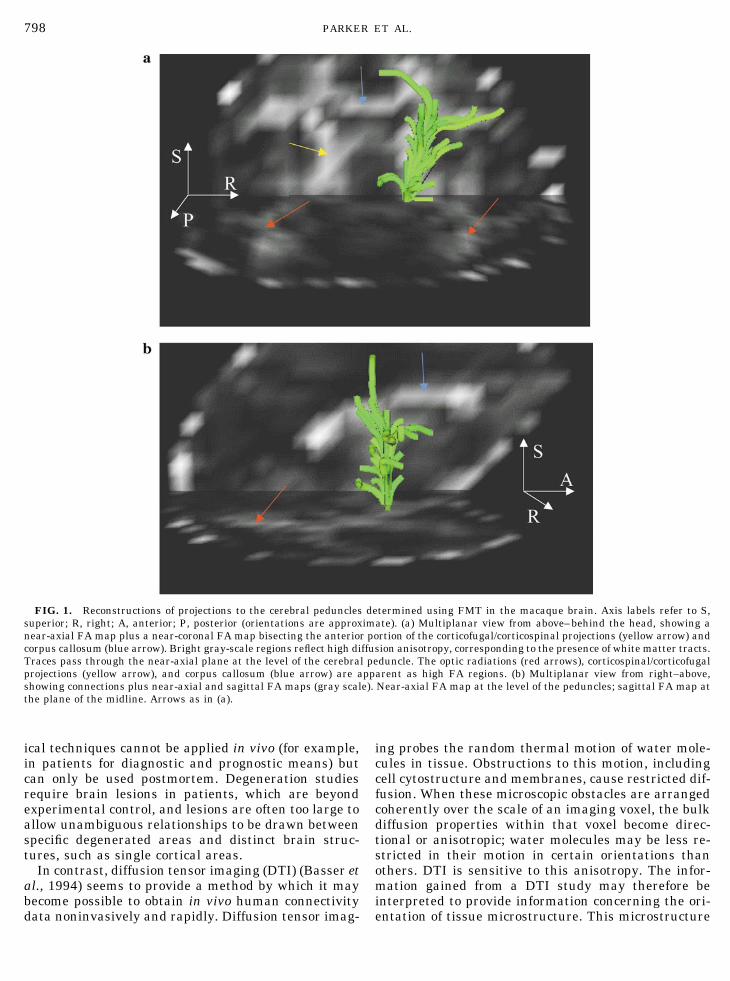
FIG. 1. Reconstructions of projections to the cerebral peduncles determined using FMT in the macaque brain. Axis labels refer to S,superior; R, right; A, anterior; P, posterior (orientations are approximate). (a) Multiplanar view from above–behind the head, showing anear-axial FA map plus a near-coronal FA map bisecting the anterior portion of the corticofugal/corticospinal projections (yellow arrow) andcorpus callosum (blue arrow). Bright gray-scale regions reflect high diffusion anisotropy, corresponding to the presence of white matter tracts.Traces pass through the near-axial plane at the level of the cerebral peduncle. The optic radiations (red arrows), corticospinal/corticofugalprojections (yellow arrow), and corpus callosum (blue arrow) are apparent as high FA regions. (b) Multiplanar view from right–above,showing connections plus near-axial and sagittal FA maps (gray scale). Near-axial FA map at the level of the peduncles; sagittal FA map atthe plane of the midline. Arrows as in (a).
798 PARKER ET AL.
has a high degree of regional directional coherence inwhite matter and low coherence in gray matter. ThusDTI is able not only to distinguish these tissue types,but also to elucidate the bulk orientation of microstruc-ture therein. This information provides the basis ofDTI tractography—methods developed to determinethe pathways of anatomical CNS connections in vivo(Conturo et al., 1999; Jones et al., 1999; Poupon et al.,2000; Basser et al., 2000; Mori et al., 1999, 2000;Parker, 2000; Parker et al., 2001; Xue et al., 1999).
In practice, there are current methodical limitationsto DTI that restrict its use as a noninvasive tool fordetermining CNS connectivity. In particular, inter-
preting the information contained within the diffusiontensor as an indicator of the spatial orientation of fibertracts is complicated by several factors. These includethe current poor resolution of DTI data in comparisonwith the size of fiber tracts, which may lead to ambig-uous information in the presence of fiber crossingswithin individual voxels (Pierpaoli et al., 2001). A sec-ond significant factor is the typically low signal-to-noise ratio (SNR) of DTI data, which introduces a riskof errors in the directional information provided byDTI. There is a trade-off between high spatial resolu-tion and good SNR; decreasing voxel volume leads to aproportional decrease in SNR. This loss of SNR can be
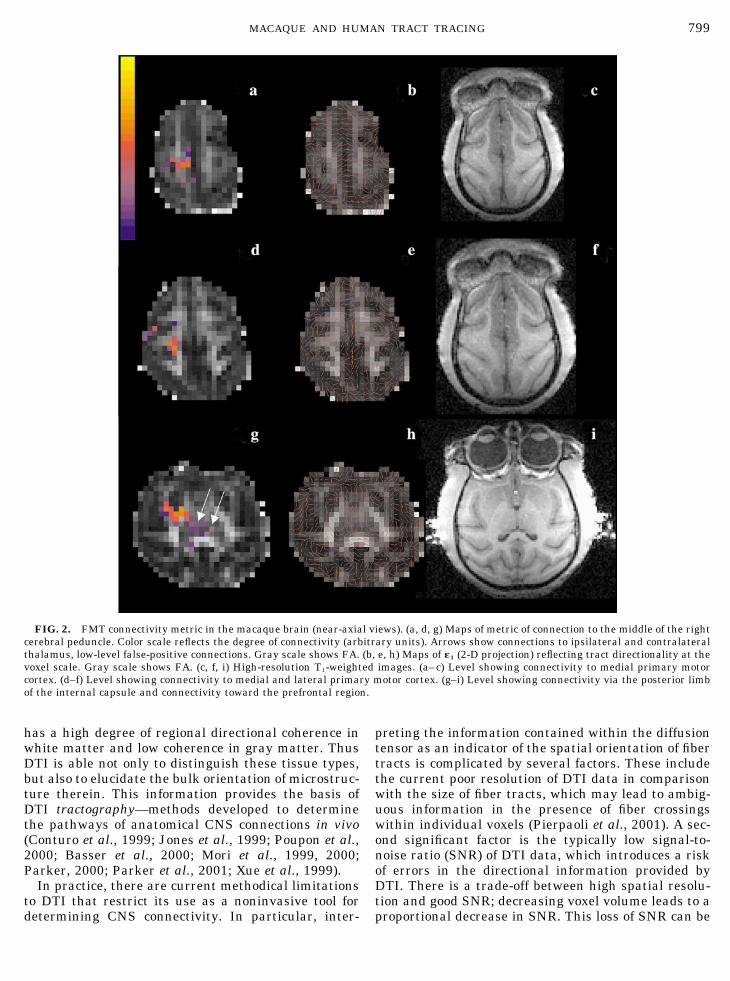
FIG. 2. FMT connectivity metric in the macaque brain (near-axial views). (a, d, g) Maps of metric of connection to the middle of the rightcerebral peduncle. Color scale reflects the degree of connectivity (arbitrary units). Arrows show connections to ipsilateral and contralateralthalamus, low-level false-positive connections. Gray scale shows FA. (b, e, h) Maps of �1 (2-D projection) reflecting tract directionality at thevoxel scale. Gray scale shows FA. (c, f, i) High-resolution T1-weighted images. (a–c) Level showing connectivity to medial primary motorcortex. (d–f) Level showing connectivity to medial and lateral primary motor cortex. (g–i) Level showing connectivity via the posterior limbof the internal capsule and connectivity toward the prefrontal region.
799MACAQUE AND HUMAN TRACT TRACING
compensated for by using a higher magnetic fieldstrength, longer acquisition times, improved acquisi-tion sequences, or improved or more appropriate imag-ing hardware. The study presented here uses a clinicalMR scanner with a field strength of 1.5 T. Such a fieldstrength provides adequate SNR for most DTI studiesin humans. To allow for higher spatial resolution in thestudy of the macaque brain we have utilized an imag-ing coil different from that used in the human study.This improves SNR sufficiently to allow a DTI study ofa macaque brain using a standard clinical scanner.
Confounds such as SNR and limited spatial resolu-tion make the determination of anatomical fiber tractsfrom diffusion tensor data a challenging problem. Var-ious tractography methods have been suggested (Con-turo et al., 1999; Jones et al., 1999; Poupon et al., 2000;Basser et al., 2000; Mori et al., 1999; Parker, 2000;Parker et al., 2001). While the approaches of Conturo etal. (1999), Basser et al. (2000), and Mori et al. (1999)have elements in common, those of Jones et al. (1999),Poupon et al. (2000), and Parker et al. (2001) use mark-edly different approaches. There is no consensus as towhich method provides the most accurate and preciseestimation of fiber tracts. It is therefore important toevaluate the sensitivity and specificity of these meth-ods against an anatomical gold standard: “Improvingour general methodology will require knowledge of agold standard with which to test the validity and ac-curacy of all refinements. One of the challenges to beimmediately pursued, therefore, is the design of reli-able validation approaches, using, for instance animalsand standard tracer-based methods” (Poupon et al.,2000, p. 194).
To date, tractography in animal brains has beenlimited to rodents (Xue et al., 1999; Mori et al., 1999).White matter pathways in rodent brains are of limitedextent and complexity and therefore fall short of pro-viding validation of tractography techniques in the hu-man brain. However, there is a large corpus of dataavailable for the macaque monkey, representing a rel-atively close analogy in terms of brain structure to thehuman. Considerable efforts have been made in recentyears to generate this information and to organize it indatabases, thus providing a comprehensive and acces-sible source of connectivity information (Felleman andVan Essen, 1991; Young, 1993; Stephan et al., 2000,2001). A logical step in the process of evaluating themethodical properties of DTI is therefore to obtain DTIdata for the macaque brain and compare them with theanatomical data available for this species. This may beperformed by reference to connectivity databases, suchas CoCoMac (Stephan et al., 2001, www.cocomac.org),which allows users to browse known individual inva-sive connectivity findings and to generate integrateddata sets across various reports. This would facilitatecomparisons between DTI and anatomy in a qualita-
tive manner and also provide information on variabil-ity in connectivity findings across experiments.
DTI data have been collected in monkey brains (Pier-paoli and Basser, 1996), but tractography data are, todate, lacking. The use of tractography in the macaquewill allow clarification of the following questions: (i)What are the current anatomical limitations of DTItractography? (ii) Given a certain anatomical resolu-tion (i.e., voxel size relative to the anatomical structureof interest), how sensitive and specific is the determi-nation of the paths of fiber tracts by DTI? (iii) What arethe advantages and disadvantages of the various trac-tography methods developed to date?
For the first time, this study reports experimentaldata obtained by noninvasive in vivo tracing of fiberbundles in the macaque brain. While the coarse reso-lution of the data still limits the elucidation of the finergrained connections in the macaque brain, our studyreplicates some well-established features of primateconnectivity with regard to larger tracts and provides afirst example of how DTI may be applied in this con-text. DTI data acquired using a clinical scanner in thehuman brain are at a higher anatomical resolutionthan is possible in the macaque brain using the samescanner and acquisition sequence (i.e., the same spa-tial resolution). The effects of voxel size relative to theanatomical structure of interest are indicated by apreliminary parallel investigation into human and ma-caque pathways. The anatomy of the identified connec-tions in both species is determined by the use of ana-tomical landmarks including well-defined whitematter tracts and well-defined cortical sulci.
A comparison of the different tractography methodssuggested to date is beyond the scope of this work.Here, we apply the fast marching tractography (FMT)method (Parker, 2000; Parker and Dehmeshki,2000a,b; Parker et al., 2001) in both species studied.The potential advantages of this technique are: (i) anability to elucidate branching tracts (such as thosefound in the corona radiata) and (ii) an ability to pro-vide an informal estimate of the “likelihood” of connec-tion between points in the brain using a connectivitymetric.
METHODS
The determination of cerebral connectivity requiresthe acquisition of DTI data of the highest possiblespatial resolution in a reasonable time. The tensorinformation is then calculated, providing maps of ten-sor-related parameters, such as the eigenvectors andeigenvalues of the tensor and indices of tensor anisot-ropy. Fast marching tractography is then applied usingthe information contained in these maps to estimate aconnectivity metric between brain regions (see Appen-dix for details). The routes of connection are also elu-cidated.
800 PARKER ET AL.

Data Acquisition
Echo-planar DTI images were acquired using a GESigna 1.5-T scanner from a single purpose-bred adultfemale macaque monkey (Macaca fascicularis; weight3.0 kg), under deep general anesthesia (2.5% isofluranein a 50:50 mixture of N2O and O2). The monkey waspremedicated with 30 mg/kg methylprednisolone (solu-Medrone; Pharmacia and Upjohn). All animal proce-dures were carried out and approved under regulationsissued under the UK Scientific Procedures (Animals)Act, including approval by the Institute of NeurologyEthical Review Process. Full details are given in Bakeret al. (1999). Scanning parameters were TR � 2500 ms,TE � 116 ms, � � 40 ms, � � 32 ms, 63 diffusionsensitizing directions (Jones et al., 1999b), bmax � 1000smm�1, 22 mTm�1 maximum gradient strength, in-plane resolution 2.2 mm � 2.2 mm, field of view (FOV)140 mm � 140 mm, 24 2.2-mm slices (whole braincoverage), no cardiac gating. Data were acquired usinga phased array temporomandibular joint coil (a pair ofcircular elements, each of 3 cm diameter) with its ele-ments placed on either side of the animal’s head. Thisarrangement was shown to provide two to three timesthe SNR of the standard GE quadrature head coil foran object the size of the macaque head. The animal wasplaced in a prone position, with its head in a Plexiglasheadholder, including eye and ear bars, and restingwithin a cradle, designed for anatomical imaging re-quired for a separate project (Baker et al., 1999). Earbars and eye bars were used to prevent motion. Totaldata acquisition time was approximately 8 min. Addi-tionally, a conventional 3D T1-weighted spoiled gradi-ent-recalled data set was obtained to provide an ana-tomical localization of tracts determined from the DTIdata and to assist with anatomical landmark determi-nation for starting point placement. These data werenot registered to the EPI data, and all landmark iden-tification was performed by visual comparison of thetwo data sets.
For anatomical resolution comparison, correspond-ing analyses were performed in a single female humanadult. All imaging parameters were the same as beforeexcept for 2.5-mm isotropic voxels, 28 diffusion sensi-tizing directions, FOV 240 mm � 240 mm, cardiacgating, 42 slices. The standard quadrature head coilwas used, this being the optimal coil in terms of SNRfor the human head. Data acquisition time was �25min. Even though the spatial resolution of this study iscomparable to that of the macaque study, the anatom-ical resolution of the human study is significantlyhigher. The larger spatial dimensions of human brainstructures allow more imaging voxels of a given size tobe placed in any given structure and reduce the pro-portion of voxels containing significant amounts ofmore than one macroscopic tissue type. A high-resolu-tion multislice T2-weighted data set was also acquired
in the human brain to assist with anatomical place-ment of tractography starting points. These data werenot registered to the EPI data.
Data Reconstruction
The diffusion tensor was estimated for all voxels inthe data set using software developed in-house, afterremoval of eddy current-induced image distortions inthe different diffusion-sensitized images using an af-fine multiscale 2-D registration method (Symms et al.,1997). The tensor was diagonalized to provide esti-mates of the eigenvectors and eigenvalues of diffusion(Basser et al., 1994; Pierpaoli and Basser, 1996; Basserand Pierpaoli, 1996). In white matter tracts, the prin-cipal eigenvector, �1, associated with the principal eig-envalue, �1, of the tensor is used to define the directionof fiber bundles. Fractional anisotropy (FA), a measureof the anisotropy of the tensor that indicates the degreeof directional preference of the fiber bundles in anygiven voxel, was also calculated (Pierpaoli and Basser,1996; Basser and Pierpaoli, 1996) as
FA ����1 � �2
2 � ��2 � �32 � ��1 � �3
2
�2�� 12 � � 2
2 � � 32
, (1)
where �p represents the pth eigenvalue of the tensor.
SNR Considerations
Previous work has shown that measurements of an-isotropy are prone to systematic bias in the presence ofnoise in the diffusion-weighted data (Pierpaoli andBasser, 1996; Bastin et al., 1998). We have previouslyinvestigated the behavior of anisotropy with SNR onthe scanner used for the current study (see for exampleParker et al., 2000) and have defined limits on scan-ning parameters when using the head coil to ensurethat errors in anisotropy are minimized. Phantommeasurements in the head coil and in the phased arraytemporomandibular joint coil used for the macaquestudy were employed to ensure that SNR characteris-tics were comparable between the human study andthe macaque study (data not shown).
Anatomical Connections
The FMT method was used to trace the pathways offiber bundles. See the Appendix and Parker (2000),Parker and Dehmeshki (2000a,b), and Parker et al.(2001) for details. Axonal projections were traced in themacaque and human brain. We wished to explore theability of the FMT method to replicate well-knownanatomical connections. The first of the pathways cho-sen as an exemplar of the technique is the corticospinaltract, or more specifically the descending corticofugal
801MACAQUE AND HUMAN TRACT TRACING

projections (including those of the corticospinal tract—less than about 20% of fibers in the cerebral peduncleas a whole are corticospinal; most of the others arecorticopontine projections (Porter and Lemon, 1993,p.80)) in the middle third of the cerebral peduncle. Thesecond is the optic radiation, lateral to the lateralgeniculate nucleus (LGN).
For the macaque corticospinal tract study, we chosea single voxel in the middle third of one of the cerebralpeduncles as the start point. The most substantialtract passing through this region is the corticospinal.We subsequently applied the FMT technique (see Ap-pendix) to estimate the likelihood of connection to thepeduncle for the entire brain. A second macaque study
of the optic radiation involved the selection of a singlestart voxel within the optic radiation, just lateral to theLGN. FMT was used to determine the most likely 1% oftraces present in the entire brain. This was performedwithin each optic radiation.
In the human brain, FMT was used to estimate like-lihood of connection within the whole brain to voxelsplaced in the cerebral peduncle and optic radiations, atpositions corresponding to those used in the macaquestudy. Single voxels were again used as seeds for theFMT process. All studies were performed with athreshold of 0.1 in FA values. This ensured that traceswould not erroneously pass into areas of very low an-isotropy, such as the cerebrospinal fluid spaces
FIG. 3. FMT tract reconstructions in the human corticofugal/corticospinal projections, from a start voxel in the middle of the rightcerebral peduncle. Top 1% most likely of all possible connections shown, overlaid on FA maps for anatomical reference. (a) View from aboveand behind, showing convergence from medial and lateral motor areas. Coronal FA map bisecting the anterior portion of the corticofugal/corticospinal projections (white arrow) and corpus callosum (red arrow); near-axial FA map at the level of the peduncles (blue arrow) andinferior extent of the optic radiations (yellow arrow). (b) View from the right, showing anterior/posterior branching within the corona radiata.Axial FA map at the level of the peduncles; sagittal FA map at the plane of the midline.
802 PARKER ET AL.

RESULTS
Cerebral Peduncle Study
FMT in the macaque corticospinal tract yieldedtraces shown in Fig. 1. The traces pass through appro-priate regions, such as the posterior limb of the inter-nal capsule (Fries et al., 1993; Armand et al., 2001),and branch to both medial and lateral aspects of pri-mary motor cortex. Figure 2 gives more specific infor-mation, showing connectivity as estimated in the right
(radiological viewing convention) corticospinal tract.Also shown are maps of �1 and high-resolution T1-weighted images at corresponding levels. High connec-tivity is correctly assigned to areas in the medial andlateral primary motor areas on the right side (Figs. 2aand 2d). The internal capsule is also precisely identi-fied by high connectivity for the passage of connections(Fig. 2g). Lower connectivity regions are apparentthroughout the rest of the brain, demonstrating suc-cessful demarcation of the regions known to project
FIG. 4. FMT connectivity metric in the human brain (axial views). (a, d, g) Maps of connectivity to the right cerebral peduncle. Color scalereflects the degree of connectivity (arbitrary units) (see Fig. 3). Gray scale shows FA. High signal appearing at the edge of the brain is dueto an imperfect manual masking procedure used to remove unwanted noise from the region outside the brain. (b, e, h) Magnified maps of �1
(2-D projection) reflecting tract directionality at the voxel scale. Gray scale shows FA. (c, f, i) High-resolution T2-weighted images. (a–c) Levelshowing connectivity from primary motor (white arrow), premotor (red arrow), and supplementary (blue arrow) motor areas. (d–f) Levelshowing some branching along the anterior–posterior axis of the corona radiata. Lateral primary motor cortex also shows significantconnectivity (arrow) (see Fig. 3). (g–i) Level showing connectivity via the posterior limb of the internal capsule (blue arrow) and furtherconnectivity from the lateral primary motor cortex (red arrow).
803MACAQUE AND HUMAN TRACT TRACING

into the middle third of the cerebral peduncle. A regionof high connectivity is also apparent toward the rightprefrontal region (Fig. 2g). Although this region doesnot contribute to the corticospinal tract, it does sendprojections to the medial portion of the peduncle aspart of the frontopontine tract (Crosby et al., 1962;Carpenter and Sutin, 1983; Dum and Strick, 1991).False-positive regions (e.g., in the contralateral thala-mus), absent from the more fine-grained human data(see below), were apparent in the macaque study. Forthe purposes of this work, we define a false-positiveconnection to be a connection that seems reasonablegiven the DTI data and using the FMT algorithm, butthat cannot be explained reasonably from known anat-omy. Similarly, false-negative connections are thosethat would be expected from known anatomy, but thatare not found using FMT on the available data.
Studies in the human brain provided more detailedresults (Figs. 3 and 4) due to the higher anatomicalresolution of the data, although the results werebroadly similar to those of the macaque brain. As ex-pected, projections from the medial and lateral pri-mary motor area, and from the premotor and supple-mentary motor areas, are apparent. Viewing the mapsof the connectivity to the start voxel confirms theseobservations (Fig. 4). A qualitative comparison be-tween the observed connectivity to the start region andthe branching patterns to be expected from the knownanatomy of the corona radiata reveals no significantareas of false-positive connection.
Optic Radiations
Figure 5a shows a reconstruction of traces with startpoints within the left and right optic radiations of themacaque brain. Figure 5b shows the �1 present in thisarea. Seed points were placed in the body of the opticradiation, lateral to the position of the LGN, and re-gions consistent with primary visual areas were iden-tified as being of high connection likelihood to the seedpoints. The top 1% most likely connections from the leftand right sides are reconstructed in Fig. 5a, showing aportion of each radiation successfully determined.However, partial volume effects between the optic ra-diation, the occipitofrontal fasciculus (Barr and Kier-nan, 1988), and the optic tract at the start points meanthat these pathways cannot be resolved at this resolu-tion; the anterior connections are likely to be a result ofthis. The pathways demonstrate a degree of symmetry,following the route of the paths suggested by the re-gions of high FA (Figs. 5a and 5b). Some possible false-positive connections are again apparent; connectionsanterior to the primary visual region are likely to beerroneous.
The equivalent study in the human brain againshowed superior reconstruction of the optic radiation
using FMT, as is to be expected from these higheranatomical resolution data (Fig. 6). High connectivitywas identified along the length of the optic radiations,from the posterolateral edge of the thalamus to thevisual cortex. In both hemispheres, high-likelihoodtraces were also identified medial to the startingpoints, running along the posterior edge of the thala-mus, which are likely to form a portion of the arc of theoptic radiation in which its medial–lateral directionchanges to an anterior–posterior one. The blue arrowsin Fig. 6 give the approximate location of the LGN.Overall, the spatial course of the tracts shown by Fig.6 is remarkably similar to those shown by Conturo etal. (1999; compare their Figs. 2 and 3), who identifiedthe LGN and primary visual cortex by means of paral-lel fMRI experiments and used these estimates as startand target points for tracing the optic radiation in aconstrained fashion.
DISCUSSION
The fast marching tractography approach provides ametric of the connectivity of the anatomical pathwaysin the central nervous system, based on informationpresent in DTI data. We have shown that it is possibleto determine motor corticofugal and optic radiationpathways in the macaque and human brain using astandard 1.5-T clinical MR scanner. However, thecoarse anatomical resolution of the present macaqueDTI data restricts the level of detail of connectivitythat may be determined; differentiation between vox-els containing multiple anatomically distinct pathwaysis shown to be problematic in some situations (Fig. 5).This restriction is less significant in the human brain,allowing more fine-structured estimates of the path-ways of connection to be obtained, with less evidence of“cross-contamination” between pathways. No obviousfalse-positive connections were identified in the humanbrain study. The connection pathways are detailed incomparison with those obtainable from postmortemlesion studies in humans, although they are still coarsecompared with those obtainable using invasive tracingmethods in animals.
Although the study of connectivity in the macaquebrain is limited by the available anatomical resolution,estimates of the projections to the cerebral pedunclefrom the motor areas provide results consistent withknown anatomy (compare Fig. 2 with Crosby et al.,1962, and Fries et al., 1993). The experiments in thehuman corticospinal tract and optic radiations show ahigh degree of detail in the connections found, whichagain are consistent with known anatomy. In particu-lar, the reconstruction of the branching structure of thecorona radiata and of the posterior portion of the opticradiations matches known anatomy. Such a recon-struction is impossible with alternative existing stream-line methods of tractography when tracing from a sin-
804 PARKER ET AL.

gle start point, although it is possible to produce animpression of diverging pathways by utilizing multipleinterpolated start points within the start voxel. How-ever, the density of traces after the point of branchingor fanning will reduce as the traces diverge when usingthese techniques, thus undersampling (in general in anonuniform manner) subsequent connected regions.This change in density will not in general reproduceany reduction in packing density of the underlyingaxons and is avoided using the FMT method.
A valuable step in the evaluation of the relativemerits of tractography approaches would be a compar-ison of the branching determined by different tractog-raphy methods and of the relative merits of connectiv-ity determined with and without the use of datamanipulation steps, such as interpolation. For this toproceed in a realistic setting, quantitative gold-stan-dard connectivity in the macaque brain will be highlyrelevant. We propose that both qualitative validationapproaches (via connectivity databases of the macaquebrain, e.g., www.cocomac.org) and quantitative valida-tion approaches (via individual anatomical tracingstudies) should be pursued in the future. More specif-ically, connectivity databases can deliver matrices ofconnections between a chosen set of brain regions inthe macaque (see Stephan et al., 2000, 2001). Giventhat sufficiently high resolution is possible, tractogra-phy methods would then have to replicate these con-nection patterns from monkey DTI data, exploringeach connection predicted by the databases in a step-by-step fashion. Moreover, the three-dimensional to-pography of the tracts could be compared with anatom-ical studies in monkeys specifically devoted to thisquestion (e.g., Morris et al., 1999).
The significant problems associated with partial vol-ume in the monkey brain become clear in Fig. 5, as theanterior portions of the optic radiations, the occipito-frontal fasciculi, and the optic tract become unresolv-able. The problems associated with identifying suchfalse-positive and false-negative results, especially insmaller pathways, are common to all tractographymethods. Is seems likely that higher resolution dataacquisition is the only solution to this problem. It istherefore prudent to accept the limitations on the res-olution of reliably detectable pathways dictated by theresolution of the data. These limitations are, as yet,poorly defined; the use of invasive animal connectivitydata to identify likely false-positive or false-negativeresults obtained in the same animals using tractogra-phy analyses has been shown to be a realistic aim andmust form the basis of future work.
A second effect of partial volume averaging on con-nectivity analysis is the difficulty in extracting reliableinformation from the tensor when pathways cross orbranch. Under these conditions the diffusion tensorellipsoid is oblate, making the meaning of �1 ambigu-ous and hampering connectivity analyses. Data acqui-
sitions using multiple diffusion direction sensitizationgradient schemes such as were used in our study(Jones et al., 1999b) provide enough orientation infor-mation to start to extract the additional informationrequired to describe adequately such situations. Thedevelopment of higher order descriptions of the diffu-sion phenomena present in tissue, such as multipletensor fitting, or the use of alternative parameteriza-tions, such as spherical harmonics (Frank, 2001), mayprovide at least a partial solution to this problem. TheFMT technique is readily adaptable to the utilization ofsuch developments, and this will form a component offuture FMT research.
A significant restriction on the resolution of DTIstudies is the SNR of the data acquisition (the othersignificant factor being limitations on the echo trainlength used in single-shot EPI). Noise will always bepresent to a degree in DTI data, which introduces anassociated uncertainty in the direction of the principaleigenvector, �1. The work conducted in this study wasperformed under criteria that have been shown to pro-vide good quality anisotropy data; it is assumed thatsuch data acquisition criteria will also generate �1 withdirectional information corrupted little by noise. How-ever, any residual uncertainty will degrade the perfor-mance of any tractography method, causing errors inconnectivity measurements that will increase with dis-tance from the start point (Basser et al., 2000). Themacaque data acquisition used here was performed ina period of approximately 8 min to allow other dataacquisition procedures to proceed for separate, unre-lated, research projects. There is therefore consider-able scope for increasing the scan time for future DTIstudies, thus increasing the SNR of the resulting data.This will allow significant improvements in the spatialand anatomical resolution of the data and have a con-sequent significant benefit on the tractography pro-cess. For example, under the current scanning proto-col, an increase of a factor of 8 in scan time toapproximately 1 h will allow a reduction in linear voxeldimensions, potentially giving 1.5 � 1.5 � 1.5-mmresolution. The fact that our present tractography ex-periments demonstrate that the FMT method is able toproduce plausible results, even for the relatively coarsedata obtained to date, indicates that tractographystudies in the macaque brain, even in a standard clin-ical scanner, are within the bounds of feasibility. In thecase of high-field and custom-made macaque scanners(e.g., Logothethis et al., 1999), this will become mucheasier still. Even today, custom-built macaque scan-ners easily achieve a spatial resolution of far below 1mm voxel size in all dimensions (e.g., Logothetis et al.,1999, 2001). The use of macaque data for the validationof tractography methods is therefore possible andshould be accomplished with a minimum of delay.
Additional improvements to the acquisition protocolinclude the possible utilization of cardiac gating in
805MACAQUE AND HUMAN TRACT TRACING

macaque studies (Pierpaoli and Basser, 1996). In ourwork gating was not used, as the monkey heart rate issignificantly more rapid than in the human, meaningthat the number of images it would be possible toacquire would be restricted within each TR. Modifica-tions to the acquisition protocol (for example, the uti-lization of a TR period of many cardiac cycles) maymake this feasible for future studies. However, thiswould be at the expense of longer data acquisitiontimes. Additionally it has not been demonstrated thatcardiac gating leads to a significant improvement indata quality when using multiple diffusion sensitiza-tion direction tensor encoding schemes (Jones et al.,1999b), as used in this work.
The choice of the connectivity metric threshold hasbeen set, arbitrarily, to allow visualization of the top1% connections. Some false-positive results are there-fore found in some analyses (e.g., Fig. 2) and are to beexpected if this threshold is overly optimistic. Like-wise, there is potential for false-negative results if thethreshold is too pessimistic. As the determination ofthe connection metric is a quantitative method, it mayin future be possible to set an independent quantitativethreshold for connectivity, rather than using a certaincentile of all possible connections, possibly based on ananalysis of the histogram of the connectivity metricover the entire brain.
In summary, the FMT method has been shown to beable to estimate anatomical connectivity using DTIdata obtained on a standard clinical scanner in boththe macaque and the human brain. The results in the
human study are more detailed than in the macaquedue to the better anatomical resolution of the data.Improved acquisition protocols, however, will not onlyremove this difference, but may make possible anatom-ical resolutions in monkey DTI which allow a truevalidation by comparison with anatomical data fromtract tracing experiments in this species. Only in thisway can the merits and potential of various tractogra-phy methods be determined. This methodological eval-uation of DTI and tractography methods will be anindispensable basis of the future use of DTI for inves-tigating human brain connectivity, both in basic re-search and in clinical conditions.
APPENDIX
The FMT technique is based on level set approachesand allows putative pathways of connection to be de-termined (Sethian, 1996, 1999; Malladi and Sethian,1996; Kimmel and Sethian, 1998). All voxels in thebrain are assigned a metric of connectivity to a startpoint, which allows multiple connections (as is appro-priate in the case of branching structures such as thosefound in the corona radiata) and maps of the metric forthe whole brain to be determined (Parker and Deh-meshki, 2000a,b; Parker et al., 2001). The metric maybe interpreted as an informal measure of the likelihoodof connection.
Putative pathways between all points in the brainand a start point are generated via a region growingstep, followed by a gradient descent step. The rate at
FIG. 5. (a) Traces from positions lateral to the LGN in the optic radiations of the macaque brain, overlaid on a near-axial FA map foranatomical reference. The optic radiations are reconstructed (blue arrows) from the start points shown by the pink arrows. Partial volumeeffects lead to the occipitofrontal fasciculus (red arrows) and the optic tract (green arrows) also being included in the top 1% most likely traces.Possible connection to the LGN is indicated by the yellow arrow. Likely false-positive results posterior to the LGN are shown by the whitearrow. (b) Map of �1 at slice position used for FA map in (a). This is at the level of the right (as viewed) start point. The left start point wasplaced at the next superior slice position for consistency of anatomical placement. Arrows defined as in (a).
806 PARKER ET AL.

which the region front propagates is determined by afunction related to the underlying diffusion tensorfield. Front evolution occurs rapidly if the principaleigenvectors (�1) in neighboring voxels are close tocolinear with each other and with the normal to thefront at that position. A speed function, F, determinesthe speed of propagation at any point, r. The form of Fmay be varied to alter the influence of local factors,such as tensor anisotropy (Parker, 2000; Parker andDehmeshki, 2000a,b). For this work, we use the form(Parker et al., 2001)
F�r � min���1�r � n�r�, ��1�r� � n�r�, ��1�r � �1�r��,
(2)
where n is the normal direction to the front and r� isthe position of a neighboring voxel that has alreadybeen passed by the front, along the direction of n.
Evolution is fastest along white matter tracts, wherestrong coherence between neighboring �1 is observed.
As the front reaches each point in the brain, anarrival time, T, is assigned using the relationship�ƒT�F � 1 (Sethian, 1999). A continuous gradient de-scent process through the resultant T field generatesputative paths from any point in the brain. A connec-tivity metric is used to estimate the (informal) likeli-hood that a putative path represents a true anatomicalconnection. The metric, , for any putative path isdetermined by the angle between the tangent, w, of thepathway and the �1 along the path’s length (Parker etal., 2001),
� � min�
��w�� � �1���, (3)
where � is the position on the path. therefore penal-izes paths with tangents that stray from the direc-
FIG. 6. Traces in the human optic radiations, from start voxels lateral to each LGN. Top 1% most likely of all possible connections,overlaid on axial FA map for anatomical reference. Yellow arrows show positions of start points; red arrows show medial connections fromstart points, indicating connections to each LGN.
807MACAQUE AND HUMAN TRACT TRACING

tional information provided by the �1 field. It is sensi-tive to the worst case alignment between w and �1
along the length of the path.The FMT approach relies on front propagation using
26 nearest-neighbor calculations, which means thatthe calculations performed in Eq. (2) are at a limitednumber of orientations. This could introduce errors tothe front propagation process that could possibly bereduced by introducing data interpolation. We haveavoided interpolating the tensor field, or any of theunderlying data, with our approach, although the ef-fects of doing so are forming part of an ongoing pro-gram of research.
ACKNOWLEDGMENTS
The input of Dr. Phil Boulby in the development of the DTI acqui-sition and helpful comments on the manuscript by Professor RichardFrackowiak are gratefully acknowledged. We also thank the anony-mous reviewers for their helpful comments. This work was partiallysupported by the Brain Research Trust London (K.E.S.) and theWellcome Trust (J.B.R., R.E.P., R.N.L., R.L.S., R.T.).
REFERENCES
Andreasen, N. C., Nopoulos, P., O’Leary, D. S., Miller, D. D., Was-sink, T., and Flaum, M. 1999. Defining the phenotype of schizo-phrenia: Cognitive dysmetria and its neural mechanisms. Biol.Psychiatry 46: 908–920.
Armand, J., Yang, H.-W., Maier, M. A., and Lemon, R. N. 2001. Aquantitative analysis of the corticospinal projections to the handmuscle motor nuclei from SMA and M1 in the macaque monkey.Cereb. Cortex, in press.
Baker, S. N., Philbin, N., Spinks, R., Pinches, E. M., Paulius, Q.,McManus, D., Lemon, R. N., and Wolpert, D. M. 1999. Multiplesingle unit recording in the cortex of monkeys using independentlymoveable microelectrodes. J. Neurosci. Methods 94: 5–17.
Barr, M. L., and Kiernan, J. A. 1988. The Human Nervous System.Lippincott, Philadelphia.
Basser, P. J., Mattiello, J., and Le Bihan, D. 1994. Estimation of theeffective self-diffusion tensor from the NMR spin echo. J. Magn.Reson. B 103: 247–254.
Basser, P. J., Pajevic, S., Pierpaoli, C., Duda, J., and Aldroubi, A.2000. In vivo fiber tractography using DT-MRI data. Magn. Reson.Med. 44: 625–632.
Basser, P. J., and Pierpaoli, C. 1996. Microstructural and physiolog-ical features of tissues elucidated by quantitative-diffusion-tensorMRI. J. Magn. Reson. B 111: 209–219.
Bastin, M. E., Armitage, P. A., and Marshall, I. 1998. A theoreticalstudy of the effect of experimental noise on the measurement ofanisotropy in diffusion imaging. Magn. Reson. Imaging 16: 773–785.
Bullmore, E. T., Woodruff, P. W., Wright, I. C., Rabe-Hesketh, S.,Howard, R. J., Shuriquie, N., and Murray, R. M. 1998. Does dys-plasia cause anatomical dysconnectivity in schizophrenia? Schizo-phrenia Res. 30: 127–135.
Burgel, U., Schormann, T., Schleicher, A., and Zilles, K. 1999. Map-ping of histologically identified long fiber tracts in human cerebralhemispheres to the MRI volume of a reference brain: Position andspatial variability of the optic radiation. NeuroImage 10: 489–499.
Carpenter, M. B., and Sutin, J. 1983. Human Neuroanatomy, 8th ed.Williams & Wilkins, Baltimore.
Conturo, T. E., Lori, N. F., Cull, T. S., Akbudak, E., Snyder, A. Z.,Shimony, J. S., McKinstry, R. C., Burton, H., and Raichle, M. E.1999. Tracking neuronal fiber pathways in the living human brain.Proc. Natl. Acad. Sci. USA 96: 10422–10427.
Crosby, E. C., Humphrey, T., and Lauer, E. W. 1962. CorrelativeAnatomy of the Nervous System. MacMillan, New York.
Di Vigilio, G., and Clarke, S. 1997. Direct interhemispheric visualinputs to human speech areas. Hum. Brain. Mapping 5: 347–354.
Dum, R. P., and Strick, P. L. 1991. The origin of corticospinal pro-jections from the premotor areas in the frontal lobe. J. Neurosci.11: 667–689.
Felleman, D. J., and Van Essen, D. C. 1991. Distributed hierarchicalprocessing in the primate cerebral cortex. Cereb. Cortex 1: 1–47.
Foong, J., Maier, M., Clark, C. A., Barker, G. J., Miller, D. H., andRon, M. A. 2000. Neuropathological abnormalities of the corpuscallosum in schizophrenia: A diffusion tensor imaging study.J. Neurol. Neurosurg. Psychiatry 68: 242–244.
Frank, L. R. 2001. Anisotropy in high angular resolution diffusion-weighted MRI. Magn. Reson. Med. 45: 935–939.
Fries, W., Danek, A., Scheidtmann, K., and Hamburger, C. 1993.Motor recovery following capsular stroke. Role of descending path-ways from multiple motor areas. Brain 116: 369–382.
Friston, K. J. 1998. The disconnection hypothesis. SchizophreniaRes. 30: 115–125.
Hilgetag, C. C., O’Neill, M. A., and Young, M. P. 1996. Indeterminateorganization of the visual system. Science 271: 776–777.
Hilgetag, C. C., Kotter, R., and Young, M. P. 1999. Inter-hemisphericcompetition of sub-cortical structures is a crucial mechanism inparadoxical lesion effects and spatial neglect. Prog. Brain. Res.121: 121–141.
Jones, D. K., Simmons, A., Williams, S. C. R., and Horsfield, M. A.1999a. Non-invasive assessment of axonal fiber connectivity in thehuman brain via diffusion tensor MRI. Magn. Reson. Med. 42:37–41.
Jones, D. K., Horsfield, M. A., and Simmons, A. 1999b. Optimalstrategies for measuring diffusion in anisotropic systems by mag-netic resonance imaging. Magn. Reson. Med. 42: 515–525.
Kimmel, R., and Sethian, J. A. 1998. Computing geodesic paths onmanifolds. Proc. Natl. Acad. Sci. USA 95: 8431–8435.
Logothetis, N. K., Guggenberger, H., Peled, S., and Pauls, J. 1999.Functional imaging of the monkey brain. Nat. Neurosci. 2: 555–562.
Logothetis, N. K., Pauls, J., Augath, M., Trinath, T., and Oelter-mann, A. 2001. Neurophysiological investigation of the basis of thefMRI signal. Nature 412: 510–516.
Malladi, R., and Sethian, J. A. 1996. An O(N log N) algorithm forshape modeling. Proc. Nat. Acad. Sci. USA 93: 9389–9392.
Miklossy, J., and van der Loos, H. 1991. The long-distance effects ofbrain lesions: Visualization of myelinated pathways in the humanbrain using polarizing and fluorescence microscopy. J. Neuro-pathol. Exp. Neurol. 50: 1–15.
Mori, S., Crain, B. J., Chacko, V. P., and van Zijl, P. C. M. 1999.Three-dimensional tracking of axonal projections in the brain bymagnetic resonance imaging. Ann. Neurol. 45: 265–269.
Mori, S., Kaufmann, W. E., Pearlson, G. D., Crain, B. J., Stielijes, B.,Solaiyappan, M., and van Zijl, P. C. M. 2000. In vivo visualisationof human neural pathways by MRI. Ann. Neurol. 47: 412–414.
Morris, R., Pandya, D. N., and Petrides, M. 1999. Fiber systemlinking the mid-dorsolateral frontal cortex with the retrosplenial/presubicular region in the rhesus monkey. J. Comp. Neurol. 407:183–192.
808 PARKER ET AL.

Parker, G. J. M. 2000. Tracing fibre tracts using fast marching. Proc.Int. Soc. Magn. Reson. Med. 85.
Parker, G. J. M., and Dehmeshki, J. 2000a. A fast marching analysisof MR diffusion tensor imaging for following white matter tracts.Proc. Med. Image Understanding Anal. MIUA2000 185–188.
Parker, G. J. M., and Dehmeshki, J. 2000b. A level sets approach todetermining brain region connectivity. In Proceedings of the 1stInternational Workshop on Image and Signal Processing and Anal-ysis, IWISPA 2000, 22nd International Conference on InformationTechnology Interfaces, pp. 145–150.
Parker, G. J. M., Schnabel, J. A., Symms, M. R., Werring, D. J., andBarker, G. J. 2000. Nonlinear image smoothing for reduction ofsystematic and random errors in diffusion tensor imaging. J.Magn. Reson. Imaging 11: 702–710.
Parker, G. J. M., Wheeler-Kingshott, C. A., and Barker, G. J. 2001.Distributed anatomical connectivity derived from diffusion tensorimaging. Proc. Inform. Processing Med. Imaging IPMI’01, Lect.Notes Comput. Sci. 2082: 106–120.
Pierpaoli, C., and Basser, P. J. 1996. Toward a quantitative assess-ment of diffusion anisotropy. Magn. Reson. Med. 36: 893–906.
Pierpaoli, C., Barnett, A., Pajevic, S., Chen, R., Penix, L., Virta, A.,and Basser, P. 2001. Water diffusion changes in Wallerian degen-eration and their dependence on white matter architecture. Neu-roImage 13: 1174–1185.
Porter, R., and Lemon, R. N. 1993. Corticospinal Function and Vol-untary Movement. Clarendon Press, Oxford.
Poupon, C., Clark, C. A., Froulin, V., Regis, J., Le Bihan, D., andMangin, J.-F. 2000. Regularization of diffusion-based directionmaps for the tracking of brain white matter fascicles. NeuroImage12: 184–195.
Pujol, R., Marti-Vilalta, J. L., Junque, C., Vendrell, P., Fernandez, J.,and Capdevilla, A. 1990. Wallerian degeneration of the pyramidaltract studied by magnetic resonance imaging. Stroke 21: 404–409.
Scannell, J. W., Sengpiel, F., Tovee, M. J., Benson, P. J., Blakemore,C., and Young, M. P. 1996. Visual motion processing in the ante-rior ectosylvian sulcus of the cat. J. Neurophysiol. 76: 895–907.
Sethian, J. A. 1996. A fast marching level set method for monoton-ically advancing fronts. Proc. Natl. Acad. Sci. USA 93: 1591–1595.
Sethian, J. A. 1999. Level Set Methods and Fast Marching Methods,2nd ed. Cambridge Univ. Press, Cambridge, UK.
Stephan, K. E., Zilles, K., and Kotter, R. 2000. Coordinate-indepen-dent mapping of structural and functional data by objective rela-tional transformation (ORT). Philos. Trans. R. Soc. London B 355:37–54.
Stephan, K. E., Kamper, L., Bozkurt, A., Burns, G. A. P. C., Young,M. P., and Kotter, R. 2001. Advanced database methodology for thecollation of connectivity data on the macaque brain (CoCoMac).Philos. Trans. R. Soc. London B 356: 1159–1186.
Symms, M. R., Barker, G. J., Franconi, F., and Clark, C. A. 1997.Correction of eddy-current distortions in diffusion-weighted echo-planar images with a two-dimensional registration technique.Proc. Int. Soc. Magn. Reson. Medicine 1723.
Talairach, J., and Tournoux, P. 1988. Co-planar Stereotaxic Atlas ofthe Human Brain. Thieme, Stuttgart.
Werring, D. J., Toosey, A. T., Clark, C. A., Parker, G. J. M., Barker,G. J., Miller, D. H., and Thompson, A. J. 2000. Diffusion tensorimaging can detect and quantify corticospinal tract degenerationafter stroke. J. Neurol. Neurosurg. Psychiatry 69: 269–272.
Xue, R., van Zijl, P. C. M, Crain, B. J., Solaiyappan, M., and Mori, S.1999. In vivo three-dimensional reconstruction of rat brain axonalprojections by diffusion tensor imaging. Magn. Reson. Med. 42:1123–1127.
Young, M. P. 1992. Objective analysis of the topological organizationof the primate cortical visual system. Nature 358: 152–155.
Young, M. P. 1993. The organization of neural systems in the pri-mate cerebral cortex. Proc. R. Soc. London B 252: 13–18.
809MACAQUE AND HUMAN TRACT TRACING