Inhibition of NF-κB during human dendritic cell differentiation generates anergy and regulatory...
29
Inhibition of NF-KappaB during human dendritic cell differentiation generates anergy and regulatory T cell activity for one -but not two- HLA-DR mismatches Ana Hernandez 1 , Melissa Burger 1 , Bonnie B. Blomberg 1,2 , William A. Ross 1 , Jeffrey J. Gaynor 1 , Inna Lindner 2 , Robert Cirocco 1 , James M. Mathew 1 , Manuel Carreno 1 , Yidi Jin 1 , Kelvin P. Lee 2 , Violet Esquenazi 1,2,3 , and Joshua Miller 1,2,3 1University of Miami School of Medicine, Department of Surgery, Division of Transplantation, Miami, FL, USA 33136 2Department of Microbiology and Immunology, Miami, FL, USA 33136 3VA Medical Center, Miami, FL, USA 33136 Abstract We examined the in vitro inhibition of human monocyte-derived dendritic cells (DC) maturation via NF-κB blockade on T cell allo-stimulation, cytokine production, and regulatory T cell generation. DC were generated from CD14 + monocytes isolated from peripheral blood using GM-CSF and IL-4 for differentiation and TNF-α, IL-1β, and PGE 2 as maturational stimuli with or without the NF-κB inhibitors, BAY11-7082 (BAY-DC) or Aspirin (ASA-DC). Stimulator and responder cells were one vs two HLA-DR mismatched in direct vs indirect presentation assays. Both BAY-DC and ASA-DC expressed high levels of HLA-DR and CD86 but always expressed less CD40 compared to controls. Some experiments showed slightly lower levels of CD80. Both BAY- and ASA- allogeneic DC and autologous alloantigen pulsed DC were weaker stimulators of T cells (by MLR) compared to controls, and there was reduced IL-2 and IFN-γ production by T cells stimulated with BAY-DC or ASA-DC (by ELISPOT) (more marked results were always observed with ASA-treated DC). In addition NF- κB blockade of DC maturation caused the generation of T cells with regulatory function (T regs) but only when T cells were stimulated by either allogeneic (direct presentation) or alloantigen pulsed autologous DC (indirect presentation) with one HLA-DR mismatch and not with two HLA-DR mismatched (either direct or indirect presentation). However, the T regs generated from these ASA- DC showed similar FoxP3 mRNA expression as those from non-treated DC. Extension of this study to human organ transplantation suggests potential therapies using one DR matched NF-κB blocked DC to help generate clinical tolerance. Keywords Allorecognition; Dendritic cells; NF-κB inhibitors; T reg; FoxP3 Corresponding Author: Bonnie B. Blomberg, PhD, University of Miami School of Medicine, Department of Surgery, Division of Transplantation, 1600 NW 10 th Avenue, RMSB#3146, Miami, FL 33136, Phone: 305-243-6040, Fax: 305-243-4623. Publisher's Disclaimer: This is a PDF file of an unedited manuscript that has been accepted for publication. As a service to our customers we are providing this early version of the manuscript. The manuscript will undergo copyediting, typesetting, and review of the resulting proof before it is published in its final citable form. Please note that during the production process errors may be discovered which could affect the content, and all legal disclaimers that apply to the journal pertain. NIH Public Access Author Manuscript Hum Immunol. Author manuscript; available in PMC 2008 September 1. Published in final edited form as: Hum Immunol. 2007 September ; 68(9): 715–729. NIH-PA Author Manuscript NIH-PA Author Manuscript NIH-PA Author Manuscript
-
Upload
independent -
Category
Documents
-
view
0 -
download
0
Transcript of Inhibition of NF-κB during human dendritic cell differentiation generates anergy and regulatory...
Inhibition of NF-KappaB during human dendritic celldifferentiation generates anergy and regulatory T cell activity forone -but not two- HLA-DR mismatches
Ana Hernandez1, Melissa Burger1, Bonnie B. Blomberg1,2, William A. Ross1, Jeffrey J.Gaynor1, Inna Lindner2, Robert Cirocco1, James M. Mathew1, Manuel Carreno1, Yidi Jin1,Kelvin P. Lee2, Violet Esquenazi1,2,3, and Joshua Miller1,2,3
1University of Miami School of Medicine, Department of Surgery, Division of Transplantation, Miami, FL,USA 33136
2Department of Microbiology and Immunology, Miami, FL, USA 33136
3VA Medical Center, Miami, FL, USA 33136
AbstractWe examined the in vitro inhibition of human monocyte-derived dendritic cells (DC) maturation viaNF-κB blockade on T cell allo-stimulation, cytokine production, and regulatory T cell generation.DC were generated from CD14+ monocytes isolated from peripheral blood using GM-CSF and IL-4for differentiation and TNF-α, IL-1β, and PGE2 as maturational stimuli with or without the NF-κBinhibitors, BAY11-7082 (BAY-DC) or Aspirin (ASA-DC). Stimulator and responder cells were onevs two HLA-DR mismatched in direct vs indirect presentation assays. Both BAY-DC and ASA-DCexpressed high levels of HLA-DR and CD86 but always expressed less CD40 compared to controls.Some experiments showed slightly lower levels of CD80. Both BAY- and ASA- allogeneic DC andautologous alloantigen pulsed DC were weaker stimulators of T cells (by MLR) compared to controls,and there was reduced IL-2 and IFN-γ production by T cells stimulated with BAY-DC or ASA-DC(by ELISPOT) (more marked results were always observed with ASA-treated DC). In addition NF-κB blockade of DC maturation caused the generation of T cells with regulatory function (T regs) butonly when T cells were stimulated by either allogeneic (direct presentation) or alloantigen pulsedautologous DC (indirect presentation) with one HLA-DR mismatch and not with two HLA-DRmismatched (either direct or indirect presentation). However, the T regs generated from these ASA-DC showed similar FoxP3 mRNA expression as those from non-treated DC. Extension of this studyto human organ transplantation suggests potential therapies using one DR matched NF-κB blockedDC to help generate clinical tolerance.
KeywordsAllorecognition; Dendritic cells; NF-κB inhibitors; T reg; FoxP3
Corresponding Author: Bonnie B. Blomberg, PhD, University of Miami School of Medicine, Department of Surgery, Division ofTransplantation, 1600 NW 10th Avenue, RMSB#3146, Miami, FL 33136, Phone: 305-243-6040, Fax: 305-243-4623.Publisher's Disclaimer: This is a PDF file of an unedited manuscript that has been accepted for publication. As a service to our customerswe are providing this early version of the manuscript. The manuscript will undergo copyediting, typesetting, and review of the resultingproof before it is published in its final citable form. Please note that during the production process errors may be discovered which couldaffect the content, and all legal disclaimers that apply to the journal pertain.
NIH Public AccessAuthor ManuscriptHum Immunol. Author manuscript; available in PMC 2008 September 1.
Published in final edited form as:Hum Immunol. 2007 September ; 68(9): 715–729.
NIH
-PA Author Manuscript
NIH
-PA Author Manuscript
NIH
-PA Author Manuscript

INTRODUCTIONInfusion of donor bone marrow cells may have a regulatory effect in human solid organtransplants (1–4). In vitro experiments have demonstrated that bone marrow cells anergize Tcells in peripheral blood (5,6), bias T cell responses towards a Th2 type (7), and inhibit thegeneration of antigen-specific cytotoxic T cell responses (8). It has been hypothesized thatimmature dendritic cells (DC) present in the infused allogeneic bone marrow graft may play arole in establishment of peripheral allograft tolerance by induction of regulatory T cells (9–12). Additionally, mesenchymal stem cells in the bone marrow graft have been proposed toalter the development of dendritic antigen presenting cells, (DC) in particular, resulting in a“semi-mature” phenotype that induces T cell unresponsiveness (13).
Recent studies have suggested that immature DC (iDC) can generate inhibition of alloreactivityvia reduced expression of costimulatory molecules, including CD80, CD86, and CD40 (14).The presentation of antigens by immature DC in the absence of a second signal appears notonly to cause T cell anergy but to lead to active inhibition of immune responses by inductionof regulatory cells (14). Jonuit et al demonstrated that repetitive stimulation of T cells withallogeneic iDC resulted in development of induced IL-10 secreting CD4+ T cells withregulatory properties (15). Dhodapkar et al demonstrated that injection of human antigen-bearing iDC leads to antigen-specific inhibition of preexisting effector T cell function in twovolunteers (16). Infusion of iDC derived from murine bone marrow cells has also been shownto prolong allograft survival in several preclinical models (17,18).
A crucial pathway for the maturation of DC by either in vivo or in vitro inflammatory stimuliinvolves the transcription factor NF-κB. The different members of this family can form avariety of homo and heterodimers and may be associated with inhibitory proteins causingretention in the cytoplasm. RelB is a member of the NF-kB transcription factor family and isthe most crucial NF-kB subunit for expression of CD40, CD86 and MHC class II on DC duringmaturation (19). Upon DC activation, RelB is translocated to the nucleus where it upregulatestranscription of NF-κB needed for DC maturation and the second signal for T cell activation.Additionally, RelB transcriptionally upregulates its own expression, leading to increased totalRelB protein (20,21). Infusion of murine DC whose maturation process and CD40 expressionwas inhibited via blocking of NF-κB using NF-κB-decoy oligodeoxynucleotides has also beenshown to prolong allograft survival (22,23). In similar experiments, CD40-deficient DC frommurine bone marrow precursors cultured in the presence of an inhibitor of NF-κB, BAY11-7082, were able to suppress previously primed immune responses and favored thedevelopment of antigen-specific regulatory T cells that could confer tolerance to the sameantigen in an adoptive transfer model (19). Another pharmacological inhibitor of NF-κB,acetylsalicylic acid (aspirin, ASA), inhibits DC maturation in vitro (24). ASA-treated murineDC were poor stimulators of naive allogeneic T cell proliferation and they inhibited IL-2production in responding T cells. These findings may have important implications for themanipulation of DC function for potential therapeutic application (25,26).
In the present report we studied the in vitro response of human T cells stimulated by eitherallogeneic DC or allo-antigen pulsed autologous DC treated by NF-κB blockade withBAY11-7082 or ASA. We tested the effect on CD40 expression, allo-proliferation and themodulation of Th1 cytokine production in responding T cells, as well as to whether T regulatorycells could be developed in vitro.
Hernandez et al. Page 2
Hum Immunol. Author manuscript; available in PMC 2008 September 1.
NIH
-PA Author Manuscript
NIH
-PA Author Manuscript
NIH
-PA Author Manuscript

Material and MethodsHuman subjects, cell preparation and histocompatibility typing
Human peripheral blood was collected from normal healthy adult volunteer donors afterobtaining informed consent according to the guidelines of the Institutional Review Board ofthe University of Miami. Peripheral blood mononuclear cells (PBMC) were purified by Ficoll-Hypaque (Sigma, St. Louis, MO) and washed with PBS from which monocytes and T cellswere isolated using CD14 and CD3 Isolation Kits respectively (Miltenyi Biotec, Auburn, CA)following the manufacturer’s protocol. Briefly, after incubation with CD14 or CD3 microbeads(20 µl per 1 × 10⁷ cells) for 15 minutes at 4°C the cells were washed and separated by positiveselection through columns placed in the magnetic field of a MACS separator (Miltenyi Biotec,Auburn, CA). Purity was 92 % or greater by flow cytometry. In all experiments cell culturewas with RPMI -1640 (Gibco-BRL, Grand Island, NY) containing 15% heat-inactivatednormal human AB serum (NABI, Gemini Bio-Products, Woodland, CA), 2mM L-glutamine,10 mM HEPES, and 1x antibiotic-antimycotic solution (all from Gibco-BRL, Grand Island,NY). Serological and DNA histocompatibility typing was performed on these unrelatedlaboratory volunteers by the University of Miami Histocompatibility testing laboratory.
Generation of dendritic cellsCD14+ monocytes were cultured in 6-well plates using 2×10⁶ cells in 3 ml of media alsosupplemented with 5 ng/ml human recombinant GM-CSF and 10 ng/ml IL-4 (both from Sigma,St. Louis, MO) for 10 days at 37C, 5% CO2 and 97% humidity. To induce maturation(designated mature DC) an additional 10 ng/ml TNF-α, 1 µg/ml PGE2 (both from Sigma, St.Louis, MO) and 10 µg/ml IL-1β (BD Pharmingen, San Diego, CA) was added for the final 48h. Except in Figure 2, where both immature and mature DC were analyzed, all experimentsassayed matured DC and are simply designated as “DC”. Treated DC were incubatedcontinuously from day 1 to 10 with either BAY 11-7082 (BAY, 1.25µM, 2.5µM or 5µM;Calbiochem, La Jolla, CA) or with acetylsalicylic acid (ASA, 0.5 mM, 2mM, 3mM or 5mM;Sigma, St. Louis, MO), henceforth referred to as BAY-DC and ASA-DC, respectively. In someexperiments, on days 3 and 5 of culture, DC were pulsed with 2×10⁶ allogeneic PBMC, madeapoptotic by irradiation (8000 rads), differing by either one or two DR mismatches in a ratioof 1:1 PBMC:DC. In all experiments, one third of the media was removed and replaced withthe same amount of fresh media with the corresponding differentiation or maturation growthfactors and with or without BAY or ASA every second day during the entire culture period.The DCs were harvested for analysis on day 10 and cell viability was assessed by trypan blue.
Western blotWestern blots for RelB and Actin were performed as previously described (27). Briefly, totalcell lysates were made from untreated CD14+ cells at day 0 and from Control-DC, BAY-DCand ASA-DC after the differentiation and maturation process (see above). Protein levels werequantitated by using the Micro BCA reagent kit (Pierce, Rockford, IL). Equal amounts ofprotein (10 µg) were separated by SDS-PAGE (4% stacking/8% resolving), electroblotted toPVFD (Millipore Corp., Bedford, MA) membranes, and probed with antibodies against RelB(C-19; Santa Cruz Biotechnology, Santa Cruz, CA) and Actin (Sigma, St. Louis, MO).Chemiluminescent detection (ECL; Amersham Pharmacia Biotech, Little Chalfont, UK) wasquantified by using ScionImage program. RelB values of each sample were normalized to theloading control (Actin). For each sample the ratio RelB/Actin was calculated. Results areexpressed as fold increase in optical density (O.D.) compared to CD14+ cells at day 0.
Hernandez et al. Page 3
Hum Immunol. Author manuscript; available in PMC 2008 September 1.
NIH
-PA Author Manuscript
NIH
-PA Author Manuscript
NIH
-PA Author Manuscript

Antibody staining and flow cytometryTo follow monocyte purification, DC treatment groups were stained with an anti-CD14-FITC(BD Pharmingen, San Diego, CA), which is not blocked by anti-CD14-microbeads. On day10, Control-DC, BAY-DC and ASA-DC were washed and stained with DC markers, CD11c-APC, CD40-PE, CD80-FITC, CD83-APC, CD86-PE, DC-SIGN-PE, HLA-DR-PerCP, andgeneral lineage markers Lin1-FITC (all from BD, San Diego, CA). To follow T cellpurification, cells were stained with CD2-PE (BD, San Diego, CA). Briefly, the cell subgroupswere rinsed with PBS, repelleted, resuspended in FACS buffer and stained for 30 min at 4°Cwith each antibody on ice followed by analysis using fluorescence-activated flow cytometry(FACS LSR; Becton Dickinson) and Cellquest® software. Dead cells or cellular debris wereexcluded by gating.
T cell proliferation assayAllogeneic responder T cells were cultured in triplicate with irradiated (3000 rad), washed DC.The DC were either from one or two HLA-DR mismatched (these were also disparate in theHLA A and B loci) stimulator (or control autologous) BAY-DC, ASA-DC or Control-DC in96-well flat bottom plates using 1×10⁵ T cells and 1×10⁴ DC in a total volume of 200 µl/wellof complete culture medium at 37°C in 5% CO2 for 3, 5 and 7 days. Wells were pulsed with1 µCi/well of [³H] thymidine for the last 18 hrs before the assay point, harvested, andradioactive incorporation measured in a WALLAC 1205 Betaplate Liquid ScintillationCounter.
Evaluation of anergyIn direct presentation experiments, 105 T cells primed with Control-DC, BAY-DC, or ASA-DC (one vs two HLA-DR mismatched) were restimulated with allogeneic mature 104 DC fromthe same DC donor. In indirect presentation experiments, 105 T cells primed with Control-DCor ASA-DC pulsed with apoptotic allogeneic PBMC (one vs two HLA-DR mismatched) wererestimulated with mature 104 DC pulsed from the same donor as the original DC pulsed asdescribed above. Cell proliferation was performed in a total volume of 200 µl/well or withPMA (10 ng/ml) and ionomycin (200 ng/ml) for 3 days. Wells were pulsed with 1 µCi/well of[³H] thymidine for the last 18 hrs before the assay point, harvested and radioactive incorporationwas measured in a WALLAC 1205 Betaplate Liquid Scintillation Counter.
Analysis of regulatory activity of T cells generated in the presence of treated DCsTo analyze whether T cells cultured with DC treated as above, would develop into a populationof cells that were capable of inhibiting/regulating fresh T cell proliferation, CD3+ cells werestimulated with allogeneic mature one or two HLA-DR mismatched Control-DC, BAY-DC,or ASA-DC for 5 days. The primed T cells were then harvested, isolated using CD3 microbeadsand rested at a concentration of 1×10⁶ cell/ml in the culture medium. After 2 days, primed Tcells were cocultured with fresh isolated autologous T cells and fresh allogeneic matureirradiated (Control) DC, from the same donors as used for the initial priming step, were addedto analyze the influence of the primed (“T reg” cells) on fresh T cell proliferation. Proliferationwas measured on day 3. In separate experiments, to mimic the indirect pathway of alloantigenpresentation in vitro, we generated Control-DC and ASA-DC pulsed with apoptotic (describedabove) allogeneic one vs two DR mismatched PBMC. The pulsed-DC were used to primeautologous CD3+ T cells (indirect presentation). After 5 days, primed T cells were collectedand rested at a concentration of 1×10⁶ cells/ml. After 2 days, a coculture with 1×10⁵ of theseprimed T cells plus 1×10⁵ freshly isolated CD3+ cells and 1×10⁴ fresh Control-DC wasperformed. Cultures were performed in 96 well plates and proliferation was measured by [³H]thymidine incorporation at day 3.
Hernandez et al. Page 4
Hum Immunol. Author manuscript; available in PMC 2008 September 1.
NIH
-PA Author Manuscript
NIH
-PA Author Manuscript
NIH
-PA Author Manuscript
Transwell experimentsIn the bottom well of 24 well plates, 3 × 10⁵ T cells were cultured with 3 × 10⁴ irradiatedmature DC in 600 µl, in a ratio of 10:1 responders:stimulators. Three × 104 irradiated Control-DC or BAY-DC were either added directly to the MLR bottom wells or were placed in uppertranswell chambers. Cultures were pulsed with [³H] thymidine 18 hrs before harvesting. Ondays 3 and 5 of culture, cells from the bottom chambers were transferred to 96-well plates intriplicate, and the incorporated radioactivity was measured as above by using a WALLAC 1205Betaplate Liquid Scintillation Counter.
Cytokine analysis by ELISPOTIL-2, IL-4, Il-10, and IFN-γ producing cells were quantified by standard ELISPOT assay asrecommended by the manufacturer (BD Biosciences, San Diego, CA). Briefly, T cellspreviously cultured for 5 days with Control-DC, BAY-DC, ASA-DC or autologous PBMC,were purified using CD3 microbeads and incubated in 96-well plates previously coated withpurified anti-human IL-2, IL-4, IL-10, or IFN-γ mAb at concentrations ranging from 1×10⁴ to2 × 105 cells/well in 200 µl of medium for 36–48 hrs. Biotinylated anti-human IL-2, IL-4,IL-10, or IFN-γ mAb was used as the detecting antibody, streptavidin-horseradish peroxidaseconjugate was used as the enzyme, and AEC (3-Amino-9-ethylcarbazole) chromogen, whichis a substrate for peroxidase and is a widely-used chromogen for ELISPOT, was used for colordevelopment.
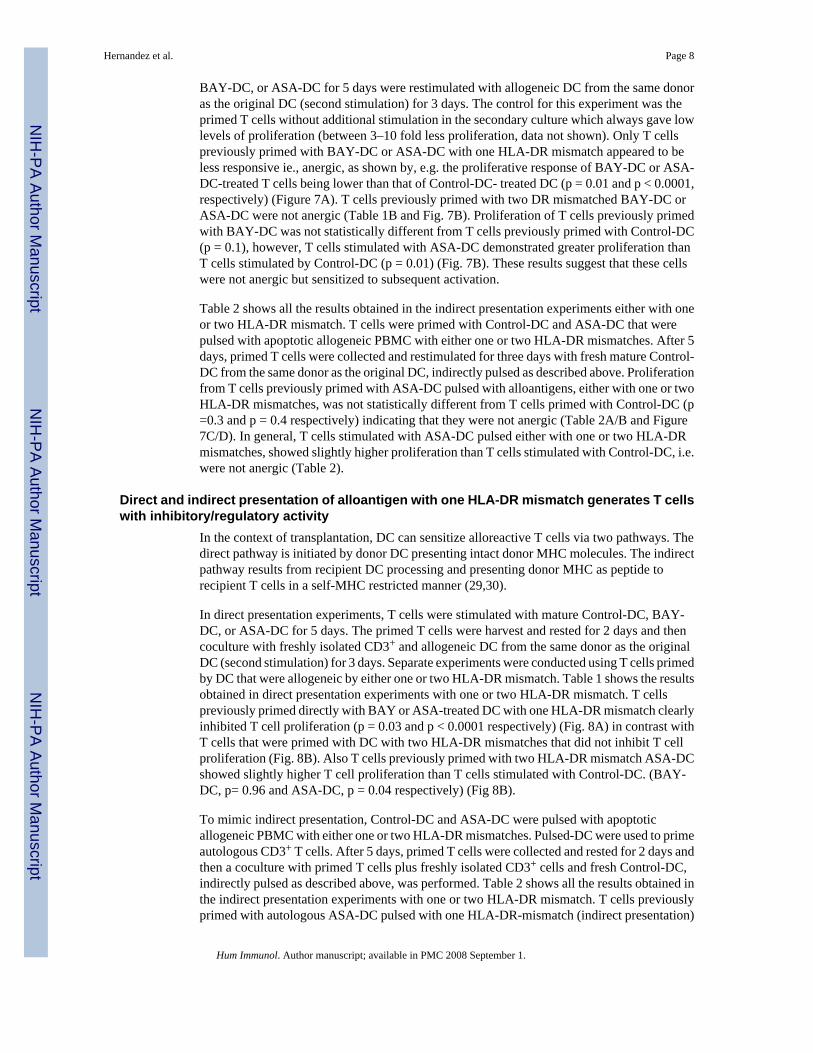
Quantitative RT-PCR for FoxP3 expressionAfter pooling the cultures, CD3+ cells were isolated from cells primed with control-DC, BAY-DC or ASA-DC using microbeads. Total RNA from 1×10⁶ CD3+ cells was extracted usingTrizol reagent (Gibco BRL Life Technologies Inc) according to the manufacturer’s protocol.Quantitative PCR was performed in duplicate with the human FOXP-3 kit (LC kit search,Heidelberg, Germany) using the light cycler (Roche, Indianapolis ID) and the DNA mastersyber green kit (Roche, Indianapolis ID). FoxP3 levels were expressed as copies per 5000 totalCD3+ cells. All levels were normalized with the housekeeping gene glyceraldehyde-3-phosphate dehydrogenase (GAPDH). The normalized FoxP3 results were calculated by thefollowing equation (28):
( Mean of all GAPDH reactions within the runThe mean GAPDH for individual samples ) × FoxP3 sample mean =
Normalized FoxP3
Per 5000CD3+cells
StatisticsAll error bars shown in Figure 1–Figure 6 represent one standard deviation above and belowthe mean. Statistical evaluation of these data was performed using ordinary t-tests. P-values of0.05 or less were considered statistically significant. Due to the fact that the distribution ofproliferation was skewed towards larger values and followed much more closely a log normalrather than normal distribution, the statistical analysis was performed using log transformeddata for experiments to evaluate anergy, regulatory activity of T cells generated in the presenceof treated DC, and regulatory activity as measured by FoxP3 expression (the results in Figure7 and Figure 8). With log transformed data, comparisons performed on the original scale arebased on percent rather than absolute differences, and the geometric mean rather than arithmeticmean is used. It should also be noted that the geometric mean is multiplied and divided (ratherthan added and subtracted) by its standard error (SE) when showing variability about the meanand in calculating confidence intervals. P-values were based on analysis of variance t-tests ofthe treatment effects while controlling for experiment to experiment differences via analysisof variance. The geometric mean along with its SE was calculated for each treatment acrossexperiments and replications. Finally, since for most of the treatment conditions the percentageof total variability due to experiment to experiment within the same group (rather than replicate
Hernandez et al. Page 5
Hum Immunol. Author manuscript; available in PMC 2008 September 1.
NIH
-PA Author Manuscript
NIH
-PA Author Manuscript
NIH
-PA Author Manuscript

to replicate within experiment) differences was greater than 90%, the power to detect relativelysmall differences between 2 treatments applied within the same experiment was high, evenwith relatively few (i.e., 5) experiments performed.
RESULTSIncreasing concentrations of BAY11-7082 and ASA in DC decreases their ability to stimulatedT cell proliferation
To optimize the amount of NF-κB inhibitor to be used in each experiment, DC were treatedcontinuously from day 1 to day 10 with increasing doses of BAY 11-7082 (1.25, 2.5 or 5 µM)or ASA (0.5, 2, 3 or 5 mM). The results demonstrated that increased doses gave a progressivelydecreased capacity to stimulate T cell proliferation with both inhibitors (Fig.1). However, cellviability was also affected by the higher doses of both inhibitors. Cells treated with 1.25 µMand 2.5 µM BAY had 70–80 % viability and with 5µM BAY had very low viability (3–5 %).Although cells treated with 0.5 mM, 2 mM or 3 mM ASA showed no big differences in viabilitycompared to controls (80–95 % viability), cells treated with 5mM ASA showed very lowviability (1–3 %). Therefore, in order to optimize cell viability and inhibition of NF-κB,subsequent experiments were carried out using 2.5 µM BAY and 3 mM ASA.
Optimization of kinetics for T cell allogeneic proliferation indicate that BAY- or ASA-treatedDC are poor stimulators of allogeneic T cell proliferation
Mature Control-DC were potent stimulators of allogeneic T cell proliferation, as measured by[³H] thymidine incorporation using a ratio of 10:1 T cells: DC (Figure 2). Mature ASA-DC,and in most cases BAY-DC, failed to strongly stimulate T cell proliferation. This effect wasmost pronounced at day 5, when proliferation peaked in T cells stimulated by Control-DC,whereas BAY-DC and ASA-DC (at optimum treatment concentrations) caused 2.2-fold and7.7-fold less proliferation respectively compared to Control-DC.
Human monocyte-derived DC generated in the presence of Bay 11-7082 or ASA have reducedlevels of RelB protein expression
The transciption factor RelB, a member of the NF-κB family and transcriptionally regulatedby other NF-kB members, was used as a read out of NF-kB activation. RelB protein expressionwas measured in total cell extracts from Control, BAY-DC, and ASA-DC by Western blot(Fig. 3A). The increase in RelB expression relative to CD14+ monocytes on Day 0 wascalculated (Fig 3B). Control, unstimulated CD14+ monocytes showed very low expression ofRelB (lane 1). Immature Control-DC cultured from monocytes in GM-CSF (which activatesNF-κB (25)) and IL-4 for 8 days increased expression of RelB 17.6-fold relative to the Day 0CD14+ monocytes (lane 2). In immature DC cultured from monocytes in GM-CSF and IL-4for 8 days in which NF-κB was blocked by either BAY or ASA, RelB expression was increasedonly 10.5 and 0.4-fold respectively (lanes 3 and 4). Control-DC matured with a cocktail ofTNF-α, IL-1β, and PGE2 had the most dramatic increase (30.1-fold) in RelB expression (lane5) compared to the Day 0 CD14+ monocytes. By contrast, in both BAY-DC and ASA-DC,given the same maturation cocktail, RelB expression increased only 13.1-fold in BAY-DC and0.3-fold in ASA-DC (lanes 6 and 7), ie., in mature BAY-DC RelB expression was less thanhalf that of mature Control-DC, and in mature ASA-DC almost no RelB expression wasdetected. Both BAY11-7082 and ASA have been reported to block the TNF-α induciblephosphorylation of inhibitory IkB proteins, resulting in less nuclear translocation of NF-κB(19,24). However, in contrast to ASA, a dose of BAY high enough to maximally inhibit RelBwas not reached due to toxicity.
Hernandez et al. Page 6
Hum Immunol. Author manuscript; available in PMC 2008 September 1.
NIH
-PA Author Manuscript
NIH
-PA Author Manuscript
NIH
-PA Author Manuscript
Human monocyte-derived DC “matured” in the presence of BAY 11-7082 or ASA expresshigh levels of HLA-DR and CD86, slightly reduced CD80 and markedly reduced CD40
As a consequence of blocking RelB, DC maturation in response to TNF-α, PGE2 and IL-1βstimulus was impaired. DC cultures were initiated with CD14+ monocytes (more than 92 %purity) that were negative for all DC markers. Upon maturation, control, BAY-DC, and ASA-DC had greatly diminished expression of CD14 (13–20%, data not shown) as expected andexpressed high levels of DC markers, DC-SIGN (90–99 %, data not shown) and CD11c (Fig4). Mature BAY-DC and ASA-DC expressed high levels of HLA-DR and CD86, similar toControl-DC. The expression CD80 was slighly lower in BAY-DC and ASA-DC (Fig. 4).However, mature BAY-DC showed a one third reduction in the number of cells expressingCD40 while ASA-DC showed two thirds reduction, the most profound effect. The amount ofCD40 expressed by the remaining positive cells was also greatly reduced, see especially ASA-DC (Fig. 4).
Transwell experiments indicate that BAY-treated DC are not toxic to T cellsThe BAY-DC were always washed three times after harvesting. However, since NF-κB is alsoa key transcription factor required for T cell proliferation, we wished to exclude the possibilitythat residual BAY from treated DC cultures was exerting a blocking or even a direct cytotoxiceffect on T cells using transwell experiments (Fig. 5). Our results indicated that T cellproliferation was not inhibited by transfer of BAY from DC (Fig. 5). Thus prior inhibition ofNF-κB activity of the DC and resultant deficiency in CD40 expression were consistent withthe poor allostimulatory function of BAY-treated DC.
T cells primed by two DR mismatched BAY- or ASA-treated DC fail to develop a robust Th1or Th2 type cytokine response and do not produce high levels of IL-10
Cytokine production by T cells stimulated with BAY-DC or ASA-DC by direct presentationof alloantigen were analyzed as to whether the influence of the maturational state of treatedDC appeared to skew the overall T cell response towards Th1 or Th2. To this end, T cells wereprimed for 5 days with two DR mismatched mature allogeneic Control-DC, BAY-DC, ASA-DC or autologous PBMC, and then re-isolated using CD3 microbeads. ELISPOTs were usedto analyze the cytokine production profiles of these primed T cells in the immediate 36–48 hrsafter harvest. The number of spots for 104 T cells cultured with autologous PBMC were: IFN-gamma = 20; IL-2 = 3, IL-4 = 3 and IL-10 = 5. As expected, the Control-DC induced a strongdifferentiation of the naive fresh T cells into Th1 type cells that produced large amounts ofIL-2 and IFN-γ but relatively low amounts of IL-4 and IL-10 (Figure 6). Two DR mismatchedT cells primed with BAY-DC or ASA-DC failed to develop a robust Th1 type response andproduced only small amounts of the growth-promoting cytokines IL-2 and IFN-γ. Howeverthey also produced low levels of IL-4 and the levels of IL-10 were comparable with controls,indicating that these T cells did not differentiate into Th2 cells. Because treated DC failed tostimulate strong development of IFN-γ producing T cells, the overall ratio of IFN-γ to IL-10producing T cells was reduced. In Control-DC, the ratio was 4.8, in BAY-DC it was 1.1 andin ASA-DC it was 0.4. This suggests that while strong Th2 development is not initiated, T cellsstimulated even by two DR mismatched BAY-DC or ASA-DC may be shifted away from apredominant Th1 response and definitely greatly reduced in the amount of Th1 cytokineproduced.
T cells primed directly by allogeneic BAY- or ASA-treated DC with one HLA-DR mismatchare anergic
Table 1 shows the samples analyzed in the direct presentation experiments either with one ortwo HLA-DR mismatch and their T cell proliferation. The anergy results are also summarizedin Fig. 7A and B. T cells primed with mature (one vs two HLA-DR mismatched) Control-DC,
Hernandez et al. Page 7
Hum Immunol. Author manuscript; available in PMC 2008 September 1.
NIH
-PA Author Manuscript
NIH
-PA Author Manuscript
NIH
-PA Author Manuscript
BAY-DC, or ASA-DC for 5 days were restimulated with allogeneic DC from the same donoras the original DC (second stimulation) for 3 days. The control for this experiment was theprimed T cells without additional stimulation in the secondary culture which always gave lowlevels of proliferation (between 3–10 fold less proliferation, data not shown). Only T cellspreviously primed with BAY-DC or ASA-DC with one HLA-DR mismatch appeared to beless responsive ie., anergic, as shown by, e.g. the proliferative response of BAY-DC or ASA-DC-treated T cells being lower than that of Control-DC- treated DC (p = 0.01 and p < 0.0001,respectively) (Figure 7A). T cells previously primed with two DR mismatched BAY-DC orASA-DC were not anergic (Table 1B and Fig. 7B). Proliferation of T cells previously primedwith BAY-DC was not statistically different from T cells previously primed with Control-DC(p = 0.1), however, T cells stimulated with ASA-DC demonstrated greater proliferation thanT cells stimulated by Control-DC (p = 0.01) (Fig. 7B). These results suggest that these cellswere not anergic but sensitized to subsequent activation.
Table 2 shows all the results obtained in the indirect presentation experiments either with oneor two HLA-DR mismatch. T cells were primed with Control-DC and ASA-DC that werepulsed with apoptotic allogeneic PBMC with either one or two HLA-DR mismatches. After 5days, primed T cells were collected and restimulated for three days with fresh mature Control-DC from the same donor as the original DC, indirectly pulsed as described above. Proliferationfrom T cells previously primed with ASA-DC pulsed with alloantigens, either with one or twoHLA-DR mismatches, was not statistically different from T cells primed with Control-DC (p=0.3 and p = 0.4 respectively) indicating that they were not anergic (Table 2A/B and Figure7C/D). In general, T cells stimulated with ASA-DC pulsed either with one or two HLA-DRmismatches, showed slightly higher proliferation than T cells stimulated with Control-DC, i.e.were not anergic (Table 2).
Direct and indirect presentation of alloantigen with one HLA-DR mismatch generates T cellswith inhibitory/regulatory activity
In the context of transplantation, DC can sensitize alloreactive T cells via two pathways. Thedirect pathway is initiated by donor DC presenting intact donor MHC molecules. The indirectpathway results from recipient DC processing and presenting donor MHC as peptide torecipient T cells in a self-MHC restricted manner (29,30).
In direct presentation experiments, T cells were stimulated with mature Control-DC, BAY-DC, or ASA-DC for 5 days. The primed T cells were harvest and rested for 2 days and thencoculture with freshly isolated CD3+ and allogeneic DC from the same donor as the originalDC (second stimulation) for 3 days. Separate experiments were conducted using T cells primedby DC that were allogeneic by either one or two HLA-DR mismatch. Table 1 shows the resultsobtained in direct presentation experiments with one or two HLA-DR mismatch. T cellspreviously primed directly with BAY or ASA-treated DC with one HLA-DR mismatch clearlyinhibited T cell proliferation (p = 0.03 and p < 0.0001 respectively) (Fig. 8A) in contrast withT cells that were primed with DC with two HLA-DR mismatches that did not inhibit T cellproliferation (Fig. 8B). Also T cells previously primed with two HLA-DR mismatch ASA-DCshowed slightly higher T cell proliferation than T cells stimulated with Control-DC. (BAY-DC, p= 0.96 and ASA-DC, p = 0.04 respectively) (Fig 8B).
To mimic indirect presentation, Control-DC and ASA-DC were pulsed with apoptoticallogeneic PBMC with either one or two HLA-DR mismatches. Pulsed-DC were used to primeautologous CD3+ T cells. After 5 days, primed T cells were collected and rested for 2 days andthen a coculture with primed T cells plus freshly isolated CD3+ cells and fresh Control-DC,indirectly pulsed as described above, was performed. Table 2 shows all the results obtained inthe indirect presentation experiments with one or two HLA-DR mismatch. T cells previouslyprimed with autologous ASA-DC pulsed with one HLA-DR-mismatch (indirect presentation)
Hernandez et al. Page 8
Hum Immunol. Author manuscript; available in PMC 2008 September 1.
NIH
-PA Author Manuscript
NIH
-PA Author Manuscript
NIH
-PA Author Manuscript
(Table 2A, Fig. 8C) were able to significantly inhibit fresh T cell proliferation (p = 0.03)specially in 4 of 7 cultures, but T cells primed with autologous ASA-DC pulsed with two HLA-DR mismatched apoptotic cells did not inhibit T cell proliferation in a significant manner (p =0.49) (Table 2B and Fig 8D).
In all experiments performed above, secondary stimulation was performed with the mixture ofprimed T cells, freshly isolated T cells and fresh DC. Because primed/regulatory T cells werealready sensitized with DC, we measured what proportion of the total proliferation in thesecultures could be due to their contribution. We have attempted to control for the “background”T primed/regulatory T cell proliferation by subtracting the response of these cells from thetotal. To determine the proliferation of fresh T cells directly and indirectly stimulated,proliferation of primed/regulatory T cells stimulated with fresh Control-DC (in Table 1 andTable 2 under Anergy column: primed T + DC) were subtracted from proliferation in the secondstimulation (in Table 1 and Table 2 under Regulatory column: primed T + T fresh + DC).Results were comparable to previous analyses, ie., T cells primed with ASA-DC with one HLA-DR mismatch inhibited fresh T cell proliferation.
These results suggest that in certain MHC restricted and lesser HLA disparate reactions, NF-kB inhibited DC, presenting alloantigens in the context of self MHC, can induce thedevelopment of T cells with some regulatory function.
FoxP3 mRNA expression was evaluated using real time quantitative PCR in T cells primedwith Control-DC versus ASA-DC, both pulsed with one HLA-DR allogeneic PBMC. Resultscomparing the FoxP3 expression in all experiments performed (n=7) showed no statisticaldifferences (p = 0.89) between alloantigen pulsed ASA-DC and non-treated DC.
DISCUSSIONThe ability of human DC to effect tolerance induction appears to be related to their functionalstate of maturation (31,32). Nuclear localization of the NF-κB transcription factor RelB haspreviously been show to regulate DC differentiation and antigen presenting function throughregulation of MHC and CD40 molecule expression (21). In vivo, the expression of RelB mRNAand protein correlates with the activated phase of peripheral blood DC and the postmigrationstage of tissue DC development (33). In the absence of inflammation, immature DCcontinuously take up self antigen in the form of apoptotic cell bodies, which appear to activelysuppress NF-κB activity (33), and thereby lack nuclear RelB expression and cell surface CD40.Also, antigen presentation in the context of MHC (signal 1) alone in the absence of signal 2(CD80/86) has been shown to induce T cell anergy (35).
However, the clinical application of immature DC may not be suitable for the inhibition ofallograft rejection because the immature DC which home into the damaged tissue wherechronic inflammation is always present are not likely to remain immature in vivo afterrecirculation (36). A modified but terminally differentiated DC that cannot respond to aninflammatory stimulus and develop into an immunostimulatory mature DC, as we havedeveloped here, may be more desirable.
The present report demonstrates that BAY 11-7082 or aspirin (ASA) inhibit the maturation ofhuman monocyte-derived DC. Treatment with BAY or ASA resulted in a decrease in totalRelB protein in both mature as well as immature DC. These results are consistent with previousobservations demonstrating that both these compounds inhibit IκBα-kinase, thus blockingcytoplasmic degradation of IκB and nuclear translocation of RelB, thus blocking furthertranscription of RelB (19,24). The resulting BAY- and ASA-treated DC express high levels ofMHC class II and CD86. There were slightly lower levels of CD80 but always notably deficientexpression of CD40. BAY- and ASA-treated DC had a reduced costimulatory capacity for T
Hernandez et al. Page 9
Hum Immunol. Author manuscript; available in PMC 2008 September 1.
NIH
-PA Author Manuscript
NIH
-PA Author Manuscript
NIH
-PA Author Manuscript
cell activation and were poor stimulators of T cell proliferation in MLR. Hackstein et al.demonstrated that when ASA-treated DC were injected into mice, the DC migrated to T cellareas of the draining lymph nodes and were poor stimulators of naïve T cells in vivo (25). Thiseffect was long lasting after the removal of ASA, indicating a sustained change in DCmaturation.
In experiments using the direct antigen presentation pathway, T cells cultured with eitherallogeneic BAY- or ASA-treated DC (two HLA-DR mismatches) produced reduced levels ofIL-2 and IFN-γ, indicating a poor Th1 response while IL-10 production was never statisticallyincreased compared to T cells treated by Control-DC, indicating that they did not differentiateinto IL-10 secreting Tr1 type cells as initially hypothesized. Additionally, treated-DCapparently did not activate natural (pre-exisiting) CD4+ CD25+ T regulatory cells to secretesignificantly increased levels of IL-10.
The decreased production of IL-2 and IFN-γ, cytokines which act as T cell growth factors, isconsistent with decreased proliferation in response to allostimulation. Thompson et al.demonstrated that T cells stimulated with BAY-treated DC do not progress past the G0/G1resting phase of the cell cycle (37). Our data confirm their observation that the decrease inproliferation was associated with a decrease in IFN-γ, which requires progression through thecell for its production.
T cell anergy is classically hypothesized to occur when T cells are stimulated through theirTCR in the absence of strong costimulation. Although T regulatory cells are able to proliferatein vivo, they are characteristically anergic to TCR stimulation in vitro and induce anergy inneighboring T cells by suppressing IL-2 production or availability (36,38). Previous in vitrowork has demonstrated that bone marrow cells induce anergy in CD3+ T cells from peripheralblood possibly due to lack of costimulatory markers on the immature APC (6). Our resultsshowed that T cells primed with completely allogeneic (two HLA-DR mismatches) treated-DC or T cells primed with alloantigen pulsed treated-DC (one or two HLA-DR mismatch)were not anergic and proliferated robustly in response to allogeneic DC or PMA/Ionomycinstimulation. These results are in agreement with previous Thompson report where BAY-treatedDC were not anergic but sensitized to subsequent activation (37). Interestingly, when ASA-DC allogeneic to the T cells by only one HLA-DR mismatch were used, the T cells appearedto be anergic and also induced less proliferation in fresh T cells suggesting some regulatoryactivity.
Recent studies involving MHC knockout mice suggest that T regulatory cells require a selfMHC for their development (39). Allo-peptide specific T regulatory cells can be expanded invitro by priming purified CD4+ CD25+ cells with autologous immature DC loaded with HLAantigens (40). We theorize that T cells with regulatory function might be induced by autologousCD40-deficient DC primed to present donor alloantigen. Our results indicate that T cellscocultured with autologous CD40-deficient DC (ASA-DC) pulsed with apoptotic alloantigen(only with one HLA-DR mismatch) are able to subsequently suppress the proliferation offreshly isolated T cells stimulated with DC primed to present the same alloantigen. The typeof the T cells with suppressor/regulatory capacity generated in our conditions are under currentinvestigation. We also performed some preliminary experiments where primed/regulatory cellswere irradiated and cocultured with freshly isolated T cells and allogeneic DC with one HLA-DR mismatch (second stimulation). The results showed that irradiated T cells previouslyprimed with ASA-DC with one HLA-DR mismatch clearly inhibited fresh T cell proliferation,which are in complete agreement with our previous finding using primed T cells withoutirradiation. These experiments also suggest that the T regulatory cells generated here areirradiation resistant. Therefore with two independent approaches, ie. Irradiating the T primed/
Hernandez et al. Page 10
Hum Immunol. Author manuscript; available in PMC 2008 September 1.
NIH
-PA Author Manuscript
NIH
-PA Author Manuscript
NIH
-PA Author Manuscript

regulatory cells (here) or subtracting their activity from total (see Results) we were able toremove the contribution to proliferation of these cells to the proliferation of the responder cells.
In general T cells with some regulatory capacity were generated only when T cells were primedwith allogenic treated-DC or with alloantigen pulsed treated-DC with one HLA-DR mismatchand not with two HLA-DR mismatch. At this time, we can not account for the differences foundbetween one and two HLA-DR but our preliminary results suggest that it may be related todifferences in the cytokine secretion profile, with more IFNγ abrogating a potential T regulatoryphenotype in the two HLA-DR mismatch. More extensive experiments have to be performedto address these findings.
Thompson et al found that either mature allogeneic or autologous DC in which NF-κB wasinhibited by treatment with BAY could not render T cells anergic and in fact the T cells weresensitized such that they proliferated to a greater extent than T cells primed with control matureDC (37). Also they could not detect regulatory T cells in their cultures. However, the HLA-DR typing of the donors was not described in their study.
In contrast to the Thompson report, a recent study described human monocyte-derived DCtreated with combinations of vitamins C and E to inhibit NF-κB and oxidative pathways whichprevent DC maturation and generate regulatory T cells (41). Probably, the differences in thesignaling pathways affected by antioxidative vitamins and the NF-κB inhibitors used in thisstudy may explain the differences in the results obtained. Very recently, Buckland et al reportedthat aspirin-treated human DC have increased ILT-3 and induce hyporesponsiveness andregulatory activity in alloreactive T cells (42). In general, these findings are in agreement withour study.
Important conclusions in our study are that ASA-treated DC consistently give lower expressionof RelB protein, cell surface CD40, and were poorer stimulators of T cell proliferation in MLRthan BAY-treated DC. In addition, T cells primed with ASA-treated DC with one HLA-DRmismatch gave stronger inhibition of fresh T cell proliferation indicating the presence of Tcells with regulatory activity. According to our results we recommend the use of ASA ratherthan BAY to inhibit NF-κB during human DC differentiation to generate anergy or regulatoryT cells.
In general, our results give more information about inhibition of NF-kB during thedifferentiation process of human DC with one and two HLA-DR mismatch, which could helpto better understand of the mechanisms by which human DC can modulate T cell function invivo vs. in vitro. These studies show that DC can promote T regulatory cell development mayhave important implications for the development of tolerogenic DC that may be used asadjuvant therapy for increasing tolerance in solid organ transplants.
ACKNOWLEDGMENTS
We thank Alain Diaz for performing some experiments, for data analysis and overall support, Jim Phillips for assistancewith FACS analysis and Michelle Perez for secretarial assistance with the manuscript.
This work was supported by the National Institutes of Health grant No. R01DK25243-25 and Miami Veterans AffairsMedical Center research support to JM.
REFERENCES1. Ciancio G, Burke GW, Garcia-Morales R, Suzart K, Rosen A, Ricordi C, Kenyon NS, Mathew JM,
Tzakis AG, Esquenazi V, Miller J. Effect of living-related donor bone marrow infusion on chimerismand in vitro immunoregulatory activity in kidney transplant recipients. Transplantation 2002;74:488.[PubMed: 12352907]
Hernandez et al. Page 11
Hum Immunol. Author manuscript; available in PMC 2008 September 1.
NIH
-PA Author Manuscript
NIH
-PA Author Manuscript
NIH
-PA Author Manuscript
2. Zeng D, Lan F, Hoffmann P, Strober S. Suppression of graft-versus-host disease by naturally occurringregulatory T cells. Transplantation 2004;77:S9. [PubMed: 14726761]
3. Higuchi M, Zeng D, Shizuru J, Gworek J, Dejbakhsh-Jones S, Taniguchi M, Strober S. Immunetolerance to combined organ and bone marrow transplants after fractionated lymphoid irradiationinvolves regulatory NK T cells and clonal deletion. J Immunol 2002;169:5564. [PubMed: 12421933]
4. Lagoo-Deenadayalan S, Lagoo AS, Lemons JA, Lorenz HM, Bass JD, McDaniel DO, Hardy KJ, BarberWH. Donor specific bone marrow cells suppress lymphocyte reactivity to donor antigens anddifferentially modulate TH1 and TH2 cytokine gene expression in the responder cell population.Transp Immunol 1995;3:124.
5. Mathew JM, Garcia-Morales RO, Carreno M, Jin Y, Fuller L, Blomberg B, Cirocco R, Burke GW,Ciancio G, Ricordi C, Esquenazi V, Tzakis AG, Miller J. Immune responses and their regulation bydonor bone marrow cells in clinical organ transplantation. Transpl Immunol 2003;11:307. [PubMed:12967784]
6. Jim Y, Fuller L, Carreno M, Esquenazi V, Blomberg BB, Wei YT, Ciancio G, Burke GW 3rd, TzakisA, Ricordi C, Miller J. Functional and phenotypic properties of peripheral T cells anergized byautologous CD3(+) depleted bone marrow cells. Hum Immunol 2002;63:567. [PubMed: 12072192]
7. Jin Y, Fuller L, Wei Y, Blomberg BB, Miller J, Esquenazi V. Bone marrow cells promote TH2polarization and inhibit virus-specific CTL generation. Hum Immunol 2002;61:1233. [PubMed:11163078]
8. Jin Y, Fuller L, Esquenazi V, Blomberg BB, Rosen A, Tzakis AG, Ricordi C, Miller J. Bone marrowcells inhibit the generation of autologous EBV-specific CTL. Hum Immunol 2000;61:538. [PubMed:10825581]
9. Toungouz M, Donckier V, Goldman M. Tolerance induction in clinical transplantation: the pendingquestions. Transplantation 2003;75:58S. [PubMed: 12819494]
10. Jin Y, Fuller L, Ciancio G, Burke GW 3rd, Tzakis AG, Ricordi C, Miller J, Esquenzai V. Antigenpresentation and immune regulatory capacity of immature and mature-enriched antigen presenting(dendritic) cells derived from human bone marrow. Hum Immunol 2004;65:93. [PubMed: 14969764]
11. Delis S, Ciancio G, Burke GW 3rd, Garcia-Morales R, Miller J. Donor bone marrow transplantation:chimerism and tolerance. Transpl Immunol 2004;13:105. [PubMed: 15380541]
12. Fudaba Y, Spitzer TR, Shaffer J, Kawai T, Fehr T, Delmonico F, Preffer F, Tolkoff-Rubin N, DeyBR, Saidman SL, Kraus A, Bonnefoix T, McAfee S, Power K, Kattleman K, Colvin RB, Sachs DH,Cosimi AB, Sykes M. Myeloma Responses and Tolerance Following Combined Kidney andNonmyeloablative Marrow Transplantation: In Vivo and In Vitro Analyses. Am J Transplant2006;6:2121. [PubMed: 16796719]
13. Bethy S, Borovsky Z, Mevorach D, Liebergall M, Gazit Z, Aslan H, Galun E, Rachmilewitz J. Humanmesenchymal stem cells alter antigen-presenting cell maturation and induce T cell unresponsiveness.Blood 2005;105:2214. [PubMed: 15514012]
14. Steinman RM, Hawiger D, Liu K, Bonifaz L, Bonnyay D, Mahnke K, Iyoda T, Ravetch J, DhodapkarM, Inaba K, Nussenzweig M. Dendritic cell function in vivo during the steady state: a role inperipheral tolerance. Ann N Y Acad Sci 2003;987:15. [PubMed: 12727620]
15. Jonuleit H, Schmitt E, Schuler G, Knop J, Enk A. Induction of IL-10–producing, nonproliferatingCD4+ T cells with regulatory properties by repetitive stimulation with allogeneic immature dendriticcells. J Exp Med 2000;192:1213. [PubMed: 11067871]
16. Dhodapkar MV, Steinman RM, Krasovsky J, Munz C, Bhardwaj N. Antigen-specific inhibition ofeffector T cell function in humans after injection of immature dendritic cells. J Exp Med2001;193:233. [PubMed: 11208863]
17. Lutz MB, Suri RM, Niimi M, Ogilvie AL, Kukutsch NA, Rossner S, Schuler G, Austyn JM. Immaturedendritic cells generated with low doses of GM-CSF in the absence of IL-4 are maturation resistantand prolong allograft survival in vivo. Eur J Immunol 2000;30:1813. [PubMed: 10940870]
18. Thomson AW, Lu L. Are dendritic cells the key to liver transplant tolerance? Immunol Today1999;20:27–32. [PubMed: 10081227]
19. Martin E, O’Sullivan B, Low P, Thomas R. Antigen-specific suppression of a primed immuneresponse by dendritic cells mediated by regulatory T cells secreting interleukin-10. Immunity2003;18:155. [PubMed: 12530984]
Hernandez et al. Page 12
Hum Immunol. Author manuscript; available in PMC 2008 September 1.
NIH
-PA Author Manuscript
NIH
-PA Author Manuscript
NIH
-PA Author Manuscript
20. Pettit AR, Quinn C, MacDonald KP, Cavanagh LL, Thomas G, Townsend W, Handel M, Thomas R.Nuclear localization of RelB is associated with effective antigen-presenting cell function. J Immunol1997;159:3681. [PubMed: 9378953]
21. O'Sullivan BJ, MacDonald KP, Pettit AR, Thomas R. RelB nuclear translocation regulates B cellMHC molecule, CD40 expression, and antigen-presenting cell function. Proc Natl Acad Sci2000;97:11421. [PubMed: 11027342]
22. Bonham CA, Peng L, Liang X, Chen Z, Wang L, Ma L, Hackstein H, Robbins PD, Thomson AW,Fung JJ, Qian S, Lu L. Marked prolongation of cardiac allograft survival by dendritic cells geneticallyengineered with NF-kappa B oligodeoxyribonucleotide decoys and adenoviral vectors encodingCTLA4-Ig. J Immunol 2002;169:3382. [PubMed: 12218160]
23. Xu MQ, Suo YP, Gong JP, Zhang MM, Yan LN. Prolongation of liver allograft survival by dendriticcells modified with NF-kappaB decoy oligodeoxynucleotides. World J Gastroenterol 2004;10:2361.[PubMed: 15285020]
24. Yin MJ, Yamamoto Y, Gaynor RB. The anti-inflammatory agents aspirin and salicylate inhibit theactivity of I(kappa)B kinase-beta. Nature 1998;396:77. [PubMed: 9817203]
25. Hackstein H, Morelli AE, Larregina AT, Ganster RW, Papworth GD, Logar AJ, Watkins SC, FaloLD, Thomson AW. Aspirin inhibits in vitro maturation and in vivo immunostimulatory function ofmurine myeloid dendritic cells. J Immunol 2001;166:7053. [PubMed: 11390449]
26. Matasic R, Dietz AB, Vuk-Pavlovic S. Cyclooxygenase-independent inhibition of dendritic cellmaturation by aspirin. Immunology 2000;101:53. [PubMed: 11012753]
27. Davis TA, Saini AA, Blair PJ, Levine BL, Craighead N, Harlan DM, June CH, Lee KP. PhorbolEsters Induce Differentiation of Human CD34+ Hemopoietic Progenitors to Dendritic Cells:Evidence for Protein Kinase C-Mediated Signaling. J Immunol 1998;160:3689. [PubMed: 9558069]
28. DePrimo SE, Diehn M, Nelson JB, Reiter RE, Matese J, Fero M, Tibshirani R, Brown PO, BrooksJD. Transcriptional programs activated by exposure of human prostate cancer cells to androgen.Genome Biology 3: Research 0034.1. 2002
29. Suciu-Foca N, Ciubotariu R, Itescu S, Rose EA, Cortesini R. Indirect allorecognition of donor HLA-DR peptides in chronic rejection of heart allografts. Transplant Proc 1998;30:3999. [PubMed:9865275]
30. Harris PE, Cortesini R, Suciu-Foca N. Indirect allorecognition in solid organ transplantation. RevImmunogenet 1999;1:297. [PubMed: 11256421]
31. Jonuleit H, Schmit E, Schuler G, Knop J, Enk AH. Induction of interleukin 10-producing, non-proliferating CD4+ T cells with regulatory properties by repetitive stimulation with allogeneicimmature human dendritic cells. J Exp Med 2000;192:1213. [PubMed: 11067871]
32. Dhodapkar MV, Steinman RM, Krasovsky J, Munz C, Bhardwaj N. Antigen-specific inhibition ofeffector T cell function in humans after injection of immature dendritic cells. J Exp Med2001;193:233. [PubMed: 11208863]
33. Clark GJ, Gunningham S, Troy A, Vuckovic S, Hart DN. Expression of the RelB transcription factorcorrelates with the activation of human dendritic cells. Immunology 1999;98:189. [PubMed:10540217]
34. Thompson AG, Pettit AR, Padmanabha J, Mansfield H, Frazer IH, Strutton GM, Thomas R. NuclearRelB+ cells are found in normal lymphoid organs and in peripheral tissue in the context ofinflammation, but not under normal resting conditions. Immunol. Cell Biol 2002;80:164. [PubMed:11940117]
35. Rocha B, Tanchot C, Von Boehmer H. Clonal anergy blocks in vivo growth mature T cells and canbe reversed in the absence of antigen. J Exp Med 1993;177:1517. [PubMed: 8478622]
36. Roncarolo MG, Levings MK, Traversari C. Differentiation of T regulatory cells by immature dendriticcells. J Exp Med 2001;193:F5. [PubMed: 11208869]
37. Thompson AG, O'Sullivan BJ, Beamish H, Thomas R. T cells signaled by NF-κB−dendritic cells aresensitized not anergic to subsequent activation. J Immunol 2004;173:1671. [PubMed: 15265896]
38. Takahashi T, Kuniyasu Y, Toda M, Sakaguchi N, Itoh M, Iwata M, Shimizu J, Sakaguchi S.Immunologic self-tolerance maintained by CD25+CD4+ naturally anergic and suppressive T cells:induction of autoimmune disease by breaking their anergic/suppressive state. Int Immunol1998;10:1969. [PubMed: 9885918]
Hernandez et al. Page 13
Hum Immunol. Author manuscript; available in PMC 2008 September 1.
NIH
-PA Author Manuscript
NIH
-PA Author Manuscript
NIH
-PA Author Manuscript
39. Hanash AM, Levy RB. Donor CD4+CD25+ T cells promote engraftment and tolerance followingMHC-mismatched hematopoietic cell transplantation. Blood 2005;105:1828. [PubMed: 15494429]
40. Jiang S, Camara N, Lombardi G, Lechler RI. Induction of allopeptide-specific human CD4+CD25+regulatory T cells ex vivo. Blood 2003;102:2180. [PubMed: 12775574]
41. Tan PH, Sagoo P, Chan C, Yates JB, Campbell J, Beutelspacher SC, Foxwell BM, Lombardi G,George AJ. Inhibition of NF-kappa B and oxidative pathways in human dendritic cells byantioxidative vitamins generates regulatory T cells. J Immunol 2005;174:7633. [PubMed: 15944264]
42. Buckland M, Jago CB, Fazekasova H, Scott K, Tan PH, George AJ, Lechler R, Lombardi G. Aspirin-Treated Human DCs Up-Regulate ILT-3 and Induce Hyporesponsiveness and Regulatory Activityin Responder T Cells. Am J Transplant 2006;6:2046. [PubMed: 16869801]
ABBREVIATIONSASA, acetylsalicylic acidBAY, (E)3-[4-t-Methylphenyl)-sulfonyl]-2-propenenitrileDC, dendritic cellsFoxP3, Forkhead box (Fox) winged helix DNA binding domain, transcription factors (P3)GM-CSF, granulocyte macrophage-colony-stimulating factorHLA, human leukocyte antigenIL, interleukinNF-κB, nuclear factor kappa BPBMC, peripheral blood mononuclear cellsPGE2, prostoglandin E2PMA, phorbol myristic acetateTNFα, tumor necrosis factor-alphaT reg, T regulatory cells
Hernandez et al. Page 14
Hum Immunol. Author manuscript; available in PMC 2008 September 1.
NIH
-PA Author Manuscript
NIH
-PA Author Manuscript
NIH
-PA Author Manuscript
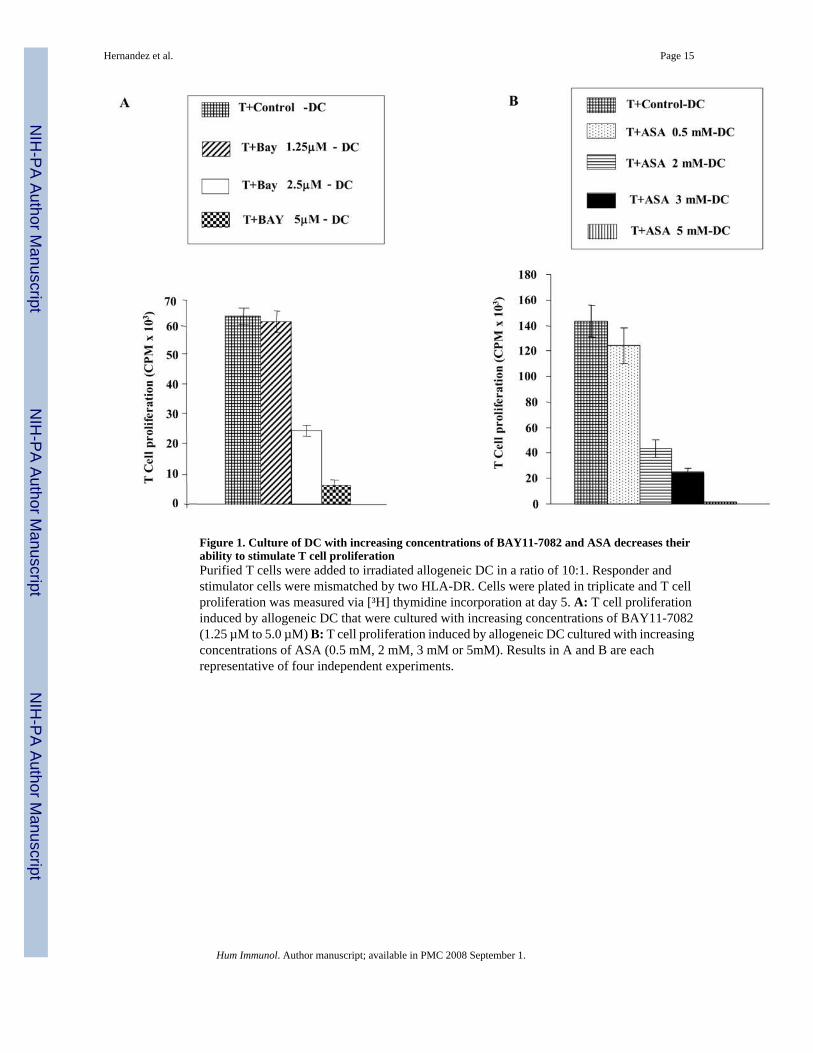
Figure 1. Culture of DC with increasing concentrations of BAY11-7082 and ASA decreases theirability to stimulate T cell proliferationPurified T cells were added to irradiated allogeneic DC in a ratio of 10:1. Responder andstimulator cells were mismatched by two HLA-DR. Cells were plated in triplicate and T cellproliferation was measured via [³H] thymidine incorporation at day 5. A: T cell proliferationinduced by allogeneic DC that were cultured with increasing concentrations of BAY11-7082(1.25 µM to 5.0 µM) B: T cell proliferation induced by allogeneic DC cultured with increasingconcentrations of ASA (0.5 mM, 2 mM, 3 mM or 5mM). Results in A and B are eachrepresentative of four independent experiments.
Hernandez et al. Page 15
Hum Immunol. Author manuscript; available in PMC 2008 September 1.
NIH
-PA Author Manuscript
NIH
-PA Author Manuscript
NIH
-PA Author Manuscript
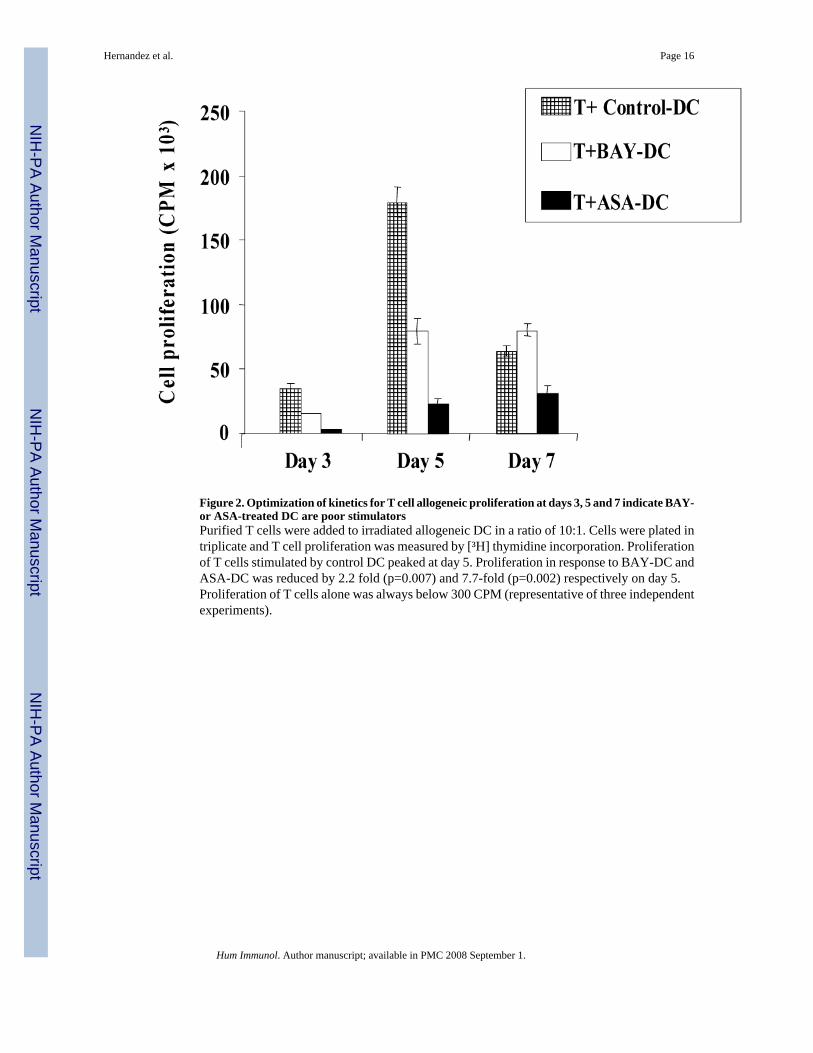
Figure 2. Optimization of kinetics for T cell allogeneic proliferation at days 3, 5 and 7 indicate BAY-or ASA-treated DC are poor stimulatorsPurified T cells were added to irradiated allogeneic DC in a ratio of 10:1. Cells were plated intriplicate and T cell proliferation was measured by [³H] thymidine incorporation. Proliferationof T cells stimulated by control DC peaked at day 5. Proliferation in response to BAY-DC andASA-DC was reduced by 2.2 fold (p=0.007) and 7.7-fold (p=0.002) respectively on day 5.Proliferation of T cells alone was always below 300 CPM (representative of three independentexperiments).
Hernandez et al. Page 16
Hum Immunol. Author manuscript; available in PMC 2008 September 1.
NIH
-PA Author Manuscript
NIH
-PA Author Manuscript
NIH
-PA Author Manuscript
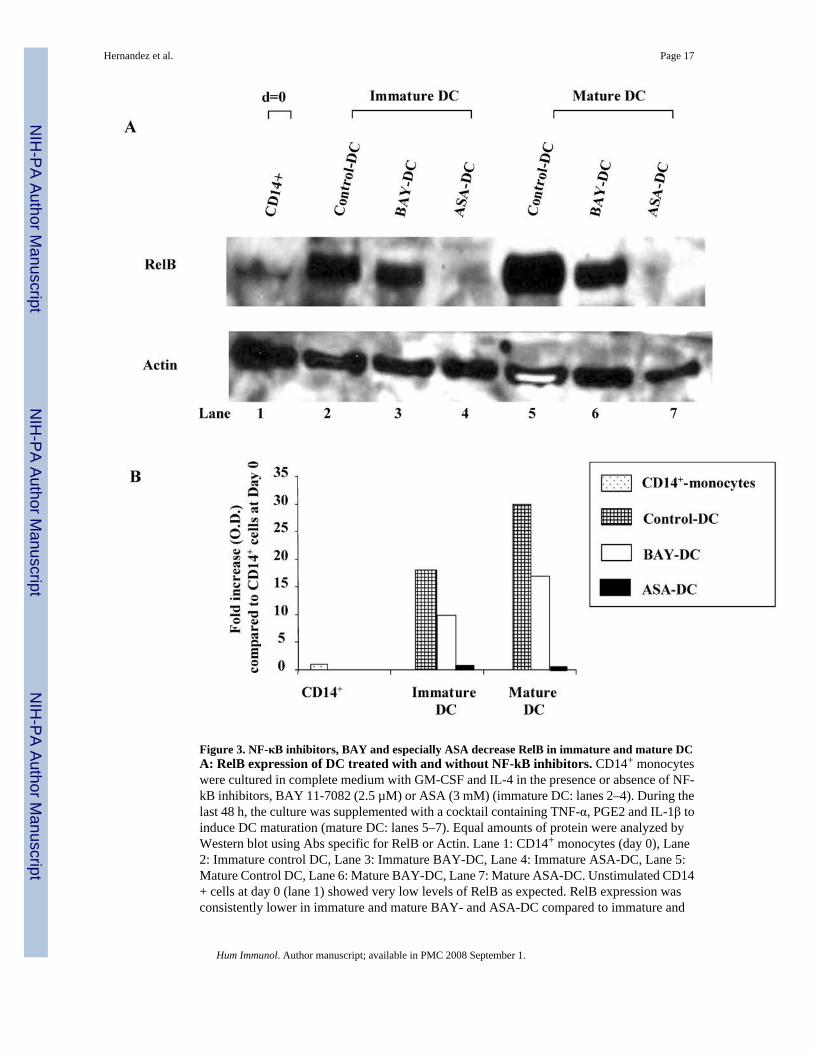
Figure 3. NF-κB inhibitors, BAY and especially ASA decrease RelB in immature and mature DCA: RelB expression of DC treated with and without NF-kB inhibitors. CD14+ monocyteswere cultured in complete medium with GM-CSF and IL-4 in the presence or absence of NF-kB inhibitors, BAY 11-7082 (2.5 µM) or ASA (3 mM) (immature DC: lanes 2–4). During thelast 48 h, the culture was supplemented with a cocktail containing TNF-α, PGE2 and IL-1β toinduce DC maturation (mature DC: lanes 5–7). Equal amounts of protein were analyzed byWestern blot using Abs specific for RelB or Actin. Lane 1: CD14+ monocytes (day 0), Lane2: Immature control DC, Lane 3: Immature BAY-DC, Lane 4: Immature ASA-DC, Lane 5:Mature Control DC, Lane 6: Mature BAY-DC, Lane 7: Mature ASA-DC. Unstimulated CD14+ cells at day 0 (lane 1) showed very low levels of RelB as expected. RelB expression wasconsistently lower in immature and mature BAY- and ASA-DC compared to immature and
Hernandez et al. Page 17
Hum Immunol. Author manuscript; available in PMC 2008 September 1.
NIH
-PA Author Manuscript
NIH
-PA Author Manuscript
NIH
-PA Author Manuscript
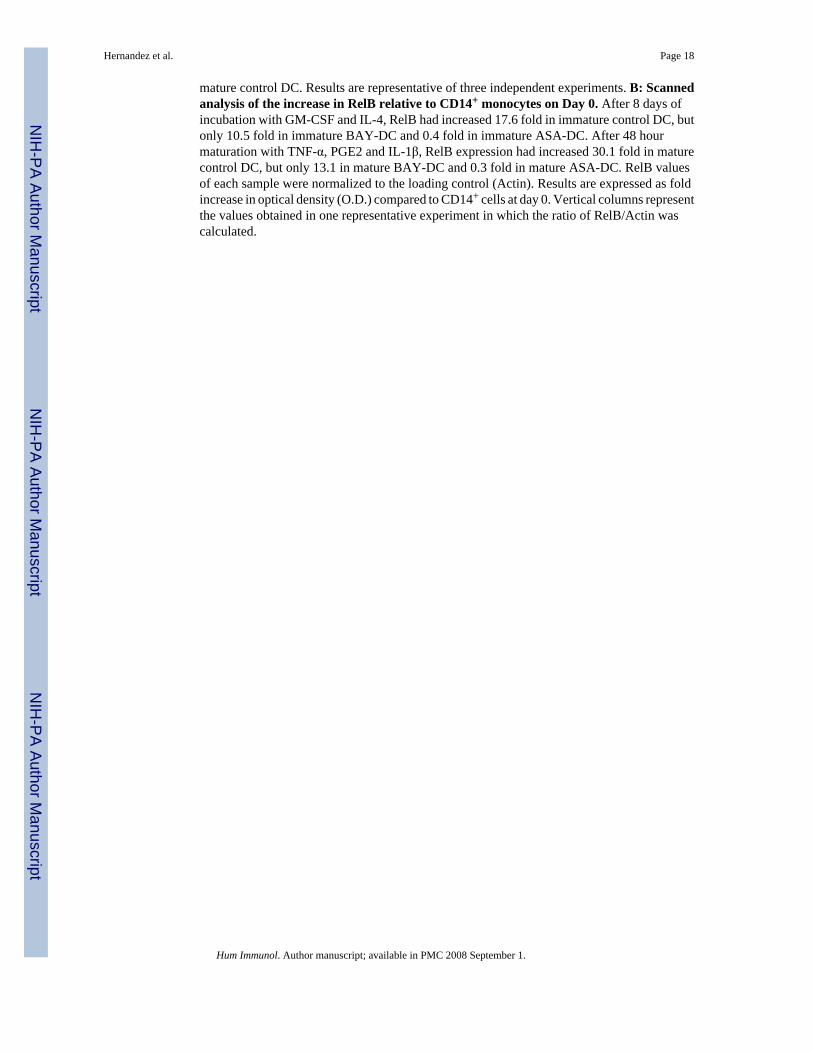
mature control DC. Results are representative of three independent experiments. B: Scannedanalysis of the increase in RelB relative to CD14+ monocytes on Day 0. After 8 days ofincubation with GM-CSF and IL-4, RelB had increased 17.6 fold in immature control DC, butonly 10.5 fold in immature BAY-DC and 0.4 fold in immature ASA-DC. After 48 hourmaturation with TNF-α, PGE2 and IL-1β, RelB expression had increased 30.1 fold in maturecontrol DC, but only 13.1 in mature BAY-DC and 0.3 fold in mature ASA-DC. RelB valuesof each sample were normalized to the loading control (Actin). Results are expressed as foldincrease in optical density (O.D.) compared to CD14+ cells at day 0. Vertical columns representthe values obtained in one representative experiment in which the ratio of RelB/Actin wascalculated.
Hernandez et al. Page 18
Hum Immunol. Author manuscript; available in PMC 2008 September 1.
NIH
-PA Author Manuscript
NIH
-PA Author Manuscript
NIH
-PA Author Manuscript
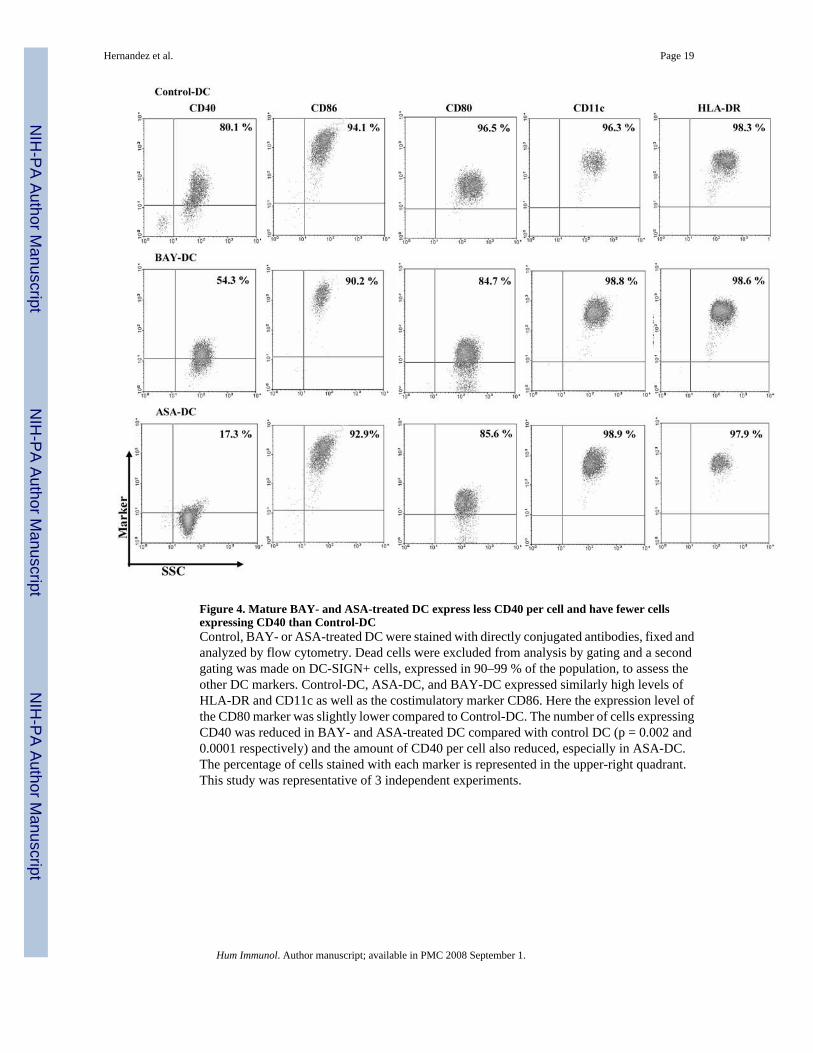
Figure 4. Mature BAY- and ASA-treated DC express less CD40 per cell and have fewer cellsexpressing CD40 than Control-DCControl, BAY- or ASA-treated DC were stained with directly conjugated antibodies, fixed andanalyzed by flow cytometry. Dead cells were excluded from analysis by gating and a secondgating was made on DC-SIGN+ cells, expressed in 90–99 % of the population, to assess theother DC markers. Control-DC, ASA-DC, and BAY-DC expressed similarly high levels ofHLA-DR and CD11c as well as the costimulatory marker CD86. Here the expression level ofthe CD80 marker was slightly lower compared to Control-DC. The number of cells expressingCD40 was reduced in BAY- and ASA-treated DC compared with control DC (p = 0.002 and0.0001 respectively) and the amount of CD40 per cell also reduced, especially in ASA-DC.The percentage of cells stained with each marker is represented in the upper-right quadrant.This study was representative of 3 independent experiments.
Hernandez et al. Page 19
Hum Immunol. Author manuscript; available in PMC 2008 September 1.
NIH
-PA Author Manuscript
NIH
-PA Author Manuscript
NIH
-PA Author Manuscript
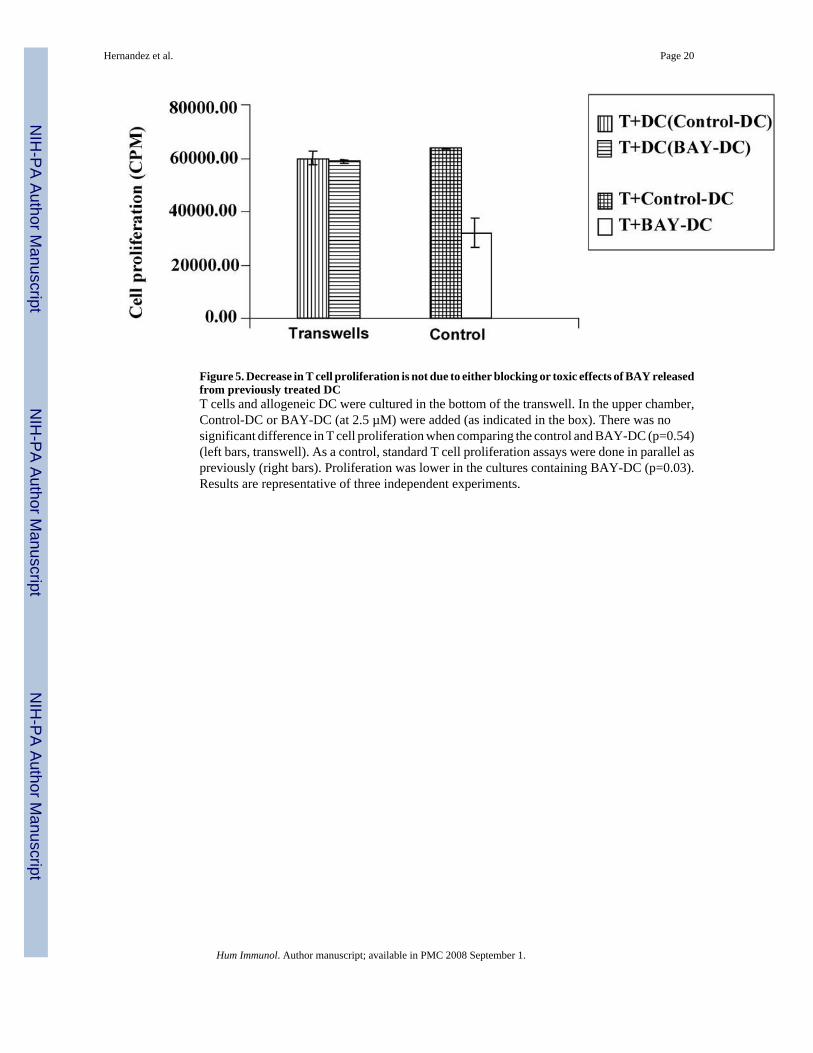
Figure 5. Decrease in T cell proliferation is not due to either blocking or toxic effects of BAY releasedfrom previously treated DCT cells and allogeneic DC were cultured in the bottom of the transwell. In the upper chamber,Control-DC or BAY-DC (at 2.5 µM) were added (as indicated in the box). There was nosignificant difference in T cell proliferation when comparing the control and BAY-DC (p=0.54)(left bars, transwell). As a control, standard T cell proliferation assays were done in parallel aspreviously (right bars). Proliferation was lower in the cultures containing BAY-DC (p=0.03).Results are representative of three independent experiments.
Hernandez et al. Page 20
Hum Immunol. Author manuscript; available in PMC 2008 September 1.
NIH
-PA Author Manuscript
NIH
-PA Author Manuscript
NIH
-PA Author Manuscript
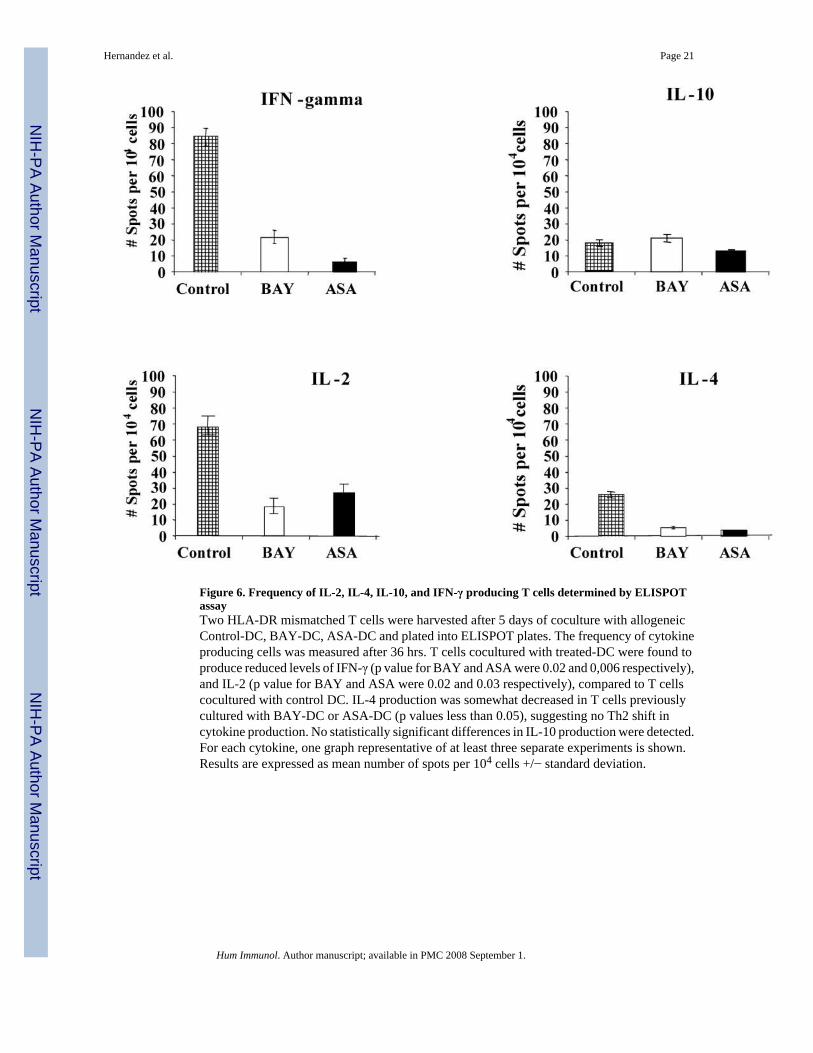
Figure 6. Frequency of IL-2, IL-4, IL-10, and IFN-γ producing T cells determined by ELISPOTassayTwo HLA-DR mismatched T cells were harvested after 5 days of coculture with allogeneicControl-DC, BAY-DC, ASA-DC and plated into ELISPOT plates. The frequency of cytokineproducing cells was measured after 36 hrs. T cells cocultured with treated-DC were found toproduce reduced levels of IFN-γ (p value for BAY and ASA were 0.02 and 0,006 respectively),and IL-2 (p value for BAY and ASA were 0.02 and 0.03 respectively), compared to T cellscocultured with control DC. IL-4 production was somewhat decreased in T cells previouslycultured with BAY-DC or ASA-DC (p values less than 0.05), suggesting no Th2 shift incytokine production. No statistically significant differences in IL-10 production were detected.For each cytokine, one graph representative of at least three separate experiments is shown.Results are expressed as mean number of spots per 104 cells +/− standard deviation.
Hernandez et al. Page 21
Hum Immunol. Author manuscript; available in PMC 2008 September 1.
NIH
-PA Author Manuscript
NIH
-PA Author Manuscript
NIH
-PA Author Manuscript
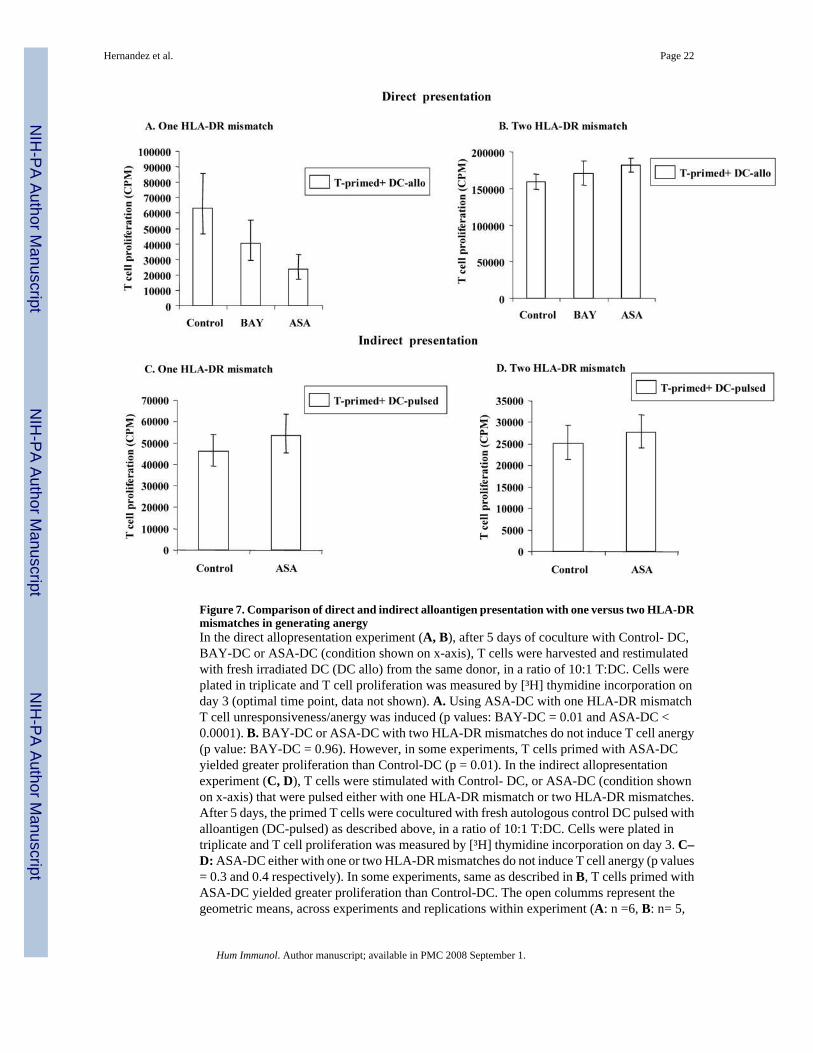
Figure 7. Comparison of direct and indirect alloantigen presentation with one versus two HLA-DRmismatches in generating anergyIn the direct allopresentation experiment (A, B), after 5 days of coculture with Control- DC,BAY-DC or ASA-DC (condition shown on x-axis), T cells were harvested and restimulatedwith fresh irradiated DC (DC allo) from the same donor, in a ratio of 10:1 T:DC. Cells wereplated in triplicate and T cell proliferation was measured by [³H] thymidine incorporation onday 3 (optimal time point, data not shown). A. Using ASA-DC with one HLA-DR mismatchT cell unresponsiveness/anergy was induced (p values: BAY-DC = 0.01 and ASA-DC <0.0001). B. BAY-DC or ASA-DC with two HLA-DR mismatches do not induce T cell anergy(p value: BAY-DC = 0.96). However, in some experiments, T cells primed with ASA-DCyielded greater proliferation than Control-DC (p = 0.01). In the indirect allopresentationexperiment (C, D), T cells were stimulated with Control- DC, or ASA-DC (condition shownon x-axis) that were pulsed either with one HLA-DR mismatch or two HLA-DR mismatches.After 5 days, the primed T cells were cocultured with fresh autologous control DC pulsed withalloantigen (DC-pulsed) as described above, in a ratio of 10:1 T:DC. Cells were plated intriplicate and T cell proliferation was measured by [³H] thymidine incorporation on day 3. C–D: ASA-DC either with one or two HLA-DR mismatches do not induce T cell anergy (p values= 0.3 and 0.4 respectively). In some experiments, same as described in B, T cells primed withASA-DC yielded greater proliferation than Control-DC. The open columms represent thegeometric means, across experiments and replications within experiment (A: n =6, B: n= 5,
Hernandez et al. Page 22
Hum Immunol. Author manuscript; available in PMC 2008 September 1.
NIH
-PA Author Manuscript
NIH
-PA Author Manuscript
NIH
-PA Author Manuscript
C: n= 7 and D: n= 7). N represents the number of experiments, and the total sample size wasequal to n times the number of replicates performed within each experiment. Standard errorbars of each group of sample are shown above and below the vertical bars.
Hernandez et al. Page 23
Hum Immunol. Author manuscript; available in PMC 2008 September 1.
NIH
-PA Author Manuscript
NIH
-PA Author Manuscript
NIH
-PA Author Manuscript
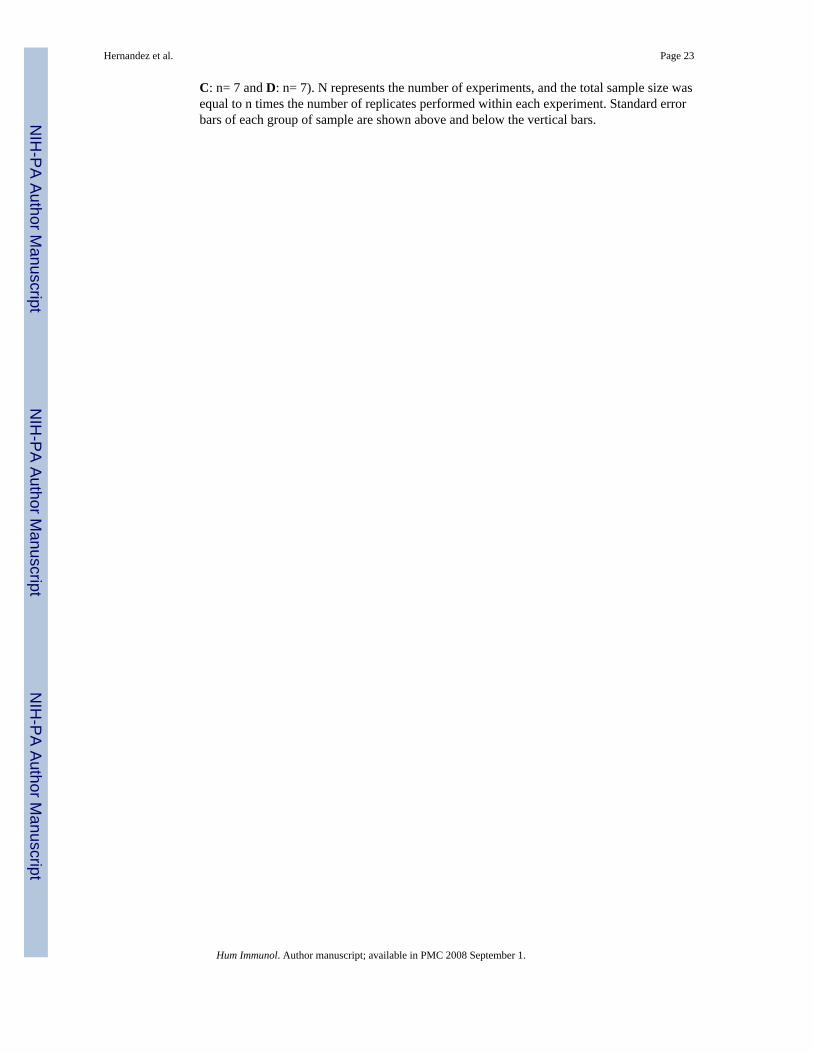
Figure 8. Direct and indirect presentation of alloantigens with one HLA-DR mismatch generatedT cells with inhibitory activityA–B. Direct Presentation: T cells were stimulated by allogeneic Control-DC, BAY-DC orASA-DC with one HLA-DR mismatch. After 5 days, the primed T cells were purified withCD3 microbeads, rested for 2 days and cocultured with fresh T cells and fresh Control-DCmatured with TNFα, PGE2 and IL-1β, as described in material and methods. T cell proliferationwas measured at day 3 (the optimal time point, data not shown) by MLR. Significant differencesin T cell proliferation were observed between Control-DC and treated-DC with one HLA-DRmismatch (p values: BAY-DC = 0.03 and ASA-DC <0.0001) whereas no significantdifferences were observed with two HLA-DR mismatch (p values: BAY-DC=0.96 and ASA-DC=0.04). The vertical bars represent the geometric means, across experiments andreplications within experiment (A: n = 5 and B: n = 3). C–D. Indirect presentation: T cellswere stimulated with autologous control DC or ASA-DC, both of these were pulsed withapoptotic allogeneic PBMC with either one HLA-DR mismatch or two HLA-DR mismatches.After 5 days, the primed T cells were purified, rested for 2 days and cocultured with freshautologous T cells and fresh autologous control DC pulsed with alloantigen as described above.T cell proliferation was significantly inhibited when T cells were primed with autologous ASA-DC pulsed with allogeneic PBMC with one HLA-DR mismatch (p = 0.03). However noinhibition was observed when T cells were primed with ASA-DC pulsed with allogeneic PBMCwith two HLA-DR mismatches (p = 0.49). The open columms represent the geometric means,
Hernandez et al. Page 24
Hum Immunol. Author manuscript; available in PMC 2008 September 1.
NIH
-PA Author Manuscript
NIH
-PA Author Manuscript
NIH
-PA Author Manuscript

across experiments and replications within experiment (C: n = 7 and D: n = 7). N representsthe number of experiments, and the total sample size was equal to n times the number ofreplicates performed within each experiment. Standard error bars of each group of sample areshown above and below the vertical bars.
Hernandez et al. Page 25
Hum Immunol. Author manuscript; available in PMC 2008 September 1.
NIH
-PA Author Manuscript
NIH
-PA Author Manuscript
NIH
-PA Author Manuscript
NIH
-PA Author Manuscript
NIH
-PA Author Manuscript
NIH
-PA Author Manuscript
Hernandez et al. Page 26Ta
ble
1
Tab
le 1
A: D
irec
t pre
sent
atio
n. (1
DR
mis
mat
ch)
Exp
.H
aplo
type
Ane
rgy
(Fig
. 7A
)R
egul
ator
y ac
tivity
(Fig
. 8A
)
(T
pri
med
+ D
C-a
llo)
(T p
rim
ed +
T fr
esh
+ D
C-a
llo)
Con
trol
BA
YA
SAC
ontr
olB
AY
ASA
1.T
cells
: A23
,31;
B44
,60;
DR
3,15
DC
: A26
,30;
B38
,18;
DR
3, -
57,3
18 ±
1,9
7138
,228
± 8
5710
,950
± 2
,300
106,
725
± 13
,329
6,41
4 ±
1,52
024
,568
± 3
290
2.T
cells
: A2,
29;
B44
,-; D
R4,
7D
C:A
1,2;
B52
,50;
DR
7,15
31,4
20 ±
1,9
9313
,695
± 5
534,
348
± 65
947
,808
± 1
0,67
418
,714
± 2
9325
,734
± 2
,536
3.T
cells
: A2,
29;
B44
,-; D
R10
,15
DC
: A3,
11; B
7,38
;D
R15
,-
8,18
9 ±
1,80
88,
202
± 3,
378
6,07
5 ±
2,94
911
,984
± 2
,281
9,29
0 ±
1,44
612
,164
± 1
,082
4.T
cells
: A2,
3;B
27,3
7; D
R1,
7D
C: A
11,2
5;B
7,63
; DR
1,-
65,2
30 ±
6,6
8644
,500
± 3
,705
47,7
20 ±
5,0
4888
,096
± 1
2,82
862
,238
± 3
,587
47,5
59 ±
4,5
91
5.T
cells
: A24
,26;
B27
,57;
DR
4,7
DC
: A2,
3; B
35,5
0;D
R7,
17
522,
008
± 14
,187
546,
723
± 26
,967
148,
517
± 19
,926
561,
765
± 26
,047
567,
810
± 46
,866
148,
987
± 16
,661
6.T
cells
: A1,
2;B
27,5
3; D
R7,
13D
C: A
2,3;
B27
,37;
DR
1, 7
126,
785
± 1,
654
10,5
40 ±
1,5
6892
,279
± 1
,840
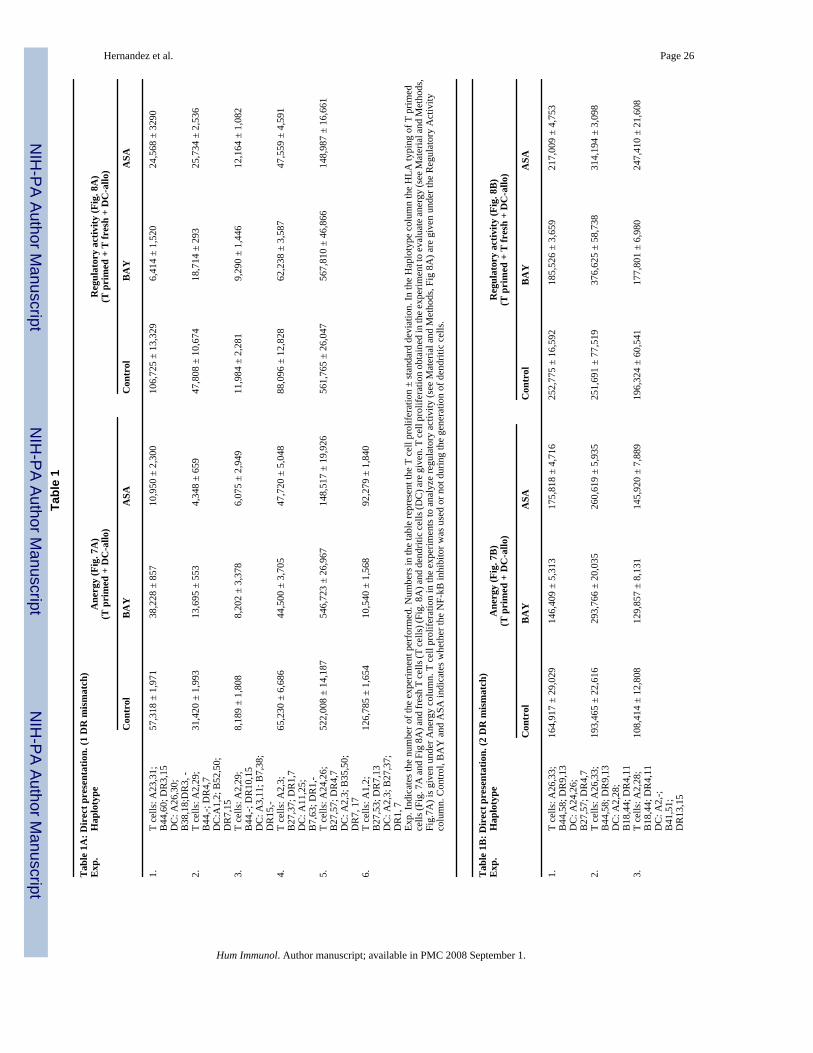
Ex
p. In
dica
tes t
he n
umbe
r of t
he e
xper
imen
t per
form
ed. N
umbe
rs in
the
tabl
e re
pres
ent t
he T
cel
l pro
lifer
atio
n ±
stan
dard
dev
iatio
n. In
the
Hap
loty
pe c
olum
n th
e H
LA ty
ping
of T
prim
edce
lls (F
ig. 7
A an
d Fi
g 8A
) and
fres
h T
cells
(T ce
lls) (
Fig.
8A
) and
den
driti
c cel
ls (D
C) a
re g
iven
. T ce
ll pr
olife
ratio
n ob
tain
ed in
the e
xper
imen
t to
eval
uate
aner
gy (s
ee M
ater
ial a
nd M
etho
ds,
Fig.
7A) i
s giv
en u
nder
Ane
rgy
colu
mn.
T c
ell p
rolif
erat
ion
in th
e ex
perim
ents
to a
naly
ze re
gula
tory
act
ivity
(see
Mat
eria
l and
Met
hods
, Fig
8A
) are
giv
en u
nder
the
Reg
ulat
ory
Act
ivity
colu
mn.
Con
trol,
BA
Y a
nd A
SA in
dica
tes w
heth
er th
e N
F-kB
inhi
bito
r was
use
d or
not
dur
ing
the
gene
ratio
n of
den
driti
c ce
lls.
Tab
le 1
B: D
irec
t pre
sent
atio
n. (2
DR
mis
mat
ch)
Exp
.H
aplo
type
Ane
rgy
(Fig
. 7B
)R
egul
ator
y ac
tivity
(Fig
. 8B
)
(T
pri
med
+ D
C-a
llo)
(T p
rim
ed +
T fr
esh
+ D
C-a
llo)
Con
trol
BA
YA
SAC
ontr
olB
AY
ASA
1.T
cells
: A26
,33;
B44
,58;
DR
9,13
DC
: A24
,26;
B27
,57;
DR
4,7
164,
917
± 29
,029
146,
409
± 5,
313
175,
818
± 4,
716
252,
775
± 16
,592
185,
526
± 3,
659
217,
009
± 4,
753
2.T
cells
: A26
,33;
B44
,58;
DR
9,13
DC
: A2,
28;
B18
,44;
DR
4,11
193,
465
± 22
,616
293,
766
± 20
,035
260,
619
± 5,
935
251,
691
± 77
,519
376,
625
± 58
,738
314,
194
± 3,
098
3.T
cells
: A2,
28;
B18
,44;
DR
4,11
DC
: A2,
-;B
41,5
1;D
R13
,15
108,
414
± 12
,808
129,
857
± 8,
131
145,
920
± 7,
889
196,
324
± 60
,541
177,
801
± 6,
980
247,
410
± 21
,608
Hum Immunol. Author manuscript; available in PMC 2008 September 1.

NIH
-PA Author Manuscript
NIH
-PA Author Manuscript
NIH
-PA Author Manuscript
Hernandez et al. Page 27T
able
1B
: Dir
ect p
rese
ntat
ion.
(2 D
R m
ism
atch
)E
xp.
Hap
loty
peA
nerg
y (F
ig. 7
B)
Reg
ulat
ory
activ
ity (F
ig. 8
B)
(T p
rim
ed +
DC
-allo
)(T
pri
med
+ T
fres
h +
DC
-allo
)
Con
trol
BA
YA
SAC
ontr
olB
AY
ASA
4.T
cells
: A3,
28;
B18
,55;
DR
16,-
DC
: A3,
-; B
7,35
;D
R1,
13
160,
993
± 37
,906
152,
710
± 17
,718
161,
113
± 4,
937
194,
190
± 12
,157
167,
498
± 12
,378
200,
430
± 6,
652
5.T
cells
: A2,
28;
B18
,44;
DR
4,11
DC
: A2,
30;
B27
,51;
DR
1,13
190,
734
± 20
,773
N.D
183,
491
± 3,
975
235,
321
± 17
,166
N.D
316,
808
± 20
,511
Ex
p. In
dica
tes t
he n
umbe
r of t
he e
xper
imen
t per
form
ed. N
umbe
rs in
the
tabl
e re
pres
ent t
he T
cel
l pro
lifer
atio
n ±
stan
dard
dev
iatio
n. In
the
Hap
loty
pe c
olum
n th
e H
LA ty
ping
of T
prim
edce
lls (F
ig. 7
B an
d Fi
g. 8
B) a
nd fr
esh
T ce
lls (F
ig. 8
B) (
T ce
lls) a
nd d
endr
itic c
ells
(DC
) are
giv
en. T
cell
prol
ifera
tion
obta
ined
in th
e exp
erim
ent t
o ev
alua
te an
ergy
(see
Mat
eria
l and
Met
hods
,Fi
g. 7
B) i
s giv
en u
nder
Ane
rgy
colu
mn.
T c
ell p
rolif
erat
ion
in th
e ex
perim
ents
to a
naly
ze re
gula
tory
act
ivity
(see
Mat
eria
l and
Met
hods
, Fig
. 8B
) are
giv
en u
nder
the
Reg
ulat
ory
Act
ivity
colu
mn.
Con
trol,
BA
Y a
nd A
SA in
dica
tes w
ith N
F-kB
inhi
bito
r was
use
d or
not
dur
ing
the
gene
ratio
n of
den
driti
c ce
lls. N
.D: n
ot d
eter
min
ed.
Hum Immunol. Author manuscript; available in PMC 2008 September 1.

NIH
-PA Author Manuscript
NIH
-PA Author Manuscript
NIH
-PA Author Manuscript
Hernandez et al. Page 28Ta
ble
2
Tab
le 2
A: I
ndir
ect p
rese
ntat
ion.
(1 D
R m
ism
atch
)E
xp.
Hap
loty
peA
nerg
y (F
ig. 7
C)
Reg
ulat
ory
activ
ity (F
ig. 8
C)
(T p
rim
ed +
DC
-pul
sed)
(T p
rim
ed +
T fr
esh
+ D
C-p
ulse
d)
Con
trol
ASA
Con
trol
ASA
1.D
C a
nd T
cel
ls: A
2,-;
B41
,51;
DR
13,1
5 PB
MC
for p
ulsi
ng:
A1,
24; B
27,5
3; D
R7,
13
15,6
00 ±
1,7
6112
,195
± 1
,336
51,3
62 ±
5,1
8321
,845
± 1
,908
2.D
C a
nd T
cel
ls: A
2,3;
B35
,50;
DR
7,17
PB
MC
for p
ulsi
ng:
A1,
24; B
27,5
3; D
R7,
13
29,5
82 ±
2,0
7537
,855
± 3
,104
73,1
41 ±
7,5
1659
,654
± 4
,041
3.D
C a
nd T
cel
ls: A
2,29
; B44
,-;D
R4,
7 PB
MC
for p
ulsi
ng:
A1,
24; B
27,5
3; D
R7,
13
36,8
91 ±
3,8
4654
,028
± 6
,705
100,
343
± 14
,925
55,2
56 ±
9,6
96
4.D
C a
nd T
cel
ls: A
3,24
; B7,
44;
DR
7,15
PB
MC
for p
ulsi
ng:
A1,
24; B
27,5
3; D
R7,
13
137,
329
± 14
,139
121,
982
± 3,
120
192,
481
± 12
,690
124,
201
± 13
,196
5.D
C a
nd T
cel
ls: A
2,28
;B
18,4
8; D
R4,
11 P
BM
C fo
rpu
lsin
g: A
2,31
; B62
,50;
DR
4,8
119,
667
± 12
,182
113,
340
± 20
,173
178,
356
± 22
,100
162,
884
± 8,
007
6.D
C a
nd T
cel
ls: A
23,2
6;B
14,2
7; D
R1,
7 PB
MC
for
puls
ing:
A1,
24; B
27,5
3;D
R7,
13
35,3
20 ±
2,6
7158
,420
± 7
,944
48,1
28 ±
7,8
5062
,370
± 3
,745
7.D
C a
nd T
cel
ls: A
1,10
;B
18,5
2; D
R3,
15 P
BM
C fo
rpu
lsin
g: A
11,2
9; B
44,-;
DR
7,15
44,9
33 ±
4,1
6761
,206
± 7
,160
90,4
45 ±
8,4
4711
4,20
7 ±
12,3
44
Exp.
Indi
cate
s the
num
ber o
f the
exp
erim
ent p
erfo
rmed
. Num
bers
in th
e ta
ble
repr
esen
t the
T c
ell p
rolif
erat
ion
± st
anda
rd d
evia
tion.
In th
e H
aplo
type
col
umn
the
HLA
typi
ng o
f T p
rimed
cel
ls (F
ig. 7
Can
d Fi
g. 8
C) a
nd fr
esh
T ce
lls (T
cel
ls) (
Fig.
8C
), de
ndrit
ic c
ells
(DC
) and
allo
gene
ic P
BM
C u
sed
to p
ulse
d D
C a
re g
iven
. T c
ell p
rolif
erat
ion
obta
ined
in th
e ex
perim
ent t
o ev
alua
te a
nerg
y (s
ee M
ater
ial
and
Met
hods
, Fig
. 7C
) is g
iven
und
er A
nerg
y co
lum
n. T
cel
l pro
lifer
atio
n in
the
expe
rimen
ts to
ana
lyze
regu
lato
ry a
ctiv
ity (s
ee M
ater
ial a
nd M
etho
ds, F
ig. 8
C) a
re g
iven
und
er th
e R
egul
ator
y A
ctiv
ityco
lum
n. C
ontro
l, B
AY
and
ASA
indi
cate
s whe
ther
the
NF-
k in
hibi
tor w
as u
sed
or n
ot d
urin
g th
e ge
nera
tion
of d
endr
itic
cells
.
Tab
le 2
B: I
ndir
ect p
rese
ntat
ion.
(2 D
R m
ism
atch
)E
xp.
Hap
loty
peA
nerg
y (F
ig. 7
D)
Reg
ulat
ory
activ
ity (F
ig. 8
D)
(T p
rim
ed +
DC
-pul
sed)
(T p
rim
ed +
T fr
esh
+ D
C-p
ulse
d)
Con
trol
ASA
Con
trol
ASA
1.D
C a
nd T
cel
ls: A
24,2
6;B
27,5
7; D
R4,
7 PB
MC
for
puls
ing:
A3,
28; B
18,3
5;D
R12
,14
42,6
61 ±
2,6
7350
,381
± 1
,892
46,5
69 ±
3,0
8752
,467
± 2
,754
2.D
C a
nd T
cel
ls: A
1,10
; B18
,52;
DR
3,15
PB
MC
for p
ulsi
ng:
A2,
3; B
35,5
0; D
R7,
8
26,3
53 ±
1,1
2122
,697
± 2
,999
64,7
42 ±
2,3
6780
,921
± 2
,144
3.D
C a
nd T
cel
ls: A
2,3;
B27
,37;
DR
1,7
PBM
C fo
r pul
sing
:A
3,28
; B18
,35;
DR
12,1
4
9,15
8 ±
293
9,21
5 ±
1,21
09,
530
± 65
99,
208
± 37
4
4.D
C a
nd T
cel
ls: A
3,28
; B18
,55;
DR
16,-
PBM
C fo
r pul
sing
:A
1,24
; B27
,53;
DR
7,13
35,5
54 ±
3,5
4444
,804
± 3
,808
43,8
51 ±
3,0
9265
,706
± 5
,445
Hum Immunol. Author manuscript; available in PMC 2008 September 1.

NIH
-PA Author Manuscript
NIH
-PA Author Manuscript
NIH
-PA Author Manuscript
Hernandez et al. Page 29T
able
2B
: Ind
irec
t pre
sent
atio
n. (2
DR
mis
mat
ch)
Exp
.H
aplo
type
Ane
rgy
(Fig
. 7D
)R
egul
ator
y ac
tivity
(Fig
. 8D
)
(T
pri
med
+ D
C-p
ulse
d)(T
pri
med
+ T
fres
h +
DC
-pul
sed)
Con
trol
ASA
Con
trol
ASA
5.D
C a
nd T
cel
ls: A
2,30
; B27
,51;
DR
1,13
PB
MC
for p
ulsi
ng:
A2,
29; B
44,-;
DR
10,1
5
17,4
87 ±
1,9
6315
,899
± 1
,293
20,2
88 ±
2,1
3616
,158
± 1
,266
6.D
C an
d T
cells
: A2,
28; B
18,
48;
DR
4,11
PB
MC
for p
ulsi
ng:
A1,
24; B
27,5
3; D
R7,
13
70,0
16 ±
2,6
8056
,353
± 6
,266
211,
561
± 13
,404
123,
707
± 18
,089
7.D
C a
nd T
cel
ls: A
2,3;
B35
,38;
DR
12,1
3 PB
MC
for p
ulsi
ng:
A2,
29; B
44,-;
DR
10,1
5
29,8
27 ±
1,8
2829
,784
± 1
,825
244,
188
± 9,
212
223,
157
± 26
,438
Exp.
Indi
cate
s the
num
ber o
f the
exp
erim
ent p
erfo
rmed
. Num
bers
in th
e ta
ble
repr
esen
t the
T c
ell p
rolif
erat
ion
± st
anda
rd d
evia
tion.
In th
e H
aplo
type
col
umn
the
HLA
typi
ng o
f T p
rimed
cel
ls (F
ig. 7
Dan
d Fi
g. 8
D) a
nd fr
esh
T ce
lls (T
cel
ls) (
Fig.
8D
), de
ndrit
ic c
ells
(DC
) and
allo
gene
ic P
BM
C u
sed
to p
ulse
d D
C a
re g
iven
. T c
ell p
rolif
erat
ion
obta
ined
in th
e ex
perim
ent t
o ev
alua
te a
nerg
y (s
ee M
ater
ial
and
Met
hods
, Fig
. 7D
) is g
iven
und
er A
nerg
y co
lum
n. T
cel
l pro
lifer
atio
n in
the
expe
rimen
ts to
ana
lyze
regu
lato
ry a
ctiv
ity (s
ee M
ater
ial a
nd M
etho
ds, F
ig. 8
D) a
re g
iven
und
er th
e R
egul
ator
y A
ctiv
ityco
lum
n. C
ontro
l, B
AY
and
ASA
indi
cate
s whe
ther
the
NF-
k in
hibi
tor w
as u
sed
or n
ot d
urin
g th
e ge
nera
tion
of d
endr
itic
cells
.
Hum Immunol. Author manuscript; available in PMC 2008 September 1.