INHABITANTS OF A SACRED TOWNSCAPE: An Archaeological and Osteological Analysis of Skeletal Remains...
24
Acta Archaeologica vol. 76, 2005, pp. 87–110 Copyright C 2005 Printed in Denmark ¡ All rights reserved ACTA ARCHAEOLOGICA ISSN 0065-101X INHABITANTS OF A SACRED TOWNSCAPE An Archaeological and Osteological Analysis of Skeletal Remains from Late Viking Age and Medieval Sigtuna, Sweden by Anna Kjellström,Sten Tesch &Anders Wikström INTRODUCTION Sigtuna is situated at a branch of the Lake Mälaren in eastern central Sweden, about 35 km north of Birka and 35 km south of Gamla Uppsala (Old Uppsala). The town stretches along the south shore of a rocky and wooded strip of land, between two passages leading up to Uppsala. Sigtuna is the oldest – still existing – town in Sweden, founded about 980 more than two hundred years before the real expansion of towns, the medieval urbanization, took place. Primarily, Sigtuna was not a trading town, but a stronghold created by the king Erik Segersäll in his quest for power in the Lake Mälaren region. A mint, the first in Sweden, was set up in Sigtuna about 995 by his son king Olof Eriksson ‘‘Skötkonung’’. Extensive archaeological ex- cavations in the block Trädgårdsmästaren (1988– 1990) showed that the town was founded according to a predetermined plan, and that the king most likely played a crucial part in the foundation (Tesch 1990, 1996, 2001b). Generally speaking and excluding func- tional analogies, Sigtuna succeeded the Viking Age proto-town Birka and preceded the 13th century town Stockholm. The foundation of the town was an important step in the development of the ‘‘Swedish realm’’. The urbanization of Sigtuna was immediate and made the town comparable to other contempor- ary larger settlements in Western Europe. No traces of stables or barns have been found in the town layers, signifying the urban character. From the 10th century and over the next 300 years it was the leading Swedish town and the largest and most densely popu- lated city in eastern Scandinavia. Artifacts recovered from the town emphasize the importance of the ur- ban settlement, not only through their exotic origin and exclusivity but also through the new ideas that some of the objects represent. The town was also, almost from the beginning, a central place for the Christian Church. A diocese was established in Sigtuna about 1060 by the archbishop of Bremen. As many as six or seven stone churches were erected before the middle of the 12th century. They are some of the oldest stone churches in Sweden. In 1237 a Dominican Friary was founded and the Dominican church St Mary’s is one of the oldest brick-buildings from medieval Sweden. The Sigtuna bishopric ceased by the middle of the 12th century, but a deanery remained. In the 14th century, after Stockholm had emerged as the new ‘capital’ of the region, Sigtuna became a mere shadow of its former self. The population dwindled, plots amalgamated with fewer houses. It is, however, unclear in what way Sigtuna was affected by the climatic changes and the plague, which rav- aged large parts of Europe and Scandinavia during the mid 14th century. The main focus of this study is to highlight the gen- eral living conditions in Sigtuna through time. Based on the grave material, the joint results of the archae- ological and osteological investigations are combined to answer the question of who lived and who were bur-
Transcript of INHABITANTS OF A SACRED TOWNSCAPE: An Archaeological and Osteological Analysis of Skeletal Remains...

Acta Archaeologica vol. 76, 2005, pp. 87–110 Copyright C 2005
Printed in Denmark ¡ All rights reserved ACTA ARCHAEOLOGICAISSN 0065-101X
INHABITANTS OF A SACRED TOWNSCAPEAn Archaeological and Osteological Analysis of Skeletal Remains from
Late Viking Age and Medieval Sigtuna, Swedenby
Anna Kjellström, Sten Tesch & Anders Wikström
INTRODUCTION
Sigtuna is situated at a branch of the Lake Mälaren
in eastern central Sweden, about 35 km north of Birka
and 35 km south of Gamla Uppsala (Old Uppsala). The
town stretches along the south shore of a rocky and
wooded strip of land, between two passages leading
up to Uppsala. Sigtuna is the oldest – still existing –
town in Sweden, founded about 980 more than two
hundred years before the real expansion of towns, the
medieval urbanization, took place. Primarily, Sigtuna
was not a trading town, but a stronghold created by
the king Erik Segersäll in his quest for power in the
Lake Mälaren region. A mint, the first in Sweden,
was set up in Sigtuna about 995 by his son king Olof
Eriksson ‘‘Skötkonung’’. Extensive archaeological ex-
cavations in the block Trädgårdsmästaren (1988–
1990) showed that the town was founded according
to a predetermined plan, and that the king most likely
played a crucial part in the foundation (Tesch 1990,
1996, 2001b). Generally speaking and excluding func-
tional analogies, Sigtuna succeeded the Viking Age
proto-town Birka and preceded the 13th century
town Stockholm. The foundation of the town was an
important step in the development of the ‘‘Swedish
realm’’. The urbanization of Sigtuna was immediate
and made the town comparable to other contempor-
ary larger settlements in Western Europe. No traces
of stables or barns have been found in the town
layers, signifying the urban character. From the 10th
century and over the next 300 years it was the leading
Swedish town and the largest and most densely popu-
lated city in eastern Scandinavia. Artifacts recovered
from the town emphasize the importance of the ur-
ban settlement, not only through their exotic origin
and exclusivity but also through the new ideas that
some of the objects represent.
The town was also, almost from the beginning, a
central place for the Christian Church. A diocese was
established in Sigtuna about 1060 by the archbishop
of Bremen. As many as six or seven stone churches
were erected before the middle of the 12th century.
They are some of the oldest stone churches in
Sweden. In 1237 a Dominican Friary was founded
and the Dominican church St Mary’s is one of the
oldest brick-buildings from medieval Sweden. The
Sigtuna bishopric ceased by the middle of the 12th
century, but a deanery remained.
In the 14th century, after Stockholm had emerged
as the new ‘capital’ of the region, Sigtuna became a
mere shadow of its former self. The population
dwindled, plots amalgamated with fewer houses. It is,
however, unclear in what way Sigtuna was affected
by the climatic changes and the plague, which rav-
aged large parts of Europe and Scandinavia during
the mid 14th century.
The main focus of this study is to highlight the gen-
eral living conditions in Sigtuna through time. Based
on the grave material, the joint results of the archae-
ological and osteological investigations are combined
to answer the question of who lived and who were bur-

88 Acta Archaeologica
ied in Sigtuna. Secondarily, comparisons between the
broad temporal phases are made to investigate trends
in health and social structure. In theory the economic
and cultural development of Sigtuna affected the living
conditions of the inhabitants, which may be reflected in
the recovered osteological material. Thirdly, the socio-
economical aspects of the biological and archaeologi-
cal data are discussed with an attempt to use a stan-
dardized health index. This paper deals with archae-
ological material from excavations made on 11 differ-
ent occasions from 1983 to 1999 (nine rescue and two
research excavations). The total numbers of graves are
574 distributed between six churchyards and burial
grounds. The total number of examined skeletons (nΩ528) is less than the number of excavated graves due to
the fact that some recorded skeletons were left in the
ground or were in total decay.
INHABITANTS OF A CHRISTIAN
TOWNSCAPE – PREVAILING THEORY
The question about who lived and who were buried
in Sigtuna during the Late Viking Age and the
Middle Ages is complex. The simple answer, i.e. that
they were town-dwellers is not satisfying. The period
from the foundation of Sigtuna to the end of the
middle Ages is long. It covers more than 500 years –
the Catholic period – from the time of missionary
to the Reformation. During this time major social,
economic and cultural changes took place in the
society. For instance the 11th century Sigtuna was not
the same town as in the 13th century, which is the
time when the real urbanization took place in Sweden
and Sigtuna became a town among other towns.
Church organization and burial practices also de-
veloped and changed, making it necessary to discuss
whom the persons buried in Sigtuna really were.
Tesch (2000, 2001a) has suggested a four-phase
chronology for the development of the church top-
ography in Sigtuna. Petterson (1995) has presented
a separate three-phase development for the profane
buildings (1). However, the chronology of these two
1. The four-phase chronology for the development of the church
topography is divided as follows: 1) 980–1050, 2) 1050–1100, 3)
1080–1200 and 4) 1200–1350. The three-phase chronology for
the development of the profane buildings is divided as follows:
1) late 10th century, 2) 11th century, 3) 12th century.
development systems does not coincide. The division
of four development stages for the church topography
is not obvious in the grave material. Using morpho-
logical criteria such as stratigraphic analysis, signs of
mortar (i.e. indicate the presence of a stone church)
and the arm position of the buried, an allocation of
the graves into three burial phases were made. Fur-
thermore, the three phases are chronologically estab-
lished and verified through carbon dating.
BURIAL PHASE 1 (C. 980–12TH CENTURY)
The grave material and the finds from the settlement
area makes Sigtuna stand out as a fully Christian town
from the time of its foundation. The graves reflect the
fact that the main purpose behind the foundation was
to establish a powerful political stronghold in the Lake
Mälaren region for a new kind of kingdom based on
Christianity. About twenty Christian cemeteries (sw.
gravgård) (2) lay in a wide half-circle behind the settle-
ment. Graves from three of these burial grounds (the
block Nunnan) is included in the material examined in
this paper. One prevailing opinion is that there were no
wooden churches in the early town, before the middle
of the 11th century, and that there were no in the
countryside either. It was not necessary to have a
special sacred building when celebrating Christian
mass. Of importance was to have a sacred altar, with a
reliquary inside, to put a chalice and a paten on (Stolt
2001). Finds of sepulchral stones used in small portable
altars as cover for the reliquary suggest that mass was
celebrated in the hall building situated in the far end of
each town yard. The use of the hall as a room for Chris-
tian ceremonies was a transformation of the pagan use
of the chieftain’s hall as a central place for the cult.
(Tesch 2000, 2001a, 2005).
In the early town there were all together about 140
plots on both sides of a main street. A larger plot in
the centre of the settlement has been interpreted as
the kings’ yard (Tesch 1996). The plot boundaries laid
2. Throughout this paper a distinction has been made between
churchyard and burial ground. The term ‘‘churchyard’’ is used
were burials have been placed near a church, either a wooden
or of stone (sw. kyrkogård). The term ‘‘burial ground’’ is used
for burial areas without a church- (sw. gravgård) (Tesch 2000,
2001a). The term ‘‘cemetery’’ may denote both types of con-
texts. No pagan graves have been identified.
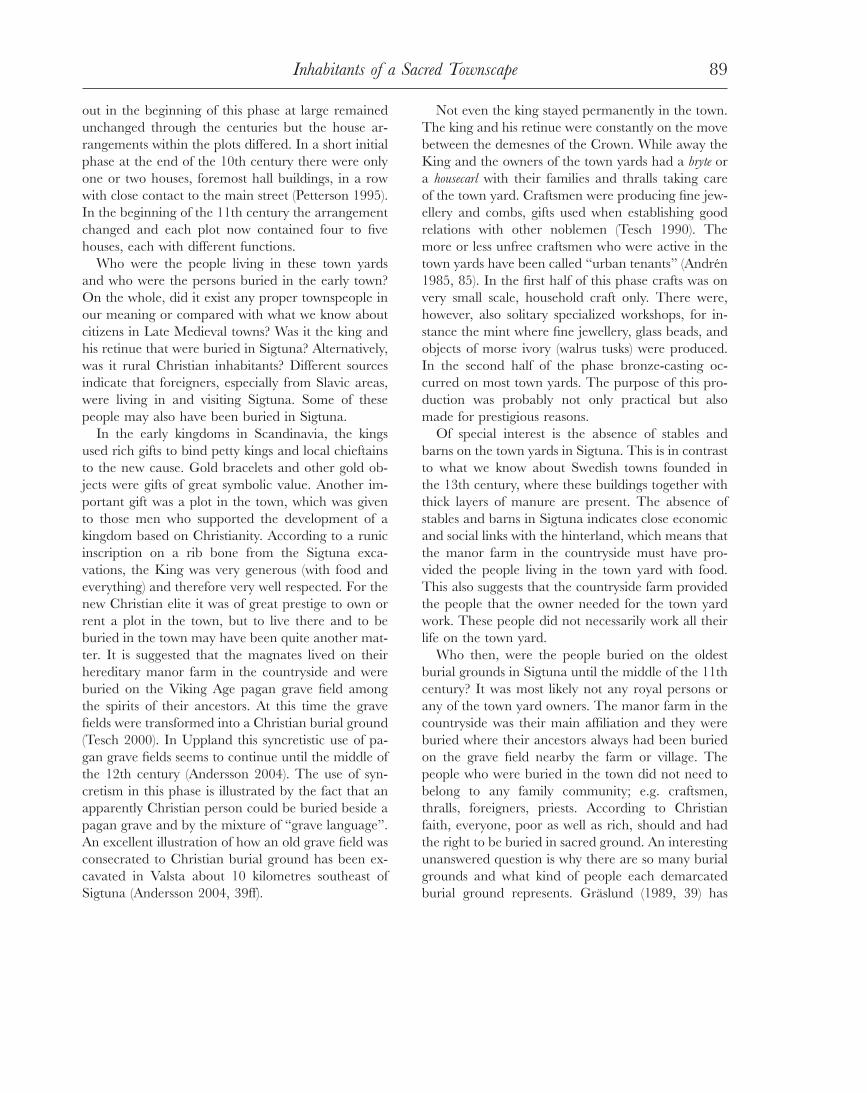
89Inhabitants of a Sacred Townscape
out in the beginning of this phase at large remained
unchanged through the centuries but the house ar-
rangements within the plots differed. In a short initial
phase at the end of the 10th century there were only
one or two houses, foremost hall buildings, in a row
with close contact to the main street (Petterson 1995).
In the beginning of the 11th century the arrangement
changed and each plot now contained four to five
houses, each with different functions.
Who were the people living in these town yards
and who were the persons buried in the early town?
On the whole, did it exist any proper townspeople in
our meaning or compared with what we know about
citizens in Late Medieval towns? Was it the king and
his retinue that were buried in Sigtuna? Alternatively,
was it rural Christian inhabitants? Different sources
indicate that foreigners, especially from Slavic areas,
were living in and visiting Sigtuna. Some of these
people may also have been buried in Sigtuna.
In the early kingdoms in Scandinavia, the kings
used rich gifts to bind petty kings and local chieftains
to the new cause. Gold bracelets and other gold ob-
jects were gifts of great symbolic value. Another im-
portant gift was a plot in the town, which was given
to those men who supported the development of a
kingdom based on Christianity. According to a runic
inscription on a rib bone from the Sigtuna exca-
vations, the King was very generous (with food and
everything) and therefore very well respected. For the
new Christian elite it was of great prestige to own or
rent a plot in the town, but to live there and to be
buried in the town may have been quite another mat-
ter. It is suggested that the magnates lived on their
hereditary manor farm in the countryside and were
buried on the Viking Age pagan grave field among
the spirits of their ancestors. At this time the grave
fields were transformed into a Christian burial ground
(Tesch 2000). In Uppland this syncretistic use of pa-
gan grave fields seems to continue until the middle of
the 12th century (Andersson 2004). The use of syn-
cretism in this phase is illustrated by the fact that an
apparently Christian person could be buried beside a
pagan grave and by the mixture of ‘‘grave language’’.
An excellent illustration of how an old grave field was
consecrated to Christian burial ground has been ex-
cavated in Valsta about 10 kilometres southeast of
Sigtuna (Andersson 2004, 39ff).
Not even the king stayed permanently in the town.
The king and his retinue were constantly on the move
between the demesnes of the Crown. While away the
King and the owners of the town yards had a bryte or
a housecarl with their families and thralls taking care
of the town yard. Craftsmen were producing fine jew-
ellery and combs, gifts used when establishing good
relations with other noblemen (Tesch 1990). The
more or less unfree craftsmen who were active in the
town yards have been called ‘‘urban tenants’’ (Andren
1985, 85). In the first half of this phase crafts was on
very small scale, household craft only. There were,
however, also solitary specialized workshops, for in-
stance the mint where fine jewellery, glass beads, and
objects of morse ivory (walrus tusks) were produced.
In the second half of the phase bronze-casting oc-
curred on most town yards. The purpose of this pro-
duction was probably not only practical but also
made for prestigious reasons.
Of special interest is the absence of stables and
barns on the town yards in Sigtuna. This is in contrast
to what we know about Swedish towns founded in
the 13th century, where these buildings together with
thick layers of manure are present. The absence of
stables and barns in Sigtuna indicates close economic
and social links with the hinterland, which means that
the manor farm in the countryside must have pro-
vided the people living in the town yard with food.
This also suggests that the countryside farm provided
the people that the owner needed for the town yard
work. These people did not necessarily work all their
life on the town yard.
Who then, were the people buried on the oldest
burial grounds in Sigtuna until the middle of the 11th
century? It was most likely not any royal persons or
any of the town yard owners. The manor farm in the
countryside was their main affiliation and they were
buried where their ancestors always had been buried
on the grave field nearby the farm or village. The
people who were buried in the town did not need to
belong to any family community; e.g. craftsmen,
thralls, foreigners, priests. According to Christian
faith, everyone, poor as well as rich, should and had
the right to be buried in sacred ground. An interesting
unanswered question is why there are so many burial
grounds and what kind of people each demarcated
burial ground represents. Gräslund (1989, 39) has

90 Acta Archaeologica
suggested that they reflect family- and lineage groups.
Another suggestion is that the burial grounds signify
different town-blocks or different districts from were
the town yard owners had their roots.
During the second half of phase 1, when Sigtuna
had become a bishop’s seat, there are some indirect
proofs of wooden churches in the town. Probably the
first one to be constructed was Church 1. After a few
decades it was replaced by a stone church. Bonnier
(1989, 11) thinks the supposed wooden cathedral
ought to have had considerable proportions, since it
should have had room for the Christian population
in the missionary diocese. A related theory is ema-
nating from the inscription on a runic stone found in
front of the high altar in St Peter’s in Sigtuna. The
stone is made of sandstone and has probably been
used as a grave-slab. It is dated to the last quarter of
the 11th century or to about the beginning of the
12th century. The inscription is fragmentary because
the edges have been cut away; ‘‘Sven ... carved the
stone ... who brought her to Sigtuna’’. The usual
interpretation is that Sven brought the remains of his
wife to Sigtuna to be buried on a Christian church-
yard. This is meant to reflect a time in the missionary
period when there were few churches, especially in
the countryside (Snædal Brink 1983). The interpreta-
tion could be right, but there are also several docu-
mented examples where Christian village people con-
tinued to be buried at nearby Viking Age burial
grounds until the middle of the 12th century. At this
time the earliest Romanesque churches were built in
the countryside. In addition, Christianity at this early
stage was a private matter and therefore mainly em-
braced the upper level of the society, the magnate
families and the farmers that erected rune stones. The
establishment of parishes was still far away, which
means that there was no immediate need for large
churches.
Of special interest when discussing the inhabitants
of Sigtuna, in both burial phases 1 and 2, is the im-
portance of the eastern contacts. Dynastic ties and
political alliances between the Swedish kingdoms and
Kiev Rus and west-Slavonic principalities is well testi-
fied. Swedish kings married the daughters of Slavic
princes and vice versa. Indeed, many rune stones tell
of journeys eastwards to both Gårdarike (Kiev Rus)
and Miklagård (Constantinople). The most persuasive
reasons for seeking fortune eastwards were based on
the acquirement of gold and other riches either
through trade or through service in the Kievan prin-
ce’s bodyguard or through service in the Eastern Ro-
man Empire. The old Icelandic sagas mention Sigtu-
na in connection to journeys to Gårdarike. It is thus
likely that a large part of the journeys eastwards from
mid-Sweden departed from, and returned to, Sigtuna.
Hence, it is not strange that Sigtuna is the site in
Scandinavia where most finds from 11th and 12th
century Rus and Byzantium have been excavated.
The intense interaction with Kiev Rus left a distinct
mark on the cultural pattern in Sigtuna. How should
these finds be interpreted? Were they just souvenirs
or gifts brought home or do they indicate Slavic im-
migrants? Imported late Slavonic vessels from Kiev
Rus came through the harbour area. Slavic potters
also worked in Sigtuna and native potters made hy-
brids in Slavic style (Roslund 2001; Tesch 2004).
Among the most interesting of these finds is a large
number of Volhynian spindle whirls. They are made
of a reddish slate from a quarry 10 km or so north-
west of Kiev. Only a few spindle whirls of this type
have been found in other parts of Scandinavia. One
possible interpretation is that the exotic objects ex-
press the very real presence of Slavic women in Sigtu-
na (Tesch 2004). Temple rings, found both in the
settlement area and in graves, can be interpreted in
the same way. Slavic Women and women from some
of the Baltic tribes used two temple rings as head
adornment with their outfits.
BURIAL PHASE 2 (C. 12TH–14TH CENTURY)
The kings’ power position in the lake Mälaren region
had varying success during the 12th century. The elite
was composed of magnate families loosely affiliated
through marriage alliances and family ties. The
church organization was weak and the members of
the elite exploited it. A strong ambition to express
power is demonstrated by the construction of all the
Romanesque stone churches in Sigtuna and the hin-
terland. Constructing a stone church was a large capi-
tal investment. For those who stood behind the
churches it were both a Christian and a worldly mani-
festation.
As mentioned above the first stone church to be

91Inhabitants of a Sacred Townscape
constructed was Church 1 c. 1080. During the 12th
century all the other churches were constructed along
a new street, parallel and north to the main street,
and in the same area as the line of burial grounds.
The church-topography reflects an intention to create
a sacred ceremonial townscape for ecclesiastical pro-
cessions. It also reflects the idea of the holy and heav-
enly city. All churches played a part in a lithurgic
drama where each church had its specific function
and ceremonial meaning.
Throughout the 12th century Sigtuna still was the
only town in the eastern part of Sweden. Each town
plot contained four or five houses in a row, but a
more specialized handicraft than previously started to
appear (Petterson 1995). The workshop close to the
main street on each town yard was replaced during
phase 2 by two small workshops, side-by-side. These
workshops are more like sheds. Here bronze casting,
black-smithing and especially comb-making were car-
ried out in large scale by professional craftsmen leav-
ing thick layers of waste, especially a large amount of
elk antler chippings (Petterson 1995). Probably these
craftsmen still were some kind of urban tenants. The
regular location of the Sigtuna churches, with 35 to
50 meters between each churchyard, alongside a new
stone paved street and the cathedral placed in the
absolute centre of the town was not only a manifes-
tation of power. It was also the result of a quite con-
scious plan to create a sacred townscape where both
God and King were honored. The town which orig-
inally had been planned for the need to express royal
power did now get a Christian signification (Tesch
2000, 2001a).
However, who were the people buried inside the
stone churches and on the churchyards? It seems
likely that the powerful families who constructed the
churches also were buried inside or at the south wall
of the church. In the Early Middle Ages only kings
and bishops were allowed to be buried inside a
church, but the patrons could be buried in the tower-
room. Though, it is uncertain if these rules were fol-
lowed. After some time the town example spread to
the hinterland and stone churches were constructed
by other powerful families, 4–5 miles from Sigtuna
which may have been the extension of the Sigtuna
diocese. The anonymous graves can not help us to
decide who the people buried in the phase 2 were.
Are they the same kind of people we have suggested
for phase 1? The answer could be both yes and no.
It still was people with some affiliation to the town
yard households that was buried in the town. In ad-
dition, by now there was also a good deal of prestige
connected with being buried in one of the Sigtuna
churchyards, at the kings’ church, or at the bishops’
church and so on. The people from the countryside
buried in Sigtuna was probably related or bound up
with the families that stood behind the stone church-
es. Most probably the phase 2 graves are more mixed
considering both the origin of the persons and their
social position. The construction of at least six stone
church also meant that there were a lot of specialists
in town for a good deal of phase 2; master-builders
organizing the work, stone masons, carpenters and
other craftsmen. Furthermore all these churches
meant a lot of priests engaged by the church-owners
to hold masses for family members who had died.
Most likely some of these people, e.g. craftsmen and
priests, also passed away in Sigtuna and got buried
on some of the churchyards.
In the beginning of the 13th century Sigtuna was
still a flourishing town with a strong religious and so-
cial position demonstrated in the foundation of a Do-
minican friary, a St George’s hospital and a royal
mint. Different factors suggest that Sigtuna continued
to have a strong position for yet another decade
(Tesch 2001a), but the town changed. As a conse-
quence of the 4th Lateran Council in Rome 1215
the parish organization was strengthened during the
course of the 13th century. Some of the private
churches were converted into parish churches. St
Laurence’s became the parish church for the towns
people, while St Peter’s and St Olaf’s became parish
churches for the surrounding countryside. St Nichol-
as’, later known as the ‘‘Old Russian church’’, re-
mained private until the Reformation (Bonnier 1989).
The other churches were torn down. This means that
the graves in the later part of phase 2 and also in
phase 3 from St Laurence’s, irrespective of phase and
church, are the only graves we clearly can determine
as belonging to town-residents. Whether they were
citizens or not is a harder question to answer. The
graves from the western part of St Olaf’s churchyard
can on the other hand have been countryside resi-
dents.

92 Acta Archaeologica
Fig. 1. The burial ground and churchyards mentioned in the pres-
ent paper. 1) The Block Nunnan 2) Church 1 3) Church 2 4) St
Laurence’s 5) St Olaf’s 6) Church 3.
BURIAL PHASE 3
(C. 14TH CENTURY – THE REFORMATION)
During this phase Sigtuna became a town in its
‘‘true’’ sense and like many towns in the Baltic Sea
Area it was dominated by the Hanseatic League.
However, the town experienced a decline, and stag-
nation, which seems to have started during the end
of the 13th century. In the 14th century, concurrently
with a general population decrease in Europe caused
by several plagues and climatic deteriorations, Sigtu-
na declined in population size and the town lost its
former status as an urban centre. Also the town yards
changed. The small workshop sheds facing the street
were now replaced by a rather large two-storey build-
ing with a shop on the first floor and storage and
living room on the second. The plot boundaries also
changed. Several town plots were joined together and
became wider, similar to the current town plan. After
the Swedish Reformation in A.D. 1527 several
churches were abandoned and left to decay and the
friary was completely torn down, except for St Ma-
ry’s, which became the church of the town parish.
Phase 3 differs from the earlier phases by the fact
that we now have access to some written sources. In
spite of the written sources we know less of this period
due to the fact that the archaeological material is very
sparse. The main focus at archaeological excavations
in Sigtuna has been on the timeframe 970–1300,
mostly because very little archaeological remains exist
from later periods and also because antiquarian au-
thorities have focused on the earlier periods.
Some of the written sources mention certain people
living in the town (3). For instance, it is known that
people belonging to the higher nobility still owned
town yards in Sigtuna, which means that at least some
of the original ownership pattern still was existing
(Schück 1926, 426). The Romanesque stone churches
were no longer of great interest for the families that
had stood behind the construction of the churches.
The focus was now on the Dominican Friars and
their huge brick-building project. Large donations
were given to the Dominicans in exchange for a
burial spot in the church or in the churchyard. For
instance, two archbishops and several magnates are
buried inside the church.
Individuals with varied professions are mentioned.
A ‘‘prefectus’’ Pavo, the kings’ bailiff is mentioned
1274. He was also one of the burghers. In a testament
from 1298 two witnesses, two ‘‘domini’’ (i.e. members
of the city council) are mentioned; Johannes Saxi and
Godica scalli (the bald) both of them Germans. By
further mentioning of German domini we can draw
the conclusion that German burghers dominated the
city council in Sigtuna about 1300.
CHURCHES AND BURIALS –
PRESENTATION OF THE ARCHAEOLOGICAL
GRAVE MATERIAL
There were among eight to ten churches in Sigtuna
during the middle ages (Fig. 1), (the first time men-
tioned in written records in parenthesis); St Peter’s (St
Per, 1220), St Mary’s (Mariakyrkan, the Dominican
friars church, 1237), St George’s (St Göran, hospital,
1278), St Olaf’s (St Olof 1286), St Nicholaus (1304)
and St Laurence’s (St Lars, 1311). From archaeologi-
cal excavations we know of at least two additional
churches, Church 1 in the block St Gertrud and Ur-
makaren and Church 2 in the block St Nicolaus. Fur-
thermore, Churchyards have been discovered in the
blocks Magistern and Kållandet but the associated
churches have not yet been located.
3. In phase 1 and 2 runic inscriptions on rune-stones and on bones
gave us a lot of names, but we don’t know what position they
held in the town and if they lived there permanently.

93Inhabitants of a Sacred Townscape
In spite of the fact that archaeological excavations
have been carried out in Sigtuna since the late 19th
century our knowledge about the sacred townscape
are in some cases still sparse (until now about 350
archaeological excavations have been carried out).
The dating of and function of the churches are still
discussed (Tesch 2000, 2001a; Wikström 2005). One
reason for the ongoing debate is that few archaeologi-
cal excavations have been carried out in the churches.
On the other hand, more excavations have been car-
ried out on the churchyards and until now over 500
graves have been examined. However, as shown in
table 1 the distribution of excavated graves is mark-
edly unequal among the churchyards. The church-
yard in the block Kållandet only consists of four
graves and is therefore combined with Church 2. An
approximate calculation of the total area of all the
churchyards gives a number between 25,000 and
35,000 m2. Based on archaeological results there were
between 1,1 and 1,3 burials per square meter, indi-
cating that 25,000 to 45,000 people may have been
buried in Sigtuna approximately from 980–1530.
This number can be compared with the total number
of excavated graves from the eleven excavations, 574
graves; which is only 1 or 2 percent.
GRAVE- AND CHURCHYARDS IN SIGTUNA
The Nunnan block: The excavation results from the
Nunnan block are the best known example of how
burial grounds looked like. The graves are widespread
almost without any overlapping graves. So far no de-
limitation of a burial ground has been found, but at
least three different groupings can be discerned (Fig.
2). The size of a single burial ground is about 800 to
900 m2. Some of the graves have been dated from
coins, from the late 10th century until the middle of
the 11th century.
Church 1: Excavations show that the stone church
was constructed already in the latter half of the 11th
century, which makes it one of the oldest in the
Mälaren area (Tesch 2001a, 9ff). A wooden church,
probably constructed in the middle of the 11th cen-
tury, preceded the stone church. The results also show
that the stone church was torn down around late 13th
century or in the beginning of the 14th century. The
early destruction of the church may explain the lack
Fig. 2. The distribution of graves in the burial ground at the Nun-
nan block.
of written medieval records naming or describing it.
The stone church is 28 meters long and 12.4 meters
wide with an apse. In the western part there was
probably a crypt. The delimitation of the churchyard
is unusual in shape and surrounds an approximately
2000 m2 large area (Fig. 3). The excavated graves
come from the south (1993 and 1995), southeast (Ur-
makaren 1991) and northwest (1983) part of the
churchyard close to the church.
Church 2: In the St Nicolaus block in Prästgatan
about a hundred graves where excavated in 1991–
92. Fragments of what are considered to be the re-
mains of the ground wall to the southern wall of the
nave were discovered. The grave material suggests
early medieval graves at both a stone church and an
older wooden church. There are also indications of
even earlier graves from a burial ground. The re-
sults suggest that the stone church was torn down
already during the late 13th century. The stone
church was probably constructed in the late 11th
century or in the beginning of the 12th century. The
delimitation of the churchyard has been established
(Wikström 2005, 10f). The size of the churchyard

94 Acta Archaeologica
Fig. 3. Grave zones (A–C) and distribution of graves at the church-
yard of Church 1.
can hereby be calculated to approximately 2200 m2.
The excavated trench probably stretches from west
to east south of the church. The presence of a
church in the Kållandet block is indicated by a
churchyard. Four graves where found at the exca-
vation of Prästgatan in 1991–92. The arm positions
in the graves indicate that the churchyard is from
the early Middle Ages.
St Laurence’s: Today only the western tower is visible
above ground, however, a part of the northern wall
of the nave is indicated as a raised mound above
ground level. The plan of the stone church shows a
western tower, a nave and a straight apse. A rune
stone with preserved paintings have been found in the
masonry, which suggests that the church was con-
structed in the early 12th century (Bonnier 1987, 21)
although this date has been questioned (Redin 1997,
598; Tesch 2000, 22). The excavated graves come
from the southeastern and southern part of the
churchyard near the church. The delimitation and
size of the churchyard is difficult to establish, but is
probably around 6000 m2, and thereby one of the
largest in Sigtuna.
St Olaf’s: St Olaf’s has been excavated in 2001,
2002 and 2004. The results showed that the area in
an initial stage (c. 980–1050) was a burial ground, but
a wooden church was probably constructed later (c.
1050–1075). The wooden church was later replaced
by stone churches (Stone church I founded about
1075, Stone church II founded in early 12th century
to the reformation). The excavated graves are located
in the south-western part of the churchyard. The size
of the churchyard has been estimated to 4500–5000
m2.
Church 3: In the Magistern block, excavated in 1992
and 1998, the presence of both a wooden church and
a stone church is suggested by graves with and with-
out mortar in the filling (Wikström and Kjellström
2005). The positions of the arms indicate that church-
yards have been used both in a short period in the
early middle Ages and later on in high- and late
middle Ages. The excavated graves are located south
of the possible churches. The size of the churchyards
is approximated to 4000 m2 or less.
THE GRAVE MATERIAL – STRATIGRAPHIC ANALYSIS
Even though the Sigtuna graves were excavated ac-
cording to traditional methods the principle of single
context was used during the stratigraphic analysis of
the grave material (Harris 1997, 66 Fig. 24). Hence,
the total grave material was uniformly handled. Due
to some limitations of documentation the grave cut,
skeleton and the fill of the grave were treated as one
context and labeled according to the grave identifi-
cation number during field work. The stratigraphical
relation between graves could in many cases be estab-
lished through disruptions of older graves by younger
graves. The stratigraphic analysis resulted in a grave
matrix for each excavated site, which facilitated the
grouping of the graves into three chronological phases
(Wikström 2005). The three main criteria considered
for the allocation were: 1) the stratigraphic analysis,
2) signs of mortar (i.e. indicate the presence of a stone
church) and 3) the arm position of the buried (Redin
1976; Kieffer-Olsen 1993). The grave distribution for
each phase is presented in table 2. Since three of the
four churchyards no longer were in use in phase
three, there is a strong overrepresentation of graves
from phases 1 and 2.

95Inhabitants of a Sacred Townscape
PHASES AND DATING
Since the grouping of the grave material in phases is
based on criteria that can be considered relative to each
other, it is difficult to specify a chronological span for
each phase. The stone churches were not constructed
at the exact same time and the dating of some of the
churches is vague. The time differences are, however,
short, and general comparisons between the different
grave materials should not be affected. Since the year
2000 96 skeletons (18% of the total material) have been
carbon dated (Ua17743–17750, Ua21858–21869,
Ua22702–22741, Ua23198–23237). The results were
used to verify the phases and in four cases rearrange the
graves from one phase to another.
BURIAL PRACTICES
The knowledge about the medieval burial practice is
well recognized both archaeologically and historically
(e.g. Nilsson 1987, 1989, 1994; Kieffer-Olsen 1993;
Chintio 2002). According to written records there
were normative regulations connected to social rank
determining the spatial distribution of the buried
(Andren 2000). However, since the churchyards in
Sigtuna only have been partially explored these regu-
lations can only be presumed. Compared to other
grave materials, e.g. Lund, the archaeological grave
material from Sigtuna is rather sparse. In general this
is due to poor preserving conditions. Very little or-
ganic materials are preserved. Distinctions between
different types of wooden coffins are difficult to make.
Though, the Christian burial practices in general
were homogenous. However, there are some features
that can be compared between the different church-
yards and burial grounds; first, the form and material
of the grave, second, the presence of charcoal and
third, the grave goods. These features can be used to
study differences in burial practices and possible so-
cial stratifications both between the churchyards and
within the churchyards.
Grave types: A total of 240 (42%) graves had traces
of a wooden coffin, either through the presence of
iron nails or wooden remains (mostly only heavily de-
composed wooden fibers). The frequency among the
phases is equal, but differs between the cemeteries
(Tables 3 and 4). Only one brick coffin has been dis-
covered, at Church 2 in phase 2. No other types of
coffins have positively been identified. Finds of burial
stones i.e. stones or brick stones placed close to or
around the buried person (Kieffer-Olsen 1993, 143f),
have been found in 28 graves with an equal distri-
bution between the phases. If the stones have been
placed in an ordered position the most common loca-
tion was around the head, followed by both feet and
head.
Charcoal in graves: Charcoal in the grave have been
used as an indication of some symbolic meaning con-
nected to cleansing of the soul and high social status
(Kieffer-Olsen 1993, 166). Of all excavated graves 28
(4.9%) had charcoal at the bottom of the grave and,
except for two graves, all belonged to phase 1. Not-
able is that the majority (18 graves) comes from the
burial ground in the Nunnan block and the rest were
discovered at four churches (five graves from Church
3, four graves from the Kållandet block, one grave
from Church 2 and one grave from St Laurence’s).
Grave goods: Objects were recovered from 77 graves
(13%) (Table 3). The distribution of graves with ob-
jects or grave goods is rather even between the phases
and between the churchyards and burial grounds.
However, notable objects, clearly belonging to the
buried, are jewelry of Slavic types. One individual at
Church 2 (phase 2) had two temple rings and a brace-
let, both made of bronze. Another temple ring in
bronze has been found in a grave at St Laurence’s
(phase 2), and a temple ring in silver has been found
in a grave at Church 3 (phase 1). Slavic influences are
also seen in a grave at Church 2 where a stone circle
surrounded the diseased, which are considered to be a
Slavic type of burial practice (Juri Leseman, personal
communication). Other examples of grave goods are
beads, silver coins, knives, needles, and whetstones
and a comb.
In summary, the Sigtuna graves reflect an urban
Christian burial system where few graves distinguish
themselves and poor preservation affects the graves
and the general archaeological context.
THE OSTEOLOGICAL ANALYSIS
In the present study all Sigtuna skeletons (nΩ528)
were examined and documented in the same consist-
ent manner, irrespective of earlier osteological analy-
ses of some of the samples. Each skeletal element was
96 Acta Archaeologica
dry brushed except for details such as pathological
changes or teeth, which were rinsed in water. The
skeletal gross morphology was examined and regis-
tered.
ANTHROPOLOGICAL METHODS
For age assessments several methods were applied.
For young individuals epiphyseal fusion was regis-
tered according to Brothwell (1981) and Scheuer and
Black (2000). Dental development was documented
after Ubelaker (1989) and long bone length without
epiphyses according to Stloukal and Hanakova
(1978). Adult age assessment on the pelvis was based
on works by Brooks and Suchey (1990) and Meindl
and Lovejoy (1989). In addition, ectocranial suture
closure was noted on the crania (Meindl and Lovejoy
1985) and dental attrition was registered according to
Brothwell (1981). All individuals were divided into
age groups (InfansΩ�0.9 year, Infans IΩ1–5 year,
Infans IIΩ6–11 years, JuvenilisΩ12–18/23 years,
AdultusΩ20–39 years, MaturusΩ40–59 years, SenilisΩ60π, AdultΩ20π).
Mean age at death was estimated to facilitate both
intra- and later inter material comparisons based on
assessed skeletal age of all individuals from each
chronological phase or the entire sample. To make
estimates of birthrate the Buikstra ratio, i.e. deaths
ages 30 years and over divided by deaths ages 5 years
and over (d30π/d5π), were calculated (Buikstra et al.
1986; McCaa 2002). According to Buikstra and col-
leagues (1986) changes in the D30/D5 measure indi-
cate birthrate changes, which is of interest in the pres-
ent study. An increased number of births result in a
decrease in the proportion of d30π/d5π. In the pres-
ent study the term subadults denotes all individuals be-
low 15 years of age.
Sex assessments were only performed on adult indi-
viduals (i.e. with fully developed pelvis or signs of den-
tal attrition on the second molar). The assessments of
sex were based on morphological features on the pel-
vis and skull (Buikstra and Ubelaker 1994; Bruzek
2002; Kjellström 2004). In addition, sex discriminat-
ing measurements of the femora (the bicondylar
width and vertical diameter of the head) and humeri
(vertical diameter of head) were used (after Pearson
1917–19 and Stewart 1979 presented in Bass 1987).
A detailed analysis of the sex assessments in Sigtuna
has been presented previously (Kjellström 2004).
Stature estimations on long bones were calculated
from left side femora (substituted by the right side
when needed) using regression formulas presented by
Trotter and Gleser (1952, 1958) and Sjøvold (1990).
OSTEOLOGICAL HEALTH AND A STANDARDIZED
HEALTH INDEX
To recognize possible differences in human health be-
tween cemeteries of different chronological phases
and between cemeteries from the same time period
various health indicators were examined. In the pres-
ent study the definition of skeletal stress by Goodman
and Martin (2002, 12) as ‘‘a measurable physiological
disruption or perturbation that has consequence for
individuals and populations’’ is used. In order to fa-
cilitate comparisons between temporal periods an
attempt was made to apply a health index with seven
pooled osteological health indicators. A health index
has previously been used in the analysis of the quality
of life of more than 12,500 individuals from 218 ar-
chaeological sites (later combined to 65) in North,
Central and South America dated between 4000 BC
and the early 20th century (Steckel and Rose 2002;
Steckel et al. 2002b). In the project, called ‘‘the West-
ern Hemisphere project’’, seven indicators demon-
strating fluctuations in the quality of life were used.
These indicators were: 1) degenerative joint disease
(DJD), 2) trauma, 3) dental health (caries, antemort-
em tooth loss and abcesses), 4) stature, 5) anemia (po-
rotic hyperostosis and cribra orbitalia), 6) enamel hypo-
plasias, and 7) skeletal infection. The seven indicators
reflect different aspects of the quality of life of both
subadults and adults (for a review see Larsen 1997;
Goodman and Martin 2002). All of the variables in
different combinations, have been applied in other
anthropological studies in order to investigate the
health status of skeletal populations (e.g. Cohen and
Armelagos 1984; Arcini 1999; Sellevold 2001; Had-
uch 2002; Jankauskas 2002). However, inconsistencies
of methods, small sample size or even contradictory
results have sometimes made interpretations difficult.
The advantage with a standardized health index is
that it is a multiattribute system. The index takes into
consideration the quality of health of the individuals

97Inhabitants of a Sacred Townscape
subdivided into six age groups whose influence on the
total health index are adjusted according to the age
distribution to a reference population (Model West
level 4 life table) (cf. Steckel and Rose 2002a, 68).
Hence in addition to individual variables of skeletal
health, a single measurement of the general health
status is presented which according to Steckel and
Rose (2002a) may be interpreted as a measurement
of the quality of life. Applying the health index on the
Sigtuna skeletal material offers a possibility to com-
pare the quality of life during three chronological
phases as well as between individuals from the differ-
ent churchyards.
The demographic data and indicators of stress
were all registered and classified according to the sys-
tem from the Western hemisphere database presented
by Steckel and colleagues (2002a). The data was pro-
cessed using the FORTRAN software that Steckel
and colleagues developed and made available for us.
A summary health index was presented for, the entire
Sigtuna population, each chronological phase, the
separate cemeteries and also divided by sex.
THE OSTEOLOGICAL RESULTSDEMOGRAPHY
Sex and age: A total of 310 individuals (59%) exhibited
at least one sex discriminating trait (Table 5)
(Kjellström 2004). There is in general a strong male
predominance in Sigtuna (64.2% men versus 35.8%
women) and the sex distribution is similar in all
phases. The highest frequency of women was, how-
ever, observed in the oldest phase of the town.
A total of 445 individuals (84%) could be age as-
sessed and of these were 173 (32.8%) younger than
about 20 years of age (Tables 6–7). The age group
distributions of the different phases are rather similar.
Phase 1 exhibits comparatively more individuals in
the group ‘‘adultus’’ (Table 6). Phase 2 demonstrates
a higher frequency of individuals in the groups ‘‘in-
fant’’, and ‘‘maturus’’ than the other two phases.
Phase 3 shows the highest frequencies for the age
groups ‘‘infans I’’, ‘‘infans II’’, ‘‘juvenilis’’.
In Table 7 the increasing proportion of subadults
through time is shown together with estimates of
birthrate i.e. the Buikstra ratio. This suggests that
the birthrate was lower in phase 2 than in phase 1.
In phase 3, although the sample is small, this trend
again seems to be reversed into a higher frequency.
The interpretation of higher birthrates, consequently
more infants prone to die, in the latest phase is in
accordance with the decline of the total mean age at
death.
To investigate possible effects relating to burial cus-
toms on the skewed sex representation a detailed
study of three different grave zones at the largest cem-
etery Church 1 was carried out (Fig. 3). The analysis
revealed that zone A (northwest of the church) in both
phase 1 and 2 demonstrates comparatively more fe-
male graves than the other two zones. Zone C (in
southeast) lacks female and subadult graves in phase
1 but shows a small proportion of women in phase 2
(Tables 8–9). No other spatial groupings of subadults
were seen. A comparison of the graves at the cem-
eteries Nunnan, Church 2 and St Laurence’s, showed
no spatial grouping according to sex and age (Tables
10–12). The complete lack of women in Church 3 is
believed to be associated to poor preservation at this
site. Since only sections belonging to the southern
part of the churchyards have been excavated at
Church 2 and St Laurence’s it may be difficult to rule
out that there were tendencies to separate burials of
women and men in these churchyards. A spatial sep-
aration according to sex, presumably connected to
early Christian traditions (Nilsson 1994), has been ob-
served at other medieval cemeteries in Sweden (e.g.
Gejvall 1960; Chinthio and Boldsen 1984). All to-
gether, except for the churchyard at Church 1, no
clear patterns of segregation between the sexes or age
groups were seen.
HEALTH STATUS
Adult stature: The mean stature using the method by
Trotter and Gleser (1952, 1958) is 173.7 cm for men
and 160.8 cm for women (Table 13). There is a de-
cline in mean stature for women from phase 1 to
phase 2. Only one measurement is available for
women in phase 3. A similar trend is not as apparent
for men although the men are shortest in phase 3.
Enamel Hypoplasias (LEH): The number of individ-
uals affected by LEH is higher in phases 2 and 3 than
in phase 1 (Table 14). Particularly the permanent

98 Acta Archaeologica
teeth demonstrate higher frequencies in the second
and third phase.
Dental status: The proportion of adults with one or
more caries lesions is presented in Table 15. The
caries frequency is almost the same between phase 1
(39.6%) and 2 (39.4%). In phase 3 the frequency of
caries has risen to 50%. Women exhibit higher fre-
quencies than men. Ante-mortem tooth loss in fe-
males, in large also indicative of severe caries or ab-
cessing, shows markedly increasing frequencies from
phase 1 to phase 2 and 3 (Table 16). The frequency
for males is lowest in phase 2.
Cribra orbitalia: Higher frequencies of affected suba-
dults than adults are demonstrated in all phases
(Table 17). The frequency for children is lower in
phase 2 compared to phase 1, while it is raised among
adults. Owing to this the total proportion of individ-
uals with cribra orbitalia is lower in phase 1 (10.2%)
than in phase 2 (16.0%). In phase 1 women were the
most affected although the sample was small.
Infection (TPF): In Table 18 the proportion of indi-
viduals with periosteal lesions on the tibia is pre-
sented. The frequency of tibial infections is elevated
from 4.4% in phase 1 to 11.1% in phase 3. The suba-
dult individuals did not display any signs of periostal
lesions on the tibiae. In phase 1 only men were
affected. In phase 2 and 3 both sexes exhibit affected
tibiae almost to the same degree.
Excluding tibial infection, the general frequency of
skeletal infection (INF) is the same in phase 1 as in
phase 2 with higher proportions in phase 3 (Table
19). Interestingly, women experience an increase from
phase 1 and 2 while the male trend is somewhat posi-
tive.
Degenerative joint disease (DJD): In Table 20 the pro-
portion of adults with DJD at various joints is pre-
sented. The distribution of DJD varies widely be-
tween the sexes. The most deviating observations
were in the hip and the knee joints, where women
display higher DJD frequencies than men, and in the
thoracic vertebral region where men were more
affected than women. The number of affected indi-
viduals subdivided into different phases and skeletal
regions is sometimes limited and difficult to interpret.
There is a slightly higher incidence of DJD in the
larger joints (such as the shoulder/elbow and hip/
knee) and possibly the lumbar vertebrae in the later
phases. Meanwhile DJD in cervical and thoracic ver-
tebrae for the same period demonstrate lower fre-
quencies in the latter phases.
Trauma: The proportion of adults with trauma is
shown in table 21. Except for weapon related frac-
tures no temporal or direct sex differentiating differ-
ences of trauma are to be seen. In phase 1, 7.2% of
the adults exhibit signs of weapon related trauma in
comparison to the lower frequencies in phase 2 (2.2%)
and phase 3 (3.3%). Except for four women exhibit-
ing weapon wounds in phase 1, all other affected indi-
viduals were men (nΩ12).
The health index: When combining the above-de-
scribed traits into a health index for the Sigtuna
population, the result is 83.2% (Table 22). Some gen-
eral trends are observed by comparisons between the
phases. The overall health index becomes successively
lower from phase 1 to phase 3 (the Quality adjusted
life years (QALY) 22.2–20.7 or 84.0% to 78.5%).
When sex is taken into consideration the results dem-
onstrate a QALY-value, which in general is lower in
the latter phases, and particularly the women score
lower than men (Table 23).
When the sites are compared the highest index is
observed at the cemetery of the Nunnan block and
the lowest frequency at the churchyard of St Olaf’s
(Table 24). Among sites represented by skeletal assem-
blages no cemetery demonstrates a higher frequency
from phase 1 to phase 2. However, in both Church 3
and St Laurence’s the frequencies in phase 3 are
higher than in phase 1.
DISCUSSION OF THE OSTEOLOGICAL
RESULTS
Describing the life of the inhabitants of medieval Sig-
tuna using osteological data is complicated. Several
factors, like sample size and preservation, affect the
representation of the sample reducing the possibilities
for interpretations. Admittedly the size of the sample
is small considering that six cemeteries and three long
chronological phases are represented. One cemetery
(St Olaf’s) contains nine individuals and phase 3 con-
sists of only 38 skeletons. Some of the skeletons are in
a very poor state and in some aspects the data are
not unequivocal and sometimes even contradictory.
Nevertheless, in light of the archaeological and the

99Inhabitants of a Sacred Townscape
historical sources, the osteological remains of the in-
habitants of Sigtuna have been brought to ‘‘life’’. The
utilization of a health index has facilitated the inter-
pretation of the health status of the people. The re-
sults show a generally negative health trend where the
quality of life in Sigtuna declined through time. This
trend is evidently more marked for women whose
stature declined in combination with increased fre-
quencies of infection while at the same time men had
to endure more marked frequencies of cribra or-
bitalia.
CHILDHOOD HEALTH
Pathological traits such as cribra orbitalia, enamel hy-
poplasias and stature highlight childhood health in
Sigtuna. Cribra is mainly to be found in younger
children (Aufderheide and Rodreiguez-Martin 1998,
349). The results of the Sigtuna study suggest that
children lived under rather harsh circumstances. For
boys the situation seems to have gotten worse through
time. On the other hand, as shown in table 25, lower
mean stature and higher incidence of enamel hypo-
plasias indicates that girls, to an even greater extent
than boys, suffered from stress at least during the
years of tooth development i.e. during approximately
the first seven years of life. Both the incidence of crib-
ra and LEH demonstrate that the children endured
periods of stress. The lack of tibial periostal reactions
among children may seem surprising. This suggests
that the cause of the skeletal lesions differed between
cribra orbitalia and LEH on one hand and infections
on the other. Alternatively, with reference to the oste-
ological paradox (Wood et al. 1992), it could imply
that some children died before exhibiting any signs of
infectious diseases. The combination of poor diet and
infections may lead to early death.
In Sigtuna the imbalanced sex distribution among
individuals with LEH got even larger and the factors
leading to enamel lesions increased in number or got
more intense through time. The increase of LEH for
both sexes is more obvious for permanent teeth,
which imply that also older children suffered from
stress. Apparently, during the initial phase the girls
suffering from stress to a higher degree than boys.
With time, more children were born and raised in the
town leading to a general increase of cribra and LEH
for both sexes, but still more marked for girls. This
could be associated to the negative trend in stature
for adult females.
The reason why children suffered from stress re-
lated changes may be connected to poor nutrition in
addition to a more frequent exposure to infection and
parasites in an urban environment. The absence of
infections in children suggests that diseases seldom
reached a chronic state. The osseous material implies
that mainly adults survived long enough for bone
changes to occur. The demonstrated risen frequency
of non-specific infections is elevated in the latter
phases in Sigtuna. The negative trend in childhood
health can be connected to intensification of the ur-
ban character with more densely populated streets
implied by the archeological context.
ADULT HEALTH
An increase of anemia related lesions and infections
in general suggest that the immune system of a popu-
lation has decreased, which in turn may have had
work-functional consequences (cf. Goodman and
Martin 2002, 30). Behavioral or activity related alter-
ations are also highlighted by skeletal changes such as
DJD and trauma. However, the deviating outcome
from the study of DJD and trauma in Sigtuna are
intriguing. The proportions of adults with DJD in la-
ger joints and lumbar vertebras increase meanwhile
the frequencies of cervical and thoracic DJD decrease
with time. This indicates changes in the physical labor
and possibly a heavier workload. The somewhat dif-
ferent distribution of DJD between the sexes indicates
gender related differences in physical labour.
The small sample size most probably affects the
frequencies of trauma rendering the results difficult to
interpret. It is obvious when excluding the mass grave
in phase 1, that no women with clear weapon related
lesions can be identified. Obviously, the mass grave
represents one occasion of unusual violent trauma.
The decreased dental health through time in Sigtu-
na may be associated with a change in diet, i.e. prob-
ably food rich in carbohydrates regarded a common
cause of dental caries. Regarding caries (in phase 1
and 2) and ante mortem tooth loss (in phase 2 and 3)
a prevailing female dominance is observed indicating
gender related differences in diet.

100 Acta Archaeologica
Exploring the difference between the sexes con-
cerning the varying traits, a society apparently favor-
ing men is discernable. Most of the stress indicators
(mean age at death, stature, LEH, caries, ante mort-
em tooth loss and non specific infections) imply that
women more often than men were subjected to
greater amount and (or) more intense, stress as re-
flected in higher frequencies of these traits.
All together, the examined health indicators imply
a successive deterioration of health through time in
Sigtuna, most obviously from phase 1 to phase 2, i.e.
a change in living environment. This could be associ-
ated to the establishment of a true urban settlement
in phase 2. The data for phase 3 suffers to some ex-
tent from the small sample size but a general trend is
still discernable. Except for weapon related injuries,
(as mentioned above affected by the results from the
mass grave), no obvious positive trends in health are
discernable. Considering that the health deteriorated
and showed a negative trend through the phases,
some effects on the demography have to be expected.
The sex distribution in Sigtuna is distorted with more
men than women, which initially could be associated
with the presence of the royal power. The distribution
of age groups demonstrates, however, that complete
families, i.e. both sexes of all ages, lived in the town.
The mean age at death depicts a rather young
population. Paradoxically, the proportion of infants
increases in phase 2 while, according to the Buikstra
index, the birth rate was lower compared to phase 1.
The birth rate index of the churchyard at Church 2,
consisting of 61.9% individuals below 20 years of age
showed the same result with lowered birth rate in
phase 2 was (from 0.277 in phase 1 to 0.424 in phase
2). An increased immigration of adults to Sigtuna
would lead to proportionally more adults than
children, but still allowing for greater amounts of
children to be born.
Since the health index value is the result of a more
holistic process than merely comparing the relative
frequency of traits, and includes adjustment for age,
the results are even more complex. The general out-
come of the health index shows the same negative
trend with time as the separate variables discussed
above. However, the age adjustment applied when
calculating the index value for dental health (caries
and tooth loss), infection (tibial periosteal reaction and
infection of the rest of skeleton), seems to have raised
the index value for these variables. The generally low
index value of stature shows that the medieval popu-
lation is shorter than the modern standard (cf. Maresh
1955) used to calculate the index. When comparing
different sites the results shows, in agreement with the
temporal trend, that old cemeteries in general exhibit
higher index values than later ones. However, the
small sample size of some materials makes a reliable
interpretation difficult.
As pointed out by the developers of the health
index (Steckel et al. 2002a), the method is not without
flaws. As in most other paleopathological research,
only diseases that leave traces in bones or teeth are
registered. The possible etiology for some of the indi-
cators may be hereditary or genetic and not always
connected to nutrition and general public health
issues. Preservation is a problem in all anthropological
studies making the utilization of a health index on an
individual level unsuitable. The health index can be
seen as a tool for comparisons of skeletal health in
different assemblages. It is suggested that the use of
multiple skeletal stress indicators may highlight as-
pects of the osteological paradox (Wood et al. 1992), i.e.
the hypothesis that the frailest individuals actually
were not strong enough to develop bone lesions. The
lesions could in fact be seen as signs of relatively good
health. Thus, the results from Sigtuna could be inter-
preted in two different ways, (1) The quality of health
improved with time, especially for women and children,
or (2) The quality of health got worse with time, espe-
cially for women and children. However, the health
index points in the direction of the latter. It is sug-
gested that increased immigration and the resulting
population density in Sigtuna affected the health of
the town people, possibly to the worse. In spite of the
negative trend presented in the study, the age distri-
bution in respective phase is in large U-shaped, i.e.
most often referred to as ‘‘attritional’’ or normal mor-
tality by bioarchaeologists (cf. Lyman 1996, 118). In-
dividuals in the most susceptible age groups such as
the youngest and the oldest were more prone to die.
In the American project each site was ranked ac-
cording to the health index and comparisons were
made between sites (Steckel and Rose 2002 table 3.3).
If Sigtuna were to be included and ranked among the
American sites, it would have shared the sixth place

101Inhabitants of a Sacred Townscape
from the top of a total of 65. The Sigtuna index is e.g.
higher than for a middle class cemetery in Belleville,
Ontario, in central Canada, dated to the nineteenth
century (Saunders et al. 2002). In comparison the
early medieval population in central Scandinavia ex-
perienced a comparably high quality of life. Naturally
there are great varieties of factors that deviate be-
tween Sigtuna and the American assemblages. Never-
theless, in the extensive American study, individuals
dated from 4000 B.C. to the 19th century, and deriv-
ing from variety of environments are compared and
discussed. Presently no studies applying health indices
are available in Scandinavia.
CONCLUSION OF THE ARCHAEOLOGICAL
AND OSTEOLOGICAL ANALYSES
The archaeological and osteological results coincide
in several areas. Though source critical factors may
be applied to each discipline, both the joint and sep-
arate results show the same tendencies.
Signs of social ranking are suggested archaeologic-
ally by differences in burial practice (i.e. presence of
coffins and burial stones). Differences are exposed be-
tween the cemeteries in each burial phase (Table 3
and 4). In the Nunnan block the many graves with
coffins and the 18 graves (c. 64% of total) with char-
coal imply a more elaborate way of burial practice.
The smallest amount of graves with coffins (and only
one with charcoal) is excavated at St Laurence’s and
are from all three phases. This could imply that those
buried in the Nunnan block had a higher social rank
compared to those buried at St Laurence’s. The oste-
ological results show that the general health was
better in the Nunnan block and that the women at
this site had the highest mean stature of all the
women in the study. It is clear that more men than
women and more adults than subadults were buried
in coffins, at least in phase 1 and 2 (Table 26).
Already in phase 1 artifacts suggesting foreign con-
tacts appear in the burials. In phase 2 the artifacts
indicate a peak in the contacts with Kiev Rus and
Bysans. Furthermore, the foundation of the stone
churches and other institutions highlight the varied
presence of craftsmen and clergy. The decline of Sig-
tuna is seen in both archaeological and written rec-
ords in phase 3, implying a decrease in population
due to political as well as general crises of the 14th
century. The osteological analyses verify the archae-
ological results in that an increase of adults is shown
from phase 1 to phase 2. Moreover, a deterioration
of health, as suggested by the health index, indicates
a more densely populated town. Thus, immigration,
both from the hinterland and abroad, to Sigtuna in
phase 1 and 2 is most likely.
Few associations to health related issues could be
made through the archaeological material. The nega-
tive health trend seen in the osseous material is on the
other hand demonstrated through several parameters.
However, both the osteological and the archaeologi-
cal material suggest that changes in workload emerge
in phase 2. It is suggested that this change is due to
a more specialized handicraft. Thick layers of waste
from professional craftsmen are common in phase 2.
The emergence of master builders, stone masons, car-
penters and priests are demonstrated by the extensive
construction of stone churches during phase 2, which
also might be implied by more elaborate and different
coffin types such as those made by brick. This, again,
is a strong indication of immigration, i.e. specialized
craftsmen, to Sigtuna. It might also imply a more dif-
ferentiated society with a more varied composition of
people living in Sigtuna.
The prevailing opinion is that women and men in
general worked in different spheres of the households
(Sawyer 1992, 98). However, this is difficult to verify
in the archaeological material. The osteological re-
sults suggest that especially the health of the women
declined from phase 1 to phase 2. Furthermore, there
may have been differences in diet and workload be-
tween the sexes demonstrated in the increased fre-
quencies of caries and DJD respectively. In general,
the male dominance seen at five of the analyzed cem-
eteries may be explained by the fact that the exca-
vations in large have been carried out in the southern
part of the churchyards. The graves at the oldest
burial grounds in the Nunnan block are not associ-
ated to a church, which may explain the even sex
distribution at this site.
In the present study an attempt has been made to
bring life to the archaeological and osteological data
to answer the question of who lived and who were
buried in Sigtuna.
Our results highlighted specific issues about the

102 Acta Archaeologica
living conditions in Sigtuna. They are important since
this town is the only urban settlement in medieval
Sweden with continuity from the Late Viking Age to
the Late Middle Ages. Moreover, the results could
be compared with contemporary urban settlements
in Scandinavia such as Lund, Trondheim and Oslo.
Finally, we conclude that the use of a health index
TABLES
Table 1. Skeletal assemblages and number of investigated skeletons. UVΩutgrävningsverksamheten, (The Archaeological Excavations Depart-
ment at The National Heritage Board), SMUVΩSigtuna museums utgrävnings verksamhet (The Archaeological Excavations Department at
The Museum of Sigtuna).
Site Excavated No. of excavated graves No. of analyzed skeletons
The Nunnan block 1984 (UV), 1987 (SMUV) 117 (19.8%) 113
Church 1 1983 (UV), 1991, 1993, 1995 (SMUV) 183 (31.8%) 165
The Kållandet block 1990–1991 (SMUV) 4 (0.7) 4
Church 2 1990–1991 (SMUV) 95 (17.2%) 88
St Laurence’s 1998 (SMUV) 124 (21.6%) 118
St Olaf’s 1999 1990–1991 (SMUV) 10 (1.7%) 9
Church 3, Kv. Magistern 1992, 1998 1990–1991 (SMUV) 41 (7.1%) 31
574 (100%) 528
Table 2. The distribution of the grave material into phases (for eight graves the phase was not possible to establish).
No. of
Phase Period excavated graves %
Phase 1 970–12th century 273 47%
Phase 2 12th century–14th century 248 43%
Phase 3 14th century – reformation 45 8%
Table 3. Distribution of coffins, charcoal and grave goods among excavated graves.
Phase Wood coffin Burial stones Brick coffin Charcoal Grave Goods
Phase 1 119 (43%) 14 (5%) – 26 (10%) 42 (15%)
Phase 2 104 (42%) 11 (4%) 1 (0.4%) 2 (0.8%) 31 (13%)
Phase 3 17 (40%) 3 (6%) – 0 4 (9%)
Total 240 (42%) 28 (5%) 1 (0.1%) 28 (4.9%) 77 (13%)
Table 4. Distribution of wood coffins at different sites and phases for the individuals in the present paper. Only osteologically analyzed
individuals are included. For the phases, the total frequency of coffins at each cemetery is presented. Grey areas denote inactive periods.
Analyzed Coffin Phase 1 Phase 2 Phase 3
burialsSite n % n % n % n %
The Nunnan block 113 66 58.4 66 58.4 0 – 0 –
Church 1 165 74 44.8 9 31.0 65 47.8 0 –
Church 2 92 34 37.0 7 29.2 27 39.7 0 –
St Laurence’s 118 27 22.9 11 19.7 9 25.7 7 27.2
St Olaf’s 9 9 100.0 0 – 0 – 9 100.0
Church 3 31 19 61.3 17 70.8 0 – 2 28.6
has shown that it is possible to compare populations
from a variety of contexts and periods.
ACKNOWLEDGMENT
We would like to thank Professor Richard Steckel, Ohio State Uni-
versity, for providing access to the FORTRAN software.

103Inhabitants of a Sacred Townscape
Table 5. Sex distribution among sexed individuals during different
phases.
Phase M % F % Total
Phase 1 89 61.4 56 38.6 145
Phase 2 95 67.4 46 32.6 141
Phase 3 15 62.5 9 37.5 24
Total 199 64.2 111 35.8 310
Table 6. Age group distribution in; phases only; the complete material; and sexed individuals.
Infant % Infans I % Infans II % Juvenilis % Adultus % Maturus % Senilis % Adult % Total n
Phase 1 3.2 7.2 3.6 15.5 42.6 13.5 0.8 13.5 251
Phase 2 5.4 12.1 3.3 13.8 28.5 17.2 1.7 18.0 239
Phase 3 2.6 15.8 5.3 18.4 31.6 10.5 0.0 15.8 38
Sigtuna 4.2 10.0 3.6 15.0 35.4 15.0 1.1 15.7 528
M – – – 13.1 46.2 25.6 1.0 14.1 199
F – – – 16.2 51.4 18.9 1.8 11.7 111
Table 7. Demographic composition of age estimated individuals in Sigtuna. The group subadults include individuals �15 years.
Phase 1 Phase 2 Phase 3 Total
Group N % N % N % N %
Males 77 35.5 81 41.3 13 40.6 171 38.4
Females 51 23.5 39 19.9 8 25.0 98 22.0
Indet. Adults 45 20.7 21 10.7 2 6.3 68 15.3
Subadults 44 20.3 55 28.1 9 28.1 108 24.3
Total 217 100.0 196 100.0 32 100.0 445 100.0
Infants 8 3.7 13 6.6 1 3.1 22 4.9
Mean age at death 27.4 25.7 22.0 26.3
D30π/D5π 0.544 0.633 0.480 0.577
Table 8. The demographic distribution in grave zones at Church
1.
Grave Men Wom Ind. A Suba. Total
zone % % % % N
A 16.0 60.0 16.0 8.0 25
B 51.0 19.6 9.8 19.6 51
C 51.7 14.6 23.6 10.1 89
46.1 23.0 18.2 12.7 165
Table 10. The demographic distribution in different cemeteries
during phase 1 only.
Men Wom Ind. A Suba. Total
Site % % % % N
Church 1 51.7 24.1 10.3 13.8 29
St Laurence’s 44.3 16.4 21.3 18.0 61
Church 2 33.3 16.7 16.7 33.3 24
Nunnan 31.9 31.0 24.8 12.4 113
Church 3 12.5 0.0 58.3 29.2 24
Tot. 35.5 22.3 24.3 17.5 251
Table 9. The demographic distribution in grave zones and phases
at Church 1.
Grave Men Wom Ind. A Suba. Total
zone % % % % N
A1 10.0 60.0 20.0 10.0 10
A2 20.0 60.0 13.3 6.7 15
B1 63.6 9.1 0.0 27.3 11
B2 47.5 22.5 12.5 17.5 40
C1 87.5 0.0 12.5 0.0 8
C2 48.1 16.0 24.7 11.1 81
46.1 23.0 18.2 12.7 165
Table 11. The demographic distribution in different cemeteries
during phase 2 only.
Men Wom Ind. A Suba. Total
Site % % % % N
Church 1 44.9 22.8 19.9 12.5 136
St Laurence’s 57.2 11.4 11.4 20.0 35
Church 2 20.6 16.2 19.1 44.1 68
Tot. 39.7 19.3 18.4 22.6 239
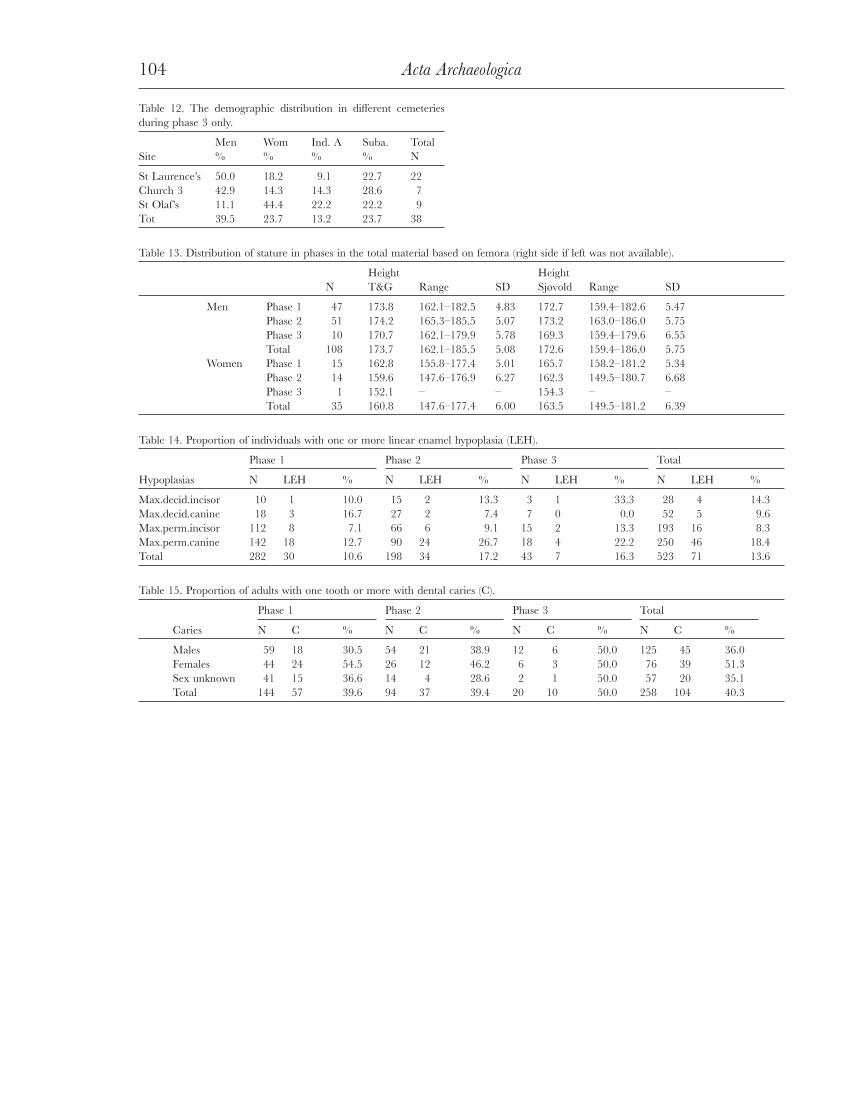
104 Acta Archaeologica
Table 12. The demographic distribution in different cemeteries
during phase 3 only.
Men Wom Ind. A Suba. Total
Site % % % % N
St Laurence’s 50.0 18.2 9.1 22.7 22
Church 3 42.9 14.3 14.3 28.6 7
St Olaf’s 11.1 44.4 22.2 22.2 9
Tot 39.5 23.7 13.2 23.7 38
Table 13. Distribution of stature in phases in the total material based on femora (right side if left was not available).
Height Height
N T&G Range SD Sjøvold Range SD
Men Phase 1 47 173.8 162.1–182.5 4.83 172.7 159.4–182.6 5.47
Phase 2 51 174.2 165.3–185.5 5.07 173.2 163.0–186.0 5.75
Phase 3 10 170.7 162.1–179.9 5.78 169.3 159.4–179.6 6.55
Total 108 173.7 162.1–185.5 5.08 172.6 159.4–186.0 5.75
Women Phase 1 15 162.8 155.8–177.4 5.01 165.7 158.2–181.2 5.34
Phase 2 14 159.6 147.6–176.9 6.27 162.3 149.5–180.7 6.68
Phase 3 1 152.1 – – 154.3 – –
Total 35 160.8 147.6–177.4 6.00 163.5 149.5–181.2 6.39
Table 14. Proportion of individuals with one or more linear enamel hypoplasia (LEH).
Phase 1 Phase 2 Phase 3 Total
Hypoplasias N LEH % N LEH % N LEH % N LEH %
Max.decid.incisor 10 1 10.0 15 2 13.3 3 1 33.3 28 4 14.3
Max.decid.canine 18 3 16.7 27 2 7.4 7 0 0.0 52 5 9.6
Max.perm.incisor 112 8 7.1 66 6 9.1 15 2 13.3 193 16 8.3
Max.perm.canine 142 18 12.7 90 24 26.7 18 4 22.2 250 46 18.4
Total 282 30 10.6 198 34 17.2 43 7 16.3 523 71 13.6
Table 15. Proportion of adults with one tooth or more with dental caries (C).
Phase 1 Phase 2 Phase 3 Total
Caries N C % N C % N C % N C %
Males 59 18 30.5 54 21 38.9 12 6 50.0 125 45 36.0
Females 44 24 54.5 26 12 46.2 6 3 50.0 76 39 51.3
Sex unknown 41 15 36.6 14 4 28.6 2 1 50.0 57 20 35.1
Total 144 57 39.6 94 37 39.4 20 10 50.0 258 104 40.3

105Inhabitants of a Sacred Townscape
Table 16. Proportion of adults showing ante mortem tooth loss (L).
Phase 1 Phase 2 Phase 3 Total
AM Loss N L % N L % N L % N L %
Males 57 23 40.4 54 16 29.6 12 4 33.3 123 43 35.0
Females 44 10 22.7 27 9 33.3 6 3 50.0 77 22 28.6
Sex unknown 23 0 0.0 14 1 7.1 2 1 50.0 39 2 5.1
Total 124 33 26.6 95 26 27.4 20 8 40.0 239 67 28.0
Table 17. Proportion of individuals with cribra orbitalia (CO).
Phase 1 Phase 2 Phase 3 Total
Cribra N CO % N CO % N CO % N CO %
Subadults 10 3 30.0 30 6 20.0 5 1 20.0 45 10 22.2
Males 45 3 6.7 54 8 14.8 10 1 10.0 109 12 11.0
Females 24 3 12.5 27 4 14.8 4 0 0.0 55 7 12.7
Sex unknown 9 0 0.0 14 2 14.3 2 0 0.0 25 2 8.0
Total Adults 78 6 7.7 95 14 14.7 16 1 6.3 189 21 11.1
Total Samples 88 9 10.2 125 20 16.0 21 2 9.5 234 31 13.2
Table 18. Proportion of individuals with tibial periostal reactions (TPR).
Phase 1 Phase 2 % Phase 3 Total
Tibia N TPR % N TPR N TPR % N TPR %
Subadults 23 0 0.0 27 0 0.0 7 0 0.0 57 0 0.0
Males 65 6 9.2 64 5 7.8 12 2 16.7 141 13 9.2
Females 35 0 0.0 26 3 11.5 6 1 16.7 67 4 6.0
Sex unknown 14 0 0.0 18 1 5.6 2 0 0.0 34 1 2.9
Total Adults 114 6 5.3 108 9 8.3 20 3 15.0 242 18 7.4
Total Samples 137 6 4.4 135 9 6.7 27 3 11.1 299 18 6.0
Table 19. Propotion of individuals showing skeletal infection (INF) (excluding tibial periostal reactions).
Phase 1 Phase 2 Phase 3 Total
Skel. INF N INF % N INF % N INF % N INF %
Males 89 7 7.9 95 5 5.3 15 2 13.3 199 14 7.0
Females 56 2 3.6 46 3 6.5 9 1 11.1 111 6 5.4
Sex un. 62 0 0.0 43 0 0.0 5 0 0.0 110 0 0.0
Total 207 9 4.3 184 8 4.3 29 3 10.3 420 20 4.8

Table 20. Proportion of adults with DJD at various joints (DJD).
Phase 1 Phase 2 Phase 3 Total
N DJD % N DJD % N DJD % N DJD %
Shoulder DJD
Males 75 2 2.7 69 1 1.4 14 1 7.1 158 4 2.5
Females 43 1 2.3 34 1 2.9 6 0 0.0 83 2 2.4
Sex unknown 18 0 0.0 15 1 6.7 3 0 0.0 36 1 2.8
Total Adults 136 3 2.2 118 3 2.5 23 1 4.3 277 7 2.5
Hip/Knee DJD
Males 80 2 2.5 77 1 1.3 14 0 0.0 171 3 1.8
Females 50 3 6.0 35 4 11.4 6 0 0.0 91 7 7.7
Sex unknown 27 0 0.0 20 1 5.0 2 1 50.0 49 2 4.1
Total Adults 157 5 3.2 132 6 4.5 22 1 4.5 311 12 3.9
Cervical DJD
Males 53 8 15.1 52 5 9.6 8 1 12.5 113 14 12.4
Females 29 2 6.9 25 3 12.0 5 0 0.0 59 5 8.5
Sex unknown 4 0 0.0 10 1 10.0 2 0 0.0 16 1 6.3
Total Adults 86 10 11.6 87 9 10.3 15 1 6.7 188 20 10.6
Thoracic DJD
Males 46 13 28.3 54 10 18.5 8 1 12.5 108 24 22.2
Females 18 3 16.7 23 2 8.7 2 0 0.0 43 5 11.6
Sex unknown 4 0 0.0 7 2 28.6 2 0 0.0 13 2 15.4
Total Adults 68 16 23.5 84 14 16.7 12 1 8.3 164 31 18.9
Lumbar DJD
Males 53 12 22.6 52 14 26.9 8 1 12.5 113 27 23.9
Females 20 3 15.0 26 7 26.9 2 0 0.0 48 10 20.8
Sex unknown 7 1 14.3 6 0 0.0 1 0 0.0 14 1 7.1
Total Adults 80 16 20.0 84 21 25.0 11 1 9.1 175 38 21.7
Table 21. Proportion of adults with trauma (Tr.).
Phase 1 Phase 2 Phase 3 Total
N Tr. % N Tr. % N Tr. % N Tr. %
Arm trauma
Males 64 5 7.8 55 3 5.5 13 2 15.4 132 10 7.6
Females 37 2 5.4 29 3 10.3 4 0 0.0 70 5 7.1
Sex unknown 16 2 12.5 10 1 10.0 2 0 0.0 28 3 10.7
Total Adults 117 9 7.7 94 7 7.4 19 2 10.5 230 18 7.8
Hand trauma
Males 56 1 1.8 59 2 3.4 11 0 0.0 126 3 2.4
Females 25 0 0.0 28 1 3.6 2 0 0.0 55 1 1.8
Sex unknown 10 1 10.0 5 0 0.0 3 0 0.0 18 1 5.6
Total Adults 91 2 2.2 92 3 3.3 16 0 0.0 199 5 2.5
Leg trauma
Males 66 2 3.0 60 2 3.3 11 0 0.0 137 4 2.9
Females 37 2 5.4 27 2 7.4 4 0 0.0 68 4 5.9
Sex unknown 10 1 10.0 9 1 11.1 2 0 0.0 21 2 9.5
Total Adults 113 5 4.4 96 5 5.2 17 0 0.0 226 10 4.4
Cranial vault
Males 53 4 7.5 56 6 10.7 10 1 10.0 119 11 9.2
Females 38 3 7.9 30 0 0.0 6 1 16.7 74 4 5.4
Sex unknown 13 2 15.4 15 1 6.7 2 0 0.0 30 3 10.0
Total Adults 104 9 8.7 101 7 6.9 18 2 11.1 223 18 8.1
Weapon wounds
Males 89 8 9.0 95 3 3.2 15 1 6.7 199 12 6.0
Females 56 4 7.1 46 0 0.0 9 0 0.0 111 4 3.6
Sex unknown 62 2 3.2 43 1 2.3 5 0 0.0 110 3 2.7
Total Adults 207 14 6.8 184 4 2.2 29 1 3.4 420 19 4.5

107Inhabitants of a Sacred Townscape
Table 22. The health index calculated for the complete Sigtuna assemblage and subdivided into phases.
Nr QALY % of max. Stature Hyp. Anemia Dental Inf. DJD Trauma Person-yrs.
Site
Sigtuna 1 21.97 83.3 41.0 84.8 94.9 92.2 92.8 89.5 87.7 34567.
Phase
Phase 1 1 22.17 84.1 42.7 87.8 96.0 92.8 91.3 90.6 87.1 17079.
Phase 2 2 21.91 83.1 40.1 82.1 94.1 93.1 95.2 87.5 89.4 15100.
Phase 3 3 20.72 78.5 38.5 72.4 92.5 81.2 89.0 97.7 78.4 2388.
Table 23. The health index calculated for sexed and unsexed adults.
Sex Nr QALY % of max. Stature Hyp. Anemia Dental Inf. DJD Trauma Person-yrs.
Females 1 21.82 82.7 42.0 81.1 92.5 91.4 95.1 90.2 88.8 9202.
Males 2 21.97 83.3 41.6 86.4 95.6 92.0 92.8 88.7 87.4 18952.
Unsexed 3 21.17 80.3 4.9 85.7 96.5 95.3 97.9 93.1 88.4 6404.
Females 1 1 22.51 85.3 51.2 89.0 92.3 92.6 96.3 92.3 87.0 4680.
Females 2 2 21.00 79.6 38.0 68.7 91.5 92.4 91.8 87.9 89.5 3997.
Females 3 3 19.04 72.2 0.0 90.2 100.0 67.9 85.7 100.0 65.8 525.
Males 1 4 22.18 84.1 41.6 89.4 97.2 92.0 91.9 89.0 88.5 9018.
Males 2 5 21.78 82.5 41.9 86.8 95.0 93.2 92.9 87.7 83.2 8434.
Males 3 6 20.62 78.2 41.9 69.0 91.4 87.9 85.8 95.4 75.8 1500.
Unsexed 1 7 22.97 87.1 11.2 86.2 97.5 98.0 96.5 99.4 91.3 3381.
Unsexed 2 8 20.76 78.7 0.0 87.9 95.7 95.5 100.0 86.0 89.8 2662.
Unsexed 3 9 – – ª1.0 98.9 98.6 80.8 100.0 100.0 100.0 360.
Table 24. The health index calculated for different sites and phases.
Site Nr QALY % of max. Stature Hyp. Anemia Dental Inf. DJD Trauma Person-yrs.
Church 1 1 22.14 83.9 45.6 86.7 94.4 93.4 90.5 86.5 90.5 12775.
Nunnan 2 22.61 85.7 42.6 92.6 99.0 91.9 90.8 93.0 89.9 8275.
Church 2 3 22.17 84.0 31.1 81.6 98.7 89.9 100.0 92.5 94.4 3296.
Church 3 4 20.76 78.7 56.3 43.0 89.4 91.3 100.0 77.9 93.0 1531.
St Laurence’s 5 21.43 81.2 34.5 87.4 91.8 92.6 92.4 89.0 80.9 8254.
St Olaf’s 6 19.48 73.9 3.5 100.0 100.0 69.7 83.1 100.0 67.8 437.
Church 1, 1 1 23.05 87.4 51.3 100.0 98.6 94.3 82.1 85.3 100.0 2115.
Church 1, 2 2 22.02 83.5 44.9 83.7 93.5 93.3 93.7 86.8 88.6 10660.
Nunnan, 1 3 22.61 85.7 42.6 92.6 99.0 91.9 90.8 93.0 89.9 8275.
Church 2, 1 4 23.05 87.4 44.0 89.2 94.1 88.9 100.0 100.0 95.9 1129.
Church 2, 2 5 21.72 82.3 22.7 77.8 99.9 90.2 100.0 90.0 95.8 2166.
Church 3, 1 6 20.30 77.0 38.6 40.0 100.0 96.8 100.0 67.7 100.0 990.
Church 3, 3 7 20.28 76.9 73.0 41.5 80.9 88.4 100.0 100.0 85.5 540.
St Laurence’s, 1 8 21.36 81.0 40.0 90.6 90.3 93.3 90.3 88.6 73.8 4570.
St Laurence’s, 2 9 21.04 79.8 21.1 77.6 91.4 94.9 98.8 88.3 86.0 2274.
St Laurence’s, 3 10 22.16 84.0 27.1 94.0 99.6 88.9 91.4 96.4 90.5 1411.
St Olaf’s, 3 11 19.48 73.9 3.5 100.0 100.0 69.7 83.1 100.0 67.8 437.

108 Acta Archaeologica
Table 25. The relative frequency of LEH among men and women
with teeth in phases.
LEH Men % Wom. %
Phase 1 8 13.1 8 17.8
Phase 2 13 23.2 11 40.7
Phase 3 3 25.0 1 16.7
Table 26. Distribution of wood coffins among aged and sexed individuals in phases (subadults�20 years).
% of % of % of % of
Phase Coffin Of total Subadults aged indiv. Adults aged indiv. M sexed indiv. W sexed indiv.
Phase 1 111 251 24 21.6 87 78.4 37 25.5 25 17.4
Phase 2 101 239 35 34.7 66 65.3 50 35.5 17 12.1
Phase 3 17 38 7 41.2 10 58.8 5 20.8 5 20.8
Total 229 528 66 28.8 163 71.2 92 29.7 47 15.2

109Inhabitants of a Sacred Townscape
BIBLIOGRAPHY
Andersson, G., 2004: Gravspråk som religiös strategi. Valsta och Skälby i
Attundaland under vikingatid och tidig medeltid. Riksantikvarieämbet-
et. Stockholm.
Andren, A., 1985: Den urbana scenen. Städer och samhälle i det medeltida
Danmark. Acta archaeologica Lundensia Series in 80. Liber
Förlag: Malmö.
– 2000: Ad sanctos – de dödas plats under medeltiden, Hikuin 27,
7–26.
Arcini, C., 1999: Health and Disease in Early Lund. Lund.
Aufderheide, A. C. & Rodrigues-Martin, C., 1998: The Cambridge
Encyclopaedia of Human Paleopathology. Cambridge University
Press. Cambridge.
Bass, W. M., 1987: Human Osteology: a laboratory and field manual of the
human skeleton. Third edition. Missouri Archaeological Society.
Columbia, MO.
Bonnier, A-C., 1987: Kyrkorna berättar. Upplands kyrkor 1250–
1350. Upplands Fornminnesförenings tidskrift nr 51. Uppsala.
– 1989: Sigtuna och kyrorna. In: Avstamp för en ny Sigtunaforskning:
18 forskare om Sigtuna, Tesch S. (ed.). Kommiten för Sigtun-
aforskning, Sigtuna Museer. Sigtuna, 9–15.
Brothwell, D. R., 1981: Digging up Bones. Third edition. Oxford
University Press. Oxford.
Brooks, J. M. & Suchey, S. T., 1990: Skeletal age determination
based on the os pubis: a comparison of the Acsadi-Nemiskeri
and Suchey-Brooks methods. Human Evolution 5, 227–238.
Bruzek, J., 2002: A Method for Visual Determination of Sex, using
the Human Hip Bone. Journal of Physical Anthropology 117, 157–
168.
Buikstra, J. E., Koningsberg, L. W. & Bullington, J., 1986: Fertility
an the Development of Agriculture in the Prehistoric Midwest.
American Antiquity 51, 528–546.
Buikstra, J. E. & Ubelaker, D. H., 1994: Standards. For data collection
from human skeletal remains. Arkansas Archaeological Survey Research
Series, Fayetteville, AK, No. 44.
Cinthio, M., 2002: De första stadsborna: medeltida gravar och människor i
Lund. Lund.
Cinthio, H. & Boldsen, J., 1984: Patterns of Distribution in the
Early Medieval Cemetery at Löddeköpinge. In: Meddelande från
Lunds universitets Historiska Museum 1983–1984. New Series 5, 116–
127.
Cohen, M. N. & Armelagos, G. J., (eds.). 1984. Paleopathology at the
Origins of Agriculture. Academic Press. New York.
Gejvall, N.-G., 1960: Westerhus. Medieval Population and Church in the
light of skeletal remains. Kungliga Vitterhets Historie och Antikvit-
ets Akademien. Stockholm.
Goodman, A. H. & Martin, D. L., 2002: Reconstruction Health
profiles from Skeletal Remains. In: The Backbone of History. Health
and Nutrition in the Western Hemisphere, Steckel R. & Rose J. (eds.).
Cambridge University Press. Cambridge, 11–60.
Gräslund, A-S., 1989: Några reflektioner om det äldsta Sigtuna. In
Avstamp för en ny Sigtunaforskning: 18 forskare om Sigtuna, Tesch S.
(ed.). Kommiten för Sigtunaforskning, Sigtuna Museer. Sigtu-
na, 35–41.
Haduch, E., 2002: The Human Biology of the Neolithic and
Bronze Age Population of Poland. In: Aspects of Past Human
Settlements in Europe. Biennial Books of EAA 2, Bennike, P., Bodzsar,
E. B. & Susanne, C. (eds.). Eötvös University press. Budapest,
143–156.
Harris, E., 1997: Principles of Archaeological Stratigraphy. Second edi-
tion. Academic Press. London.
Jankauskas, R., 2002: Anthropology of the Iron Age Inhabitants of
Lithuania.Ecological In: Aspects of Past Human Settlements in Eur-
ope. Biennial Books of EAA 2, Bennike, P., Bodzsar, E. B. & Susan-
ne, C. (eds.). Eötvös University press. Budapest, 129–142.
Kieffer-Olsen, J., 1993: Grav og gravskik i det meddelalderlige Danmark-
8 kirkegårdsudgravninger. Aarhus Universitet.
Kjellström, A., 2004: Evaluations of Sex Assessment using
Weighted Traits on Incomplete Skeletal Remains. International
Journal of Osteoarchaeology 14, 360–373.
Larsen, C. S., 1997: Bioarchaeology. Interpreting behavior from the human
skeleton. Cambridge University Press. Cambridge.
Lyman, R. E., 1996: Vertebrate Taphonomy. Cambridge University
Press. Cambridge.
Maresh, M. M., 1955: Linear Growth of Long Bones of Extremities
from Infancy Trough Adolescence. A.M.A. American Journal of
Diseases of Children 89, 725–742.
McCaa, R., 2002: Paleodemography of the Americas: From An-
cient Times to Colonialism and Beyond. In: The Backbone of
History. Health and Nutrition in the Western Hemisphere, Steckel, R.
H. & Rose, J. C. (eds.). Cambridge University Press. Cam-
bridge, 94–124.
Meindl, R. S. & Lovejoy, C. O., 1985: Ectocranial suture closure:
a revised method for the determination of skeletal age at death
based on lateral-anterior sutures. American Journal of Physical
Anthropology 68, 57–66.
Meindl, R. S. & Lovejoy, C. O., 1989: Age changes in the pelvis
implications for paleodemography. In: Age Markers In the Human
Skeleton, Iscan M.Y. (ed.). Thomas, cop. Springfield, IL, 137–
168.
Nilsson, B., 1987: Död och begravning. Begravningsskicket i Nord-
en. In: Tanke och tro. Aspekter på medeltidens tankevärld och fromhetsliv,
Ferm, O. & Tegner G. (eds.). Studier till Det Medeltida Sverige
3, Stockholm, 133–150.
– 1989: De sepulturis. Gravrätten i Corpus Iuris Canonici och medeltida
nordisk lagstiftning. Bibliotheca theologiae practicae. Kyrkoveten-
skapliga studier 44. Stockholm.
– 1994: Kvinnor, män och barn på medeltida begravningsplatser. Lunne
böcker. Uppsala.
Petterson, B., 1995: Stratigraphic analysis and settlement stratigra-
phy in early medieval Sigtuna. Methods and preliminary re-
sults. Laborativ Arkeologi 8/Journal of Nordic Archaeological Science,
65–77.
Redin, L., 1976: Lagmansheidan. Ett gravfält som spegling av sociala
strukturer i Skanör. Acta Archaeological Lundensia, Series in 4 Nr
10. Bonn & Lund.
– 1997: Med ögonvråns förlängda seende. Till Gunborg. Arkeologis-

110 Acta Archaeologica
ka samtal, Åkerlund A. (ed.). Stockholm Archaeological Reports
Nr 33, 593–601.
Roslund, M., 2001: Gäster i huset: Kulturell överföring mellan slaver och
skandinavier 900 till 1300. Lund.
Sauders, S. R., Herring, A., Sawchuk, L., Boyce, G., Hoppa, H. &
Klepp, S., 2002: St. Thomas’Church Cemetery project. In: The
Backbone of History. Health and nutition in the western hemisphere,
Steckel RH. & Rose JC. (eds.). Cambridge university Press.
Cambridge, 130–161.
Sawyer, B., 1992: Kvinnor och familj i det forn- och medeltida Skandinavien.
Viktoria bokförlag. Skara.
Scheuer, L. & Black, S., 2000: Developmental Juvenile Osteology. Aca-
demic Press. London.
Sellevold, B., 2001: From Death to Life in Medieval Hamar. Skeletons and
Graves as Historical Source Material. Faculty of Arts, University of
Oslo. Oslo.
Sjøvold, T., 1990: Estimation of stature from long bones utilizing
the line organic correlation. Human Evolution 5, 431–447.
Snædal Brink, T., 1983. Igul och Björn läto resa stenen ...: runstenar
och runinskrifter i Sigtuna kommun. Sigtuna museers skriftserie 2.
Sigtuna.
Steckel, R. H. & Rose, J. C., 2002: The Backbone of History. Health and
Nutrition in the Western Hemisphere. Cambridge University Press.
Cambridge.
Steckel, R. H., Sculli, P. W. & Rose, J. C., 2002a: A Health Index
from Skeletal Remains. In: The Backbone of History. Health and
Nutrition in the Western Hemisphere. Cambridge University Press.
Cambridge, 61–93.
Steckel, R. H., Rose, J. C., Larsen, C. S. & Walker, P. L., 2002b:
Skeletal Health in the Western Hemisphere From 4000 B.C. to
the Present. Evolutionary Anthropology 11, 142–155.
Stloukal, M. & Hanakova, H., 1978: Die Länge der Längsknochen
altslawischer Bevölkerungen- Unter besonderer Berücksichti-
gung von Wachtumsfragen. Homo 29, 53–60.
Stolt, B. 2001: Boktyngder och bärbara altarskivor. In: Kyrkliga
sällsyntheter på Gotland och annorstädes. Uddevalla, 25–42.
Tesch, S., 1990: Stad och stadsplan. In: Makt och människor i kungens
Sigtuna. Sigtunautgrävningen 1988–90, Tesch S. (ed.). Sigtuna
museer, Sigtuna, 23–37.
Author’s addresses
Osteoarchaeological Research Laboratory, Stockholm University,
S-106 91 Stockholm, Sweden. Phone: π46 8 161393. Fax:
π46 8 164476. E-mail: anna.kjellstrom/telia.com
Sigtuna museum, Stora gatan 55, 193 30 Sigtuna, Sweden.
Phone: π46 8 597 838 70, Fax: π46 8 597 838 83, E-mail: sten.
tesch/sigtuna.se
Sigtuna museum, Stora gatan 55, 193 30 Sigtuna, Sweden.
Phone: π46 8 597 838 70, Fax: π46 8 597 838 83, E-mail: anders.
wikstrom/sigtuna.se
– 1996: Sigtuna- Royal stronghold and early town. In: The Emer-
gence of Towns: Archaeology and Early Urbanization in Non Roman,
North West Europe. The Swedish Institute of Urban History 75 years
anniversary symposium, Nilsson L. & Lilja S. (eds.). Stockholm,
113–126.
– 2000: Det sakrala stadsrummet- Sigtunas sakrala kyrkotopog-
rafi. META, Medeltidsarkeologisk tidskrift 1, 3–26.
– 2001a: Olof Palme, S:ta Gertrud och Sigtunas medeltida kyrko-
topografi. In: Biskopen i museets trädgård. En arkeologisk gåta, Tesch,
S. & Edberg, E. (eds.). Sigtuna Museers skriftserie 9, Stockholm,
9–44.
– 2001b: Houses Town Yards and Town Planning in Late Viking
Age and Medieval Sigtuna, Sweden. In: Lübecker Kolloquium zur
Stadtarchäologie III, der Hausbau, Gläser M. (ed.). Lübeck, 723–
741.
– 2004: Stadsplan och stadsbyggnad i Sigtuna och Kiev/ Town
planning and town building in Sigtuna and Kiev. In: Olga &
Ingegerd – Vikingafurstinnor i öst/Viking princesses: Historiska Nyheter:
Statens historiska Museum: Stockholm, 30–35.
– 2005: På fast grund- om det äldsta stenkyrkobyggandet i Sveri-
ge. Hikuin (in print)
Trotter, M. & Gleser, G., 1952: Estimation of stature from long
bones of American Whites and Negroes. American Journal of
Physical Anthropology 10, 463–515.
– 1958: A re-evaluation of estimation of stature based on meas-
urements of stature taken during life and long bones after
death. American Journal of Physical Anthropology 16, 79–125.
Ubelaker, D. H., 1989: Human Skeletal remains. Excavation, analysis,
interpretation. Second edition. Taraxacom: Washington.
Wikström, A. 2005. Den svårfångade kronologin. Hikuin (in print).
Wikström, A. & Kjellström, A., 2005. Rapport Arkeologisk under-
sökning. Arkeologiska undersökningar i kvarteret Magistern
1992 och 1998 (Report in print).
Wood, J. W., Milner, G. R., Harpending, H. C. & Weiss, K. M.,
1992: The Osteological Paradox: problems of inferring prehis-
toric health from skeletal samples. Current Anthropology 33, 343–
358.