Infrared fluorescence and absorption studies of CN: spectra and relaxation in solid rare gases
11
Chemical Physics 174 (1993) 255-265 North-Holland Infrared fluorescence and absorption studies of CN: spectra and relaxation in solid rare gases Brent E. Wurfel, Giinter Schallmoser, Gerrit M. Lask, Jiirgen Agreiter, Anton Thoma, Richard Schlachta and Vladimir E. Bondybey Institutfir Physikalische und Theoretische Chemie, Technische Universitiit Miinchen, Lichtenbergstrasse 4.85 747 Garching. Germany Received 19 January 1993 The spectra and relaxation of CN radicals are studied by FfIR absorption and emission spectroscopy. The relaxation of excited A *lI vibrational levels proceeds via efficient intramolecular internal conversion processes between the A *lI and X *Z levels. The intensity distribution in the observed vibrational CN fluorescence is explained by the occurrence of rapid intermolecular vibra- tional energy transfer and “ladder climbing” processes. The effect of isotopic substitution and medium effects on the relaxation dynamics are also discussed. 1. Introduction Atoms or molecules isolated in low temperature rare gas solids represent systems which can be con- veniently studied spectroscopically and relatively easily modelled theoretically. This is one of the rea- sons why the spectroscopy and dynamics of matrix isolated molecules have been the subject of extensive studies [ l-41. This past work yielded a number of unexpected results concerning the relaxation dynam- ics of matrix isolated molecules. Studies of vibra- tional relaxation of small hydride and deuteride mol- ecules, e.g. OH/OD [ 51 and NH/ND [ 61, led to the conclusion that the energy gap law predicted theoret- ically breaks down for these molecules. Similar re- sults were later obtained for several other hydrides [ 7-101, and this behavior could then be semiquan- titatively modelled theoretically [ 1 1 - 13 ] . A number of years ago we studied the relaxation dynamics of the CN radical isolated in solid Ne using time-resolved laser induced fluorescence. This led to the conclusion, unexpected at the time, that vibra- tional relaxation in the excited A’lT state does not proceed directly down the vibrational manifold, but via an interelectronic cascade involving levels of the ground electronic state [ 141. We were subsequently able to prove the proposed mechanism by probing di- rectly the population of the ground state vibrational levels using two lasers in a pump-probe experiment. This experiment demonstrated that while the inter- electronic cascade processes proceed on a nanosec- ond-microsecond timescale, the low X ‘ZS ( V= 4 ) and ~1x3 vibrational levels for which this relaxation mechanism is not possible, and which can only relax by direct vibrational relaxation, have orders of mag- nitude longer lifetimes. We have noted that the mea- sured lifetimes may well be close to the radiative val- ues [ 15 1. Later experiments have demonstrated also that gas phase collisional relaxation of CN, as well as of a number of other molecules proceeds by a similar process involving a sequence of A++X internal con- versions [ 16 1. We have proceeded to propose, based on the nature of the guest-host interactions that one can, in general, in many matrix isolated systems, ex- pect interelectronic cascade processes to prevail over direct vibrational relaxation [ 15 1. Studies of infrared fluorescence following excita- tion by infrared lasers have been extremely useful in providing information about the dynamics of matrix isolated molecules. The elegant studies of NO or CO in rare gas solids by Dubost and co-workers [ 17 1, as well as the studies of HCl and HCN by Moore’s group [ 7,18,19] are noteworthy examples of the infrared pump and infrared fluorescence detection technique. 0301-0104/93/$06.00 0 1993 Elsevier Science Publishers B.V. All rights reserved.
-
Upload
laureateinstitute -
Category
Documents
-
view
4 -
download
0
Transcript of Infrared fluorescence and absorption studies of CN: spectra and relaxation in solid rare gases
Chemical Physics 174 (1993) 255-265 North-Holland
Infrared fluorescence and absorption studies of CN: spectra and relaxation in solid rare gases
Brent E. Wurfel, Giinter Schallmoser, Gerrit M. Lask, Jiirgen Agreiter, Anton Thoma, Richard Schlachta and Vladimir E. Bondybey Institutfir Physikalische und Theoretische Chemie, Technische Universitiit Miinchen, Lichtenbergstrasse 4.85 747 Garching. Germany
Received 19 January 1993
The spectra and relaxation of CN radicals are studied by FfIR absorption and emission spectroscopy. The relaxation of excited A *lI vibrational levels proceeds via efficient intramolecular internal conversion processes between the A *lI and X *Z levels. The intensity distribution in the observed vibrational CN fluorescence is explained by the occurrence of rapid intermolecular vibra- tional energy transfer and “ladder climbing” processes. The effect of isotopic substitution and medium effects on the relaxation dynamics are also discussed.
1. Introduction
Atoms or molecules isolated in low temperature rare gas solids represent systems which can be con- veniently studied spectroscopically and relatively easily modelled theoretically. This is one of the rea- sons why the spectroscopy and dynamics of matrix isolated molecules have been the subject of extensive studies [ l-41. This past work yielded a number of unexpected results concerning the relaxation dynam- ics of matrix isolated molecules. Studies of vibra- tional relaxation of small hydride and deuteride mol- ecules, e.g. OH/OD [ 51 and NH/ND [ 61, led to the conclusion that the energy gap law predicted theoret- ically breaks down for these molecules. Similar re- sults were later obtained for several other hydrides [ 7-101, and this behavior could then be semiquan- titatively modelled theoretically [ 1 1 - 13 ] .
A number of years ago we studied the relaxation dynamics of the CN radical isolated in solid Ne using time-resolved laser induced fluorescence. This led to the conclusion, unexpected at the time, that vibra- tional relaxation in the excited A’lT state does not proceed directly down the vibrational manifold, but via an interelectronic cascade involving levels of the ground electronic state [ 141. We were subsequently able to prove the proposed mechanism by probing di-
rectly the population of the ground state vibrational levels using two lasers in a pump-probe experiment. This experiment demonstrated that while the inter- electronic cascade processes proceed on a nanosec- ond-microsecond timescale, the low X ‘ZS ( V= 4 ) and ~1x3 vibrational levels for which this relaxation mechanism is not possible, and which can only relax by direct vibrational relaxation, have orders of mag- nitude longer lifetimes. We have noted that the mea- sured lifetimes may well be close to the radiative val- ues [ 15 1. Later experiments have demonstrated also that gas phase collisional relaxation of CN, as well as of a number of other molecules proceeds by a similar process involving a sequence of A++X internal con- versions [ 16 1. We have proceeded to propose, based on the nature of the guest-host interactions that one can, in general, in many matrix isolated systems, ex- pect interelectronic cascade processes to prevail over direct vibrational relaxation [ 15 1.
Studies of infrared fluorescence following excita- tion by infrared lasers have been extremely useful in providing information about the dynamics of matrix isolated molecules. The elegant studies of NO or CO in rare gas solids by Dubost and co-workers [ 17 1, as well as the studies of HCl and HCN by Moore’s group [ 7,18,19] are noteworthy examples of the infrared pump and infrared fluorescence detection technique.
0301-0104/93/$06.00 0 1993 Elsevier Science Publishers B.V. All rights reserved.
256 B.E. Wurfel et al. /Chemical Physics 174 (1993) 255-265
The X’Z(o=4) and XzZ(v=3) states of CN in solid neon have long lifetimes (2.8 and 5.4 ms, re- spectively) and infrared fluorescence should also be observable following electronic excitation. In gen- eral, studies of infrared fluorescence following visible or ultraviolet excitation could prove to be a valuable tool in studies of both spectroscopy and molecular dynamics of matrix isolated samples. A visible-exci- tation-infrared-detection experiment has the advan- tage that fluorescence is far removed from the exci- tation source and so there are no problems with scattered laser light. Furthermore, it is generally more efficient to excite molecules on fully allowed elec- tronic transitions rather than on the much weaker vi- brational infrared absorptions.
During our previous visible-ultraviolet study of CN we have noted that very little visible fluorescence is observed in solid Ar in comparison with solid Ne and have suggested that the corresponding relaxation processes may be considerably faster. In the present manuscript we re-examine the CN radical both in solid Ar and Ne using a Fourier transform spectrom- eter to investigate its infrared fluorescence and absorption.
2. Experimental
Our apparatus has been described previously [ 20 1, and only details specific to the present investigation are given here. In most experiments HCN, prepared by reacting sulphuric acid with KCN (Merck), was used as the parent compound for generating the CN radical. KL3CN ( i3C 99%, Promochem) was substi- tuted for regular KCN in the isotopic experiments. The samples were dried over CaClz or Pz05 and pur- ified with several trap-to-trap distillations prior to usage. Several experiments were carried out using ClCN and dicyanoacetylene, N&N, as precursors. The original purpose of the NC4N experiments was the study of the parent isomerization [ 2 11, and as a source for production of the CCCN radical. How- ever, the compound proved to be a very efficient source of CN, and useful spectra of the CN radical were obtained.
The precursor/rare gas mixtures were made by standard procedures and stored in glass bulbs. Nor- mally 3-4 mmol were deposited at a 1 mmol per hour
rate, which led to matrices with a thickness of about 100 pm. The gaseous samples were deposited through the pulsed discharge source, which we have previ- ously shown to be an extremely convenient source of radicals [ 22 1. In the discharge fragmentation of the parent molecules and recombination occurs and the concentration of the CN radical cannot be given ex- actly. From the decrease of the parent absorption with a production efficiency of 50% for CN we estimate a ratio of CN: rare gas of about 1: 2500 to 1: 3000. The discharge voltages were in the range of 500-1000 V with approximately (0.5-5.0) x 10R6 C. The exit of the source has been placed 25 mm from a KC1 sub- strate. The window was cooled to 14 K by an APD Cryogenics HC-2D closed cycle refrigerator for the argon matrix studies. An RMC Cryosystems. LTS-1 C- 4.5CM closed cycle refrigerator was used in the solid neon experiments, where the sample was cooled to 5 K as described in ref. [ 23 1. Some experiments with argon as the matrix gas were performed on the 5 K refrigerator to check the influence of the sample tem- perature, but no difference in the relaxation behav- iour could be detected. Infrared, near-infrared, visi- ble and near-ultraviolet absorption and emission spectra were measured on a Bruker IFS 120 HR Fourier transform spectrometer. A Coherent ring ti- tanium-sapphire laser was used to induce the fluorescence.
3. Results and discussion
3.1. Absorption spectra
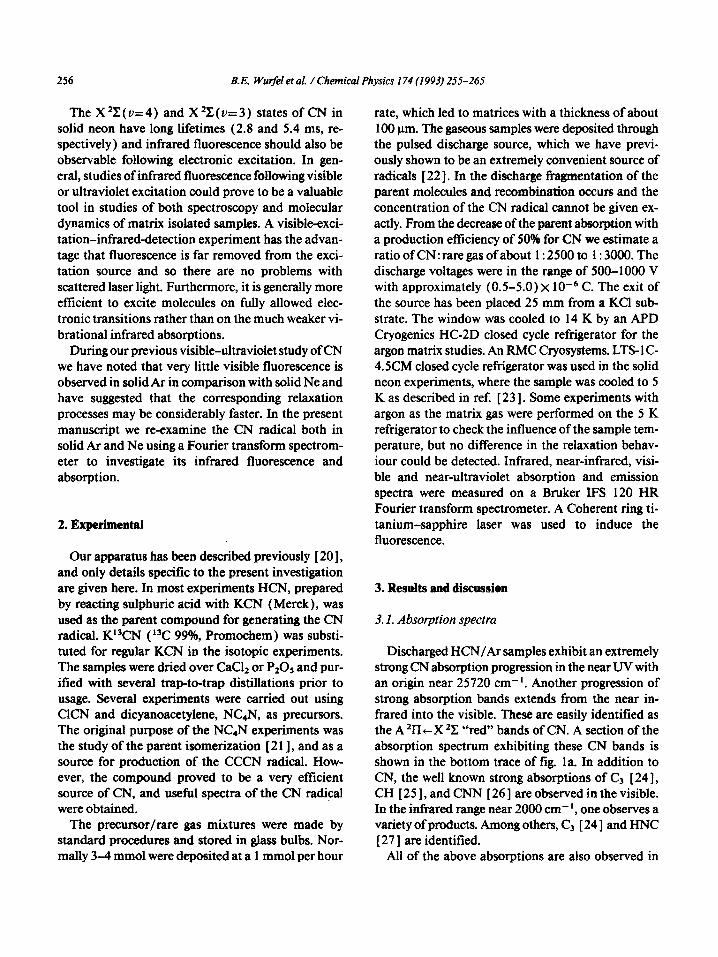
Discharged HCN/Ar samples exhibit an extremely strong CN absorption progression in the near UV with an origin near 25720 cm-‘. Another progression of strong absorption bands extends from the near in- frared into the visible. These are easily identified as the A *II+X 2Z “red” bands of CN. A section of the absorption spectrum exhibiting these CN bands is shown in the bottom trace of fig. la. In addition to CN, the well known strong absorptions of C3 [ 241, CH [ 25 1, and CNN [ 26 ] are observed in the visible. In the infrared range near 2000 cm-‘, one observes a variety of products. Among others, C3 [ 241 and HNC [ 271 are identified.
All of the above absorptions are also observed in
B,E. Wwfel et al. / Chemical Physics I74 (1993) 255-265 251
a) Abaofption A *II@‘) t X ?(o”) 1.0 -
24-O
!! “eo” 3+0 .
i! 0 0.5 - 0
argon
b) Emission A *Il(u’) + X %+(d’) laser exdtatbn at 8- in argon 11,238.2 cm4
s 8- l-+0
0-K) -
2 4_ 2+0
J
.i 2
E 3+0
Ow
16000 1SOOO 11000 Qooo
wavenumber @me’)
Fii 1. (a) Absorption spectra of the A*ll+X % “red” bands of CN in solid neon (upper) and argon (lower). Throu@ the discharge Jource4mmolofanCICN:Ne=1:500mixtureweredepositedtoformaneonmatrixand5.1mmolofaHCN:Ar=1:400mixNre~ deposited in the case of argon. Peaks denoted with z are due to the Phillips bands of C,. (b) Emission from the A % state ofCN in aqon following excitation with the titanium sapphire laser at 11236.2 cm-‘. The spectrum above 10500 cm-’ was recorded with a photomul- tiplier tube and below 10500 cm-’ with an InSb detector. Note that emission also occurs from the v’ = 2 and v’ = 3 level of the A sll state. Peak positions are given in table 1.
the experiments using dicyanoacetylene as a parent. In this case, several other products can be also iden- tified. In particular one observes infrared absorp- tions due to the isomers of NCCCCN [ 2 11, as well as the visibIe absorption and fluorescence spectrum of CCN.
Neon matrix results are quite analogous. In the near infrared one observes again the red bands of CN. These are, however, in solid neon some 350 cm-’ lower in energy than in argon and much closer to the gas phase frequencies. In the neon matrix spectrum, shown in the top trace of fig. la, a fairly prominent progression of sharp absorptions due to the Phillips bands of C2 is also observed [ 2 3 1. These are labeled by asterisks. The C2 is undoubtedly present in the Ar matrix experiments also. In argon the Phihips bands are known to be broad due to both homogeneous and inhomogeneous effects, and the absorption bands are not readily apparent [ 28 1.
3.2. Fluorescence spectra
3.2. I. Argon matrix Excitation of the sample by the titanium-sapphire
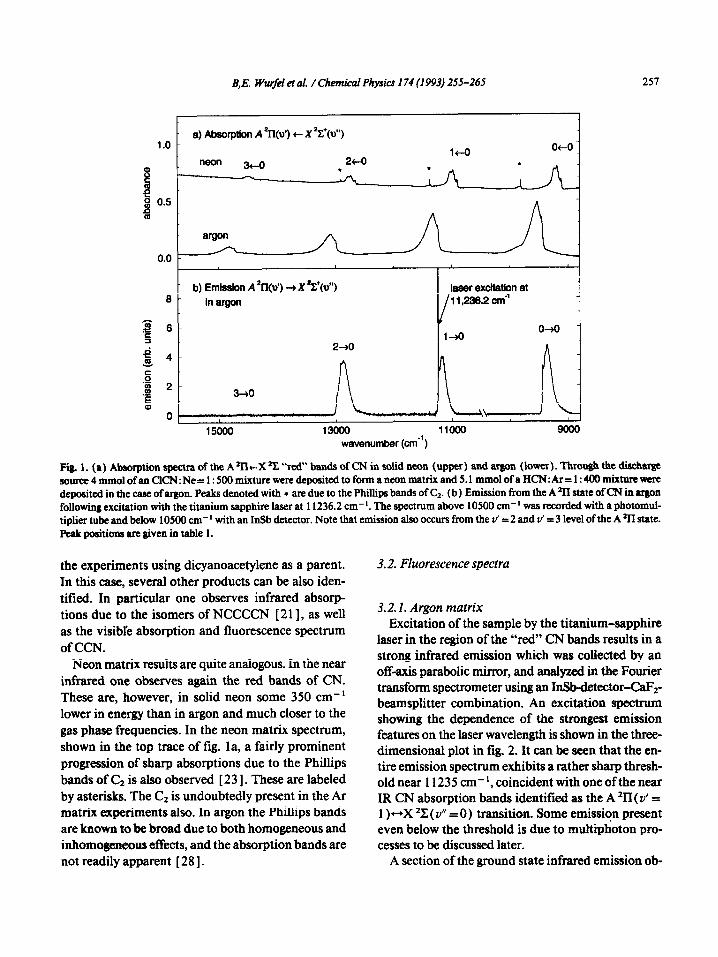
laser in the region of the “red” CN bands results in a strong infrared emission which was collected by an off-axis parabolic mirror, and analyxed in the Fourier transform spectrometer using an IrSbdetector-CaF~- beamsplitter combination. An excitation spectrum showing the dependence of the strongest emission features on the laser wavelength is shown in the three- dimensional plot in fig. 2. It can be seen that the en- tire emission spectrum exhibits a rather sharp thresh- old near 11235 cm-‘, coincident with one of the near IR CN absorption bands identified as the A ‘II ( v’ = 1 )-X ‘C ( Y” = 0) transition. Some emission present even below the threshold is due to multiphoton pro- cesses to be discussed later.
A section of the ground state infrared emission ob-
158 B.E. Wu@ei et al. / Chemical physics 174 (1993) 255-265
CN fluorescence Z-al
emieeion wavenumber (cm”)
:ig. 2. Three-dimensional infrared emission of Au= 1 transitions of the X *X state of an argon matrix, which was made by depositing 1.4 nmol ofa C4N1:Ar= 1: 400 mixture. The laser was scanned over the A *ll(v= 1) level from 10800 to 12000 cm-’ and the fluorescence vas recorded +th the FTIR. Emission is also observed below the threshold at 11235 cm-’ and is due to multiphoton pmcesses. peak ktions are listed in table 1.
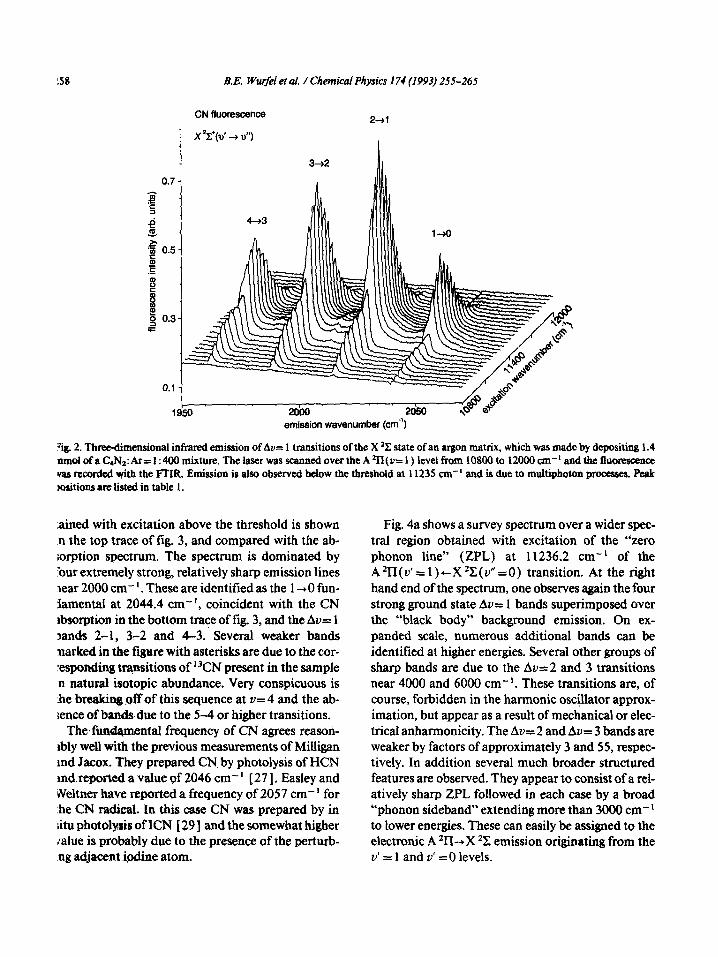
ained with excitation above the threshold is shown .n the top trace of tig. 3, and compared with the ab- sorption spectrum. The spectrum is dominated by ‘our extremely strong, relatively sharp emission lines lear 2000 cm- ‘. These are identified as the 1 +O fun- iamental at 2044.4 cm-‘, coincident with the CN absorption in the bottom traqe of fig 3, and the Av= 1 ,ands 2-1, 3,2 and 4-3. Several weaker bands narked in the figure with asterisks are due to the cor- esponding trapsitiolls of “CN present in the sample n naturai isotopic abundance. Very conspicuous is .he breaking off of this sequence at ZI= 4 and the ab- ience of ban&due to the 5-4 or higher transitions.
The~f~damental frequency of CN agrees reason- ably well with the previous measurements of Mill&an md Jacox. They prepared CN, by photolysis of HCN mdreported a value of 2046 cm-r [ 27 1, Easley and Weltuer have reported a frequency of 2057 cm-’ for .he CN radical. In this case CN was prepared by in ;itu photolysis of ICN [ 29 ] and the somewhat higher Jalue is probably due to the presence of the perturb- ng adjacent iodine atom.
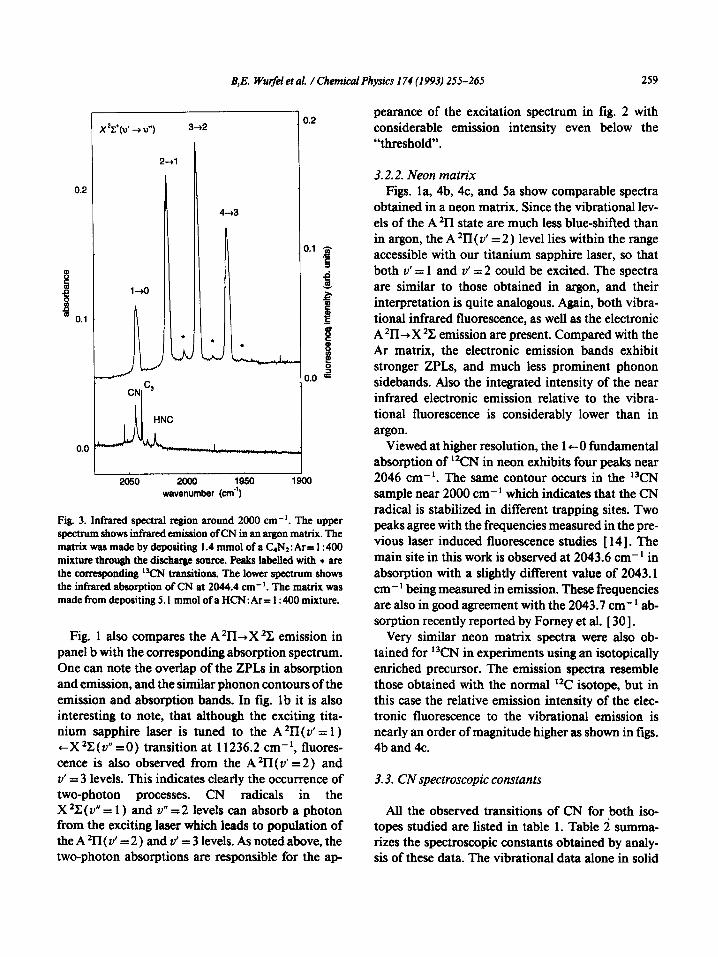
Fig. 4a shows a survey spectrum over a wider spec- tral region obtained with excitation of the “zero phonon line” (ZPL) at 11236.2 cm-’ of the A2TL(v’=1)cXZC(v”= 0) transition. At the right hand end of the spectrum, one observes again the four strong ground state Av= 1 bands superimposed over the “black body” background emission. On ex- panded scale, numerous additional bands can be identified at higher energies. Several other groups of sharp bands are due to the Av=2 and 3 transitions near 4000 and 6000 cm-‘. These transitions are, of course, forbidden in the harmonic oscillator approx- imation, but appear as a result of mechanical or elec- trical anharmonicity. The Av= 2 and Av= 3 bands are weaker by factors of approximately 3 and 55, respec- tively. In addition several much broader structured features are observed. They appear to consist of a rel- atively sharp ZPL followed in each case by a broad “phonon sideband” extending more than 3000 cm-’ to lower energies. These can easily be assigned to the electronic A %-+X *C. emission originating from the v’ = 1 and Y’ = 0 levels.
B;E. Wurfel et al. / Chemical Physics 174 (1993) 255-265 259
0.2
l+O
n
r X22(d -au”) 3+2
9 2 B m 0.1
L
2050 2ooo 1950 1900 wavenumber (cm”)
Fig. 3. Infrared spectral region around 2000 cm-‘. The upper spectrum shows infrared emission of CN in an argon matrix. The matrix was made by depositing 1.4 mmol of a C,N2: Ar = 1: 400 mixture through the discharge source. Peaks labelkd with t are the corresponding ‘WN transitions. The lower spectrum shows the infrared absorption of CN at 2044.4 cm-‘. The matrix was made from depositing 5. I mmol of a HCN: Ar= 1: 400 mixture.
Fig. 1 also compares the A *II-+X *C emission in panel b with the corresponding absorption spectrum. One can note the overlap of the ZPLs in absorption and emission, and the similar phonon contours of the emission and absorption bands. In fig. 1 b it is also interesting to note, that although the exciting tita- nium sapphire laser is tuned to the A *II( v’ = 1) tX*C(v” =O) transition at 11236.2 cm-‘, fluores- cence is also observed from the A *II( v’ =2) and v’ = 3 levels. This indicates clearly the occurrence of two-photon processes. CN radicals in the X*C(v”=l) and v” =2 levels can absorb a photon from the exciting laser which leads to population of the A *II{ v’ = 2 ) and v’ = 3 levels. As noted above, the two-photon absorptions are responsible for the ap-
pearance of the excitation spectrum in fig. 2 with considerable emission intensity even below the “threshold”.
3.2.2. Neon matrix Figs. la, 4b, 4c, and 5a show comparable spectra
obtained in a neon matrix. Since the vibrational lev- els of the A *II state are much less blue-shifted than in argon, the A *II (v’ = 2) level lies within the range accessible with our titanium sapphire laser, so that both v’ = 1 and v’ = 2 could be excited. The spectra are similar to those obtained in argon, and their interpretation is quite analogous. Again, both vibra- tional infrared fluorescence, as well as the electronic A *II+X *Z emission are present. Compared with the Ar matrix, the electronic emission bands exhibit stronger ZPLs, and much less prominent phonon sidebands. Also the integrated intensity of the near infrared electronic emission relative to the vibra- tional fluorescence is considerably lower than in argon.
Viewed at higher resolution, the 1+-O fundamental absorption of ‘*CN in neon exhibits four peaks near 2046 cm-‘. The same contour occurs in the i3CN sample near 2000 cm-i which indicates that the CN radical is stabilized in different trapping sites. Two peaks agree with the frequencies measured in the pre- vious laser induced fluorescence studies [ 141. The main site in this work is observed at 2043.6 cm-’ in absorption with a slightly different value of 2043.1 cm-i being measured in emission. These frequencies are also in good agreement with the 2043.7 cm-’ ab- sorption recently reported by Fomey et al. [ 301.
Very similar neon matrix spectra were also ob- tained for 13CN in experiments using an isotopically enriched precursor. The emission spectra resemble those obtained with the normal ‘*C isotope, but in this case the relative emission intensity of the elec- tronic fluorescence to the vibrational emission is nearly an order of magnitude higher as shown in figs. 4b and 4c.
3.3. CN spectroscopic constants
All the observed transitions of CN for both iso- topes studied are listed in table 1. Table 2 summa- rizes the spectroscopic constants obtained by analy- sis of these data. The vibrational data alone in solid
260 B.E. Wu@l et al. / Chemical Physics 174 (1993) 255-265
6000 wavenumber (cm”)
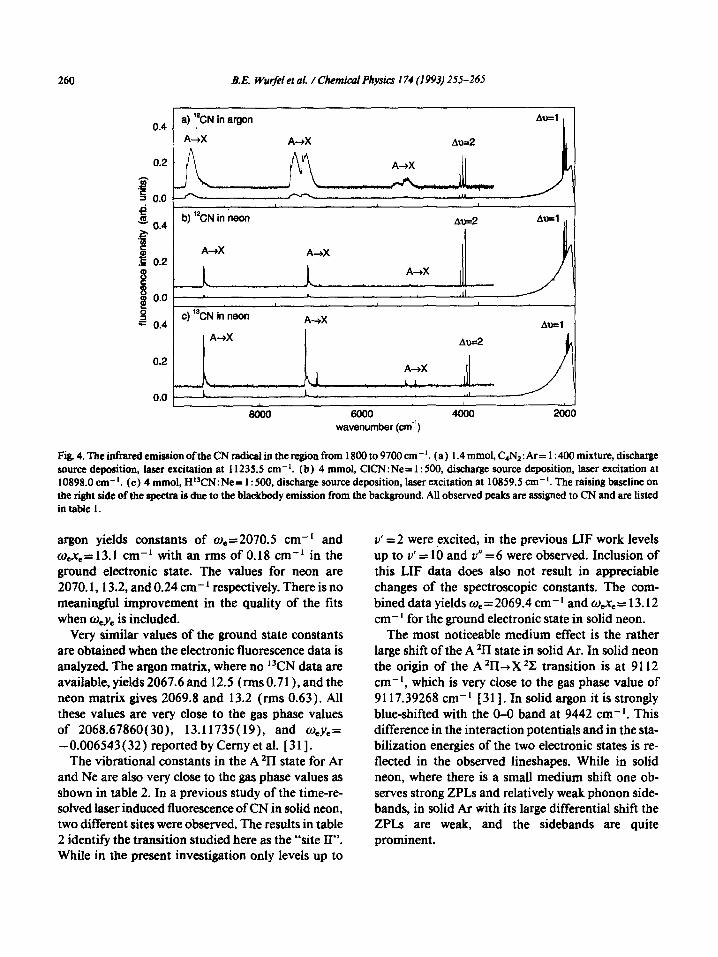
Fig. 4. The infrared emission ofthe CN radicalin the region from 1800 to 9700 cm-‘. (a) 1.4 mmol, C4N2:Ar= 1:400 mixture, discharge source deposition, laser excitation at 11235.5 cm-‘. (b) 4 mmol, ClCN:Ne= 1: 500, discharge source deposition, laser excitation at 10898.0 cm-‘. (c) 4 mmol, HWN:Ne= 1: 500, discharge source deposition, laser excitation at 10859.5 cm-‘. The raising baseline on the ri@t side of the spectra is due to the blackbody emission from the background. All observed peaks are assigned to CN and are listed in table 1.
argon yields constants of w,=2070.5 cm-’ and v’ = 2 were excited, in the previous LIF work levels 0,x,=13.1 cm-’ with an rms of 0.18 cm-i in the up to v’ = 10 and v” = 6 were observed. Inclusion of ground electronic state. The values for neon are this LIF data does also not result in appreciable 2070.1,13.2, and 0.24 cm- ’ respectively. There is no changes of the spectroscopic constants. The com- meaningful improvement in the quality of the tits bined data yields w,=2069.4 cm-’ and w&= 13.12 when o,y, is included. cm-’ for the ground electronic state in solid neon.
Very similar values of the ground state constants are obtained when the electronic fluorescence data is analyzed. The argon matrix, where no “CN data are available, yields 2067.6 and 12.5 (rms 0.7 1 ), and the neon matrix gives 2069.8 and 13.2 (rms 0.63). All these values are very close to the gas phase values of 2068.67860(30), 13.11735( 19), and o,y,= - 0.006543 (32 ) reported by Cemy et al. [ 3 11.
The vibrational constants in the A 211 state for Ar and Ne are also very close to the gas phase values as shown in table 2. In a previous study of the time-re- solved laser induced fluorescence of CN in solid neon, two different sites were observed. The results in table 2 identify the transition studied here as the “site II”. While in the present investigation only levels up to
The most noticeable medium effect is the rather large shift of the A *II state in solid Ar. In solid neon the origin of the A 211-+X 2I; transition is at 9112 cm-‘, which is very close to the gas phase value of 9 117.39268 cm-’ [ 3 11. In solid argon it is strongly blue-shifted with the O-O band at 9442 cm-‘. This difference in the interaction potentials and in the sta- bilization energies of the two electronic states is re- flected in the observed lineshapes. While in solid neon, where there is a small medium shift one ob- serves strong ZPLs and relatively weak phonon side- bands, in solid Ar with its large differential shift the ZPLs are weak, and the sidebands are quite prominent.
B.E. Wurfer et al. /Chemical Physics 174 (1993) 255-265 261
0.5
0.3
g 0.2
z J
'm * 0.1 s .z
1 0.3
$8 Z
0.2
x k+(u’ + u”) 3-12 -
a) ‘*CN 2+1
11 l
2+1
L__i
14 L
3-2 4+3
0.1' 2050
/
2ooo 1950 wavenumber(cm“)
1900
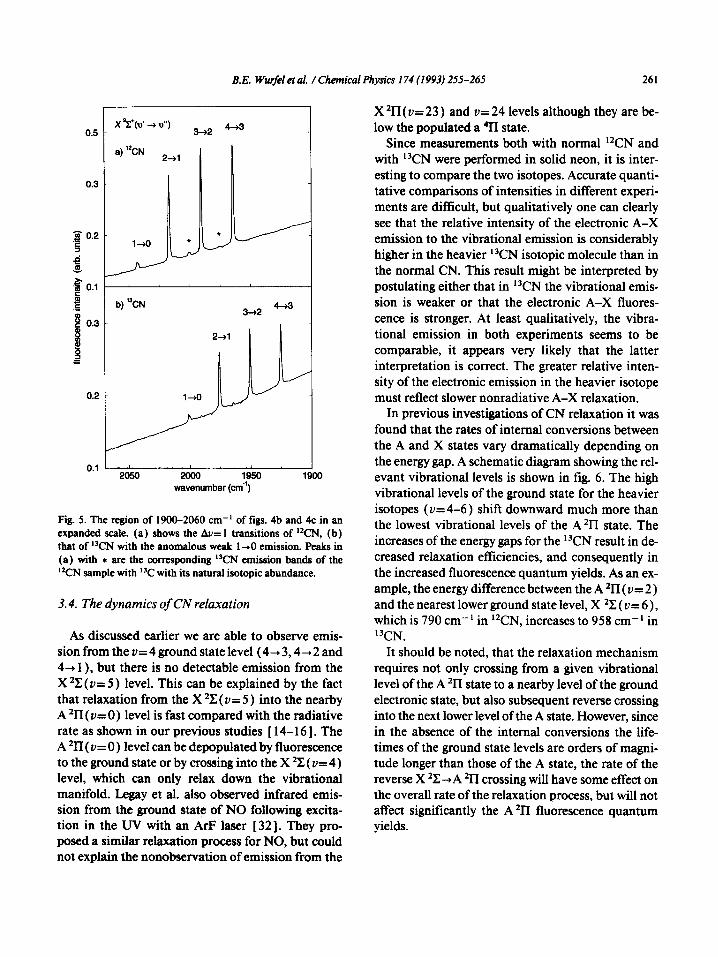
Fig. 5. The region of 1!300-2060 cm-’ of figs. 4b and 4c in an expanded scale. (a) shows the Au= 1 transitions of ‘TN, (b) that of %N with the anomalous weak l-0 emission. Peaks in (a) with * are the corresponding ICN emission bands of the ‘%N sample with ‘“C with its natural isotopic abundance.
3.4. The dynamics of CN relaxation
As discussed earlier we are able to observe emis- sion from the v=4 ground state level (4+3,4+2 and 4+ 1 ), but there is no detectable emission from the X *ZZ (u= 5) level. This can be explained by the fact that relaxation from the X *Z (v= 5 ) into the nearby A 2n ( u= 0) level is fast compared with the radiative rate as shown in our previous studies [ 14-161. The A ‘II( u= 0) level can be depopulated by fluorescence to the ground state or by crossing into the X 2X ( V= 4) level, which can only relax down the vibrational manifold. Legay et al. also observed infrared emis- sion from the ground state of NO following excita- tion in the UV with an ArF laser [ 321. They pro- posed a similar relaxation process for NO, but could not explain the nonobservation of emission from the
X ‘II (v= 23 ) and V= 24 levels although they are be- low the populated a 411 state.
Since measurements both with normal ‘*CN and with i3CN were performed in solid neon, it is inter- esting to compare the two isotopes. Accurate quanti- tative comparisons of intensities in different experi- ments are difficult, but qualitatively one can clearly see that the relative intensity of the electronic A-X emission to the vibrational emission is considerably higher in the heavier i3CN isotopic molecule than in the normal CN. This result might be interpreted by postulating either that in “CN the vibrational emis- sion is weaker or that the electronic A-X fluores- cence is stronger. At least qualitatively, the vibra- tional emission in both experiments seems to be comparable, it appears very likely that the latter interpretation is correct. The greater relative inten- sity of the electronic emission in the heavier isotope must reflect slower nonradiative A-X relaxation.
In previous investigations of CN relaxation it was found that the rates of internal conversions between the A and X states vary dramatically depending on the energy gap. A schematic diagram showing the rel- evant vibrational levels is shown in fig. 6. The high vibrational levels of the ground state for the heavier isotopes (v= 4-6) shift downward much more than the lowest vibrational levels of the A% state. The increases of the energy gaps for the i3CN result in de- creased relaxation efficiencies, and consequently in the increased fluorescence quantum yields. As an ex- ample, the energy difference between the A *II ( V= 2 ) and the nearest lower ground state level, X *I; (u= 6) which is 790 cm- ’ in ‘*CN, increases to 958 cm-’ in 13CN.
It should be noted, that the relaxation mechanism requires not only crossing from a given vibrational level of the A *II state to a nearby level of the ground electronic state, but also subsequent reverse crossing into the next lower level of the A state. However, since in the absence of the internal conversions the life- times of the ground state levels are orders of magni- tude longer than those of the A state, the rate of the reverse X *L+A *II crossing will have some effect on the overall rate of the relaxation process, but will not affect significantly the A*II fluorescence quantum yields.

262 B.E. Wurfel et al. /Chemical Physics I74 (1993) 255-265
Table 1 Experimental frequencies (cm- ’ ) of CN in rare gas matrices
V’Hy Argon matrix *) Neon matrix ‘)
x22+ 1-o 2044.4( 1) c, l+O 2044.4( 1) 2-l 201&1(l) 3-2 1991.8(3) 4-3 1965.5(3) 2-O 4062.5 ( 1) 3-+l 4009.9(3) 4-2 3957.5(3) 3-O 6054( 1) 4-l 5975.5(5)
A211(v’)wX2X+(~“) O-0 oco o-1 o-+2 1-O It0 l-*1 1+2 l-3 2-O 2+0 2+1 2-2 2-3 2-4 3+0 4+0
9442(3) 9448(l) 7398(2) 5380( 5)
11235(l) 9186(3) 7166(2) 5175(2)
12988(3) 12995(l)
14731( 1) 16440(2)
2001.9(l)
1976.8( 1) 1951.6( 1) 1926.4( 1) 3978.7(2) 3928.4( 1) 3877.9( 1) 5929(l) 5854(2)
2043.0(7) 2043.6(5) 2017.2(5) 1990.9(5)
1936.8(l) 1964.4(5) 4061.0(5) 4008.3(5)
3899.2(2) 3955.5(5) 6052.0(5) 5972.7(5)
9112.3(5) 9112(l) 7068.8(5) 5051(2)
10897.8(5) 10897.2(5)
6836.9(5) 4846(5)
12658( 1) 10615(5)
14392(2) 16100(8)
2001.2(5) 2001.3(S) 1975.9(5) 1950.6(5) 1925.3(5) 1895.6(5) 3977.5(5) 3926.8(5) 3876.2(5) 5928.4(5) 5852.4(5)
9111(l) 9110(l) 71 lO(2) 5134.6(5)
10861.1(s) 10859( 1) 8859.8(5) 6883.9(5) 4933.3(5)
12583( 1) 10584.4(5) 8609(l) 6657.6(5) 4732.4( 5)
14283(2) 15959(2)
‘) Excitation of the A 211 (v’ = 1) zero phonon line (ZPL ). b)ExcitationoftheA211(v’=1)ZPLorA211(v’=2)ZPL. c, Uncertainty includes spectral resolution and error in the determination of the exact peak maximum.
3.5. The effect of the matrix The same “phonon Franck-Condon factors”, which lead to the appearance of extensive phonon side-
It is also interesting to examine the effect of the rare gas medium, and compare the relaxation in solid ar- gon and neon. It can be seen readily in fig. 4 that the integrated intensity of the electronic A*II+X*Z emission relative to the vibrational fluorescence is more than order of magnitude higher in argon than in neon. It has been noted above, and is easily seen in the figure that the A-X emission bands in solid argon exhibit much more prominent phonon side- bands. These indicate that in argon the guest-host in- teraction potentials are considerably different in the A and the X state, consistent with the observed large differential shift of the two states discussed above.
bands in the A *II-+X *Z spectrum will also favor a more efficient nonradiative A *II-+X *C relaxation, quite contrary to the observation.
To explain the observed trend, one has to note the effects of the differential shift of the X *C and A *II vibrational manifolds. In solid At-, the A *II state is some 350 cm-’ blue-shifted, resulting in a corre- sponding increase in the relevant energy gaps. Thus, to stay with the example used above in comparing the two carbon isotopic species in neon matrix, while in neon the A( y-2) level lies 790 cm-’ above the near- est lower ground state X (v= 6)) the energy gap in- creases to 1114 cm- * in solid argon. Apparently these
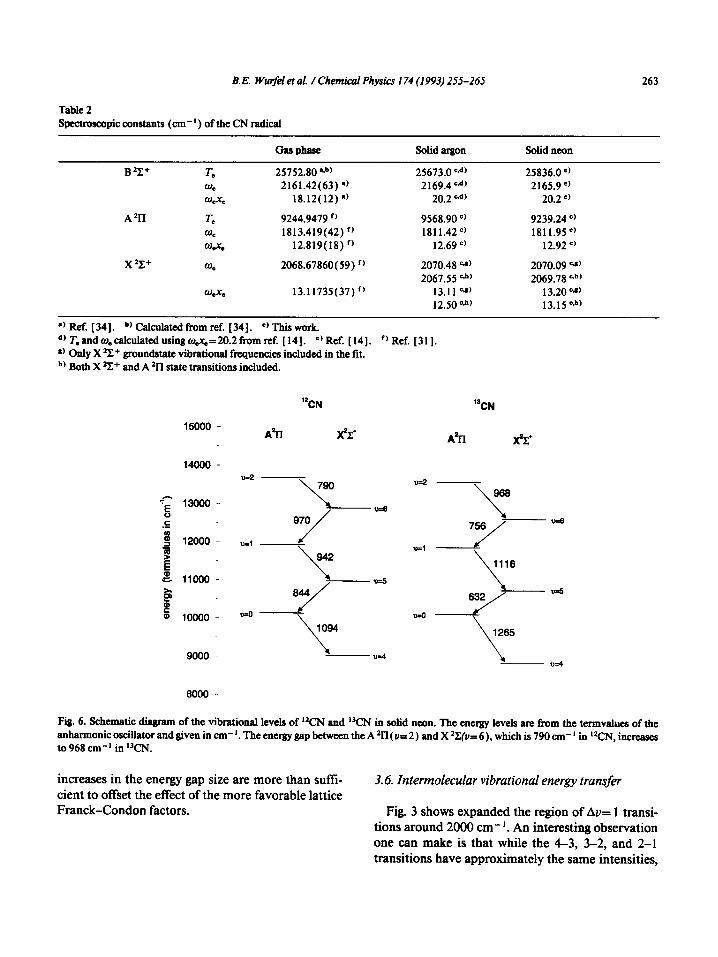
Table 2
B.E. Wu&l et al. / Chemical Physics I74 (1993) 255-265 263
Spectroscopic constants (cm-‘) of the CN radical
GasPhase Solid argon Solid neon
25152.80 .vb’ 2161.42(63) a)
18.12(12) a)
9244.9479 r) 1813.419(42) ()
12.819(18) ‘1
2068.67860( 59) f,
13.11735(37) r)
25673.0 c-d) 25836.0 ‘) 2169 4 G*)
20:2 +*’ 2165.9 c’
20.2 =’
9568.90 c, 1811.42@
12.69 ‘)
9239.24 =) 1811.95 c,
12.92 =)
2070.48 Cd) 2067.55 G’
13.llW 12.50 c.b)
2070.09 CJ) 2069 18 =s)
13:20 -1 13.15 c&j
‘) Ref. [34]. b, Calculated from ref. [34]. Cl This work. *~T.andw,calcu1atedusingw~~=20.2fi-omref. [14]. “‘Ref. [14]. “Ref. [31]. s) Only X 2Z+ groundstate vibrational frequencies included in the tit. s) Both X 2E+ and A 21T state transitions included.
15000
14000-
7; 13000 - 0 .E
1 12000 -
!I? E & llOOO-
!z a 10000 -
9000 -
8000 -
“CN
A3-l x%+
‘-‘-\“I_., 970 / u=l -
942 \ - v=s v uco-
1094
\ ~ u=4
AT-I XT
u=2 -
\
..G
-UC8
\
u=a -
\ 1265
Fig 6. Schematic diagram of the vibrational levels of “CN and %N in solid neon. The energy levels are from the termvalues of the anharmonic oscillator and given in cm-‘. The energy gap between the A 21T(u= 2) and X %(u= 6), which is 790 cm-’ in WN, increases to 968 cm-’ in *YIN.
increases in the energy gap size are more than suff~- cient to offset the effect of the more favorable lattice Franck-Condon factors.
3.4. Intermolecular vibrational energy transfer
Fig. 3 shows expanded the region of Av= 1 transi- tions around 2000 cm-‘. An interesting observation one can make is that while the 4-3, 3-2, and 2-l transitions have approximately the same intensities,

264 B.E. Wurfer et al. / Chemical Physics 174 (1993) 255-265
the 1-O fundamental transition is nearly an order of magnitude weaker. In the absence of competing non- radiative processes one might expect the fundamen- tal transition to have the highest intensity: for each photon emitted on the 2-l transition, one molecule ends up in the V= 1 level, and, in absence of other processes, will relax by emitting a fundamental 1-O photon. Additional population will be arriving in the V= 1 level via Au= 2 or 3 processes, which occur rather efftciently, as can be seen in the spectrum. Also elec- tronic A 211-+X 2Z fluorescence should contribute to the v= 1 level population. Some depopulation of the v= 1 level can occur via the two-photon processes discussed above. Since the emission from the A 211 ( v’ = 2 ) level could be observed only with the photomultiplier, which is orders of magnitude more sensitive than the InSb detector, the depopulation by this absorption mechanism is probably very small. Clearly the distribution can not be explained by ra- diative processes alone.
One might propose that the 1-O photons are ab- sorbed by the ground state molecules, but this expla- nation is clearly unsatisfactory. In the first place the photon is not lost but only transferred to another molecule. If one recorded the sample emission re- solved in time one would observe lengthening of the lifetime, but the total number of emitted photons would remain the same. Furthermore, the absorption spectra show that the CN fundamental absorption is too weak to explain an effect of this magnitude.
The explanation clearly lies in the nonradiative processes occurring in the matrix. Excited molecules in the v= 1 level can very efficiently transfer energy to the nearby ground state molecules by the resonant process:
In this way the v= 1 excitation can wander through the solid and can eventually arrive in the neighbor- hood of another CN molecule in the v= 1 or higher excited level. As has been shown in the elegant work of Dubost and co-workers [ 33 1, at the temperature of the matrix, entropy is unimportant, and “ladder climbing” exothermic processes can be quite efficient:
CN(v=l)+CN(v=n)
-CN(v=O)+CN(v=n+l)+bE.
In this way the v= 1 levels are selectively depopu- lated, and 1-O photons are continuously converted into the overtones. The higher excited levels could also, in principle, resonantly transfer energy to their ground state neighbours:
CN(v=2)+CN(v=O)-+CN(v=O)+CN(v=2).
The cross sections for such processes are orders of magnitude smaller than for the v= 1 molecules, and these higher excited molecules are effectively local- ized. This is evidenced by the observation that only the 1-O transition is anomalously weak. No similar intensity loss is observed for the emission of the higher vibrational levels. The same observation of anoma- lously weak 1-O transition is made also in experi- ments with isotopically substituted 13C as shown in fig. 3c. The mechanism is the same as in the normal sample.
In the spectrum with the 12CN sample in fig. 3a, one can also clearly observe “CN emission. In this case, however, the 1-O transition is the strongest. In the predominantly i2C sample, the 13CN molecules may have nearest neighbor i2CN species. The exo- thermic process,
can take place and results in populating the v= 1 level of the 13CN, as evidenced by its emission. The re- verse process, on the other hand, will be endothermic and is reduced by the Boltzmann factor (about 2 or- ders of magnitude in Ar). As a result the “CN( v= 1) molecules in the predominantly “C sample will be localized and will be only depopulated by emission. It may be noted that the “CN( v= 1) emission has at least an order of magnitude higher intensity than one would expect based purely on the natural isotopic abundance. This is due to the above discussed non- radiative depopulation of the ‘*CN( v= 1) level, as well as to enhancement of the i3CN( v= 1) emission due to energy transfer from the “CN.
4. Conclusion
Laser excitation of CN trapped in solid argon and neon into the A 211 state results in infrared emission
B.E. Wurfer et al. /Chemical Physics I74 (1993) 255-265 265
from the vibrationally excited ground electronic state levels. This confirms the relaxation mechanism via internal conversion between the A and X vibrational manifolds found in the earlier time-resolved studies. The guest-host interaction is much stronger in argon than in neon. This leads to a blue-shift of 350 cm-’ of the A 211 state and to broad phonon sidebands of the vibronic A *II-+X 2C transitions. Efficient non- radiative processes occur in the matrix which result in energy transfer between distinct molecules.
Acknowledgement
We thank Klaus Fritz for the preparation of HCN, Hi3CN and ClCN, and Dr. Josef Silha for the synthe- sis of NC.,N. The partial support of this work by the Deutsche Forschungsgemeinschaft as well as assis- tance by the Fond der Chemischen Industrie is grate- fully acknowledged.
References
[ 1 ] ME. Jacox, J. Phys. Chem. Ref. Data 13 (1984) 945; 17 (1988) 269; 19 (1990) 1387.
[2] L. Andrews and M. Moskovits, Chemistry and physics of matrix-isolated species (North-Holland, Amsterdam, 1989).
[ 31 V.E. Bondybey, in: Annual review of physical chemistry, eds. B.S. Rabinovitch, J.M. Schurr and H.L. Strauss (Annual Reviews Inc., Palo Alto, CA, 1984).
[4] M.J. Almond and A.J. Downs, in: Spectroscopy of matrix isolated species, eds. R.J.H. Clark and R.E. Hester (Wiley, New York, 1989), and references therein.
[5] L.E. Brus and V.E. Bondybey, J. Chem. Phys. 63 (1975) 786.
[6] V.E. Bondybey and L.E. Brus, J. Chem. Phys. 63 ( 1975) 794.
[ 71 J.M. Wiesenfeld and C.B. Moore, J. Chem. Phys. 70 ( 1979) 930.
[ 8 ] L. Abouaf-Marguin, B. Gauthier-Roy and F. Legay, Chem. Phys. 23 (1977) 443.
[ 91 B. Gauthier-Roy, L. Abouaf-Marguin and F. Legay, Chem. Phys.46 (1980) 31.
[ lo] L. Abouaf-Marguin and B. Gauthier-Roy, Chem. Phys. 5 1 (1980) 213.
[ 111 M. Berkowitz and R.B. Gerber, Chem. Phys. Letters 49 (1977) 260.
[ 121 R.B. Gerber, M. Berkowitz and V. Yakhot, Mol. Phys. 36 (1978) 355.
[ 131 M. Berkowitz and R.B. Gerber, Chem. Phys. 37 (1979) 369. [ 141 V.E. Bondybey, J. Chem. Phys. 66 ( 1977) 995. [ 151 V.E. Bondybey and A. Nitxan, Phys. Rev. Letters 38 ( 1977)
889. [ 161 D.H. Katayama, T.A. Miller and V.E. Bondybey, J. Chem.
Phys. 71 (1979) 1662. [ 171 H. Dubost and F. Legay, in: Chemistry and physics of
matrix-isolated species, eds. L. Andrews and M. Moskovits (North-Holland, Amsterdam, 1989) p. 303.
[ 181 L. Young and C.B. Moore, J. Chem. Phys. 76 (1982) 5869; 81 (1984) 3137.
[ 191 A.D. Abbate and C.B. Moore, J. Chem. Phys. 82 (1985) 1263; 83 (1985) 975.
[20] A. Thoma, B.E. Wurfel, R. Schlachta, G. Lask and V.E. Bondybey, J. Phys. Chem. 96 ( 1992) 723 1.
[21] A.M. Smith, G. Schallmoser, A. Thoma and V.E. Bondybey, J. Chem. Phys. 98 (1993) 1.
[22] R. Schlachta, G.M. Lask, S.H. Tsay and V.E. Bondybey, Chem. Phys. 155 (1991) 267.
[23] G.M. Lask, J. Agreiter, R. Schlachta and V.E. Bondybey, Chem. Phys. Letters 205 ( 1993) 3 1.
[ 241 W. Weltner Jr. and D. McLeod Jr., J. Chem. Phys. 40 ( 1964) 1305.
[25]R. Bhatnagar, J.L. Wilkerson, G.R. Smith and W.A. Guillory, J. Mol. Spectry. 85 ( 198 1) 348.
[26] B.E. Wurfel, A. Thoma, R. Schlachta and V.E. Bondybey, Chem. Phys. Letters 190 ( 1992) 119.
[27] D.E. Milligan and M.E. Jacox, J. Chem. Phys. 47 (1967) 278.
[28] V.E. Bondybey, J. Chem. Phys. 65 (1976) 2296. [29] W.C. Easley and William W. Weltner Jr., J. Chem. Phys. 52
(1970) 197. [ 301 D. Fomey, W.E. Thompson and M.E. Jacox, J. Chem. Phys.
97 (1992) 1664. [ 311 D. Cemy, R. Bacis, G. Guelachvili and F. Roux, J. Mol.
Spectry. 73 (1978) 154. [ 321 F. Legay, N. Legay-Sommaire, A. Tramer, M. Chergui and
N. Schwenter, J. Phys. Chem. 92 ( 1988) 26 1. [ 331 H. Dubost and R. Chameau, Chem. Phys. 12 ( 1976) 407. [ 341 B.D. Rehfuss, M.-H. Suh, T.A. Miller and V.E. Bondybey,
J. Mol. Spectry. 15 1 ( 1992) 437.