Information Retrieval from Unstructured Web Text based on Automatic learning of the Threshold
19
IJIRR: International Journal of Information Retrieval Research. In press, 2013. Information Retrieval from Unstructured Web Text based on Automatic learning of the Threshold Fethi Fkih and Mohamed Nazih Omri MARS Research Unit, Faculty of sciences of Monastir, University of Monastir, 5019 Monastir, Tunisia ABSTRACT Collocation is defined as a sequence of lexical tokens which habitually co-occur. This type of information is widely used in various applications such as Information Retrieval, document indexing, machine translation, lexicography, etc. Therefore, many techniques are developed for the automatic retrieval of collocations from textual documents. These techniques use statistical measures based on a joint frequency calculation to quantify the connection strength between the tokens of a candidate collocation. The discrimination between relevant and irrelevant collocations is performed using a priori fixed threshold. Generally, the discrimination threshold estimation is performed manually by a domain expert. This supervised estimation is considered as an additional cost which reduces system performance. In this paper, we propose a new technique for the threshold automatic learning. This technique is mainly based on the usual performance evaluation measures (such as ROC and Precision-Recall curves). The results show the ability to automatically estimate a statistical threshold independently to the treated corpus. Keywords: Collocations Retrieval, Statistical Threshold, Binary Classification, Performance Evaluation, ROC curves, Youden Index. 1. INTRODUCTION Currently, the Web is considered as the most used source of knowledge. It brings a huge amount of heterogeneous information (text, image, videos, etc.). Among this information, the unstructured textual content remains the most important. In fact, textual data are very rich of important kinds of information (such as: named entities, terms, collocations, etc.) which are useful in several applications (such as: indexing, machine translation, documents classification, construction of linguistic resources, Lexicography, Parsing, etc.). There are several tools for automatic knowledge retrieval from the web. These techniques often use linguistic, statistical or hybrid approaches. Each approach tries to exploit linguistic and statistical features of the information to be retrieved. In this paper we will focus on the retrieval of a particular kind of knowledge, i.e. word collocations, which are
Transcript of Information Retrieval from Unstructured Web Text based on Automatic learning of the Threshold
IJIRR: International Journal of Information Retrieval Research. In press, 2013.
Information Retrieval from Unstructured
Web Text based on Automatic learning
of the Threshold
Fethi Fkih and Mohamed Nazih Omri
MARS Research Unit, Faculty of sciences of Monastir,
University of Monastir, 5019 Monastir, Tunisia
ABSTRACT
Collocation is defined as a sequence of lexical tokens which habitually co-occur. This type of
information is widely used in various applications such as Information Retrieval, document
indexing, machine translation, lexicography, etc. Therefore, many techniques are developed for
the automatic retrieval of collocations from textual documents. These techniques use statistical
measures based on a joint frequency calculation to quantify the connection strength between the
tokens of a candidate collocation. The discrimination between relevant and irrelevant
collocations is performed using a priori fixed threshold. Generally, the discrimination threshold
estimation is performed manually by a domain expert. This supervised estimation is considered
as an additional cost which reduces system performance. In this paper, we propose a new
technique for the threshold automatic learning. This technique is mainly based on the usual
performance evaluation measures (such as ROC and Precision-Recall curves). The results show
the ability to automatically estimate a statistical threshold independently to the treated corpus.
Keywords: Collocations Retrieval, Statistical Threshold, Binary Classification, Performance
Evaluation, ROC curves, Youden Index.
1. INTRODUCTION
Currently, the Web is considered as the most
used source of knowledge. It brings a huge
amount of heterogeneous information (text,
image, videos, etc.). Among this
information, the unstructured textual content
remains the most important. In fact, textual
data are very rich of important kinds of
information (such as: named entities, terms,
collocations, etc.) which are useful in
several applications (such as: indexing,
machine translation, documents
classification, construction of linguistic
resources, Lexicography, Parsing, etc.).
There are several tools for automatic
knowledge retrieval from the web. These
techniques often use linguistic, statistical or
hybrid approaches. Each approach tries to
exploit linguistic and statistical features of
the information to be retrieved.
In this paper we will focus on the
retrieval of a particular kind of knowledge,
i.e. word collocations, which are
IJIRR: International Journal of Information Retrieval Research. In press, 2013.
characterized by specific linguistic and
statistical properties (Seretan, 2011).
According to Manning and Schütze (1999),
they can be characterized by three linguistic
properties:
Limited compositionality: the
meaning of the collocation is not a
composition of the meanings of its
parts. For example, the meaning of
the collocation “strong tea” is
different from the composition of the
meaning of “strong” and the
meaning of “tea”.
Limited substitutability: we cannot
substitute a part of a collocation by
her synonym. For example, “strong”
in “strong tea” cannot be substituted
by “muscular”.
Limited modifiability: many
collocations cannot be supplemented
by additional words. For example,
the collocation “to kick the bucket”
cannot be supplemented as “to kick
the {red/plastic/water} bucket”
(Wermter and Hahn, 2004).
Indeed, the retrieval of collocations
requires two main tasks: recognizing
interesting collocations in the text;
classifying them according to classes
predefined by the expert. Firth (1957)
asserts that “you shall know a word by the
company it keeps”. In this perspective, the
techniques used for the collocations retrieval
are often based on the calculation of the
joint frequency of a pair of words within a
sliding window of fixed size (Church et al.,
1989). In practice, the joint frequency is
used to calculate a score that measures the
attachment force between two words in a
given text. If this force exceeds a threshold
fixed a priori, we can judge in this case that
the couple can form a pertinent collocation.
The collocation retrieval problem can be
seen as a binary classification problem.
Collocations will be classified by the system
into two classes: relevant and irrelevant.
This classification depends mainly on two
parameters: the statistical value used to
weight collocations, and the threshold value
used for the discrimination. Estimation of
the discrimination threshold is a problem
very known in several scientific fields (such
as: signal processing, image processing,
information retrieval, etc.). In fact we can
find in the literature a wide range of
machine learning techniques for the
prediction of the threshold as, among other
things, Bayesian networks (Gustafson et al.,
2009), Perona-Malik Model (Shao and Zou,
2009), genetic algorithm (Lia et al., 2012),
etc..
Like other areas of knowledge, the choice
of the ideal threshold is considered as a
problem in the terminology retrieval field.
However, we don’t find in the literature any
exact rules to justify this choice. On the
other hand, a domain expert is tasked with
determining the threshold value the most
suitable for retrieval. The manual estimation
of the threshold has a significant cost on the
retrieval systems performance.
Thus, in this paper we try to shed light on
the threshold determination problem by
exploring, first, the techniques used in
several scientific areas (such as biomedical
and biometric) and applying them on the
statistical terminology field. Our approach is
mainly based on statistical techniques of
performance measurement of binary
classification systems, namely, ROC,
Precision-Rappel, Accuracy and Cost
curves.
The remainder of this paper is structured
as follows. First, we present the theoretical
basis of the statistical approach for
collocations retrieval. Then, we identify the
main measures used to evaluate the
performance of binary classifiers. Finally we
IJIRR: International Journal of Information Retrieval Research. In press, 2013.
conclude with an exposition of the obtained
results.
2. COLLOCATIONS RETRIEVAL
2.1 Definition
In the statistical approach, collocation is
considered as a sequence of words (n-gram)
among millions of other possible word
sequences. In Church and Hunks (1990)
work, a collocation as defined is a pair of
words that appear together more often than
expected.
Benson (1990) defines collocation as an
arbitrary and recurrent word combination.
This definition emerges from the statistic
interpretation of Firth (1957), which is based
on the following proposition: a collocation
consists of a number of lexemes appearing
often enough in a representative corpus at a
distance <n (see also Halliday (1966)).
Smadja (1993) considers that these
definitions don’t cover some aspects and
properties of collocations that affect a
number of machine applications. Therefore,
he enriches these definitions by four
properties:
Collocations are arbitrary:
collocations are difficult to produce
for second language learners; it’s
difficult to translate a collocation
word-for-word.
Collocations are domain-dependent:
they are related to the treated
knowledge area (medical, biologic,
etc.).
Collocations are recurrent: these
combinations are not exceptions;
they are very often repeated in a
given context.
Collocations are cohesive lexical
clusters: the presence of one or
several words of the collocations
often implies or suggests the rest of
the collocation
The remainder of this paper, we adopt
this definition. In fact, this definition is very
appropriate with our application domain,
namely the biomedical area, which is very
rich in collocations that are considered
highly relevant technical terms that, can
perfectly describe the content of the
biomedical corpus. Way of example, we cite
some collocations belonging to the
biomedical field: bilateral hemianopia,
cobalt allergy, EDTA molecule, ribonucleic
acids, etc.
Subsequently, we present the statistical
technique used for collocations retrieval.
2.2 Statistical approach for collocations retrieval
The collocations retrieval technique is
based on a simple principle: if two words
frequently appear together, then there’s a
chance that they form a meaningful lexical
sequence (or a pertinent term). In practice,
we calculate a score that measures the
attachment force between two words in a
given text. If this force exceeds a threshold
fixed a priori, we can judge in this case that
the couple can form a pertinent term.
Before calculating the words joint
frequency we must, first, reduce them to a
canonical form. Stemming (or
lemmatization) can solve the terminological
variation problem. The terminological
variation can be graphical, inflectional or
otherwise. In fact, terminology variation can
disrupt the results if we consider two
variations of the same token as two different
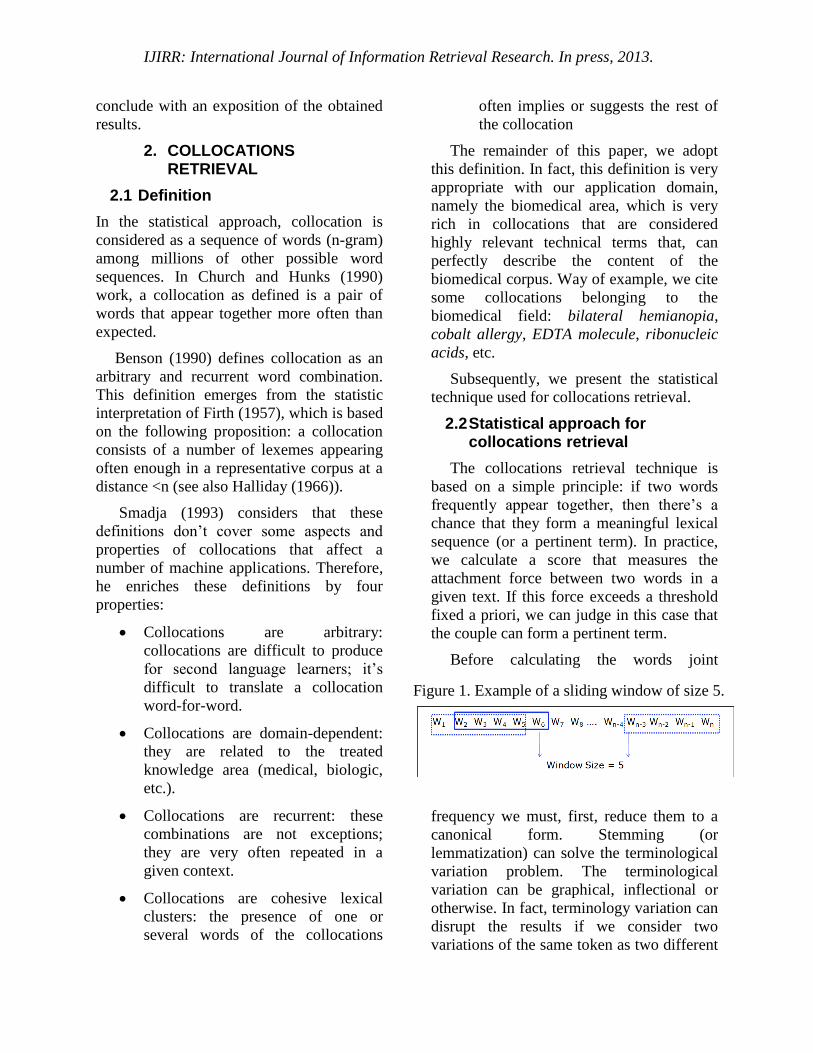
Figure 1. Example of a sliding window of size 5.
IJIRR: International Journal of Information Retrieval Research. In press, 2013.
units. Example, the lexical units "acids" and
"Acid" are reduced to their canonical form
"acid" that will accumulate the frequencies
sum of all its variations.
Next, we apply on the text a common
statistical technique presented by Church
and hanks (1990). This technique consists in
moving a sliding window of size T over the
text (see Fig. 1).
For each pair of lemma (w1,w2),
(w1,w3),…, (w1,wT) we increment its
occurrence frequency in the corpus. We
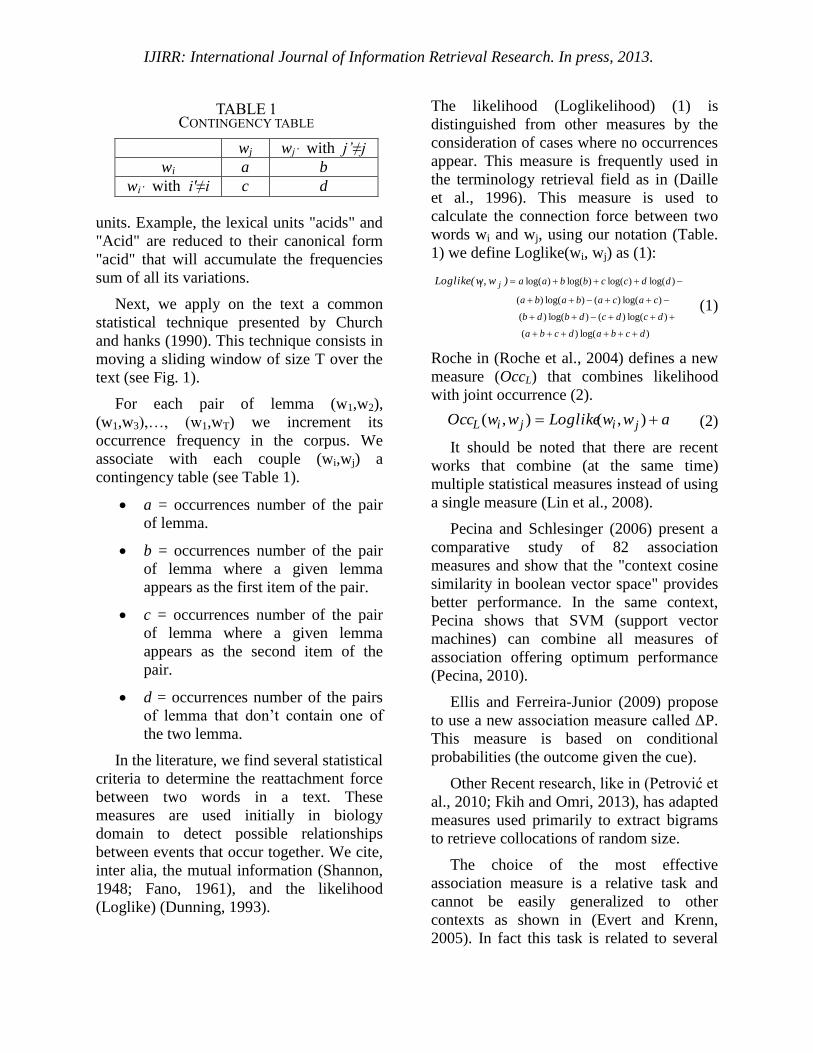
associate with each couple (wi,wj) a
contingency table (see Table 1).
a = occurrences number of the pair
of lemma.
b = occurrences number of the pair
of lemma where a given lemma
appears as the first item of the pair.
c = occurrences number of the pair
of lemma where a given lemma
appears as the second item of the
pair.
d = occurrences number of the pairs
of lemma that don’t contain one of
the two lemma.
In the literature, we find several statistical
criteria to determine the reattachment force
between two words in a text. These
measures are used initially in biology
domain to detect possible relationships
between events that occur together. We cite,
inter alia, the mutual information (Shannon,
1948; Fano, 1961), and the likelihood
(Loglike) (Dunning, 1993).
The likelihood (Loglikelihood) (1) is
distinguished from other measures by the
consideration of cases where no occurrences
appear. This measure is frequently used in
the terminology retrieval field as in (Daille
et al., 1996). This measure is used to
calculate the connection force between two
words wi and wj, using our notation (Table.
1) we define Loglike(wi, wj) as (1):
(1)
Roche in (Roche et al., 2004) defines a new
measure (OccL) that combines likelihood
with joint occurrence (2).
(2)
It should be noted that there are recent
works that combine (at the same time)
multiple statistical measures instead of using
a single measure (Lin et al., 2008).
Pecina and Schlesinger (2006) present a
comparative study of 82 association
measures and show that the "context cosine
similarity in boolean vector space" provides
better performance. In the same context,
Pecina shows that SVM (support vector
machines) can combine all measures of
association offering optimum performance
(Pecina, 2010).
Ellis and Ferreira-Junior (2009) propose
to use a new association measure called ΔP.
This measure is based on conditional
probabilities (the outcome given the cue).
Other Recent research, like in (Petrović et
al., 2010; Fkih and Omri, 2013), has adapted
measures used primarily to extract bigrams
to retrieve collocations of random size.
The choice of the most effective
association measure is a relative task and
cannot be easily generalized to other
contexts as shown in (Evert and Krenn,
2005). In fact this task is related to several
TABLE 1 CONTINGENCY TABLE
wj wj’ with j’≠j
wi a b
wi’ with i'≠i c d
)log()(
)log()()log()(
)log()()log()(
)log( )log()log()log(
dcbadcba
dcdcdbdb
cacababa
ddccbbaa), wLoglike(w ji
),(),( awwLoglikewwOcc jijiL
IJIRR: International Journal of Information Retrieval Research. In press, 2013.
constraints such as the type and the size of
the corpus used and the target application.
Based on experimental studies, Roche in
(Roche et al., 2004) has proved that OccL
measure admits a higher discriminative
ability than other measures and offers,
therefore, the best result. Roche has made
his experiments on a corpus very similar to
our test corpus. That’s why; we choose this
measure to retrieve collocations in our work.
Collocations classification into two classes
"relevant" and "irrelevant" is based mainly
on the choice of an optimal decision
threshold that can provide maximum
performance to the retrieval system.
Thereafter, we make a survey of the work
concerning the measurement of binary
classifiers performance.
2.3 Statistical threshold estimation
Statistical thresholds are often used to
classify events having similar behavior
dependent on a statistical criterion. Indeed,
this similarity will induce an ambiguity in a
decision-making or classification process. In
a statistical test, the events are presented by
a weight that quantifies their importance in
the test based on statistical observations. In
the case of a binary classification, events are
classified into two classes: a class
representing the events statistical with
indices above the threshold and a class that
represents events with indices below the
statistical threshold.
The problem of prediction of the
discrimination threshold is considered as an
intersection between multiple research
disciplines. Indeed, this problem is
addressed by several researchers in different
areas. We cite, among others, econometrics
(Hansen, 1999), genetics (Churchill and
Doerge, 1994), biochemistry (Keller et al.,
2002).
There are several techniques for
predicting the discrimination threshold,
these techniques are generally based on
approaches emerged from the fields of
Artificial Intelligence and Performance
Evaluation.
The threshold can be simply chosen as
some high percentile of the data
(DuMouchel, 1983) or estimated graphically
using the mean excess plot (Embrechts et
al., 1997) which is a tool widely used in the
study of risk, insurance and extreme values.
Behrens in (Behrens et al., 2004) determines
the threshold by proposing a parametric
form to fit the observations below it and a
generalized Pareto distribution (GPD) for
the observations beyond it.
In the next section, we present the basic
performance metrics used for the
performance evaluation of the binary
classifiers.
3. PERFORMANCE
MEASURES IN BINARY
CLASSIFICATION
In our case, our system (S) classifies
collocations into two classes: relevant and
irrelevant collocations. Collocations
correctly classified by the system in the
class "relevant" are called "true positives";
collocations misclassified are called "false
positives". Collocations correctly classified
by the system in the class "irrelevant" are
called "true negatives"; collocations
misclassified are called "false negatives".
The relevance of the extracted collocations
is reviewed by a domain expert (researcher,
linguist, engineer…) who will decide
TABLE 2 Decision Matrix
Relevant
collocations
Irrelevant
collocations
Collocations evaluated
as relevant by the system
True
Positives (TP)
False
Positives (FP)
Collocations evaluated
as irrelevant by the system
False
Negatives
(FN)
True
Negatives
(TN)
IJIRR: International Journal of Information Retrieval Research. In press, 2013.
whether collocations admit sense or not. The
ultimate goal of this technique is to
maximize the rate of true positives and the
rate of false positives, also is to minimize
the rate of false positives and the rate of
false negatives.
Subsequently, we can build a Decision
Matrix (Table. 2) that summarizes all the
necessary measures for the performance
evaluation of a binary classification system.
Thus, we can calculate the four following
performance indices:
True Positives (TP): number of
correctly classified positive
examples
False Negatives (FN): number of
incorrectly classified positive
examples
True Negatives (TN): number of
correctly classified negative
examples
False Positives (FP): number of
incorrectly classified negative
examples
If the system is perfectly discriminative
(i.e.: the knowledge of statistical values
allowed him to predict without fail), we
would have: FP=FN=0.
In the following, we present the different
techniques used to selecting the optimal cut-
point that can provide the maximum
performance to binary classification system.
3.1 ROC curves
Originally, ROC curves have long been
used in signal detection theory to depict the
tradeoff between hit rate and false alarm rate
of classifiers (Swets et al., 2000).
Subsequently, they are used in the statistics
field to evaluate the performance of binary
classifiers. Graphically, the ROC curve
shows the rate of correct classifications
(called true positive rate) as a function of the
number of incorrect classifications (false
positive rate) for a set of results provided by
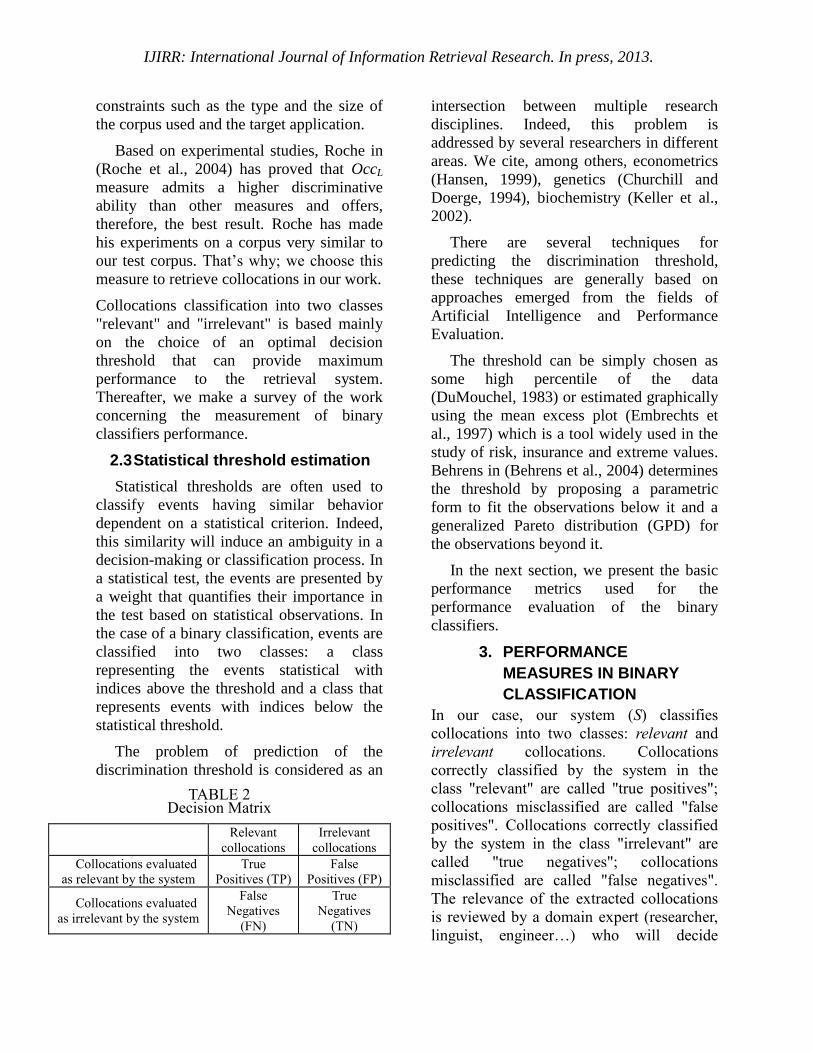
the system to be evaluated (see Fig. 2).
ROC analysis has been extended for use
in several areas in the computer science
field. Bradely (1997) is the first to use the
ROC curves for evaluation and comparison
of learning algorithms. In the field of
statistical terminology, Fkih and Omri
(2012) used ROC curves for learning the
size of the sliding window used for
terminology retrieval. For a deeper
discussion on the use of ROC curves, you
can see Hand (2009) and Krzanowski and
Hand (2009).
Based on Table 2 notations, we define the
following terms (Fawcett 2004):
Sensitivity (3) (also known as
Fraction of True Positives):
proportion of positive collocations
detected by the test. In other words,
the sensitivity allows measuring how
much the test is effective when used
on positive collocations. The test is
perfect for positive collocations
when sensitivity is 1, equivalent to a
random draw when sensitivity is 0.5.
If it is below 0.5, the test is cons-
efficient.
(3)
Specificity (4) (also known as
Fraction of True Negatives):
proportion of negative collocations
detected by the test. Specificity
allows measuring how well the test is
effective when used on negative
collocations. The test is perfect for
collocations negative when the
specificity is 1, equivalent to a
random draw when specificity is 0.5.
If it is below 0.5, the test is cons-
efficient.
(4)
In our work, we are interested in two
performance indices that can be deducted
FNTP
TPSeySensitivit
)(
FPTN
TNSpySpecificit
)(
IJIRR: International Journal of Information Retrieval Research. In press, 2013.
from the ROC curve: Points on curve closest
to the (0,1) and Youden Index (J) (see Fig.
2). Each of the two criteria gives equal
weight to sensitivity and specificity.
3.1.1 Points on curve closest to the (0, 1)
According to Tilbury in (Tilbury et al.,
2000), if the distributions of the 2 classes
(relevant and irrelevant collocation) are well
separated, the curve will immediately rise to
the top left corner (0, 1), and then proceed
horizontally. If the distributions tend to
overlap, so that relevant and irrelevant
collocations cannot be distinguished by the
measurement, the curve will approach the
diagonal ((0,0) to (1,1)). As shown in Figure
2, the Points on curve closest to the (0, 1)
index measures the distance between a point
on the curve and the upper left corner of the
graph (point (0,1)). The goal is to minimize
this distance, then the point closest to the
point (0,1) is selected as "optimal point"
which ensures both a high sensitivity and
specificity to the system. In the following
we denote by DPCC(M) the distance
between the point (0,1) and a point M
belonging the curve.
For each point M(1-Sp,Se) belonging to
the ROC curve, we have (5):
(5)
Let T the optimum point which ensures
both a high sensitivity and specificity to the
system. Thus, we have (6):
(6)
3.1.2 Youden Index (J)
The Youden index (J) (Youden, 1950) is
a function of sensitivity (Se) and specificity
(Sp) is a commonly used measure of overall
diagnostic effectiveness (Schisterman et al.,
2005). The goal is to maximize the vertical
distance from line of random chance to the
point M (as shown in Fig. 2).
There are several mathematical methods
for estimating the Youden index (J). For
more details you can see (Ruopp et al.,
2008; Martínez-Camblor, 2011).
For each point M(1-Sp,Se) belonging to
the ROC curve, we have (7):
(7)
Let T the optimum point, we have (8):
(8)
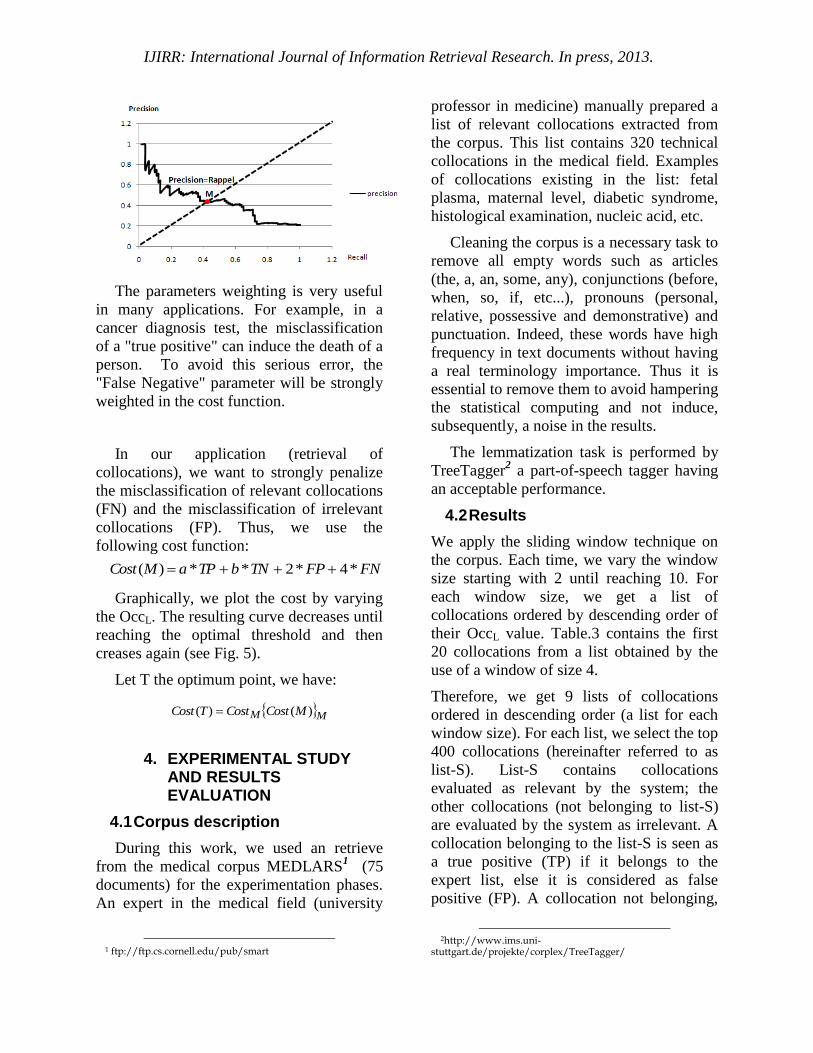
3.2 Precision-Recall Curves
We define precision and recall as:
1. Precision (9): the ratio of the number
of relevant collocations by the total
extracted collocations extracted
(9)
2. Recall (10): the ratio of the number
of extracted collocations by the total
number of relevant collocations
(10)
Figure 2. ROC curve, on curve closest to
the (0,1) and Youden Index.
22 )1()1()( SeSpMDPCC
MM MDPCCTDPCC )(min)(
MM MJTJ )(max)(
FPTP
TPprecision
FNTP
TPrecall
1)()()( MSeMSpMJ
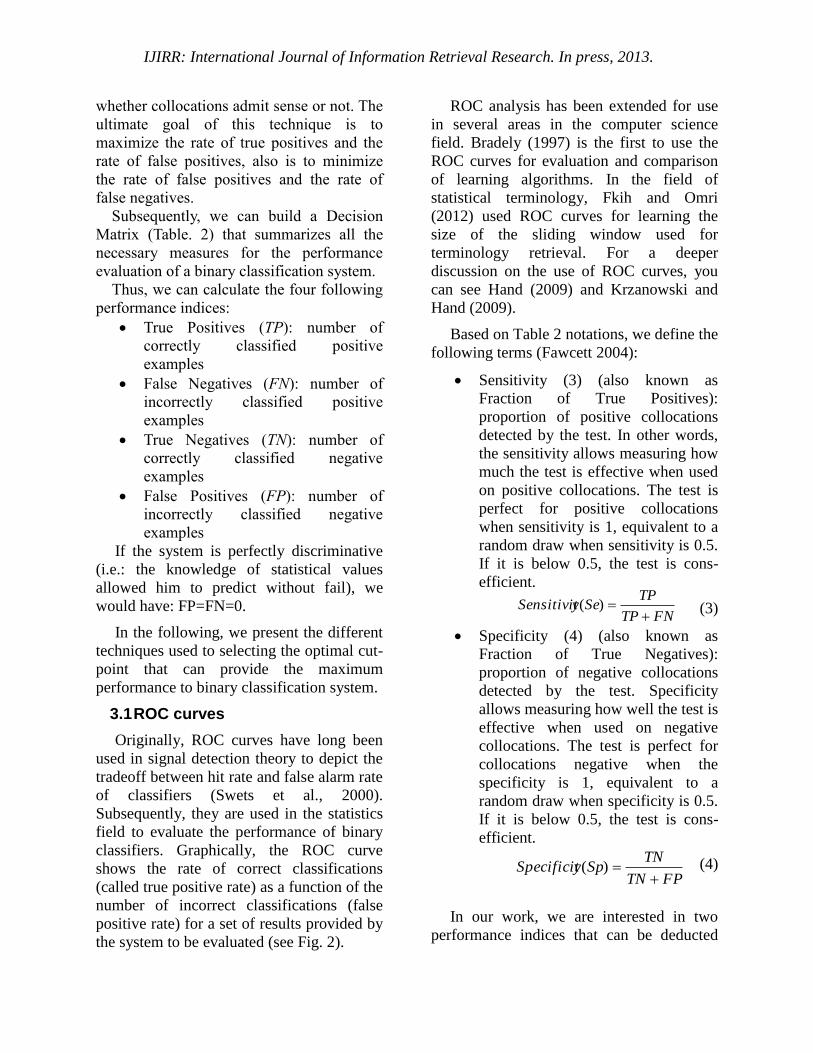
IJIRR: International Journal of Information Retrieval Research. In press, 2013.
Precision-Recall (PR) curves are
commonly used in Information retrieval
field as in (Manning and Schütze 1999,
Raghavan et al. 1989). Also, they are used
by Pecina (2010) to evaluate the
performance of collocation retrieval
methods. This evaluation is based on
measuring the quality of candidates ranking
based on their chance to form collocations.
As shown in Figure 3, precision is a
decreasing function of the recall. In our
case, we give equal importance to precision
and recall. Then the optimal threshold is the
point (M) on the curve such as (11):
(11)
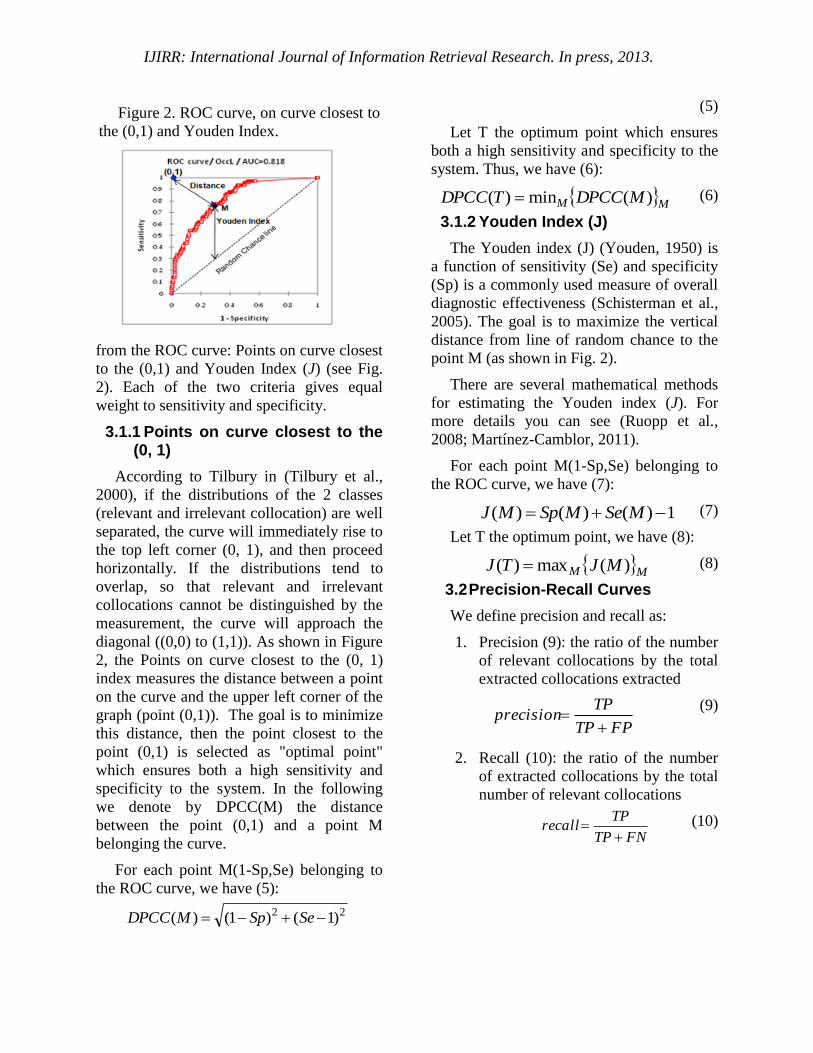
3.3 Accuracy
Accuracy refers to the degree of
closeness or conformity to the true value of
the quantity under measurement. Is defined
as (12):
(12)
Accuracy is an indicator commonly used
to measure the performance of binary
classifiers as in (Mazurowski and Tourassi,
2009; Bradley, 1997; Provost et al., 1998;
Sokolova et al., 2006). The goal is to
maximize the Accuracy function. So to get
the optimal threshold, we must select the
peak of the curve (see Fig. 4).
Let T the optimum point, we have (13):
(13)
3.4 Decision graph (Cost/Occl)
Each performance index (see Table 2)
gives an idea about the types of errors that
may occur during the process of
classification. These errors are mainly
caused by a misclassification of positive and
negative instances. In order to determine the
value of the classification threshold which
reduces the errors risk, a function which
calculates the misclassification cost is used.
The optimal threshold in this case is the one
that provides a minimum cost.
Practically, the cost function depends on
four parameters: TP, TN, FP and FN. Each
parameter is weighted according to its
importance.
Figure 3. Precision-Recall curve.
Figure 4. Accuracy curve.
Figure 5. Cost curve.
)()( MrecallMprecision
FNFPTNTP
TNTPAccuracy
MM MAccuracyTAccuracy )(max)(
FNdFPcTNbTPaMCost ****)(
numberspositivedcbaWhere ,,,
IJIRR: International Journal of Information Retrieval Research. In press, 2013.
The parameters weighting is very useful
in many applications. For example, in a
cancer diagnosis test, the misclassification
of a "true positive" can induce the death of a
person. To avoid this serious error, the
"False Negative" parameter will be strongly
weighted in the cost function.
In our application (retrieval of
collocations), we want to strongly penalize
the misclassification of relevant collocations
(FN) and the misclassification of irrelevant
collocations (FP). Thus, we use the
following cost function:
Graphically, we plot the cost by varying
the OccL. The resulting curve decreases until
reaching the optimal threshold and then
creases again (see Fig. 5).
Let T the optimum point, we have:
4. EXPERIMENTAL STUDY AND RESULTS EVALUATION
4.1 Corpus description
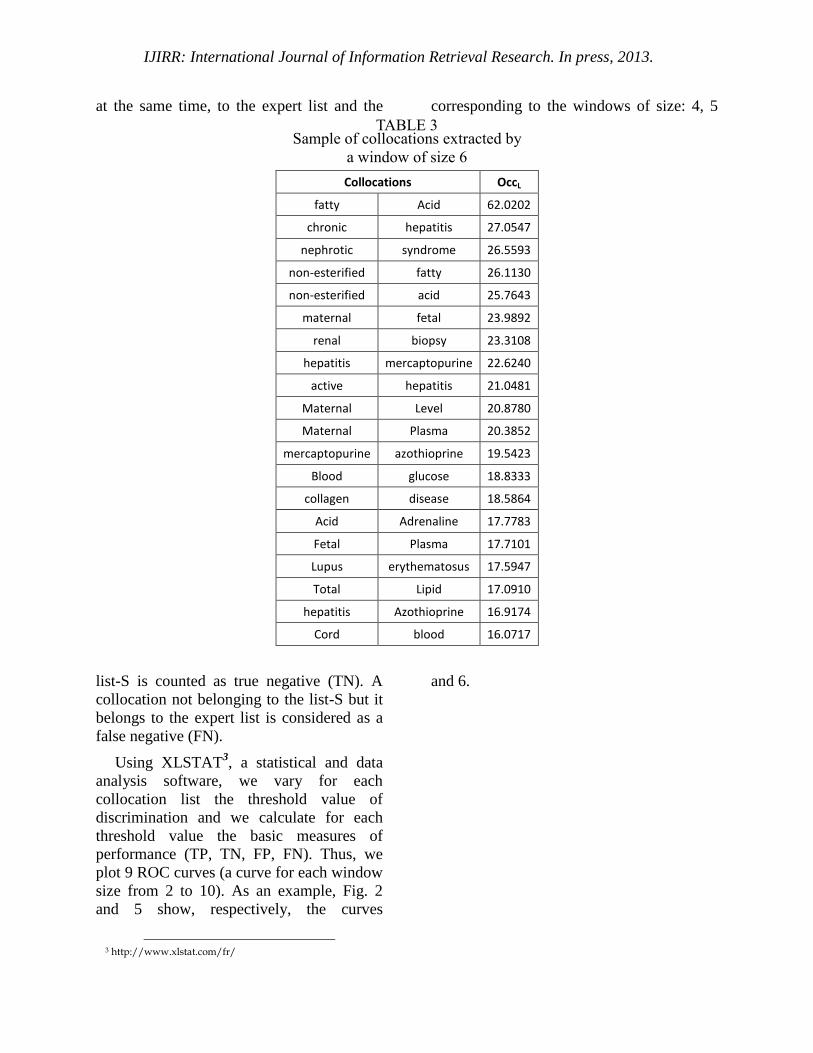
During this work, we used an retrieve
from the medical corpus MEDLARS1 (75
documents) for the experimentation phases.
An expert in the medical field (university
1 ftp://ftp.cs.cornell.edu/pub/smart
professor in medicine) manually prepared a
list of relevant collocations extracted from
the corpus. This list contains 320 technical
collocations in the medical field. Examples
of collocations existing in the list: fetal
plasma, maternal level, diabetic syndrome,
histological examination, nucleic acid, etc.
Cleaning the corpus is a necessary task to
remove all empty words such as articles
(the, a, an, some, any), conjunctions (before,
when, so, if, etc...), pronouns (personal,
relative, possessive and demonstrative) and
punctuation. Indeed, these words have high
frequency in text documents without having
a real terminology importance. Thus it is
essential to remove them to avoid hampering
the statistical computing and not induce,
subsequently, a noise in the results.
The lemmatization task is performed by
TreeTagger2 a part-of-speech tagger having
an acceptable performance.
4.2 Results
We apply the sliding window technique on
the corpus. Each time, we vary the window
size starting with 2 until reaching 10. For
each window size, we get a list of
collocations ordered by descending order of
their OccL value. Table.3 contains the first
20 collocations from a list obtained by the
use of a window of size 4.
Therefore, we get 9 lists of collocations
ordered in descending order (a list for each
window size). For each list, we select the top
400 collocations (hereinafter referred to as
list-S). List-S contains collocations
evaluated as relevant by the system; the
other collocations (not belonging to list-S)
are evaluated by the system as irrelevant. A
collocation belonging to the list-S is seen as
a true positive (TP) if it belongs to the
expert list, else it is considered as false
positive (FP). A collocation not belonging,
2http://www.ims.uni-
stuttgart.de/projekte/corplex/TreeTagger/
FNFPTNbTPaMCost *4*2**)(
MM MCostCostTCost )()(
IJIRR: International Journal of Information Retrieval Research. In press, 2013.
at the same time, to the expert list and the
list-S is counted as true negative (TN). A
collocation not belonging to the list-S but it
belongs to the expert list is considered as a
false negative (FN).
Using XLSTAT3, a statistical and data
analysis software, we vary for each
collocation list the threshold value of
discrimination and we calculate for each
threshold value the basic measures of
performance (TP, TN, FP, FN). Thus, we
plot 9 ROC curves (a curve for each window
size from 2 to 10). As an example, Fig. 2
and 5 show, respectively, the curves
3 http://www.xlstat.com/fr/
corresponding to the windows of size: 4, 5
and 6.
TABLE 3 Sample of collocations extracted by
a window of size 6
Collocations OccL
fatty Acid 62.0202
chronic hepatitis 27.0547
nephrotic syndrome 26.5593
non-esterified fatty 26.1130
non-esterified acid 25.7643
maternal fetal 23.9892
renal biopsy 23.3108
hepatitis mercaptopurine 22.6240
active hepatitis 21.0481
Maternal Level 20.8780
Maternal Plasma 20.3852
mercaptopurine azothioprine 19.5423
Blood glucose 18.8333
collagen disease 18.5864
Acid Adrenaline 17.7783
Fetal Plasma 17.7101
Lupus erythematosus 17.5947
Total Lipid 17.0910
hepatitis Azothioprine 16.9174
Cord blood 16.0717
IJIRR: International Journal of Information Retrieval Research. In press, 2013.
Figure 5. ROC curves corresponding to the windows of size 5 (a) and 6 (b).
(a) (b)
Figure 6. Precision-Recall curves corresponding to the windows of size 2
(a), 3 (b), 4 (c) and 5 (d).
(a) (b)
(c) (d)
IJIRR: International Journal of Information Retrieval Research. In press, 2013.
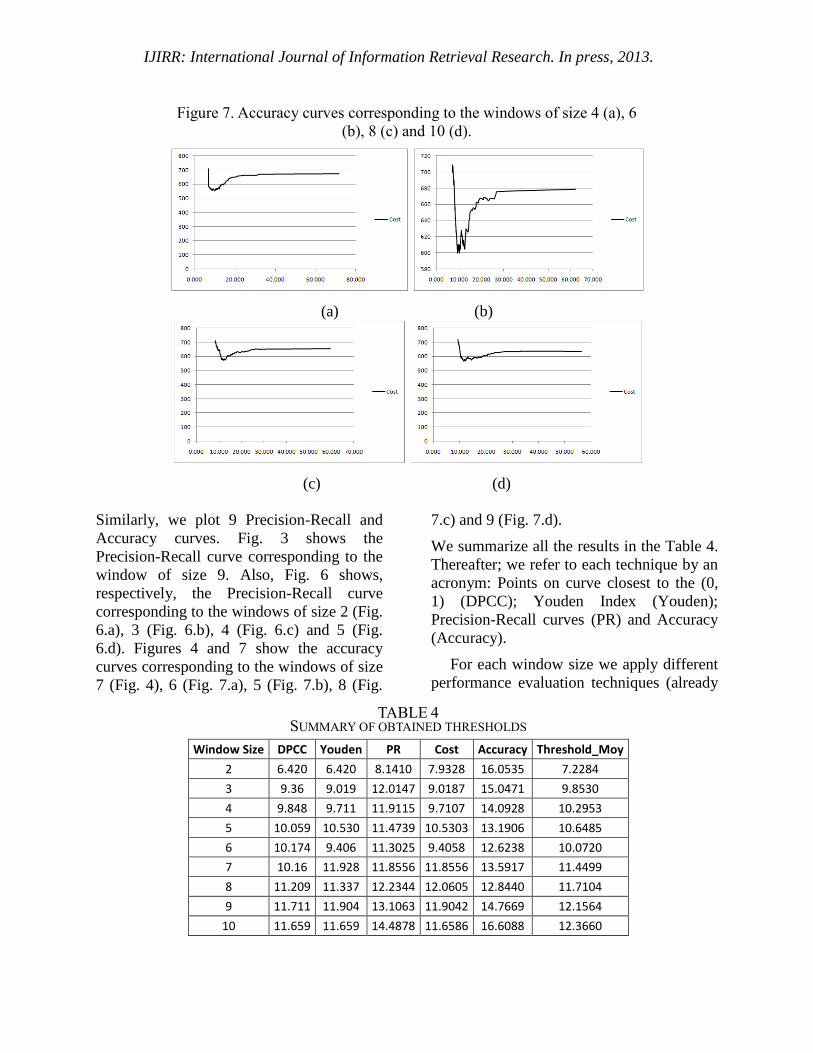
Figure 7. Accuracy curves corresponding to the windows of size
6 (a), 5 (b), 8 (c) and 9 (d).
(a) (b)
(c) (d)
IJIRR: International Journal of Information Retrieval Research. In press, 2013.
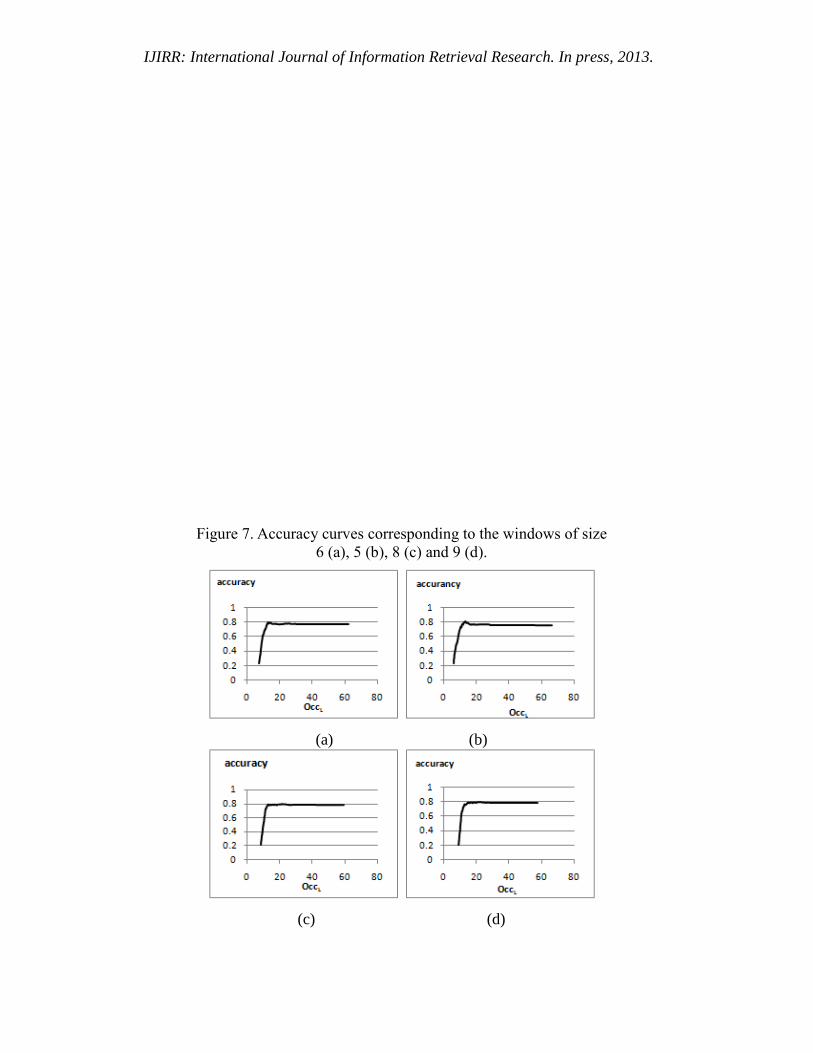
Similarly, we plot 9 Precision-Recall and
Accuracy curves. Fig. 3 shows the
Precision-Recall curve corresponding to the
window of size 9. Also, Fig. 6 shows,
respectively, the Precision-Recall curve
corresponding to the windows of size 2 (Fig.
6.a), 3 (Fig. 6.b), 4 (Fig. 6.c) and 5 (Fig.
6.d). Figures 4 and 7 show the accuracy
curves corresponding to the windows of size
7 (Fig. 4), 6 (Fig. 7.a), 5 (Fig. 7.b), 8 (Fig.
7.c) and 9 (Fig. 7.d).
We summarize all the results in the Table 4.
Thereafter; we refer to each technique by an
acronym: Points on curve closest to the (0,
1) (DPCC); Youden Index (Youden);
Precision-Recall curves (PR) and Accuracy
(Accuracy).
For each window size we apply different
performance evaluation techniques (already
Figure 7. Accuracy curves corresponding to the windows of size 4 (a), 6
(b), 8 (c) and 10 (d).
(a) (b)
(c) (d)
TABLE 4 SUMMARY OF OBTAINED THRESHOLDS
Window Size DPCC Youden PR Cost Accuracy Threshold_Moy
2 6.420 6.420 8.1410 7.9328 16.0535 7.2284
3 9.36 9.019 12.0147 9.0187 15.0471 9.8530
4 9.848 9.711 11.9115 9.7107 14.0928 10.2953
5 10.059 10.530 11.4739 10.5303 13.1906 10.6485
6 10.174 9.406 11.3025 9.4058 12.6238 10.0720
7 10.16 11.928 11.8556 11.8556 13.5917 11.4499
8 11.209 11.337 12.2344 12.0605 12.8440 11.7104
9 11.711 11.904 13.1063 11.9042 14.7669 12.1564
10 11.659 11.659 14.4878 11.6586 16.6088 12.3660
IJIRR: International Journal of Information Retrieval Research. In press, 2013.
detailed in the preceding paragraphs) on the
collocations extracted by the statistical
approach (see Table 3). For each
performance measure (DPCC, Youden, PR,
Accuracy) we give the value of the obtained
discrimination threshold (see Table 4).
4.3 Evaluation and discussion
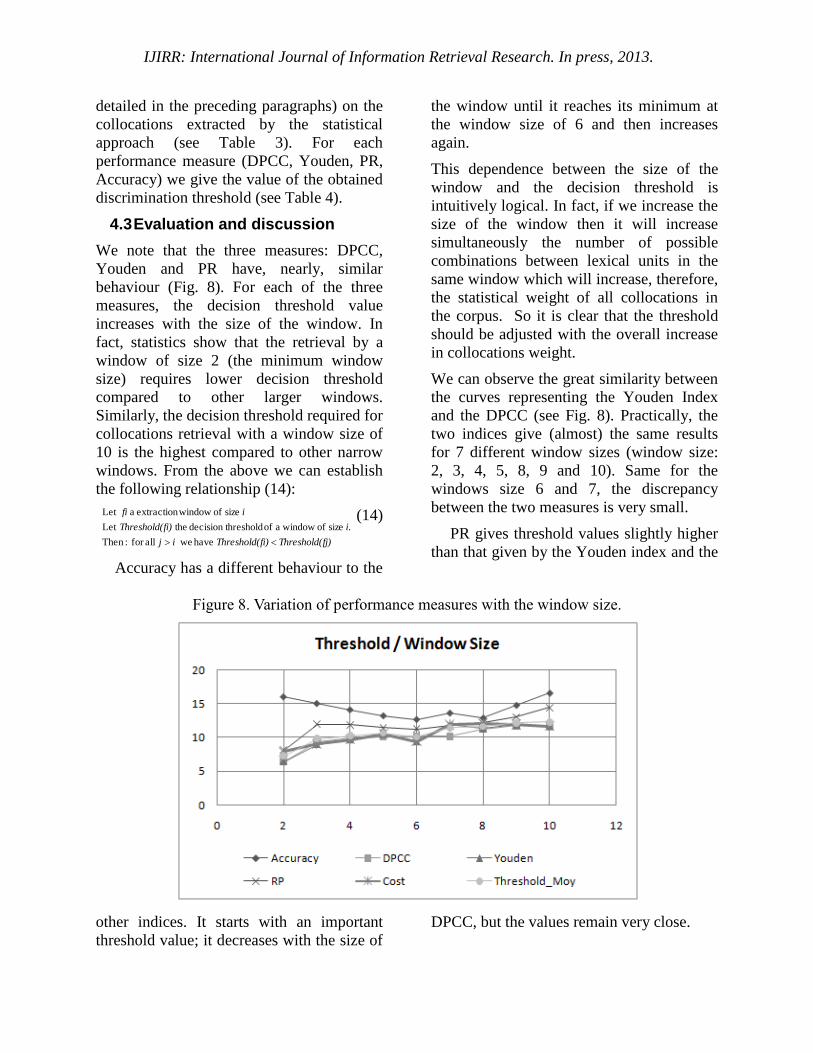
We note that the three measures: DPCC,
Youden and PR have, nearly, similar
behaviour (Fig. 8). For each of the three
measures, the decision threshold value
increases with the size of the window. In
fact, statistics show that the retrieval by a
window of size 2 (the minimum window
size) requires lower decision threshold
compared to other larger windows.
Similarly, the decision threshold required for
collocations retrieval with a window size of
10 is the highest compared to other narrow
windows. From the above we can establish
the following relationship (14):
(14)
Accuracy has a different behaviour to the
other indices. It starts with an important
threshold value; it decreases with the size of
the window until it reaches its minimum at
the window size of 6 and then increases
again.
This dependence between the size of the
window and the decision threshold is
intuitively logical. In fact, if we increase the
size of the window then it will increase
simultaneously the number of possible
combinations between lexical units in the
same window which will increase, therefore,
the statistical weight of all collocations in
the corpus. So it is clear that the threshold
should be adjusted with the overall increase
in collocations weight.
We can observe the great similarity between
the curves representing the Youden Index
and the DPCC (see Fig. 8). Practically, the
two indices give (almost) the same results
for 7 different window sizes (window size:
2, 3, 4, 5, 8, 9 and 10). Same for the
windows size 6 and 7, the discrepancy
between the two measures is very small.
PR gives threshold values slightly higher
than that given by the Youden index and the
DPCC, but the values remain very close.
Figure 8. Variation of performance measures with the window size.
have we allfor :Then
. size of windowa of hresholddecision t theLet
size of windowextraction a Let
fj)Threshold(fi)Threshold(i j
ifi) Threshold(
ifi
IJIRR: International Journal of Information Retrieval Research. In press, 2013.
Accuracy index is still the exception, it
provides values that are very distant to other
performance indices (e.g. threshold = 16 for
window size 2).
The results show that the index Accuracy
is not in harmony with the other
performance indices in its behaviour and
values. We judged that this index does not
provide any relevant knowledge to assist the
decision of the optimal threshold.
We may conclude that the indices: DPCC,
Youden and PR can provide interpretable
knowledge for the determination of the
optimal threshold for automatic retrieval
collocation systems. For these reasons, we
choose in our retrieval system to use the
average of the values provided by these
three performance indices (15).
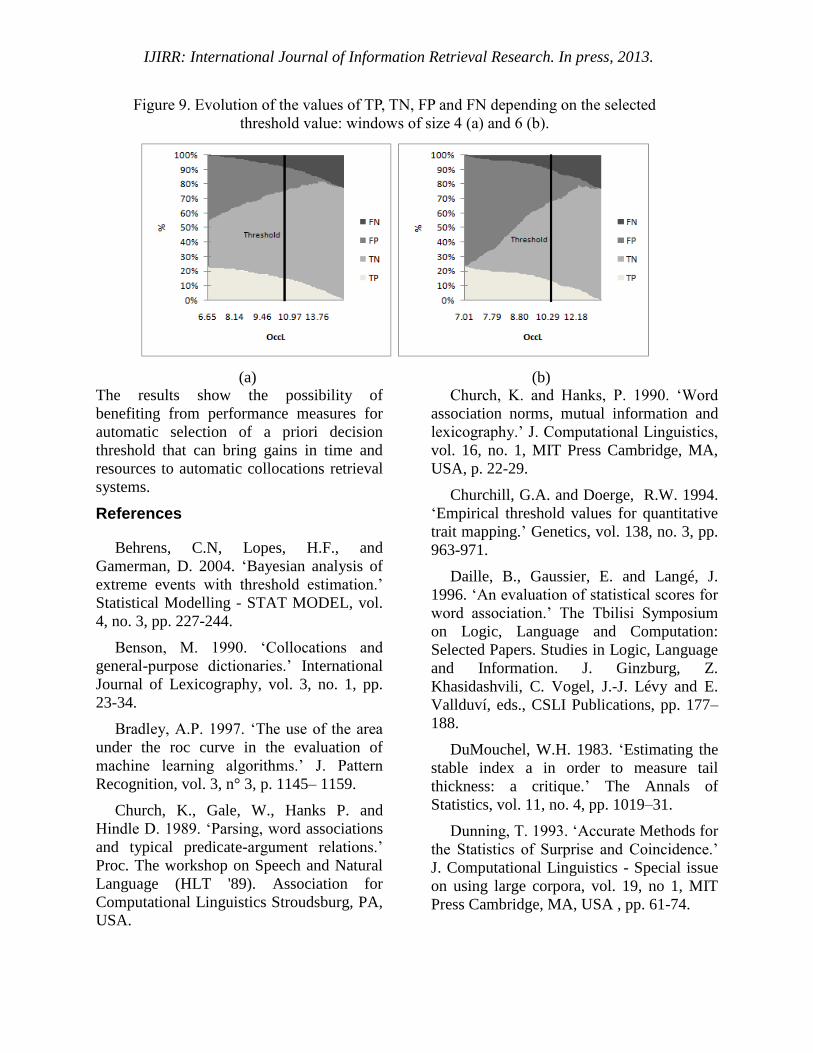
We consider the case of a list of
collocations extracted by a window of size
4. The graph of Figure 9 allows seeing the
evolution of the values of TP (true
positives), TN (true negative), FP (false
positives) and FN (false negatives)
depending on the selected threshold value.
The discrimination threshold divides the
graph into two parts (see the dotted lines in
Fig. 9.a and Fig. 9.b). The two parts describe
the evolution of the basic performance
measures (TP, TN, FP and FN) before and
after the selected threshold. We note a
decrease in rates of FP and TP and an
increase in TN and FN after the threshold
which induces, therefore, an increase in
precision and a decrease in recall. Our
chosen threshold (10.49), for an retrieval
with a window of size 4, can be a good
compromise; he tries to take into
consideration the four factors evaluation
measures.
5. CONCLUSION
In this paper, we have presented a
detailed theoretical study on techniques
measurement of performance of binary
classifiers. Then, we used these techniques
to determine the optimal threshold for
collocations retrieval from text documents.
To this end, we conducted an empirical deep
study on a biomedical text corpus.
It is clear that collocations retrieval
problem is a binary classification problem.
Indeed, we must classify collocations
(extracted by statistical method using a
sliding window) in two different classes:
“relevant” and “irrelevant” collocations.
Each collocation is weighted by a statistical
weight which measures the strength of
connection between its components.
Collocations classification relies, mainly, on
the use of a discrimination statistical
threshold. In fact, collocations which have a
statistical weight above the threshold are
classified as "relevant". The same,
collocations which have a statistical weight
below the threshold are classified as
"irrelevant."
The main goal of our work is to improve
classification quality of collocations.
Practically, we used 4 conventional
statistical techniques namely Youden Index,
Points on curve closest to the (0, 1),
Precision-Recall curves and Accuracy
curves. These techniques attempt to estimate
the discrimination threshold that ensures
optimal performance for collocation
retrieval systems.
IJIRR: International Journal of Information Retrieval Research. In press, 2013.
The results show the possibility of
benefiting from performance measures for
automatic selection of a priori decision
threshold that can bring gains in time and
resources to automatic collocations retrieval
systems.
References
Behrens, C.N, Lopes, H.F., and
Gamerman, D. 2004. ‘Bayesian analysis of
extreme events with threshold estimation.’
Statistical Modelling - STAT MODEL, vol.
4, no. 3, pp. 227-244.
Benson, M. 1990. ‘Collocations and
general-purpose dictionaries.’ International
Journal of Lexicography, vol. 3, no. 1, pp.
23-34.
Bradley, A.P. 1997. ‘The use of the area
under the roc curve in the evaluation of
machine learning algorithms.’ J. Pattern
Recognition, vol. 3, n° 3, p. 1145– 1159.
Church, K., Gale, W., Hanks P. and
Hindle D. 1989. ‘Parsing, word associations
and typical predicate-argument relations.’
Proc. The workshop on Speech and Natural
Language (HLT '89). Association for
Computational Linguistics Stroudsburg, PA,
USA.
Church, K. and Hanks, P. 1990. ‘Word
association norms, mutual information and
lexicography.’ J. Computational Linguistics,
vol. 16, no. 1, MIT Press Cambridge, MA,
USA, p. 22-29.
Churchill, G.A. and Doerge, R.W. 1994.
‘Empirical threshold values for quantitative
trait mapping.’ Genetics, vol. 138, no. 3, pp.
963-971.
Daille, B., Gaussier, E. and Langé, J.
1996. ‘An evaluation of statistical scores for
word association.’ The Tbilisi Symposium
on Logic, Language and Computation:
Selected Papers. Studies in Logic, Language
and Information. J. Ginzburg, Z.
Khasidashvili, C. Vogel, J.-J. Lévy and E.
Vallduví, eds., CSLI Publications, pp. 177–
188.
DuMouchel, W.H. 1983. ‘Estimating the
stable index a in order to measure tail
thickness: a critique.’ The Annals of
Statistics, vol. 11, no. 4, pp. 1019–31.
Dunning, T. 1993. ‘Accurate Methods for
the Statistics of Surprise and Coincidence.’
J. Computational Linguistics - Special issue
on using large corpora, vol. 19, no 1, MIT
Press Cambridge, MA, USA , pp. 61-74.
Figure 9. Evolution of the values of TP, TN, FP and FN depending on the selected
threshold value: windows of size 4 (a) and 6 (b).
(a) (b)
IJIRR: International Journal of Information Retrieval Research. In press, 2013.
Ellis, N. C. & Ferreira-Junior, F. 2009.
‘Constructions and their acquisition: Islands
and the distinctiveness of their occupancy’.
Annual Review of Cognitive Linguistics, 7,
187–220.
Embrechts, P., Klüppelberg, C., Mikosch,
T. 1997. Modelling extremal events for
insurance and finance. New York: Springer.
Evert, S. and Krenn, B. 2005. ‘Using
small random samples for the manual
evaluation of statistical association
measures’. J. Computer Speech &
Language. Vol. 19, no. 4, pp. 450–466.
Elsevier.
Fano, R. 1961. ‘Transmission of
Information: A Statistical Theory of
Communications.’ MIT Press, Cambridge,
MA.
Fawcett, T. 2004. ‘ROC Graphs: Notes
and Practical Considerations for
Researchers.’ J. Pattern Recognition Letters,
vol. 27, n° 8, pp. 882-891.
Fkih, F. and Omri, M.N. 2012. ‘Learning
the Size of the Sliding Window for the
Collocations Extraction: a ROC-Based
Approach.’ Proc. The 2012 International
Conference on Artificial Intelligence
(ICAI'12), Las Vegas, USA, pp. 1071-1077.
Fkih, F. and Omri, M.N. 2013. ‘A
Statistical Classifier based Markov Chain
for Complex Terms Filtration’. Proc.
International Conference on Web and
Information Technologies (ICWIT'13),
Hammamet, Tunisia.
Firth, J. R. 1957. ‘A synopsis of
linguistic theory 1930-1955.’ Studies in
Linguistic Analysis, pp. l-32. Oxford:
Philological Society.
Gustafson, S.C., Costello, C.S., Like,
E.C., Pierce, S.J., Shenoy, K.N. 2009.
‘Bayesian Threshold Estimation.’ J. IEEE
Transactions on Education, vol. 52, no. 3,
pp. 400- 403.
Halliday, M.A.K. 1966. ‘Lexis as a
Linguistic Level.’ In Meomory of J.R. Firth,
C.E. Bazell, J.C. Catford, M.A.K. Halliday,
and R.H. Robins, eds., London: Longmans,
pp.148-162.
Hand, D.J. 2009. ‘Measuring classifier
performance: a coherent alternative to the
area under the ROC curve’. J. Machine
Learning, vol. 77, no. 1, pp. 103-123.
Springer.
Hansen, B.E. 1999. ‘Threshold effects in
non-dynamic panels: Estimation, testing,
and inference.’ J. Journal of Econometrics.
vol .93, no. 2, pp 345–368.
Keller, A., Nesvizhskii, A.I, Kolker, E.,
and Aebersold, R. 2002. ‘Empirical
Statistical Model To Estimate the Accuracy
of Peptide Identifications Made by MS/MS
and Database Search.’ J. Analytical
Chemistry, vol.74, no. 20, pp. 5383–5392.
Krzanowski, W. J. and Hand, D. J. 2009.
ROC curves for continuous data. Chapman
and Hall, London.
Li, J., Cheng, C., Jiang, T., Grzybowski,
S. 2012. ‘Wavelet de-noising of partial
discharge signals based on genetic adaptive
threshold estimation.’ J. IEEE Transactions
on Dielectrics and Electrical Insulation, vol.
19, no. 2, pp. 543- 549.
Lin, J.F., Li, S. and Cai, Y. 2008. ‘A new
collocation extraction method combining
multiple association measures,’ Proc.
International Conference on Machine
Learning and Cybernetics, pp. 12-17.
Manning, C.D. and Schütze, H. 1999.
‘Foundations of statistical natural language
processing.’ MIT Press Cambridge, MA,
USA.
Martínez-Camblor, P. 2011.
‘Nonparametric Cutoff Point Estimation for
Diagnostic Decisions with Weighted
Errors’. J. Revista Colombiana de
Estadística, vol. 34, no. 1, pp. 133-146.
IJIRR: International Journal of Information Retrieval Research. In press, 2013.
Mazurowski, M.A., and Tourassi, G.D.
2009. ‘Evaluating classifiers: Relation
between area under the receiver operator
characteristic curve and overall accuracy’.
Proc. International Joint Conference on
Neural Networks, Atlanta, Georgia, USA,
pp. 2045- 2049.
Pecina, P. 2010. ‘Lexical association
measures and collocation extraction’. J.
Language Resources and Evaluation, vol.
44, no. 1-2, pp. 137-158. Springer.
Pecina, P. and Schlesinger, P. 2006.
‘Combining association measures for
collocation extraction’. Proc. COLING-ACL
'06 Proceedings of the COLING/ACL, pp.
651-658. Association for Computational
Linguistics. Stroudsburg, PA, USA.
Petrović, S., Šnajder, J. and Bašić, B.D.
2010. ‘Extending lexical association
measures for collocation extraction’. J.
Computer Speech & Language. Vol. 24, no.
2, pp. 383–394. Elsevier.
Provost, F. J., Fawcett, T., and Kohavi,
R. 1998.’The case against accuracy
estimation for comparing induction
algorithms,’ in Proceedings of the Fifteenth
International Conference on Machine
Learning, pp. 445--453.
Raghavan, V., Bollmann, P. and Jung,
G.S. 1989. ‘A critical investigation of recall
and precision as measures of retrieval
system performance.’ J. ACM Transactions
on Information Systems (TOIS), vol. 7, n° 3,
1989, p. 205-229.
Roche, M., Azé, J., Kodratoff Y. and
Sebag, M. 2004. ‘Learning Interestingness
Measures in Terminology Extraction A
ROC based approach.’ Proc. ROC Analysis
in AI Workshop (ECAI 2004), Valencia,
Espagne.
Ruopp, M.D., Perkins, N.J., Whitcomb,
B.W. and Schisterman, E.F. 2008. ‘Youden
Index and Optimal Cut-Point Estimated
from Observations Affected by a Lower
Limit of Detection.’ J. Biometrical Journal,
vol. 50, n° 3, p. 419-430.
Schisterman, E.F., Perkins, N.J., Liu, A.
and Bondell, H. 2005. ‘Optimal cut-point
and its corresponding Youden Index to
discriminate individuals using pooled blood
samples.’ J. Epidemiology, vol. 16, n° 1, p.
73-81.
Seretan, V. 2011. ‘Syntax-Based
Collocation Extraction.’ Series: Text,
Speech and Language Technology, vol. 44,
Springer.
Shannon, C.E. 1948. ‘A mathematical
theory of communication.’ J. Bell System
Technical Journal, vol. 27, no. 3, pp. 379-
423.
Smadja, F. 1993. ‘Retrieving
Collocations from Text: Xtract.’ J.
Computational Linguistics - Special issue on
using large corpora, vol. 19, no. 1, MIT
Press Cambridge, MA, USA , pp. 143-177.
Sokolova, M., Japkowicz, N. and
Szpakowicz, S. 2006. ‘Beyond Accuracy, F-
Score and ROC: A Family of Discriminant
Measures for Performance Evaluation’. In
AI 2006: Advances in Artificial Intelligence,
Abdul Sattar and Byeong-ho Kang, eds.,
Springer Berlin Heidelberg, pp. 1015-1021.
Swets, J.A., Dawes, R.M. and Monahan,
J. 2000. ‘Better Decisions through Science.’
J. Scientific American, vol. 283, n° 4, pp.
82-87.
Shao, H., Zou, H. 2009. ‘Threshold
Estimation Based on Perona-Malik Model.’
Conf. International Conference on
Computational Intelligence and Software
Engineering. CiSE 2009, pp. 1-4.
Tilbury, J.B., Van Eetvelt, W.J.,
Garibaldi, J.M., Curnsw, J.S.H., Ifeachor,
E.C. 2000. ‘Receiver operating
characteristic analysis for intelligent medical
systems-a new approach for finding
IJIRR: International Journal of Information Retrieval Research. In press, 2013.
confidence intervals.’J. IEEE Transactions
on Biomedical Engineering, vol. 47, no. 7,
952- 963.
Wermter, J. and Hahn, U. 2004.
‘Collocation extraction based on
modifiability statistics.’ Proc. The 20th
international conference on Computational
Linguistics (COLING '04). Association for
Computational Linguistics Stroudsburg, PA,
USA.
Youden, W.J. 1950. ‘Index for rating
diagnostic tests.’ J. Cancer, vol. 3, pp. 32-
35.