Acquiring Expertise in Medical Radiology through Long-Term Interactions
Upload
khangminh22Category
view
2download
0
Note: This copy is for your personal non-commercial use only. To order presentation-ready copies for distribution to your colleagues or clients, contact us at www.rsna.org/rsnarights.
1833INFORMATICS
Tessa S. Cook, MD, PhD • Stefan L. Zimmerman, MD • Scott R. Steingall, RT Andrew D. A. Maidment, PhD • Woojin Kim, MD • William W. Boonn, MD
There is growing interest in the ability to monitor, track, and report ex-posure to radiation from medical imaging. Historically, however, dose information has been stored on an image-based dose sheet, an arrange-ment that precludes widespread indexing. Although scanner manufac-turers are beginning to include dose-related parameters in the Digital Imaging and Communications in Medicine (DICOM) headers of imag-ing studies, there remains a vast repository of retrospective computed tomographic (CT) data with image-based dose sheets. Consequently, it is difficult for imaging centers to monitor their dose estimates or partici-pate in the American College of Radiology (ACR) Dose Index Registry. An automated extraction software pipeline known as Radiation Dose Intelligent Analytics for CT Examinations (RADIANCE) has been designed that quickly and accurately parses CT dose sheets to extract and archive dose-related parameters. Optical character recognition of information in the dose sheet leads to creation of a text file, which along with the DICOM study header is parsed to extract dose-related data. The data are then stored in a relational database that can be queried for dose monitoring and report creation. RADIANCE allows efficient dose analysis of CT examinations and more effective education of technolo-gists, radiologists, and referring physicians regarding patient exposure to radiation at CT. RADIANCE also allows compliance with the ACR’s dose reporting guidelines and greater awareness of patient radiation dose, ultimately resulting in improved patient care and treatment.©RSNA, 2011 • radiographics.rsna.org
Informatics in RadiologyRADIANCE: An Automated, Enterprise-wide Solution for Archiving and Reporting CT Radiation Dose Estimates1
Abbreviations: ACR = American College of Radiology, CTDI = CT dose index, DICOM = Digital Imaging and Communications in Medicine, DIR = Dose Index Registry, DLP = dose-length product, IHE = Integrating the Healthcare Enterprise, NRDR = National Radiology Data Registry, OCR = optical character recognition, PACS = picture archiving and communication system, PC = personal computer, RADIANCE = Radiation Dose Intelligent Analytics for CT Examinations, RDSR = radiation dose structured report, REM = Radiation Exposure Monitoring
RadioGraphics 2011; 31:1833–1846 • Published online 10.1148/rg.317115048 • Content Codes: 1From the Department of Radiology, Hospital of the University of Pennsylvania, 3400 Spruce St, 1 Silverstein, Philadelphia, PA 19104 (T.S.C., S.R.S., A.D.A.M., W.K., W.W.B.); and Department of Radiology, Johns Hopkins University, Baltimore, Md (S.L.Z.). Presented as an education exhibit at the 2010 RSNA Annual Meeting. Received March 11, 2011; revision requested May 26 and received July 11; accepted July 28. T.S.C., S.R.S., A.D.A.M., W.K., and W.W.B. have disclosed various financial relationships (see p 1845); the other author has no financial relationships to disclose. Address correspondence to T.S.C. (e-mail: [email protected]).
Funding: The work was supported in part by the National Institutes of Health [grant number T32-EB-004311-06].
©RSNA, 2011
1834 November-December 2011 radiographics.rsna.org
IntroductionThe use of computed tomography (CT) has increased significantly in the past decade (1). Patients presenting to the emergency depart-ment often undergo CT as part of their work-up, and patients with malignancies or other chronic disease may undergo annual or more frequent follow-up imaging (2). In the past 2 decades, the proportion of background radiation in the United States attributed to medical imaging has increased from approximately 15% in 1987 to nearly 50% today (3,4). With the increasing ap-plication of CT, ranging from screening to can-cer follow-up to emergent evaluation of acute coronary syndrome, patients are being irradiated more often and from an earlier age. The current generation will likely receive a higher lifetime ra-diation dose than did their predecessors, and the risks associated with this increased dose are dif-ficult to estimate (5,6).
As the lay press and state and federal legisla-tures demonstrate growing interest in the ability to monitor and report the dose associated with imaging-related radiation (7–9), professional societies have expanded their efforts to educate both patients and physicians on this topic. The ImageGently and ImageWisely campaigns of the Society of Pediatric Radiology and the American College of Radiology (ACR), respectively, are raising awareness in both the medical community and the patient community at large regarding diagnostic irradiation (10,11). The American As-sociation of Physicists in Medicine is working on methods and guidelines for standardization of CT protocols to optimize dose reduction (12). Recent legislation in the state of California re-quires that radiologists include dose information in their CT reports beginning in July 2012 (13).
Technical developments over the past decade have allowed greater standardization of dose reporting. The Digital Imaging and Communica-tions in Medicine (DICOM) Structured Report-ing standard defines dose objects dedicated to storing CT radiation dose information (14,15). The dose objects contain information about the study type, in addition to the relevant CT phys-ics parameters for individual irradiation events (discussed in the next section). The Integrating the Healthcare Enterprise (IHE) initiative has developed a Radiation Exposure Monitoring (REM) profile to assist vendors in increasing the interoperability of their systems with respect to dose monitoring and reporting (16). IHE REM defines a set of “actors” that produce, report, and
transmit dose information, including the acquisi-tion modality, image manager-archive, dose in-formation consumer, dose information reporter, and dose registry. It also defines the interactions between the actors, including DICOM query-retrieve operations and secure transfer of dose information to a registry, so that vendors can de-velop software and hardware that complies with IHE REM and communicates seamlessly with other compliant systems.
In addition, large-scale initiatives are underway to promote dose monitoring and dose reporting. The ACR Dose Index Registry (DIR), part of the National Radiology Data Registry (NRDR) and often referred to as the NRDR-DIR, is currently collecting population-based data from facilities across the United States (17,18). These data will allow development of reference dose levels and comparison of dose estimates among imaging centers, thereby fostering development of dose optimization measures. The Initiative to Reduce Unnecessary Radiation Exposure from Medical Imaging was recently launched by the U. S. Food and Drug Administration (19). The NIH (Na-tional Institutes of Health) is also making efforts to track and report radiation doses for all patients imaged at the Institutes (20).
Despite these various endeavors to initiate more careful monitoring of patient radiation dose in the future, every imaging center has a vast re-pository of retrospective CT data that does not currently include such information in an easily accessible form. Dose-related parameters for CT have historically been stored as an image-based DICOM dose report, rather than as structured data within the DICOM header. As a result, it is difficult for imaging centers to participate in the ACR DIR. Furthermore, CT scanners cur-rently in use may not have firmware amenable to incorporating radiation dose into image head-ers. At our institution alone, there are more than 800,000 CT examinations stored in our picture archiving and communication system (PACS) that date back to the early 2000s for which radia-tion dose data exist but are not easily accessed. In addition, imaging centers without plans to purchase new scanners in the near future will face the challenge of how to most efficiently and accurately record and report radiation dose information.
In this article, in the interests of improving pa-tient care by decreasing exposure to unnecessary medical radiation, improving the benefit-to-risk ratio for patients undergoing diagnostic imaging, and addressing the growing awareness of poten-tial problems caused by radiation exposure at CT,
RG • Volume 31 Number 7 Cook et al 1835
we describe Radiation Dose Intelligent Analytics for CT Examinations (RADIANCE), an auto-mated extraction software pipeline that we devel-oped for the extraction, archiving, and monitor-ing of radiation dose information for CT.
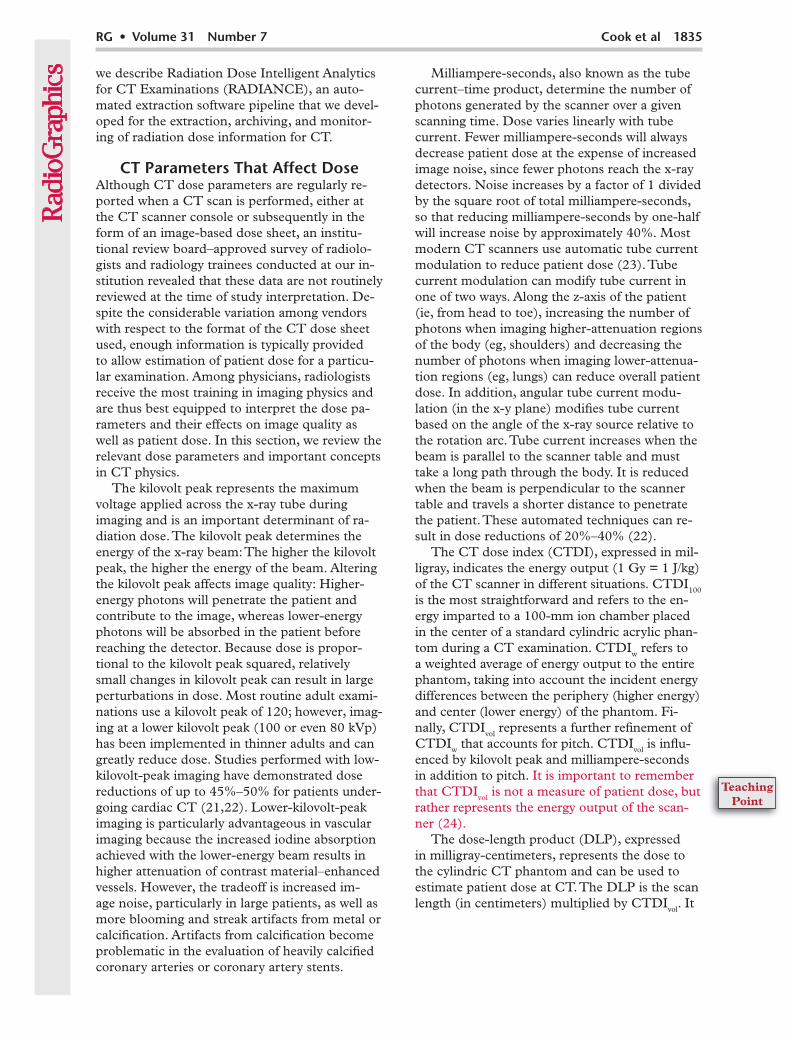
CT Parameters That Affect DoseAlthough CT dose parameters are regularly re-ported when a CT scan is performed, either at the CT scanner console or subsequently in the form of an image-based dose sheet, an institu-tional review board–approved survey of radiolo-gists and radiology trainees conducted at our in-stitution revealed that these data are not routinely reviewed at the time of study interpretation. De-spite the considerable variation among vendors with respect to the format of the CT dose sheet used, enough information is typically provided to allow estimation of patient dose for a particu-lar examination. Among physicians, radiologists receive the most training in imaging physics and are thus best equipped to interpret the dose pa-rameters and their effects on image quality as well as patient dose. In this section, we review the relevant dose parameters and important concepts in CT physics.
The kilovolt peak represents the maximum voltage applied across the x-ray tube during imaging and is an important determinant of ra-diation dose. The kilovolt peak determines the energy of the x-ray beam: The higher the kilovolt peak, the higher the energy of the beam. Altering the kilovolt peak affects image quality: Higher-energy photons will penetrate the patient and contribute to the image, whereas lower-energy photons will be absorbed in the patient before reaching the detector. Because dose is propor-tional to the kilovolt peak squared, relatively small changes in kilovolt peak can result in large perturbations in dose. Most routine adult exami-nations use a kilovolt peak of 120; however, imag-ing at a lower kilovolt peak (100 or even 80 kVp) has been implemented in thinner adults and can greatly reduce dose. Studies performed with low-kilovolt-peak imaging have demonstrated dose reductions of up to 45%–50% for patients under-going cardiac CT (21,22). Lower-kilovolt-peak imaging is particularly advantageous in vascular imaging because the increased iodine absorption achieved with the lower-energy beam results in higher attenuation of contrast material–enhanced vessels. However, the tradeoff is increased im-age noise, particularly in large patients, as well as more blooming and streak artifacts from metal or calcification. Artifacts from calcification become problematic in the evaluation of heavily calcified coronary arteries or coronary artery stents.
Milliampere-seconds, also known as the tube current–time product, determine the number of photons generated by the scanner over a given scanning time. Dose varies linearly with tube current. Fewer milliampere-seconds will always decrease patient dose at the expense of increased image noise, since fewer photons reach the x-ray detectors. Noise increases by a factor of 1 divided by the square root of total milliampere-seconds, so that reducing milliampere-seconds by one-half will increase noise by approximately 40%. Most modern CT scanners use automatic tube current modulation to reduce patient dose (23). Tube current modulation can modify tube current in one of two ways. Along the z-axis of the patient (ie, from head to toe), increasing the number of photons when imaging higher-attenuation regions of the body (eg, shoulders) and decreasing the number of photons when imaging lower-attenua-tion regions (eg, lungs) can reduce overall patient dose. In addition, angular tube current modu-lation (in the x-y plane) modifies tube current based on the angle of the x-ray source relative to the rotation arc. Tube current increases when the beam is parallel to the scanner table and must take a long path through the body. It is reduced when the beam is perpendicular to the scanner table and travels a shorter distance to penetrate the patient. These automated techniques can re-sult in dose reductions of 20%–40% (22).
The CT dose index (CTDI), expressed in mil-ligray, indicates the energy output (1 Gy = 1 J/kg) of the CT scanner in different situations. CTDI100 is the most straightforward and refers to the en-ergy imparted to a 100-mm ion chamber placed in the center of a standard cylindric acrylic phan-tom during a CT examination. CTDIw refers to a weighted average of energy output to the entire phantom, taking into account the incident energy differences between the periphery (higher energy) and center (lower energy) of the phantom. Fi-nally, CTDIvol represents a further refinement of CTDIw that accounts for pitch. CTDIvol is influ-enced by kilovolt peak and milliampere-seconds in addition to pitch. It is important to remember that CTDIvol is not a measure of patient dose, but rather represents the energy output of the scan-ner (24).
The dose-length product (DLP), expressed in milligray-centimeters, represents the dose to the cylindric CT phantom and can be used to estimate patient dose at CT. The DLP is the scan length (in centimeters) multiplied by CTDIvol. It

1836 November-December 2011 radiographics.rsna.org
can be converted to an estimated patient effective dose (in millisieverts) by multiplying by unitless anatomy-specific conversion factors (also known as k factors) (25). These conversion factors are derived from tissue-weighting factors that are maintained by the International Commission for Radiation Protection (26) and evolve as the Commission updates the factors. Studies that ir-radiate the thyroid gland, breasts, or gonads typi-cally have higher k factors than do those that irra-diate the brain or extremities. The change in units for effective dose from milligray to millisieverts reflects the application of the tissue-weighting factors. With use of the DLP, it is possible to derive an estimated effective dose (DLP × k, or CTDIvol × scan length × k) for a patient’s CT examination. Because DLP is dependent on scan length, reducing the scan length will lower the patient dose but may also introduce the risk of missing relevant disease by excluding it from the imaged anatomy.
Additional nonphysics parameters, such as patient age and patient size, can also affect dose (27,28). Younger patients are at a higher risk of experiencing the adverse effects of radiation ex-posure because of more rapid turnover of cellular DNA and the higher potential for radiation-in-duced mutations. Similarly, women who undergo breast imaging are more susceptible. In addition, for a given CT protocol, a thinner patient will receive a higher organ dose than will a larger pa-tient owing to a smaller amount of attenuating soft tissue. Hence, CT protocols should always be tailored to patient size so as to (a) optimize diagnostic image quality and dose savings, and (b) maximize the benefit-risk ratio of exposing patients to ionizing radiation.
RADIANCE AlgorithmFigure 1 illustrates the RADIANCE pipeline. The input to the pipeline is the DICOM CT dose sheet. Scanner manufacturers typically store these documents as a separate series within the study, thereby simplifying their retrieval from a PACS. Some vendors use a unique series num-ber; for example, series 501 for Siemens Medi-cal Systems (Erlangen, Germany), series 999 for GE Medical Systems (Milwaukee, Wis), and (more recently) series 9000 for Toshiba Medi-cal Systems (Tustin, Calif). Neither dose sheets generated by Philips Medical Systems (Best, the Netherlands) nor Toshiba dose sheets generated before 2009 are stored in series that are consis-tently numbered.
The first step in the pipeline is optical charac-ter recognition (OCR) analysis of the dose sheet. This step converts the pixel-based information into ASCII text (29), which can be parsed to ex-tract the relevant CT dose parameters. The OCR tool also translates the dose sheet’s DICOM header into extensible markup language and produces a JPEG (Joint Photographic Experts Group) copy of the original DICOM dose sheet for validation. These copies are used to validate the performance of the software (30). For some vendors (eg, Philips and Toshiba), a binary threshold must be applied to the dose sheet before OCR is applied, since the dose data are stored in the actual pixels of the image instead of in an overlay, as with Siemens.
The relational database stores an aggregate of study data by parsing both the dose sheet and the study header. Before the OCR version of the dose sheet is parsed, useful study parameters are parsed from the extensible markup language study header to tailor the processing steps that follow. The information extracted from the study header includes the study date, examination code and description, scanner manufacturer and mod-el, institution name, patient identification num-ber, and patient date of birth. This information can be used for quality control and correct inser-tion of the dose-related values into the database.
Each dose sheet is processed in a vendor-specific fashion (discussed later). The extracted dose-related parameters for each series of a CT examination include kilovoltage, x-ray tube mil-liamperes, reference milliamperes, CTDIvol, and DLP. Each vendor’s dose sheet reports a subset
Figure 1. Chart illustrates the RADIANCE auto-mated dose extraction pipeline, which combines data from the dose sheet, examination header, and radiol-ogy information system (RIS) to allow analytics and quality assurance. OCR = optical character recognition, XML = extensible markup language.
RG • Volume 31 Number 7 Cook et al 1837
of these parameters. During software develop-ment, consistently repeated errors in the OCR process were iteratively identified and corrections were implemented in the code on a vendor-specific basis. Once the provided dose parameters are parsed, validated, and stored in the database, the estimated whole-body effective dose is cal-culated by multiplying the total study DLP by the appropriate anatomy-specific k factor. RA-DIANCE uses the k factors derived from Inter-national Commission on Radiologic Protection publication 60 (26).
A radiation dose structured report (RDSR) can be produced for every study with an image-based dose sheet. This is achieved using a Java utility built on the PixelMed Java DICOM Tool-kit (31). RADIANCE populates the structured report template with the data from its database and generates an RDSR that can be automatical-ly transmitted to the ACR DIR. This enables im-aging facilities to automate transfer of their dose data to the DIR, eliminating the need for manual data entry or manual transmission of dose re-ports. The contents of scanner-generated RDSRs can also be imported into the database, enabling users to centralize their dose monitoring in cases in which there is a mixture of CT scanners, only some of which can produce structured reports.
Vendor-specific Implementation Details
The parameters extracted from the study header guide the subsequent parsing of the OCR output dose sheet. RADIANCE is able to process dose sheets generated by the four major CT vendors—Siemens, GE, Toshiba, and Philips—as well as from the CereTom portable head CT scanner by NeuroLogica (Danvers, Mass). Each vendor’s dose sheets have certain unique features that re-
quire customized processing. These specifications are described in the sections that follow.
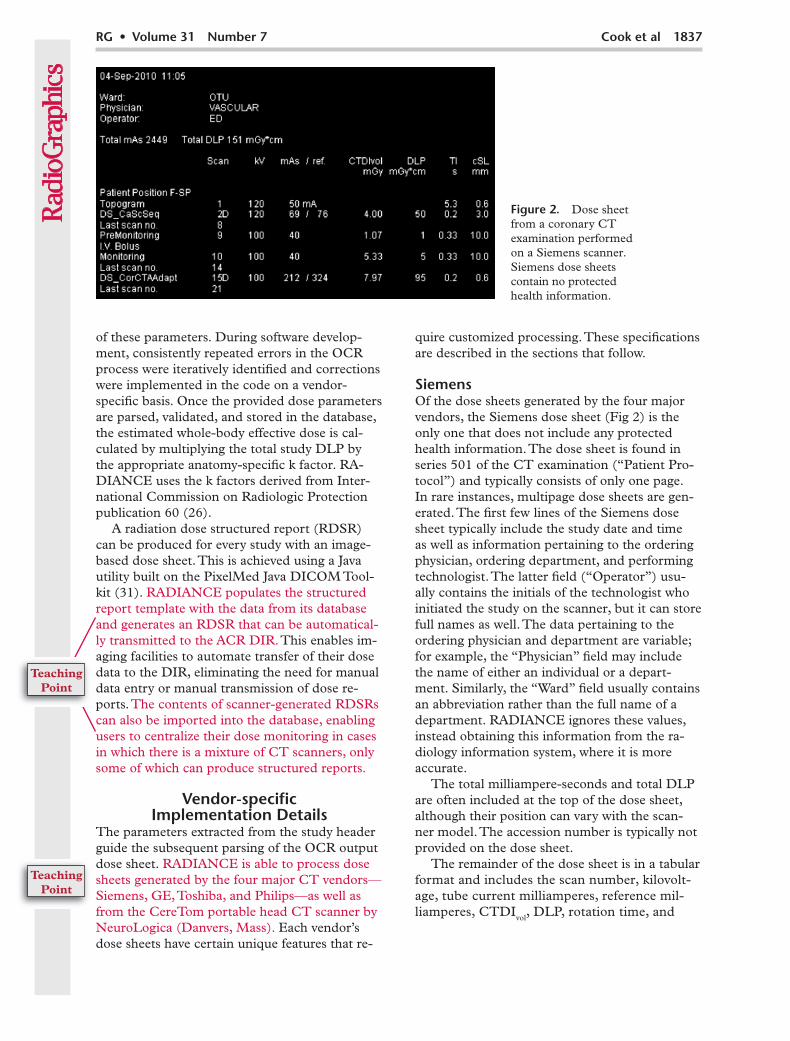
SiemensOf the dose sheets generated by the four major vendors, the Siemens dose sheet (Fig 2) is the only one that does not include any protected health information. The dose sheet is found in series 501 of the CT examination (“Patient Pro-tocol”) and typically consists of only one page. In rare instances, multipage dose sheets are gen-erated. The first few lines of the Siemens dose sheet typically include the study date and time as well as information pertaining to the ordering physician, ordering department, and performing technologist. The latter field (“Operator”) usu-ally contains the initials of the technologist who initiated the study on the scanner, but it can store full names as well. The data pertaining to the ordering physician and department are variable; for example, the “Physician” field may include the name of either an individual or a depart-ment. Similarly, the “Ward” field usually contains an abbreviation rather than the full name of a department. RADIANCE ignores these values, instead obtaining this information from the ra-diology information system, where it is more accurate.
The total milliampere-seconds and total DLP are often included at the top of the dose sheet, although their position can vary with the scan-ner model. The accession number is typically not provided on the dose sheet.
The remainder of the dose sheet is in a tabular format and includes the scan number, kilovolt-age, tube current milliamperes, reference mil-liamperes, CTDIvol, DLP, rotation time, and
Figure 2. Dose sheet from a coronary CT examination performed on a Siemens scanner. Siemens dose sheets contain no protected health information.

1838 November-December 2011 radiographics.rsna.org
collimated section length for each of the scout images and series within the study. If both tube current milliamperes and reference milliamperes are specified, they are usually delimited by a forward slash. If reference milliamperes are not provided (ie, dose modulation is not turned on), the forward slash is omitted and only one value is provided.
To parse the Siemens dose sheet, RADIANCE first parses the header to extract the operator’s identity, total milliampere-seconds, and (when specified) total DLP. RADIANCE looks for the word “Patient” or “Scan” to locate the start of the dose parameters. Each line of dose information is first examined to see if it matches one of a set of prescribed patterns. These patterns include scout or topographic image entries, which report kilo-voltage and (rarely) milliamperes but not CTDIvol or DLP. In addition, special dual-energy sequenc-es have a unique format in which there is a series name for one of the kilovolt settings but not for the other. In addition, the presence of a value for reference milliamperes is specifically sought. Any series that consists only of a series name and number but no dose parameters is omitted. Se-ries that don’t fit any of the predefined patterns are parsed according to a standard template of expected parameters. Some versions of the Sie-mens dose sheet now specify the phantom type used for the study by providing a footnote of “(a)” or “(b)” or, more recently, “S” or “L” with each CTDIvol and defining the footnote at the bottom of the dose sheet. If this information is specified, it is also stored in the database.
The volume and rate of intravenous contrast material injection are sometimes reported on the dose sheet, either as one of the series entries with the dose information or separately at the bottom of the dose sheet. At present, this information is not stored in RADIANCE.
GE Medical SystemsThe GE dose sheet (Fig 3) is found in series 999 (“Dose Report”). The header section of the dose sheet often includes the patient’s name and identification number, as well as the study acces-sion number, examination description, scanner model name, and study date. RADIANCE does not parse any of these data from the dose sheet because all of this information is included in the DICOM header, where it is immune to potential errors in the OCR process. The “Operator” field specified on the Siemens dose sheet is not in-cluded by GE and defaults to a value of “ZZZ” to indicate that these data were not specified on the
Figure 3. Dose sheet from a chest CT an-giographic examination performed on a GE scanner. Identifiable patient information that is normally included on the dose sheet has been removed for compli-ance with the Health Insurance Portability and Accountability Act.
Figure 4. Dose sheet from an abdominopelvic CT examination performed on a Toshiba scanner. Protected health information that is normally included on the dose sheet has been removed for Health Insurance Portability and Accountability Act compliance.
RG • Volume 31 Number 7 Cook et al 1839
dose sheet. In addition, total milliampere-seconds are not specified and default to an unspecified value of -1.
RADIANCE searches for the term “mGy” to locate the start of the dose parameters. The remainder of the GE dose sheet is tabular and reports a number, type, scan length, CTDIvol, DLP, and phantom type for every series in the study. Of these data, RADIANCE stores the series type (ie, series name), CTDIvol, DLP, and phantom type. At present, the scan length is not included in the database, since its value is inher-ently reflected in the series DLP. Neither tube current nor reference tube current is specified on the dose sheet, and they default to -1 in the da-tabase. Unlike the Siemens dose sheet, on which not all series entries follow the same tabular for-mat, the GE dose sheet has no such discrepancy.
The last line of the GE dose sheet reports the total DLP for the examination. This value is also parsed and stored. It can be compared with the sum of the individual series DLPs for internal validation of the OCR process as well as the pars-ing algorithm.
In some cases, GE studies produce multipage dose sheets. In such cases, the number at the bot-tom of each page of the dose sheet will specify the total number of pages in the dose sheet. All of the individual pages will be found within series 999 of the study.
ToshibaHistorically, the location of the Toshiba dose sheet (Fig 4) in a CT examination has varied. For studies from approximately 2009 onward, they can be found in series 9000 of the examination, but they may not have a consistent series name. For earlier examinations, both the series name and the series number can vary. This poses a challenge in retrieving these dose sheets from the PACS.
Parsing of the dose sheets is relatively straight-forward. The Toshiba dose sheet headers are quite detailed, but as with the GE dose sheets, most of the data are also available in the DICOM header, which is not susceptible to OCR extrac-
tion errors. However, the operator’s name or ini-tials are parsed from the dose sheet and stored in the database.
The total milliampere-seconds, average CTDIvol, and total DLP for the study, in addition to the type of phantom on which these estimates were based (ie, head or body), are parsed from the first page of the dose sheet. In some cases, the sum of the CTDIvol values for individual series is provided; although these data cannot be used to correctly calculate DLP for each body part scanned, they are extracted and stored. Users with these scanner models should verify how the CT-DIvol is reported to ensure correct use of the data for analysis. As with other vendors, information related to the use of intravenous contrast mate-rial is not parsed from the dose sheet. Reference tube current is not provided. Newer Toshiba dose sheets have a multipage format in which the first page retains the original summary format and subsequent pages provide series-specific values.
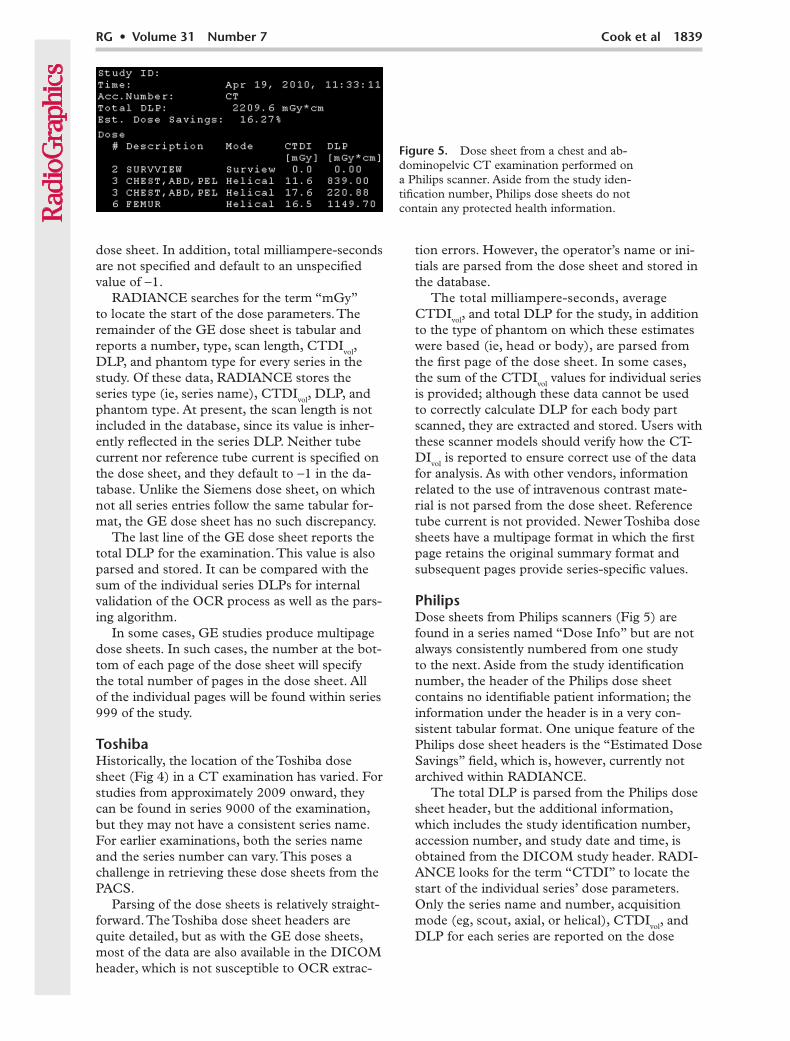
PhilipsDose sheets from Philips scanners (Fig 5) are found in a series named “Dose Info” but are not always consistently numbered from one study to the next. Aside from the study identification number, the header of the Philips dose sheet contains no identifiable patient information; the information under the header is in a very con-sistent tabular format. One unique feature of the Philips dose sheet headers is the “Estimated Dose Savings” field, which is, however, currently not archived within RADIANCE.
The total DLP is parsed from the Philips dose sheet header, but the additional information, which includes the study identification number, accession number, and study date and time, is obtained from the DICOM study header. RADI-ANCE looks for the term “CTDI” to locate the start of the individual series’ dose parameters. Only the series name and number, acquisition mode (eg, scout, axial, or helical), CTDIvol, and DLP for each series are reported on the dose
Figure 5. Dose sheet from a chest and ab-dominopelvic CT examination performed on a Philips scanner. Aside from the study iden-tification number, Philips dose sheets do not contain any protected health information.
1840 November-December 2011 radiographics.rsna.org
sheet; no phantom information is provided. For each series in the study, the software archives the series name, CTDIvol, and DLP.
Another unique feature of Philips scanners is that they have historically provided dose param-eters in the DICOM header, although not in the same format as the new RDSR. Nevertheless, these data are also parsed and are used to vali-date the values extracted from the dose sheet by means of OCR.
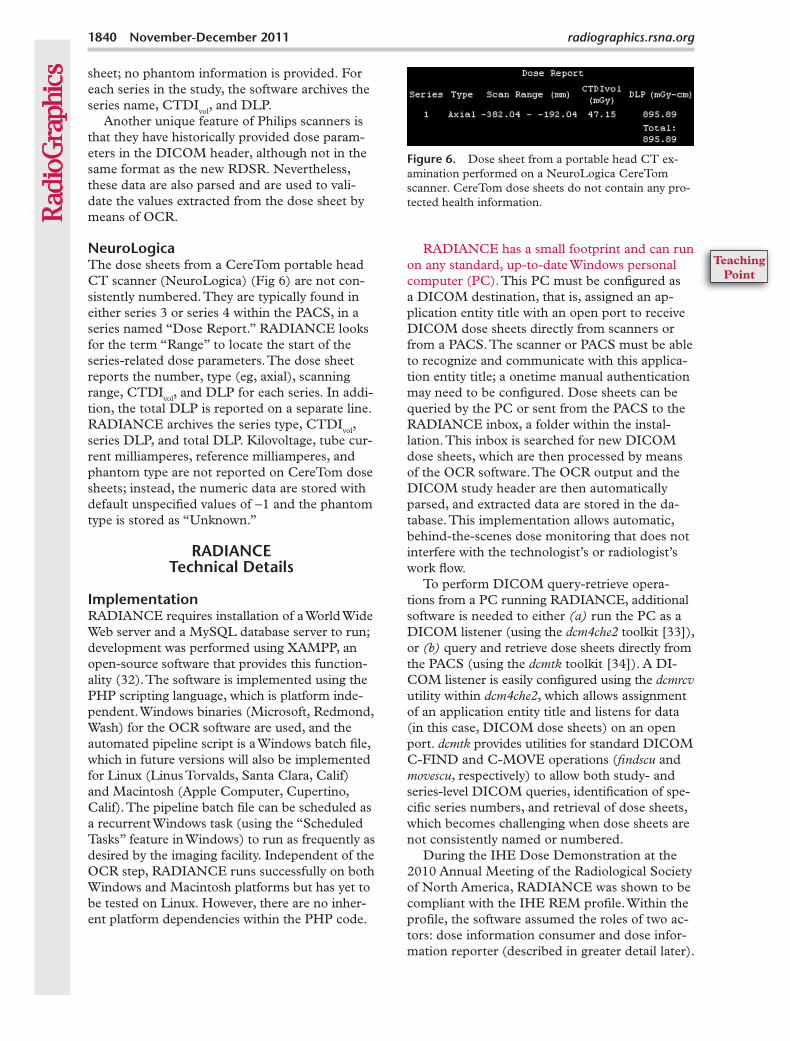
NeuroLogicaThe dose sheets from a CereTom portable head CT scanner (NeuroLogica) (Fig 6) are not con-sistently numbered. They are typically found in either series 3 or series 4 within the PACS, in a series named “Dose Report.” RADIANCE looks for the term “Range” to locate the start of the series-related dose parameters. The dose sheet reports the number, type (eg, axial), scanning range, CTDIvol, and DLP for each series. In addi-tion, the total DLP is reported on a separate line. RADIANCE archives the series type, CTDIvol, series DLP, and total DLP. Kilovoltage, tube cur-rent milliamperes, reference milliamperes, and phantom type are not reported on CereTom dose sheets; instead, the numeric data are stored with default unspecified values of -1 and the phantom type is stored as “Unknown.”
RADIANCE Technical Details
ImplementationRADIANCE requires installation of a World Wide Web server and a MySQL database server to run; development was performed using XAMPP, an open-source software that provides this function-ality (32). The software is implemented using the PHP scripting language, which is platform inde-pendent. Windows binaries (Microsoft, Redmond, Wash) for the OCR software are used, and the automated pipeline script is a Windows batch file, which in future versions will also be implemented for Linux (Linus Torvalds, Santa Clara, Calif) and Macintosh (Apple Computer, Cupertino, Calif). The pipeline batch file can be scheduled as a recurrent Windows task (using the “Scheduled Tasks” feature in Windows) to run as frequently as desired by the imaging facility. Independent of the OCR step, RADIANCE runs successfully on both Windows and Macintosh platforms but has yet to be tested on Linux. However, there are no inher-ent platform dependencies within the PHP code.
RADIANCE has a small footprint and can run on any standard, up-to-date Windows personal computer (PC). This PC must be configured as a DICOM destination, that is, assigned an ap-plication entity title with an open port to receive DICOM dose sheets directly from scanners or from a PACS. The scanner or PACS must be able to recognize and communicate with this applica-tion entity title; a onetime manual authentication may need to be configured. Dose sheets can be queried by the PC or sent from the PACS to the RADIANCE inbox, a folder within the instal-lation. This inbox is searched for new DICOM dose sheets, which are then processed by means of the OCR software. The OCR output and the DICOM study header are then automatically parsed, and extracted data are stored in the da-tabase. This implementation allows automatic, behind-the-scenes dose monitoring that does not interfere with the technologist’s or radiologist’s work flow.
To perform DICOM query-retrieve opera-tions from a PC running RADIANCE, additional software is needed to either (a) run the PC as a DICOM listener (using the dcm4che2 toolkit [33]), or (b) query and retrieve dose sheets directly from the PACS (using the dcmtk toolkit [34]). A DI-COM listener is easily configured using the dcmrcv utility within dcm4che2, which allows assignment of an application entity title and listens for data (in this case, DICOM dose sheets) on an open port. dcmtk provides utilities for standard DICOM C-FIND and C-MOVE operations (findscu and movescu, respectively) to allow both study- and series-level DICOM queries, identification of spe-cific series numbers, and retrieval of dose sheets, which becomes challenging when dose sheets are not consistently named or numbered.
During the IHE Dose Demonstration at the 2010 Annual Meeting of the Radiological Society of North America, RADIANCE was shown to be compliant with the IHE REM profile. Within the profile, the software assumed the roles of two ac-tors: dose information consumer and dose infor-mation reporter (described in greater detail later).
Figure 6. Dose sheet from a portable head CT ex-amination performed on a NeuroLogica CereTom scanner. CereTom dose sheets do not contain any pro-tected health information.
RG • Volume 31 Number 7 Cook et al 1841
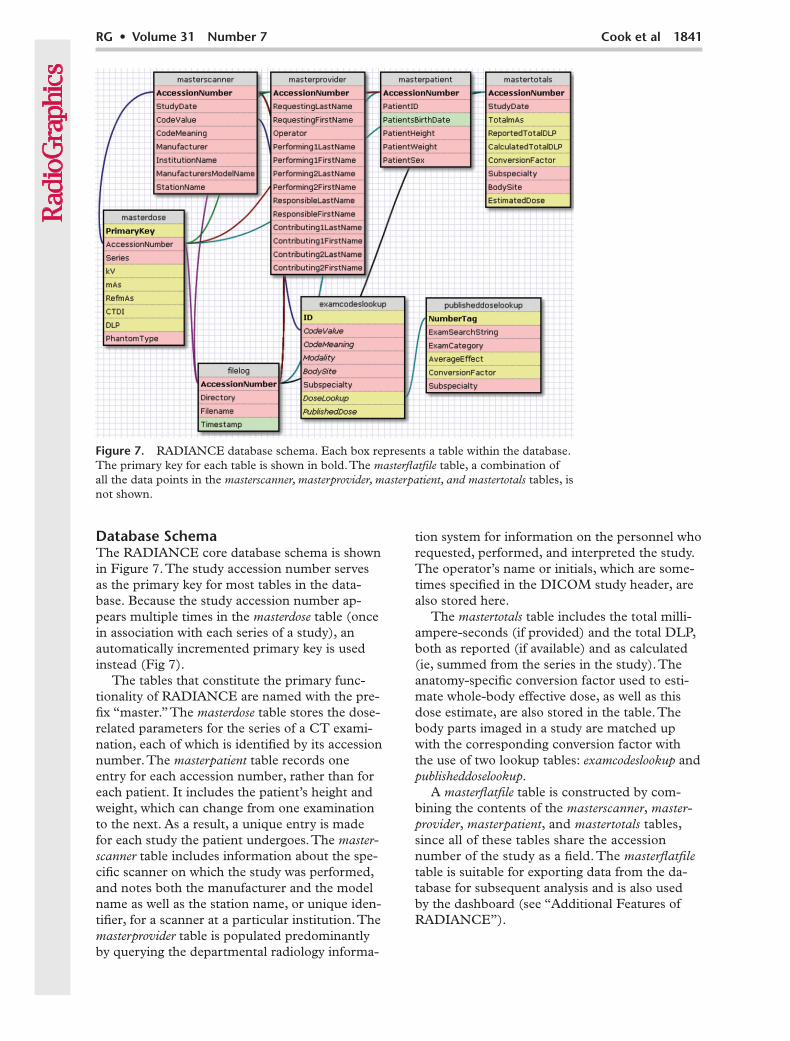
Database SchemaThe RADIANCE core database schema is shown in Figure 7. The study accession number serves as the primary key for most tables in the data-base. Because the study accession number ap-pears multiple times in the masterdose table (once in association with each series of a study), an automatically incremented primary key is used instead (Fig 7).
The tables that constitute the primary func-tionality of RADIANCE are named with the pre-fix “master.” The masterdose table stores the dose-related parameters for the series of a CT exami-nation, each of which is identified by its accession number. The masterpatient table records one entry for each accession number, rather than for each patient. It includes the patient’s height and weight, which can change from one examination to the next. As a result, a unique entry is made for each study the patient undergoes. The master-scanner table includes information about the spe-cific scanner on which the study was performed, and notes both the manufacturer and the model name as well as the station name, or unique iden-tifier, for a scanner at a particular institution. The masterprovider table is populated predominantly by querying the departmental radiology informa-
tion system for information on the personnel who requested, performed, and interpreted the study. The operator’s name or initials, which are some-times specified in the DICOM study header, are also stored here.
The mastertotals table includes the total milli-ampere-seconds (if provided) and the total DLP, both as reported (if available) and as calculated (ie, summed from the series in the study). The anatomy-specific conversion factor used to esti-mate whole-body effective dose, as well as this dose estimate, are also stored in the table. The body parts imaged in a study are matched up with the corresponding conversion factor with the use of two lookup tables: examcodeslookup and publisheddoselookup.
A masterflatfile table is constructed by com-bining the contents of the masterscanner, master-provider, masterpatient, and mastertotals tables, since all of these tables share the accession number of the study as a field. The masterflatfile table is suitable for exporting data from the da-tabase for subsequent analysis and is also used by the dashboard (see “Additional Features of RADIANCE”).
Figure 7. RADIANCE database schema. Each box represents a table within the database. The primary key for each table is shown in bold. The masterflatfile table, a combination of all the data points in the masterscanner, masterprovider, masterpatient, and mastertotals tables, is not shown.
1842 November-December 2011 radiographics.rsna.org
Additional tables help organize the data that are used to create the RDSRs that are transmit-ted to the ACR DIR.
RADIANCE ValidationUnique repeatable errors were found during OCR processing of each of the different vendors’ dose sheets. For example, the number 7 was al-ways replaced by the letter J when Siemens dose sheets were processed. Similar alphanumeric sub-stitutions were identified for other vendors’ dose sheets. All identified errors were consistent and repeatable for a particular vendor; consequently, correction of the parameters extracted from the OCR output was vendor specific. No manual intervention on the part of the user is required to correct these errors; the software expects and ac-counts for these substitutions.
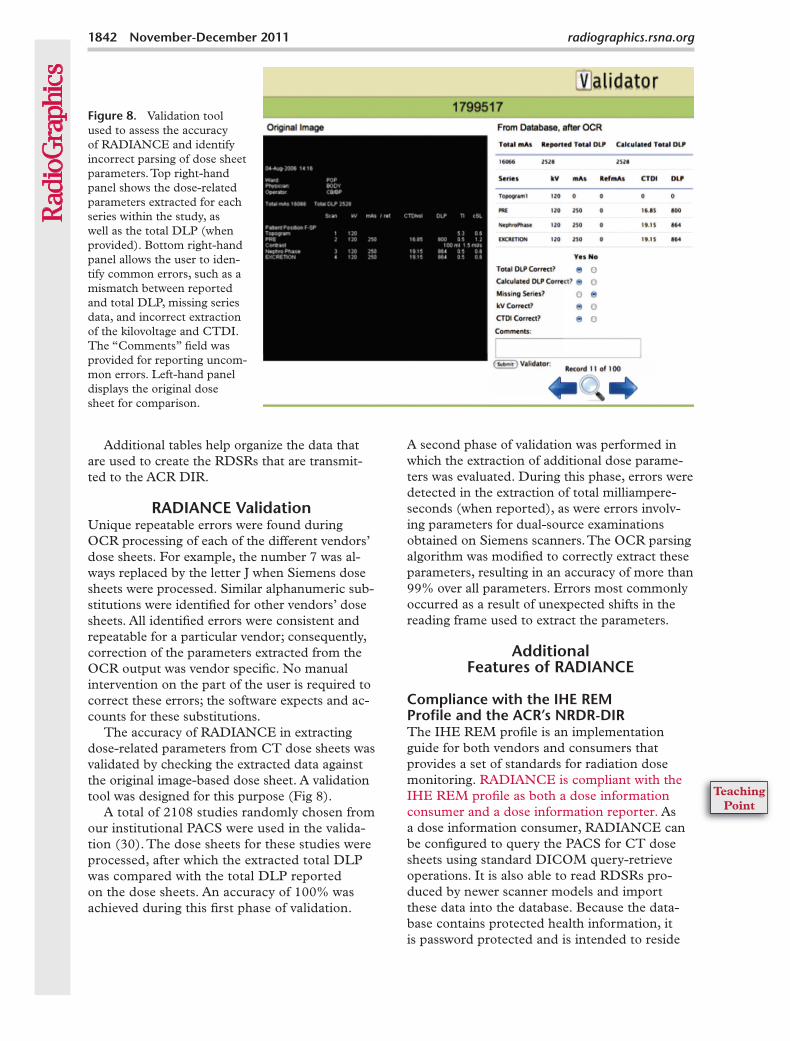
The accuracy of RADIANCE in extracting dose-related parameters from CT dose sheets was validated by checking the extracted data against the original image-based dose sheet. A validation tool was designed for this purpose (Fig 8).
A total of 2108 studies randomly chosen from our institutional PACS were used in the valida-tion (30). The dose sheets for these studies were processed, after which the extracted total DLP was compared with the total DLP reported on the dose sheets. An accuracy of 100% was achieved during this first phase of validation.
A second phase of validation was performed in which the extraction of additional dose parame-ters was evaluated. During this phase, errors were detected in the extraction of total milliampere-seconds (when reported), as were errors involv-ing parameters for dual-source examinations obtained on Siemens scanners. The OCR parsing algorithm was modified to correctly extract these parameters, resulting in an accuracy of more than 99% over all parameters. Errors most commonly occurred as a result of unexpected shifts in the reading frame used to extract the parameters.
Additional Features of RADIANCE
Compliance with the IHE REM Profile and the ACR’s NRDR-DIRThe IHE REM profile is an implementation guide for both vendors and consumers that provides a set of standards for radiation dose monitoring. RADIANCE is compliant with the IHE REM profile as both a dose information consumer and a dose information reporter. As a dose information consumer, RADIANCE can be configured to query the PACS for CT dose sheets using standard DICOM query-retrieve operations. It is also able to read RDSRs pro-duced by newer scanner models and import these data into the database. Because the data-base contains protected health information, it is password protected and is intended to reside
Figure 8. Validation tool used to assess the accuracy of RADIANCE and identify incorrect parsing of dose sheet parameters. Top right-hand panel shows the dose-related parameters extracted for each series within the study, as well as the total DLP (when provided). Bottom right-hand panel allows the user to iden-tify common errors, such as a mismatch between reported and total DLP, missing series data, and incorrect extraction of the kilovoltage and CTDI. The “Comments” field was provided for reporting uncom-mon errors. Left-hand panel displays the original dose sheet for comparison.

RG • Volume 31 Number 7 Cook et al 1843
behind an imaging center’s firewall, rather than on a public network.
As a dose information reporter, the analytics dashboard built on the database schema allows users to scrutinize their dose data more carefully and to analyze dose estimates by departmental section, individual scanner, involved personnel, or individual patient. Outlier identification is also possible, that is, the detection of studies whose dose estimates exceed a prescribed threshold. With the exception of the patient dashboard, which requires input of the patient’s medical record number, all data presented by the dash-board are completely deidentified in keeping with the REM profile. One of the actions of a dose information reporter in the REM profile is to transmit dose information to a registry. Hence, RADIANCE is able to generate deidentified RDSR representations of legacy CT dose sheets, thereby enabling users to participate in dose reg-istries. This capacity was tested in the IHE Dose Demonstration at the 2010 Annual Meeting of the Radiological Society of North America, dur-ing which RADIANCE fulfilled the roles of both dose information consumer and dose information reporter. With use of secure free-text protocol, RDSR representations of legacy CT dose sheets were produced and transmitted to the ACR DIR to demonstrate communication between a dose information reporter and a dose registry. Al-ternatively, these representations can be routed
through the ACR’s TRIAD Server, installed locally at each facility, and sent to the NRDR-DIR. RDSR generation is implemented using the open-source PixelMed Java DICOM Toolkit (31).
Dashboard AnalyticsTo facilitate review of the extracted data, we have designed a customizable dashboard built on the RADIANCE database schema. The dashboard is implemented using Highcharts JS (35), an open-source JavaScript charting library (Netscape [http://en.wikipedia.org/wiki/JavaScript]). The dashboard provides a set of standard overview screens that summarize dose estimates by depart-mental section, scanner, personnel, patient, and examination type. In addition, it allows users to identify those examinations that exceed a pre-scribed threshold for estimated whole-body dose (in millisieverts). Moreover, the dashboard is eas-ily customizable and enables users to add screens to those already provided that organize the data according to the needs at their particular facility.
A screen shot from a patient summary is shown in Figure 9. The patient dashboard indicates the dose estimates for each individual CT examina-tion at a given facility, as well as a cumulative lifetime dose estimate for the patient in question. Despite the limitations of adding dose estimates for separate CT scans, this representation gives
Figure 9. Screen shot from a patient summary within the RADIANCE dash-board, which pro-vides individual dose estimates as well as a cumulative lifetime patient dose estimate for all imaging un-dergone at a given facility. This repre-sentation of the data gives users a sense of how many and what types of CT exami-nations a patient has undergone, as well as an indication of who ordered these studies.
1844 November-December 2011 radiographics.rsna.org
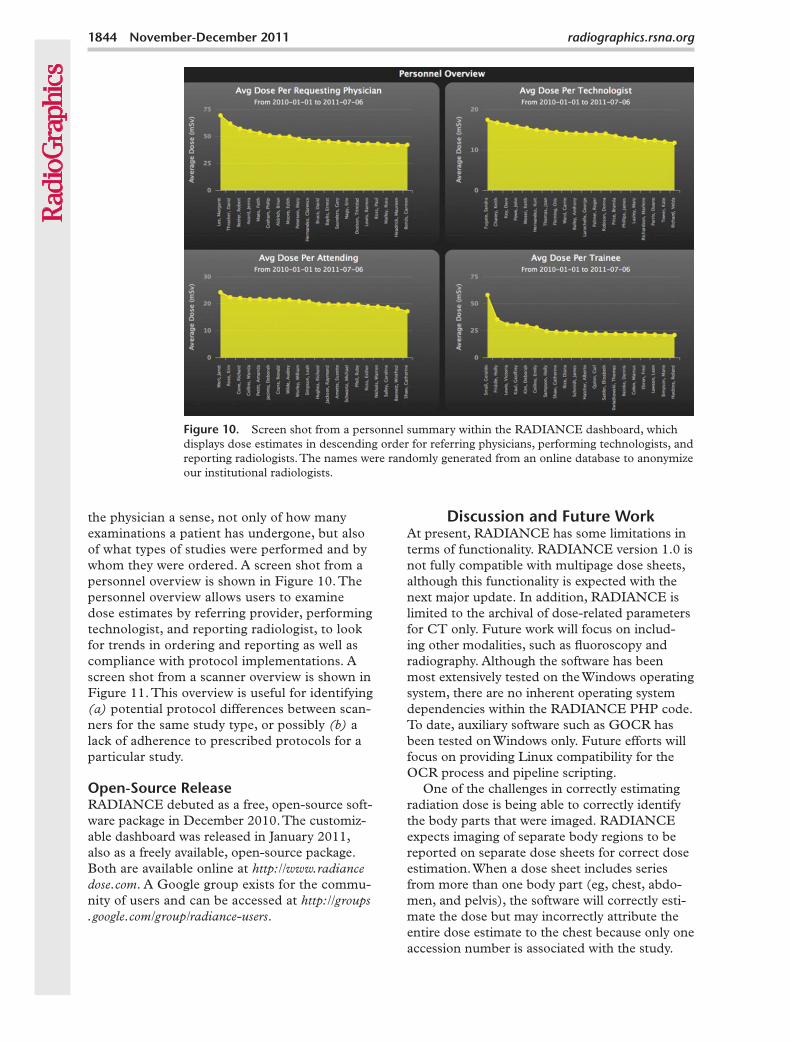
Figure 10. Screen shot from a personnel summary within the RADIANCE dashboard, which displays dose estimates in descending order for referring physicians, performing technologists, and reporting radiologists. The names were randomly generated from an online database to anonymize our institutional radiologists.
the physician a sense, not only of how many examinations a patient has undergone, but also of what types of studies were performed and by whom they were ordered. A screen shot from a personnel overview is shown in Figure 10. The personnel overview allows users to examine dose estimates by referring provider, performing technologist, and reporting radiologist, to look for trends in ordering and reporting as well as compliance with protocol implementations. A screen shot from a scanner overview is shown in Figure 11. This overview is useful for identifying (a) potential protocol differences between scan-ners for the same study type, or possibly (b) a lack of adherence to prescribed protocols for a particular study.
Open-Source ReleaseRADIANCE debuted as a free, open-source soft-ware package in December 2010. The customiz-able dashboard was released in January 2011, also as a freely available, open-source package. Both are available online at http://www.radiance dose.com. A Google group exists for the commu-nity of users and can be accessed at http://groups .google.com/group/radiance-users.
Discussion and Future WorkAt present, RADIANCE has some limitations in terms of functionality. RADIANCE version 1.0 is not fully compatible with multipage dose sheets, although this functionality is expected with the next major update. In addition, RADIANCE is limited to the archival of dose-related parameters for CT only. Future work will focus on includ-ing other modalities, such as fluoroscopy and radiography. Although the software has been most extensively tested on the Windows operating system, there are no inherent operating system dependencies within the RADIANCE PHP code. To date, auxiliary software such as GOCR has been tested on Windows only. Future efforts will focus on providing Linux compatibility for the OCR process and pipeline scripting.
One of the challenges in correctly estimating radiation dose is being able to correctly identify the body parts that were imaged. RADIANCE expects imaging of separate body regions to be reported on separate dose sheets for correct dose estimation. When a dose sheet includes series from more than one body part (eg, chest, abdo-men, and pelvis), the software will correctly esti-mate the dose but may incorrectly attribute the entire dose estimate to the chest because only one accession number is associated with the study.

RG • Volume 31 Number 7 Cook et al 1845
Figure 11. Screen shot from a scanner overview within the RADIANCE dashboard, which shows average and maximum dose estimates for a particular study type across multiple scanners at a given facility. This overview is helpful for detecting differences in dose between scanners, which may be due to protocol differences or lack of adherence to prescribed protocols.
We have developed an algorithm that addresses this problem by directly querying the PACS da-tabase at our institution and looking for scenarios in which multiple body parts are grouped on a single dose sheet (36). Without additional infor-mation from either the facility’s PACS or radiol-ogy information system, however, the algorithm may not be able to correctly sort these doses by the appropriate body part.
SummaryWith a growing need to be able to monitor, ar-chive, and report radiation dose estimates and dose-related parameters from CT examinations, RADIANCE provides a free, open-source solu-tion that can be implemented at imaging facilities worldwide with a small footprint on a standard Windows PC. Its users are able not only to moni-tor CT dose estimates, optimize protocols, and detect outliers, but also to participate in the ACR DIR, even if their scanners do not produce RD-SRs. In addition, at facilities with a mix of older and newer scanners, the software will import RDSRs generated by scanners with updated firm-ware, enabling facilities to use RADIANCE for internal dose monitoring and reporting regardless of the types of scanners available. RADIANCE is also compliant with the IHE REM profile, fulfill-ing the roles of both dose information consumer and dose information reporter within the profile. This allows imaging centers worldwide to moni-tor dose estimates administered at CT, optimize protocols on the basis of a review of the dose data collected, and, ultimately, maximize the benefit-to-risk ratio for patients by reducing unnecessary patient exposure to medical radiation while still performing diagnostic imaging examinations.
Acknowledgments:—The authors especially thank Thomas Chiang, MBA, and Daniel Morton, MSEE, of the Medical Imaging Group in the Department of Radiology at the Hospital of the University of Pennsyl-vania, who were instrumental in the successful deploy-ment of RADIANCE at Penn, assisting with retrospec-tive retrieval of the CT dose sheets from the PACS and the overall setup of the live application. We also thank Jonathan Haski, BS, and Vishnu Ganesan, BS, for their help in implementing the original version of the validator tool.
Disclosures of Potential Conflicts of Interest.— A.D.A.M.: Related financial activities: none. Other finan-cial activities: on the board of Real-Time Tomography and holds patents for anthropomorphic phantoms and octree encoding. S.R.S.: Related financial activities: none. Other financial activities: consultant for the Radiologi-cal Society of North America. T.S.C.: Related financial activities: received research support from the National In-stitutes of Health. Other financial activities: none. W.K.: Related financial activities: none. Other financial activities: on the boards of Montage Healthcare Solutions and iVirtuoso; consultant for Amirsys, Click Diagnostics, and Infiniti Medical; received payment from Terumo Medi-cal. W.W.B.: Related financial activities: none. Other fi-nancial activities: on the boards of the Society of Imaging Informatics in Medicine, Montage Healthcare Solutions, and Merge Healthcare; holds stock in Montage Health-care Solutions and Merge Healthcare.
References 1. Maitino AJ, Levin DC, Parker L, Rao VM, Sun-
shine JH. Nationwide trends in rates of utilization of noninvasive diagnostic imaging among the Medi-care population between 1993 and 1999. Radiology 2003;227(1):113–117.
2. Levin DC, Rao VM, Parker L, Frangos AJ, Sunshine JH. Recent trends in utilization rates of abdomi-nal imaging: the relative roles of radiologists and nonradiologist physicians. J Am Coll Radiol 2008; 5(6):744–747.

1846 November-December 2011 radiographics.rsna.org
3. Sinclair WK, Adelstein SJ, Carter MW, Harley JH, Moeller DW. Ionizing radiation exposure of the population of the United States: technical report 93. Bethesda, Md: National Council on Radiation Protection and Measurements, 1987.
4. Kase KR. Ionizing radiation exposure of the popu-lation of the United States: technical report 160. Bethesda, Md: National Council on Radiation Pro-tection and Measurements, 2009.
5. Brenner DJ, Hall EJ. Computed tomography: an increasing source of radiation exposure. N Engl J Med 2007;357(22):2277–2284.
6. Smith-Bindman R, Lipson J, Marcus R, et al. Ra-diation dose associated with common computed tomography examinations and the associated life-time attributable risk of cancer. Arch Intern Med 2009;169(22):2078–2086.
7. Congressional Subcommittee on Health. Medical radiation: an overview of the issues. Available at: http://energycommerce.house.gov/index.php? option=com_content&view=article&id=1910: medical-radiation-an-overview-of-the-issues& catid=132:subcommittee-on-health&Itemid=72. Accessed March 1, 2010.
8. Bogdanich W, Ruiz RR. FDA to increase oversight of medical radiation. New York Times, February 9, 2010.
9. Landro L. Radiation risks prompt push to curb CT scans. Wall Street Journal, March 2, 2010.
10. Goske MJ, Applegate KE, Boylan J, et al. The ‘Im-age Gently’ campaign: increasing CT radiation dose awareness through a national education and aware-ness program. Pediatr Radiol 2008;38(3): 265–269.
11. Brink JA, Amis ES Jr. Image Wisely: a campaign to increase awareness about adult radiation protec-tion. Radiology 2010;257(3):601–602.
12. American Association of Physicists in Medicine. CT protocols. Available at: http://aapm.org/pubs/CTProtocols/. Accessed July 1, 2011.
13. Padilla A, Alquist EK. California S.B. no. 1237. Radiation control: health facilities and clinics—records. Available at: http://www.leginfo.ca.gov/pub/09-10/bill/sen/sb_1201-1250/sb_1237_bill_ 20100929_chaptered.html. Accessed February 28, 2011.
14. DICOM Standards Committee. DICOM standard supplement 127: CT radiation dose reporting. Rosslyn, Va: DICOM Standards Committee, 2007.
15. DICOM Standards Committee. DICOM standard part 16: content mapping resource. Rosslyn, Va: DICOM Standards Committee, 2008.
16. Radiation Exposure Monitoring. Available at: http://wiki.ihe.net/index.php?title=Radiation_ Exposure_Management. Accessed March 15, 2010.
17. Amis ES Jr, Butler PF, Applegate KE, et al. Ameri-can College of Radiology white paper on radiation dose in medicine. J Am Coll Radiol 2007;4(5): 272–284.
18. American College of Radiology. National Radiol-ogy Data Registry. Available at: http://www.acr.org/SecondaryMainMenuCategories/quality_safety/NRDR.aspx. Accessed March 15, 2010.
19. U.S. Food and Drug Administration. White paper: initiative to reduce unnecessary radiation exposure from medical imaging. Available at: http://www . fda.gov/Radiation-EmittingProducts/Radiation Safety/RadiationDoseReduction/ucm199994.htm#_Toc253092884. Accessed March 15, 2010.
20. Neumann RD, Bluemke DA. Tracking radiation exposure from diagnostic imaging devices at the NIH. J Am Coll Radiol 2010;7(2):87–89.
21. Hausleiter J, Meyer T, Hermann F, et al. Estimated radiation dose associated with cardiac CT angiog-raphy. JAMA 2009;301(5):500–507.
22. Luaces M, Akers S, Litt H. Low kVp imaging for dose reduction in dual-source cardiac CT. Int J Cardiovasc Imaging 2009;25(suppl 2):165–175.
23. McCollough CH, Bruesewitz MR, Kofler JM Jr. CT dose reduction and dose management tools: overview of available options. RadioGraphics 2006; 26(2):503–512.
24. McCollough CH, Leng S, Yu L, Cody DD, Boone JM, McNitt-Gray MF. CT dose index and patient dose: they are not the same thing. Radiology 2011; 259(2):311–316.
25. Christner JA, Kofler JM, McCollough CH. Es-timating effective dose for CT using dose-length product compared with using organ doses: con-sequences of adopting International Commission on Radiological Protection publication 103 or dual-energy scanning. AJR Am J Roentgenol 2010; 194(4):881–889.
26. 1990 Recommendations of the International Com-mission on Radiological Protection. Ann ICRP 1991;21(1-3):1–201.
27. Huda W, Vance A. Patient radiation doses from adult and pediatric CT. AJR Am J Roentgenol 2007;188(2):540–546.
28. Kalra MK, Maher MM, Toth TL, et al. Strategies for CT radiation dose optimization. Radiology 2004;230(3):619–628.
29. GOCR. Available at: http://jocr.sourceforge.net/. Accessed March 1, 2010.
30. Cook TS, Zimmerman SL, Kim W, Boonn WW. Automated extraction and reporting of dose infor-mation from computed tomography examinations. College Park, Md: American Association of Physi-cists in Medicine, 2010.
31. Clunie DA. PixelMed Java DICOM Toolkit. Available at: http://www.dclunie.com/pixelmed/software/. Accessed March 1, 2011.
32. XAMPP. Available at: http://www.apachefriends .org/en/xampp.html. Accessed March 2, 2011.
33. dcm4che2 DICOM Toolkit. Available at: http://www.dcm4che.org/confluence/display/d2/dcm4 che2+DICOM+Toolkit. Accessed March 1, 2011.
34. Toolkit DCMTK-DICOM. Available at: http://dicom.offis.de/dcmtk.php.en. Accessed March 1, 2011.
35. Highcharts JS. Available at: http://highcharts.com/. Accessed March 2, 2011.
36. Cook TS, Zimmerman SL, Steingall S, Boonn WW, Kim W. An algorithm for intelligent sorting of CT-related dose parameters. Proc SPIE 2011; 7961:79612H.
Teaching Points November-December Issue 2011
Informatics in Radiology RADIANCE: An Automated, Enterprise-wide Solution for Archiving and Re-porting CT Radiation Dose EstimatesTessa S. Cook, MD, PhD • Stefan L. Zimmerman, MD • Scott R. Steingall, RT • Andrew D. A. Maidment, PhD • Woojin Kim, MD • William W. Boonn, MD
RadioGraphics 2011; 31:1833–1846 • Published online 10.1148/rg.317115048 • Content Codes:
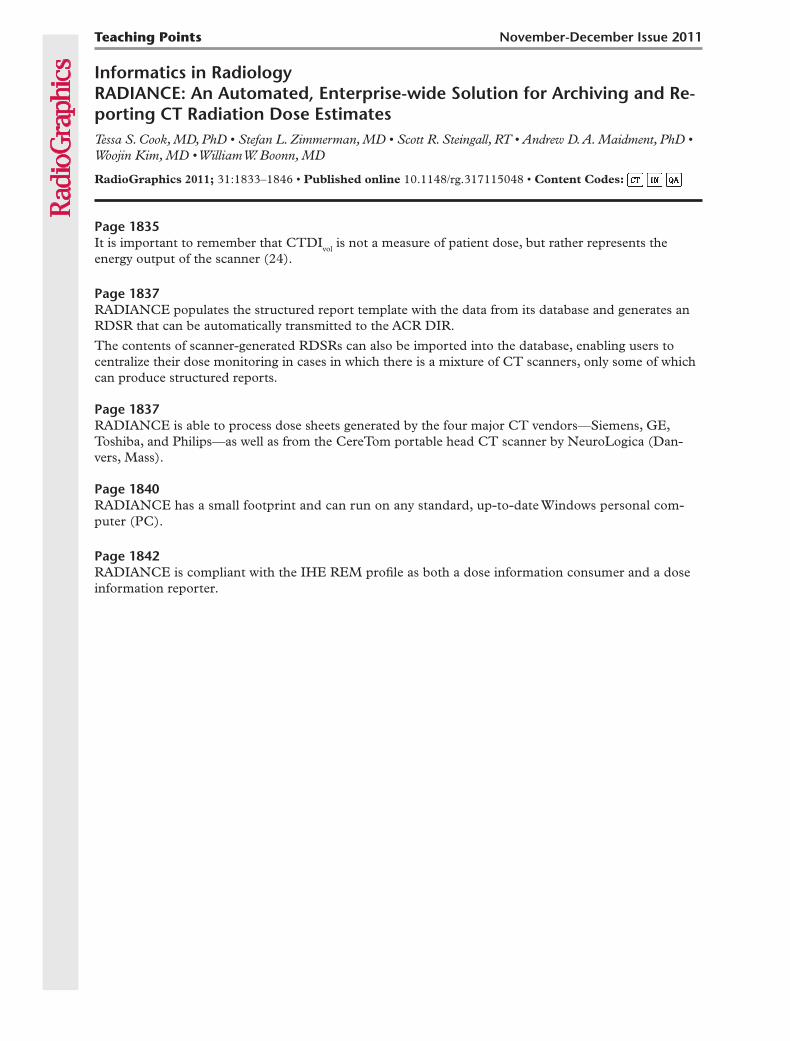
Page 1835It is important to remember that CTDIvol is not a measure of patient dose, but rather represents the energy output of the scanner (24).
Page 1837RADIANCE populates the structured report template with the data from its database and generates an RDSR that can be automatically transmitted to the ACR DIR.
The contents of scanner-generated RDSRs can also be imported into the database, enabling users to centralize their dose monitoring in cases in which there is a mixture of CT scanners, only some of which can produce structured reports.
Page 1837RADIANCE is able to process dose sheets generated by the four major CT vendors—Siemens, GE, Toshiba, and Philips—as well as from the CereTom portable head CT scanner by NeuroLogica (Dan-vers, Mass).
Page 1840RADIANCE has a small footprint and can run on any standard, up-to-date Windows personal com-puter (PC).
Page 1842RADIANCE is compliant with the IHE REM profile as both a dose information consumer and a dose information reporter.
Copyright © 2022 FDOKUMEN