Bioimage Informatics in the context of Drosophila research
14
Bioimage Informatics in the context of Drosophila research Florian Jug a,1 , Tobias Pietzsch a,1 , Stephan Preibisch b,c , Pavel Tomancak a,⇑ a Max Planck Institute of Molecular Cell Biology and Genetics, 01307 Dresden, Germany b Janelia Farm Research Campus, Howard Hughes Medical Institute, Ashburn, VA 20147, USA c Department of Anatomy and Structural Biology, Gruss Lipper Biophotonics Center, Albert Einstein College of Medicine, Bronx, NY 10461, USA article info Article history: Received 25 February 2014 Revised 2 April 2014 Accepted 4 April 2014 Available online 13 April 2014 Keywords: Image analysis Registration Processing Segmentation Tracking Drosophila abstract Modern biological research relies heavily on microscopic imaging. The advanced genetic toolkit of Drosophila makes it possible to label molecular and cellular components with unprecedented level of specificity necessitating the application of the most sophisticated imaging technologies. Imaging in Dro- sophila spans all scales from single molecules to the entire populations of adult organisms, from electron microscopy to live imaging of developmental processes. As the imaging approaches become more com- plex and ambitious, there is an increasing need for quantitative, computer-mediated image processing and analysis to make sense of the imagery. Bioimage Informatics is an emerging research field that covers all aspects of biological image analysis from data handling, through processing, to quantitative measure- ments, analysis and data presentation. Some of the most advanced, large scale projects, combining cutting edge imaging with complex bioimage informatics pipelines, are realized in the Drosophila research community. In this review, we discuss the current research in biological image analysis specif- ically relevant to the type of systems level image datasets that are uniquely available for the Drosophila model system. We focus on how state-of-the-art computer vision algorithms are impacting the ability of Drosophila researchers to analyze biological systems in space and time. We pay particular attention to how these algorithmic advances from computer science are made usable to practicing biologists through open source platforms and how biologists can themselves participate in their further development. Ó 2014 The Authors. Published by Elsevier Inc. This is an open access article under the CC BY license (http://creativecommons.org/licenses/by/3.0/). 1. Introduction Biological image analysis is a very rich field that affects all aspects of modern biological research dealing with imaging across many scales, from molecules to whole organisms. The Drosophila research community is no exception and needs image analysis methods to extract quantitative information from microscopy images. Over the years the tasks associated with processing and analyzing the output of microscopy technologies have become increasingly more complex. This is partly because the imaging technologies are developing rapidly, but also because the reverse genetic toolkit of Drosophila is making ever more sophisticated approaches to visualize molecular components in the organism possible. Resulting high dimensional image data need to be pro- cessed, visualized, quantified, analyzed and presented to the scien- tific community. Bioimage informatics is an emerging scientific discipline that addresses the image analysis problems associated with biological image data. Research on the Drosophila model system provides specific examples of all common biological image analysis scenarios. The field is too broad to be covered in a single comprehensive review. Therefore, we concentrate here on selected examples of advanced image analysis problems and solutions that emerge from the unique large scale projects that exploit the powerful Drosophila reverse genetic toolkit. These projects often represent the most advanced applications of systematic, genome-scale bioimage informatics. We begin by discussing the systematic efforts to map patterns of gene expression for all genes in the genome in var- ious developmental scenarios. We review the rich literature in computational biology journals and at computer vision confer- ences dealing with the analysis of 2D and 3D staining patterns and the impact of these technological papers on the respective fields – biology and computer vision. We next introduce the cut- ting edge imaging projects that aspire to capture entire Drosophila organs at high resolution or follow dynamic morphogenetic pro- cesses in toto. We discuss briefly the renaissance of electron microscopy (EM) investigations particularly in the neurobiology field and how image registration techniques become indispensable for application of EM to large tissues. Finally, we present an http://dx.doi.org/10.1016/j.ymeth.2014.04.004 1046-2023/Ó 2014 The Authors. Published by Elsevier Inc. This is an open access article under the CC BY license (http://creativecommons.org/licenses/by/3.0/). ⇑ Corresponding author. E-mail address: [email protected] (P. Tomancak). 1 These authors contributed equally. Methods 68 (2014) 60–73 Contents lists available at ScienceDirect Methods journal homepage: www.elsevier.com/locate/ymeth
Transcript of Bioimage Informatics in the context of Drosophila research

Methods 68 (2014) 60–73
Contents lists available at ScienceDirect
Methods
journal homepage: www.elsevier .com/locate /ymeth
Bioimage Informatics in the context of Drosophila research
http://dx.doi.org/10.1016/j.ymeth.2014.04.0041046-2023/� 2014 The Authors. Published by Elsevier Inc.This is an open access article under the CC BY license (http://creativecommons.org/licenses/by/3.0/).
⇑ Corresponding author.E-mail address: [email protected] (P. Tomancak).
1 These authors contributed equally.
Florian Jug a,1, Tobias Pietzsch a,1, Stephan Preibisch b,c, Pavel Tomancak a,⇑a Max Planck Institute of Molecular Cell Biology and Genetics, 01307 Dresden, Germanyb Janelia Farm Research Campus, Howard Hughes Medical Institute, Ashburn, VA 20147, USAc Department of Anatomy and Structural Biology, Gruss Lipper Biophotonics Center, Albert Einstein College of Medicine, Bronx, NY 10461, USA
a r t i c l e i n f o
Article history:Received 25 February 2014Revised 2 April 2014Accepted 4 April 2014Available online 13 April 2014
Keywords:Image analysisRegistrationProcessingSegmentationTrackingDrosophila
a b s t r a c t
Modern biological research relies heavily on microscopic imaging. The advanced genetic toolkit ofDrosophila makes it possible to label molecular and cellular components with unprecedented level ofspecificity necessitating the application of the most sophisticated imaging technologies. Imaging in Dro-sophila spans all scales from single molecules to the entire populations of adult organisms, from electronmicroscopy to live imaging of developmental processes. As the imaging approaches become more com-plex and ambitious, there is an increasing need for quantitative, computer-mediated image processingand analysis to make sense of the imagery. Bioimage Informatics is an emerging research field that coversall aspects of biological image analysis from data handling, through processing, to quantitative measure-ments, analysis and data presentation. Some of the most advanced, large scale projects, combiningcutting edge imaging with complex bioimage informatics pipelines, are realized in the Drosophilaresearch community. In this review, we discuss the current research in biological image analysis specif-ically relevant to the type of systems level image datasets that are uniquely available for the Drosophilamodel system. We focus on how state-of-the-art computer vision algorithms are impacting the ability ofDrosophila researchers to analyze biological systems in space and time. We pay particular attention tohow these algorithmic advances from computer science are made usable to practicing biologists throughopen source platforms and how biologists can themselves participate in their further development.
� 2014 The Authors. Published by Elsevier Inc. This is an open access article under the CC BY license(http://creativecommons.org/licenses/by/3.0/).
1. Introduction
Biological image analysis is a very rich field that affects allaspects of modern biological research dealing with imaging acrossmany scales, from molecules to whole organisms. The Drosophilaresearch community is no exception and needs image analysismethods to extract quantitative information from microscopyimages. Over the years the tasks associated with processing andanalyzing the output of microscopy technologies have becomeincreasingly more complex. This is partly because the imagingtechnologies are developing rapidly, but also because the reversegenetic toolkit of Drosophila is making ever more sophisticatedapproaches to visualize molecular components in the organismpossible. Resulting high dimensional image data need to be pro-cessed, visualized, quantified, analyzed and presented to the scien-tific community. Bioimage informatics is an emerging scientificdiscipline that addresses the image analysis problems associatedwith biological image data.
Research on the Drosophila model system provides specificexamples of all common biological image analysis scenarios. Thefield is too broad to be covered in a single comprehensive review.Therefore, we concentrate here on selected examples of advancedimage analysis problems and solutions that emerge from theunique large scale projects that exploit the powerful Drosophilareverse genetic toolkit. These projects often represent the mostadvanced applications of systematic, genome-scale bioimageinformatics. We begin by discussing the systematic efforts tomap patterns of gene expression for all genes in the genome in var-ious developmental scenarios. We review the rich literature incomputational biology journals and at computer vision confer-ences dealing with the analysis of 2D and 3D staining patternsand the impact of these technological papers on the respectivefields – biology and computer vision. We next introduce the cut-ting edge imaging projects that aspire to capture entire Drosophilaorgans at high resolution or follow dynamic morphogenetic pro-cesses in toto. We discuss briefly the renaissance of electronmicroscopy (EM) investigations particularly in the neurobiologyfield and how image registration techniques become indispensablefor application of EM to large tissues. Finally, we present an

2 Local invariant features are pixel level representations of image patchescommonly used in computer vision that are insensitive to transformations such asscaling or translation/rotation, i.e. similar features can be recognized in similarimages regardless of orientation of the objects in the images.
F. Jug et al. / Methods 68 (2014) 60–73 61
overview of computer vision methods available to segment andtrack labeled components in 4D image data and how they areslowly finding their way into the Drosophila application domains.
It is clear that in order to apply advanced computer scienceapproaches to biological image analysis by biologists, it is neces-sary to have the tools available as easy-to-use, preferably opensource, programs. Therefore, for each of the problems discussedhere we highlight the tools that are implemented in an accessibleway. In the Section 5 we discuss the open source platforms thathave emerged in recent years and that are collecting the biologicalimage analysis solutions, maintaining them and making themaccessible to the biology community. We will point out which toolsare particularly relevant for Drosophila researchers and why.Finally, we will also show how biologists can participate in devel-oping, extending or adapting the open source software to their spe-cific research needs.
2. Image analysis of systematically collected atlases of patternsof gene expression
2.1. Analysis of 2D RNA in situ datasets
Ever since the genome of Drosophila became available [1], it waspossible to apply classical techniques such as in situ hybridization(ISH) to all genes in the genome and systematically catalogpatterns of gene expression in various tissues [2–5]. The patternswere typically documented using fairly standard wide-field or fluo-rescence microscopy techniques, as 2D images of whole mountspecimen. The datasets were unique in a sense that they consistedof tens of thousands of images acquired under relatively controlledconditions. Controlled vocabularies (CV) were used to make thedata accessible to searches and global computational analysis.Grouping of similar patterns and searching was not done usingthe images themselves, but rather relied on expert judgmentsabout the patterns. Despite the standardization of imaging proce-dures and limited number of annotators, controlled vocabularyannotation suffers from human bias – even an experienced embry-ologists would annotate the same patterns differently whenpresented with them multiple times.
In order to reduce the annotator bias, several groups have inde-pendently made an effort to organize the gene expression datausing computer-assisted image analysis approaches. The firstattempt at organizing the ISH data using the images themselveswas the FlyExpress database allowing blast like searches of theexpression patterns based on mostly manual segmentations(Fig. 1a and b http://www.flyexpress.net [6,7]. The manual seg-mentations from FlyExpress have been incorporated into FlyBase.The FlyExpress search tool has grown over the years to also includedata from the fluorescent in situ hybridizations (FISH) [4] andimages of Drosophila embryos extracted from open access litera-ture corpus [8]. FlyExpress has been used by its authors to studygene expression patterns of paralogs [9] and there is a desktop ver-sion of the software, which biologists can use to upload their owndata and search them against the systematically collected dat-abases [10]. Biologists on the go can use the database even usingan iPhone application [11].
One way to simplify image analysis of the ISH data is to reducethe dimensionality of the images. For example, one can downsam-ple the embryos by overlaying it with a triangular mesh with fixednumber of triangles and integrating the staining signal in each tri-angle [12]. Each expression pattern becomes represented by a 311dimensional vector that can be easily compared between patternsand used for clustering of similar patterns together. The authorsused this approach to classify patterns during the blastodermstage, where it is particularly difficult to describe the patterns byCV annotations since the cells lack distinguishing morphological
characteristics. The mesh approach also lends itself to straightfor-ward implementation of image-based search and is availablethrough the BDGP website as a annotation independent gatewayinto the ISH dataset (Fig. 1c–e http://insitu.fruitfly.org/cgi-bin/ex/insitu.pl).
Developmental anatomy of Drosophila embryo is complex and itis a difficult task even for an expert biologist to correctly interpret astaining pattern when presented with a finite set of stage-specificimages. How can the computer perform well at this task? Eventhough the data are collected using strictly controlled imaging pro-tocols, at the end, the computer is presented with a limited sampleof 2D image snapshots of a complex 3D pattern that is in realitydynamically changing during development. Interestingly, it is spe-cifically this incompleteness of the data that makes the problemchallenging for the computer science community. It turns out thatthe expert CV annotations are the crucial ingredient that makes theproblem tractable. The computer vision community has limitedinterest in Drosophila research, however its researchers see a largestandardized dataset of images that have been expertly labeled.This presents an opportunity to apply machine-learning tech-niques in combination with segmentation and feature extractionalgorithms to yield relatively consistent results in expression pat-tern classification. Over the years several independent groups haveapplied state-of-the-art computer vision approaches to decomposethe patterns, group similar patterns together, and annotate basedon learned examples [13–22]
Initially, Hanchuan Peng and colleagues used advanced com-puter vision techniques [13,23,24], to detect similar patterns, how-ever these approaches were applied to an unfinished ISH dataset.Computational biologist, Uwe Ohler, took a more statisticalapproach of testing against randomized, dimensionally reduceddatasets to identify similarities among patterns [18]. Later on Ohlerdeveloped an approach based on sparse Bayesian factor analysisthat attempts to decompose the complex patterns into simplebuilding blocks and use such lower dimensional representationfor comparisons [19]. They also extended this approach to analysisof pattern development across time [20]. Yeping Ye and co-workersused the data from the FlyExpress database to extract a number ofcommonly used local invariant image features2 from the embryoimages and combine them to match similar patterns [15]. They alsoused an approach from text mining, called bag-of-words, to constructvisual code books from the extracted invariant features across groupsof images representing one pattern as defined by the annotationterms and used these representations to annotate [16,25]. Recentlythese authors developed an interesting approach to determine theexact stage of the embryos in the pictures going beyond the approx-imate assignment into a stage group and this approach had found itsway into FlyExpress [26]. The interest of the computer vision com-munity in this problem is not diminishing. A completely independentsystem for embryo image analysis, SPEX2, reusing some of the previ-ous approaches such as mesh representation has been developed inthe lab of Eric Xing [21] and applied to network analysis of the BDGPdata [27]. As for all approaches discussed in this paragraph, the codeto perform the analysis is accessible only to experts.
In summary, the BDGP ISH data turned out to be a useful play-ground for computer vision experts to develop, test and compareadvanced image classification algorithms. Some of the methodsdealing with data have been published at dedicated computervision conferences, which is the primary publishing venue in thisfield [23,24,17,28,22,29]. Unfortunately, very little of this researchhas had direct impact on biology. For example, none of the numer-

stg
tin
CG12026
Hph
trx
CG12340
CG10171
tin*
CG8603
CG8001
neur
CG9005
Cyp310a
CG34379
CG8312
netA
wntD
CG9005
a
b
c
e
d
*
Fig. 1. Image-based searching of Drosophila ISH datasets. (a) Screenshot of FlyExpress search input page launched from an image of Drosophila blastoderm stage embryostained with anti-sense tinman probe (c). Three independent manual thresholds are presented to the user and the nine images that match that threshold best (45–55%similarity) are shown along with the corresponding segmentations (b). The expression pattern of tinman (c) represented as triangular mesh and the top nine results of theresulting image-based search on the BDGP website. Stars mark other tinman images returned by the BDGP search (note that the first tinman image is oriented with ventralside of the embryo pointing upwards). Interestingly, the top hits of the two search engines do not overlap.
62 F. Jug et al. / Methods 68 (2014) 60–73
ous machine driven annotation results were incorporated into theCV annotation dataset, because the level and types of errors in theautomated annotation is still too high to be useful to biology. Thereis also a significant redundancy in the research efforts. Forexample, the mesh approach has been implemented by three inde-pendent groups [12,27,30]. The consequence of poor code sharingpractices is that even now, after all the research done on the sub-ject, when someone wants to analyze ISH data they have to start bydeveloping their own basic processing tools for embryo segmenta-tion [29].
Biologists are collecting embryo ISH images routinely and anaccessible software for quantitatively analyzing them and compar-ing them with large-scale databases would be very useful. Quanti-tative approaches are also required to compare patterns acrossspecies [31] and to analyze ISH data from other tissues such asimaginal discs [32,33]. In the future it will be important to bringthe ISH analysis pipeline to one of the open source platforms forbiological image analysis. There is a need for modular open sourcesoftware that is simplifying the entry point into the data (by imple-menting standard embryo extraction and registration tasks) and

F. Jug et al. / Methods 68 (2014) 60–73 63
enables seamless incorporation of advanced classification andanalysis approaches.
2.2. Analysis of gene expression data captured in 3D
The major limitation of the ISH embryo datasets is that inher-ently 3D dynamical developmental system is documented bystatic 2D snapshots. Imaging technologies to scan Drosophilaembryos in 3D are readily available, however they are relativelyslow and so it would be difficult to achieve the same throughputof imaging as in high-throughput ISH screens. The Berkeley Dro-sophila Transcription Network Project focused on imaging tran-scription factors at the blastoderm stage of embryodevelopment using antibody stainings and two-photon confocalmicroscopy [34]. The resolution of the imaging was sufficient todistinguish essentially all nuclei throughout the embryo andreduce the dimensionality of the data into a point cloud 3D rep-resentation. Quantitative analysis of the data was facilitated byregistering all acquired 3D images into a composite VirtualEmbryo using a reference gene expression pattern common toall embryos. As every specimen is different, it was necessary towarp the point-clouds to map the gene boundaries of the refer-ence marker onto a standard morphological template [35]. Inorder to be able to follow the pattern over time it was necessaryto establish correspondences between nuclei from differenttemporal cohorts using dynamical morphological templatesincorporating real data on nuclear positions and movements[36]. This general approach was later used to compare spatialgene expression patterns between different Drosophila species[37,38]. The Drosophila melanogaster dataset consists of 3D scansfor 95 genes at 6 different temporal cohorts and served as a start-ing point for modeling of transcription factor networks in theearly embryo [35,39]. Interestingly, similar predictive models ofgene regulatory networks [40–42] can be extracted from 2D con-focal datasets further dimensionally reduced to 1D line profilesalong the anterior posterior axis [43–45]. Since the 2D data areclearly sufficient to perform network inference at least in this set-ting [46] and collecting the 3D image data requires substantialresources, it may be useful to invest in robust, open source pipe-line for dealing with 2D ISH data especially for comparative anal-ysis [31].
Systematic imaging of patterns of gene activity is not limitedto Drosophila embryos. In recent years, Janelia Farm ResearchCampus has made a concerted effort to generate promoter con-structs to assay for enhancer activity across the genome. The pri-mary goal of this project is to generate UAS/GAL4 reagentscapable of targeting relatively smaller neuronal subpopulationsin the CNS compared to standard enhancer traps [47]. The lineshave been systematically imaged in the adult brain [48] and sev-eral other tissues [49,50] by confocal microscopy. The 3D braindata were aligned to a common atlas using the software BrainA-ligner [51]. It uses an automatically recognizable subset of man-ually selected landmarks defined by general neuronal marker towarp the subject brain into the target brain. The atlas enablescomparison of the neuronal networks in sparsely labeled trans-genic enhancers constructs. The approach is powerful and willlikely supersede previous pioneering efforts to systematicallymap neuroanatomy using manual approaches [52]. The tool isavailable as open source plugin to Vaa3D suite [53] where it syn-ergizes with state-of-the-art visualization and segmentation tools.Importantly, the data are provided to the Drosophila communitythrough dedicated interface at Janelia Farm and also through anindependent Virtual Fly Brain project [54,55]. These online tools
will become particularly powerful when Drosophila researcherswill be able to upload their own Drosophila brain images andcompare against the databases similarly to Flyexpress for ISHembryo data. The tools to analyze neuronal morphology by com-paring shapes are available [56].
3. Image processing of spatially or temporally large microscopydata
Modern Drosophila developmental biology increasingly relies onthe imaging of large samples with high spatial and temporal reso-lution. Classical confocal microscopy is only capable of deliveringhigh-resolution imaging for relatively small parts of the specimen.Depending on the type of analysis, several approaches can beundertaken to achieve high resolution throughout the entiresample.
3.1. Tiled imaging, stitching and processing of serial sections
For analysis of fixed, relatively thin samples like imaginal discs,where temporal resolution is not relevant, classical confocalmicroscopy can be combined with an automated microscopic stageto cover large fields of view at maximal spatial resolution. Theseoften automatically acquired 3D image tiles can be completelyautomatically aligned using image stitching tools available in Fiji[57,58], XuvTools [59], Vaa3D [53], TeraStitcher [60]. These soft-ware tools make use of the Fourier based phase correlation todirectly compute the translation between adjacent tiles in 3Dand combine all pairwise overlaps into one globally optimal solu-tion that does not propagate errors (Fig. 2a). The underlying phasecorrelation method is very efficient, therefore the computationtime is typically significantly lower than the time it takes toacquire the tiled confocal dataset.
An extreme example of tiled imaging of large tissues is theapplication of an imaging modality that offers the ultimate spatialresolution – electron microscopy (EM). In this case it is necessaryto image thin sections (which can be produced by various means– for recent review see [61] to gain insight into the 3D structureof the specimen. The combination of imaging large areas withnanometer resolution and across hundreds or thousands of tensof nanometers ‘thick’ sections, results in enormous amounts ofimage data that have to registered. It has been proposed that inthe neurobiology such data will provide insight into both micro-and macro-architecture of the Drosophila nervous system [62].Therefore, the large scale EM approaches are experiencing a resur-gence and Drosophila is leading the way especially through the CNSmapping projects run at Janelia Farm. The datasets produced thereoften consist of hundreds of thousands of EM images.
The ultimate goal of collecting serial section EM data of largepieces of Drosophila brain or ventral nerve cord (Fig. 2b) is to recon-struct the connectome. Connectomics has been successfullyapplied to decipher the local motion detection circuit in Drosophilaoptic medulla [63]. The EM data have been reconstructed using aimage processing pipeline developed at Janelia Farm [64], howeveraccess to these computational tools remains limited. An alterna-tive, more accessible, set of tools for reconstruction of serial sectionEM data have been developed under the Fiji project (see Section 5).
Serial section EM reconstruction requires the solution of twoconnected problems: stitching of overlapping image tiles, whosearrangement is typically known, within each section and registra-tion of such mosaics between sections that have been indepen-dently cut and stained in case of Transmission EM data (TEM).

Fig. 2. Reconstruction of microscopic acquisitions. (a) Illustrates the principle of 3D image stitching on a multi-tile acquisition of a Drosophila central nervous system. Severaltiles are acquired using a confocal microscope and a motorized microscopic stage; the correct overlap between the tiles is computed and a final output image covering theentire specimen is rendered. (b) Schematic drawing of the central nervous system of Drosophila larva [153]. VNC – ventral nerve cord, SOG – subesophageal ganglion, T1-3 –thoracic segments, A1-9 – abdominal segments. The blue box marks the approximate area that was subjected to serial section transmission electron microscopy. The blow upshows a sagittal section through that volume after elastic registration. (c, d) An electron micrograph of a reconstructed TEM section overlaid with outlines of image tilesrepresenting three consecutive sections after affine (c) and elastic (d) registration. (e) Schematic representation of alignment strategy where all sections in the series are alignedto a number of neighboring section in the series. (f) Cross section through a part of Drosophila ventral nerve cord volume shown in (b) aligned using as-rigid-as-possible (left)and elastic (right) approach. (g) Schematic of a SPIM microscope where illumination and detection lens are arranged orthogonally and a sample mounted in a capillary inagarose is placed at the intersection of the optical path and can be rotated. (h) Schematic representation of a multi-view acquisition consisting of four 3D stacks of the samespecimen. (i) Rendering of two overlapping SPIM views with segmented fluorescent beads colored according to the transformation model they support (majority of green beadsagree on a transformation model while all red beads point to a different model). The grey mass in the center are the nuclei of the blastoderm Drosophila embryo. (j) Dorsal,lateral and frontal 3D renderings of an extended germ band stage Drosophila embryo imaged with SPIM, reconstructed and fused using SPIMage processing plugins in Fiji. (k)Dorsal, lateral and frontal 3D renderings of the same extended germ band stage Drosophila embryo as in (j) imaged with SPIM, reconstructed and deconvolved. The bright dotsaround the embryo are sub-resolution fluorescent beads used as fiducial markers during registration. The beads become emphasized by the deconvolution process.
64 F. Jug et al. / Methods 68 (2014) 60–73

F. Jug et al. / Methods 68 (2014) 60–73 65
Stephan Saalfeld proposed to use SIFT (Scale Invariant FeatureTransform) features [65] to connect corresponding image contentboth within sections and across sections and to iterativelyminimize the displacement of corresponding SIFT features acrossthe entire system of overlapping image tiles [66]. The approachrelies on the corresponding features being correct, which isensured using stringent consensus filters3 [67]. The approach isas-rigid-as-possible in a sense that it does not arbitrarily deformindividual images and relies only on their affine transformations.4
(Fig. 2c). While this approach can reconstruct large portions of Dro-sophila brain with precision sufficient to make biological insights[68], the pervasiveness of artifacts and non-linear deformations inserial section TEM data make reliable extraction of neuronal profilescumbersome even using manual approaches. Thus Saalfeld extendedhis approach to develop an algorithm that takes the SIFT alignmentas a starting point and uses local block matching5 in triangulatedimages to perform constrained global elastic alignment (Fig. 2d[69]). The key feature of the algorithm is that block matches arecomputed not only between adjacent sections but in a broader sec-tion vicinity (Fig. 2e). This tends to preserve the continuously chang-ing neuronal shapes across sections and to remove the characteristicjitter caused by artifacts that are uncorrelated across the section ser-ies (Fig. 2f). All the registration tools are integrated into a powerfulopen source software suite for management, registration, and analy-sis of serial EM datasets, TrakEM2, developed by Albert Cardona [70]and distributed through the Fiji project [58]. The pipeline is applica-ble to small and large scale EM datasets (even block face EM dataneed registration correction, Stephan Saalfeld personal communica-tion) and can also be used to register serially stained array tomogra-phy section series [69,71].
3.2. Processing of multi-view light sheet microscopy data
In order to completely cover large non-transparent samples likeDrosophila embryos or larvae, it is necessary to image the specimenin multiple 3D orientations, from multiple angles (views). Initially,rotational devices had been devised to combine rotation and con-focal microscopy [72], but they remained a niche solution as theapproach is limited to imaging of fixed samples and is very trickyto realize. The recent emergence of Selective Plane IlluminationMicroscopy (SPIM, also called Light Sheet Fluorescence Micros-copy, LSFM) [73] dramatically changed the landscape in lightmicroscopy field (for recent review of light sheet technology see[74]. Apart from sample rotation, SPIM offers significantly reducedphotobleaching and fast acquisition due to orthogonal light-sheetillumination and detection (Fig. 1g) and thereby allows live imag-ing of entire Drosophila embryos at cellular resolution throughoutdevelopment. The resulting datasets are useful to study morphoge-netic movements, can be used to record patterns of gene expres-sion [75], and have the potential to enable the reconstruction ofentire lineage trees of developing Drosophila embryos.
Due to the enormous amount of image data generated by SPIM,reconstruction, viewing, and analysis of the data is a major compu-tational challenge. The reconstruction of multi-view time-lapsedatasets typically consists of multi-view registration whereby thedifferent acquired views are placed on top of each other optimallyin a 3D space (Fig. 2h). Multi-view registration can be achieved byrobust and efficient matching of external landmarks like fluores-cent beads (Fig. 2i) [76], matching of sample intensities [77] or
3 Coarse outliers are removed using the RANSAC algorithm (RANdom SAmpleConsensus [67]) which finds the largest subset of features that all agree on the sametransformation. The inlier set is further pruned using a robust trimmed M-estimatorto match the expected distribution of displacement errors.
4 Affine transformation includes translation, rotation and scaling.5 Essentially computing cross-correlation between blocks of pixel in a local vicinity
.by precise calibration of the optical setup [73,78]. The registrationis followed by a multi-view fusion step when the data fromdifferent views are combined into a single isotropic output image.Multi-view fusion combines the overlapping views using weightedaverages of the pixel values from the different registered views(Fig. 2j) [77,76,79]. Multi-view deconvolution has been proposedas a powerful alternative to simple multi-view fusion as it signifi-cantly increases resolution and contrast in the reconstructed sam-ple (compare Fig. 2j and k) [77,80]. In general, the deconvolutionattempts to computationally identify the most probable underly-ing image that gave rise to the image observed in the microscopetaking into account the optical properties of the microscope. Therepeated observations of the same specimen from different anglesmake the difficult deconvolution problem more tractable. Based onprevious research in the medical community [81], improved multi-view deconvolution based on Poisson statistics has recently beenadapted for SPIM [82,83], and optimized to a point that allowsreal-time deconvolution of long-term time-lapse acquisitions(Fig. 2k) [84]. The software for bead-based registration as well asefficient multi-view deconvolution is available as plugin andopen-source code in Fiji.
Since SPIM microscopy is now readily available to practicingbiologists through commercial products (Carl Zeiss MicroimagingLightsheet Z.1) and open access platforms [85,86], it is importantthat Drosophila biologists are ready to deal with the data torrentcoming off these microscopes. The implementation for SPIMageprocessing in Fiji is applicable to both Lightsheet Z.1 and OpenSPIMand crucially, all the tools can be deployed on a compute cluster inparallel (http://fiji.sc/SPIM_Registration_on_cluster).
The latest light sheet microscopy paradigms [87,88] do not relyon sample rotation but also they need image processing before thedata can be used for analysis. This is also true for the structuredillumination bessel beam light sheet microscope [89] that capturedthe imagination of biologists with beautiful images and movies.Yet these simply do not realize without appropriate software.
Even viewing the gigantic, processed datasets is often notpossible with standard software as it exceed the limits of RAM oftypical workstation computers. A simple way to view recon-structed data is to use Fiji’s option of opening virtual stacks, butthen viewing and analysis options are limited. A more advancedtool for interactively slicing, viewing and processing on very large,terabyte range datasets in real-time is the BigDataViewer (PietzschT., personal communication) that is provided as a Fiji plugin(http://fiji.sc/BigDataViewer). Another possibility, that is currentlyunder development, is to extend the GoogleMaps style web toolCATMAID [90] to include the temporal dimension. By adaptingthe neuron tracing tools (http://catmaid.org) to manual trackingof nuclei or proofreading of automated segmentations one cancrowd source the analysis of SPIM data.
SPIM datasets are the prime examples of challenging, nextgeneration microscopy data that in its scale rival the wildest imag-ination of biologists and will impress even computer scientistsused to what is sometimes referred to as Big Data. Acquiring andprocessing the data is only the first step, in order to learn some-thing new from the recordings of cellular anatomy of an entireembryo, cells and other labeled biological entities have to be iden-tified and followed across time. The following article will deal withcomputer vision approaches to these problems.
4. Segmentation and tracking
Segmentation and tracking of labeled molecular componentsare the most common tasks in biological image analysis. Thesetasks have received a lot of attention in the computer visionliterature, however typically on natural images that differ from

6 To better understand the graph construction and the algorithmic approach to findthe min-cut we must refer to [101].
66 F. Jug et al. / Methods 68 (2014) 60–73
biological data significantly. In a nutshell, the faces of humans invideo sequences have identity which helps distinguish one personfrom another whereas labeled nuclei in microscopy images typi-cally lack such stable distinguishing characteristics. In this sectionwe discuss the general segmentation and tracking approaches andhow they can be adapted to the biological context.
Tracking and segmentation are intimately related problems.The goal is to segment objects from image data while keeping trackof the identity of those objects. This means to link all segments thatrepresent the same object in sequences of different images. Notethat this need not be tracking over time necessarily – it also appliesto other tasks like object registration across different views, or fol-lowing neuronal profiles across large 3D volumes.
Ideally one would like to solve both problems jointly, for exam-ple by obtaining the maximum a posteriori solution of a suitablegenerative model, roughly meaning that one finds the most prob-able interpretation given a model that is capable of explaining allpossible datasets. Such an approach would promise a low error ratebut is unfortunately computationally infeasible. Hence, simplifyingapproximations have to be made in order to achieve acceptableruntime. One such simplification, that is made almost universallyin the available literature, is to address segmentation and trackingas separate problems that are solved in sequence. Published track-ing systems use a wide variety of segmentation methods which canin many cases be replaced by each other without rendering thetracking machinery non-functional.
We review frequently used and important segmentation andtracking mechanisms. Due to the vast amounts of literature andideas in both fields we cannot include all existing approachesand would like to apologize in case your favorite segmentationor tracking method did not find its way into this document.
4.1. Segmentation
Image segmentation, or just segmentation, is the process offinding all the objects of interest in a given dataset. While, in somecases, it might be sufficient to simply return a list of coordinates atwhich those objects were found, other applications might require adetailed characterization of appearance and shape of those objects.Examples from Drosophila research include segmentation oflabeled nuclei, e.g. [88], segmentation of labeled cell boundariesin epithelia [91]), or segmentation of neuronal profiles in serial sec-tion EM datasets [92–94].
4.1.1. Detecting maximaCompact structures, such as cell nuclei, can simply be described
by the image coordinates of their centroids. For some applications,such as lineage tracing, this may be sufficient. Additional shapeinformation, though, can be handy for distinguishing objects indensely packed areas.
Spot detection methods often proceed by searching for areas ofcertain shape and size in the data. This is best achieved by convolv-ing the image with filter templates (kernels). Commonly used ker-nels are the Laplacian-of-Gaussian (LoG) or Difference-of-Gaussian(DoG). To detect blobs of variable size such filter approaches areoften combined with automatic scale detection mechanisms [95].In cases where nuclei are not labeled, but their outlines are still vis-ible as darker regions within the cytoplasm [96], the approach canbe turned around by detecting local minima in the images.
4.1.2. Watershed and component treesSeveral segmentation methods are based on thresholding, that
is, classifying the image voxels as either foreground (object) orbackground based on intensity. In the simplest case one singlethreshold is selected, either globally for the whole image or adap-tively for each voxel based on local image features [97]. All voxels
are set to either 1 (foreground) or 0 (background) based on theresult of comparing the voxel’s intensity to the threshold value.After that it is assumed that each connected foregroundcomponent corresponds to one segmented object. This assumptionis obviously rarely correct.
More sophisticated methods are based on the so called compo-nent tree of the image. A component tree is built by iterativelythresholding at increasing (or decreasing) threshold values. Well-known examples are the Watershed transform [98] and MaximallyStable Extremal Regions [99].
4.1.3. Graph-cuts and parametric max-flowA segmentation problem can be formulated as a graph connect-
ing each pixel to its direct neighbors as well as to terminal nodesrepresenting foreground and background. Preferences of each pixelfor being foreground or background, as well as certain smoothnessor shape constraints [100] can then be encoded in costs that areassociated with each edge individually. Given such a graph, asegmentation can be obtained by finding a graph-cut of minimalcost (min-cut), i.e. a set of edges of minimal summed cost that,when removed, separate the terminal nodes (foreground andbackground).6
An interactive extension to graph-cut based segmentation wassuggested by Boykov and Jolly [102]. They describe how a usercan influence the segmentation by fixing some pixels to be eitherforeground or background. The utility of this and similar approachstems from the fact that finding a min-cut can be solved very effi-ciently [101]. Graph cuts with a shape prior have been applied tothe segmentation of nuclei in the zebrafish embryo by Lou et al.[103].
In the previous section we discussed thresholding methods thatapply a sequence of thresholds instead of a single one. Similarly,instead of a single min-cut, a sequence of min-cuts can becomputed, varying a parameter of the cost function. Similar to acomponent tree this will yield multiple hypotheses for segmenta-tion. Kolmogorov et al. [104] showed that the set of all suchhypotheses can be efficiently computed.
4.1.4. Deformable modelsDeformable models are initialized with a segment contour, a
closed curve in 2D or surface in 3D, that is then iteratively modifiedin order to minimize an adequate cost function. This cost functioncontains internal and external terms. Internal terms refer tocontour-inherent costs such as length or bending energy whileexternal terms describe the dissimilarity cost between the contourand the underlying image – for example the distance between con-tour segments and edges in the image.
Deformable models can be classified as active contour methodsor level set methods. Active contour models (or snakes) [105] areparameterized by a set of control points, while level set methods[106] work by identifying the zero level set of an auxiliary functionnot using such discrete control points. Level set methods can there-fore naturally handle topology changes during the iterative evolu-tion of the contour, while the strong point of active contourapproaches lies in the natural way they can express biophysicallymotivated constraints [107].
Deformable models require an initial segment contour whichmight be obtained by one of the methods discussed above. In thecontext of tracking, the contour can be initialized with the segmen-tation obtained in the previous time-point, assuming that trackedobjects do not move too much between frames [108].

F. Jug et al. / Methods 68 (2014) 60–73 67
4.1.5. Statistical classification systemsWith a perfect classification system at hand, one that looks at
each pixel in a dataset and returns the correct object class of thatpixel, image segmentation would be solved. One of the main char-acteristics of statistical classification systems, in contrast to previ-ously introduced segmentation methods, is that they have to betrained on labeled data (already classified examples) before theycan be used to classify more data. The arguably best known statis-tical learning systems of this kind are neural networks [109], Sup-port-vector machines [110] and Random Forest Classifier [111]. Inthe interest of space we cannot discuss the principles upon whichthose systems work here. Instead we refer the interested reader tothe vast amounts of available literature.
In recent years, Random Forests [111,112] became very popular.Random forest classifier can be very efficiently trained andapplied to relatively large datasets. This makes them intrinsicallyinteresting for large biological datasets. Many existing tools, likethe Advanced Weka Segmentation plugin (http://fiji.sc/Advanced_Weka_Segmentation) in Fiji [58] or Ilastik [113], make extensiveuse of this technique.
We think it is useful and important to mention that pixelclassification systems can be combined with other segmentationmethods in various ways. Watershed or graph-cut based methods,just to name one example, can be applied on probability mapscreated by a statistical classifier.
It is crucial to bear in mind that choosing an adequate segmen-tation method is important, but that having adequate tools to visu-alize results and allow one to alter automated segmentation resultsis absolutely central in order to guarantee sound data upon whichone can start scientific reasoning (Fig. 3). In Section 5 we take acloser look at available tools.
4.2. Tracking
In this section we will first review the state of the art of trackingin biological data and then have a specific look at tracking in Dro-sophila research.
One particular group of tracking approaches are particle track-ing systems [114] which assume that all segments are point-likeparticles. One such particle is thereby characterized by its spatialposition alone – no other information is assumed to be availablefor tracking. This makes a lot of sense in applications where thevisual appearance of the objects to be tracked are too similar to dis-tinguish them on the basis of their voxel representation alone. Thissituation is typical in biology.
Fig. 3. Segmentation of nuclei in a Drosophila embryo. In large datasets automated segmsegmentation itself, visualization of the results and data curation are important, but unfoconvolving the 3D dataset with an DoG kernel of adequate size. Even if errors would be spdata curation feasible. (b) Shows how such a data curation interface might look. Here, svolume. Only a subset of identified segments is shown to prevent confusing the user. In
With segmentation taken care of in an initial step, the trackingphase must link segmented objects in pairs of images to each other.Special events that might occur, such as cell divisions, cell death, orcell disappearance/reappearance from the field of view, have to betaken care of as well.
We divide published tracking approaches into two broad clas-ses: (i) state space models, and (ii) assignment models. Below wediscuss advantages and disadvantages and provide examples forboth approaches.
4.2.1. State space models (SSMs)State space models have a long tradition in tracking, historically
dating back to the 1960s [115]. Approaches of this class processdata sequentially, for example time-point by time-point. Availableand relevant information that can be extracted from the data isthereby aggregated into ‘‘object states’’. These states are then usedto bias the segmentation and linking step during the next iteration.In other words, a state space model is any model that includes anobservation process and a state process.
The state process models the dynamics of the observed system.This can for example include physical models of cell motion ortemporal models of cell cycle events. The observation process, incontrast, models how a given state gives rise to certain measure-ments, e.g. segment positions in the image.
Early work addressed tracking of single or a hand-full of objects(such as ships or airplanes) from noisy sensor measurements(radar, sonar), predominantly by using Kalman and particle filters[116]. These approaches have been applied to biological data withsome success [117]. However, the characteristics of biologicalimage data make the problem considerably harder in most cases.Biological data often requires to track a large number of similarobjects that can and will at times be densely packed. As a conse-quence this leads to ambiguity in associating measurements totracked objects and in turn renders the object’s state unreliable.Sometimes this can be resolved by maintaining multiple associa-tion hypotheses over multiple time-points. An excellent article tak-ing this approach is [118] where they track thousands of targets ina multi-hypothesis Kalman filter based framework.
It has to be mentioned that, for example when tracking nuclei inDrosophila embryonic development, additional problems have tobe addressed. The number of tracked objects varies over time, celldivisions, disappearing and reappearing cells, and cell death eventshave to be explicitly modeled and detected. While state spaceapproaches can be extended to handle such events, these exten-sions are usually not very natural and do push this trackingapproach to its computational limits.
entation procedures are key to render developmental research feasible. Next to thertunately very time consuming. (a) Shows the results of a maximum detection afterotted in such an annotated image, tools to correct them must exist in order to renderegment hypotheses have been automatically identified in a component tree of thedividual segments could be moved, added or removed.

68 F. Jug et al. / Methods 68 (2014) 60–73
4.2.2. Assignment models (AMs)Assignment models formulate the problem of associating seg-
ments (linking segmented objects over time) across all time-pointsas a global optimization problem. In the literature this approach isalso known as tracking-by-assignment. In rough terms this meansthat one can step back a bit and look at all tracks at once in order tojudge the quality of the overall solution. This helps avoidingsolutions that look locally good but have consistency problems ina larger context.
Ambiguous segment associations, variable number of objects,and splitting and merging events can naturally be included intoassignment models [119]. Given the segmented data, a cost isgiven to each possible segment association. These costs can beunderstood as a measure of how uncertain one is about the cor-rectness of such association hypothesis. For example, a segmentedobject in one image could be associated to each of a number of seg-ments in the next image. Costs for each such possible assignmentcan then depend on spatial displacement, segment similarity, andmany more such characteristics. Alternatively, the same objectmight also divide or disappear, and again all possible such eventswould be enumerated and corresponding costs would be assigned.
To finally find the most likely tracking solution one needs tofind an assignment that (i) minimizes the total cost caused by allactivated (chosen) assignments, and (ii) is compliant to structuralconstraints that prevent choosing inconsistent associations [93].7
Different methods to find such a consistent assignment are known.Below we review 3 example systems.
Jaqaman et al. [120] approximate the global optimal solution byfirst establishing track segments between adjacent time-points,followed by gap closing, track splitting, and track merging in asecond step. Both steps are formulated as linear assignment prob-lems8 which can be solved efficiently.
A quite different approach was first suggested by Padfield et al.[121,122]. In their seminal work they show that segment assign-ment between two time-points, including splitting, merging, dis-appearing and reappearing of cells, can be modeled as a coupledminimum-cost flow problem and solved efficiently using the wellestablished optimization method of linear programming (LP).
A similar formulation to solve the global assignment problemwas recently suggested by Kausler et al. [119]. They propose toconsider more than just two time-points at once. While thisimproves accuracy by enriching the temporal ‘‘context’’ uponwhich assignments can be chosen, it also makes the computationalproblem considerably harder. Additional constraints must be intro-duced in the LP-formulation of the optimization problem at hand.This turns the problem into an integer linear program for whichone cannot guarantee polynomial runtime any longer. In the lightof large biological datasets this might therefore seem impractical,but they show examples of real datasets that can be solved suc-cessfully and sufficiently fast.
4.2.3. SSMs vs. AMsComparing the two types of tracking models introduced above
we see that the major difference is the way they search for theirrespective solution. Only state space models make use of sequen-tial, frame-by-frame processing. Such a greedy approach makes itdifficult to revise decisions that have been made earlier. In con-trast, this is not an issue in (global) assignment models, whichcan moreover also handle track splitting, merging, and other
7 Structural constrains are needed to rule out logically wrong solutions. A validsolution will, for example, never let a cell vanish and divide at the same time. Theminimal cost solution is then only chosen among all solutions that are logicallycorrect in the above sense.
8 Assignment problems are also known as maximum weight matching problems inthe mathematical field of combinatorics.
events more naturally. But, as we pointed out above, this doescome at a price – assignment models tend to be computationallyexpensive since a high-dimensional integral objective functionhas to be optimized.
The advantage of state space models is the natural incorpora-tion of prior knowledge in the form of dynamics models. Whiledynamics models can in principle also be incorporated in assign-ment models, they would introduce higher-order costs (higherorder factors) that can easily render the needed optimizationintractable.
4.2.4. Special segmentation or linking strategiesTo conclude our discussion about existing tracking approaches
we want to point the reader’s attention to some systems built forbiological data that do not separate segmentation and linking asstrictly as the before-mentioned models.
Initially we pointed out that joint segmentation and trackingapproaches promise low error rates at high or even infeasible com-putational cost. Any model that softens the boundary between seg-mentation and tracking must therefore be critically evaluated onthe basis of their improvement potential vs. their potential scala-bility issues.
Fred Hamprecht’s group recently proposed a tracking systemwith interacting segmentation and linking phases [123]. Alreadyin a previous study [119] they proposed a system capable of deal-ing with over-segmentations. They show how to define assignmentcosts in such a way that the linking phase can filter away segmentsthat do not corresponds to real objects. Fundamental for this towork is the observations that only correct segmentations are con-sistent across multiple time-points. Schiegg et al. [123] addedfunctionality to deal with under-segmentations as well. If, duringthe linking phase, multiple segmented objects are best assignedto only one segment, this segment can be subdivided, thereby fix-ing this apparent under-segmentation.
Funke et al. [93] include similar ideas by constructing a multi-tude of overlapping segmentation hypotheses that are, similar tothe work by Kausler et al. [119], filtered by the linking procedure.
Approaches that sequentially process time-points are naturallyinterleaving tracking and segmentation. The state of the previouslyprocessed time-point can be used to guide segmentation of thecurrent one. Tomer et al. [88] track in image volumes of Drosophilaembryogenesis using a Gaussian mixture model, where eachGaussian component models one ellipsoidal nucleus. At each timepoint, initialised by the estimated previous distribution of nuclei,the current image is segmented using the Expectation–Maximiza-tion algorithm to adapt the model to the image intensities.
State-space models can additionally employ their processmodel to predict how the system dynamics evolve. Li et al. [124],for example, use an interacting multiple models filter and non-parametric contour evolution to segment and track thousands ofobjects in 2D phase contrast time lapse data sets.
As we did above for automated segmentation approaches, wedo also need to point out in the context of tracking that havinguser-friendly, adaptive tools to visualize and modify automaticallyfound tracking solutions is at least as important as the automatedtracking itself. In Fig. 4 we illustrate how such software could looklike.
4.3. Segmentation and tracking in practical applications
The application of the above discussed methods to solve ques-tions in Drosophila research is in its infancy. Segmentation methodsfor blob-shaped objects, e.g. nuclei, range from relatively efficientapproaches [35,87,125], to more complex optimization basedapproaches, like [88,103,126].

Fig. 4. Tracking of nuclei in a Drosophila embryo. A similar argument as in Fig. 3 is also true for automated tracking. Errors in automated tracking solutions must usually beidentified and eliminated before the data can be used to draw sound scientific conclusions. Without the right set of visualization and data-curation tools even the manualpost-processing of automatically generated tracks is barely feasible for large developmental datasets. (a, b, d) Shows three views on the same time-point in a dataset oflabeled nuclei in a Drosophila embryo. The voxel-data is overlaid by the segmentation of the current time-point (colored circles) and the tracked nucleus positions of adjacenttime-points (colored lines). (c) Shows lineage tree gradually built from the data in (a, b and d).
F. Jug et al. / Methods 68 (2014) 60–73 69
Examples for applications that require the segmentation of cellboundaries in membrane labeled data can for example be found in[91,127].
Of the approaches discussed above [88,119,123] were appliedto tracking nuclei in Drosophila. Kausler et al. [119] evaluate theirmethod on a sequence of 40 time points of the syncytial blasto-derm, acquired with a light-sheet microscope. Tomer et al. [88]track over 3000 cells for 140 time points of early embryogenesis,reconstructing 70% of correct lineages through two cycles of mito-tic waves.
The broader application of state-of-the-art segmentation andtracking methods is certainly just around the corner. The high-speed, live imaging technology is slowly finding its way into thelaboratories of Drosophila researchers. Systems biology approacheswill require quantitative extraction of complex phenotypic datafrom multi-dimensional images such as cell lineages from SPIMrecordings. We cannot stress enough that this can be achieved onlyif the segmentation and tracking approaches are made available asefficient, extensible software. In the next article we will discuss thesoftware packages that will make it happen.
5. Open source software tools
5.1. What tools should one use?
The first decision researchers are facing when deciding whattools to use for image analysis is whether to invest in commercialpackages or take advantage of the open source platforms. A num-ber of recent opinion pieces have argued convincingly for the useof open source tools in computational biology [128,129] includingthe bioimage informatics research area [130]. The unifying argu-ment in favor of open source tools is the necessity to understandwhat the methods applied to the data do and to be able to extend
them, particularly for frontier, non-routine research questions.Drosophila research field is relatively small, compared to researchareas dealing with directly medical applications, and it is unlikelythat tools specifically tailored for Drosophila will be developedcommercially.
Fortunately, there is a plethora of open source bioimage infor-matics tools that collectively cover the range of applications oncommercial platforms [131] and in specialized areas, such as Dro-sophila research, often offer much more tailored solutions. Compar-isons of the performance of the open source platforms have beenattempted [132,133], however the results favoring the platformsdeveloped by the authors themselves cast doubt on their objectiv-ity. In Table 1 we list the platforms ordered by the number of cita-tions of their primary papers. Performance comparisons of variousopen source tools are meaningless, since each one of them is strongin certain areas and outperformed in others. We believe that biol-ogists should explore all possibilities and use the platform that isbest adapted to their particular task. Efforts to provide online vot-ing forums for solutions available through multiple open sourceprojects are underway (http://bigwww.epfl.ch/obia-tags/index.html) and will greatly facilitate decision making.
The bioimage informatics open source platforms are driven byacademics who are typically solving their own biological researchquestions. Therefore, one way to discriminate among the platformsis to concentrate on the ones that are primarily driven by theresearchers from the Drosophila field (Table 1). We briefly highlightthe particular strengths of Fiji [58], Vaa3D [53] and Ilastik [113]which does not mean that tools useful for Drosophila researcherscannot be found on platforms like Icy [132], BioimageXD [133],Endrov [134], EBImage [135] or CellProfiler [136].
Fiji (Fiji Is Just ImageJ) is a widely adopted distribution ofImageJ, which is the undisputed leader in open source bioimageinformatics platforms [58,137]. Fiji focuses on image analysis inlife sciences (while ImageJ’s reach is even broader) and many of

Table 1Open source platforms with some relation to Drosophila research. We list the platforms in descending order of number of citations of its primary paper. Clearly, the olderplatforms had more time to accumulate citations. In the second column we list the programming language in which the software is written and the advanced image processinglibraries it is using.
Open source platform Programming language/libraries Year of establishment Primary paper Citations acc. to Google Scholar
ImageJ Java/Bioformats 1987 (as NIH Image) Schneider (2012) [137] 1344Cell Profiler Python/Bioformats, ImgLib2 2006 Carpenter et al. (2006) [136] 824Fiji Java/ImgLib2, Bioformats 2006 Schindelin et al. (2012) [58] 475KNIME Java/ImgLib2 2006 Berthold et al. (2009) [144] 223Vaa3D C++ Peng et al. (2011) [53] 155Ilastik Python, C++/Vigra, VTK 2010 Sommer et al. (2011) [113] 60Icy Java/Bioformats, VTK Since 2011 open source de Chaumont et al. (2011) [150] 52EBI Image R/ImageMagick �2008 Pau et al. (2010) [135] 46BioimageXD Python, C++/ITK, VTK 2012 Kankaanpaa (2012) 34Endrov Java/Bioformats, ImgLib2 2007 Henriksson (2013) [134] 1ImageJ2 Java/ImgLib2, Bioformats �2014 n.a. n.a.
70 F. Jug et al. / Methods 68 (2014) 60–73
the applications developed specifically for Fiji have been optimizedon Drosophila data. As described above, Fiji has popular solutionsfor image stitching [57], EM data registration and analysis[66,69,70], SPIM image processing [76,84], segmentation (http://fiji.sc/Trainable_Segmentation) and tracking (http://fiji.sc/TrackMate, [138]. There are many other specialized and generalpurpose image analysis tools in Fiji and the list is ever growing(http://fiji.sc). Fiji offers convenient means for software dissemina-tion through the update system and it can be extended in variousways with simple macros, scripting languages and full blown plu-gins building on the tradition of ImageJ. The long term future of theproject is intimately tied to ImageJ2 (http://developer.imagej.net/about), which is redesigning the core of ImageJ according to mod-ern software engineering principles.
Vaa3D (previously known as V3D) is the product of Drosophilaoriented research projects at the Janelia Farm Research Campus.Vaa3D focuses particularly on applications in neurobiology andprovides tools for registration of Drosophila brains [51] as well as3D digital atlas of Caenorhabditis elegans adaptable to Drosophilaapplications [139]. Vaa3D excels in 3D image visualization andenables biologist to interact with very large 3D imagery in aninteractive manner [140]. The user interaction is facilitated bystate-of-the-art automated 3D segmentation algorithms optimizedparticularly for neuron tracing [141]. Similarly to ImageJ Vaa3D isextensible through a plugin architecture.
Ilastik is a tool focusing on user friendly image classification andsegmentation [113]. It uses simple labels provided by users toextract a range of local image features and use them to train a ran-dom forest classifier that is then able to distinguish the labeledstructures in images automatically. It is comparable to trainablesegmentation plugin in Fiji, but additionally it is able to extract fea-tures in up to four-dimensional pixel neighborhoods. Ilastik is atool that emphasizes ease-of-use and although it does not havegeneral functionality comparable to Fiji, Icy or Vaa3D, it does itsmachine learning task very well and its feature spectrum can beextended through plugins. It has been applied to segmentation ofEM datasets and soon there will be a version available for segmen-tation and tracking in the context of massive Drosophila SPIM data-sets (Fred Hamprecht, personal communication). Ilastik isdeveloped by a computer vision group and the algorithms behindits friendly interface are state-of-the-art and reflect the results ofongoing computer science research.
Besides centrally organized open source platforms manyresearchers in the Drosophila research community develop stand-alone applications solving very specific image analysis problems.Besides the lack of reusability, interoperability and duplication ofefforts [142], it has been shown that such programs have oftenlimited lifetime [143]. We therefore advocate strongly forincorporating new solutions into established open source plat-forms [130].
5.2. Can biologists play along?
Another benefit of using established open source platforms fordeveloping new image analysis solution for Drosophila research isthat they typically provide infrastructure for development ofcustomized tools that are accessible even to amateur programmers.In an online poll that was slightly biased towards the Drosophilaresearch community, it has become apparent that manybiologists possess serious programming skills [130]. Since biolo-gists understand the problem they are trying to solve best, whengiven the right level of access to the algorithmic libraries on opensource platform, they can often solve the problems most efficiently.
Open source platforms give by definition full access to its sourcecode and so everything is possible. On the other hand these arecomplex software engineering projects that require serious com-puter science expertise to master. Fortunately, many platforms,and in particular Fiji and Icy, offer possibility to access the internalfunctionality written in Java through higher level scripting lan-guages. Fiji inherits from ImageJ the ultimately simplified macrolanguage that enables recording of manually executed commands.In combination with rudimentary macro language constructs thiscan be used to establish relatively sophisticated pipelines withtruly minimal knowledge of programming. On a higher level, Fijioffers four scripting languages and command line interpreters(Python, Javascript, Beanshell and Clojure) that together with adedicated scripting editor plugin can be used to write complex pro-grams and distribute them through the Updater [58]. An exampleof such program is the CoverMaker script that builds image mosa-ics from a database of Drosophila embryo in situ images. It was pro-grammed by a biologist (Pavel Tomancak personal communicationhttp://fiji.sc/Cover_Maker).
Another way to make building image analysis tools accessible tobiologists is visual programming. Icy provides a powerful editor forassembling pipelines of image processing tools using drag-and-drop of modular software components. Similar functionality isavailable through the image processing toolbox of KNIME [144]which can string together software components from differentimage analysis platforms and additionally provides access toextensive library of data analysis tools.
5.3. Will the computer science community help us?
No matter how skilled some biologists are in programming,some problems in bioimage informatics such as tracking of all cellsin noisy, anisotropic and temporally sparse microscopy recordingsor reconstructing the connectome from imperfect EM datasets ofthe entire nervous system, will require the input from professionalcomputer scientists. Although these problems are challenging andfascinating to biologists, they are attractive to computer scienceprofessionals only if they advance their own research agenda. That
F. Jug et al. / Methods 68 (2014) 60–73 71
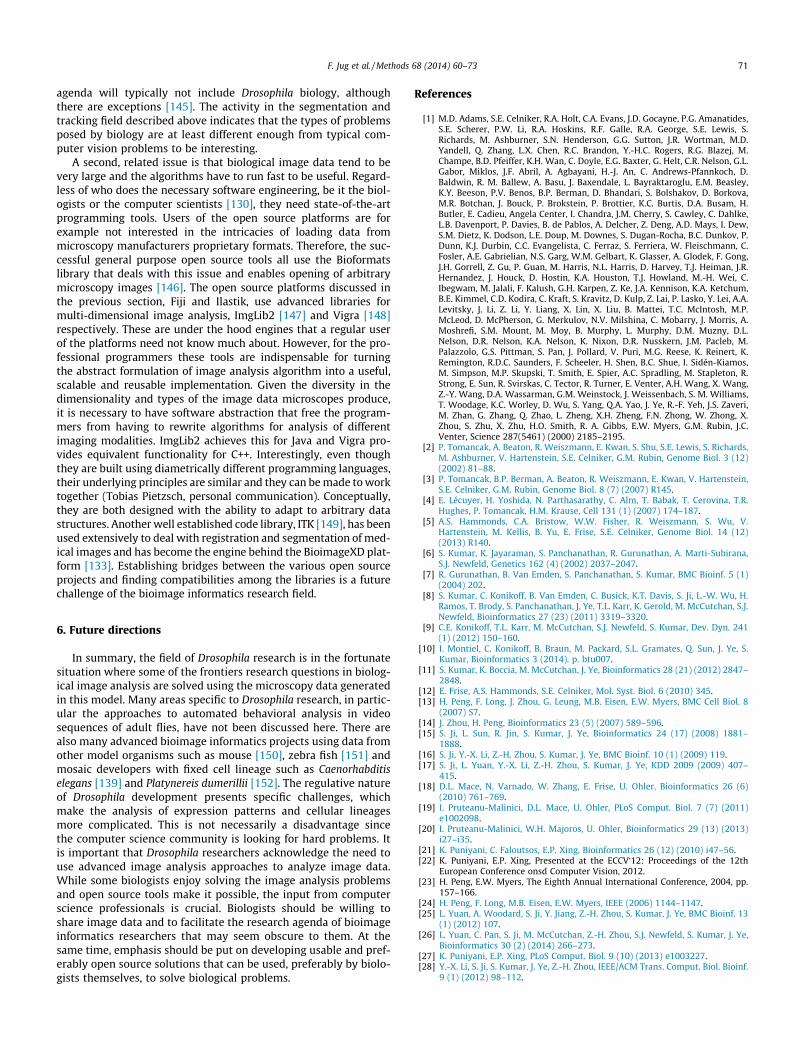
agenda will typically not include Drosophila biology, althoughthere are exceptions [145]. The activity in the segmentation andtracking field described above indicates that the types of problemsposed by biology are at least different enough from typical com-puter vision problems to be interesting.
A second, related issue is that biological image data tend to bevery large and the algorithms have to run fast to be useful. Regard-less of who does the necessary software engineering, be it the biol-ogists or the computer scientists [130], they need state-of-the-artprogramming tools. Users of the open source platforms are forexample not interested in the intricacies of loading data frommicroscopy manufacturers proprietary formats. Therefore, the suc-cessful general purpose open source tools all use the Bioformatslibrary that deals with this issue and enables opening of arbitrarymicroscopy images [146]. The open source platforms discussed inthe previous section, Fiji and Ilastik, use advanced libraries formulti-dimensional image analysis, ImgLib2 [147] and Vigra [148]respectively. These are under the hood engines that a regular userof the platforms need not know much about. However, for the pro-fessional programmers these tools are indispensable for turningthe abstract formulation of image analysis algorithm into a useful,scalable and reusable implementation. Given the diversity in thedimensionality and types of the image data microscopes produce,it is necessary to have software abstraction that free the program-mers from having to rewrite algorithms for analysis of differentimaging modalities. ImgLib2 achieves this for Java and Vigra pro-vides equivalent functionality for C++. Interestingly, even thoughthey are built using diametrically different programming languages,their underlying principles are similar and they can be made to worktogether (Tobias Pietzsch, personal communication). Conceptually,they are both designed with the ability to adapt to arbitrary datastructures. Another well established code library, ITK [149], has beenused extensively to deal with registration and segmentation of med-ical images and has become the engine behind the BioimageXD plat-form [133]. Establishing bridges between the various open sourceprojects and finding compatibilities among the libraries is a futurechallenge of the bioimage informatics research field.
6. Future directions
In summary, the field of Drosophila research is in the fortunatesituation where some of the frontiers research questions in biolog-ical image analysis are solved using the microscopy data generatedin this model. Many areas specific to Drosophila research, in partic-ular the approaches to automated behavioral analysis in videosequences of adult flies, have not been discussed here. There arealso many advanced bioimage informatics projects using data fromother model organisms such as mouse [150], zebra fish [151] andmosaic developers with fixed cell lineage such as Caenorhabditiselegans [139] and Platynereis dumerillii [152]. The regulative natureof Drosophila development presents specific challenges, whichmake the analysis of expression patterns and cellular lineagesmore complicated. This is not necessarily a disadvantage sincethe computer science community is looking for hard problems. Itis important that Drosophila researchers acknowledge the need touse advanced image analysis approaches to analyze image data.While some biologists enjoy solving the image analysis problemsand open source tools make it possible, the input from computerscience professionals is crucial. Biologists should be willing toshare image data and to facilitate the research agenda of bioimageinformatics researchers that may seem obscure to them. At thesame time, emphasis should be put on developing usable and pref-erably open source solutions that can be used, preferably by biolo-gists themselves, to solve biological problems.
References
[1] M.D. Adams, S.E. Celniker, R.A. Holt, C.A. Evans, J.D. Gocayne, P.G. Amanatides,S.E. Scherer, P.W. Li, R.A. Hoskins, R.F. Galle, R.A. George, S.E. Lewis, S.Richards, M. Ashburner, S.N. Henderson, G.G. Sutton, J.R. Wortman, M.D.Yandell, Q. Zhang, L.X. Chen, R.C. Brandon, Y.-H.C. Rogers, R.G. Blazej, M.Champe, B.D. Pfeiffer, K.H. Wan, C. Doyle, E.G. Baxter, G. Helt, C.R. Nelson, G.L.Gabor, Miklos, J.F. Abril, A. Agbayani, H.-J. An, C. Andrews-Pfannkoch, D.Baldwin, R. M. Ballew, A. Basu, J. Baxendale, L. Bayraktaroglu, E.M. Beasley,K.Y. Beeson, P.V. Benos, B.P. Berman, D. Bhandari, S. Bolshakov, D. Borkova,M.R. Botchan, J. Bouck, P. Brokstein, P. Brottier, K.C. Burtis, D.A. Busam, H.Butler, E. Cadieu, Angela Center, I. Chandra, J.M. Cherry, S. Cawley, C. Dahlke,L.B. Davenport, P. Davies, B. de Pablos, A. Delcher, Z. Deng, A.D. Mays, I. Dew,S.M. Dietz, K. Dodson, L.E. Doup, M. Downes, S. Dugan-Rocha, B.C. Dunkov, P.Dunn, K.J. Durbin, C.C. Evangelista, C. Ferraz, S. Ferriera, W. Fleischmann, C.Fosler, A.E. Gabrielian, N.S. Garg, W.M. Gelbart, K. Glasser, A. Glodek, F. Gong,J.H. Gorrell, Z. Gu, P. Guan, M. Harris, N.L. Harris, D. Harvey, T.J. Heiman, J.R.Hernandez, J. Houck, D. Hostin, K.A. Houston, T.J. Howland, M.-H. Wei, C.Ibegwam, M. Jalali, F. Kalush, G.H. Karpen, Z. Ke, J.A. Kennison, K.A. Ketchum,B.E. Kimmel, C.D. Kodira, C. Kraft, S. Kravitz, D. Kulp, Z. Lai, P. Lasko, Y. Lei, A.A.Levitsky, J. Li, Z. Li, Y. Liang, X. Lin, X. Liu, B. Mattei, T.C. McIntosh, M.P.McLeod, D. McPherson, G. Merkulov, N.V. Milshina, C. Mobarry, J. Morris, A.Moshrefi, S.M. Mount, M. Moy, B. Murphy, L. Murphy, D.M. Muzny, D.L.Nelson, D.R. Nelson, K.A. Nelson, K. Nixon, D.R. Nusskern, J.M. Pacleb, M.Palazzolo, G.S. Pittman, S. Pan, J. Pollard, V. Puri, M.G. Reese, K. Reinert, K.Remington, R.D.C. Saunders, F. Scheeler, H. Shen, B.C. Shue, I. Sidén-Kiamos,M. Simpson, M.P. Skupski, T. Smith, E. Spier, A.C. Spradling, M. Stapleton, R.Strong, E. Sun, R. Svirskas, C. Tector, R. Turner, E. Venter, A.H. Wang, X. Wang,Z.-Y. Wang, D.A. Wassarman, G.M. Weinstock, J. Weissenbach, S. M. Williams,T. Woodage, K.C. Worley, D. Wu, S. Yang, Q.A. Yao, J. Ye, R.-F. Yeh, J.S. Zaveri,M. Zhan, G. Zhang, Q. Zhao, L. Zheng, X.H. Zheng, F.N. Zhong, W. Zhong, X.Zhou, S. Zhu, X. Zhu, H.O. Smith, R. A. Gibbs, E.W. Myers, G.M. Rubin, J.C.Venter, Science 287(5461) (2000) 2185–2195.
[2] P. Tomancak, A. Beaton, R. Weiszmann, E. Kwan, S. Shu, S.E. Lewis, S. Richards,M. Ashburner, V. Hartenstein, S.E. Celniker, G.M. Rubin, Genome Biol. 3 (12)(2002) 81–88.
[3] P. Tomancak, B.P. Berman, A. Beaton, R. Weiszmann, E. Kwan, V. Hartenstein,S.E. Celniker, G.M. Rubin, Genome Biol. 8 (7) (2007) R145.
[4] E. Lécuyer, H. Yoshida, N. Parthasarathy, C. Alm, T. Babak, T. Cerovina, T.R.Hughes, P. Tomancak, H.M. Krause, Cell 131 (1) (2007) 174–187.
[5] A.S. Hammonds, C.A. Bristow, W.W. Fisher, R. Weiszmann, S. Wu, V.Hartenstein, M. Kellis, B. Yu, E. Frise, S.E. Celniker, Genome Biol. 14 (12)(2013) R140.
[6] S. Kumar, K. Jayaraman, S. Panchanathan, R. Gurunathan, A. Marti-Subirana,S.J. Newfeld, Genetics 162 (4) (2002) 2037–2047.
[7] R. Gurunathan, B. Van Emden, S. Panchanathan, S. Kumar, BMC Bioinf. 5 (1)(2004) 202.
[8] S. Kumar, C. Konikoff, B. Van Emden, C. Busick, K.T. Davis, S. Ji, L.-W. Wu, H.Ramos, T. Brody, S. Panchanathan, J. Ye, T.L. Karr, K. Gerold, M. McCutchan, S.J.Newfeld, Bioinformatics 27 (23) (2011) 3319–3320.
[9] C.E. Konikoff, T.L. Karr, M. McCutchan, S.J. Newfeld, S. Kumar, Dev. Dyn. 241(1) (2012) 150–160.
[10] I. Montiel, C. Konikoff, B. Braun, M. Packard, S.L. Gramates, Q. Sun, J. Ye, S.Kumar, Bioinformatics 3 (2014). p. btu007.
[11] S. Kumar, K. Boccia, M. McCutchan, J. Ye, Bioinformatics 28 (21) (2012) 2847–2848.
[12] E. Frise, A.S. Hammonds, S.E. Celniker, Mol. Syst. Biol. 6 (2010) 345.[13] H. Peng, F. Long, J. Zhou, G. Leung, M.B. Eisen, E.W. Myers, BMC Cell Biol. 8
(2007) S7.[14] J. Zhou, H. Peng, Bioinformatics 23 (5) (2007) 589–596.[15] S. Ji, L. Sun, R. Jin, S. Kumar, J. Ye, Bioinformatics 24 (17) (2008) 1881–
1888.[16] S. Ji, Y.-X. Li, Z.-H. Zhou, S. Kumar, J. Ye, BMC Bioinf. 10 (1) (2009) 119.[17] S. Ji, L. Yuan, Y.-X. Li, Z.-H. Zhou, S. Kumar, J. Ye, KDD 2009 (2009) 407–
415.[18] D.L. Mace, N. Varnado, W. Zhang, E. Frise, U. Ohler, Bioinformatics 26 (6)
(2010) 761–769.[19] I. Pruteanu-Malinici, D.L. Mace, U. Ohler, PLoS Comput. Biol. 7 (7) (2011)
e1002098.[20] I. Pruteanu-Malinici, W.H. Majoros, U. Ohler, Bioinformatics 29 (13) (2013)
i27–i35.[21] K. Puniyani, C. Faloutsos, E.P. Xing, Bioinformatics 26 (12) (2010) i47–56.[22] K. Puniyani, E.P. Xing, Presented at the ECCV‘12: Proceedings of the 12th
European Conference onsd Computer Vision, 2012.[23] H. Peng, E.W. Myers, The Eighth Annual International Conference, 2004, pp.
157–166.[24] H. Peng, F. Long, M.B. Eisen, E.W. Myers, IEEE (2006) 1144–1147.[25] L. Yuan, A. Woodard, S. Ji, Y. Jiang, Z.-H. Zhou, S. Kumar, J. Ye, BMC Bioinf. 13
(1) (2012) 107.[26] L. Yuan, C. Pan, S. Ji, M. McCutchan, Z.-H. Zhou, S.J. Newfeld, S. Kumar, J. Ye,
Bioinformatics 30 (2) (2014) 266–273.[27] K. Puniyani, E.P. Xing, PLoS Comput. Biol. 9 (10) (2013) e1003227.[28] Y.-X. Li, S. Ji, S. Kumar, J. Ye, Z.-H. Zhou, IEEE/ACM Trans. Comput. Biol. Bioinf.
9 (1) (2012) 98–112.

72 F. Jug et al. / Methods 68 (2014) 60–73
[29] T. Kazmar, E.Z. Kvon, A. Stark, C.H. Lampert, Presented at the InternationalConference on Computer Vision, 2013.
[30] W. Zhang, D. Feng, R. Li, A. Chernikov, N. Chrisochoides, C. Osgood, C. Konikoff,S. Newfeld, S. Kumar, S. Ji, BMC Bioinf. 14 (1) (2013) 372.
[31] A. Crombach, D. Cicin-Sain, K.R. Wotton, J. Jaeger, PLoS ONE 7 (9) (2012)e46658.
[32] P. Ahammad, C.L. Harmon, A. Hammonds, S.S. Sastry, G.M. Rubin, Presented atthe CVPR ‘‘05: Proceedings of the 2005 IEEE Computer Society Conference onComputer Vision and Pattern Recognition, CVPR’’05, 2005.
[33] C.L. Harmon, P. Ahammad, A. Hammonds, R. Weiszmann, S.E. Celniker, S.S.Sastry, G.M. Rubin, Presented at the RECOMB‘07: Proceedings of the 11thAnnual International Conference on Research in Computational MolecularBiology, 2007.
[34] C.L. Luengo Hendriks, S.V. Keranen, C.C. Fowlkes, L. Simirenko, G.H. Weber,A.H. DePace, C. Henriquez, D.W. Kaszuba, B. Hamann, M.B. Eisen, J. Malik, D.Sudar, M.D. Biggin, D.W. Knowles, Genome Biol. 7 (12) (2006) R123.
[35] C.C. Fowlkes, C.L.L. Hendriks, S.V.E. Keränen, G.H. Weber, O. Rübel, M.-Y.Huang, S. Chatoor, A.H. DePace, L. Simirenko, C. Henriquez, A. Beaton, R.Weiszmann, S. Celniker, B. Hamann, D.W. Knowles, M.D. Biggin, M.B. Eisen,J. Malik, Cell 133 (2) (2008) 364–374.
[36] S.V.E. Keränen, C.C. Fowlkes, C.L. Luengo Hendriks, D. Sudar, D.W. Knowles, J.Malik, M.D. Biggin, Genome Biol. 7 (12) (2006) R124.
[37] C.C. Fowlkes, K.B. Eckenrode, M.D. Bragdon, M. Meyer, Z. Wunderlich, L.Simirenko, C.L. Luengo Hendriks, S.V.E. Keränen, C. Henriquez, D.W. Knowles,M.D. Biggin, M.B. Eisen, A.H. DePace, PLoS Genet. 7 (10) (2011) e1002346.
[38] Z. Wunderlich, M.D. Bragdon, K.B. Eckenrode, T. Lydiard-Martin, S. Pearl-Waserman, A.H. DePace, Mol. Syst. Biol. 8 (2012) 604.
[39] G.R. Ilsley, J. Fisher, R. Apweiler, A.H. DePace, N.M. Luscombe, eLife 2 (2013)e00522.
[40] H. Janssens, S. Hou, J. Jaeger, A.-R. Kim, E. Myasnikova, D. Sharp, J. Reinitz, Nat.Genet. 38 (10) (2006) 1159–1165.
[41] Manu, S. Surkova, A.V. Spirov, V.V. Gursky, H. Janssens, A.-R. Kim, O.Radulescu, C.E. Vanario-Alonso, D.H. Sharp, M. Samsonova, J. Reinitz, PLoSComput. Biol. 5 (3) (2009) e1000303.
[42] Manu, S. Surkova, A.V. Spirov, V.V. Gursky, H. Janssens, A.-R. Kim, O.Radulescu, C.E. Vanario-Alonso, D.H. Sharp, M. Samsonova, J. Reinitz, PLoSBiol. 7 (3) (2009) 1000049.
[43] K.N. Kozlov, E. Myasnikova, A.A. Samsonova, S. Surkova, J. Reinitz, M.Samsonova, Fly 3 (2) (2009) 151–156.
[44] A. Pisarev, E. Poustelnikova, M. Samsonova, J. Reinitz, Nucleic Acids Res. 37(Database issue) (2009) D560–D566.
[45] S. Surkova, E. Myasnikova, H. Janssens, K.N. Kozlov, A.A. Samsonova, J. Reinitz,M. Samsonova, Fly 2 (2) (2008) 58–66.
[46] A. Crombach, K.R. Wotton, D. Cicin-Sain, M. Ashyraliyev, J. Jaeger, PLoSComput. Biol. 8 (7) (2012) e1002589.
[47] B.D. Pfeiffer, A. Jenett, A.S. Hammonds, T.-T.B. Ngo, S. Misra, C. Murphy, A.Scully, J.W. Carlson, K.H. Wan, T.R. Laverty, C. Mungall, R. Svirskas, J.T.Kadonaga, C.Q. Doe, M.B. Eisen, S.E. Celniker, G.M. Rubin, PNAS 105 (28)(2008) 9715–9720.
[48] A. Jenett, G.M. Rubin, T.-T.B. Ngo, D. Shepherd, C. Murphy, H. Dionne, B.D.Pfeiffer, A. Cavallaro, D. Hall, J. Jeter, N. Iyer, D. Fetter, J.H. Hausenfluck, H.Peng, E.T. Trautman, R.R. Svirskas, E.W. Myers, Z.R. Iwinski, Y. Aso, G.M.DePasquale, A. Enos, P. Hulamm, S.C.B. Lam, H.-H. Li, T.R. Laverty, F. Long, L.Qu, S.D. Murphy, K. Rokicki, T. Safford, K. Shaw, J.H. Simpson, A. Sowell, S. Tae,Y. Yu, C.T. Zugates, Cell Rep. 2 (4) (2012) 991–1001.
[49] L. Manning, E.S. Heckscher, M.D. Purice, J. Roberts, A.L. Bennett, J.R. Kroll, J.L.Pollard, M.E. Strader, J.R. Lupton, A.V. Dyukareva, P.N. Doan, D.M. Bauer, A.N.Wilbur, S. Tanner, J.J. Kelly, S.-L. Lai, K.D. Tran, M. Kohwi, T.R. Laverty, J.C.Pearson, S.T. Crews, G.M. Rubin, C.Q. Doe, Cell Rep. 2 (4) (2012) 1002–1013.
[50] A. Jory, C. Estella, M.W. Giorgianni, M. Slattery, T.R. Laverty, G.M. Rubin, R.S.Mann, Cell Rep. 2 (4) (2012) 1014–1024.
[51] H. Peng, P. Chung, F. Long, L. Qu, A. Jenett, A.M. Seeds, E.W. Myers, J.H.Simpson, Nat. Methods 8 (6) (2011) 493–500.
[52] A. Jenett, J.E. Schindelin, M. Heisenberg, BMC Bioinf. 7 (2006) 544.[53] H. Peng, Z. Ruan, F. Long, J.H. Simpson, E.W. Myers, Nat. Biotechnol. 28 (4)
(2010) 348–353.[54] Z.L. Husz, N. Burton, B. Hill, N. Milyaev, R.A. Baldock, BMC Bioinf. 13 (2012)
122.[55] N. Milyaev, D. Osumi-Sutherland, S. Reeve, N. Burton, R.A. Baldock, J.D.
Armstrong, Bioinformatics 28 (3) (2012) 411–415.[56] A. Cardona, S. Saalfeld, I. Arganda, W. Pereanu, J. Schindelin, V. Hartenstein, J.
Neurosci. 30 (22) (2010) 7538–7553.[57] S. Preibisch, S. Saalfeld, P. Tomancak, Bioinformatics 25 (11) (2009) 1463–
1465.[58] J. Schindelin, I. Arganda-Carreras, E. Frise, V. Kaynig, M. Longair, T. Pietzsch, S.
Preibisch, C. Rueden, S. Saalfeld, B. Schmid, J.-Y. Tinevez, D.J. White, V.Hartenstein, K. Eliceiri, P. Tomancak, A. Cardona, Nat. Methods 9 (7) (2012)676–682.
[59] M. Emmenlauer, O. Ronneberger, A. Ponti, P. Schwarb, A. Griffa, A. Filippi, R.Nitschke, W. Driever, H. Burkhardt, J. Microsc. 233 (1) (2009) 42–60.
[60] A. Bria, G. Iannello, BMC Bioinf. 13 (1) (2012) 316.[61] C.J. Peddie, L.M. Collinson, Micron 61 (2014) 9–19.[62] A. Cardona, S. Saalfeld, P. Tomancak, V. Hartenstein, Cold Spring Harb. Symp.
Quant. Biol. 74 (2009) 235–248.[63] S.-Y. Takemura, A. Bharioke, Z. Lu, A. Nern, S. Vitaladevuni, P.K. Rivlin, W.T.
Katz, D.J. Olbris, S.M. Plaza, P. Winston, T. Zhao, J.A. Horne, R.D. Fetter, S.
Takemura, K. Blazek, L.-A. Chang, O. Ogundeyi, M.A. Saunders, V. Shapiro, C.Sigmund, G.M. Rubin, L.K. Scheffer, I.A. Meinertzhagen, D.B. Chklovskii,Nature 500 (7461) (2013) 175–181.
[64] D.B. Chklovskii, S. Vitaladevuni, L.K. Scheffer, Curr. Opin. Neurobiol. 20 (5)(2010) 667–675.
[65] D.G. Lowe, Int. J. Comput. Vision 60 (2) (2004) 91–110.[66] S. Saalfeld, A. Cardona, V. Hartenstein, P. Tomancak, Bioinformatics 26 (12)
(2010) i57–i63.[67] M.A. Fischler, R.C. Bolles, Commun. ACM 24 (6) (1981) 381–395.[68] A. Cardona, S. Saalfeld, S. Preibisch, B. Schmid, A. Cheng, J. Pulokas, P.
Tomancak, V. Hartenstein, PLoS Biol. 8 (10) (2010).[69] S. Saalfeld, R. Fetter, A. Cardona, P. Tomancak, Nat. Methods 9 (7) (2012) 717–
720.[70] A. Cardona, S. Saalfeld, J. Schindelin, I. Arganda-Carreras, S. Preibisch, M.
Longair, P. Tomancak, V. Hartenstein, R.J. Douglas, PLoS ONE 7 (6) (2012)e38011.
[71] K.D. Micheva, S.J. Smith, Neuron 55 (1) (2007) 25–36.[72] P.J. Shaw, D.A. Agard, Y. Hiraoka, J.W. Sedat, Biophys. J. 55 (1) (1989) 101–110.[73] J. Huisken, J. Swoger, F. Del Bene, J. Wittbrodt, E.H.K. Stelzer, Science 305
(5686) (2004) 1007–1009.[74] P.J. Keller, Science (New York, NY) 340 (6137) (2013) 1234168.[75] R.K. Ejsmont, M. Sarov, S. Winkler, K.A. Lipinski, P. Tomancak, Nat. Methods 6
(6) (2009) 435–437.[76] S. Preibisch, S. Saalfeld, J. Schindelin, P. Tomancak, Nat. Methods 7 (6) (2010)
418–419.[77] J. Swoger, P. Verveer, K. Greger, J. Huisken, E.H.K. Stelzer, Opt. Express, OE 15
(13) (2007) 8029–8042.[78] P.J. Keller, A.D. Schmidt, J. Wittbrodt, E.H.K. Stelzer, Science 322 (5904) (2008)
1065–1069.[79] J.L. Rubio-Guivernau, V. Gurchenkov, M.A. Luengo-Oroz, L. Duloquin, P.
Bourgine, A. Santos, N. Peyrieras, M.J. Ledesma-Carbayo, Bioinformatics 28 (2)(2012) 238–245.
[80] P.J. Verveer, J. Swoger, F. Pampaloni, K. Greger, M. Marcello, E.H.K. Stelzer,Nat. Methods 4 (4) (2007) 311–313.
[81] L.A. Shepp, Y. Vardi, IEEE Trans. Med. Imaging 1 (2) (1982) 113–122.[82] U. Krzic, Multiple-view microscopy with light-sheet based fluorescence
microscope, PhD Thesis (submitted to the Combined facultiesfor the naturalSciences and for Mathematicsof the Ruperto-Carola University of Heidelberg,Germany), 2009.
[83] M. Temerinac-Ott, O. Ronneberger, P. Ochs, W. Driever, T. Brox, H. Burkhardt,IEEE Trans. Image Process. 21 (4) (2012) 1863–1873.
[84] S. Preibisch, F. Amat, E. Stamataki, M. Sarov, R.H. Singer, E. Myers, P.Tomancak, Efficient Bayesian-based Multi-View Deconvolution, arXiv.org, vol.q-bio.QM, 2013.
[85] P.G. Pitrone, J. Schindelin, L. Stuyvenberg, S. Preibisch, M. Weber, K.W. Eliceiri,J. Huisken, P. Tomancak, Nat. Methods 10 (7) (2013) 598–599.
[86] E.J. Gualda, T. Vale, P. Almada, J.A. Feijó, G.G. Martins, N. Moreno, Nat.Methods 10 (7) (2013) 599–600.
[87] U. Krzic, S. Gunther, T.E. Saunders, S.J. Streichan, L. Hufnagel, Nat. Methods 9(7) (2012) 730–733.
[88] R. Tomer, K. Khairy, F. Amat, P.J. Keller, Nat. Methods 9 (7) (2012) 755–763.
[89] L. Gao, L. Shao, C.D. Higgins, J.S. Poulton, M. Peifer, M.W. Davidson, X. Wu, B.Goldstein, E. Betzig, Cell 151 (6) (2012) 1370–1385.
[90] S. Saalfeld, A. Cardona, V. Hartenstein, P. Tomancak, Bioinformatics 25 (15)(2009) 1984–1986.
[91] F. Bosveld, I. Bonnet, B. Guirao, S. Tlili, Z. Wang, A. Petitalot, R. Marchand, P.-L.Bardet, P. Marcq, F. Graner, Y. Bellaïche, Science 336 (6082) (2012) 724–727.
[92] A. Cardona, Neuroinformatics 11 (1) (2013) 31–33.[93] J. Funke, B. Anders, F.A. Hamprecht, A. Cardona, M. Cook, Presented at the
CVPR ,12: Proceedings of the 2012 IEEE Conference on Computer Vision andPattern Recognition, CVPR, 2012.
[94] V.Kaynig, T.Fuchs, and J.M.Buhmann, Presented at the Computer Vision andPattern Recognition (CVPR), 2010 IEEE Conference on, IEEE, pp. 2902–2909,http://dx.doi.org/10.1109/CVPR.2010.5540029.
[95] T. Lindeberg, Int. J. Comput. Vision 30 (2) (1998) 79–116.[96] W. Supatto, D. Débarre, B. Moulia, E. Brouzés, J.-L. Martin, E. Farge, E.
Beaurepaire, Proc. Natl. Acad. Sci. USA 102 (4) (2005) 1047–1052.[97] B.L. Sankur, J. Electron. Imaging 13 (1) (2004) 146–168.[98] J. Roerdink, A. Meijster, Fundam. Inf. 41 (1–2) (2000).[99] Chum Matas, Pajdla Urban, Image Vision Comput. 22 (10) (2004). 7–7.
[100] V. Kolmogorov, Y. Boykov, Tenth IEEE International Conference on ComputerVision (ICCV’05), vol. l, 2005, pp. 564–571.
[101] Y. Boykov, V. Kolmogorov, IEEE Trans. Pattern Anal. Mach. Intell. 26 (9) (2004)1124–1137.
[102] Y.Y. Boykov, M.P. Jolly, IEEE 1 (2001) 105–112.[103] X. Lou, U. Koethe, J. Wittbrodt, F.A. Hamprecht, Presented at the CVPR 12:
Proceedings of the 2012 IEEE Conference on Computer Vision and PatternRecognition, CVPR, 2012.
[104] V. Kolmogorov, Y. Boykov, C. Rother, Presented at the InternationalConference on Computer Vision (ICCV), 2007, pp. 1–8.
[105] M. Kass, A. Witkin, D. Terzopoulos, Int. J. Comput. Vision 1 (4) (1988) 321–331.
[106] S. Osher, J.A. Sethian, J. Comput. Phys. 79 (1988) 12–49.[107] J. Pecreaux, C. Zimmer, J.C. Olivo-Marin, IEEE International Conference on
Presented at the Image Processing, 2006, pp. 1949–1952.

F. Jug et al. / Methods 68 (2014) 60–73 73
[108] A. Dufour, V. Shinin, S. Tajbakhsh, N. Guillén-Aghion, J.-C. Olivo-Marin, C.Zimmer, IEEE Trans. Image Process. 14 (9) (2005) 1396–1410.
[109] Y. LeCun, L.D. Jackel, L. Bottou, C. Cortes, J.S. Denker, H. Drucker, I. Guyon, U.A.Muller, E. Sackinger, P. Simard, V. Vapnik, Neural Networks: Stat. Mech.Perspect. (1995) 261–276.
[110] C. Cortes, V. Vapnik, Mach. Learn. 20 (3) (1995) 273–297.[111] L. Breiman, Mach. Learn. 45 (1) (2001) 5–32.[112] A. Bosch, A. Zisserman, and X. Munoz, Image classification using random
forests and ferns, in: IEEE 11th International Conference on Computer Vision,2007. ICCV 2007.
[113] C. Sommer, C. Straehle, U. Kothe, F.A. Hamprecht, IEEE InternationalSymposium on Biomedical Imaging: From Nano to Macro, 2011, pp. 230–233.
[114] N. Chenouard, I. Smal, F. de Chaumont, M. Maška, I.F. Sbalzarini, Y. Gong, J.Cardinale, C. Carthel, S. Coraluppi, M. Winter, A.R. Cohen, W.J. Godinez, K.Rohr, Y. Kalaidzidis, L. Liang, J. Duncan, H. Shen, Y. Xu, K.E.G. Magnusson, J.Jaldén, H.M. Blau, P. Paul-Gilloteaux, P. Roudot, C. Kervrann, F. Waharte, J.-Y.Tinevez, S.L. Shorte, J. Willemse, K. Celler, G.P. van Wezel, H.-W. Dan, Y.-S.Tsai, C.O. de Solórzano, J.-C. Olivo-Marin, E. Meijering, Nat. Methods 11 (3)(2014) 281–289.
[115] R.E. Kalman, J. Basic Eng. 82 (1) (1960) 35–45.[116] Y. Bar-Shalom, ‘‘Multitarget-multisensor tracking: Advanced applications,
vol. 1, Norwood, MA, Artech House, 1990, p. 391.[117] W.J. Godinez, M. Lampe, S. Wörz, B. Müller, R. Eils, K. Rohr, Med. Image Anal.
13 (2) (2009) 325–342.[118] N. Chenouard, I. Bloch, J.-C. Olivo-Marin, IEEE Trans. Pattern Anal. Mach.
Intell. 35 (11) (2013) 2736–3750.[119] B.X. Kausler, M. Schiegg, B. Andres, M. Lindner, U. Koethe, H. Leitte, J.
Wittbrodt, L. Hufnagel, F.A. Hamprecht, ECCV 2012, vol. 7574, no. 11, 2012,pp. 144–157.
[120] K. Jaqaman, D. Loerke, M. Mettlen, H. Kuwata, S. Grinstein, S.L. Schmid, G.Danuser, Nat. Methods 5 (8) (2008) 695–702.
[121] D. Padfield, J. Rittscher, B. Roysam, Presented at the IPMI ’09: Proceedings ofthe 21st International Conference on Information Processing in MedicalImaging, 2009.
[122] D. Padfield, J. Rittscher, B. Roysam, Med. Image Anal. 15 (4) (2011) 650–668.[123] M. Schiegg, P. Hanslovsky, B.X. Kausler, nd L. Hufnagel, ICCV, 2013.[124] K. Li, E.D. Miller, M. Chen, T. Kanade, L.E. Weiss, P.G. Campbell, Med. Image
Anal. 12 (5) (2008) 546–566.[125] P.J. Keller, A.D. Schmidt, A. Santella, K. Khairy, Z. Bao, J. Wittbrodt, E.H.K.
Stelzer, Nat. Methods 7 (8) (2010) 637–642.[126] G. Xiong, X. Zhou, L. Ji, P. Bradley, IEEE International Conference on Image
Processing, ICIP (2006) 73–76, http://dx.doi.org/10.1109/ICIP.2006.312365.[127] B. Aigouy, R. Farhadifar, D.B. Staple, A. Sagner, J.-C. Röper, F. Jülicher, S. Eaton,
Cell 142 (5) (2010) 773–786.[128] D.C. Ince, L. Hatton, J. Graham-Cumming, Nature 482 (7386) (2012) 485–488.[129] A. Morin, J. Urban, P.D. Adams, I. Foster, A. Sali, D. Baker, P. Sliz, Science (New
York, NY) 336 (6078) (2012) 159–160.[130] A. Cardona, P. Tomancak, Nat. Methods 9 (7) (2012) 661–665.
[131] K.W. Eliceiri, M.R. Berthold, I.G. Goldberg, L. Ibáñez, B.S. Manjunath, M.E.Martone, R.F. Murphy, H. Peng, A.L. Plant, B. Roysam, N. Stuurman, N.Stuurmann, J.R. Swedlow, P. Tomancak, A.E. Carpenter, Nat. Methods 9 (7)(2012) 697–710.
[132] F. de Chaumont, S. Dallongeville, J.C. Olivo-Marin, IEEE InternationalSymposium on Biomedical Imaging: From Nano to Macro, 2011, pp. 234–237.
[133] P. Kankaanpää, L. Paavolainen, S. Tiitta, M. Karjalainen, J. Päivärinne, J.Nieminen, V. Marjomäki, J. Heino, D.J. White, Nat. Methods 9 (7) (2012) 683–689.
[134] J. Henriksson, J. Hench, Y.G. Tong, A. Johansson, D. Johansson, T.R. Bürglin,Nat. Methods 10 (6) (2013) 454–456.
[135] G. Pau, F. Fuchs, O. Sklyar, M. Boutros, W. Huber, Bioinformatics 26 (7) (2010)979–981.
[136] A.E. Carpenter, T.R. Jones, M.R. Lamprecht, C. Clarke, I.H. Kang, O. Friman, D.A.Guertin, J.H. Chang, R.A. Lindquist, J. Moffat, P. Golland, D.M. Sabatini,Genome Biol. 7 (10) (2006) R100.
[137] C.A. Schneider, W.S. Rasband, K.W. Eliceiri, Nat. Methods 9 (7) (2012) 671–675.
[138] A. Shivanandan, A. Radenovic, I.F. Sbalzarini, BMC Bioinf. 14 (1) (2013) 349.[139] F. Long, H. Peng, X. Liu, S.K. Kim, E.W. Myers, Nat. Methods 6 (9) (2009) 667–
672.[140] H. Peng, A. Bria, Z. Zhou, G. Iannello, F. Long, Nat. Protoc. 9 (1) (2014) 193–
208.[141] H. Peng, F. Long, G. Myers, Bioinformatics 27 (13) (2011) i239–i247.[142] A.E. Carpenter, L. Kamentsky, K.W. Eliceiri, Nat. Methods 9 (7) (2012) 666–
670.[143] J. Hennessey, S. Ge, BMC Bioinf. 14 (14) (2013) S5.[144] M.R. Berthold, N. Cebron, F. Dill, T.R. Gabriel, T. Kötter, T. Meinl, P. Ohl, K.
Thiel, B. Wiswedel, ACM SIGKDD Explorations Newsletter 11 (1) (2009) 26–31.
[145] G. Myers, Nat. Methods 9 (7) (2012) 659–660.[146] M. Linkert, C.T. Rueden, C. Allan, J.-M. Burel, W. Moore, A. Patterson, B.
Loranger, J. Moore, C. Neves, D. Macdonald, A. Tarkowska, C. Sticco, E. Hill, M.Rossner, K.W. Eliceiri, J.R. Swedlow, J. Cell Biol. 189 (5) (2010) 777–782.
[147] T. Pietzsch, S. Preibisch, P. Tomancak, S. Saalfeld, Bioinformatics 28 (22)(2012) 3009–3011.
[148] U. Köthe, C++ Rep. Mag. 12 (1) (2000) 24–30.[149] T.S. Yoo, M.J. Ackerman, W.E. Lorensen, Stud. Health Technol. Inf. 85 (2002)
586–592.[150] F. de Chaumont, R.D.-S. Coura, P. Serreau, A. Cressant, J. Chabout, S. Granon, J.-
C. Olivo-Marin, Nat. Methods 9 (4) (2012) 410–417.[151] O. Ronneberger, K. Liu, M. Rath, D. Rueb, T. Mueller, H. Skibbe, B. Drayer, T.
Schmidt, A. Filippi, R. Nitschke, T. Brox, H. Burkhardt, W. Driever, Nat.Methods 9 (7) (2012) 735–742.
[152] R. Tomer, A.S. Denes, K. Tessmar-Raible, D. Arendt, Cell 142 (5) (2010) 800–809.
[153] K. Ito, J. Urban, G.M. Technau, Roux’s Arch. Dev. Biol. 204 (5) (1995) 284–307.