infections caused by bacteria, viruses, fungi, and parasites
Upload
khangminh22Category
view
2download
0
Influenza A viruses dual and multiple infections
with other respiratory viruses and risk of
hospitalization and mortality
A thesis submitted to The University of Manchester
for the degree of Doctor of Philosophy in Medicine
in the Faculty of Medical and Human Sciences
2014
Edward Anthony Chilongo GOKA
School of Medicine
1
Table of contents
List of tables ................................................................................................................................................ 7
List of figures ............................................................................................................................................. 11
List of appendices ..................................................................................................................................... 14
List of Abbreviations ................................................................................................................................. 15
Abstract ..................................................................................................................................................... 20
Declaration ................................................................................................................................................ 21
Copyright statement ................................................................................................................................. 22
Acknowledgements .................................................................................................................................. 23
Dedication ................................................................................................................................................. 24
Rationale for submitting the thesis in alternative format ........................................................................ 25
Outline of the thesis ................................................................................................................................. 26
Part I: Introduction ................................................................................................................................... 28
1.1. Introduction .............................................................................................................................. 29
1.1.1. Epidemiology and significance of influenza and other respiratory viruses ...................... 29
1.1.2. Factors associated with severity of respiratory virus infections ...................................... 29
1.1.3. Hypothesis ........................................................................................................................ 34
1.1.4. Objectives ......................................................................................................................... 35
1.1.5. Research questions and study aims .................................................................................. 35
1.1.6. Significance of the study ................................................................................................... 35
1.1.7. Methodology..................................................................................................................... 37
1.1.7.1. Study design and setting ................................................................................................... 37
1.1.7.2. Analysis of electronic data ................................................................................................ 37
1.1.7.3. Variables and information extracted from the MMPL database ...................................... 38
1.1.7.4. Inclusion and exclusion criteria ........................................................................................ 38
1.1.7.5. Respiratory viruses detection assays ................................................................................ 38
1.1.7.6. Testing for coronaviruses and human bocavirus .............................................................. 40
1.1.7.7. Primers, templates and probes for hCoV, hBoV ............................................................... 41
1.1.7.8. Determination of analytical sensitivity and reproducibility of RT-PCR protocols ............ 41
1.1.7.9. PCR for identification of coronaviruses and bocavirus in samples ................................... 42
1.1.7.10. Strategies in systematic reviews ....................................................................................... 42
1.1.7.11. Statistical analysis ............................................................................................................. 43
1.1.7.12. Ethical considerations ....................................................................................................... 45
Part II: The nature of respiratory virus infections..................................................................................... 46
2.1. The nature of respiratory virus disease Part A: Clinical characteristics of respiratory virus
infections, vaccines and treatments ..................................................................................................... 47
2.1.1. Reproductive number and mode of transmission ............................................................ 47
2.1.2. Signs and symptoms ......................................................................................................... 47
2
2.1.3. Available vaccines and research on vaccines for other respiratory viruses ..................... 48
2.1.4. Available treatments and research on treatments for other respiratory viruses ............ 49
2.2. The nature of respiratory virus disease Part B: Incidence of viral respiratory infections ....... 51
2.2.1. Incidence of respiratory virus infections globally ............................................................. 51
2.2.1.1. Incidence as reported by community based studies ........................................................ 51
2.2.1.2. Incidence as reported by hospital based studies .............................................................. 52
2.2.1.3. Prevalence of different respiratory virus infections ......................................................... 53
2.2.2. Rates of severe disease and incidence of hospitalization and mortality associated with
respiratory virus infections ............................................................................................................... 58
2.2.2.1. The rates of severe respiratory disease ............................................................................ 58
2.2.2.2. The incidence of hospitalization and mortality ................................................................ 58
2.2.2.3. The burden of hospitalization and mortality .................................................................... 59
2.2.2.4. Waves and relative virulence of influenza virus pandemics and epidemics .................... 59
2.2.3. Risk pyramid for respiratory virus infections .................................................................... 61
2.2.4. Seasonality of viral respiratory infections ........................................................................ 67
2.2.5. Social-economic factors and incidence of viral respiratory infections ............................. 70
2.3. The nature of respiratory virus disease Part C: The incidence of acute respiratory virus
infections and influenza A viruses associated hospitalizations in North West England, 2007 – 2012 . 74
2.3.1. Abstract ..................................................................................................................................... 75
2.3.2. Introduction .............................................................................................................................. 76
2.3.3. Methodology ............................................................................................................................ 77
2.3.3.1. Setting, data source and laboratory methods .................................................................. 77
2.3.3.2. Calculation of incidence and other statistical analyses .................................................... 77
2.3.3.3. Ethical and research and development approval ............................................................. 78
2.3.4. Results ....................................................................................................................................... 78
2.3.4.1. Profile of patients with ARIs and the source population .................................................. 78
2.3.4.2. Incidence of hospitalizations associated with ARI ............................................................ 80
2.3.4.3. Age-specific average annual incidence of hospitalization associated with the pandemic
and seasonal influenza A viruses .......................................................................................................... 83
2.3.5. Discussion and conclusion ........................................................................................................ 85
2.3.6. Supplementary material ........................................................................................................... 88
2.4. The nature of respiratory virus disease Part D: Virology of respiratory virus infections ......... 89
2.4.1. Virology of influenza viruses ..................................................................................................... 90
2.4.1.1. Host range of influenza viruses ......................................................................................... 91
2.4.2. Virology of respiratory syncytial virus (RSV), human metapneumovirus (hMPV) and human
parainfluenza virus (hPIV) ..................................................................................................................... 93
2.4.3. Virology of coronaviruses (CoV) ............................................................................................... 95
2.4.3.1. Host range of coronaviruses ............................................................................................. 96
2.4.4. Virology of the rhinoviruses ...................................................................................................... 99
3
2.4.5. Virology of adenovirus and human bocavirus (AdV and hBoV) .............................................. 100
2.5. The nature of respiratory virus infections Part E: Genetic mutations associated with
pathogenicity of pandemic influenza A(H1N1)pdm09 virus: A review .............................................. 103
2.5.1. Abstract ........................................................................................................................... 104
2.5.2. Introduction .................................................................................................................... 105
2.5.2.1. The virulence genes of influenza A viruses ..................................................................... 105
2.5.2.2. The HA genes’ virulence related functional sites ........................................................... 105
2.5.2.3. The PB2 genes’ virulence related functional sites .......................................................... 106
2.5.2.4. The NS1 genes’ virulence related functional sites .......................................................... 107
2.5.2.5. Rationale for conducting the review .............................................................................. 107
2.5.2.6. Aims and objectives of the review .................................................................................. 108
2.5.3. Methodology................................................................................................................... 109
2.5.3.1. Protocol for the review ................................................................................................... 109
2.5.3.2. Search strategy ............................................................................................................... 109
2.5.3.3. Study assessment tool and study selection criteria........................................................ 110
2.5.3.4. Assessment of bias in the studies ................................................................................... 110
2.5.3.5. Data extraction and statistical analysis........................................................................... 111
2.5.4. Results ............................................................................................................................. 111
2.5.4.1. Characteristics of the included studies ........................................................................... 111
2.5.4.2. Possible sources of bias in the included studies ............................................................. 112
2.5.4.3. Association between mutations in influenza A(H1N1)pdm09 and severe disease ........ 116
2.5.4.3.1. HA-D222G mutation and severity ................................................................................... 116
2.5.4.3.2. Mutation HA-D222E and D222N and disease outcome.................................................. 116
2.5.4.4. Association between PB2-E627K mutation and severe disease ..................................... 120
2.5.4.5. NS1-T123V and other mutations and disease severity ................................................... 121
2.5.5. Discussion and conclusion .............................................................................................. 123
2.5.6. Supplementary material ................................................................................................. 127
2.5.6.1. The cause of influenza pandemics .................................................................................. 136
Part III: Review of available literature on patterns of co-infections and association between co-
infections and disease severity ............................................................................................................... 139
3.1. Co-infections; patterns and severity Part A: The patterns of co-infection between influenza A
and other respiratory viruses and its effect on viral load and interferon production: A systematic
review and meta-analysis ................................................................................................................... 139
3.1.1. Abstract ........................................................................................................................... 140
3.1.2. Introduction .................................................................................................................... 142
3.1.2.1. Rationale for conducting this review .............................................................................. 143
3.1.2.2. Aims and objectives of the systematic review and meta-analysis ................................. 143
3.1.3. Methodology................................................................................................................... 144
3.1.3.1. Review protocol .............................................................................................................. 144
4
3.1.3.2. Search strategy ............................................................................................................... 144
3.1.3.3. Assessment of study quality and selection process ....................................................... 145
3.1.3.4. Exclusion and inclusion criteria ....................................................................................... 145
3.1.3.5. Assessment of bias .......................................................................................................... 146
3.1.3.6. Data extraction and statistical analysis........................................................................... 146
3.1.4. Results ............................................................................................................................. 147
3.1.4.1. Characteristics of the included studies ........................................................................... 147
3.1.4.2. Co-infection patterns between influenza A and other respiratory viruses .................... 150
3.1.4.3. Association between co-infection with viral load and interferon production ............... 150
3.1.5. Discussion and conclusion .............................................................................................. 156
3.1.6. Supplementary material ................................................................................................. 159
3.2. Co-infections patterns and severity Part B: Single and multiple respiratory virus infections
and severity of respiratory disease: A systematic review and meta-analysis .................................... 162
3.2.1. Abstract ................................................................................................................................... 163
3.2.2. Introduction ............................................................................................................................ 164
3.2.2.1. Rationale for conducting the review .............................................................................. 164
3.2.2.2. Objectives and aims of the review and meta-analysis ................................................... 165
3.2.3. Methodology .......................................................................................................................... 165
3.2.3.1. Review protocol .............................................................................................................. 165
3.2.3.2. Literature search ............................................................................................................. 166
3.2.3.3. Study quality assessment and selection criteria ............................................................. 167
3.2.3.4. Assessment of bias .......................................................................................................... 167
3.2.3.5. Data extraction from the studies .................................................................................... 169
3.2.3.6. Statistical analysis ........................................................................................................... 169
3.2.4. Results ..................................................................................................................................... 170
3.2.4.1. Characteristics of the studies included in this review .................................................... 170
3.2.4.2. Factors associated with positivity and co-infection rates............................................... 170
3.2.4.3. Assessment of bias in the studies ................................................................................... 173
3.2.4.3.1. Study design, year of study and viral genetics ................................................................ 173
3.2.4.3.2. Publication bias ............................................................................................................... 173
3.2.4.4. Co-infection and risk of hospitalization to a general ward ............................................. 174
3.2.4.5. Co-infection and risk of admission to intensive care unit (ICU) ..................................... 176
3.2.4.6. Co-infection and risk of bronchiolitis .............................................................................. 178
3.2.4.7. Co-infection and risk of pneumonia ............................................................................... 178
3.2.4.8. Influenza A virus single and mixed infections and disease severity ............................... 181
3.2.5. Discussion and conclusion ...................................................................................................... 183
3.2.6. Supplementary material ......................................................................................................... 187
Part IV: Co-infections and risk of hospitalization and mortality in NW England 2007 – 2012 ............... 192
5
4.1. Co-infections and risk of hospitalization and mortality Part A: Single, dual and multiple
respiratory virus infections and risk of hospitalization and mortality ................................................ 192
4.1.1. Abstract ........................................................................................................................... 194
4.1.2. Introduction .................................................................................................................... 195
4.1.3. Methodology................................................................................................................... 196
4.1.3.1. Study design and setting ................................................................................................. 196
4.1.3.2. Virus identification, inclusion and exclusion criteria ...................................................... 196
4.1.3.3. Statistical analysis ........................................................................................................... 196
4.1.3.4. Ethical and research and development approval ........................................................... 197
4.1.4. Results ............................................................................................................................. 197
4.1.4.1. Respiratory virus infections ............................................................................................ 197
4.1.4.2. Demographic and other factors associated with single or multiple infections .............. 198
4.1.4.3. Single and multiple infections and risk of hospitalization to a general ward, or admission
to an intensive care unit (ICU) and death ....................................................................................... 198
4.1.5. Discussion and Conclusion .............................................................................................. 200
4.1.6. Supplementary material ................................................................................................. 208
4.2. Co-infections and risk of hospitalization and mortality Part B: Influenza A viruses dual and
multiple infections with other respiratory viruses and risk of hospitalization and mortality ............ 213
4.2.1. Abstract ........................................................................................................................... 214
4.2.2. Introduction .................................................................................................................... 215
4.2.3. Methodology................................................................................................................... 215
4.2.3.1. Study Design and setting ................................................................................................ 215
4.2.3.2. Statistical analysis ........................................................................................................... 217
4.2.4. Results ............................................................................................................................. 217
4.2.4.1. Identification of influenza and respiratory viral infections Jan 2007 – June 2011 ......... 217
4.2.4.2. Characteristics of included and excluded patients ......................................................... 218
4.2.4.3. Respiratory viruses’ positivity rates and subjects demographics ................................... 218
4.2.4.4. Respiratory viral infections yield by type of sample ....................................................... 222
4.2.4.5. Seasonal distribution of respiratory viral infections ....................................................... 222
4.2.4.6. Flu A(H1N1)pdm09 and seasonal Flu A, pattern of co-infections and patients
demographics ................................................................................................................................. 222
4.2.4.7. Risk of hospitalization, admission to ICU and death associated with influenza
A(H1N1)pdm09 co-infections ......................................................................................................... 225
4.2.4.8. Risk of hospitalization, admission to ICU and death associated with seasonal influenza A
virus co-infection ............................................................................................................................ 226
4.2.5. Discussion and conclusion .............................................................................................. 228
4.2.6. Supplementary tables ........................................................................................................... 231
4.3. Co-infections and risk of hospitalization and mortality Part C: Influenza A viruses co-infection
with human coronavirus and bocavirus and risk of hospitalization: Use of SYBR Green and TaqMan
RT-PCR assays for virus identification ................................................................................................. 233
6
4.3.1. Abstract ........................................................................................................................... 235
4.3.2. Introduction .................................................................................................................... 236
4.3.3. Methodology................................................................................................................... 237
4.3.3.1. Clinical samples and setting ............................................................................................ 237
4.3.3.2. Primers, templates and probes for hCoV, hBoV ............................................................. 237
4.3.3.3. Determination of analytical sensitivity and reproducibility of RT-PCR protocols .......... 239
4.3.3.4. PCR for identification of coronaviruses and bocavirus in samples ................................. 240
4.3.3.5. Confirmation of positive samples using MGB probes .................................................... 241
4.3.3.6. Polyacrylamide gel (PAGE) electrophoresis .................................................................... 241
4.3.3.7. Statistical analysis ........................................................................................................... 242
4.3.3.8. Ethics ............................................................................................................................... 242
4.3.4. Results ............................................................................................................................. 242
4.3.4.1. Efficiency, analytical sensitivity and reproducibility of the hCoV and hBoV PCRs.......... 242
4.3.4.2. Respiratory virus infections in samples that were positive for influenza A viruses ....... 244
4.3.4.3. Demographic characteristics, seasonality of infections and disease outcome .............. 245
4.3.5. Discussion and conclusion .............................................................................................. 246
4.3.6. Supplementary material ................................................................................................. 249
4.3.6.1. Optimization of primers and annealing temperature .................................................... 249
4.3.6.2. Standard curve experiments for hCoV using RNA from 229E and pEX-A vector ............ 250
4.3.6.3. RNA extraction from the live hCoV 229E virus ............................................................... 250
4.3.6.4. RNA Synthesis and associated protocols ........................................................................ 252
4.3.6.5. Purification of PCR Products ........................................................................................... 254
Part V: Discussion and conclusion .......................................................................................................... 265
5.1. Discussion and conclusion ...................................................................................................... 266
5.1.1. Age, gender and epidemiology of respiratory viruses .................................................... 266
5.1.2. Burden of co-infection and associated hospitalizations and mortality .......................... 267
5.1.2.1. Influenza A viruses co-infections and disease outcome ................................................. 267
5.1.2.2. Co-infections among respiratory viruses, in general, and severity ................................ 268
5.1.3. Possible interaction between RV and influenza A viruses .............................................. 270
5.1.4. Seasonality and epidemiology of respiratory viruses ..................................................... 271
5.1.5. Limitations of this study .................................................................................................. 272
5.1.5.1. Limitations in the systematic review and meta-analysis papers .................................... 273
5.1.5.2. Limitations inherent in the four primary studies ............................................................ 274
5.1.5.3. Possible selection and diagnostic bias in the primary studies ........................................ 277
5.1.6. Summary of limitations in the study design and recommendations for future designs 278
5.1.7. Summary of the major findings and recommendations ................................................. 279
List of appendices ................................................................................................................................... 327
7
List of tables
Page
Part I
Table 1.1 Study questions and list of studies designed to answer them 37
Table 1.2 Details of the type of information that was extracted from the HPA
respiratory database
41
Part II
Table 2.1 Incidence of respiratory virus infections: population based family
studies and hospital based studies
55
Table 2.2 Proportion of patients with viral respiratory infection that seek medical
attention or develop acute respiratory tract infection
63
Table 2.3 Hospitalization and mortality associated with respiratory virus
infections
64
Table 2.4 Mortality associated with different influenza virus strains 65
Table 2.5 Socio-economic status (SES) and risk of respiratory virus infection 73
Table 2.6 Demographics of patients and that of the NW England general
population
80
Table 2.7 Age-specific average annual incidence of ARI hospitalizations per
100,000 population in NW England 2007-2012
82
Table 2.8 Age-specific average annual incidence of hospitalization for pandemic
and seasonal influenza A viruses
85
Table 2.3S1 Number of ILI hospitalizations and age-specific mid-year population
figures for NW England 2007-2012
89
Table 2.9 The known coronaviruses 99
Table 2.10 Characteristics of the studies included in the analysis of the effect of
HA, NS1 and PB2 mutations on virulence of pandemic influenza
A(H1N1)pdm09 viruses
115
Table 2.5S1 Summary map of influenza A(H1N1)-HA gene antigenic sites by study 128
Table 2.5S2 Mutations on the H1-HA antigenic sites in representative strains 1918-
2009
130
Table 2.5S3 Assessment of bias in studies included on the review: Mutations in
FluApdm09 and severity
132
Table 2.5S4 Search history on EMBASE for review number 1: Mutations
associated with severity of pandemic influenza A(H1N1)pdm09
viruses: A systematic review and meta-analysis
136

8
List of tables continued
Page
Table 2.11 Evidence on the origin of the pandemic influenza A(H1N1)pdm09
virus genomes 1918-2009
139
Part III
Table 3.1 Inclusion criteria for studies in this systematic review and meta-
analysis of patterns of co-infections between influenza and other
respiratory viruses
148
Table 3.2 Characteristics of the studies included in the meta-analysis of the
patterns of co-infections with influenza A viruses
150
Table 3.3 Influenza A virus co-infection and viral load/interferon production 156
Table 3.4 Summary of pooled proportions of co-infections 157
Table 3.1S1 Assessment of bias in included studies – patterns of co-infections
review
160
Table 3.1S2 Search history on MEDLINE for review number 2: Co-infection
patterns between influenza and other respiratory viruses
162
Table 3.5 Inclusion criteria for studies in this systematic review and meta-
analysis on respiratory viruses single and multiple infection and
severity
165
Table 3.6 Characteristics of studies included in the review on association
between single and multiple infections and severity of respiratory
disease
173
Table 3.2S1 Number of co-infections for different respiratory viruses in included
studies
188
Table 3.2S2 Study quality assessment criteria – bias and other study characteristics 189
Table 3.2S3 Search history on Web of Science for review number 3: Single and
multiple respiratory virus infections and severity
190
Part IV
Table 4.1A Patterns of single and multiple infections between respiratory viruses 204
Table 4.1B The likelihood and burden of co-infection for specific viruses
Table 4.2 Demographic and other characteristics of single and multiple
respiratory virus infections in NW England, 2007 – 2012
205
Table 4.3 Risk of hospitalization to a general ward in single and multiple
respiratory virus infections
207
Table 4.4 Risk of admission to ICU/death in single and multiple respiratory
virus infections
208
9
List of tables continued
Page
Table 4.1S1A Respiratory viruses’ positivity rates by age group NW England, Jan 2007
– Jun 2012
209
Table 4.1S1B Age distribution of patients that were positive for any respiratory virus
infection NW England Jan 2007 – Jun 2012
210
Table 4.1S2A Number of respiratory virus infections identified in each season NW
England 2007 - 2012
211
Table 4.1S2B Proportion of each respiratory virus identified in each season NW
England 2007 - 2012
212
Table 4.1S2B Number of hospitalisations and deaths by virus type 213
Table 4.5 Demographic characteristics of patients positive for any respiratory virus 222
Table 4.6 Influenza A(H1N1)pdm09 co-infections, demographics and risk of
hospitalization, admission to ICU and death
227
Table 4.7 Other influenza A viruses co-infections, demographics and risk of
hospitalization, admission to ICU and death
228
Table 4.2S1 Odds ratios for influenza A(H1N1)pdm09 co-infections and risk of
hospitalization, and ICU or death
232
Table 4.2S2 Odds ratios for other influenza A viruses co-infections and risk of
hospitalization, admission to ICU/death
233
Table 4.8 Sequences of coronavirus used in the design of pan-coronavirus primers
(downloaded from GenBank on 18th December, 2011)
239
Table 4.9 Number of co-infection between influenza A viruses and human
coronavirus, human bocavirus and other respiratory viruses in NW
England between June 2011 and June 2012
245
Table 4.10 Demographic and other characteristics of patients that were positive for
influenza A virus infection in NW England between June 2011 and June
2012
246
Table 4.11 Disease severity in single influenza A virus infections vs. in co-infection
with hCoV, hBoV and in multiple infection with other respiratory viruses
247
Table 4.12 Details of primer optimization experiment set up 250
Table 4.3S1 Number of RNA copies calculation for hCoV – T7 synthesized PEX-A
vector
264
Table 4.3S2 Number of copies of hBoV PEX-A-COBOC plasmid in serial dilutions 265
10
List of tables continued
Part V Page
Table 5.1 Population Attributable Fraction Percent (PAF% or PAR%) associated
with influenza A virus co-infections
269
Table 5.2 Summary of research questions and findings 273
Table 5.3 Prevalence of confounders associated with respiratory virus infections
(UK)
276
Table 5.4 Number of samples tested for influenza A viruses that were also tested
for other respiratory viruses
278
11
List of figures
Page
Part I
Figure 1.1 Schematic of the thesis outline 28
Figure 1.2 Factors associated with severity of respiratory virus infections 32
Figure 1.3 Schematic of the project design 40
Figure 1.4 The search words used in systematic reviews of this study 45
Part II
Figure 2.1 Mean number of respiratory illnesses (and 95% confidence intervals)
experienced per year by age and sex, 1976 – 81 Tecumseh Michigan,
USA
56
Figure 2.2 Age-specific prevalence of cross-reactive antibodies from baseline
pandemic sera
56
Figure 2.3A Prevalence of respiratory virus infections as reported by different studies
globally
57
Figure 2.3B Age and patient group – specific prevalence of respiratory viruses as
reported by different studies globally
58
Figure 2.4 Age distribution of deaths associated with influenza A pandemics and
interpandemics in the United States, 1918 – 1995
66
Figure 2.5 Ratio of confirmed H1N1pdm deaths to hospitalizations for selected
countries
66
Figure 2.6 Risk pyramid for respiratory virus infections 67
Figure 2.7 RCGP weekly ILI rate per 100,000 in England and Wales from various
seasons since 1999/00
69
Figure 2.8 Total number of respiratory syncytial virus (RSV) cases identified
throughout several years of observation in six North American cities
70
Figure 2.9 Weekly incidence of ARI hospitalizations in NW England 2007-2012 83
Figure 2.10 Diagram of an influenza A virus virion 91
Figure 2.11 Ecology of influenza viruses and interspecies transmission 93
Figure 2.12 Genomic maps of Pneumovirinae 95
Figure 2.13 Genomic structure of parainfluenza viruses 96
Figure 2.14 Genomes of coronaviruses 98
Figure 2.15 The genome map of human rhinoviruses 100
Figure 2.16 Genome organisation of hAdV-C2, hAdV-F40, and hAdV-D53 102
Figure 2.17 Map of the hBoV genome 103
12
List of figures continued
Page
Figure 2.18 Number of studies identified, excluded and included in the review on
genetic mutations in pandemic influenzas A(H1N1)pdm09 and severity
111
Figure 2.19 Mutation HA-D222G and risk of severe disease and mortality 118
Figure 2.20 Mutation HA-D222E and risk of severe disease and mortality 119
Figure 2.21 Mutation HA-D222N and risk of severe disease and mortality 120
Figure 2.22 Mutation PB2-E627K and risk of severe disease and mortality 121
Figure 2.23 Mutation NS1-T123V and others and severe disease and mortality 123
Figure 2.5S1 Sites under differential selection between isolates from seasonal human
and the pandemic 2009 clusters
134
Figure 2.5S2 Updated evolutionary dynamics of positively selected sites on the HA1
domain of human influenza A/H3N2
135
Figure 2.5S3 Genetic Relationships among Human and Relevant Swine Influenza
Viruses, 1918–2009
138
Part III
Figure 3.1 Number of studies identified, excluded and included in the review on
patterns of co-infection between influenza and other respiratory viruses
149
Figure 3.2 Influenza A/RSV co-infection patterns by patient group and age 152
Figure 3.3 Influenza A/hBoV co-infection patterns by patient group and age 153
Figure 3.4 Influenza A/RV co-infection patterns by patient group and age 153
Figure 3.5 Influenza A/hCoV co-infection patterns by patient group and age 154
Figure 3.6 Influenza A/hMPV co-infection patterns by patient group and age 154
Figure 3.7 Influenza A/AdV co-infection patterns by patient group and age 155
Figure 3.8 Influenza A/hPIV co-infection patterns by patient group and age 156
Figure 3.9 Number of studies that were identified, included and excluded in the
review on respiratory virus co-infections and disease severity
172
Figure 3.10 Funnel plot of observed odds ratios to check publication bias 175
Figure 3.11 Respiratory virus co-infections and risk of admission to a general ward 176
Figure 3.12 Respiratory virus co-infections and risk of admission to an intensive
care unit
178
Figure 3.13 Respiratory virus co-infections and risk of bronchiolitis 180
13
List of figures continued
Page
Figure 3.14 Respiratory virus co-infections and risk of pneumonia 181
Figure 3.15 Influenza A viruses single and multiple infections and disease severity 183
Part IV
Figure 4.1 Schematic diagram of tests conducted, results, included and excluded
patients
220
Figure 4.2 Respiratory viruses positivity rate by age group 221
Figure 4.3 Seasonal distribution of respiratory viral infections Jan 2007 – Jun 2011 224
Figure 4.4 Co-infections patterns, influenza A viruses vs. other respiratory viruses 225
Figure 4.5 A section of the consensus sequence (showing the region identical in all
coronaviruses, derived from consensus sequences for 15 coronaviruses)
that was used to design pan-coronavirus primers
240
Figure 4.6 Polyacrylamide gel electrophoresis of hCoV PCR products 244
Figure 4.3S1 Ct values for the hCoV RT-PCR at different annealing temperatures 256
Figure 4.3S2 Strength of the fluorescence signal at different annealing temperatures
(hCoV RT-PCR)
257
Figure 4.3S3 Melting curves for hCoV 229E, pEX-A vector RNA and the negative
control wells at annealing temperature of 57oC
258
Figure 4.3S4 Amplification plots for the coronavirus RT-PCR standard curve
experiment
259
Figure 4.3S5 Standard curve for the hCoV RT-PCR 260
Figure 4.3S6 Amplification plot for probe confirmation experiment for a few hCoV
positive patient samples.
261
Figure 4.3S7 PEX-A vector map 262
Part V
Figure 5.1 Weekly activity of the pandemic Influenza A(H1N1)pdm09 and
rhinovirus in North West England between November 2008 and March
2010
272
Figure 5.2 Hospitalization to death ratio for patients 277
14
List of appendices
Page
Appendix I
List of papers included in this study
328
Appendix II
ICD-10 major diagnosis codes used to determine the number of
medically attended influenza like illnesses
329
Appendix III
Number of specific respiratory virus infections identified by
different studies globally
330
Appendix IV
Accession numbers for the coronavirus sequences that were
downloaded from the GenBank and used to design the pan-
coronavirus primers
332
Appendix V
The consensus sequence that was used to BLAST hCoV primer pair
334
15
List of Abbreviations
2-5OAS 2', 5' - oligoadenylate synthetase
AdV Adenovirus
AIDS acquired immunodeficiency syndrome
ALRI acute lower respiratory tract infection
ARI acute respiratory tract infection
BatCoV-61 bat coronavirus 61
BatCoV-HKU2 bat coronavirus HKU2
BatSARS-CoV bat SARS coronavirus
BCoV bovine coronavirus
CCoV canine coronavirus
CI confidence interval (95%)
COPD chronic obstructive pulmonary disease
CPSF cleavage and polyadenylation specificity factor
CTL cytotoxic lymphocytes
DALYS disability life adjusted years
DCoV duck coronavirus
DNA deoxyribonucleic acid
E envelope gene
ECoV equine coronavirus
eIF4G1 eukaryotic translation initiation factor 4 gamma 1
F fusion gene
Flu A influenza A viruses
Flu A(H1N1)pdm09 pandemic influenza A(H1N1)pdm09 virus
Flu B influenza B virus
G glycoprotein gene
GCoV goose coronavirus
GISRS Global influenza surveillance and response network
GP general practitioner
GW general ward
HA haemagglutinin gene
HA haemagglutinin
hBoV human bocavirus
16
List of abbreviations continued
hCoV human coronavirus
hCoV-229E human coronavirus 229E
hCoV-HKU1 human coronavirus HKU1
hCoV-NL63 human coronavirus NL63
hCoV-OC43 human coronavirus OC43
HE haemagglutinin esterase gene
HEF haemagglutinin-esterase-fusion
HES Hospital Episodes Statistics
HEV haemagglutinating encephalomyelitis virus
Hib Haemophilus influenzae type b
HIV human immunodeficiency virus
hMPV human metapneumovirus
HN haemagglutinin neuraminidase gene
HPA Health Protection Agency (now Public Health England)
hPIV1-3/4 human parainfluenzavirus types 1 to 3 or 1 to 4
HSWIC Health and Social Welfare Information Services
IBV infectious bronchitis virus
ICD-10 the International Conference for the Tenth Revision of the International
Classification of Diseases
ICD-9 the International Conference for the Ninth Revision of the International
Classification of Diseases
ICU intensive care unit
IFN-α interferon-alpha
IFN-β interferon-beta
IL-6/18 interleukin-6 or 18
ILI influenza like illness
INF-1 type 1 interferons
IRAS integrated research approval system
L large polymerase
LRTI(s) lower respiratory tract infections
M1/2 matrix protein 1 or 2
MAD-5 melanoma differentiation associated gene 5
MAVS mitochondrial antiviral signaling protein
17
List of abbreviations continued
MERS Middle East respiratory syndrome coronavirus
MGB dihydrocyclopyrroloindole tripeptide minor groove binder
MHC-I/II major histocompatibility complex class I or II
MHV mouse hepatitis virus
MMPL Manchester Microbiology Partnership Laboratory
MMU Medical Microbiology Unit
mRNA messenger ribonucleoprotein
N nucleocapsid
NA neuraminidase gene
NCBI National Centre for Biotechnology Information
NHS National Health Service
NP nucleoprotein
NS1 nonstructural protein 1
NW England North West England
ONS Office of National Statistics
OR odds ratio
ORF 1/2 open reading frame 1 or 2
P phosphoprotein
PA polymerase gene
PABP I/II polyadenine binding protein I or II
PAF(%) population attributable fraction (percent)
PB1/2 polymerase basic pritein 1 or 2
PCoV puffinosis coronavirus
PCoV pigeon coronavirus
PEDV porcine epidemic diarrhoea virus
PFP-1/2/3 purified fusion protein 1 or 2 or 3
PH power of hydrogen
PhCoV pheasant coronavirus
PI3k/Akt phosphatidylinositol 3-kinase
PKR protein kinase R
PRCoV porcine respiratory coronavirus
PRISMA Preferred Reporting Items for Systematic Reviews and Meta-Analyses
R&D research and development
18
List of abbreviations continued
R0 basic reproductive number
RCGP Royal College of Physicians General Practice
RCoV rat coronavirus
RD risk difference
RdRp RNA-dependent RNA polymerase
REC Research Ethics Committee
RIG-I retinoic acid-inducible gene 1
RNA ribonucleic acid
RNPs ribonucleoproteins
RR risk ratio
RSV respiratory syncytial virus
RTI respiratory tract infection
RT-PCR real-time polymerase chain reaction
RT-PCR reverse transcriptase polymerase chain reaction
RV rhinovirus
RVI respiratory virus infection
S spike protein
SARS-CoV severe acute respiratory syndrome coronavirus
SDAV sialodacryoadenitis virus
SES socio-economic status
SH small hydrophobic gene
SiRNAs small interfering ribonucleic acids
SO-IAV swine-origin (H1N1) influenza A viruses
SP Streptococcus pneumoniae
ssDNA double-stranded deoxyribonucleic acid
ssRNA single-stranded ribonucleic acid
STAT1 /2 signal transducers and activator of transcription factor 1 or 2
STROBE strengthening the reporting of observational studies
TAMRA tetramethylrhodamine
TCoV turkey coronavirus
TGEV transmissible gastroenteritis virus
TLR toll like receptor
TNF tumor necrosis factor
19
List of abbreviations continued
TRIM25 tripartite motif-containing 25
UK United Kingdom
USA United States of America
UTRs untranslated regions
VNPA nasopharyngeal aspirates
VNT nose and throat swabs
VP 1/2 viral protein 1 or 2
VSW swabs taken from the mouth and nose area
VTS throat swabs
WHO World Health Organisation
20
Abstract
Introduction: Epidemiological studies have indicated that 5-38% of influenza like illnesses
(ILI) develop into severe disease due to, among others, factors such as; underlying chronic
diseases, age, pregnancy, and viral mutations. There are suggestions that dual or multiple virus
infections may affect disease severity. This study investigated the association between co-
infection between influenza A viruses and other respiratory viruses and disease severity.
Methodology: Datum for samples from North West England tested between January 2007 and
June 2012 was analysed for patterns of co-infection between influenza A viruses and ten
respiratory viruses. Risk of hospitalization to a general ward ICU or death in single versus
mixed infections was assessed using multiple logistic regression models.
Results: One or more viruses were identified in 37.8% (11,715/30,975) of samples, of which
10.4% (1,214) were mixed infections and 89.6% (10,501) were single infections. Among
patients with influenza A(H1N1)pdm09, co-infections occurred in 4.7% (137⁄2,879) vs. 6.5%
(59⁄902) in those with seasonal influenza A virus infection. In general, patients with mixed
respiratory virus infections had a higher risk of admission to a general ward (OR: 1.43, 95% CI:
1.2 – 1.7, p = <0.0001) than those with a single infection. Co-infection between seasonal
influenza A viruses and influenza B virus was associated with a significant increase in the risk
of admission to ICU/ death (OR: 22.0, 95% CI: 2.21 – 219.8 p = 0.008). RSV/seasonal
influenza A viruses co-infection also associated with increased risk but this was not statistically
significant. For the pandemic influenza A(H1N1)pdm09 virus, RSV and AdV co-infection
increased risk of hospitalization to a general ward, whereas Flu B increased risk of admission to
ICU/ death, but none of these were statistically significant. Considering only single infections,
RSV and hPIV1-3 increased risk of admission to a general ward (OR: 1.49, 95% CI: 1.28 –
1.73, p = <0.0001 and OR: 1.34, 95% CI: 1.003 – 1.8, p = 0.05) and admission to ICU/ death
(OR: 1.5, 95% CI: 1.20 – 2.0, p = <0.0001 and OR: 1.60, 95% CI: 1.02 – 2.40, p = 0.04).
Conclusion: Co-infection is a significant predictor of disease outcome; there is insufficient
public health data on this subject as not all samples sent for investigation of respiratory virus
infection are tested for all respiratory viruses. Integration of testing for respiratory viruses’ co-
infections into routine clinical practice and R&D on integrated drugs and vaccines for influenza
A&B, RSV, and AdV, and development of multi-target diagnostic tests is encouraged.

21
Declaration
I hereby declare that no portion of the work referred to in the thesis has been submitted in
support of an application for another degree or qualification of this or any other university or
other institute of learning.
22
Copyright statement
1. The author of this thesis (including any appendices and/or schedules to this thesis) owns
certain copyright or related rights in it (the “Copyright”) and s/he has given The
University of Manchester certain rights to use such Copyright, including for
administrative purposes.
2. Copies of this thesis, either in full or in extracts and whether in hard or electronic copy,
may be made only in accordance with the Copyright, Designs and Patents Act 1988 (as
amended) and regulations issued under it or, where appropriate, in accordance with
licensing agreements which the University has from time to time.
3. The ownership of certain Copyright, patents, designs, trademarks and other intellectual
property (the “Intellectual Property”) and any reproductions of copyright works in the
thesis, for example graphs and tables (“Reproductions”), which may be described in this
thesis, may not be owned by the author and may be owned by third parties. Such
Intellectual Property and Reproductions cannot and must not be made available for use
without the prior written permission of the owner(s) of the relevant Intellectual Property
and/or Reproductions.
4. Further information on the conditions under which disclosure, publication and
commercialisation of this thesis, the Copyright and any Intellectual Property and/or
Reproductions described in it may take place is available in the University IP Policy
(see http://documents.manchester.ac.uk/DocuInfo.aspx?DocID=487) in any relevant
Thesis restriction declarations deposited in the University Library, The University
Library’s regulations (see http://www.manchester.ac.uk/library/aboutus/regulations) and
in The University’s policy on Presentation of Theses.

23
Acknowledgements
My dues go to my supervisors Professor Pamela Vallely and Professor Paul Klapper and my
advisor Dr Kenneth Mutton for their excellent guidance throughout the process of this study.
Dr David Baxter for his guidance during the first year of my study, Dr Andrew Turner for
approving that I use the Health Protection Agency (HPA) respiratory dataset and nucleic acid
samples tested for respiratory viruses at the Manchester Microbiology Partnership Laboratory
(MMPL) to conduct this study. Professor Christopher Roberts for the statistical support. I
acknowledge the University of Manchester for sponsoring the PhD, the Manchester Academic
Health Science Centre, and the Central Manchester University Hospitals NHS Foundation Trust
and staff for their support in the research. Dr Keith Paver, Mr. Alan Lord, Mr. Mark Hasselhold
for assistance with data extraction and mining of the samples.
I am also indebted to MS Yvonne Satchell, Mr. David Dennington and Dr Carol Yates for
assistance and guidance with laboratory experiments, Ms Audrey Coke and Peter Yates for
administrative support on laboratory matters. The officers in the research offices at the
University and the Central Manchester Universities NHS Trust; Ms Lynne Macrae and MS
Sophia Lockwood for their support with the ethical and R&D approvals. All members of the
NRES Committee Greater Manchester West for the ethical permission to carry out this study.
The North Manchester Management and administration of the Institute of Inflammation and
Repair Dr Catherine O’Neill, MS Christine Burns and all the other line managers for their
immeasurable support during my stay at the University.
Lastly I would like to thank all my colleagues in the MVU, i.e. fellow students and the post-
doctoral students for their love and friendliness while we were working together in our
laboratory. I also acknowledge my family in Malawi and in Taiwan, for the moral and material
support throughout the four years of my study. My dues also go to too many other people who
have supported me in one way or another during my studies. You are all thanked for the same.

24
Dedication
This thesis is dedicated to my daughter Ms Jia-Yi (Ntchayi) Goka.
25
Rationale for submitting the thesis in alternative format
Respiratory virus infections have been regarded as single virus infections. Although some
published studies have investigated the epidemiology and clinical significance of respiratory
virus dual and multiple infections and disease severity, there has been no previous attempt to
review the available evidence. Writing this thesis in the alternative format enables the
presentation of primary and review articles on the significance of co-infections on respiratory
disease outcome in publishable peer reviewed papers format. There is need for scientific
knowledge to help guide policy on multi-targeted testing, integrated vaccines, and combined
treatment of viral respiratory infections. Details of the papers included in this thesis and the
journals they were submitted to are presented in Appendix I.
26
Outline of the thesis
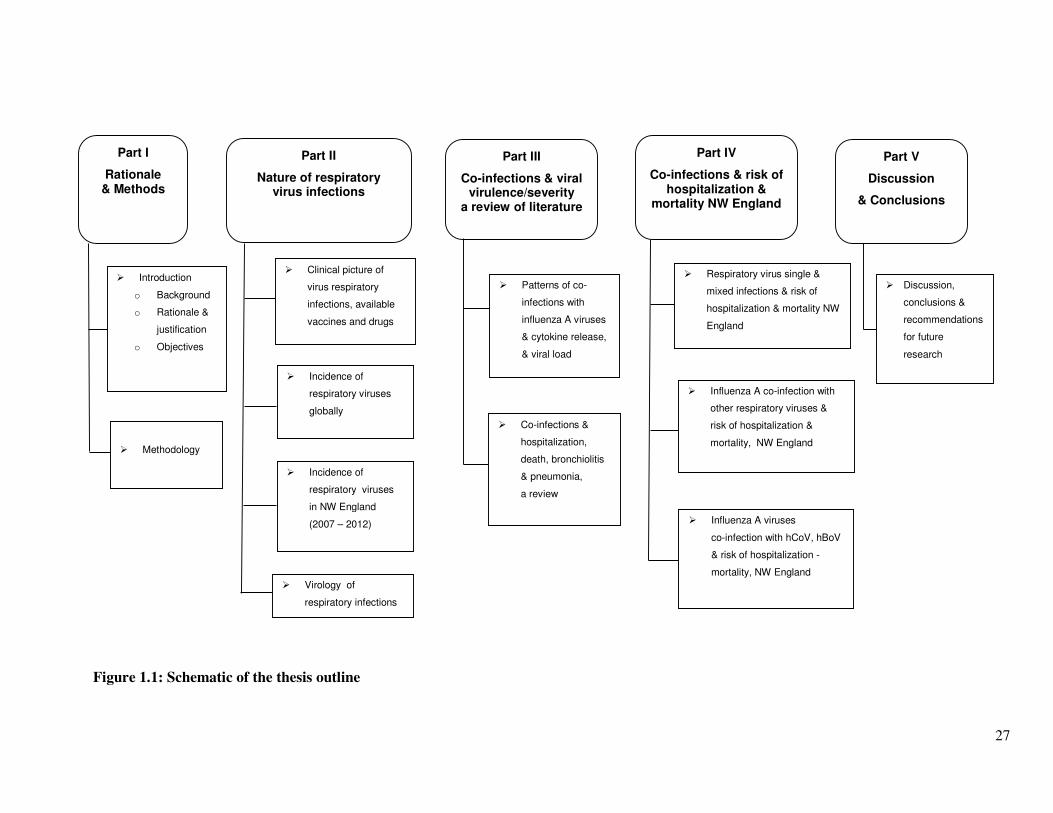
The thesis begins with an introduction chapter which briefly outlines the background for the
research question, the aim and objectives of the study, the justification for conducting this
investigation, the significance of its findings, and the methodology that was employed to
investigate the question.
Part 2 describes the nature of respiratory virus infections in five parts: Section A gives the
clinical signs and symptoms of respiratory disease, available treatments and vaccines. Section
B explores the incidence of respiratory virus infections globally and the factors that affect
incidence rates e.g. season and socio-economic factors. Section C drills down to the local
situation with a primary paper on the incidence of respiratory virus infections in North West
England between January 2007 and June 2012. Section D and E describes the genetics of
respiratory viruses investigated in this research and a review on the mutations in the pandemic
influenza A(H1N1)pdm09 virus and their relationship with severity, as reported by different
studies.
Part 3 is a review of published literature on the epidemiological significance of viral co-
infections on disease outcome. Section A discusses the observed patterns of co-infections
between influenza A and other respiratory viruses and its associated innate and virological
responses (interferon production and viral load). Section B reviews published literature on the
association between co-infections and risk of hospitalization to a general ward, admission to an
intensive care unit (ICU), bronchiolitis and pneumonia.
Part 4 presents the roles of co-infections on risk of hospitalization and mortality in North West
England between 2007 and 2012. Section A describes the role of respiratory viruses dual and
multiple infections on risk of hospitalization and mortality. Section B discusses influenza A
viruses co-infection with other respiratory viruses and risk of hospitalization and mortality; and
Section C presents the association between influenza A viruses co-infection with human
coronaviruses and human bocaviruses and disease severity. It also describes the SYBR Green
and TaqMan RT-PCR assays that were used to test for hCoV and hBoV.
Part 5 gives a discussion of the results and conclusions drawn from the study followed by a list
of all the references and appendices. Figure 1.1 gives a schematic of the thesis outline.
27
Figure 1.1: Schematic of the thesis outline
� Discussion,
conclusions &
recommendations
for future
research
Part I
Rationale & Methods
Part II
Nature of respiratory virus infections
Part III
Co-infections & viral virulence/severity
a review of literature
Part IV
Co-infections & risk of hospitalization &
mortality NW England
Part V
Discussion
& Conclusions
� Introduction
o Background
o Rationale &
justification
o Objectives
� Methodology
� Incidence of
respiratory viruses
globally
� Incidence of
respiratory viruses
in NW England
(2007 – 2012)
� Virology of
respiratory infections
� Patterns of co-
infections with
influenza A viruses
& cytokine release,
& viral load
� Co-infections &
hospitalization,
death, bronchiolitis
& pneumonia,
a review
� Respiratory virus single &
mixed infections & risk of
hospitalization & mortality NW
England
� Influenza A co-infection with
other respiratory viruses &
risk of hospitalization &
mortality, NW England
� Influenza A viruses
co-infection with hCoV, hBoV
& risk of hospitalization -
mortality, NW England
� Clinical picture of
virus respiratory
infections, available
vaccines and drugs
28
Part I: Introduction
Synopsis
This section gives the rationale for the investigation, and summarizes the methodology that was
employed to conduct the research.
29
1.1. Introduction
1.1.1. Epidemiology and significance of influenza and other respiratory viruses
Influenza virus and other acute respiratory tract infections (ARIs) cause considerable mortality and
morbidity worldwide. The 2009 World Health Organization (WHO) report on acute respiratory
infections estimated that, in each winter season, between 10% and 20% of populations worldwide
suffer from influenza (1) and that there are at least 2.2 to 3.9 million deaths from acute respiratory
tract infections (ARIs) throughout the world each year (2;3). A review published in 2013 by Walker
et al., (4) reported that between 2010 and 2011 the incidence of influenza was 982 per 1,000
children ≤5 years old (CI: 414–2699), with 7% of influenza cases developing into severe disease.
The incidence of influenza associated deaths was estimated at 137 per 1,000 children (CI: 38–163).
The authors also indicated that, during this period, there were 120 million episodes of pneumonia
(or acute lower respiratory infections - ALRI), 14 million of which developed into severe disease,
and 10.9% of the pneumonia cases were due to influenza virus. Another study on epidemiology of
pneumonia in 2010 [Rudan et al., (5)], identified RSV and influenza as the most important causes of
pneumonia with RSV being present in 29.0% of all pneumonia episodes and influenza in 17% (5).
In their earlier review Rudan et al., (6) estimated that, in each year, there are approximately 150.7
million new cases of acute lower respiratory tract infection (ALRIs) in children 0-4 years in
developing countries, of which 7 to 13% end up being hospitalized. In the United Kingdom, a study
on general practitioners (GP) consultations and hospitalization for influenza in England and Wales
estimated that influenza causes about 779,000 to 1,164,000 general practice consultations, 19,000 to
31,200 hospital admissions and 18,500 to 24,800 deaths annually (7). Whereas in the United States
of America (USA), Molinari et al., (8), study of 2007 reported that influenza is responsible for 20-
40 million outpatient visits, 330,000 hospitalizations and 30,000 deaths annually.
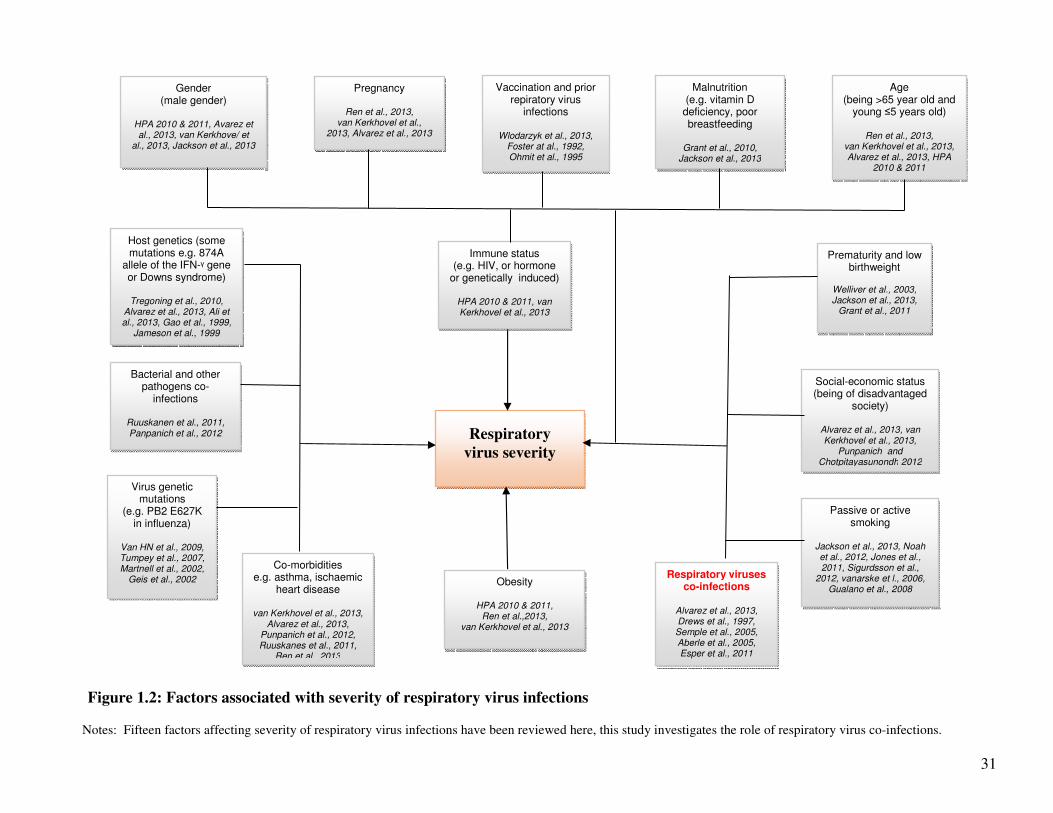
1.1.2. Factors associated with severity of respiratory virus infections
A number of factors may influence the severity of respiratory viral infections including: the age and
gender of the individual; pregnancy; presence or absence of underlying chronic disorders e.g.
asthma, chronic respiratory disease such as chronic obstructive pulmonary disease (COPD),
diabetes, ischaemic heart disease, chronic renal disease, chronic heart disease, chronic liver disease,
chronic neurological disease, atopic dermatitis (9-13); bacterial co-infection e.g. co-infection with
Streptococcus pneumoniae (SP) and Haemophilus influenzae type b (Hib) (14;15);
immunodeficiency e.g. human immunodeficiency virus/ acquired immunodeficiency syndrome
30
(HIV/AIDS); obesity; (9-12); host genetics and mutations in human gene e.g. Downs syndrome
(13;16;17); the virus gene constellation (18-20); vaccination status; previous exposure to certain
viruses (21); prematurity; low birthweight, malnutrition e.g. vitamin D deficiency (13;22;23);
low/vulnerable social-economic status (10), and active or passive smoking (13;23). Figure 1.2 is a
schematic of the factors associated with severity of respiratory viruses.
Patient characteristics like; age (young and old age), gender (being male), patients underlying
conditions (e.g. chronic lung diseases such as chronic obstructive pulmonary disease (COPD),
asthma, congenital heart disease), immunodeficiency, obesity, and being pregnant would precipitate
or offer favourable conditions for respiratory viruses to infect patients. A report published by the
United Kingdom’s (UK’s) Health Protection Agency (HPA), on the epidemiology of the 2009
pandemic influenza A(H1N1)pdm09 virus, indicated that people aged between 6 months and <65
years, with an underlying condition were 10 times more likely to be hospitalized and 18 times more
likely to die compared to people of the same age without an underlying condition (12). A similar
result was observed by the WHO influenza programme analyzing 9,700 hospitalized patients and
2,500 deaths from pandemic influenza A(H1N1)pdm09 from 19 countries, which occurred between
April 2009 and January 2010 (10). Patients aged ≤5 and between 5–14 years old had the highest per
capita risk of hospitalization (relative risk ratio – RR = 3.3 and 3.2) compared to the general
population, and the risk of death was highest among those aged 50–64 and >65 (RR = 1.5 and 1.6).
Further, patients with chronic conditions were more likely to be hospitalized, admitted to ICU or die
from influenza A(H1N1)pdm09 (median 31.1%, 52.3% and 61.8% respectively). Obesity increased
the risk of ICU admission 36 fold (RR = 36.3). A study conducted in China reported that obesity
increased the likelihood of experiencing severe manifestations (odds ratio OR: 35.61), in addition
young/old age and chronic conditions increased this risk 21-fold (OR: 21.4 and 9.79 respectively)
(11). The 2010 HPA report also observed that pregnancy increased risk of hospitalization 5-fold
(rate ratio – RR = 5.1) and mortality 7-fold (RR = 7.1 respectively), whereas immunodeficiency
increased risk of hospitalization 18-fold (RR = 18.5) and mortality 56-fold (RR = 56.0) (12). A
2013 meta-analysis by Jackson et al., (23) indicated that male gender significantly increased risk of
ALRI one and a half times (pooled odds ratio 1.5).
31
Figure 1.2: Factors associated with severity of respiratory virus infections
Notes: Fifteen factors affecting severity of respiratory virus infections have been reviewed here, this study investigates the role of respiratory virus co-infections.
Respiratory
virus severity
Gender (male gender)
HPA 2010 & 2011, Avarez et al., 2013, van Kerkhove/ et
al., 2013, Jackson et al., 2013
Age (being >65 year old and
young ≤5 years old)
Ren et al., 2013, van Kerkhovel et al., 2013, Alvarez et al., 2013, HPA
2010 & 2011
Host genetics (some mutations e.g. 874A
allele of the IFN-ᵞ gene or Downs syndrome)
Tregoning et al., 2010,
Alvarez et al., 2013, Ali et al., 2013, Gao et al., 1999,
Jameson et al., 1999
Immune status (e.g. HIV, or hormone
or genetically induced)
HPA 2010 & 2011, van Kerkhovel et al., 2013
Pregnancy
Ren et al., 2013, van Kerkhovel et al.,
2013, Alvarez et al., 2013
Virus genetic mutations
(e.g. PB2 E627K in influenza)
Van HN et al., 2009, Tumpey et al., 2007, Martnell et al., 2002,
Geis et al., 2002
Vaccination and prior repiratory virus
infections
Wlodarzyk et al., 2013, Foster at al., 1992, Ohmit et al., 1995
Obesity
HPA 2010 & 2011, Ren et al.,2013,
van Kerkhovel et al., 2013
Co-morbidities e.g. asthma, ischaemic
heart disease
van Kerkhovel et al., 2013, Alvarez et al., 2013,
Punpanich et al., 2012, Ruuskanes et al., 2011,
Ren et al., 2013
Respiratory viruses co-infections
Alvarez et al., 2013, Drews et al., 1997, Semple et al., 2005, Aberle et al., 2005, Esper et al., 2011
Bacterial and other pathogens co-
infections
Ruuskanen et al., 2011, Panpanich et al., 2012
Social-economic status (being of disadvantaged
society)
Alvarez et al., 2013, van Kerkhovel et al., 2013,
Punpanich and Chotpitayasunondh 2012
Prematurity and low birthweight
Welliver et al., 2003, Jackson et al., 2013,
Grant et al., 2011
Malnutrition (e.g. vitamin D
deficiency, poor breastfeeding
Grant et al., 2010,
Jackson et al., 2013
Passive or active smoking
Jackson et al., 2013, Noah et al., 2012, Jones et al., 2011, Sigurdsson et al.,
2012, vanarske et l., 2006, Gualano et al., 2008
32
It has been suggested that the increased severity associated with age could be because old age
leads to deterioration of dendritic cells, making them unable to produce type 1 interferons during
virus infection (24;25), whereas young children have an immature immune system lending them
susceptible to infections (26;27). On the other hand, gender may predispose individuals to
susceptible genes (28), or sex specific hormones e.g. testosterone select men to poor immunity
phenotype (29;30); some chronic conditions e.g. COPD facilitate infection through the removal
of immune barriers, i.e. epithelial cell layer leading to impaired production of mucus and
surfactants, anti-viral mediators, and some interfere with innate responses to virus infection, e.g.
production of inflammatory cytokines (31).
The severity of respiratory viruses may also be affected by the host or viral genetics (32;33). A
review by Tregoning et al., (17) found that an individual’s genetic trait is directly related to their
interferon response, antigen presentation, B-cell development, T-helper cell differentiation,
CD28, apoptosis and protein ubiquitination. In viruses, studies have indicated that the
haemagglutinin (HA), neuraminidase (NA), non-structural protein (NS1) and polymerase basic
protein 2 (PB2) are associated with severity of influenza viruses due to their interaction with
sialic acids, the virus receptors on host cells, antagonists of the interferon pathways, and in
determining the viruses host specificity (18-20;34-37). The NS1 protein in respiratory syncytial
virus (RSV) has also been found to perform similar immune regulatory functions as the influenza
A virus NS1 protein (38-40). Similarly bocavirus’ NS1 protein causes cell damage and facilitates
virus replication by among others activating the phosphatidylinositol 3-kinase (PI3K)/Akt
pathway (41;42). The molecules performing related functions in other viruses are the E protein in
adenovirus (AdV) (43), and the spike protein in human coronavirus (hCoV) (44-46). Whereas
the human metapneumovirus (hMPV) uses the P gene and parainfluenza viruses (hPIV1-4) the P
accessory proteins (C, D and V) to promote viral replication by inhibiting interferon production
through degradation of signal transducers and activator of transcription factor 1 or 2 (STAT1
and/or STAT2) (47-50). Recently, Walker et al., (51) have shown that rhinovirus 16 (RV16) 2A
and 3C proteases, cleave cellular protein and uses them to produce viral proteins. Similar
mechanisms were reported in RV14 by Gustin and Sarnow (52).
A 2011 meta-analysis by Grant et al., (53) identified the three child nutrition factors i.e. low
birthweight, zinc deficiency, and insufficient breast feeding as being associated with an
increased risk of developing lower respiratory tract disease (LRTI). The role of nutrition on
LRTI was also confirmed in the 2013 review by Jackson et al., (23). Further, Jackson et al., (23)
33
found lack of exclusive breastfeeding and passive smoking as risk factors. Children whose
parents were smokers or living with adults who smoke were almost 3 times more likely to have
severe respiratory disease than those without (OR: 2.5 and 2.7 respectively). Similar results were
reported by a systematic review and meta-analysis by Jones et al., (54). Active cigarette smoking
has been linked to an increased incidence and severity of respiratory virus infections (55-57), and
such link has also been demonstrated in mice (58). There is overwhelming evidence on the role
of bacterial and other co-infections in aggravating respiratory virus infection. A review by
Punpanich and Chotpitayasunondh (15) published in 2012 reported that up to 43% of influenza
A(H1N1)pdm09 virus associated paediatric deaths had bacterial co-infection. A well conducted
review by Ruuskanen et al., (59) found that up to a third of children with respiratory virus
infections have evidence of viral-bacterial co-infection. Evidence from animal studies, as
reviewed by Peltola and McCullers (60) indicated that the destruction of respiratory epithelium
by viruses may increase bacterial adhesion leading to more pneumonia, bronchiolitis and other
severe outcomes. Similar observations were made by an earlier review by Bakaletz et al., (61).
Some studies have suggested that individuals with low socio-economic status are more likely to
have more respiratory virus infections (62;63) and more severe outcome (10;15). Presumably
because they are more likely to live in an overcrowded household, have poor nutrition leading to
lower immunity have high prevalence of risky behaviours like smoking or may lack information
about vaccination and other types of medical care and hence access medical services to a lesser
extent. However, other studies have found no such link (64-67). Further, prematurity and low
birthweight have been identified as risk factors to severe respiratory disease (22;23;53). For
example, in their study, Jackson et al (23) found that underweight children were five times more
likely to develop ALRI.
Regarding host immunity, studies by Gao et al., (68) and Lu et al (69) with two H5N1 viruses i.e.
the A/HK/483/97 (H5N1), and the A/HK/486/97 (H5N1), isolated from fatal and mild human
cases respectively, showed that the former was highly pathogenic in inbred mice. However, cell
culture and ferret models used by (70) showed that both isolates escaped the antiviral effects of
type 1 interferons (IFN-1) e.g. TNF-α, and gave comparable clinical signs, whereas a separate
study by (71) showed that some cytotoxic lymphocytes (CTLs) were cross-reactive against both
A/HK/156/97 (H5N1) and A/HK/483/97 (H5N1), suggesting the role of host immunostatus or
immunosuppressive diseases. Vaccination is known to reduce the risk of hospitalization and
development of complications among the elderly and individuals with underlying medical
34
conditions (72;73). Cell-mediated immune response to previous exposure to certain viruses leads
to cytopathic effect following infection with another virus whose T cell epitopes cross-react with
the previous infection (21), and that such immune response could also be induced by vaccination
(74).
There have been suggestions, in recent literature, that respiratory virus co-infections affect
disease severity with some studies suggesting that dual and multiple infections increased severity
of respiratory disease (75-77), while others have found no association (78;79), and yet others
found that dual or multiple infection may actually be protective (80-82). Although literature has
shed some light on the patterns of respiratory virus co-infections, most of the studies, such as
Richard et al., (76), Semple et al., (83), Stenfaska et al., (84), Semple, 2005 695 /id}, Calvo et
al., (85), Ali et al., (86), have dwelled on co-infections between RSV and other respiratory
viruses, or bocaviruses and other respiratory viruses [e.g.Schidren et al., (87) and Zheqian et al.,
(88)] therefore the epidemiology or patterns of influenza A viruses co-infections i.e which
viruses most commonly co-infect with influenza A virus in large numbers (Flu A+RSV?
FluA+AdV? or Flu A+PIV1-3? etc), is not known. Further, the association between specific
types of co-infections with influenza A viruses and severity of respiratory disease is not well
understood. This is mainly because most studies have conducted crude analysis. For example, in
the 2011 study by Martin et al., (82), and 2013 studies by Bicer et al., (89) and Peci et al., (90),
only crude analysis was applied to present the association between single and multiple
respiratory infections and risk of admission to a general ward or intensive care unit. In addition,
most of the studies on respiratory virus co-infections [e.g. Rhedin et al., (91), Bicer et al., (89),
Richard et al., (76)] have recruited children ≤5 years old, therefore the impact of respiratory virus
infections in all age groups in not known. In addition, very few studies [Singleton et al., (92),
Libster et al., (93), Echenique et al., (94) and Rhedin et al., (91)] have investigated the effect of
influenza A and other respiratory viruses co-infection on disease outcome. Therefore the
relationship between specific co-infections between influenza and other respiratory viruses and
severity of disease i.e. risk of hospitalization to a general ward (GW), admission to the intensive
care unit (ICU) and death is still unclear. This study intends to generate knowledge to fill these
gaps.
1.1.3. Hypothesis
Severity of influenza A viruses disease will be influenced by certain types of co-infections with
respiratory viral pathogens.
35
1.1.4. Objectives
This study aimed to identify the association between influenza A and respiratory viral infections
dual or multiple infections and severity of influenza disease. The following were the specific
objectives:
1. To investigates the patterns of co-infections between influenza A and other respiratory
virus infections.
2. To determine whether infection with influenza A viruses alone has a different disease
outcome, i.e. risk of hospitalization, admission to a general ward, ICU and death,
compared to co-infections with respiratory viruses.
3. To identify whether the risk of hospitalization, admission to a general ward, ICU and
death in the pandemic influenza A (H1N1)pdm09 co-infections differed from that in
seasonal influenza A viruses.
1.1.5. Research questions and study aims
Table 1.1 gives a summary of the research questions and the studies or experiments that were
conducted to answer these questions. The research questions included:
1. What is the incidence of influenza and other respiratory virus infections, and their associated
hospitalization and mortality globally, in UK and NW England?
2. Did mutations known to increase virus severity occur in influenza A viruses during the study period?
3. Which respiratory viruses most commonly co-infect with influenza A viruses?
4. What is the disease outcome in single and multiple respiratory virus infections in general?
5. Which respiratory viral co-infections mostly enhance influenza A virus severe outcome?
6. Does hCoV and hBoV co-infect with influenza A virus in substantial numbers, if yes, is the disease in
such co-infection severe or mild?
1.1.6. Significance of the study
The WHO and other researchers have called for an integrated approach to the development of
therapeutics and vaccines for RSV, the hPIVs, hMPV, and influenza viruses (95-98). This study
will provide data on the clinical benefit of multiple disease screening in respiratory viral diseases;
it will also provide data for justifying virus combinations to be prioritized in research and
development of combined treatment, integrated vaccines and multi-target diagnostic tests.
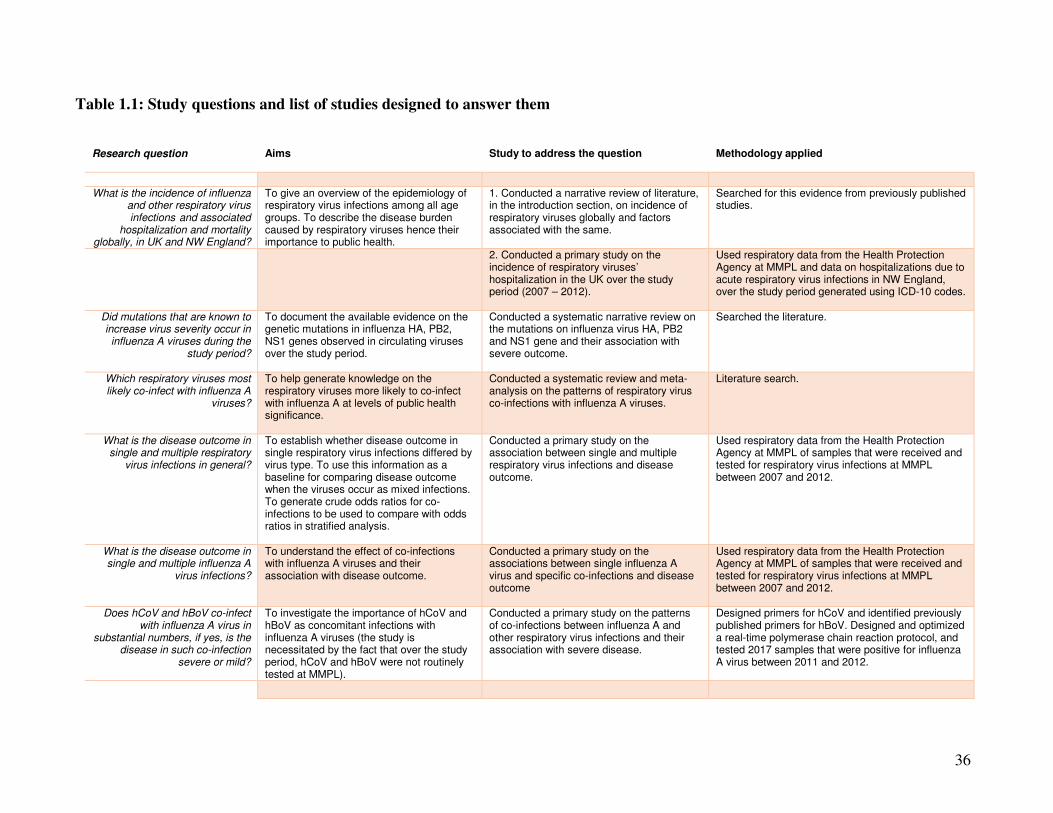
36
Table 1.1: Study questions and list of studies designed to answer them
Research question
Aims
Study to address the question
Methodology applied
What is the incidence of influenza and other respiratory virus infections and associated
hospitalization and mortality globally, in UK and NW England?
To give an overview of the epidemiology of respiratory virus infections among all age groups. To describe the disease burden caused by respiratory viruses hence their importance to public health.
1. Conducted a narrative review of literature, in the introduction section, on incidence of respiratory viruses globally and factors associated with the same.
Searched for this evidence from previously published studies.
2. Conducted a primary study on the incidence of respiratory viruses’ hospitalization in the UK over the study period (2007 – 2012).
Used respiratory data from the Health Protection Agency at MMPL and data on hospitalizations due to acute respiratory virus infections in NW England, over the study period generated using ICD-10 codes.
Did mutations that are known to increase virus severity occur in influenza A viruses during the
study period?
To document the available evidence on the genetic mutations in influenza HA, PB2, NS1 genes observed in circulating viruses over the study period.
Conducted a systematic narrative review on the mutations on influenza virus HA, PB2 and NS1 gene and their association with severe outcome.
Searched the literature.
Which respiratory viruses most likely co-infect with influenza A
viruses?
To help generate knowledge on the respiratory viruses more likely to co-infect with influenza A at levels of public health significance.
Conducted a systematic review and meta-analysis on the patterns of respiratory virus co-infections with influenza A viruses.
Literature search.
What is the disease outcome in single and multiple respiratory
virus infections in general?
To establish whether disease outcome in single respiratory virus infections differed by virus type. To use this information as a baseline for comparing disease outcome when the viruses occur as mixed infections. To generate crude odds ratios for co-infections to be used to compare with odds ratios in stratified analysis.
Conducted a primary study on the association between single and multiple respiratory virus infections and disease outcome.
Used respiratory data from the Health Protection Agency at MMPL of samples that were received and tested for respiratory virus infections at MMPL between 2007 and 2012.
What is the disease outcome in single and multiple influenza A
virus infections?
To understand the effect of co-infections with influenza A viruses and their association with disease outcome.
Conducted a primary study on the associations between single influenza A virus and specific co-infections and disease outcome
Used respiratory data from the Health Protection Agency at MMPL of samples that were received and tested for respiratory virus infections at MMPL between 2007 and 2012.
Does hCoV and hBoV co-infect with influenza A virus in
substantial numbers, if yes, is the disease in such co-infection
severe or mild?
To investigate the importance of hCoV and hBoV as concomitant infections with influenza A viruses (the study is necessitated by the fact that over the study period, hCoV and hBoV were not routinely tested at MMPL).
Conducted a primary study on the patterns of co-infections between influenza A and other respiratory virus infections and their association with severe disease.
Designed primers for hCoV and identified previously published primers for hBoV. Designed and optimized a real-time polymerase chain reaction protocol, and tested 2017 samples that were positive for influenza A virus between 2011 and 2012.
37
1.1.7. Methodology
1.1.7.1. Study design and setting
This is a cross-sectional study that retrospectively analysed data of patient’s samples that were
sent to the Manchester Microbiology Partnership Laboratory (MMPL), by hospitals, medical
centres, and surgeries located in North West England, in the United Kingdom. The study
attempted to describe the epidemiology of twelve respiratory virus infections; pandemic influenza
A(H1N1)pdm09 virus (Flu Apdm09), seasonal influenza A viruses (Flu A), influenza B virus (Flu
B), RSV, RV, AdV, hMPV, hPIV1-3, hCoV and hBoV and characterise the association of their
co-infection with hospitalization to a general ward, admission to ICU or death.
The MMPL is based at the Central Manchester University Hospitals, National Health Service
(NHS) Foundation Trust and serves as a regional reference laboratory for North West England,
catering for a population of 6.9 million people (99). In addition to analysis of electronic laboratory
data, the study also tested samples that were positive for influenza A virus for the presence of
coronavirus and human bocavirus. The real-time polymerase chain reaction (RT-PCR) tests for
coronaviruses and human bocavirus were conducted in the Medical Microbiology Unit (MMU)
Laboratories in Stopford building of the University of Manchester medical school. For calculation
of incidence of respiratory virus infections, bespoke data on hospitalizations due to influenza like
illnesses (by age groups and week/season/year) in in the North West of England between January
2007 and June 2012 were obtained from the Hospital Episodes Statistic (HES) from the Health
and Social Welfare Information Centre – HSCIC (100). Population data for the North West
England was downloaded from the UK’s, Office of National Statistics – ONS (101). A schematic
of the project template summarizing the study design is given in Figure 1.3.
1.1.7.2. Analysis of electronic data
An interrogation of the MMPL respiratory database was conducted in two phases. In the first
phase, datum of samples that were sent to the MMPL for viral detection between 1st January 2007
and 23rd June 2011 was analysed. In the second phase, datum for samples submitted between 24th
June 2011 and 30th June 2012 was analysed. The analysis investigated the epidemiology of
respiratory virus infections (including the incidence of hospitalization, the patterns of co-infection
among them, and the association between co-infection between influenza A viruses and other
respiratory virus infections and the severity of influenza disease (hospitalization to a general ward,
admission to ICU and mortality).

38
1.1.7.3. Variables and information extracted from the MMPL database
Information collected from the MMPL electronic respiratory database included: patients age (in
years and no date of birth was collected), date sample was collected, date received, the medical
facility which submitted the sample and the location within the facility (secondary location), type
of sample that was submitted, type of tests that were requested, tests that were done and the results
of the same. Table 1.2 gives the details of the datum that was extracted from the dataset. A
selection from the J00 to J100 international classification of diseases codes, tenth revision (ICD-
10) as listed in Appendix II was used to extract the number of hospital visits, hospitalizations, or
deaths associated with influenza like illnesses (ILI), in North West England, during the study
period. The codes serve as respiratory classifiers – capturing patients with an influenza like event
as a major diagnosis in the Hospital Episodes database.
1.1.7.4. Inclusion and exclusion criteria
All records with a positive PCR for influenza A virus or patients who were hospitalized or were an
outpatient, and who had samples sent to the laboratory between 1st January 2007 – and 30th June
2012 for screening of respiratory viral infections, were eligible for inclusion. All entries with
incomplete data (where outcome datum was omitted or where the test result was missing either
because the PCR was inhibited or was not performed), were excluded.
1.1.7.5. Respiratory viruses detection assays
Samples submitted to the MMPL by attending physicians for respiratory virus identification
included: nose and throat swabs (VNT), throat swabs (VTS), nasopharyngeal aspirates (VNPA),
and other types of swabs taken from the mouth and nose area (VSW). Samples were submitted
using standard virus transport medium. Nucleic acids were extracted using the Qiagen total
nucleic acid extraction kit on a Qiagen Biorobot MDX (Qiagen, Crawley, UK). Duplex assays of
well-characterised “in-house” RT-PCR assays (unpublished) were used for the identification of
Flu A/B, RSV, RV, AdV, hMPV, and triplex assays for hPIV1-3. In addition, A duplex Assay
published by the Health Protection Agency (the HPA (H1)v - RT-PCR assay (102)) was used for
the identification of the pandemic influenza A(H1N1)psm09. For ribonucleic acid (RNA) viruses,
reverse transcription was accomplished using the Invitrogen Superscript III platinum one-step RT-
PCR kit (Invitrogen, Paisley, UK). All the PCRs were run on the ABI7500 real-time
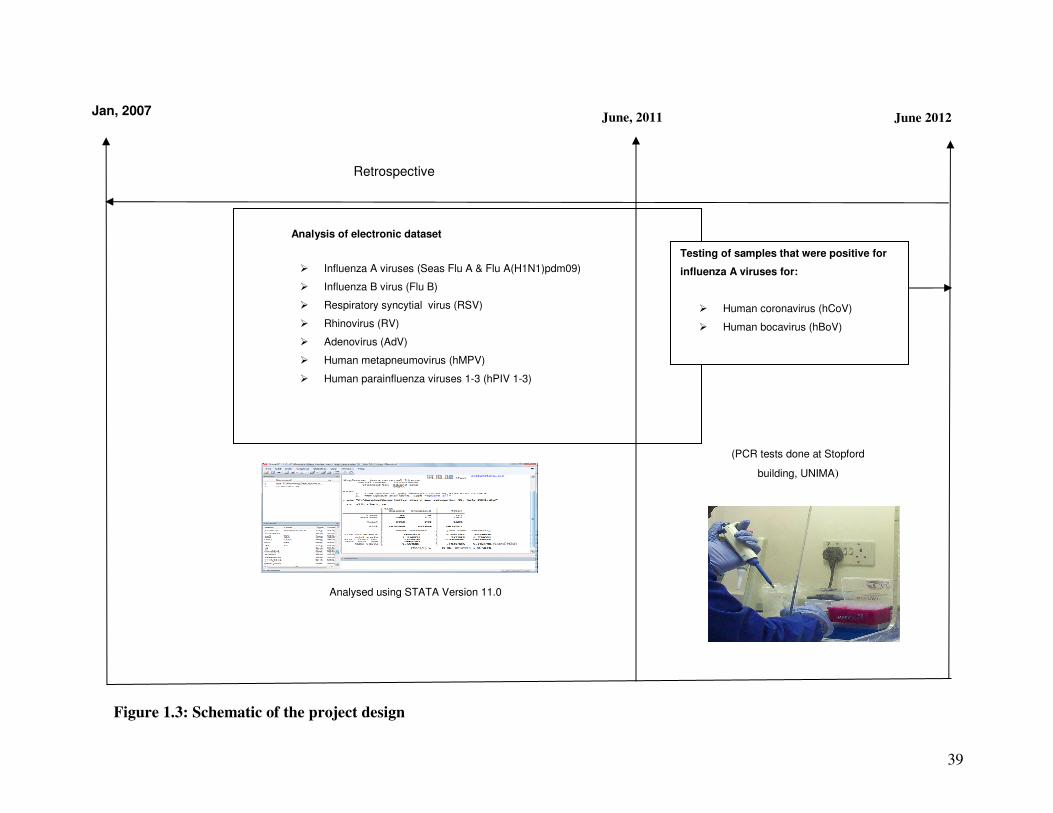
39
Jan, 2007
Figure 1.3: Schematic of the project design
June 2012
Analysis of electronic dataset
� Influenza A viruses (Seas Flu A & Flu A(H1N1)pdm09)
� Influenza B virus (Flu B)
� Respiratory syncytial virus (RSV)
� Rhinovirus (RV)
� Adenovirus (AdV)
� Human metapneumovirus (hMPV)
� Human parainfluenza viruses 1-3 (hPIV 1-3)
Retrospective
June, 2011
Testing of samples that were positive for
influenza A viruses for:
� Human coronavirus (hCoV)
� Human bocavirus (hBoV)
(PCR tests done at Stopford
building, UNIMA)
Analysed using STATA Version 11.0
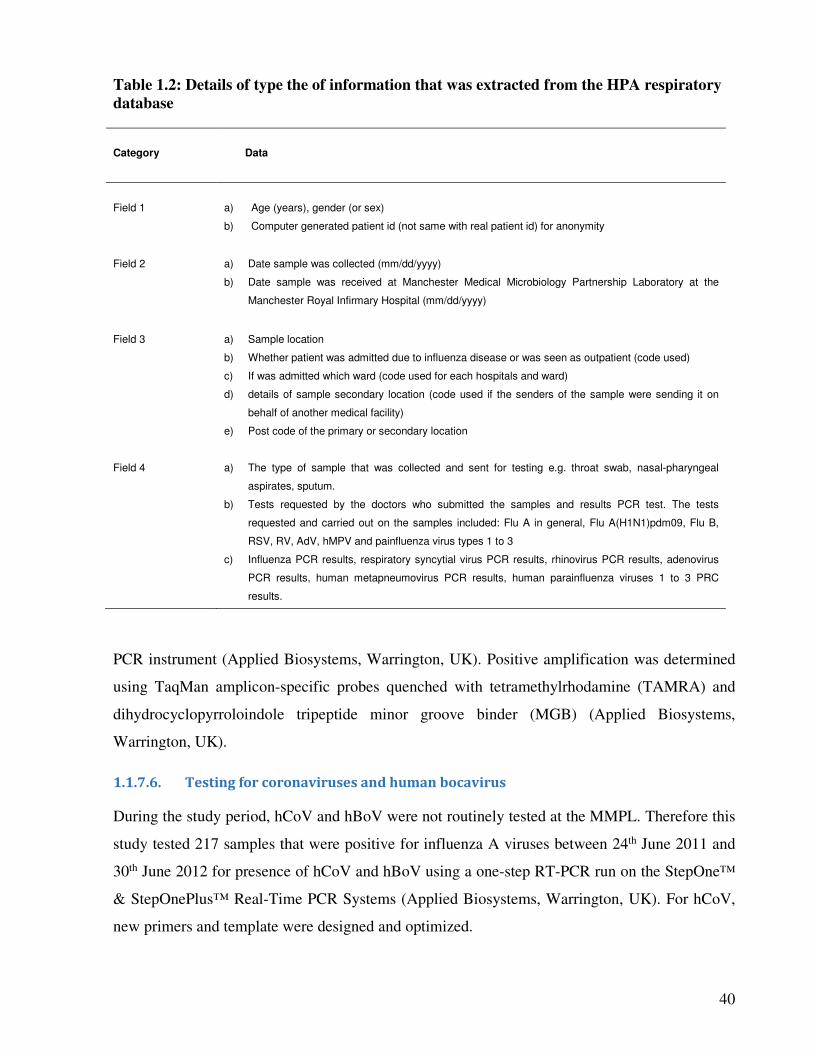
40
Table 1.2: Details of type the of information that was extracted from the HPA respiratory
database
Category
Data
Field 1
a) Age (years), gender (or sex)
b) Computer generated patient id (not same with real patient id) for anonymity
Field 2 a) Date sample was collected (mm/dd/yyyy)
b) Date sample was received at Manchester Medical Microbiology Partnership Laboratory at the
Manchester Royal Infirmary Hospital (mm/dd/yyyy)
Field 3 a) Sample location
b) Whether patient was admitted due to influenza disease or was seen as outpatient (code used)
c) If was admitted which ward (code used for each hospitals and ward)
d) details of sample secondary location (code used if the senders of the sample were sending it on
behalf of another medical facility)
e) Post code of the primary or secondary location
Field 4 a) The type of sample that was collected and sent for testing e.g. throat swab, nasal-pharyngeal
aspirates, sputum.
b) Tests requested by the doctors who submitted the samples and results PCR test. The tests
requested and carried out on the samples included: Flu A in general, Flu A(H1N1)pdm09, Flu B,
RSV, RV, AdV, hMPV and painfluenza virus types 1 to 3
c) Influenza PCR results, respiratory syncytial virus PCR results, rhinovirus PCR results, adenovirus
PCR results, human metapneumovirus PCR results, human parainfluenza viruses 1 to 3 PRC
results.
PCR instrument (Applied Biosystems, Warrington, UK). Positive amplification was determined
using TaqMan amplicon-specific probes quenched with tetramethylrhodamine (TAMRA) and
dihydrocyclopyrroloindole tripeptide minor groove binder (MGB) (Applied Biosystems,
Warrington, UK).
1.1.7.6. Testing for coronaviruses and human bocavirus
During the study period, hCoV and hBoV were not routinely tested at the MMPL. Therefore this
study tested 217 samples that were positive for influenza A viruses between 24th June 2011 and
30th June 2012 for presence of hCoV and hBoV using a one-step RT-PCR run on the StepOne™
& StepOnePlus™ Real-Time PCR Systems (Applied Biosystems, Warrington, UK). For hCoV,
new primers and template were designed and optimized.
41
1.1.7.7. Primers, templates and probes for hCoV, hBoV
Primers for hCoV were designed using the BLAST program [GenBank, Bethesda MD, 20894
USA]. Complete genomic sequences for 15 coronavirus were downloaded from the GenBank.
The retrieved sequences were aligned with BioEdit Sequence alignment Editor version 7.1.3.0
(103) and, where more than one sequence for each subtype was available, a consensus sequence
for each subtype generated. All the consensus sequences were then aligned to generate one
consensus for all consensuses which was then blasted on Primer Blast on the GenBank website,
limiting the search to nucleotide collection (nt) database and organism Coronaviridae. One pair
of primers targeting the region of the replicase open reading frame 1b (ORF1b) gene responsible
for the transcription of the non-structural protein 15 (nsp15; XendoU/NendoU) uridylate specific
endonuclease, which is highly conserved among all coronaviruses (104;105) was selected. For
the hBoV, the NS1 gene primers and template, designed by Qu et al., (106) were used. Details of
the sequences of the templates and primers are given in the methodology section of the paper on
hCoV and hBoV co-infection with influenza A viruses in the latter section of this thesis.
1.1.7.8. Determination of analytical sensitivity and reproducibility of RT-PCR protocols
A series of experiments were conducted to determine the analytical sensitivity and
reproducibility of the PCRs’, and to optimize the primer and probe concentrations (details of the
series of experiments that were conducted to determine the analytical sensitivity of the PCRs are
given in the paper). Briefly for hCoV, both a live coronavirus 229E (Public Health England
Culture Collection, Salisbury UK) and RNA transcribed from the templates (or amplicon
sequences) inserted into a bacterial plasmid pEX-A vector (Eurofins MWG Operon, Ebersberg
Germany) were used. For RNA synthesis the pEX-A vector was linearized using BAMHI
restriction enzyme (New England BioLabs, Ipswich USA) and RNA transcribed using the T7
polymerase enzyme using the T7 High Yield RNA synthesis Kit (New England BioLabs,
Ipswich USA). To determine the analytical sensitivity, standard curve experiments were
conducted in duplicates using serial dilutions of the transcribed RNA and RNA extracted from
the live human coronavirus 229E. The number of viral copies was calculated using the absolute
quantification method published by Brankatschk et al., (107) (an expanded discussion of the
analytical sensitivity experiments is given as an appendix to the paper on this subject). It would
have been good to also test the analytical sensitivity using serial RNA extracted from clinical
samples of all the known human coronaviruses. However, due to budgetary constraints, this was
not carried out and should be noted as one of the limitations of this study. The primer and probe
42
concentrations were also optimized using 20µM, 10µM, 7.50µM, and 5µM serial dilutions of
forward and reverse primer and 10µM, 6.60µM, 3.3µM, 0.37µM probe concentrations set up in
MicroAmp Fast Reaction PCR tubes and mounted on a 48 well plate. For the hBoV, similar
experiments were conducted, however, no RNA was transcribed, instead, the plasmid inserted
amplicon was used as a positive control.
1.1.7.9. PCR for identification of coronaviruses and bocavirus in samples
The RT-PCR experiments were conducted using the Power SYBR Green RNA – to – CT 1 –
Step Kit (Applied Biosystems, Warrington, UK). For identification of coronaviruses, the Power
SYBR Green RNA-to-CT 1-Step Kit (Applied Biosystems) was used in a one-step RT-PCR. The
reaction mixture comprised: Ten microliters (10µl) of Power SYBR Green RT-PCR Master Mix
(2X), 2.5µl forward and reverse primer (concentration; twenty micromolar 20µM), 1µl of
Arrayscript RT Enzyme mix (125X), 2µl of RNAse free water and 3µl of RNA template in
positive control well or sample in test wells. For identification of bocavirus the Power SYBR
Green PCR Master Mix (Applied Biosystems) was used. Details of the PCR protocols such as
cycling conditions are presented in the methodology section of the paper for this subject. For
both PCRs, positive amplification was determined using TaqMan amplicon-specific probes
quenched with MGB (Applied Biosystems, Warrington, UK).
1.1.7.10. Strategies in systematic reviews
Three systematic reviews and meta-analyses were conducted in this study. Individual study
quality was assessed using the STROBE tools (108) whereas the PRISMA statement for
reporting systematic reviews and meta-analysis (109) was followed to write the reviews (details
of the study assessment, selection criteria, and data extraction are provided in the methodology
sections of the reviews). Regarding the search strategies employed, briefly the searches were
conducted on the electronic databases; MEDLINE (Ovid) and EMBASE (Ovid) (which contains
papers published from May, 1946 to date), and WEB of Science (which contains studies
published from 1945 to date); Websites of health organisations e.g. the World Health
Organisation (WHO), United Kingdom’s Health Protection Agency (HPA; now Public Health
England), United States of Americas Centre for Disease Control (CDC), the World Influenza
Network Centre, and reference lists of well conducted published studies were also searched. A
summary of the search words, subject headings, mapping or text words used is provided in
Figure 1.4
43
1.1.7.11. Statistical analysis
Descriptive statistics were computed on the distribution of respiratory virus infections by age,
gender, season, year, and disease outcome (admission to general ward, admission to ICU and
death). The relationship between respiratory virus infections with any of these dichotomous
variables was first assessed using 2 x 2 tables, statistical differences were examined using the
Pearson’s Chi square (�²) statistic if each cell had >5 observations, and the Fisher’s exact test
for small samples.
The weekly age-specific number of hospitalizations associated with ARIs was used to calculate
incidence of hospitalizations in a Poisson model. Incidence of ARI hospitalizations was
calculated by dividing the age-specific weekly number of ARIs hospitalizations by the age-
specific mid-year population figures for North West England for the years 2007 – 2011, and the
2011 census figures for 2011/2012 season, and rounded up for every 100,000. Cumulative
annual hospitalization rates were calculated by summing up the weekly incidence rates. The
numbers of ARI hospitalizations were calculated using major complaint [respiratory classifiers (J
codes) of the International Conference for the Ninth Revision of the International Classification
of Diseases (ICD10].
For the incidence of FluApdm09 and SeasFlu A associated hospitalizations, the expected number
of hospitalizations was used. The expected number was calculated by dividing the weekly age-
specific number of hospitalizations with positive PCR identification of the viruses by the total
number of hospitalizations with ILI, multiplied by the age-specific total number of ARI
hospitalizations obtained using the ICD-10 J codes. Incidence was calculated by diving the
expected number of hospitalizations associated with each virus by the age-specific mid-year
population figures for North West England for the years 2007 – 2011, and the 2011 census
figures for 2011/2012 season, and rounded up for every 100,000 using a Poisson model.
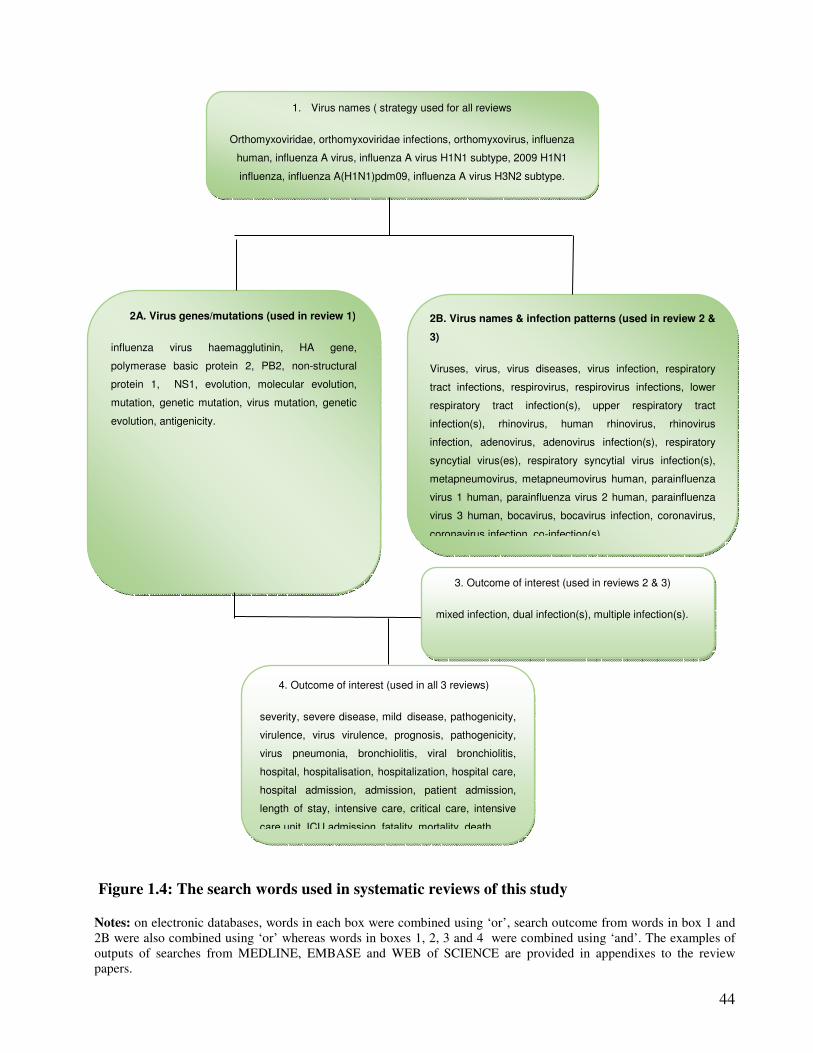
44
Figure 1.4: The search words used in systematic reviews of this study
Notes: on electronic databases, words in each box were combined using ‘or’, search outcome from words in box 1 and
2B were also combined using ‘or’ whereas words in boxes 1, 2, 3 and 4 were combined using ‘and’. The examples of
outputs of searches from MEDLINE, EMBASE and WEB of SCIENCE are provided in appendixes to the review
papers.
1. Virus names ( strategy used for all reviews
Orthomyxoviridae, orthomyxoviridae infections, orthomyxovirus, influenza
human, influenza A virus, influenza A virus H1N1 subtype, 2009 H1N1
influenza, influenza A(H1N1)pdm09, influenza A virus H3N2 subtype.
2A. Virus genes/mutations (used in review 1)
influenza virus haemagglutinin, HA gene,
polymerase basic protein 2, PB2, non-structural
protein 1, NS1, evolution, molecular evolution,
mutation, genetic mutation, virus mutation, genetic
evolution, antigenicity.
2B. Virus names & infection patterns (used in review 2 &
3)
Viruses, virus, virus diseases, virus infection, respiratory
tract infections, respirovirus, respirovirus infections, lower
respiratory tract infection(s), upper respiratory tract
infection(s), rhinovirus, human rhinovirus, rhinovirus
infection, adenovirus, adenovirus infection(s), respiratory
syncytial virus(es), respiratory syncytial virus infection(s),
metapneumovirus, metapneumovirus human, parainfluenza
virus 1 human, parainfluenza virus 2 human, parainfluenza
virus 3 human, bocavirus, bocavirus infection, coronavirus,
coronavirus infection, co-infection(s),
4. Outcome of interest (used in all 3 reviews)
severity, severe disease, mild disease, pathogenicity,
virulence, virus virulence, prognosis, pathogenicity,
virus pneumonia, bronchiolitis, viral bronchiolitis,
hospital, hospitalisation, hospitalization, hospital care,
hospital admission, admission, patient admission,
length of stay, intensive care, critical care, intensive
care unit, ICU admission, fatality, mortality, death.
3. Outcome of interest (used in reviews 2 & 3)
mixed infection, dual infection(s), multiple infection(s).
.
45
Association between respiratory virus single and multiple infection with disease outcome was
evaluated; first using simple logistic regression models; and then using multiple logistic
regression models, controlling for age, sex, season, and an age and co-infection interaction
factor. The significance of the covariates was assessed using the likelihood-ratio test. All the
results were presented as odds ratios (OR) with 95% confidence intervals (CIs) with significance
level of p = 0.05. All analyses were done using the STATA software, version 11.0.
(STATACorp, Texas 77845, USA). In the systematic review, odds ratios were calculated using
the Comprehensive Meta-Analysis software – version 2 (BIOSTAT, Englewood, NJ 07631
USA) and results summarized using forest plots.
1.1.7.12. Ethical considerations
Preliminary permission to use the MMPL respiratory dataset was obtained from the Manchester
Health Protection Agency Research and Development (R&D) Committee. Ethical approval was
obtained from National Health Service – Research Ethics Committee (NHS-REC) through the
integrated research approval system (IRAS) (approval reference number 11 ⁄NW⁄ 0698). Further
ethical approval was obtained from the University of Manchester R&D governance office and a
PANMAN research approval form was completed. NHS R&D approval was obtained through
the NHS-CPS procedure (approval reference number R01835). All electronic datum obtained
from the MMPL respiratory database was anonymized by a third person and the original dataset
was delinked from the dataset given to the researcher; and no patient names or other sensitive
patient’s data were included. The electronic data were stored in encrypted USB and backups
were stored on the secure University of Manchester servers. Procedures of the Data Protection
Act 1998 were followed to avoid disclosure of confidential information through email and other
electronic routes. Results from this research have been published in different places; some
papers have been published in peer reviewed journals, others have been published as conference
abstracts as summarized in the prefixes to each section/chapter/paper and in Appendix I. All
publications have also been uploaded on eScholar of the University of Manchester John Rylands
Library. Project outcomes were also presented and discussed at Faculty of Medical and Human
Sciences quarterly postgraduate showcase meetings and the Medical Microbiology Unit monthly
research meetings.
46
Part II: The nature of respiratory virus infections
Synopsis
This section is an extension of the introduction. It describes the mode of spread, reproductive
number and duration of influenza like illnesses; reviews developments in the vaccination and
treatment protocols; describes the incidence of respiratory virus infections (including the
variations by seasonal, demographic, and social factors); describes the incidence and burden of
hospitalization and death associated with respiratory virus infections including mortality trends
in the past pandemics comparing it to the trend observed in the 2009 influenza A(H1N1)
pandemic, and concludes with a description of their genetics, and a review of the observed
virulence conferring mutations in the pandemic influenza A(H1N1)pdm09 virus.
47
2.1. The nature of respiratory virus disease Part A: Clinical characteristics of
respiratory virus infections, vaccines and treatments
2.1.1. Reproductive number and mode of transmission
The basic reproductive number (R0) for microorganisms range from 2 to 18; measles 13-14,
rubella 6 – 7, chicken pox 7 – 8, HIV 2 – 5, pertussis 16 – 18, mumps 7 - 14 (110). Respiratory
viruses spread through aerosols, droplets on hands and other fomites and are highly contagious.
Modelling studies have put the basic reproductive number (R0) [i.e. the expected number of
infectious hosts that one infectious patient would produce during his/her period of infectiousness,
in a population that is completely susceptible (110)] of the 1918-19, 1957-58 and 1968-69
influenza A virus pandemics at 2 to 3, 1.8 and 1.24 respectively (111-113). Whereas Glass et al.,
(114) and a review by Boelle et al., (115) put the R0 for the 2009 pandemic influenza virus at 1.0
to 2.0 and 1.2 to 2.3 with median value of 1.5 respectively. Conversely, in their review, Cintron-
Arias et al., (116) put the R0 of seasonal influenza viruses between 1.30 and 4.0. Although there
are some differences between studies, generally, the R0’s of other respiratory virus infections
closely resemble those of influenza viruses. In their study, Weber et al., (117), reported an R0 for
RSV ranging from 1.2 to 2.1. On the other hand, reproductive numbers of 2.6 - 2.7 were reported
for the SARS coronavirus by (118;119).
2.1.2. Signs and symptoms
After infection with a respiratory virus, signs and symptoms appear within 48 hours (range 24-96
hours), these mainly being fever, rhinorrhoea, myalgia, anorexia and transient depression,
followed by cough and sore throat. These symptoms normally last for three days before
subsiding usually by the 6th day (120;121). Most respiratory virus illnesses occur only as upper
respiratory tract infections, however, in 5% to 38%, respiratory virus infection may persist and
develop into acute lower respiratory tract infections (ALRI) with more severe symptoms such as,
worsening cough, tachypnoea, dyspnoea, bronchiolitis, bronchitis, croup, wheezing,
hyperinflation, myocarditis, febrile convulsions, myositis and complications in the form of
pneumonia or a toxic shock syndrome (14;17;122-125). In children of ≤5 years old, respiratory
syncytial virus infections are characterised by wheezing (126-128), whereas parainfluenza virus
infections are more associated with croup (17). On the other hand, the influenza B clinical
picture is similar to that of influenza A viruses, but influenza C and bocaviruses are
characterized by mild illness (87;129;130) although some studies have indicated that bocavirus
may cause significant ALRI (87;88).
48
While it is generally accepted that influenza like illnesses (ILI) are of short duration lasting for 4
to 7 days with the highest duration extending up to 14 days, evidence from studies among
immunocompromised individuals suggest that these individuals might harbour the viruses for
longer periods. Prolonged shedding of 1 year to one and a half years have previously been
reported by Weinstock et al., (131), Baz et al., (132), Ison et al., (133), McMinn et al., (134),
Rocha et al., (135) , Okomo-Adhiambo et al., (136), and Giannella et al., (137).
Specifically, Rocha et al., (135) reported influenza virus shedding by a child with severe
combined immunodeficiency disease who developed a 10 month long chronic infection with
naturally acquired influenza A virus, H1N1 subtype. The virus specimens were isolated from
nasal secretions taken at about monthly intervals over a 10 month period. Okomo-Adhiambo et
al., (136) reported an almost similar event for the 2009 pandemic influenza A(H1N1)pdm09
virus in a 2.5 year old child who shed the virus for 5 months before he finally died. Whereas
Giannella et al., (137) performed a prospective study of 64 adult patients (>16 years) of which
some were immunocompromised and others not. The patients were consecutively admitted with
laboratory confirmed influenza A(H1N1) virus infection between September and December,
2009. They reported that 16 of the 64 patients had prolonged viral shedding (range 7-28 days), of
which 6 had shed the virus for up to 14 days while 43 patients did not have prolonged viral
shedding. When classified by immunostatus, 11(68.8%) of the 16 patients who had prolonged
viral shedding were immunocompromised compared to 16 (33.3%) among immunocompetent
individuals who had a short duration of virus shedding and this difference was statistically
significant (OR: 5.15 95% CI: 1.2-22.2, p = 0.03) indicating that immunostatus was an important
risk factor for prolonged viral shedding.
2.1.3. Available vaccines and research on vaccines for other respiratory viruses
Infection with most respiratory viruses, triggers a variety of host immune responses, such as the
production of virus neutralizing antibodies by B-cells and the activation of virus-specific CD8+
cytotoxic T-lymphocytes (138;139). Antibodies against most respiratory surface proteins e.g.
HA-specific immunoglobulins, including IgM, IgA and IgG, appear within 2 weeks of virus
inoculation (130;140-145). The specificity of the antibody response to RNA virus infections in
humans is limited and varies considerably from individual to individual. The serum antibody
response is subtype specific, i.e. infection by one subtype confers little or no protective immunity
to other subtypes (141-145), or antibodies within the same strain or its variant may cross-react, a
phenomenon called "original antigenic sin" (140). This is possible because RNA viruses reassort
their genes and evade cell-mediated immunity. For example substitutions in influenza virus CTL
epitopes abrogate binding of immunogenic peptides to major histocompatibility complex class I
49
(MHC-I) molecules, binding of neutralizing antibodies, and diminish T-cell receptor interaction
(146). However, for the deoxyribonucleic acid (DNA) viruses i.e. adenoviruses and human
bocavirus, CD4-T cells offer long term immunity (147-151).
Because of the ever changing nature of RNA respiratory viruses, annual vaccination is used to
control the spread of influenza virus. Each year’s vaccine is designed based on a prediction of
the strains that are more likely to be in circulation in the next winter seasons (152). Currently,
vaccines for influenza viruses are in two forms; the trivalent inactivated vaccine and the live,
attenuated influenza vaccine (153). The former can be used for any person aged ≥6 months;
whereas the live vaccine can only be used in individuals aged 2–49 years and are considered not
safe in pregnant women and infants (153). Adenovirus based influenza virus vaccines offer new
hope for cost-effective, easy to use influenza vaccine, with long-lasting humoral and cellular
protective immunity (154-156).
For other respiratory viruses, a number of vaccine formulations e.g. for RSV, hMPV, hPIV and
SARS coronavirus are being investigated (95;96;157-159). The subunit vaccines focusing on the
first, second, and third generation purified fusion protein (PFP-1, PFP-2 and PFP-3) of RSV
were found to induce short lived immunity, however the live attenuated RSV, hPIV-3 and hMPV
vaccines look promising (96;159-163). Despite rhinoviruses being among the most common
aetiologic agent for respiratory virus illness, there is currently no vaccine(s) being developed
against rhinoviruses, as it is an almost impossible task, owing to the milliard serotypes of the
virus (164). For bocaviruses, as the clinical significance of bocaviruses is still under review, no
vaccine is currently under development (87).
2.1.4. Available treatments and research on treatments for other respiratory viruses
Among influenza viruses antiviral drugs, the matrix protein 2 (M2) channel blockers, amantadine
and rimantadine, and the neuraminidase inhibitors, oseltamivir, zanamivir and paramivir, are
used for treatment and chemoprophylaxis of influenza virus infections - oseltamivir and
zanamivir for both influenza A and B viruses, and amantadine and rimantadine for influenza A
viruses (165-168). Amantadine and rimantadine were introduced in 1966 and are effective when
treatment is begun within 48 hours of symptom onset (166). On the other hand, oseltamivir and
zanamivir were licenced in the 1990s (167). Antiviral prophylaxis and chemotherapy against
influenza is important however a major current concern is the emergence of resistance to one or
more of the four licenced antiviral agents since 2005 (165;169-175). As influenza A viruses
carry structurally distinct NAs, different mutations on the NA are responsible for the viruses
resistance to neuraminidase inhibitors (176). H1N1 and H5N1 viruses drug resistant mutations
50
have largely been marked by the H274Y mutation (177;178); H3N2 viruses the E119V and
R292K mutations (179) and influenza B viruses the R152K mutation (167). Whilst the
mutations L26F, V27A, A30T, and S31N have been reported to be responsible for resistance to
M2 channel blockers (169;180).
Treatment options for RSV are limited, only aerosolized ribavirin is licenced, however, the drug
is not widely used in treatment particularly because of the difficulties surrounding its
administration (157;181-184). Other RSV treatments include; corticosteroids (hydrocortisone,
dexamethasone and prednisone), salbutamol, ipratropium bromide, vitamin A, and interferon’s.
However, all these have not been found to be effective (157;185-187). Research on the antibody
palivizumab, for prophylactic treatment i.e. passive immunization, is promising
(157;186;188;189). In addition, a number of small molecules including; antibodies, fusion
inhibitors, attachment inhibitors, transcription inhibitors, antisense oligonucleotides, SiRNAs
and natural products or botanical, are being investigated (190).
No specific antiviral is presently licenced for treatment of hPIVs, however, a number of
chemical agents, indicated for paramoxyviruses are under review. For example: small synthetic
peptides targeting the F protein (191;192); inhibitors of virus protein and nucleic acid synthesis
e.g. puromycin (193); plant extracts (194); glucocorticoid (195;196); benzothiazole derivative;
1,2,4-thiazol-2 dicyanamide, carbocyclic-3-deezaadenosine; and calcium elenolate (47;197).
Treatments for RV have been reviewed by Anzueto (198) and include pleconaril which inhibits
the uncoating of the viral capsid and has been associated with reduction in severity and duration
of viral shedding in clinical trials. Other promising drug candidates include protein synthesis
inhibitors like AG7088 (199;200). As for the DNA respiratory virus (AdV), case reports and
clinical studies have reported the use of cidofovir, ribavirin, ganciclovir, and vidarabine for the
treatment of adenovirus infections; however, no clinical trial has been conducted yet (201;202).
The World Health Organisation made a call on the need for the pursuance of an integrated
approach to developing therapeutics and vaccines for RSV, hMPV, the hPIVs, and influenza
viruses i.e. for research to: “Identify gaps in knowledge and tools needed to develop effective
interventions; articulate a research agenda reflecting public health research priorities to
address these needs; and increase research efforts to develop new preventive and treatment
options” (98). Similar calls have previously been made by the scientific community (95-97).
This research aims at generating knowledge on the role of co-infections in disease severity so as
to aid in making a case for integrated drug, integrated vaccine and multi-target diagnostic tests
development.
51
2.2. The nature of respiratory virus disease Part B: Incidence of viral respiratory
infections
2.2.1. Incidence of respiratory virus infections globally
Studies have identified; influenza virus A/B, RSV, RV, AdV, hMPV, hCoV, hBoV and hPIV1-
4 as causers of viral respiratory infections (203-206). The World Health Organisation estimates
that in each winter season, in the temperate regions, and during rainy and cold seasons, in the
tropics, between 10-20% of populations suffer from influenza, and 22–40% of populations
present with symptoms of viral respiratory infections (1).
2.2.1.1. Incidence as reported by community based studies
Table 2.1 summarizes the results of community based studies on incidence of respiratory
viruses conducted in the 1920s, 60s, 70s, 80s and more recently. In Tecumseh USA, over 1,000
families (or 10% of the population) were followed up; from 1965-1971 in first phase, and from
1976-1981 in the second. Twenty two point one percent (22.1%) of the population suffered
from respiratory illness in each year. Incidence was greatly associated with age, infections
being more common in children < 5 years old - Figure 2.1 (204); age-specific annual attack
rates; (31.3%; 293.1 per 1,000 person years) among children 0-4 years old; 21.2% (116.1/1,000
person years) in 5-19 year olds; 18.6% (70.9/1,000 person years) in 20-39 year olds; and 15.8%
(26.7 per 1,000 person years) among those aged ≥ 40 years. Similar observations were reported
by other community based studies with incidence rates ranging between 28.9 and 6,200 per
1,000 population; including a USA study on families, civil servants, military and university
students (64;207), the Baltimore study (208), the New York Virus Watch (209), the Cleveland
family study (210), the Holland Family study (211) and a community based study in
Bangladesh (212) - Table 2.1. However some recent studies reported higher rates among
children 5-19 years old, for example, in a study of the epidemiology of influenza like illnesses
in the Amazon Basin (Peru), incidence also varied with age; 19.6% (122.9 per 1,000 person
years) among children 0-4 years old, 62.7/1,000 in 5-15 year olds, 24.5 in 15-29, 25.4 in 30-44,
31.4 in 45-59, and 29.8 per 1,000 person years in those aged ≥60 years (66). A recent meta-
analysis indicated that the pandemic influenza A(H1N1) virus infections peaked in the 5-19
year olds - Figure 2.2 as indicated by post-pandemic serological investigations (213).
52
2.2.1.2. Incidence as reported by hospital based studies
The incidence rates reported by hospital based studies tend to be lower than those reported by
community based studies – Table 2.1. This is because not all individuals suffering from
respiratory virus infections occurring in the community seek medical attention. It is also
because, community based surveys, which involve households with school going children, tend
to have higher incidence rates since ILI attack rates are much higher in school going children
(204;214).
In general, incidence reports from hospital based studies also indicate that the incidence of
respiratory virus infections is higher in children ≤5 years old. In the United States of America,
Fowlkes et al., (215) and Glezen et al., (216) used data from the MacGregor Medical
Association prepaid health care plan, sentinel surveillance schemes in Houston USA, and
outpatient practices in six states, respectively. Fowlkes et al., (215) reported an incidence of
20.0 (95% CI: 19.7 – 20.4) per 1,000 population for a six months period, whereas Glezen et al.,
(216) reported an incidence of 120 per 1,000 persons/year with preschool children having the
greatest burden, 270 per 1,000 persons during the 1981-1982 influenza season and 290 per
1,000 persons during the 1982-1983 season. In Europe, Hak et al., (217) analysed two years of
computerized data (May, 2000 and April, 2002) from 90 general practices in the Netherlands.
Overall upper respiratory virus infections had an incidence of 144 per 1,000 person years, and
just like in the in the Tecumseh and the Peruvian studies (66;204), the incidence was higher
among children 0-4 years than in other age groups (IR: 392 vs. 80 per 1,000 person years
respectively).
In the UK, data from the Royal College of Physicians General Practice weekly report database
(RCGP) indicated that between 1966 and 2006, respiratory virus infections peaked only during
4 winter seasons; 6.51 per 1,000 population per annum in 1969/70, 0.749 per 1,000 in 1971/72,
3.676 per 1,000 in 1972/73 and 4.103 per 1,000 during the 1975/76. After 1975/76, respiratory
virus activity was comparatively low for the next 13 years and peaked again during the 1989/90
season (3.03 per 1,000 population per annum) (218). During the recent influenza A virus
pandemic period, UK HPA reports indicated that during the 2009/2010 season, the highest
weekly incidence rate in England and Wales was 1.563 per 1,000 population, declining to 1.202
in the 2010/2011 winter season and 0.193 during the 2011/12 winter season with Scotland and
Northern Ireland reporting slightly lower but almost similar weekly rates – data not shown
(9;219). As for annual incidence rates, the RCGP reported an annual ILI incidence of 11.5 per
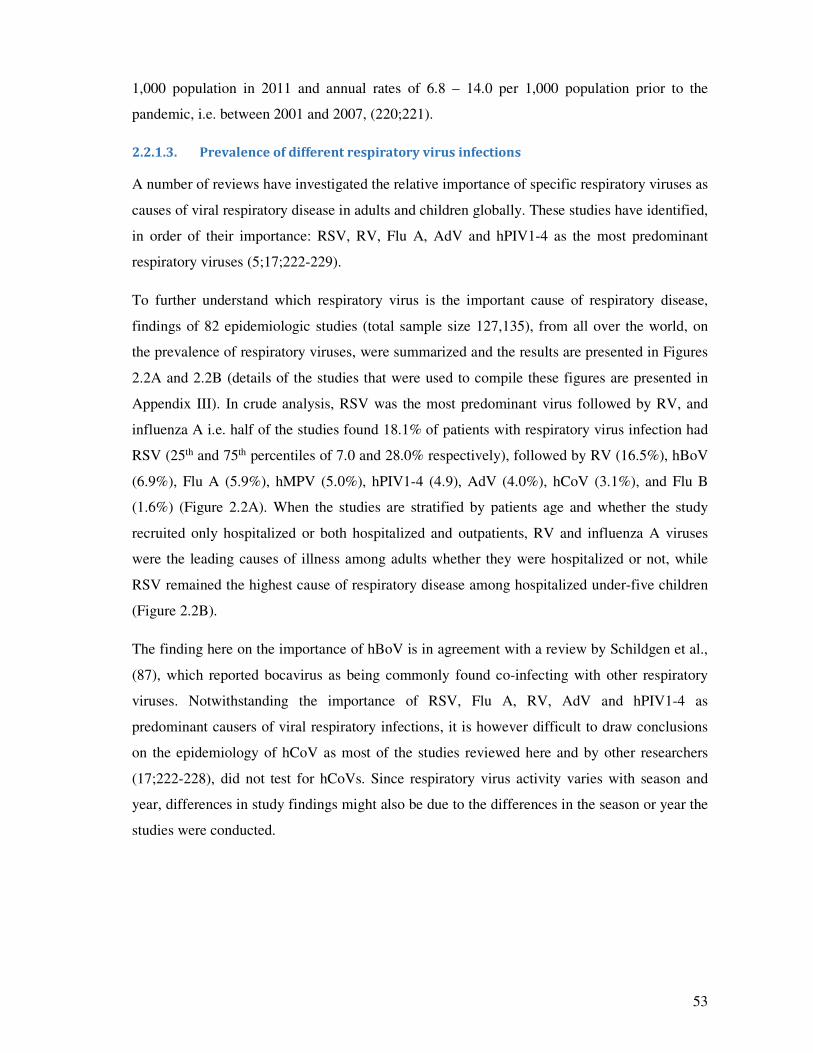
53
1,000 population in 2011 and annual rates of 6.8 – 14.0 per 1,000 population prior to the
pandemic, i.e. between 2001 and 2007, (220;221).
2.2.1.3. Prevalence of different respiratory virus infections
A number of reviews have investigated the relative importance of specific respiratory viruses as
causes of viral respiratory disease in adults and children globally. These studies have identified,
in order of their importance: RSV, RV, Flu A, AdV and hPIV1-4 as the most predominant
respiratory viruses (5;17;222-229).
To further understand which respiratory virus is the important cause of respiratory disease,
findings of 82 epidemiologic studies (total sample size 127,135), from all over the world, on
the prevalence of respiratory viruses, were summarized and the results are presented in Figures
2.2A and 2.2B (details of the studies that were used to compile these figures are presented in
Appendix III). In crude analysis, RSV was the most predominant virus followed by RV, and
influenza A i.e. half of the studies found 18.1% of patients with respiratory virus infection had
RSV (25th and 75th percentiles of 7.0 and 28.0% respectively), followed by RV (16.5%), hBoV
(6.9%), Flu A (5.9%), hMPV (5.0%), hPIV1-4 (4.9), AdV (4.0%), hCoV (3.1%), and Flu B
(1.6%) (Figure 2.2A). When the studies are stratified by patients age and whether the study
recruited only hospitalized or both hospitalized and outpatients, RV and influenza A viruses
were the leading causes of illness among adults whether they were hospitalized or not, while
RSV remained the highest cause of respiratory disease among hospitalized under-five children
(Figure 2.2B).
The finding here on the importance of hBoV is in agreement with a review by Schildgen et al.,
(87), which reported bocavirus as being commonly found co-infecting with other respiratory
viruses. Notwithstanding the importance of RSV, Flu A, RV, AdV and hPIV1-4 as
predominant causers of viral respiratory infections, it is however difficult to draw conclusions
on the epidemiology of hCoV as most of the studies reviewed here and by other researchers
(17;222-228), did not test for hCoVs. Since respiratory virus activity varies with season and
year, differences in study findings might also be due to the differences in the season or year the
studies were conducted.
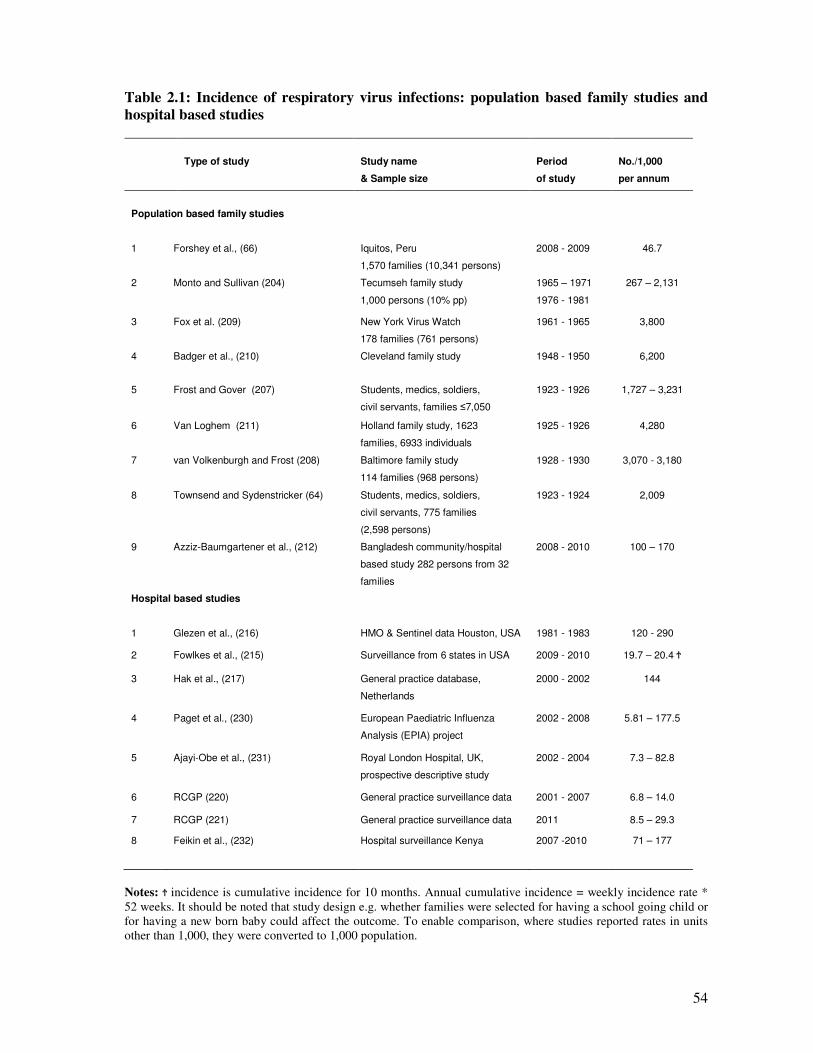
54
Table 2.1: Incidence of respiratory virus infections: population based family studies and
hospital based studies
Type of study
Study name
& Sample size
Period
of study
No./1,000
per annum
Population based family studies
1 Forshey et al., (66) Iquitos, Peru
1,570 families (10,341 persons)
2008 - 2009 46.7
2 Monto and Sullivan (204) Tecumseh family study
1,000 persons (10% pp)
1965 – 1971
1976 - 1981
267 – 2,131
3 Fox et al. (209) New York Virus Watch
178 families (761 persons)
1961 - 1965 3,800
4 Badger et al., (210) Cleveland family study 1948 - 1950 6,200
5 Frost and Gover (207) Students, medics, soldiers,
civil servants, families ≤7,050
1923 - 1926 1,727 – 3,231
6 Van Loghem (211) Holland family study, 1623
families, 6933 individuals
1925 - 1926 4,280
7 van Volkenburgh and Frost (208) Baltimore family study
114 families (968 persons)
1928 - 1930 3,070 - 3,180
8 Townsend and Sydenstricker (64) Students, medics, soldiers,
civil servants, 775 families
(2,598 persons)
1923 - 1924 2,009
9 Azziz-Baumgartener et al., (212) Bangladesh community/hospital
based study 282 persons from 32
families
2008 - 2010 100 – 170
Hospital based studies
1 Glezen et al., (216) HMO & Sentinel data Houston, USA 1981 - 1983 120 - 290
2 Fowlkes et al., (215) Surveillance from 6 states in USA 2009 - 2010 19.7 – 20.4 Ϯ
3 Hak et al., (217) General practice database,
Netherlands
2000 - 2002 144
4 Paget et al., (230) European Paediatric Influenza
Analysis (EPIA) project
2002 - 2008 5.81 – 177.5
5 Ajayi-Obe et al., (231) Royal London Hospital, UK,
prospective descriptive study
2002 - 2004 7.3 – 82.8
6 RCGP (220) General practice surveillance data 2001 - 2007 6.8 – 14.0
7 RCGP (221) General practice surveillance data 2011 8.5 – 29.3
8 Feikin et al., (232) Hospital surveillance Kenya 2007 -2010 71 – 177
Notes: Ϯ incidence is cumulative incidence for 10 months. Annual cumulative incidence = weekly incidence rate *
52 weeks. It should be noted that study design e.g. whether families were selected for having a school going child or
for having a new born baby could affect the outcome. To enable comparison, where studies reported rates in units
other than 1,000, they were converted to 1,000 population.
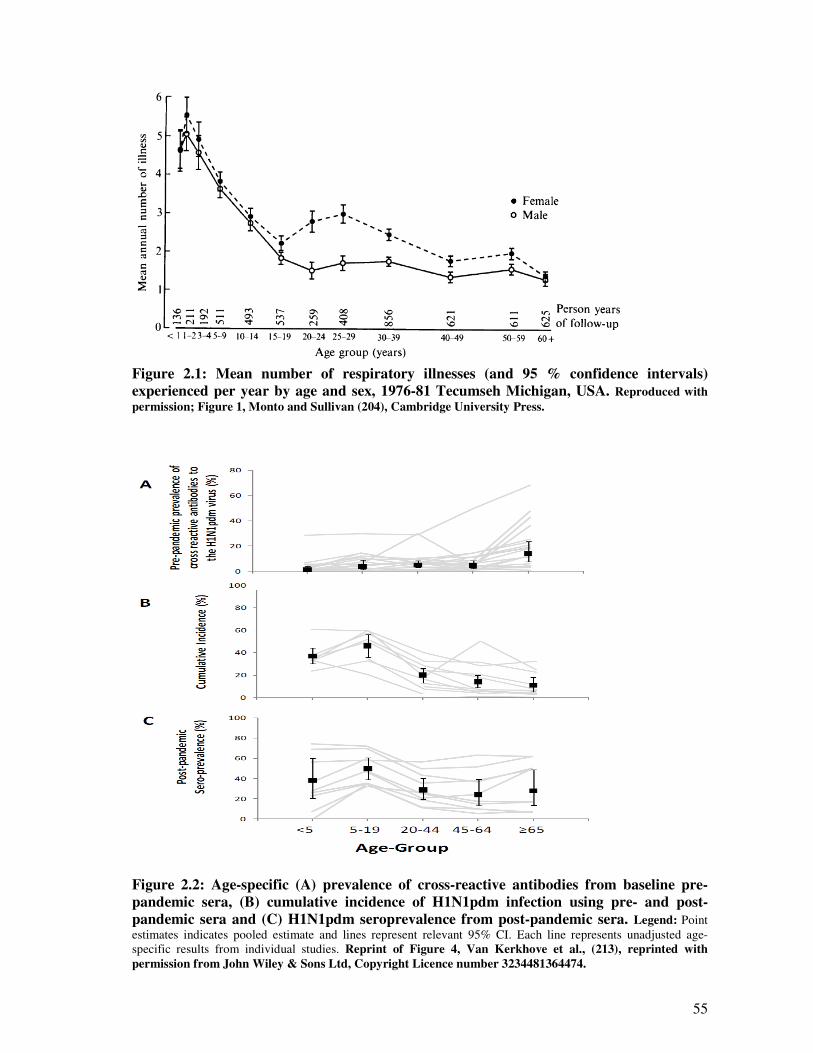
55
Figure 2.1: Mean number of respiratory illnesses (and 95 % confidence intervals)
experienced per year by age and sex, 1976-81 Tecumseh Michigan, USA. Reproduced with
permission; Figure 1, Monto and Sullivan (204), Cambridge University Press.
Figure 2.2: Age-specific (A) prevalence of cross-reactive antibodies from baseline pre-
pandemic sera, (B) cumulative incidence of H1N1pdm infection using pre- and post-
pandemic sera and (C) H1N1pdm seroprevalence from post-pandemic sera. Legend: Point
estimates indicates pooled estimate and lines represent relevant 95% CI. Each line represents unadjusted age-
specific results from individual studies. Reprint of Figure 4, Van Kerkhove et al., (213), reprinted with
permission from John Wiley & Sons Ltd, Copyright Licence number 3234481364474.
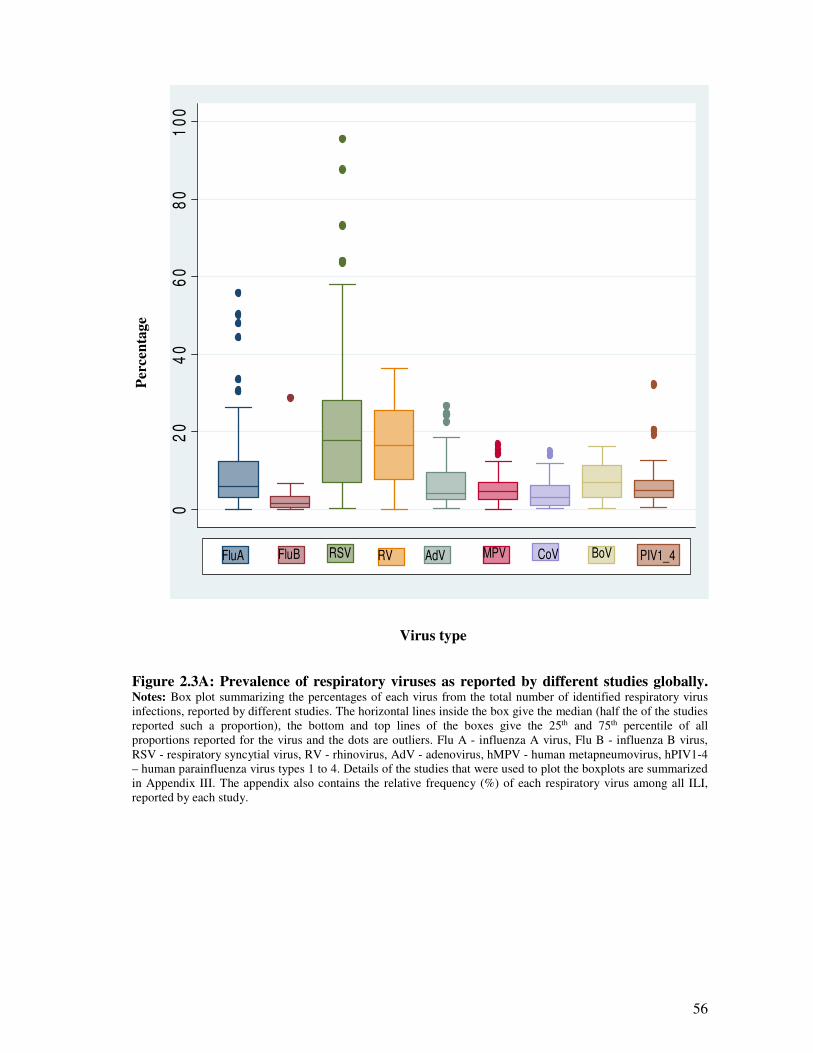
56
Per
cen
tag
e
02
04
06
08
01
00
FluA FluB RSV RV AdV MPV CoV BoV PIV1_4
Virus type
Figure 2.3A: Prevalence of respiratory viruses as reported by different studies globally. Notes: Box plot summarizing the percentages of each virus from the total number of identified respiratory virus
infections, reported by different studies. The horizontal lines inside the box give the median (half the of the studies
reported such a proportion), the bottom and top lines of the boxes give the 25th and 75th percentile of all
proportions reported for the virus and the dots are outliers. Flu A - influenza A virus, Flu B - influenza B virus,
RSV - respiratory syncytial virus, RV - rhinovirus, AdV - adenovirus, hMPV - human metapneumovirus, hPIV1-4
– human parainfluenza virus types 1 to 4. Details of the studies that were used to plot the boxplots are summarized
in Appendix III. The appendix also contains the relative frequency (%) of each respiratory virus among all ILI,
reported by each study.
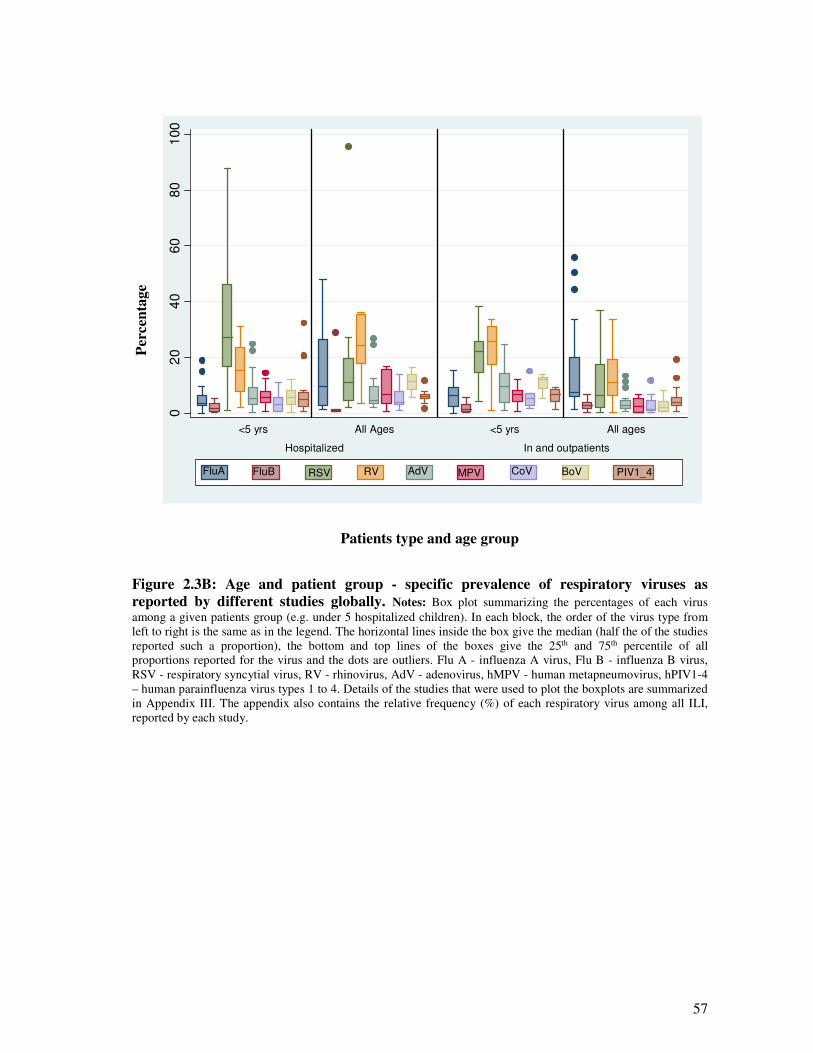
57
Per
cen
tag
e
02
04
06
08
01
00
Hospitalized In and outpatients
<5 yrs All Ages <5 yrs All ages
FluA FluB RSV RV AdV MPV CoV BoV PIV1_4
Patients type and age group
Figure 2.3B: Age and patient group - specific prevalence of respiratory viruses as
reported by different studies globally. Notes: Box plot summarizing the percentages of each virus
among a given patients group (e.g. under 5 hospitalized children). In each block, the order of the virus type from
left to right is the same as in the legend. The horizontal lines inside the box give the median (half the of the studies
reported such a proportion), the bottom and top lines of the boxes give the 25th and 75th percentile of all
proportions reported for the virus and the dots are outliers. Flu A - influenza A virus, Flu B - influenza B virus,
RSV - respiratory syncytial virus, RV - rhinovirus, AdV - adenovirus, hMPV - human metapneumovirus, hPIV1-4
– human parainfluenza virus types 1 to 4. Details of the studies that were used to plot the boxplots are summarized
in Appendix III. The appendix also contains the relative frequency (%) of each respiratory virus among all ILI,
reported by each study.
58
2.2.2. Rates of severe disease and incidence of hospitalization and mortality associated
with respiratory virus infections
2.2.2.1. The rates of severe respiratory disease
Evidence from epidemiological studies indicates that 5 - 38% of all ILI episodes would develop
into acute respiratory tract infections (8;209;226;233-236) and 5 - 25% would seek medical
consultation (204;212;226;237;238) and 0.01 – to 5% would die (6;8;226) - (Table 2.2).
Consequently, respiratory virus infections impart a substantial burden on the health care
system, with between 3.0 - 15 % of all medical consultations being due to ILI (215;239), and
up to 40.0% of all paediatric emergency department visits being due to ILI (231;240).
2.2.2.2. The incidence of hospitalization and mortality
The rates of hospitalization and mortality due to respiratory viruses has its highest toll in ≤ 5
years old children, ≥ 65 years old adults and those with high-risk conditions. Approximately
5.4 - 15% of all acute respiratory viral conditions, or all patients with a positive diagnosis of
respiratory virus are hospitalized (6;241-243), and between 1 % and 5% of those hospitalized
with ARI, or those with acute respiratory infections die (6;226;243;243-248). Table 2.3
summarizes studies, from all over the world, that estimated population based incidence rates of
hospitalization and mortality from respiratory virus infections. Hospitalization rates range from
200 to ≥1,000 per 100,000 population for persons aged ≥65 years, compared to 200 to 500 per
100,000 population for children 5 to 14 years of age, and 80 to 400 per 100,000 for persons 15-
64 years of age. The rates among middle aged (15-64 year olds) also varies with risk
conditions; with rate of 250 to 650 per 100,000 population in those with high-risk conditions
e.g. diabetes, and 20 to 80 per 100,000 in those without.
In their studies, Schanzer et al., (249) and Schanzer et al., (250) reported that, over the period
1994 -2000, in Canada, influenza-associated hospitalizations ranged from 18-200 per 100,000
population. The largest burden was in infants 6 to 11 months of age (200 per 100,000), almost
equivalent to the rate of 270–340 per 100,000 for adults 65 to 69 years old, compared to a rate
of 65/100, 000 among persons aged 20 years or older. In the UK, Nicholson et al., (251)
assessed children presenting to the Leicester Royal Infirmary Children’s Hospital (which serves
1 million inhabitants, including 68,000 children ≤71 months old), from October 2001 to June
2002. They reported that the rates of admission for influenza A, RSV and hMPV were 144
(95% CI: 117–175), 517 (95% CI: 465–574), and 126 (95% CI: 101–156) per 100,000
respectively.
59
2.2.2.3. The burden of hospitalization and mortality
Data from the World Health Organisation indicate that there are at least 3.9 million deaths from
ARI throughout the world each year and that ARIs are responsible for a loss of 94.0 million
(6.3% of total) disability-adjusted life-years (DALYs), making them rank first among causes of
disability-adjusted life-years (2). In the USA, Molinari et al., (8) reported influenza is
responsible for 20-40 million outpatient visits, 330,000, hospitalizations and 30,000 deaths
annually, almost similar findings were reported for influenza, RSV and parainfluenza virus type
3 by earlier studies (238;252-259). In Germany, a 2 year multicentre study of children aged <3
years by Forster et al., (260) reported that between 1999 and 2001, a total of 682,128 children <
3 years old were seen as outpatients by a doctor for LRTIs of which 69,847 were hospitalized
giving an annual hospitalization rate for LRTIs of 2,941 per 100,000 children.
Rudan and colleagues, estimated that in developing countries, the median incidence of lower
respiratory tract infections (LRTI) was 44 per 100 child-years, equal to approximately 150.7
million new cases each year and 11 – 20 million (7 to 13% of all ARI cases) would be
hospitalized (6). Reviews on the burden on influenza and RSV indicated that in 2008,
influenza caused 90 million infections globally and 21 million of these developed into lower
respiratory infections with 28,000–111,500 deaths. RSV caused 33.8 million ALRIs of which
3.4 million (22% of all ALRI cases) required hospital admission, and an estimated 66,000 to
199,000 of the children died (227;228). In the United Kingdom, Pitman et al., (7) estimated that
between 1990 - 2004 there were, in each year, around 779,000 to 1,164,000 influenza
associated general practice consultations, 19,000 to 31,200 hospital admissions and 18,500 to
24,800 deaths.
2.2.2.4. Waves and relative virulence of influenza virus pandemics and epidemics
In general, the influenza pandemics which have occurred in the past centuries, have shown
marked variation in severity, ranging from a mild pandemic in 1968/69, to a severe pandemic
in 1918/19 (261;262). In each of the five pandemics of the 20th century, there were multiple
waves of infection following the emergence of the virus. In the 1918 pandemic, the first wave
occurred in spring 1918 in the USA. The second wave began in August 1918 and the third
wave appeared in spring 1919 (263;264). It is estimated that in total the pandemic claimed over
50 million lives, and had an excessive death rate of 598/100,000 persons per year
(262;265;266) - Table 2.4.
The 1957–1958 pandemic originated in Yunan Province, China in February 1957 and second
wave was in early 1958 (261). The two waves were similar in severity in many countries but
60
the second had caused larger number of deaths in some (261;266;267). The estimated
worldwide death toll was around 1 million persons, while its excessive death rate was attributed
to around 40.6/100,000 persons per year – Table 2.4.
Similarly, the 1968–1969 pandemic began in China in July 1968, spreading rapidly to the
remainder of Southeast Asia and Australia and Europe by September 1968. It at first caused
mild illnesses until the winter season of 1969–1970 (268-270). An analysis of the genes of the
pandemic virus indicated that the pandemic was caused by PB1 and HA obtained from avian
sources (Figure 2.21). However because the NA segment was similar to earlier viruses,
antibodies to this glycoprotein conferred partial protection against clinical disease and probably
this was the reason for its relative mildness (271) – mortality rate of 16.9 per 100,000
population - Table 2.4. Estimates of victims of the 1969 pandemic show a range of 1-3 million
fatalities, of which over 30,000 were from the United Kingdom (272).
The 1977-78 pandemic was a return of the virus which had been circulating in the 1918 - 1950s
(273). Outbreaks of influenza were recorded in three Chinese provinces from end of May,
1977. Further outbreaks were recorded in China, Taiwan, the Philippines, Siberia, Singapore
and Russia in November, spreading to North America, the UK and a number of central
European countries and Japan in February 1978. By March, epidemics were reported in North
America, Scandinavian countries, Europe and the Middle East, reaching Australia, New
Zealand, Central America, South America in June. However, compared to the 1918/1919
pandemic, it caused mild deaths (261) – mortality rate of 21.0 per 100,000 population – Table
2.4.
As for the pandemic influenza A(H1N1)pdm09 virus, the first confirmed cases were from
California and Mexico reported by CDC on 17 April 2009. Later WHO confirmed the Mexico
and California cases to be the same novel virus, an outbreak notice was issued a week later on
24 April 2009 and a global pandemic alert which was then upgraded to level 6 on 11 June 2009
(274). The virus then spread to all other parts of the world (over 214 countries). Reports on the
first wave indicated that the majority of cases were mild influenza-like illnesses, with few cases
having high fever and some patients having gastrointestinal symptoms including diarrhoea
(275). The second wave was from October 2009 to January 2010. In the UK, by this time, the
virus had caused a total of 29,228 infections: with 20,595 occurring in England, 6,600 in
Scotland, 1,369 in Northern Ireland, and 664 in Wales with 440 deaths (276). The 3rd wave
was from December 2010 to February, 2011 (277). According to the 18th February 2011 WHO
weekly epidemiological update, by this time, the virus severity had increased with severe and
fatal cases reported in the UK and the Middle East (278). A study by Dawood et al., (279)
61
estimated that between April, 2009 and August, 2010 there were 18,500 laboratory confirmed
cases of the pandemic virus and between 151,700 and 575,400 deaths globally, representing a
rate of 1.7 to 7.8 per 100,000 population.
A general observation to make is that hospitalization and mortality rates in the past pandemics
varied with age. Simonsen et al.,(255) compared the age distribution of influenza-related deaths
in the United States during 3 influenza pandemics (1918 -1999, 1957 – 1969 and 1968 – 1969).
They observed that in each pandemic, hospitalization and mortality was high among young
people ≤65 years of age, but for all the 3 pandemics, the trend has been that this group
accounted for decreasingly smaller proportions of deaths during the decades that follow each
pandemic (Figure 2.4). The authors suggest that individuals infected by the pandemic virus
acquired immunity to the virus, the so called “original antigenic sin’’ (140), and that there is a
tendency for selective acquisition of protection against fatal illness among younger persons. A
recent review on the patterns of hospitalization and mortality of the pandemic influenza
A(H1N1)pdm09 indicated that, among the 19 countries included in the analysis, the median age
of hospitalization, admission to ICU and death were 7 - 38 years, 28 - 49.5 years and 30 - 56
years respectively, but the highest per capita death rate was in the elderly ≥65 old – Figure 2.5
(10). Similarly, a recent review by Wang et al., (280) on pandemic influenza A(H1N1)pdm09
fatality risk, has also reported an age dependent mortality risk. If the observations by Simonsen
et al., (255), Van Kerkhove et al., (10) and Wong et al., (280) are to repeat in the coming
decades, it could be expected that the future seasonal strains of the pandemic influenza
A(H1N1)pdm09 virus would cause more deaths in new born children and the very elderly.
2.2.3. Risk pyramid for respiratory virus infections
From the evidence reviewed above, it can be summarized that in each winter season, around
20% of the population suffer from respiratory virus infections, 5 to 25% of these would seek
medical attention, 5 to 15% of those that are medical attended would be hospitalized and
around 5% of those hospitalized will die. Figure 2.6 is a risk pyramid giving a schematic of
risk/burden of respiratory virus infections. The estimates here are only averages, and incidence
rates of infection, hospitalization, or death are likely to vary with virus type (including co-
infections), patients’ health status, age, and other factors.
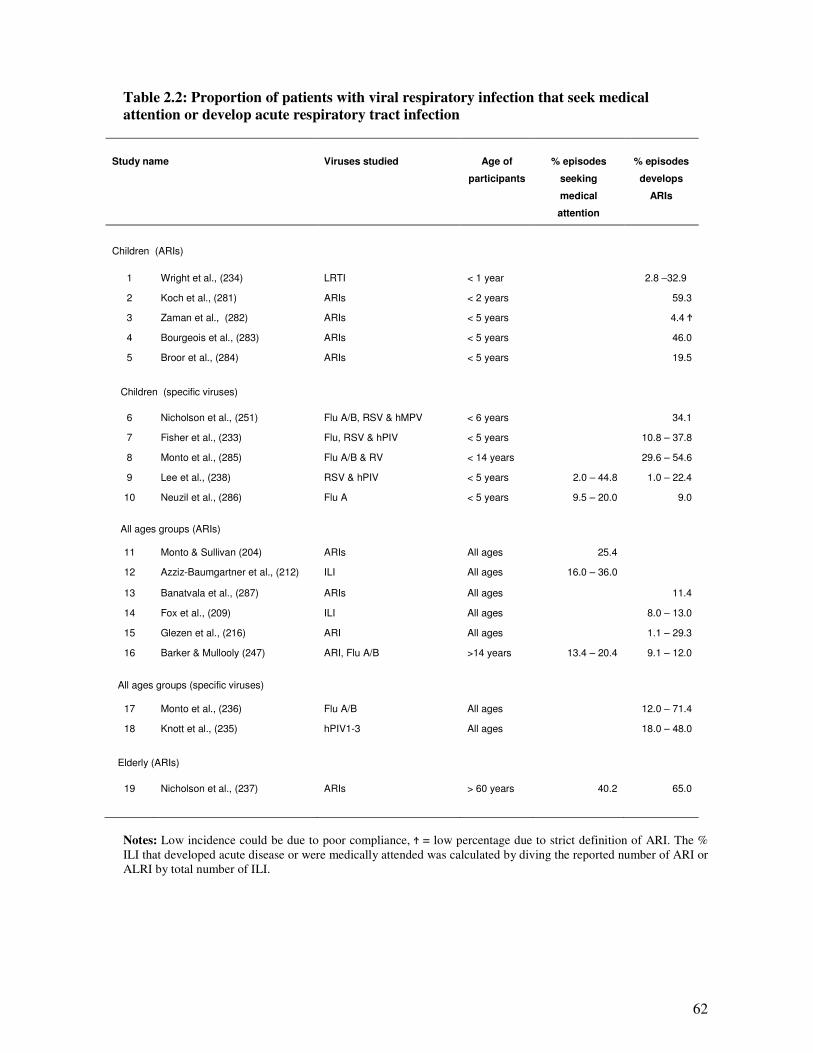
62
Table 2.2: Proportion of patients with viral respiratory infection that seek medical
attention or develop acute respiratory tract infection
Study name
Viruses studied
Age of
participants
% episodes
seeking
medical
attention
% episodes
develops
ARIs
Children (ARIs)
1 Wright et al., (234) LRTI < 1 year 2.8 –32.9
2 Koch et al., (281) ARIs < 2 years 59.3
3 Zaman et al., (282) ARIs < 5 years 4.4 Ϯ
4 Bourgeois et al., (283) ARIs < 5 years 46.0
5 Broor et al., (284) ARIs < 5 years 19.5
Children (specific viruses)
6 Nicholson et al., (251) Flu A/B, RSV & hMPV < 6 years 34.1
7 Fisher et al., (233) Flu, RSV & hPIV < 5 years 10.8 – 37.8
8 Monto et al., (285) Flu A/B & RV < 14 years 29.6 – 54.6
9 Lee et al., (238) RSV & hPIV < 5 years 2.0 – 44.8 1.0 – 22.4
10 Neuzil et al., (286) Flu A < 5 years 9.5 – 20.0 9.0
All ages groups (ARIs)
11 Monto & Sullivan (204) ARIs All ages 25.4
12 Azziz-Baumgartner et al., (212) ILI All ages 16.0 – 36.0
13 Banatvala et al., (287) ARIs All ages 11.4
14 Fox et al., (209) ILI All ages 8.0 – 13.0
15 Glezen et al., (216) ARI All ages 1.1 – 29.3
16 Barker & Mullooly (247) ARI, Flu A/B >14 years 13.4 – 20.4 9.1 – 12.0
All ages groups (specific viruses)
17 Monto et al., (236) Flu A/B All ages 12.0 – 71.4
18 Knott et al., (235) hPIV1-3 All ages 18.0 – 48.0
Elderly (ARIs)
19 Nicholson et al., (237) ARIs > 60 years 40.2 65.0
Notes: Low incidence could be due to poor compliance, Ϯ = low percentage due to strict definition of ARI. The %
ILI that developed acute disease or were medically attended was calculated by diving the reported number of ARI or
ALRI by total number of ILI.
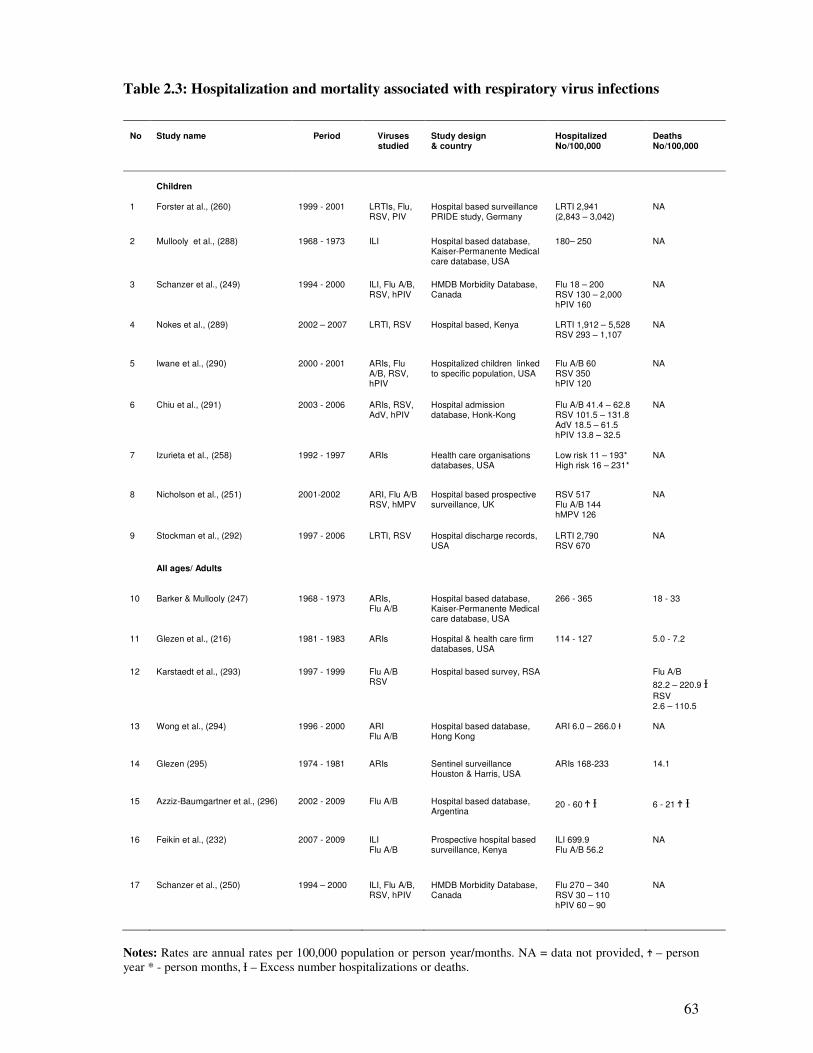
63
Table 2.3: Hospitalization and mortality associated with respiratory virus infections
No
Study name
Period
Viruses studied
Study design & country
Hospitalized No/100,000
Deaths No/100,000
Children
1 Forster at al., (260) 1999 - 2001 LRTIs, Flu, RSV, PIV
Hospital based surveillance PRIDE study, Germany
LRTI 2,941 (2,843 – 3,042)
NA
2 Mullooly et al., (288) 1968 - 1973 ILI Hospital based database, Kaiser-Permanente Medical care database, USA
180– 250 NA
3 Schanzer et al., (249) 1994 - 2000 ILI, Flu A/B, RSV, hPIV
HMDB Morbidity Database, Canada
Flu 18 – 200 RSV 130 – 2,000 hPIV 160
NA
4 Nokes et al., (289) 2002 – 2007 LRTI, RSV Hospital based, Kenya LRTI 1,912 – 5,528 RSV 293 – 1,107
NA
5 Iwane et al., (290) 2000 - 2001 ARIs, Flu A/B, RSV, hPIV
Hospitalized children linked to specific population, USA
Flu A/B 60 RSV 350 hPIV 120
NA
6 Chiu et al., (291) 2003 - 2006 ARIs, RSV, AdV, hPIV
Hospital admission database, Honk-Kong
Flu A/B 41.4 – 62.8 RSV 101.5 – 131.8 AdV 18.5 – 61.5 hPIV 13.8 – 32.5
NA
7 Izurieta et al., (258) 1992 - 1997 ARIs Health care organisations databases, USA
Low risk 11 – 193* High risk 16 – 231*
NA
8 Nicholson et al., (251) 2001-2002 ARI, Flu A/B RSV, hMPV
Hospital based prospective surveillance, UK
RSV 517 Flu A/B 144 hMPV 126
NA
9 Stockman et al., (292) 1997 - 2006 LRTI, RSV Hospital discharge records, USA
LRTI 2,790 RSV 670
NA
All ages/ Adults
10 Barker & Mullooly (247) 1968 - 1973 ARIs, Flu A/B
Hospital based database, Kaiser-Permanente Medical care database, USA
266 - 365 18 - 33
11 Glezen et al., (216) 1981 - 1983 ARIs Hospital & health care firm databases, USA
114 - 127 5.0 - 7.2
12 Karstaedt et al., (293) 1997 - 1999 Flu A/B RSV
Hospital based survey, RSA Flu A/B
82.2 – 220.9 Ɨ RSV 2.6 – 110.5
13 Wong et al., (294) 1996 - 2000 ARI Flu A/B
Hospital based database, Hong Kong
ARI 6.0 – 266.0 Ɨ
NA
14 Glezen (295) 1974 - 1981 ARIs Sentinel surveillance Houston & Harris, USA
ARIs 168-233 14.1
15 Azziz-Baumgartner et al., (296) 2002 - 2009 Flu A/B Hospital based database, Argentina
20 - 60 Ϯ Ɨ 6 - 21 Ϯ Ɨ
16 Feikin et al., (232) 2007 - 2009 ILI Flu A/B
Prospective hospital based surveillance, Kenya
ILI 699.9 Flu A/B 56.2
NA
17 Schanzer et al., (250) 1994 – 2000 ILI, Flu A/B, RSV, hPIV
HMDB Morbidity Database, Canada
Flu 270 – 340 RSV 30 – 110 hPIV 60 – 90
NA
Notes: Rates are annual rates per 100,000 population or person year/months. NA = data not provided, Ϯ – person
year * - person months, Ɨ – Excess number hospitalizations or deaths.
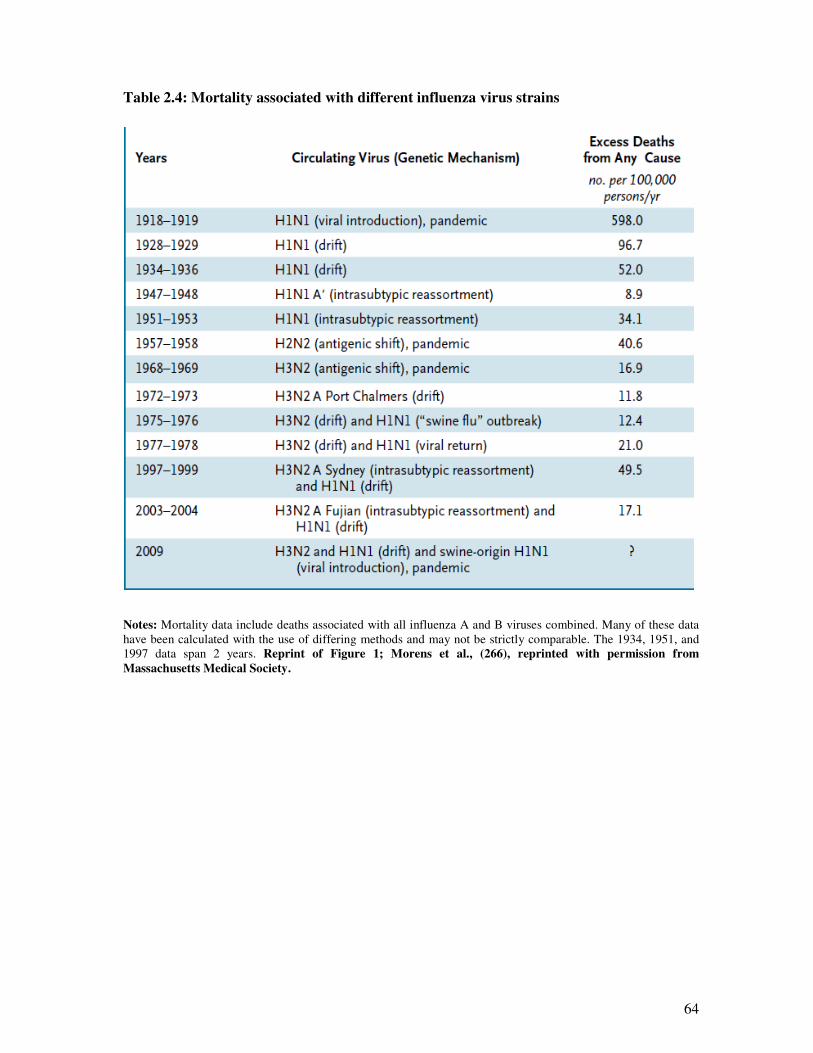
64
Table 2.4: Mortality associated with different influenza virus strains
Notes: Mortality data include deaths associated with all influenza A and B viruses combined. Many of these data
have been calculated with the use of differing methods and may not be strictly comparable. The 1934, 1951, and
1997 data span 2 years. Reprint of Figure 1; Morens et al., (266), reprinted with permission from
Massachusetts Medical Society.
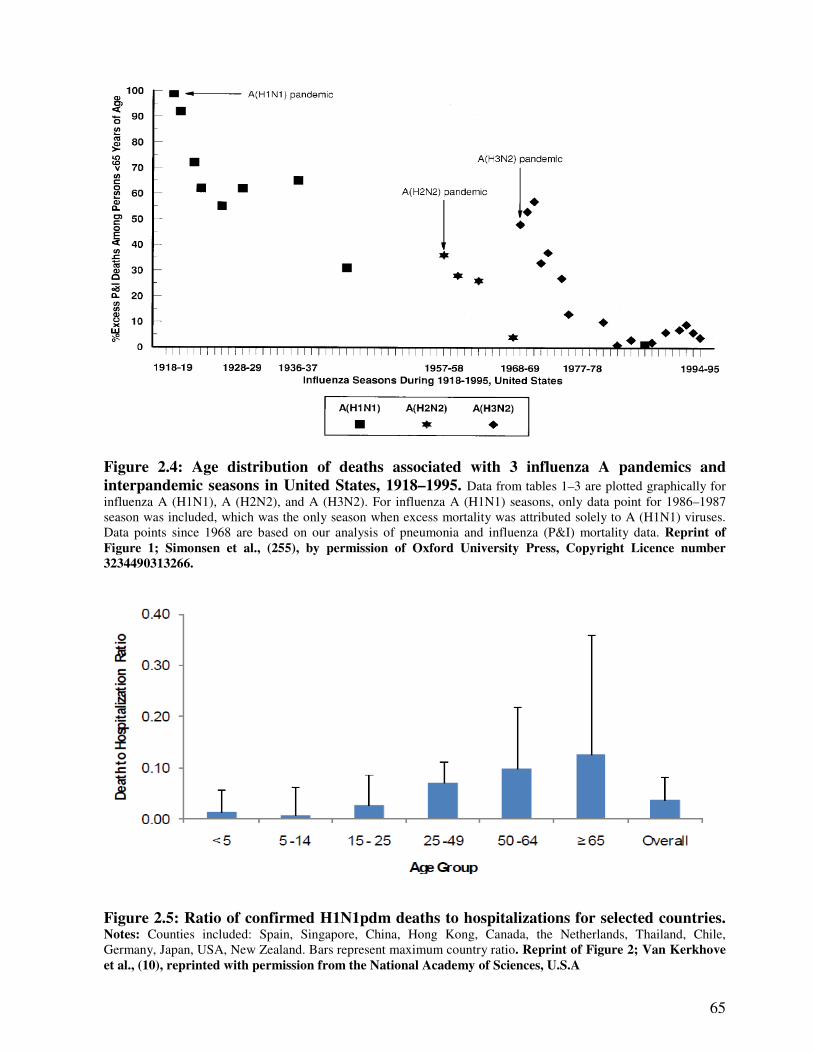
65
Figure 2.4: Age distribution of deaths associated with 3 influenza A pandemics and
interpandemic seasons in United States, 1918–1995. Data from tables 1–3 are plotted graphically for
influenza A (H1N1), A (H2N2), and A (H3N2). For influenza A (H1N1) seasons, only data point for 1986–1987
season was included, which was the only season when excess mortality was attributed solely to A (H1N1) viruses.
Data points since 1968 are based on our analysis of pneumonia and influenza (P&I) mortality data. Reprint of
Figure 1; Simonsen et al., (255), by permission of Oxford University Press, Copyright Licence number
3234490313266.
Figure 2.5: Ratio of confirmed H1N1pdm deaths to hospitalizations for selected countries. Notes: Counties included: Spain, Singapore, China, Hong Kong, Canada, the Netherlands, Thailand, Chile,
Germany, Japan, USA, New Zealand. Bars represent maximum country ratio. Reprint of Figure 2; Van Kerkhove
et al., (10), reprinted with permission from the National Academy of Sciences, U.S.A
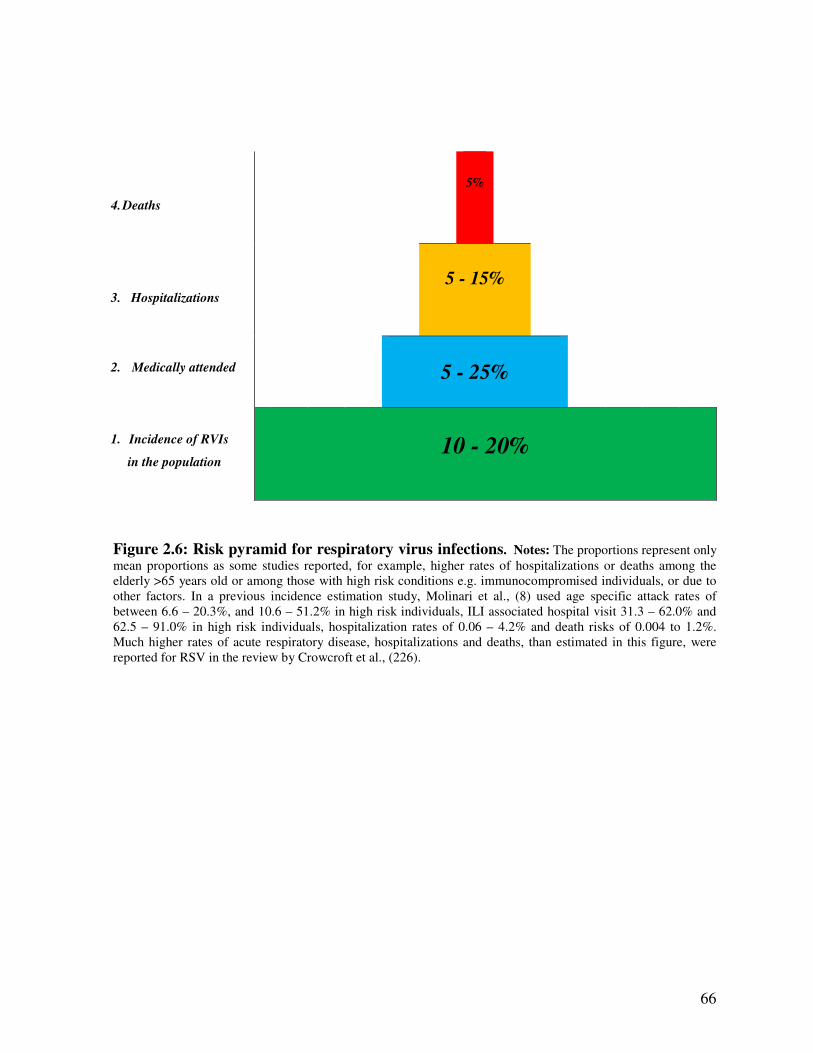
66
4. Deaths
5%
3. Hospitalizations
5 - 15%
2. Medically attended
5 - 25%
1. Incidence of RVIs
in the population
10 - 20%
Figure 2.6: Risk pyramid for respiratory virus infections. Notes: The proportions represent only
mean proportions as some studies reported, for example, higher rates of hospitalizations or deaths among the
elderly >65 years old or among those with high risk conditions e.g. immunocompromised individuals, or due to
other factors. In a previous incidence estimation study, Molinari et al., (8) used age specific attack rates of
between 6.6 – 20.3%, and 10.6 – 51.2% in high risk individuals, ILI associated hospital visit 31.3 – 62.0% and
62.5 – 91.0% in high risk individuals, hospitalization rates of 0.06 – 4.2% and death risks of 0.004 to 1.2%.
Much higher rates of acute respiratory disease, hospitalizations and deaths, than estimated in this figure, were
reported for RSV in the review by Crowcroft et al., (226).
67
2.2.4. Seasonality of viral respiratory infections
Globally, there is a clear seasonal variation in the activity of respiratory virus infections peaking in
winters in temperate regions and in rainy seasons in the tropics. Specifically, epidemiological
studies in Europe, Africa, South America, Asia, and Australia have reported consistent seasonal
variations in influenza and RSV infections, while in temperate regions e.g. the UK; RSV and
influenza A viruses peak in the winter season, in November-February, which corresponds to
March-August in the southern hemisphere (224;297-300). However while some respiratory
viruses have a predictable seasonal pattern, some researchers: Pitman et al., (7), Jansen et al.,
(301), Razanajatovo et al., (302), HPA (9) and Mak et al., (303), have reported that rhinovirus and
adenovirus infections occur year round.
In the United Kingdom, surveillance reports of influenza and other respiratory viruses over the
2010/2011 and 2011/2012 seasons (9;219) indicated that respiratory virus activity peaked in
weeks 48 to 6. The only exception was in 2009 when there was a heightened influenza like
activity in summer, weeks 26-36 – Figure 2.7 (9), coinciding with the WHO declaration of a world
pandemic of the influenza A(H1N1)pdm09. A review of the epidemiology of influenza and other
respiratory viruses in Africa (222), indicated predominance of influenza and RSV in the cooler
winter months of June to August, in southern Africa (Zambia, South Africa, and Madagascar), a
phenomenon similar to that in North America and Europe. However, seasonality was less
pronounced in the countries nearer to the equator such as Senegal. This correlated more with
constancy of temperature; in Senegal, temperature is relatively constant (at 27–32°C), whereas
rainfall varies substantially with heavy rains between July and September and relatively low in
November - May, yet respiratory virus circulation is continuous throughout these months.
Previous reviews of epidemiology of RSV by Weber et al., (223), Welliver (299) and Shek et al.,
(224) reported similar findings.
In a review of the relationship between meteorological conditions and RSV epidemiology, Yusuf
et al., (300) adds further explanation to the picture observed in the tropics. Respiratory virus
activity varies as we move from the equator towards the poles with continuous activity in places
where temperatures are very constant and rainfall is generally heavy (in the equatorial region up to
latitude 19.2o–25.8o North or south of the equator, e.g. Mexico City, Hong Kong, Dhaka in
Bangladesh, Riyadh in Saudi Arabia and Miami in USA). Beyond this point, i.e. latitudes 29.0o –
42.6o north or south, e.g. Jacksonville, Delhi, Kuwait City, Tucson, Santiago, Albuquerque,
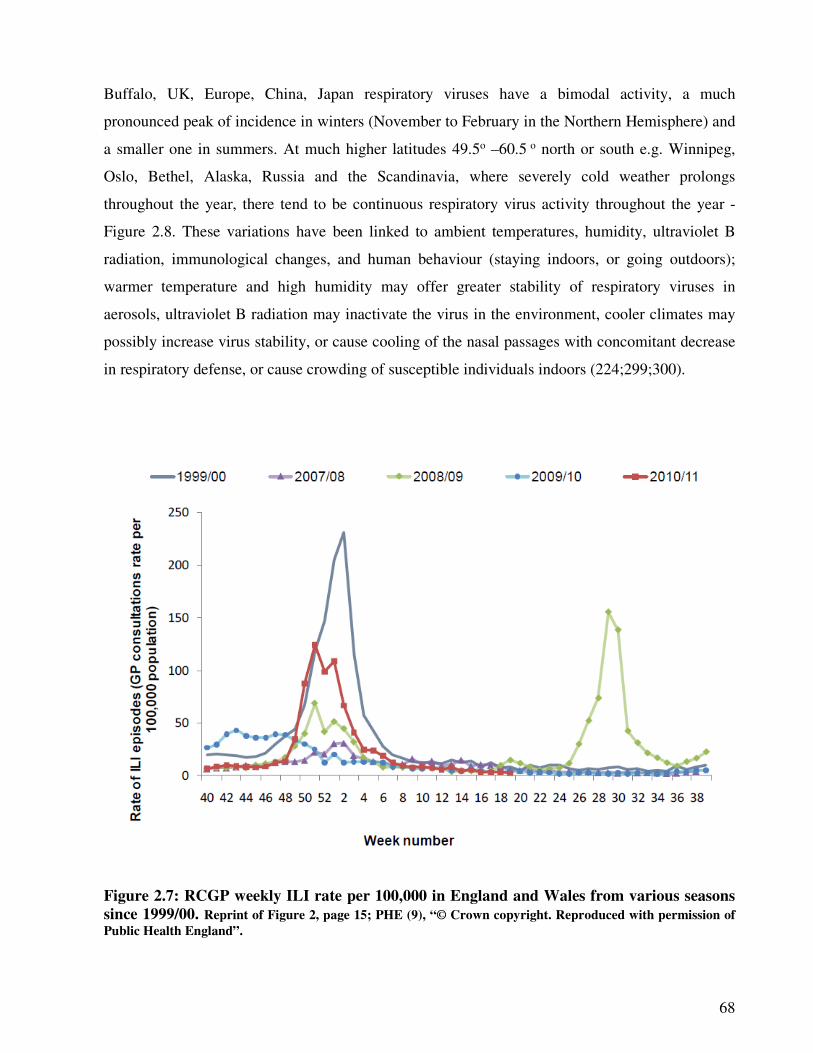
68
Buffalo, UK, Europe, China, Japan respiratory viruses have a bimodal activity, a much
pronounced peak of incidence in winters (November to February in the Northern Hemisphere) and
a smaller one in summers. At much higher latitudes 49.5o –60.5 o north or south e.g. Winnipeg,
Oslo, Bethel, Alaska, Russia and the Scandinavia, where severely cold weather prolongs
throughout the year, there tend to be continuous respiratory virus activity throughout the year -
Figure 2.8. These variations have been linked to ambient temperatures, humidity, ultraviolet B
radiation, immunological changes, and human behaviour (staying indoors, or going outdoors);
warmer temperature and high humidity may offer greater stability of respiratory viruses in
aerosols, ultraviolet B radiation may inactivate the virus in the environment, cooler climates may
possibly increase virus stability, or cause cooling of the nasal passages with concomitant decrease
in respiratory defense, or cause crowding of susceptible individuals indoors (224;299;300).
Figure 2.7: RCGP weekly ILI rate per 100,000 in England and Wales from various seasons
since 1999/00. Reprint of Figure 2, page 15; PHE (9), “© Crown copyright. Reproduced with permission of
Public Health England”.
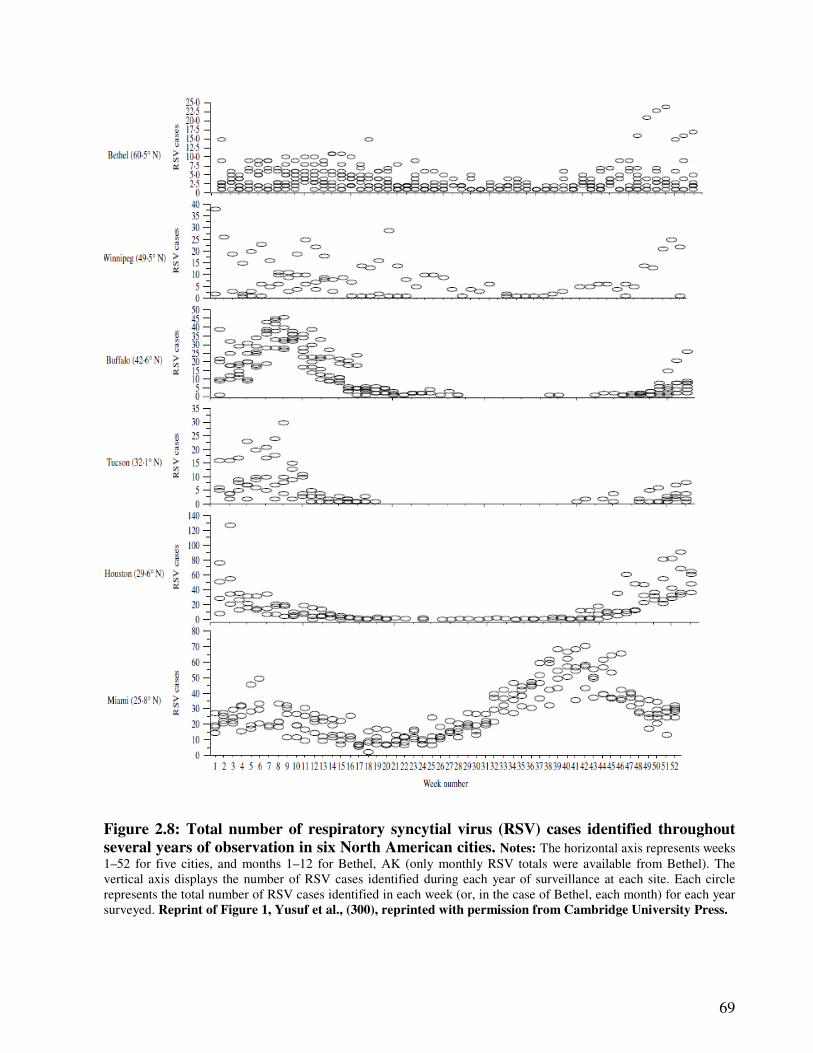
69
Figure 2.8: Total number of respiratory syncytial virus (RSV) cases identified throughout
several years of observation in six North American cities. Notes: The horizontal axis represents weeks
1–52 for five cities, and months 1–12 for Bethel, AK (only monthly RSV totals were available from Bethel). The
vertical axis displays the number of RSV cases identified during each year of surveillance at each site. Each circle
represents the total number of RSV cases identified in each week (or, in the case of Bethel, each month) for each year
surveyed. Reprint of Figure 1, Yusuf et al., (300), reprinted with permission from Cambridge University Press.
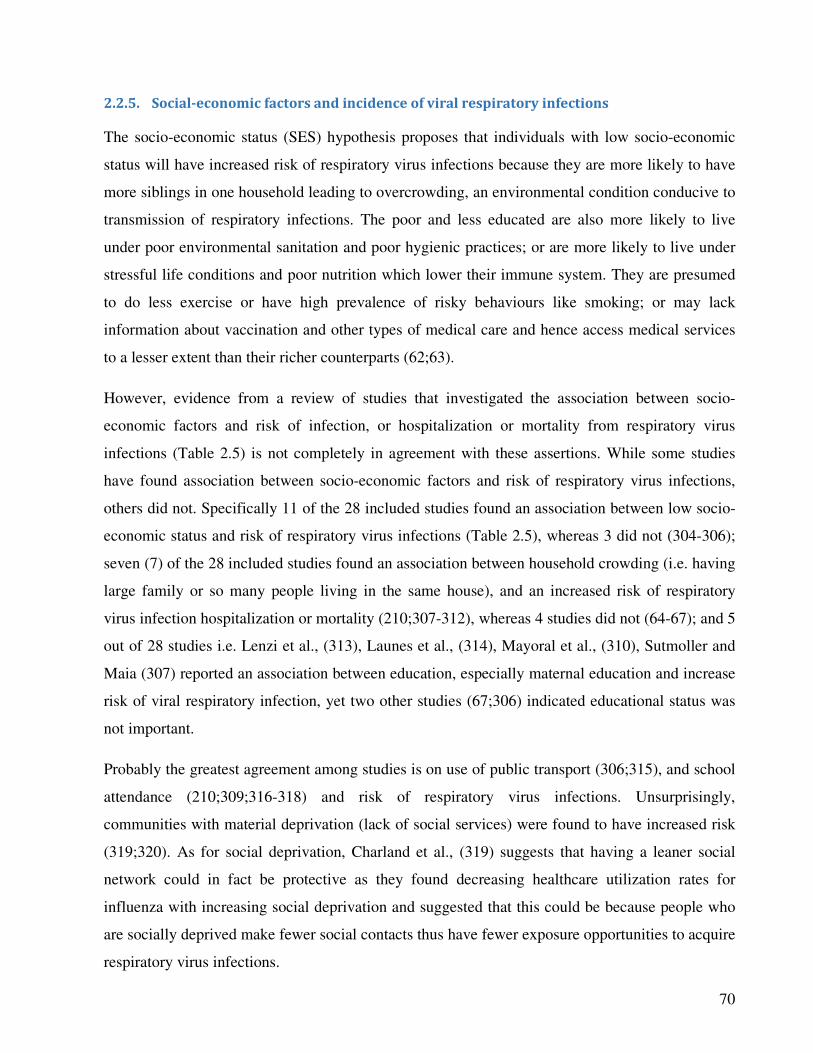
70
2.2.5. Social-economic factors and incidence of viral respiratory infections
The socio-economic status (SES) hypothesis proposes that individuals with low socio-economic
status will have increased risk of respiratory virus infections because they are more likely to have
more siblings in one household leading to overcrowding, an environmental condition conducive to
transmission of respiratory infections. The poor and less educated are also more likely to live
under poor environmental sanitation and poor hygienic practices; or are more likely to live under
stressful life conditions and poor nutrition which lower their immune system. They are presumed
to do less exercise or have high prevalence of risky behaviours like smoking; or may lack
information about vaccination and other types of medical care and hence access medical services
to a lesser extent than their richer counterparts (62;63).
However, evidence from a review of studies that investigated the association between socio-
economic factors and risk of infection, or hospitalization or mortality from respiratory virus
infections (Table 2.5) is not completely in agreement with these assertions. While some studies
have found association between socio-economic factors and risk of respiratory virus infections,
others did not. Specifically 11 of the 28 included studies found an association between low socio-
economic status and risk of respiratory virus infections (Table 2.5), whereas 3 did not (304-306);
seven (7) of the 28 included studies found an association between household crowding (i.e. having
large family or so many people living in the same house), and an increased risk of respiratory
virus infection hospitalization or mortality (210;307-312), whereas 4 studies did not (64-67); and 5
out of 28 studies i.e. Lenzi et al., (313), Launes et al., (314), Mayoral et al., (310), Sutmoller and
Maia (307) reported an association between education, especially maternal education and increase
risk of viral respiratory infection, yet two other studies (67;306) indicated educational status was
not important.
Probably the greatest agreement among studies is on use of public transport (306;315), and school
attendance (210;309;316-318) and risk of respiratory virus infections. Unsurprisingly,
communities with material deprivation (lack of social services) were found to have increased risk
(319;320). As for social deprivation, Charland et al., (319) suggests that having a leaner social
network could in fact be protective as they found decreasing healthcare utilization rates for
influenza with increasing social deprivation and suggested that this could be because people who
are socially deprived make fewer social contacts thus have fewer exposure opportunities to acquire
respiratory virus infections.
71
As for the gender distribution of infections, there has been conflicting evidence where some
studies found incidence is higher among females, especially among middle aged women
(204;209;210) – Figure 2.1, and others observed that respiratory virus infections have a slight
male preponderance especially in children (64;208), the same finding has been reported by recent
studies in Malaysia, Hong Kong, Taiwan and the USA (321-324).
Based on the inconsistencies in studies by (210;307-312) and (64-67), there is no evidence that
socio-econmic status increases risk of respiratory virus infection or severity. A possible source of
the contradictions in the findings on the association with some of the social-economic factors and
risk of respiratory virus infections could be confounded by environmental factors, such as school
attendance, involvement in an occupation that involves interaction with people and use of public
transport. For example, in Margolis et al., (312) study, the association between socio-economic
status and risk of respiratory virus infections was reduced after controlling for environmental
factors such as day care attendance. However some of the socio factors e.g. age and gender, have
been attributed to biomedical processes which influence susceptibility (24-26;28-30;325).
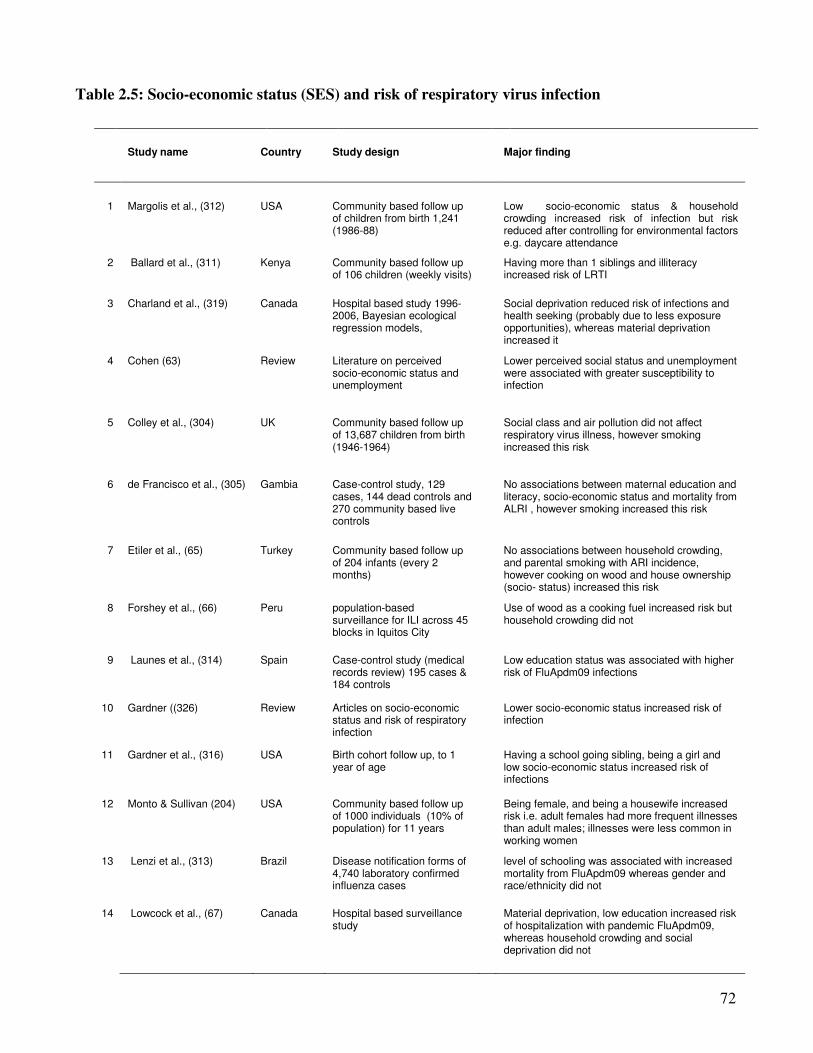
72
Table 2.5: Socio-economic status (SES) and risk of respiratory virus infection
Study name Country Study design
Major finding
1 Margolis et al., (312) USA Community based follow up of children from birth 1,241 (1986-88)
Low socio-economic status & household crowding increased risk of infection but risk reduced after controlling for environmental factors e.g. daycare attendance
2 Ballard et al., (311) Kenya Community based follow up of 106 children (weekly visits)
Having more than 1 siblings and illiteracy increased risk of LRTI
3 Charland et al., (319) Canada Hospital based study 1996-2006, Bayesian ecological regression models,
Social deprivation reduced risk of infections and health seeking (probably due to less exposure opportunities), whereas material deprivation increased it
4 Cohen (63) Review Literature on perceived socio-economic status and unemployment
Lower perceived social status and unemployment were associated with greater susceptibility to infection
5 Colley et al., (304) UK Community based follow up of 13,687 children from birth (1946-1964)
Social class and air pollution did not affect respiratory virus illness, however smoking increased this risk
6 de Francisco et al., (305) Gambia Case-control study, 129 cases, 144 dead controls and 270 community based live controls
No associations between maternal education and literacy, socio-economic status and mortality from ALRI , however smoking increased this risk
7 Etiler et al., (65) Turkey Community based follow up of 204 infants (every 2 months)
No associations between household crowding, and parental smoking with ARI incidence, however cooking on wood and house ownership (socio- status) increased this risk
8 Forshey et al., (66) Peru population-based surveillance for ILI across 45 blocks in Iquitos City
Use of wood as a cooking fuel increased risk but household crowding did not
9 Launes et al., (314) Spain Case-control study (medical records review) 195 cases & 184 controls
Low education status was associated with higher risk of FluApdm09 infections
10 Gardner ((326) Review Articles on socio-economic status and risk of respiratory infection
Lower socio-economic status increased risk of infection
11 Gardner et al., (316) USA Birth cohort follow up, to 1 year of age
Having a school going sibling, being a girl and low socio-economic status increased risk of infections
12 Monto & Sullivan (204) USA Community based follow up of 1000 individuals (10% of population) for 11 years
Being female, and being a housewife increased risk i.e. adult females had more frequent illnesses than adult males; illnesses were less common in working women
13 Lenzi et al., (313) Brazil Disease notification forms of 4,740 laboratory confirmed influenza cases
level of schooling was associated with increased mortality from FluApdm09 whereas gender and race/ethnicity did not
14 Lowcock et al., (67) Canada Hospital based surveillance study
Material deprivation, low education increased risk of hospitalization with pandemic FluApdm09, whereas household crowding and social deprivation did not
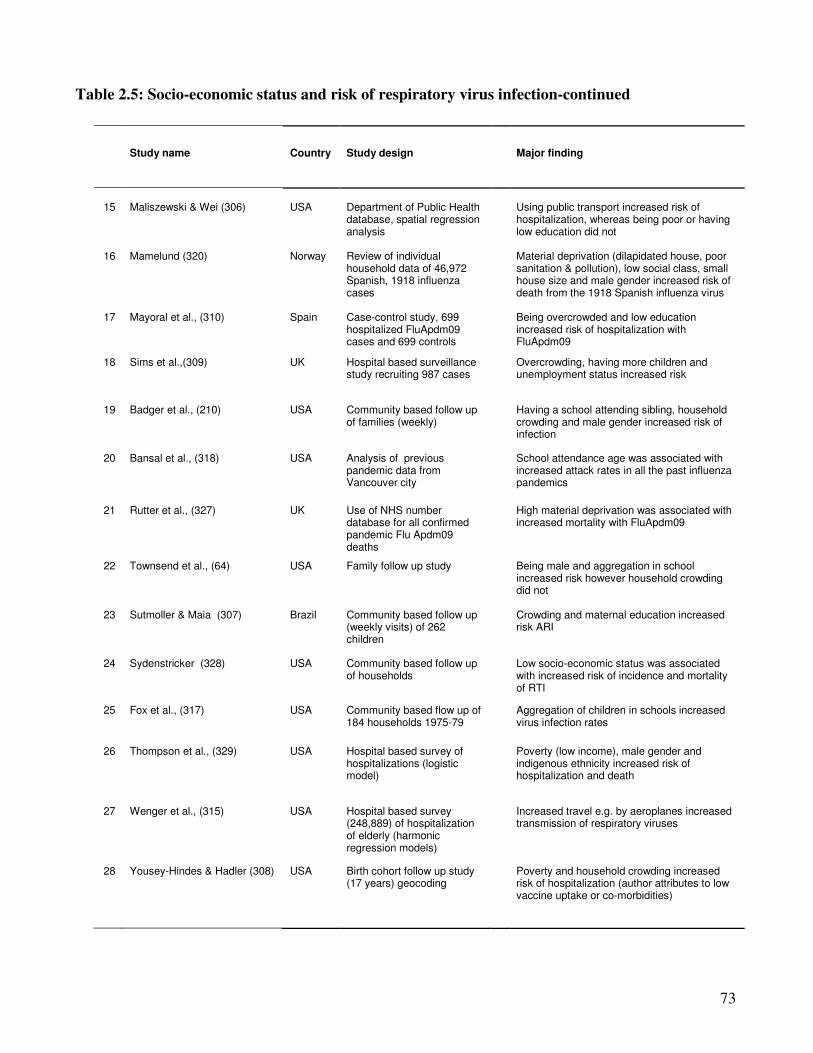
73
Table 2.5: Socio-economic status and risk of respiratory virus infection-continued
Study name Country Study design Major finding
15
Maliszewski & Wei (306)
USA
Department of Public Health database, spatial regression analysis
Using public transport increased risk of hospitalization, whereas being poor or having low education did not
16 Mamelund (320) Norway Review of individual household data of 46,972 Spanish, 1918 influenza cases
Material deprivation (dilapidated house, poor sanitation & pollution), low social class, small house size and male gender increased risk of death from the 1918 Spanish influenza virus
17 Mayoral et al., (310) Spain Case-control study, 699 hospitalized FluApdm09 cases and 699 controls
Being overcrowded and low education increased risk of hospitalization with FluApdm09
18 Sims et al.,(309) UK Hospital based surveillance study recruiting 987 cases
Overcrowding, having more children and unemployment status increased risk
19 Badger et al., (210) USA Community based follow up of families (weekly)
Having a school attending sibling, household crowding and male gender increased risk of infection
20 Bansal et al., (318) USA Analysis of previous pandemic data from Vancouver city
School attendance age was associated with increased attack rates in all the past influenza pandemics
21 Rutter et al., (327) UK Use of NHS number database for all confirmed pandemic Flu Apdm09 deaths
High material deprivation was associated with increased mortality with FluApdm09
22 Townsend et al., (64) USA Family follow up study Being male and aggregation in school increased risk however household crowding did not
23 Sutmoller & Maia (307) Brazil Community based follow up (weekly visits) of 262 children
Crowding and maternal education increased risk ARI
24 Sydenstricker (328) USA Community based follow up of households
Low socio-economic status was associated with increased risk of incidence and mortality of RTI
25 Fox et al., (317) USA Community based flow up of 184 households 1975-79
Aggregation of children in schools increased virus infection rates
26 Thompson et al., (329) USA Hospital based survey of hospitalizations (logistic model)
Poverty (low income), male gender and indigenous ethnicity increased risk of hospitalization and death
27 Wenger et al., (315) USA Hospital based survey (248,889) of hospitalization of elderly (harmonic regression models)
Increased travel e.g. by aeroplanes increased transmission of respiratory viruses
28 Yousey-Hindes & Hadler (308) USA Birth cohort follow up study (17 years) geocoding
Poverty and household crowding increased risk of hospitalization (author attributes to low vaccine uptake or co-morbidities)
74
2.3. The nature of respiratory virus disease Part C: The incidence of acute respiratory
virus infections and influenza A viruses associated hospitalizations in North
West England, 2007 – 2012
Synopsis
This is the authors’ version of the paper submitted to Eurosurveillance for publication. This
paper presents the incidence of respiratory virus infections in order to elucidate the burden of
sickness due to these viruses by examining the association of infection with hospitalization and
mortality caused by influenza like illnesses (ILI), in NW England over the study period. An earlier
version of this paper was presented as a poster to the Spring Conference of the Society for General
Microbiology held in Manchester from 25 – 28 of March 2013, poster number MA16/18.
75
2.3.1. Abstract
The incidence of acute respiratory virus infections and influenza A viruses
associated hospitalizations in North West England, 2007 – 2012
Goka E.A1, Vallely P.J 1, Mutton K.J1,2, Klapper P.E,1,2
1: Institute of Inflammation and Repair, Faculty of Medical and Human Sciences, University of Manchester,
2: Department of Clinical Virology, Central Manchester University Hospitals - NHS Foundation Trust
Correspondence author: E. A. Goka: Institute of Inflammation and Repair, Faculty of Medical and Human
Sciences, 1st Floor Stopford building, University of Manchester, Oxford Road, Manchester, M13 9PL, UK. Email:
Introduction: Incidence provides knowledge on the medical burden and aids public health
preparedness and interventions.
Methodology: We used ICD-10 J-codes, number of ILI hospitalized patients tested for
respiratory virus infection at the MMPL (January 2007-June 2012), and age-specific mid-year
population figures for NW England, to calculate ARI and influenza A associated
hospitalization using a Poisson regression.
Results: From week 13/2007-13/2012, 378,866 hospitalizations were associated with ARI and
24,607 patients hospitalized with ILI had a sample tested for a respiratory virus. ARIs
hospitalizations peaked in week 50/2008 (85.7/100,000) and week 51/2010/11 (83.1 per
100,000). Hospitalizations were higher in ≤5 children and the elderly >65 years old (annual
average 4,726.3 per 100,000 in ≤ 5 years old, 2,628.7/100,000 in 65-84 year olds,
6,167.4/100,000 in >85 years old compared to 189.51/100,000 in 25-65 year olds). Pandemic
influenza A(H1N1)pdm09 and the seasonal influenza A viruses associated hospitalizations
ranged from 192.8 to, 86.9 per 100,000 and 23.6 to 99.8 per 100,000 respectively. The role of
comorbidities, behavioral and socio-economic factors should be born in mind.
Conclusion: These results are in favour of influenza vaccination policy in children ≤5 years
and the elderly >65 years old. The results could also aid future public health preparedness.
Key words: incidence of hospitalization, acute respiratory virus infections, influenza A viruses.
76
2.3.2. Introduction
Population based studies have estimated the annual incidence of influenza like illnesses (ILIs) to lie
between 46.7 and 6,000 per 1,000 population. The Cleveland study (210), estimated an annual ILI
incidence of 6,200 per 1,000 population, whereas the Holland family study by Van Loghem (211)
put it at 4,280 per 1,000 population. In the Baltimore study, van Volkenburgh and Frost (208)
estimated that annually there are between 3,070 and 3,180 ILIs per 1,000 population.
Studies have indicated that 5-38% of all ILI develop into acute infections requiring hospitalization
or leading into death (8;234;236). In a hospital based study using the health management
organization database, Glezen et al., (216) indicated that the incidence of respiratory virus
associated acute respiratory disease lies between 120 and 290 per 1,000 population. According to
the 2011 review by Nair and others (228), globally, the annual incidence of influenza among
children ≤5 year old is 119 to 156 cases per 1,000 children (equivalent to 90 million cases). Around
20 million (13%) develop into acute lower respiratory tract infections (giving an influenza
associated ALRI incidence of 23 to 44 per 1,000 children) of which between 28,000 and 111,500
die. A review published in 2013, on global prevalence of pneumonia and its associated causes
[Walker et al., (4)], reported that in 2010-2011 the incidence of influenza was 982 (CI: 414–2699)
per 1,000 children ≤5 years old with 7.0% developing into severe disease, whereas the incidence of
influenza associated deaths was 137 (CI: 38–163) per 1,000 children.
In the UK, the European Paediatric Influenza Analysis project (EPIA) reported that between 2002
and 2008, the incidence of medically attended influenza like illnesses (ILI) in England was 581 and
409 per 100,000 for children aged ≤4 and 4-14 years respectively and influenza associated
incidence was 315 per 100,000 children (230). In 2006, Pitman et al., (7) estimated that influenza
causes between 19,000 to 50,000 hospitalizations and 18,000 – 24,800 deaths annually. Similar
estimates were reported by Fleming et al., (330) and Fleming et al., (331).
Knowledge of the incidence of diseases is important as it aids in; determination of disease burden,
planning of public health interventions (such as vaccination). It also informs on the cost-
effectiveness of disease management strategies, and on policy for public health preparedness
(8;332). However, the estimation of incidence of respiratory virus infections is difficult because the
frequency of respiratory virus infections varies considerably from year to year; in some years
epidemics occur, in others pandemics, and in yet others only minimal virus activity (224;333;333).
The variations can among other things be due to genetic changes in respiratory viruses (334),
77
changes in weather patterns, or the match between vaccine and circulating viruses or the yearly
differences in the number of people vaccinated (224;335;336). In 2009, the World Health
Organisation declared an influenza H1N1 pandemic which later spread to all parts of the world
(274). An understanding of the incidence of pandemic and the seasonal influenza A viruses
associated, and ARIs associated hospitalizations, in this period and its vicinity, could help generate
knowledge on their medical burden, and aid in future public health preparedness. However, the
incidence of ARI and influenza A viruses associated hospitalizations in the North West England,
between 2007 and 2012, is not known. This study used data obtained using ICD-10 J-codes
respiratory classifiers, on ARI associated hospitalizations, and laboratory confirmed cases of
influenza A viruses, to estimate the incidence of ARI and influenza associated hospitalization.
2.3.3. Methodology
2.3.3.1. Setting, data source and laboratory methods
The Manchester Microbiology Partnership Laboratory receives and tests respiratory virus samples
from hospitals, medical centres and surgeries located in North West England region, an area with a
population of about 7 million people (99). The data for samples tested at the MMPL contributes to;
the Health Protection Agency laboratory surveillance tool for influenza and other respiratory viruses
(DataMart), the National Health Service (NHS) National Lab Reporting Scheme (LabBase), the
Royal College of General Practitioners Weekly Returns Service (RCGP), and the HPA
complementary sentinel primary care scheme (337). We used this data to calculate the incidence of
influenza and acute respiratory virus infections (ARIs) associated hospitalizations in North West
England from January 2007 to June 2012. Details of the laboratory protocols used to test for the
various respiratory viruses have been published elsewhere (338).
2.3.3.2. Calculation of incidence and other statistical analyses
The number of ARI associated hospitalizations were calculated using the major complaint
[respiratory classifiers (J codes) of the International Conference for the Ninth Revision of the
International Classification of Diseases (ICD-10]. Incidence of ARI was calculated by dividing the
age-specific weekly number of ARIs hospitalizations by the age-specific mid-year population
figures for North West England for the years 2007 – 2011, and the 2011 census figures for
2011/2012 season, and rounded up for every 100,000 using a Poisson model. Cumulative annual
incidence rates were calculated by summing up the age-specific weekly incidence rates.
78
On the other hand, incidence of hospitalizations due to the pandemic influenza A(H1N1)pdm09
(FluApdm09) and seasonal influenza A viruses (SeasFlu A) were calculated by dividing the
expected number of hospitalizations for each respiratory virus by the age-specific population figures
and rounding up for every 100,000 population, in a Poisson regression model. To obtain the
expected number of hospitalizations, the age-specific observed number of hospitalizations caused
by each virus was divided by the total number of ILI samples, from hospitalized individuals, tested
for each virus at the MMPL and multiplied by the age-specific total number of ARIs events from
the ICD-10 J codes. Details of the ICD-10 codes and the scope they covered are provided in
Appendix I at the very end of this thesis.
The models goodness of fit, (how good the Poisson models fitted the observed frequencies of
respiratory virus infections) were assessed using the Pearson’s chi-square goodness of fit statistic
and the likelihood-ratio test and the Akaike information criterion. A difference in age distribution of
patients who visited GPs who had their samples tested for respiratory viruses, and those who were
hospitalized over the study period and the NW England general population was assessed using the
Chi-square test. Statistical differences in the incidence of ARI and influenza A viruses associated
hospitalizations by age group were evaluated by incidence rate ratios (IRR) and their 95%
confidence intervals at significance level of p = 0.05. All analyses were conducted using the
STATA software version 11 (STATACorp, College Station, TX, USA).
2.3.3.3. Ethical and research and development approval
Ethical approval for this study was granted by the Greater Manchester NHS Ethics Committee (Ref:
11/NW⁄0698) and the University of Manchester Research Ethics Office. Research and Development
approval was obtained from the Central Manchester Universities Hospitals NHS Foundation Trust
(Ref: R01835).
2.3.4. Results
2.3.4.1. Profile of patients with ARIs and the source population
Between January 2007 and June, 2012, a total of 30,975 samples were sent to the MMPL for testing
of one or more respiratory viruses of which 24,607 were from patients hospitalized with ILI. A
substantial proportion; 37.8% (11,715) were positive for one or more respiratory virus infection,
and 2,879 (24.6%) were pandemic influenza A(H1N1)pdm09, and 902 (7.7%) were seasonal
influenza A viruses.
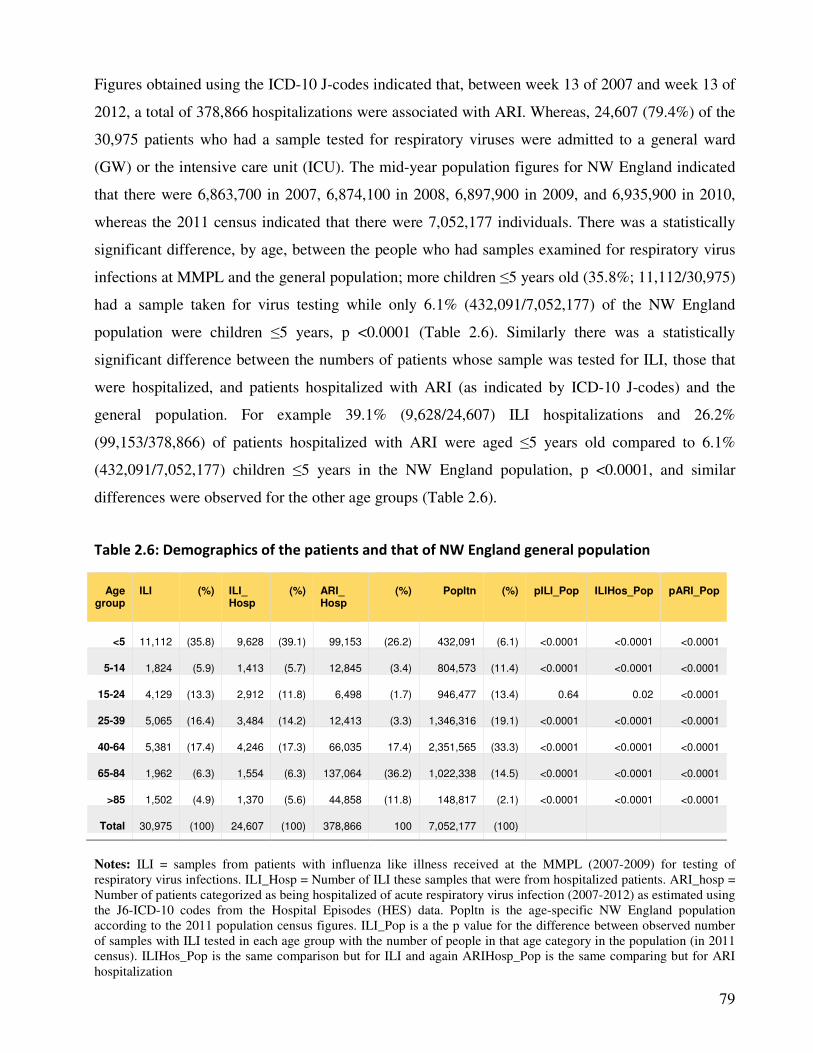
79
Figures obtained using the ICD-10 J-codes indicated that, between week 13 of 2007 and week 13 of
2012, a total of 378,866 hospitalizations were associated with ARI. Whereas, 24,607 (79.4%) of the
30,975 patients who had a sample tested for respiratory viruses were admitted to a general ward
(GW) or the intensive care unit (ICU). The mid-year population figures for NW England indicated
that there were 6,863,700 in 2007, 6,874,100 in 2008, 6,897,900 in 2009, and 6,935,900 in 2010,
whereas the 2011 census indicated that there were 7,052,177 individuals. There was a statistically
significant difference, by age, between the people who had samples examined for respiratory virus
infections at MMPL and the general population; more children ≤5 years old (35.8%; 11,112/30,975)
had a sample taken for virus testing while only 6.1% (432,091/7,052,177) of the NW England
population were children ≤5 years, p <0.0001 (Table 2.6). Similarly there was a statistically
significant difference between the numbers of patients whose sample was tested for ILI, those that
were hospitalized, and patients hospitalized with ARI (as indicated by ICD-10 J-codes) and the
general population. For example 39.1% (9,628/24,607) ILI hospitalizations and 26.2%
(99,153/378,866) of patients hospitalized with ARI were aged ≤5 years old compared to 6.1%
(432,091/7,052,177) children ≤5 years in the NW England population, p <0.0001, and similar
differences were observed for the other age groups (Table 2.6).
Table 2.6: Demographics of the patients and that of NW England general population
Age
group
ILI
(%)
ILI_ Hosp
(%)
ARI_ Hosp
(%)
Popltn
(%)
pILI_Pop
ILIHos_Pop
pARI_Pop
<5
11,112
(35.8)
9,628
(39.1)
99,153
(26.2)
432,091
(6.1)
<0.0001
<0.0001
<0.0001
5-14 1,824 (5.9) 1,413 (5.7) 12,845 (3.4) 804,573 (11.4) <0.0001 <0.0001 <0.0001
15-24 4,129 (13.3) 2,912 (11.8) 6,498 (1.7) 946,477 (13.4) 0.64 0.02 <0.0001
25-39 5,065 (16.4) 3,484 (14.2) 12,413 (3.3) 1,346,316 (19.1) <0.0001 <0.0001 <0.0001
40-64 5,381
(17.4) 4,246 (17.3) 66,035 17.4) 2,351,565 (33.3) <0.0001 <0.0001 <0.0001
65-84 1,962 (6.3) 1,554 (6.3) 137,064 (36.2) 1,022,338 (14.5) <0.0001 <0.0001 <0.0001
>85 1,502 (4.9) 1,370 (5.6) 44,858 (11.8) 148,817 (2.1) <0.0001 <0.0001 <0.0001
Total 30,975 (100) 24,607 (100) 378,866 100 7,052,177 (100)
Notes: ILI = samples from patients with influenza like illness received at the MMPL (2007-2009) for testing of
respiratory virus infections. ILI_Hosp = Number of ILI these samples that were from hospitalized patients. ARI_hosp =
Number of patients categorized as being hospitalized of acute respiratory virus infection (2007-2012) as estimated using
the J6-ICD-10 codes from the Hospital Episodes (HES) data. Popltn is the age-specific NW England population
according to the 2011 population census figures. ILI_Pop is a the p value for the difference between observed number
of samples with ILI tested in each age group with the number of people in that age category in the population (in 2011
census). ILIHos_Pop is the same comparison but for ILI and again ARIHosp_Pop is the same comparing but for ARI
hospitalization
80
2.3.4.2. Incidence of hospitalizations associated with ARI
The number of ARI hospitalizations for each year by age, and the number of individuals in the
general population (according to mid-year population figures for the specific years), is given in
supplementary table 2.3S1. During the 2007/2008 influenza season there were 69,089
hospitalizations associated with ARI and the NW England age-specific population for this period
was 6,864,100. For the other periods, the number of ARI hospitalizations were 76,157 (2008/2009),
74,678 (2009/2010), 81,370 (2010/2011) and 77,563 for 2011/2012.
We used these ARI and population figures to calculate the incidence of age-specific ARI associated
hospitalization in NW England during this period and the results are presented in Table 2.7. The
weekly incidence ranged from 85.7 (week 50, 2008) as the highest to 11.3 as the lowest with and
average, minimum and maximum weekly rates of: 37.1 (21.1 – 64.4), 40.8 (21.8 – 85.7), 39.1 (15.4
– 64.9), 42.1 (11.3 – 83.2) and 41.2 (25.5 – 68.9) for the successive years. For each year, incidence
of ARI associated hospitalization peaked from week 39 to week 12 (Figure 2.9 A & B), and the
2008/2009 year had the highest peak followed by 2010/11, this was before the pandemic influenza
A(H1N1)pdm09 virus had emerged.
For age-specific rates, the incidence of ARI hospitalizations was higher among children ≤5 years
old and the elderly ≥65 years old compared to that for patients aged 4 to 64 years old (Table 2.7).
For example, between week 13 of 2007 and week 12 of 2008, there were 4,588.5 ARI associated
hospitalizations per 100,000 children ≤5 years old and 1,969.9 per 100,000 for patients 65-84 years
old and 5,472.8 per 100,000 among the elderly ≥85 years old. In a Poisson model, the risk of ARI
hospitalizations among children ≤5 years old, patients 65-84 years old and patients ≥85 years old
was significantly higher than that of patients 25-39 year old; For the 2007/2008 year: rate ratio -
RR: 39.0, 95% CI: 32.5 – 46.8, p <0.0001, RR: 16.7, 95% CI: 13.9 – 20.2, p = <0.0001 and RR:
46.5, 95% CI: 38.7 – 55.8, p = <0.0001 respectively. Similar results were obtained for the
2008/2009, 2009/2010, 2010/2011 and 2011/2012 influenza seasons.
For the 5 seasons, the average age-specific annual incidence of ARI associated hospitalizations was
4,726.3 per 100,000 in children ≤5 years old, 2,628.7 per 100,000 in patients ≥65 -84 years old and
6,167.4 per 100,000 individuals aged ≥85 years old compared to rates of 322.3 per 100,000 for
those aged 5-14 years old, 133.7/100,000 for 15-24 year olds, 189.5/100,000 among 25-39 year
olds, and 503.0 per 100,000 individuals aged 40-64 year old (and the rate ratios were also
statistically significant – data not shown).
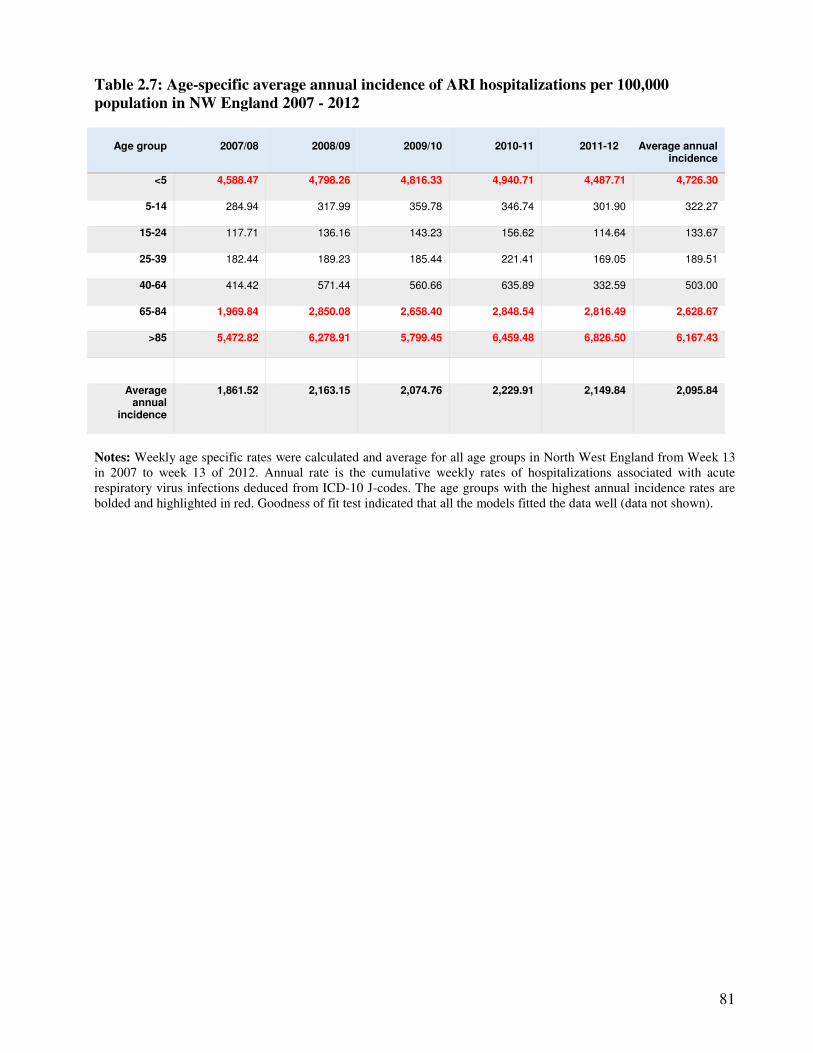
81
Table 2.7: Age-specific average annual incidence of ARI hospitalizations per 100,000
population in NW England 2007 - 2012
Age group
2007/08
2008/09
2009/10
2010-11
2011-12
Average annual
incidence
<5 4,588.47 4,798.26 4,816.33 4,940.71 4,487.71 4,726.30
5-14 284.94 317.99 359.78 346.74 301.90 322.27
15-24 117.71 136.16 143.23 156.62 114.64 133.67
25-39 182.44 189.23 185.44 221.41 169.05 189.51
40-64 414.42 571.44 560.66 635.89 332.59 503.00
65-84 1,969.84 2,850.08 2,658.40 2,848.54 2,816.49 2,628.67
>85 5,472.82 6,278.91 5,799.45 6,459.48 6,826.50 6,167.43
Average annual
incidence
1,861.52 2,163.15 2,074.76 2,229.91 2,149.84 2,095.84
Notes: Weekly age specific rates were calculated and average for all age groups in North West England from Week 13
in 2007 to week 13 of 2012. Annual rate is the cumulative weekly rates of hospitalizations associated with acute
respiratory virus infections deduced from ICD-10 J-codes. The age groups with the highest annual incidence rates are
bolded and highlighted in red. Goodness of fit test indicated that all the models fitted the data well (data not shown).
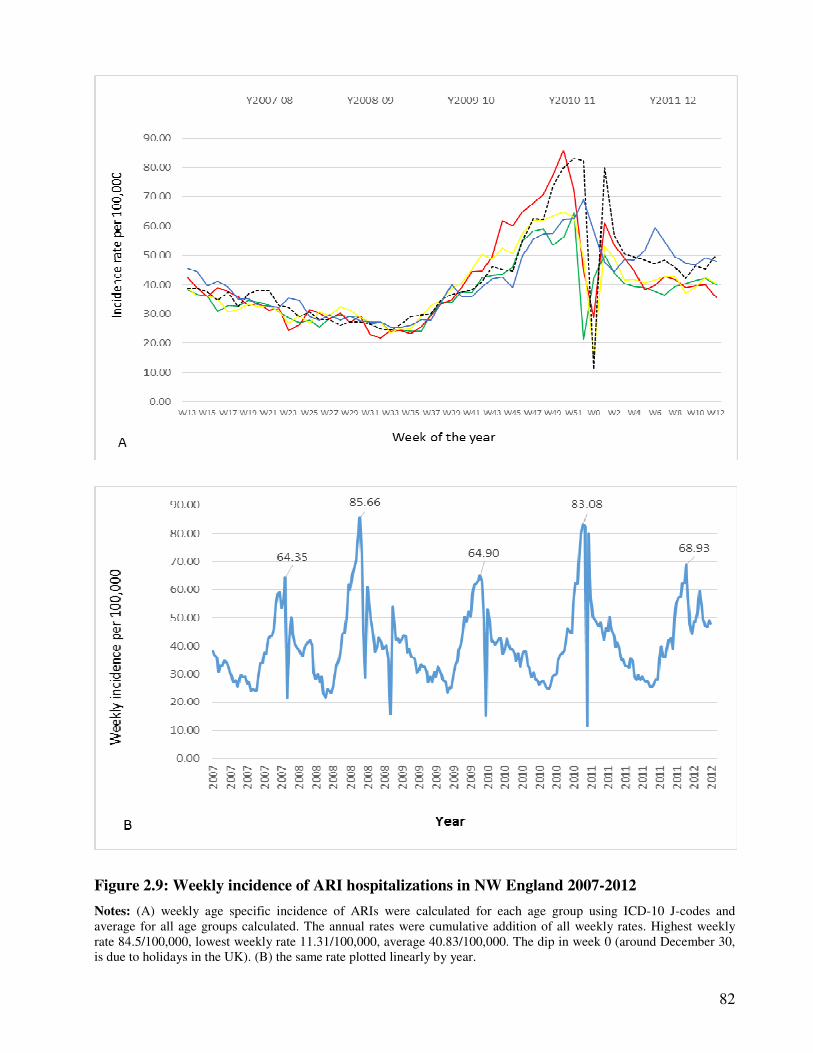
82
Figure 2.9: Weekly incidence of ARI hospitalizations in NW England 2007-2012
Notes: (A) weekly age specific incidence of ARIs were calculated for each age group using ICD-10 J-codes and
average for all age groups calculated. The annual rates were cumulative addition of all weekly rates. Highest weekly
rate 84.5/100,000, lowest weekly rate 11.31/100,000, average 40.83/100,000. The dip in week 0 (around December 30,
is due to holidays in the UK). (B) the same rate plotted linearly by year.
83
2.3.4.3. Age-specific average annual incidence of hospitalization associated with the
pandemic and seasonal influenza A viruses
Sixteen thousand five hundred and seventy seven (16,577) of patients whose samples were tested
for the pandemic influenza A(H1N1)pdm09 virus were admitted to a GW or the ICU. A positive
diagnosis with FluApdm09 was made in 12.7% (2,106) of these. Conversely 21,129 patients who
were tested for seasonal influenza A virus were admitted to a GW or ICU and the virus was
identified in 3.7% (788) of them. Data from the ICD-10 J-codes showed that over the study period
there were 378,866 ARI associated hospitalizations.
In a Poisson regression model, for the 3 years the pandemic virus was in circulation, the average
annual incidence of Flu Apdm09 associated hospitalizations were 192.8 per 100,000 population in
the 2009/10 season, 86.9/100,000 in the 2010/11 and 89.2 per 100,000 in 2011/12 season. Similar to
ARI hospitalizations, the pandemic influenza A(H1N1)pdm09 virus associated hospitalizations
were higher among children ≤5 years old and the elderly ≥65 years old (incidence rate IR: 301.4 per
100,000 in children ≤5 years, and 108.1 and 300.6 per 100,000 population in 65-84 and >85 year
olds respectively – Table 2.8). The seasonal influenza A viruses caused substantial burden of
hospitalization, with annual rates ranging from 23.6 to 99.8 per 100,000 over the 5 seasons 2007 –
2012 – Table 2.8. Age-specific rates were also higher among children ≤5 years and the elderly ≥65
years old (105.7, 56.6 and 116.6 per 100,000 respectively).
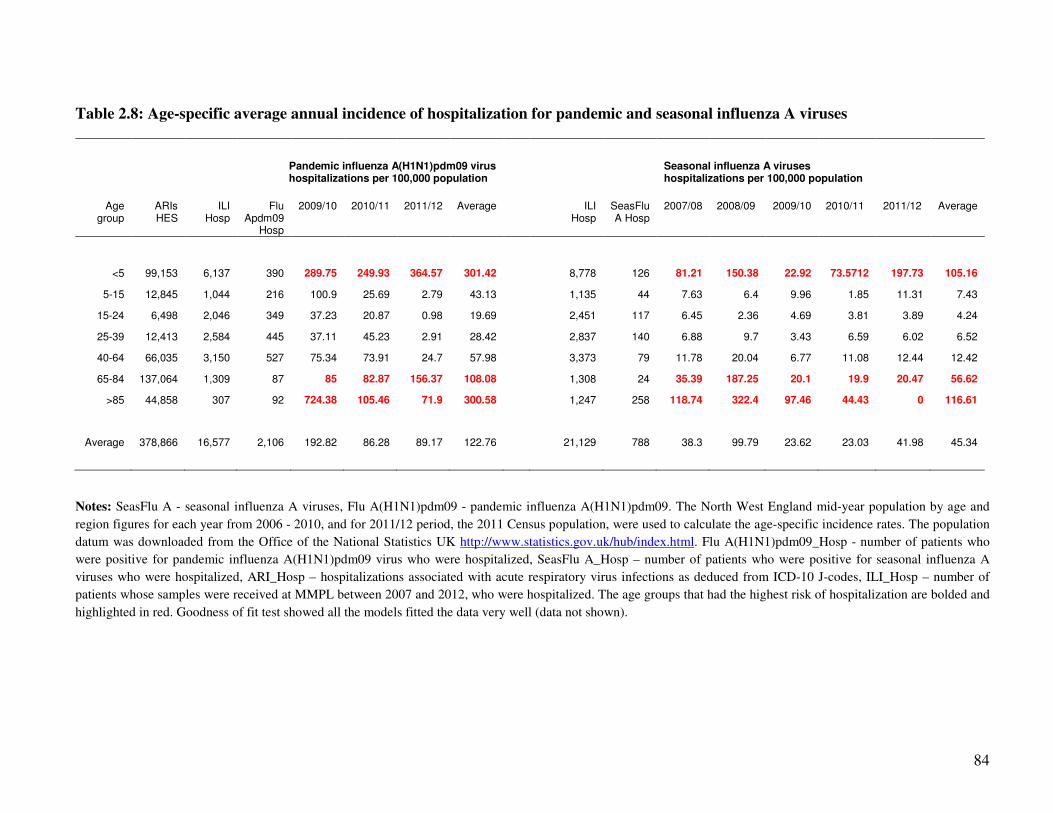
84
Table 2.8: Age-specific average annual incidence of hospitalization for pandemic and seasonal influenza A viruses
Pandemic influenza A(H1N1)pdm09 virus hospitalizations per 100,000 population
Seasonal influenza A viruses hospitalizations per 100,000 population
Age group
ARIs HES
ILI Hosp
Flu Apdm09
Hosp
2009/10 2010/11 2011/12 Average ILI Hosp
SeasFlu A Hosp
2007/08 2008/09 2009/10 2010/11 2011/12 Average
<5 99,153 6,137 390 289.75 249.93 364.57 301.42 8,778 126 81.21 150.38 22.92 73.5712 197.73 105.16
5-15 12,845 1,044 216 100.9 25.69 2.79 43.13 1,135 44 7.63 6.4 9.96 1.85 11.31 7.43
15-24 6,498 2,046 349 37.23 20.87 0.98 19.69 2,451 117 6.45 2.36 4.69 3.81 3.89 4.24
25-39 12,413 2,584 445 37.11 45.23 2.91 28.42 2,837 140 6.88 9.7 3.43 6.59 6.02 6.52
40-64 66,035 3,150 527 75.34 73.91 24.7 57.98 3,373 79 11.78 20.04 6.77 11.08 12.44 12.42
65-84 137,064 1,309 87 85 82.87 156.37 108.08 1,308 24 35.39 187.25 20.1 19.9 20.47 56.62
>85 44,858 307 92 724.38 105.46 71.9 300.58 1,247 258 118.74 322.4 97.46 44.43 0 116.61
Average 378,866 16,577 2,106 192.82 86.28 89.17 122.76 21,129 788 38.3 99.79 23.62 23.03 41.98 45.34
Notes: SeasFlu A - seasonal influenza A viruses, Flu A(H1N1)pdm09 - pandemic influenza A(H1N1)pdm09. The North West England mid-year population by age and
region figures for each year from 2006 - 2010, and for 2011/12 period, the 2011 Census population, were used to calculate the age-specific incidence rates. The population
datum was downloaded from the Office of the National Statistics UK http://www.statistics.gov.uk/hub/index.html. Flu A(H1N1)pdm09_Hosp - number of patients who
were positive for pandemic influenza A(H1N1)pdm09 virus who were hospitalized, SeasFlu A_Hosp – number of patients who were positive for seasonal influenza A
viruses who were hospitalized, ARI_Hosp – hospitalizations associated with acute respiratory virus infections as deduced from ICD-10 J-codes, ILI_Hosp – number of
patients whose samples were received at MMPL between 2007 and 2012, who were hospitalized. The age groups that had the highest risk of hospitalization are bolded and
highlighted in red. Goodness of fit test showed all the models fitted the data very well (data not shown).
85
2.3.5. Discussion and conclusion
During the study period, the highest weekly incidence of hospitalizations associated with ARIs
occurred in 2008/2009 and 2010/2011 seasons; 85.7 per 100,000 and 83.1 per 100,000
respectively. The 2008/2009 peak was in week 50 of 2008. The World Health organization
declared an influenza A(H1N1) pandemic in April, 2009 (274), therefore the pandemic virus had
not yet emerged by then. The peak could probably be due to seasonal influenza A viruses or other
respiratory viruses such as respiratory syncytial virus, human parainfluenza viruses etc.
In this study, for the entire study period, the average age-specific annual incidence of ARI
associated hospitalization ranged from 4,726.3 per 100,000 in children ≤5 years old, 322.3 per
100,000 for those aged 5-14 years old, 133.7/100,000 in 15-24 year olds, 189.5/100,000 in 25-39
year olds, 503.0 per 100,000 in 40-64 year old, 2,628.7 per 100,000 in patients 65 -84 years old
and 6,167.4 per 100,000 in the elderly >85 years old (with the 2008/09 and 2010/11 seasons
having the highest annual rates 2,163.2/100,000 and 2,229.9/100,000 respectively.
Hospitalizations were higher in ≤5 year old children and the elderly >65 year old. Our Results
agree with other studies that have also reported higher hospitalizations among these age groups.
The 2004 PRIDE study in Germany, by Forster et al., (260) reported an annual LRTI associated
hospitalization of between 2,843 and 3,042 per 100,000 population among children <3 years old.
In 2012, Stockman et al., (292) found LRTIs caused around 2,790 hospitalizations per 100,000
children <5 years in the USA. Two hospital based studies published in 2009 and 2012 from Kenya
reported rates of 1,912 to 5,528 per 100,000 population among children and 670/100,000 among
people of all ages (232;289). Two daces ago, Glezen et al., (216), using the hospital and health
care firm database in the USA, reported rates of 114 to 127 per 100,000 population.
We also investigated hospitalizations associated with the pandemic influenza A(H1N1)pdm09 and
the seasonal influenza A viruses. Flu Apdm09 associated hospitalizations ranged from 192.8 to,
86.9 per 100,000 population whereas the seasonal influenza viruses 23.6 to 99.8 per 100,000.
Again these findings are in agreement with previous studies; Nicholson et al., (251), Schanzer et
al., (249) and Schanzer et al., (250) in Canada. Specifically, Nicholson (251) reported that
influenza, RSV and metapneumovirus would cause around 517, 144 and 126 hospitalizations per
100,000 population respectively. Whereas Schanzer et al., (2006) and Schanzer et al., (2008)
indicated that between 1994 and 2000, influenza-associated hospitalizations ranged from 18-200
per 100,000 population. The largest burden was in infants 6 to 11 months of age (200 per
86
100,000), 270–340 per 100,000 in adults 65 to 69 years old, compared to 65/100, 000 among
persons aged 20 years or older.
A weakness of this study is that we used the number of hospitalized patients who had their
samples sent to the laboratory, for identification of respiratory virus infections, to estimate the
expected number of hospitalizations with specific respiratory viruses. However, not all patients
who consult medical services with respiratory illness have samples taken for identification of
respiratory viruses. This might lead to a general underestimation of the incidence of influenza A
viruses associated hospitalizations during the study period. In addition, the age profiles of patients
included in this study significantly differed with that of the general population; 35.8%
(11,112/30,975) of samples received at the MMPL between 2007 and 2012 were from children ≤5
years old. Similarly 26.2% (99,153/378,866) of patients identified using the ICD-10 J-codes to
have been hospitalized with ARIs were children and majority of patient’s positive for any
respiratory virus (51.8%; 6,065/11,715) were ≤5 years old, yet according to the 2011 population
census figures, children ≤5 years old made up only 6.1% of the general population. This difference
might be because, due to concern for their children’s health, parents were more likely to take their
children’s to hospital, leading to more children being registered in the medical records. It could
also be due to selection or diagnostic bias (i.e. doctors were preferentially sending samples from <
5 year old children). However, as indicated above, our results compare well with previous studies,
which have also shown high attack and hospitalization rates of ILI in children. It is therefore very
unlikely that this result was due to selection or diagnosis bias.
Lastly, the role of socio-economic status in the incidence of ILI and hospitalizations has been
extensively covered in literature (10;15;23;62;63) although the impact of the same is not very
clear. While some researchers argue that the socially disadvantaged are more likely; to have more
respiratory virus infections (62;63), and more severe outcome (10;15), others found no such
evidence (64-67). Environmental, nutritional, and behavioral factors such as; overcrowded
household, poor nutrition, high prevalence of risky behaviours like smoking, ignorance about
vaccination and other types of medical care, prematurity and low birthweight have also been
identified as risk factors could affect the epidemiology of respiratory viruses (22;23;53). Also
chronic conditions such as chronic respiratory disease e.g. asthma, chronic heart disease, chronic
liver disease, chronic neurological disease, chronic renal disease influence severe disease (9-13)
However, we did not have this information and these factors were not controlled for in this study.
Bias due to the same should be noted when interpreting our results.
87
Despite any shortfall, this study has found that ARIs and influenza A viruses caused significant
burden of hospitalization in NW England between 2007 and 2012. Children ≤5 years and the
elderly >65 years old bore the highest brunt of this burden. This result supports the idea of
vaccinating children ≤5 years and the elderly >65 years old against influenza virus infections. Our
study spanned over a period where there was a pandemic of influenza A(H1N1)pdm09 virus.
Therefore our incidence estimates could in future be useful for the estimation of the expected
numbers of infections, hospitalizations, hence help with public health preparedness in form of
stock piling of vaccines, drugs, and in the organisation of hospital beds.
Funding: This work was supported by the University of Manchester.
Acknowledgements: The authors would like to acknowledge the University of Manchester, the
Manchester Academic Health Science Centre, the Central Manchester University Hospitals NHS
Foundation Trust and staff, and the Public Health England, for their support in this research, and
for the data respectively.
Conflict of interest: All authors, no conflict of interest.
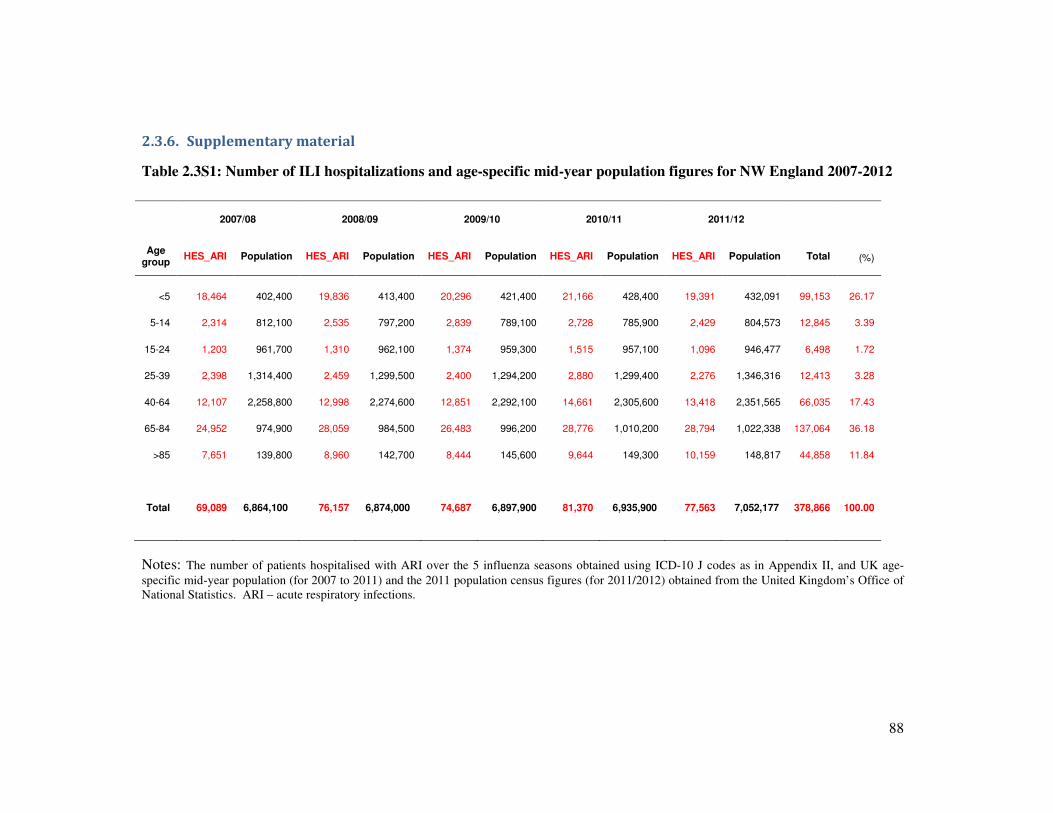
88
2.3.6. Supplementary material
Table 2.3S1: Number of ILI hospitalizations and age-specific mid-year population figures for NW England 2007-2012
2007/08 2008/09 2009/10 2010/11 2011/12
Age group
HES_ARI Population HES_ARI Population HES_ARI Population HES_ARI Population HES_ARI Population Total (%)
<5 18,464 402,400
19,836 413,400 20,296 421,400 21,166 428,400 19,391 432,091 99,153 26.17
5-14 2,314 812,100 2,535 797,200 2,839 789,100 2,728 785,900 2,429 804,573 12,845 3.39
15-24 1,203 961,700 1,310 962,100 1,374 959,300 1,515 957,100 1,096 946,477 6,498 1.72
25-39 2,398 1,314,400 2,459 1,299,500 2,400 1,294,200 2,880 1,299,400 2,276 1,346,316 12,413 3.28
40-64 12,107 2,258,800
12,998 2,274,600 12,851 2,292,100 14,661 2,305,600 13,418 2,351,565 66,035 17.43
65-84 24,952 974,900
28,059 984,500 26,483 996,200 28,776 1,010,200 28,794 1,022,338 137,064 36.18
>85 7,651 139,800 8,960 142,700 8,444 145,600 9,644 149,300 10,159 148,817 44,858 11.84
Total 69,089 6,864,100
76,157 6,874,000 74,687 6,897,900 81,370 6,935,900 77,563 7,052,177 378,866 100.00
Notes: The number of patients hospitalised with ARI over the 5 influenza seasons obtained using ICD-10 J codes as in Appendix II, and UK age-
specific mid-year population (for 2007 to 2011) and the 2011 population census figures (for 2011/2012) obtained from the United Kingdom’s Office of
National Statistics. ARI – acute respiratory infections.
89
2.4. The nature of respiratory virus disease Part D: Virology of respiratory virus
infections
Synopsis
This subsection will presents the virology of all the respiratory viruses studied in this thesis i.e.
influenza A and B virus, respiratory syncytial virus (RSV), rhinovirus (RV), adenovirus (AdV),
human metapneumovirus (hMPV), human parainfluenza viruses types 1 to 4 (hPIV1-4), human
bocavirus (hBoV), and human coronaviruses (hCoV). The rationale for presenting these is to lay a
background to the research, to provide information that will help readers to understand the nature
of the respiratory viruses described in this thesis.
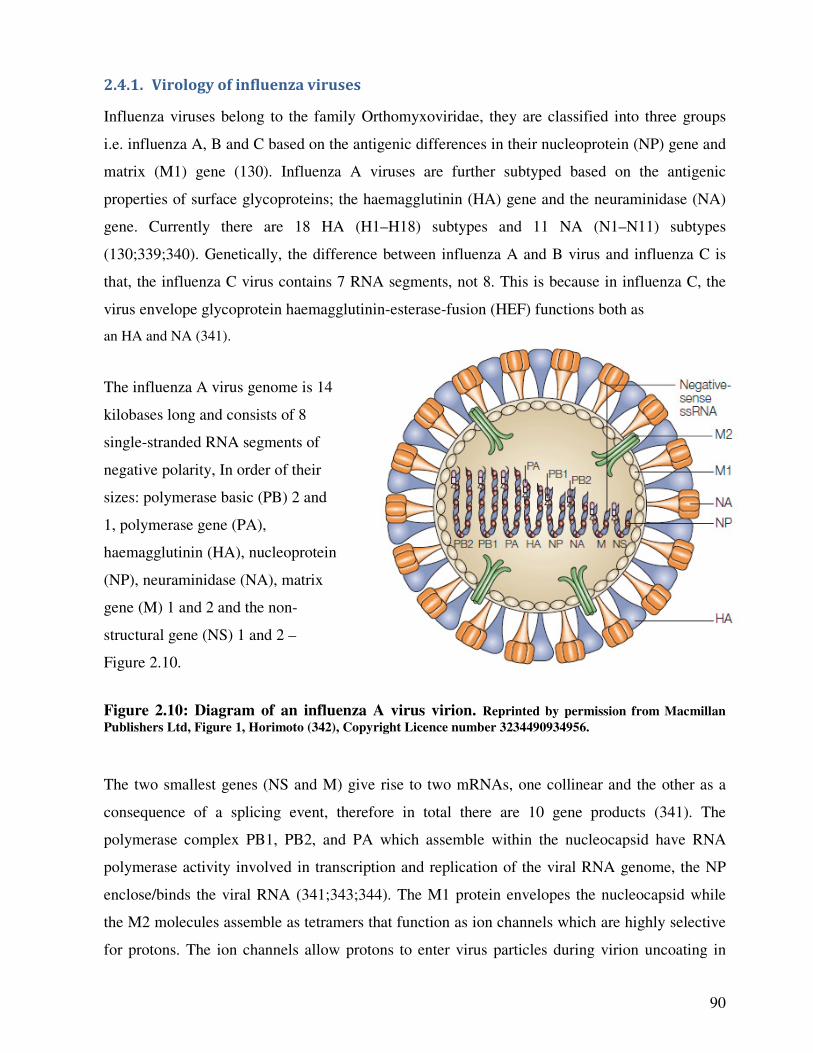
90
2.4.1. Virology of influenza viruses
Influenza viruses belong to the family Orthomyxoviridae, they are classified into three groups
i.e. influenza A, B and C based on the antigenic differences in their nucleoprotein (NP) gene and
matrix (M1) gene (130). Influenza A viruses are further subtyped based on the antigenic
properties of surface glycoproteins; the haemagglutinin (HA) gene and the neuraminidase (NA)
gene. Currently there are 18 HA (H1–H18) subtypes and 11 NA (N1–N11) subtypes
(130;339;340). Genetically, the difference between influenza A and B virus and influenza C is
that, the influenza C virus contains 7 RNA segments, not 8. This is because in influenza C, the
virus envelope glycoprotein haemagglutinin-esterase-fusion (HEF) functions both as
an HA and NA (341).
The influenza A virus genome is 14
kilobases long and consists of 8
single-stranded RNA segments of
negative polarity, In order of their
sizes: polymerase basic (PB) 2 and
1, polymerase gene (PA),
haemagglutinin (HA), nucleoprotein
(NP), neuraminidase (NA), matrix
gene (M) 1 and 2 and the non-
structural gene (NS) 1 and 2 –
Figure 2.10.
Figure 2.10: Diagram of an influenza A virus virion. Reprinted by permission from Macmillan
Publishers Ltd, Figure 1, Horimoto (342), Copyright Licence number 3234490934956.
The two smallest genes (NS and M) give rise to two mRNAs, one collinear and the other as a
consequence of a splicing event, therefore in total there are 10 gene products (341). The
polymerase complex PB1, PB2, and PA which assemble within the nucleocapsid have RNA
polymerase activity involved in transcription and replication of the viral RNA genome, the NP
enclose/binds the viral RNA (341;343;344). The M1 protein envelopes the nucleocapsid while
the M2 molecules assemble as tetramers that function as ion channels which are highly selective
for protons. The ion channels allow protons to enter virus particles during virion uncoating in
91
endosomes, and the M2 channel also causes the equilibration of pH between the acidic lumen of
the trans-Golgi network and the cytoplasm (345).
The virus also contains two non-structural proteins, the collinear NS1 and the spliced NS2
messenger RNA (mRNAs) of the NS gene. The NS1 and NS2 proteins have a regulatory
function including inhibition of cellular interferon response, inhibition of the export of poly-A
containing mRNA molecules from the nucleus and inhibition of splicing of pre-mRNA to
promote the synthesis of viral components in the infected cell (346). NS2 is a small molecule
with a molecular weight of 11,000 bound to M1 protein. Its function is believed to facilitate the
transport of newly synthesized ribonucleoproteins from the nucleus to the cytoplasm to
accelerate virus production (347).
The HA and NA genes are transmembrane glycoproteins, which form the surface of the virus
particles (348;349). The haemagglutinin is the principal antigen on the viral surface and is
responsible for viral binding to host receptors enabling entry into the host cell through
endocytosis and subsequent membrane fusion. Important residues on the HA gene include the
binding sites, glycosylation sites, major histocompatibility class I (MHC-I) epitope residues, and
antibody binding sites (348). The NA is an enzyme which cleaves α-ketosidic linkage between
the haemagglutinin and sialic acid residue on the surface of the infected cells. This prevents virus
aggregation, on the surface of infected cells, and releases the progeny virions from the surface of
infected cells enabling them to infect new cells hence aids in virus replication (350;351).
2.4.1.1. Host range of influenza viruses
Influenza B and C viruses are primarily human viruses and rarely infect animal host’s e.g. seals,
pigs, and dogs. On the other hand, influenza A viruses primary host are water fowls
(130;352;353). Figure 2.11 displays the host range for different HA and NA subtypes. Water
fowls, are infected with all the HA and NA subtypes; humans are infected by H1 to H3, H5, H7,
H9 and N1 and N2 subtypes; domesticated poultry can be infected by H4, 5, 7, 9, 10 and N1 – 9;
pigs may be infected with H1, 3 and N1 and 2 and are thought to be the mixing vessels, re-
assorting primarily human and avian viruses and enabling them to cross the species burrier
(130;352-354). Only a few HA and NA subtypes infect other hosts such as cattle, horses, seals,
and cats (Figure 2.11).
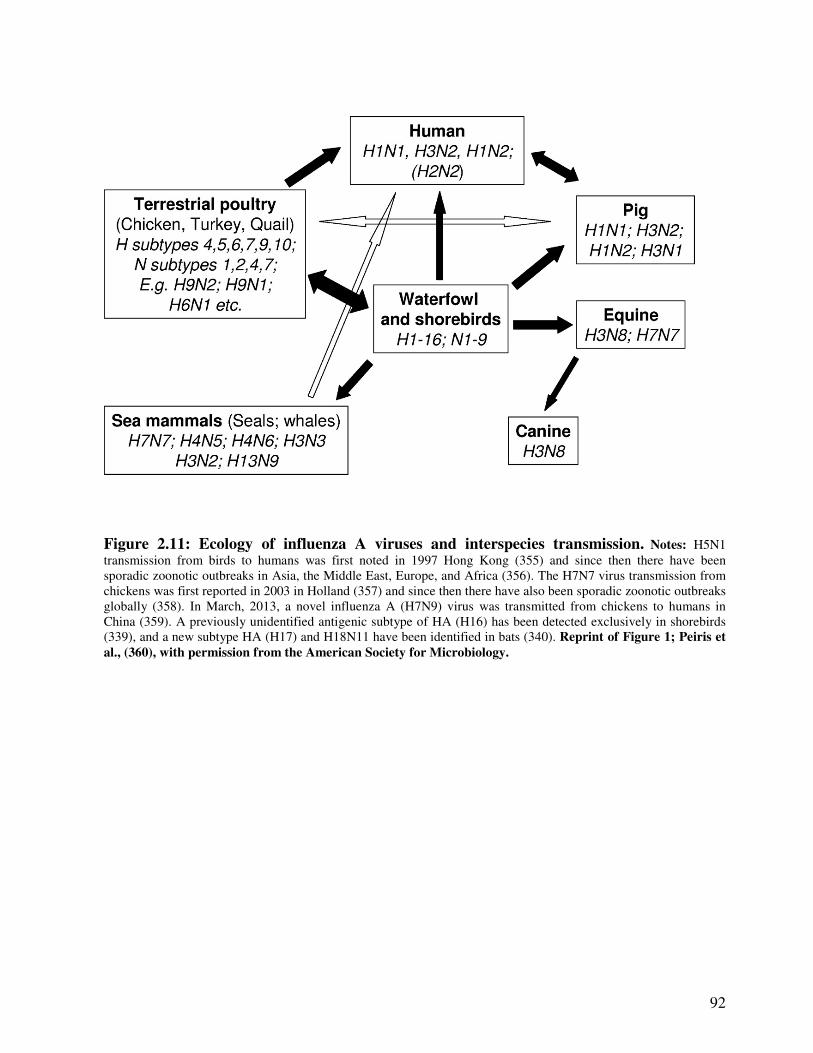
92
Figure 2.11: Ecology of influenza A viruses and interspecies transmission. Notes: H5N1
transmission from birds to humans was first noted in 1997 Hong Kong (355) and since then there have been
sporadic zoonotic outbreaks in Asia, the Middle East, Europe, and Africa (356). The H7N7 virus transmission from
chickens was first reported in 2003 in Holland (357) and since then there have also been sporadic zoonotic outbreaks
globally (358). In March, 2013, a novel influenza A (H7N9) virus was transmitted from chickens to humans in
China (359). A previously unidentified antigenic subtype of HA (H16) has been detected exclusively in shorebirds
(339), and a new subtype HA (H17) and H18N11 have been identified in bats (340). Reprint of Figure 1; Peiris et
al., (360), with permission from the American Society for Microbiology.
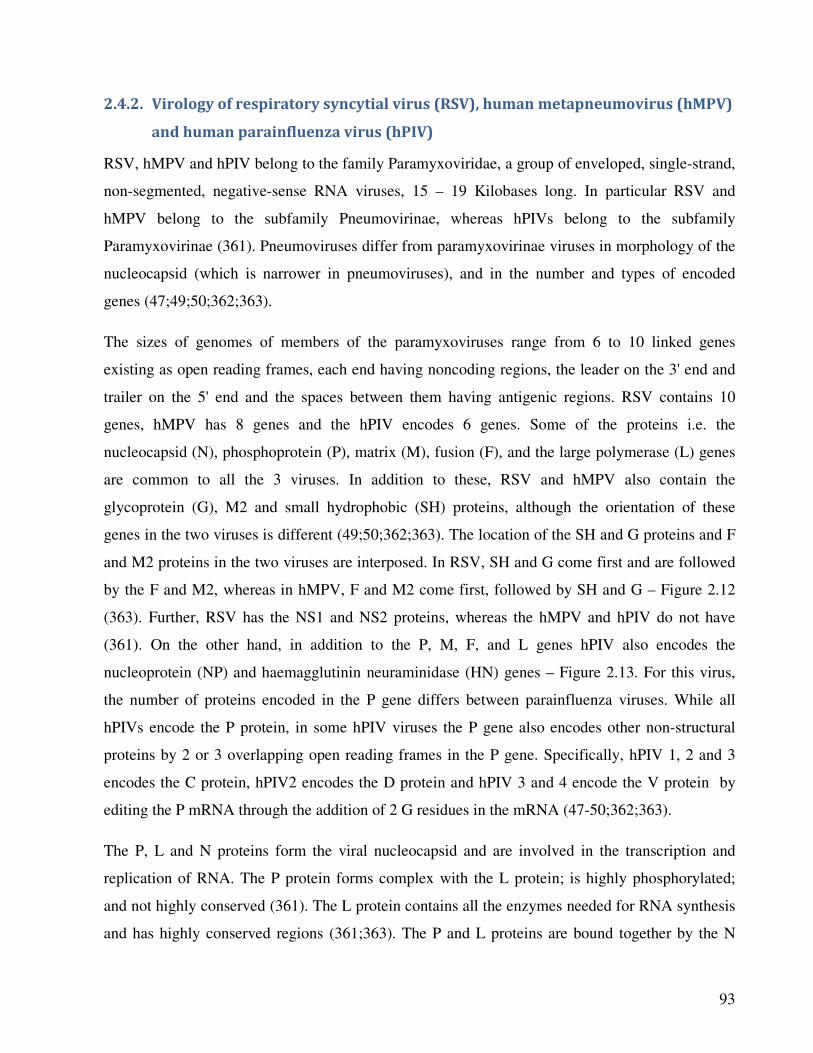
93
2.4.2. Virology of respiratory syncytial virus (RSV), human metapneumovirus (hMPV)
and human parainfluenza virus (hPIV)
RSV, hMPV and hPIV belong to the family Paramyxoviridae, a group of enveloped, single-strand,
non-segmented, negative-sense RNA viruses, 15 – 19 Kilobases long. In particular RSV and
hMPV belong to the subfamily Pneumovirinae, whereas hPIVs belong to the subfamily
Paramyxovirinae (361). Pneumoviruses differ from paramyxovirinae viruses in morphology of the
nucleocapsid (which is narrower in pneumoviruses), and in the number and types of encoded
genes (47;49;50;362;363).
The sizes of genomes of members of the paramyxoviruses range from 6 to 10 linked genes
existing as open reading frames, each end having noncoding regions, the leader on the 3' end and
trailer on the 5' end and the spaces between them having antigenic regions. RSV contains 10
genes, hMPV has 8 genes and the hPIV encodes 6 genes. Some of the proteins i.e. the
nucleocapsid (N), phosphoprotein (P), matrix (M), fusion (F), and the large polymerase (L) genes
are common to all the 3 viruses. In addition to these, RSV and hMPV also contain the
glycoprotein (G), M2 and small hydrophobic (SH) proteins, although the orientation of these
genes in the two viruses is different (49;50;362;363). The location of the SH and G proteins and F
and M2 proteins in the two viruses are interposed. In RSV, SH and G come first and are followed
by the F and M2, whereas in hMPV, F and M2 come first, followed by SH and G – Figure 2.12
(363). Further, RSV has the NS1 and NS2 proteins, whereas the hMPV and hPIV do not have
(361). On the other hand, in addition to the P, M, F, and L genes hPIV also encodes the
nucleoprotein (NP) and haemagglutinin neuraminidase (HN) genes – Figure 2.13. For this virus,
the number of proteins encoded in the P gene differs between parainfluenza viruses. While all
hPIVs encode the P protein, in some hPIV viruses the P gene also encodes other non-structural
proteins by 2 or 3 overlapping open reading frames in the P gene. Specifically, hPIV 1, 2 and 3
encodes the C protein, hPIV2 encodes the D protein and hPIV 3 and 4 encode the V protein by
editing the P mRNA through the addition of 2 G residues in the mRNA (47-50;362;363).
The P, L and N proteins form the viral nucleocapsid and are involved in the transcription and
replication of RNA. The P protein forms complex with the L protein; is highly phosphorylated;
and not highly conserved (361). The L protein contains all the enzymes needed for RNA synthesis
and has highly conserved regions (361;363). The P and L proteins are bound together by the N
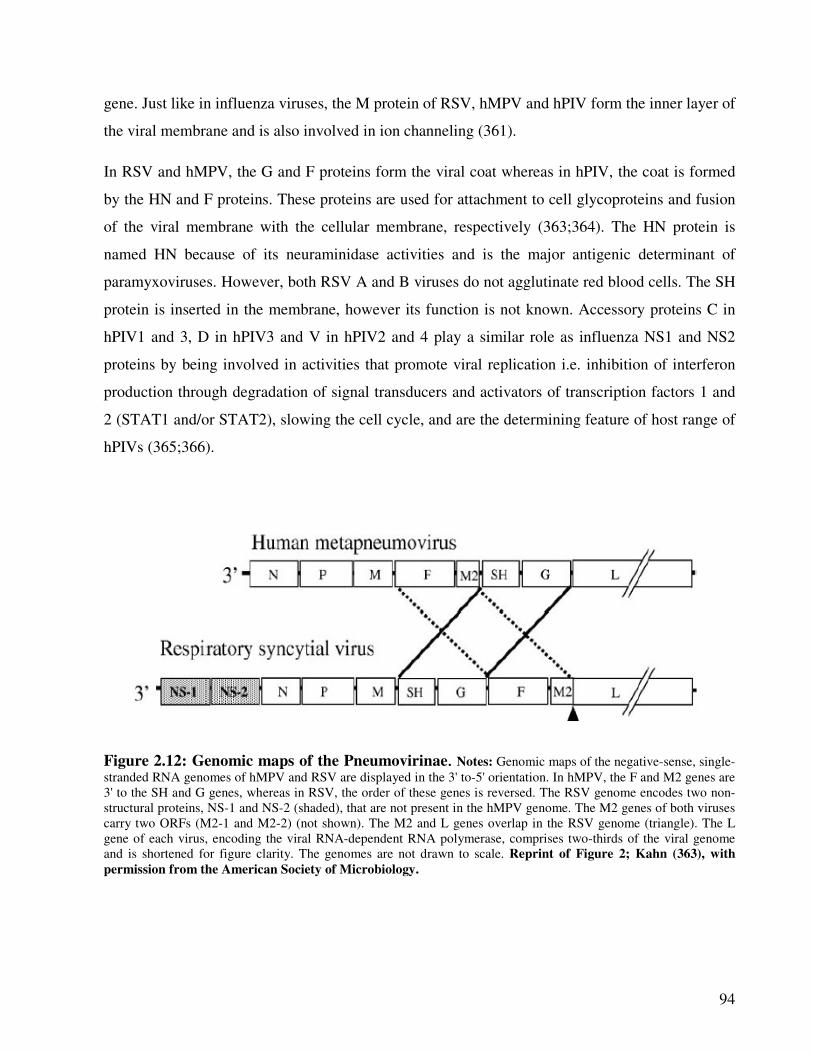
94
gene. Just like in influenza viruses, the M protein of RSV, hMPV and hPIV form the inner layer of
the viral membrane and is also involved in ion channeling (361).
In RSV and hMPV, the G and F proteins form the viral coat whereas in hPIV, the coat is formed
by the HN and F proteins. These proteins are used for attachment to cell glycoproteins and fusion
of the viral membrane with the cellular membrane, respectively (363;364). The HN protein is
named HN because of its neuraminidase activities and is the major antigenic determinant of
paramyxoviruses. However, both RSV A and B viruses do not agglutinate red blood cells. The SH
protein is inserted in the membrane, however its function is not known. Accessory proteins C in
hPIV1 and 3, D in hPIV3 and V in hPIV2 and 4 play a similar role as influenza NS1 and NS2
proteins by being involved in activities that promote viral replication i.e. inhibition of interferon
production through degradation of signal transducers and activators of transcription factors 1 and
2 (STAT1 and/or STAT2), slowing the cell cycle, and are the determining feature of host range of
hPIVs (365;366).
Figure 2.12: Genomic maps of the Pneumovirinae. Notes: Genomic maps of the negative-sense, single-
stranded RNA genomes of hMPV and RSV are displayed in the 3' to-5' orientation. In hMPV, the F and M2 genes are
3' to the SH and G genes, whereas in RSV, the order of these genes is reversed. The RSV genome encodes two non-
structural proteins, NS-1 and NS-2 (shaded), that are not present in the hMPV genome. The M2 genes of both viruses
carry two ORFs (M2-1 and M2-2) (not shown). The M2 and L genes overlap in the RSV genome (triangle). The L
gene of each virus, encoding the viral RNA-dependent RNA polymerase, comprises two-thirds of the viral genome
and is shortened for figure clarity. The genomes are not drawn to scale. Reprint of Figure 2; Kahn (363), with
permission from the American Society of Microbiology.
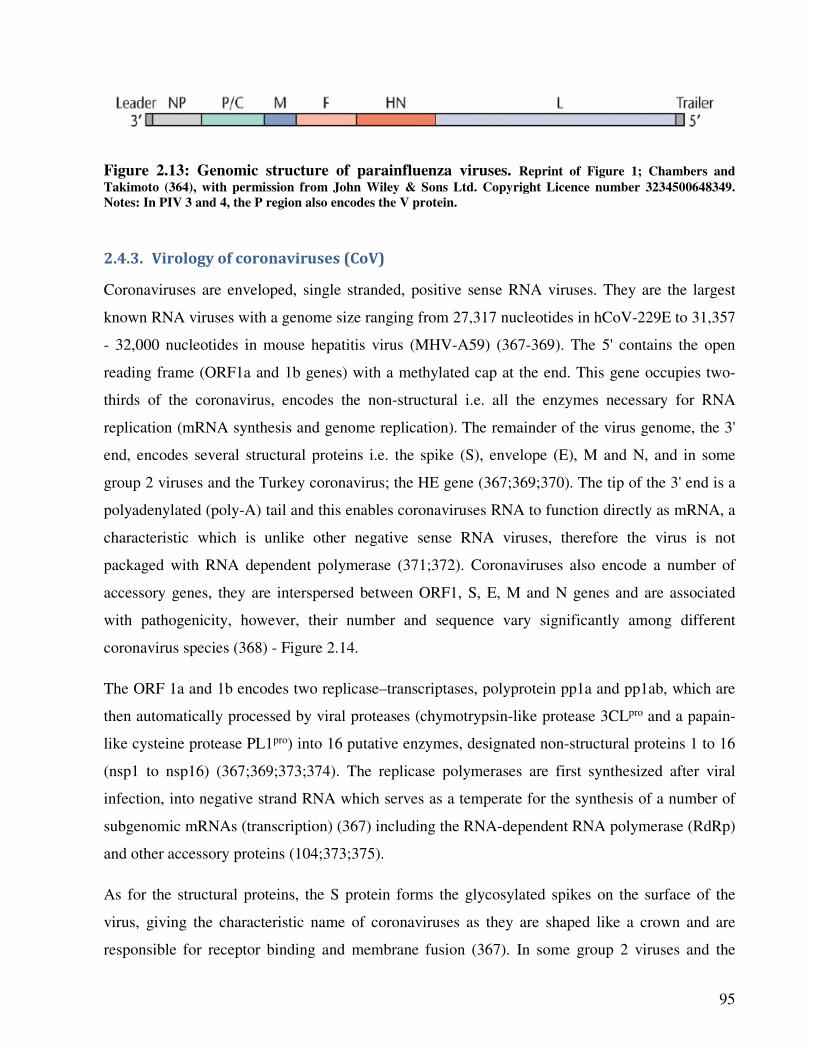
95
Figure 2.13: Genomic structure of parainfluenza viruses. Reprint of Figure 1; Chambers and
Takimoto (364), with permission from John Wiley & Sons Ltd. Copyright Licence number 3234500648349.
Notes: In PIV 3 and 4, the P region also encodes the V protein.
2.4.3. Virology of coronaviruses (CoV)
Coronaviruses are enveloped, single stranded, positive sense RNA viruses. They are the largest
known RNA viruses with a genome size ranging from 27,317 nucleotides in hCoV-229E to 31,357
- 32,000 nucleotides in mouse hepatitis virus (MHV-A59) (367-369). The 5' contains the open
reading frame (ORF1a and 1b genes) with a methylated cap at the end. This gene occupies two-
thirds of the coronavirus, encodes the non-structural i.e. all the enzymes necessary for RNA
replication (mRNA synthesis and genome replication). The remainder of the virus genome, the 3'
end, encodes several structural proteins i.e. the spike (S), envelope (E), M and N, and in some
group 2 viruses and the Turkey coronavirus; the HE gene (367;369;370). The tip of the 3' end is a
polyadenylated (poly-A) tail and this enables coronaviruses RNA to function directly as mRNA, a
characteristic which is unlike other negative sense RNA viruses, therefore the virus is not
packaged with RNA dependent polymerase (371;372). Coronaviruses also encode a number of
accessory genes, they are interspersed between ORF1, S, E, M and N genes and are associated
with pathogenicity, however, their number and sequence vary significantly among different
coronavirus species (368) - Figure 2.14.
The ORF 1a and 1b encodes two replicase–transcriptases, polyprotein pp1a and pp1ab, which are
then automatically processed by viral proteases (chymotrypsin-like protease 3CLpro and a papain-
like cysteine protease PL1pro) into 16 putative enzymes, designated non-structural proteins 1 to 16
(nsp1 to nsp16) (367;369;373;374). The replicase polymerases are first synthesized after viral
infection, into negative strand RNA which serves as a temperate for the synthesis of a number of
subgenomic mRNAs (transcription) (367) including the RNA-dependent RNA polymerase (RdRp)
and other accessory proteins (104;373;375).
As for the structural proteins, the S protein forms the glycosylated spikes on the surface of the
virus, giving the characteristic name of coronaviruses as they are shaped like a crown and are
responsible for receptor binding and membrane fusion (367). In some group 2 viruses and the
96
turkey coronavirus, the HE gene forms short spikes on the surface and performs a similar function
to influenza virus NA, specifically it cleaves 9-O-acetylated neuraminic acid glycans, hence
preventing virus aggregation on cell surfaces hence aiding virus replication (367). The function of
the N and M proteins of coronaviruses is similar to the functions of these genes in influenza, RSV,
hMPV and hPIV viruses; i.e. it forms the inner lining of the virus capsid. However in
coronaviruses, the viral envelope also contains the E protein which works in conjunction with the
M protein to facilitate virion formation and budding (376)
2.4.3.1. Host range of coronaviruses
Coronaviruses are classified into 4 Genera based on inter-genomic comparisons, with members of
the same group having similar non-structural proteins in the same genomic position (368;377).
Alphacoronaviruses and Betacoronaviruses infect mammals, Gammacoronaviruses infect birds
(367;368) - Table 2.9. Alphacoronaviruses includes 8 species; human coronavirus 229E (hCoV-
229E), human coronavirus NL63 (hCoV-NL63), Miniopterus bat coronavirus 1 (BatCoV-1),
Miniopterus bat coronavirus HKU8 (BatCoV- HKU8), Rhinolophus bat coronavirus HKU2
(BatCoV-HKU2), Scotophilus bat coronavirus 512 (BatCoV-512), and the porcine epidemic
diarrhoea virus (PEDV) (45;367;368;377;378). Betacoronaviruses include 7 species; Human
coronavirus HKU1 (hCoV-HKU1), Betacoronavirus 1, mouse hepatitis virus (MHV), Pipistrellus
bat coronavirus HKU5 (BatCoV-HKU5), Rousettus bat coronavirus HKU9 (BatCoV-HKU9),
Tylonycteris bat coronavirus HKU4 (BatCoV-HKU4) and Severe acute respiratory syndrome-
related coronavirus. Deltacoronaviruses include 3 species: Bulbul coronavirus HKU11 (BCoV-
HKU11), Munia coronavirus HKU13, and Thrush coronavirus HKU12, whereas
Gammacoronaviruses include 2 species; infectious bronchitis virus (IBV), and Beluga whale
coronavirus SW1 (378). The classification of the newly discovered novel Middle East respiratory
syndrome coronavirus (MERS) is still controversial (378).
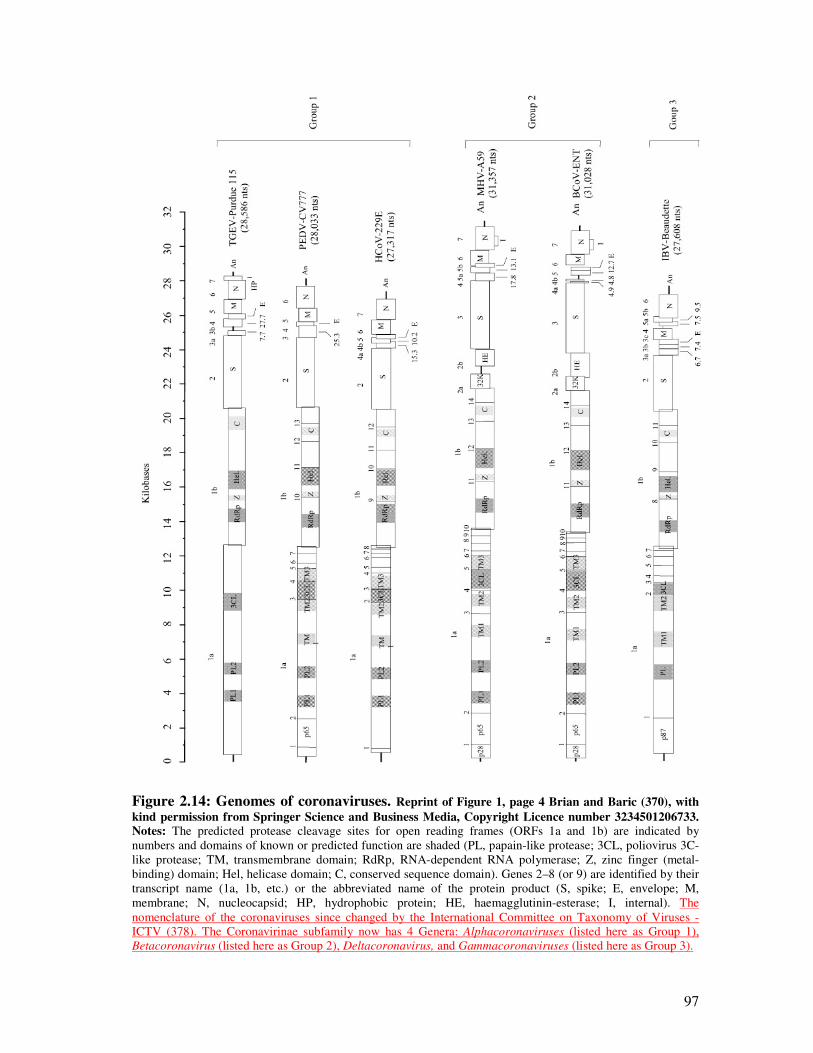
97
Figure 2.14: Genomes of coronaviruses. Reprint of Figure 1, page 4 Brian and Baric (370), with
kind permission from Springer Science and Business Media, Copyright Licence number 3234501206733. Notes: The predicted protease cleavage sites for open reading frames (ORFs 1a and 1b) are indicated by
numbers and domains of known or predicted function are shaded (PL, papain-like protease; 3CL, poliovirus 3C-
like protease; TM, transmembrane domain; RdRp, RNA-dependent RNA polymerase; Z, zinc finger (metal-
binding) domain; Hel, helicase domain; C, conserved sequence domain). Genes 2–8 (or 9) are identified by their
transcript name (1a, 1b, etc.) or the abbreviated name of the protein product (S, spike; E, envelope; M,
membrane; N, nucleocapsid; HP, hydrophobic protein; HE, haemagglutinin-esterase; I, internal). The
nomenclature of the coronaviruses since changed by the International Committee on Taxonomy of Viruses -
ICTV (378). The Coronavirinae subfamily now has 4 Genera: Alphacoronaviruses (listed here as Group 1),
Betacoronavirus (listed here as Group 2), Deltacoronavirus, and Gammacoronaviruses (listed here as Group 3).
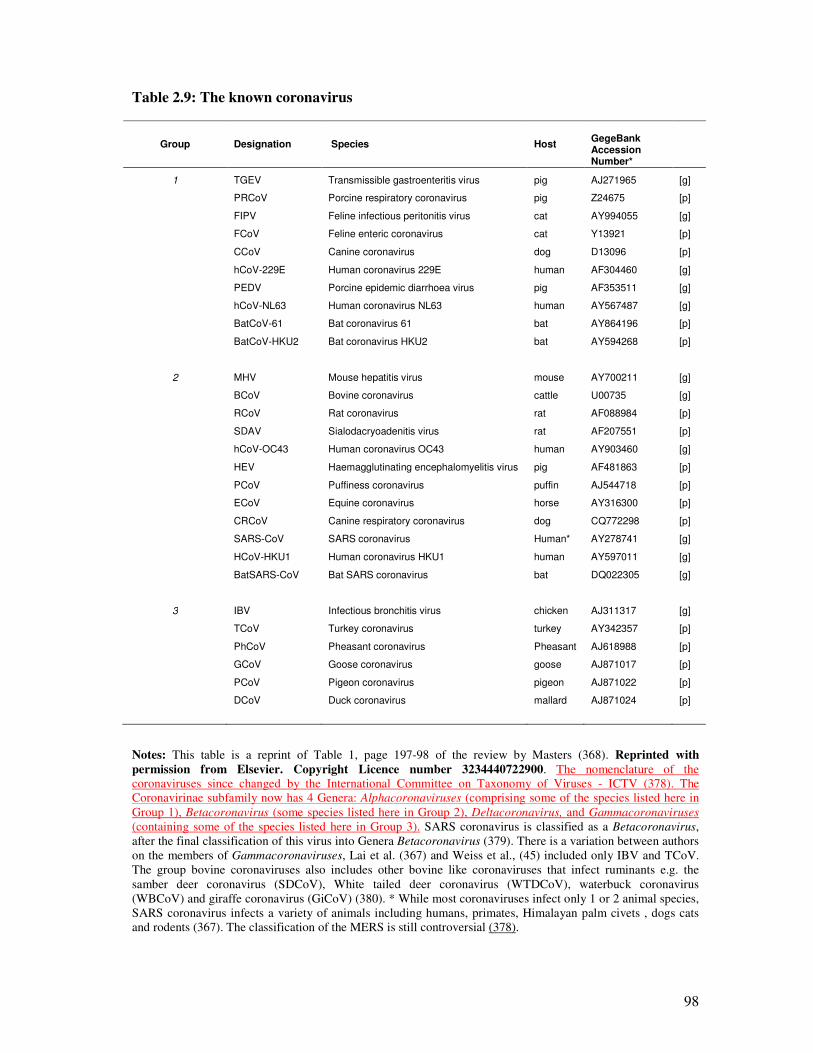
98
Table 2.9: The known coronavirus
Group Designation Species
Host
GegeBank Accession Number*
1 TGEV Transmissible gastroenteritis virus pig AJ271965 [g]
PRCoV Porcine respiratory coronavirus pig Z24675 [p]
FIPV Feline infectious peritonitis virus cat AY994055 [g]
FCoV Feline enteric coronavirus cat Y13921 [p]
CCoV Canine coronavirus dog D13096 [p]
hCoV-229E Human coronavirus 229E human AF304460 [g]
PEDV Porcine epidemic diarrhoea virus pig AF353511 [g]
hCoV-NL63 Human coronavirus NL63 human AY567487 [g]
BatCoV-61 Bat coronavirus 61 bat AY864196 [p]
BatCoV-HKU2 Bat coronavirus HKU2 bat AY594268 [p]
2 MHV Mouse hepatitis virus mouse AY700211 [g]
BCoV Bovine coronavirus cattle U00735 [g]
RCoV Rat coronavirus rat AF088984 [p]
SDAV Sialodacryoadenitis virus rat AF207551 [p]
hCoV-OC43 Human coronavirus OC43 human AY903460 [g]
HEV Haemagglutinating encephalomyelitis virus pig AF481863 [p]
PCoV Puffiness coronavirus puffin AJ544718 [p]
ECoV Equine coronavirus horse AY316300 [p]
CRCoV Canine respiratory coronavirus dog CQ772298 [p]
SARS-CoV SARS coronavirus Human* AY278741 [g]
HCoV-HKU1 Human coronavirus HKU1 human AY597011 [g]
BatSARS-CoV Bat SARS coronavirus bat DQ022305 [g]
3 IBV Infectious bronchitis virus chicken AJ311317 [g]
TCoV Turkey coronavirus turkey AY342357 [p]
PhCoV Pheasant coronavirus Pheasant AJ618988 [p]
GCoV Goose coronavirus goose AJ871017 [p]
PCoV Pigeon coronavirus pigeon AJ871022 [p]
DCoV Duck coronavirus mallard AJ871024 [p]
Notes: This table is a reprint of Table 1, page 197-98 of the review by Masters (368). Reprinted with
permission from Elsevier. Copyright Licence number 3234440722900. The nomenclature of the
coronaviruses since changed by the International Committee on Taxonomy of Viruses - ICTV (378). The
Coronavirinae subfamily now has 4 Genera: Alphacoronaviruses (comprising some of the species listed here in
Group 1), Betacoronavirus (some species listed here in Group 2), Deltacoronavirus, and Gammacoronaviruses
(containing some of the species listed here in Group 3). SARS coronavirus is classified as a Betacoronavirus,
after the final classification of this virus into Genera Betacoronavirus (379). There is a variation between authors
on the members of Gammacoronaviruses, Lai et al. (367) and Weiss et al., (45) included only IBV and TCoV.
The group bovine coronaviruses also includes other bovine like coronaviruses that infect ruminants e.g. the
samber deer coronavirus (SDCoV), White tailed deer coronavirus (WTDCoV), waterbuck coronavirus
(WBCoV) and giraffe coronavirus (GiCoV) (380). * While most coronaviruses infect only 1 or 2 animal species,
SARS coronavirus infects a variety of animals including humans, primates, Himalayan palm civets , dogs cats
and rodents (367). The classification of the MERS is still controversial (378).
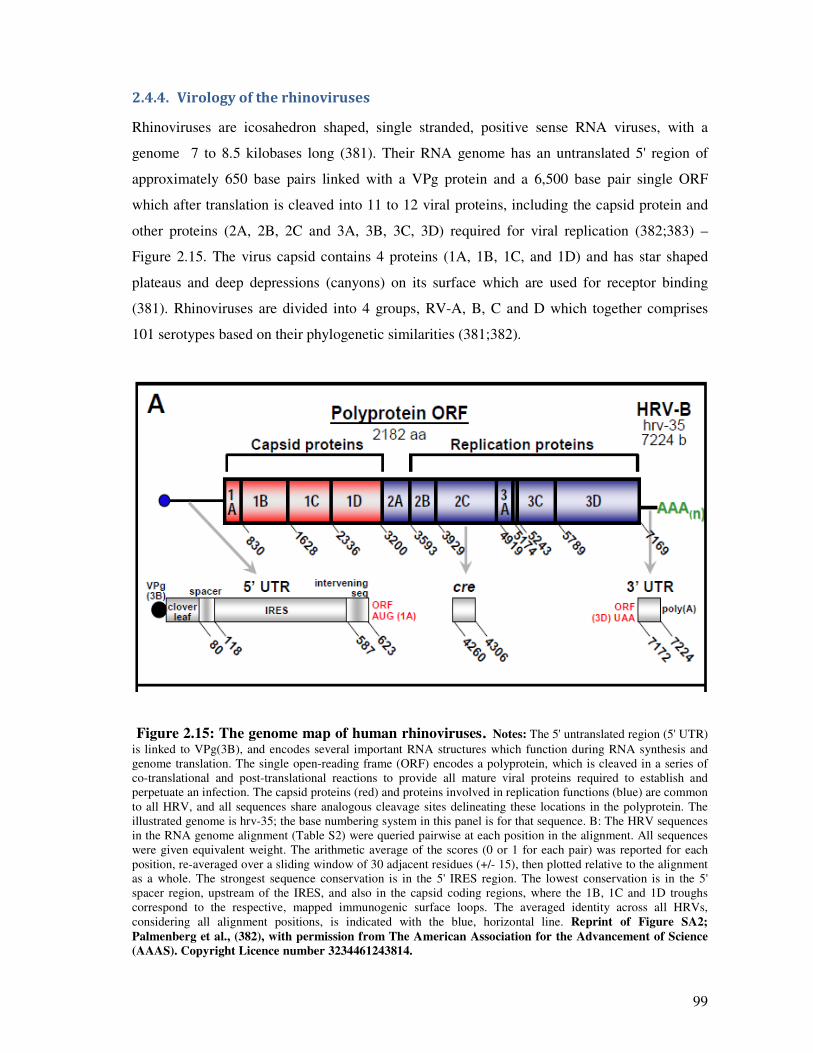
99
2.4.4. Virology of the rhinoviruses
Rhinoviruses are icosahedron shaped, single stranded, positive sense RNA viruses, with a
genome 7 to 8.5 kilobases long (381). Their RNA genome has an untranslated 5' region of
approximately 650 base pairs linked with a VPg protein and a 6,500 base pair single ORF
which after translation is cleaved into 11 to 12 viral proteins, including the capsid protein and
other proteins (2A, 2B, 2C and 3A, 3B, 3C, 3D) required for viral replication (382;383) –
Figure 2.15. The virus capsid contains 4 proteins (1A, 1B, 1C, and 1D) and has star shaped
plateaus and deep depressions (canyons) on its surface which are used for receptor binding
(381). Rhinoviruses are divided into 4 groups, RV-A, B, C and D which together comprises
101 serotypes based on their phylogenetic similarities (381;382).
Figure 2.15: The genome map of human rhinoviruses. Notes: The 5' untranslated region (5' UTR)
is linked to VPg(3B), and encodes several important RNA structures which function during RNA synthesis and
genome translation. The single open-reading frame (ORF) encodes a polyprotein, which is cleaved in a series of
co-translational and post-translational reactions to provide all mature viral proteins required to establish and
perpetuate an infection. The capsid proteins (red) and proteins involved in replication functions (blue) are common
to all HRV, and all sequences share analogous cleavage sites delineating these locations in the polyprotein. The
illustrated genome is hrv-35; the base numbering system in this panel is for that sequence. B: The HRV sequences
in the RNA genome alignment (Table S2) were queried pairwise at each position in the alignment. All sequences
were given equivalent weight. The arithmetic average of the scores (0 or 1 for each pair) was reported for each
position, re-averaged over a sliding window of 30 adjacent residues (+/- 15), then plotted relative to the alignment
as a whole. The strongest sequence conservation is in the 5' IRES region. The lowest conservation is in the 5'
spacer region, upstream of the IRES, and also in the capsid coding regions, where the 1B, 1C and 1D troughs
correspond to the respective, mapped immunogenic surface loops. The averaged identity across all HRVs,
considering all alignment positions, is indicated with the blue, horizontal line. Reprint of Figure SA2;
Palmenberg et al., (382), with permission from The American Association for the Advancement of Science
(AAAS). Copyright Licence number 3234461243814.
100
2.4.5. Virology of adenovirus and human bocavirus (AdV and hBoV)
Both adenovirus and human bocavirus are DNA non-enveloped icosahedral viruses,
adenoviruses have a double stranded DNA (dsDNA), the hBoV have a single stranded DNA
(ssDNA) (43;384;385).
The DNA of adenoviruses is 34-36 kilobases long with inverted terminal repeat sequences
ranging from 36 to 200 base pairs. The virion consists of a protein capsid enclosing the DNA
(43;384). The DNA has approximately 47 genes (open reading frames ORFs) i.e. early (E1A,
E1B, E2, 3, and 4), intermediate (IX and IVa2), late (L1, 2, 3, 4, 5) genes, and the p23 protein –
Figure 2.16 (43;384). Out of the 47 proteins, 33 (including the early and late genes) are
conserved among all adenoviruses (386;387), and five proteins i.e. the hexon fibre, panton
base, and the E3 transcription genes are hypervariable (388).
The hexon (gene II), panton (gene III), and polypeptide II, III and IV (Fibre protein) form the
virus capsid, and together, these proteins determine the virus antigenicity (43). The penton
consists of a base and a fibre, the fibre protein binds to cell receptors, the VIII and IX proteins
stabilize interactions between hexons, VI protein disrupts host cell membranes during infection,
whereas the IIIa protein is involved in virus assembly. The nucleoprotein is composed of five
genes; i.e. the V, VII, µ, terminal protein, and the p23 genes. The VII and µ proteins bind the
genome together. Polypeptide V (core protein) links the virus core to the capsid, whereas the
p23 protein is used for protein synthesis (43). The E3 proteins facilitate immune evasion by the
virus (389;390).
The human adenoviruses are classified into 56 serotypes and 7 species (A, B, C, D, E, F and
G), with subspecies B being further divided into B1 and B2. The classification is based on the
viruses haemagglutination characteristics (384;391;392) and degree of base sequence
homology as shown by similarity of restriction fragments cut by restriction enzymes; BamHI,
BclI, Bgll, BglII, BstEII, EcoRI, HindIII HpaI, Sall, SmaI, XbaI, and XhoII among different
species. The classification puts a within subgroup homology of >50%, and between subgroup
homology of <25% (393-395). The patterns obtained after restriction digestion are named using
the name of the gene in which they occur e.g. A, B, C - G combined with Arabic letters (e.g.,
Ad3p, Ad3p1, H8a, H8p, H8k) - (396;397).
Bocaviruses are simple and small viruses with negative or positive strand ssDNA 4 to 6
kilobases long with inverted terminal repeats, which are able to infect only dividing epithelial
or lymphoid cells (385). The genome of human bocavirus consists of three open reading frames
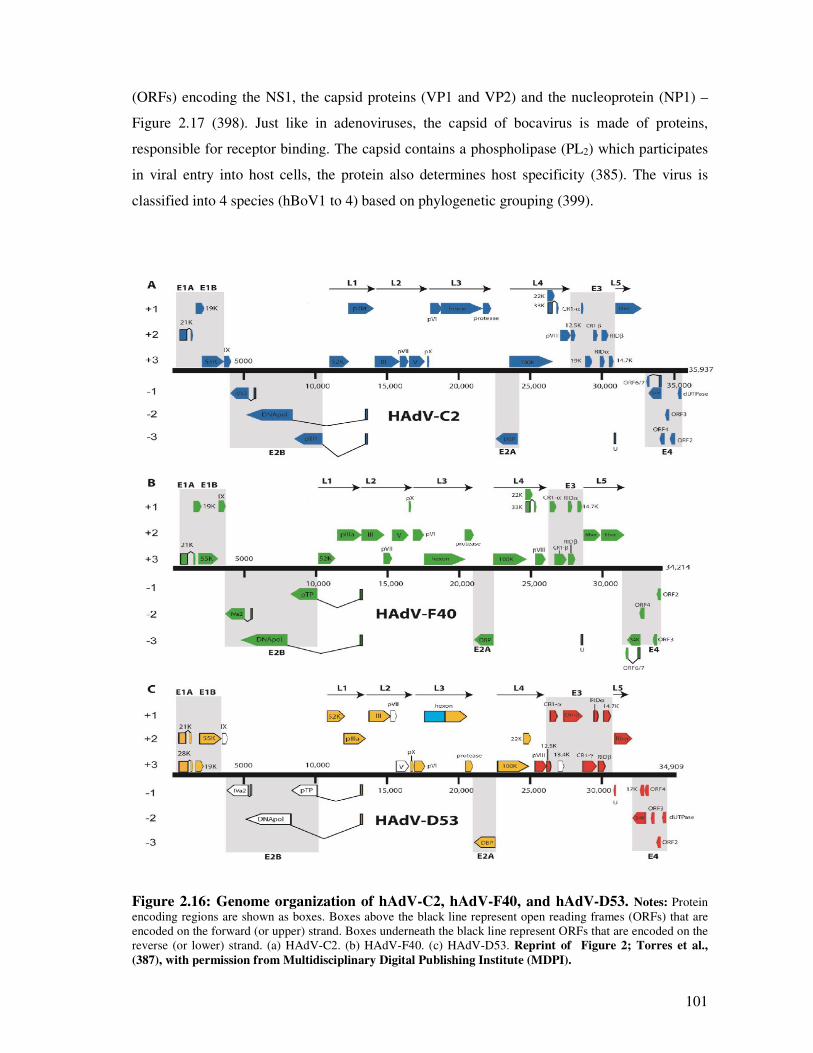
101
(ORFs) encoding the NS1, the capsid proteins (VP1 and VP2) and the nucleoprotein (NP1) –
Figure 2.17 (398). Just like in adenoviruses, the capsid of bocavirus is made of proteins,
responsible for receptor binding. The capsid contains a phospholipase (PL2) which participates
in viral entry into host cells, the protein also determines host specificity (385). The virus is
classified into 4 species (hBoV1 to 4) based on phylogenetic grouping (399).
Figure 2.16: Genome organization of hAdV-C2, hAdV-F40, and hAdV-D53. Notes: Protein
encoding regions are shown as boxes. Boxes above the black line represent open reading frames (ORFs) that are
encoded on the forward (or upper) strand. Boxes underneath the black line represent ORFs that are encoded on the
reverse (or lower) strand. (a) HAdV-C2. (b) HAdV-F40. (c) HAdV-D53. Reprint of Figure 2; Torres et al.,
(387), with permission from Multidisciplinary Digital Publishing Institute (MDPI).
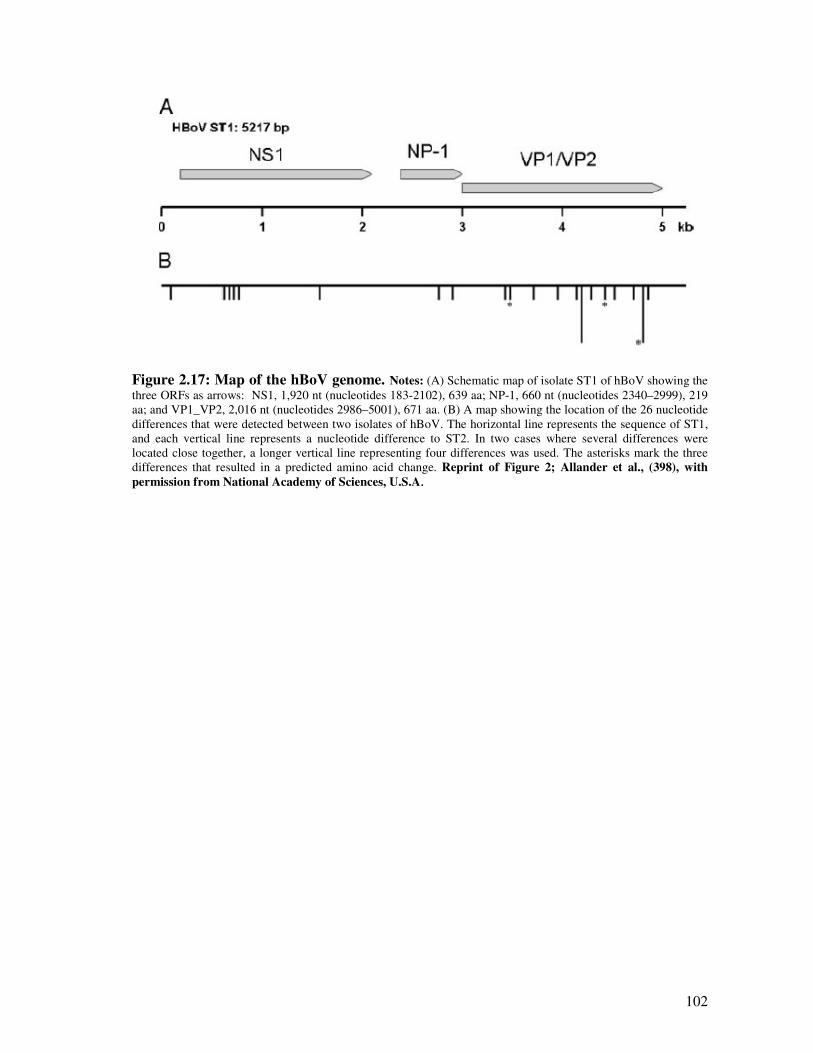
102
Figure 2.17: Map of the hBoV genome. Notes: (A) Schematic map of isolate ST1 of hBoV showing the
three ORFs as arrows: NS1, 1,920 nt (nucleotides 183-2102), 639 aa; NP-1, 660 nt (nucleotides 2340–2999), 219
aa; and VP1_VP2, 2,016 nt (nucleotides 2986–5001), 671 aa. (B) A map showing the location of the 26 nucleotide
differences that were detected between two isolates of hBoV. The horizontal line represents the sequence of ST1,
and each vertical line represents a nucleotide difference to ST2. In two cases where several differences were
located close together, a longer vertical line representing four differences was used. The asterisks mark the three
differences that resulted in a predicted amino acid change. Reprint of Figure 2; Allander et al., (398), with
permission from National Academy of Sciences, U.S.A.
103
2.5. The nature of respiratory virus infections Part E: Genetic mutations associated
with pathogenicity of pandemic influenza A(H1N1)pdm09 virus: A review
Synopsis
This is the authors’ version of the paper submitted to Archives of Virology. This paper
discusses the association between mutations in the pandemic influenza A with severe or fatal
disease. Animal models have indicated that certain virus genetic mutations affect severity of
influenza disease. This study aimed at summarizing the available evidence on the role of
mutations on disease outcome in humans.
104
2.5.1. Abstract
Mutations associated with severity of the pandemic influenza
A(H1N1)pdm09 in humans: A systematic review and
meta-analysis of epidemiological evidence
Goka E.A1, Vallely P.J 1, Mutton K.J 1,2, Klapper P.E 1,2
1: Institute of Inflammation and Repair, Faculty of Medical and Human Sciences, University of Manchester,
2: Department of Clinical Virology, Central Manchester Universities NHS Trust
Corresponding author: Edward Goka, Institute of Inflammation and Repair, Faculty of Medical and Human Sciences, 1st
Floor Stopford building, University of Manchester, Oxford Road, Manchester, M13 9PL, UK.
E-mail: [email protected]
Objective: Mutations on the haemagglutinin (HA), non-structural protein 1 (NS1) and polymerase
basic protein 2 (PB2) of influenza viruses have been associated with virulence. This study investigated
the association between mutations on these genes, in influenza A(H1N1)pdm09 and risk of severe or
fatal disease.
Methodology: The review is conducted using studies identified from the MEDLINE, EMBASE and
WEB of Science electronic databases, and reference lists of published studies. The PRIMA and
STROBE guidelines were followed in assessing the quality of studies and conducting the write-up.
Results: Eighteen (18) studies, from all continents, were included in the systematic review (recruiting
patients 0 – 77 years old). During the two years the pandemic influenza A(H1N1)pdm09 virus
circulated, mutation D222G was associated with a significant increase of severe disease (pooled RD:
11%, 95% CI: 3.0% - 18.0%, p = 0.004); and risk of fatality (RD: 23%, 95% CI: 14.0% – 31.0%, p =
<0.0001): No association was observed between mutations HA-D222N, D222E, PB2-E627K and NS1-
T123V and severe/fatal disease. The results suggest that no virus quasi-species bearing virulence
conferring mutations in the HA, PB2 and NS1 predominating in humans. This result reaffirms previous
reports suggesting the importance of PB2, NS1, and HA genes working together to cause serious
disease. However issues of sampling bias, and bias due to uncontrolled confounders such as;
comorbidities, and viral and bacterial co-infection, should be born in mind.
Conclusion: Influenza A viruses should continue to be monitored for the occurrence of virulence
conferring mutations on HA, PB2 and NS1. There are suggestions that respiratory virus co-infections
also affect virus virulence. Studies investigating the role of genetic mutations on disease outcome
should make efforts to also investigate the role of co-infections.
105
2.5.2. Introduction
2.5.2.1. The virulence genes of influenza A viruses
The history of influenza viruses has shown that the viruses that caused pandemics had changes in
the surface and internal proteins (400). The 1957 pandemic H2N2 influenza virus had
haemagglutinin (HA), neuraminidase (NA) and polymerase basic protein 1 (PB1) genes from
avian virus and the remainder of the genes derived from a previously circulating human virus.
Similarly, the 1968 pandemic H3N2 virus had avian HA and PB1 segments in a background of
human viral genes (266;271;342;400-403). It has been suggested that changes in the HA, PB and
NS1 genes affect virus severity.
Changes in the antigenic sites, or in the vicinity of the antigenic sites of the HA gene result in
antigenic drift and compromises vaccine and immune effectiveness, with some novel strains
causing pandemics with high virulence (348;404-408). Also changes in the HA receptor binding
sites or in molecules in their vicinity affect viral virulence (409). Similarly glycosylation in the
vicinity of the cleavage site promotes folding of the HA and can lead to masking or unmasking
of proteolytic cleavage or antigenic sites and affect viral pathogenicity (348). The polymerase
basic protein 2 (PB2) gene has been shown to affect host specificity in influenza H5N1, H7N7
and in the 1918 H1N1 virus (20;34;37). The NS1 protein was implicated in the pathogenicity of
the highly pathogenic H5N1 avian influenza virus and the 1918 H1N1 virus (19;36). Mutations
in the PB2, HA, and NS1 affect viral virulence by: determining host specificity, enhancing the
ability of hybrid viruses to efficiently replicate in humans - enhancing efficiency of viral
attachment, entry and release, facilitating antagonism of the interferon pathways and evasion of
the immune response (18-20;34-37).
2.5.2.2. The HA genes’ virulence related functional sites
HA is an envelope glycoprotein of 550 amino acids (348); HA1-329 residues, and HA2-221
residues (348). The HA gene contains three major functional sites; the receptor binding sites
(RBS), the antigenic sites and the cleavage site.
HA1 187 and 222, determine the receptor-binding specificity of the HA: D187/D222 for α(2,6)
receptors in humans, D187/G222 for α(2,6) and α(2,3) receptors in swine, and E187/G222 for
α(2,3) receptors in avian (18;407;410-416). In the 1918 virus, a single mutation (D222G)
reduced the binding affinity for α (2,6) receptors (414;415) and the infectivity of the virus (18),
while a double variant D187E/D222G rendered the HA non-binding to α(2,6) receptors and the
virus non-infectious (414;415;417).
106
Out of the 329 HA1 residues, 131 are antigenic sites, 181 are non-antigenic sites and the status of
the others is unknown. The antigenic sites are further classified into 5 antigenic epitopes
(Supplementary table S1), designated Sa, Sb, Ca1, Ca2 and Cb in influenza H1N1 viruses and A,
B, C, D and E in influenza H3N2 viruses (348;418-421). In general, most of the antigenic
changes in influenza A(H1N1) and A(H3N2) have been proceeded by at least 3 substitutions in
positively selected sites (406). However a deletion of K at position 130 (K134 in H3 numbering)
was responsible for the antigenic difference between the A/Bayern/7/95 and A/Beijing/262/95
influenza A(H1N1) subtypes (404). The positively selected antigenic sites on H1N1-HA1 have
previously been summarized by Cox et al., (422), Brownlee and Fodor (421), Igarashi et al.,
(408), Liao et al., (406), Huang et al, (423), Stray and Pitman (424), and Shen et al., (407). We
have summarized the findings from these studies in supplementary Table 2.5S1. Further,
supplementary Table 2.5S2 details the amino acid mutations in these HA antigenic sites that
have occurred in influenza A(H1N1) main strains that have circulated since 1918.
Cleavage of the HA gene is important for viral infectivity as it is a prerequisite for the fusion of
the viral and cell membranes (425). N-glycosylation is achieved by addition of glycans to
asparagine (N) residues (426). Influenza A (H1N1) viruses possess 5 glycosylation sites N71,
N104, N142 (variant - 144), N177 (variant – 172 and 179), and N286 (H1- numbering)
(427;428). The A/SC/1918 and CA/07/2009 had only one glycosylation site N104 (408;427),
however after 1918, H1N1 viruses gained the N286 and N142 and N177 before 1957, the other
site N71 appeared in 1987 (427). The seasonal influenza A(H1N1) viruses that circulated prior to
the 2009 pandemic virus had 4 glycosylation sites (dropped the 286) - (427).
2.5.2.3. The PB2 genes’ virulence related functional sites
The PB1, PB2, and PA form the polymerase responsible for replication and transcription of the
viral RNA in the nucleus of infected cells using a cap-snatching mechanism (429;430). The
location of the cap binding site on PB2 is controversial, Honda et al., (431), Palese and Shaw
(432), and Li et al., (430) suggested N-site residues 242–252 and C-site residues 533–577,
Fechter et al., (433) a more central site involving residues F363 and F404 and Poole et al.,
(432;434) the C-terminal residues 1–269 and 580–683 respectively. One of the most commonly
identified virulence markers is mutation (PB2-E627K); the glutamic acid (E) is generally found
in avian influenza viruses, while human viruses have a lysine (K), therefore this mutation
determines host specificity (435). Other important PB2 mutations include D701N, S714R,
S678N and L13P in (436-440), and in the pandemic influenza A(H1N1)pdm09 virus PB2-
T588I, A271T, K340N and D567G (417;441-443). The pandemic influenza A(H1N1)pdm09
(Flu Apdm09) virus has avian PB2 gene (266), hence need for the 627K mutation for it to
107
efficiently replicate in humans. However, some researchers (436;440;444-446) indicated that
E627K has little effect on transmissibility of Flu Apdm09, yet others found it is (447) yet others
suggested that this might be compensated by Q591R (440;448).
2.5.2.4. The NS1 genes’ virulence related functional sites
Depending on the virus strain NS1 consists of 124–237 amino acids and is expressed exclusively
in infected cells and contains the N-terminal RNA-binding domain (residues 1–73) and the C-
terminal effector domain (residues 73–237) (449). The effector domain containing several other
domains, including cleavage and CPSF-binding domain (residues 175-210), poly(A)-binding
protein (PABP) domain (residues 218-225), nuclear localization signal 1 (residues 34-38),
nuclear localization signal 2 (residues 211-216), nuclear export signal (residues 132-141) and
e1F4G1 domain (residues 81-113) (450). Residue 186 and the 103 and 106 prevent transport of
cellular mRNA to the cytoplasm by interaction with poly (A) – binding protein II (PABII) (451-
453), whereas amino acids 215 to 237 have been identified as the binding site for PABII (451).
Wang et al., (454), Cheng et al., (455) and Yin et al., (456) indicated that the dsRNA-binding
residues in the N-terminal include; T5, P31, D34, R35, R38, K41, G45, R46 and T49. Further, a
five-residue short peptide sequence (123-IMDKN-127) counteracts the PKR-mediated antiviral
response (457;458). The effector domain residues; T89/M93, P164/P167 and L141/E142 bind to
p85b and induce the phosphatidylinositol 3-kinase (PI3K)/Akt signalling pathway (346;459),
whereas R38A/K41A and E96A/E97A are responsible for TRIM25 binding (460-463). Studies
by Donelan et al., (464) and Talon et al., (465) indicated that the NS1 R38A/K41A mutations
abolished binding to dsRNA-binding and IFN antagonism. While Gack et al., (460), Mibayashi
et al., (461); Bornholdt and Prasad (462) and Chien et al., (463) indicated that mutations
R38A/K41A and E96A/E97A NS1, in contrast to NS1 wild type, led to abolishment of TRIM25
binding and dysfunctional RIG-I. The mutations implicated in the pandemic influenza
A(H1N1)pdm include the NS1 T123V (466;467)
2.5.2.5. Rationale for conducting the review
An understanding of the positively selected important mutations on influenza A virus HA, PB2
and NS1 genes, associated with severe outcome, could help future research for vaccine and drug
development. It could also help with patient management, and public health surveillance and
preparedness. Due to the ever changing nature (antigenic drift and shift) of influenza viruses, the
World Health Organisation (WHO) Global Influenza Surveillance and Response System
(GISRS) coordinates the global risk assessment of influenza viruses yearly. One hundred and
twenty two (122) National Influenza Centres, designated by national authorities in 92 countries
108
sends around 150,000 to 200,000 respiratory specimens to the 5 global collaborating centres (the
United Kingdom and Australia National Institute for Medical Research, US Centres for Disease
Control and Prevention, Chinese Centres for Disease Control and Prevention, and National
Institute of Infectious Diseases in Japan) for antigenic characterization to identify novel variants
twice a year (468;469). An additional approach is the filed vaccine trials, which are undertaken
by multiple sites in North America, Europe and Australia. The case-control and cohort studies
identify and characterise influenza viruses, document observed mutations and observed
responsiveness of the circulating viruses to that seasons vaccine (470;471). Lastly, independent
studies are conducted by hospitals, university institutions, government ministry of health and
other bodies of which some are published and others are not. Some of the virus sequences are
deposited on GenBank, the Influenza Research Database, and Research Collaboration for
Structural Bioinformatics Protein Data Bank. A major problem with the above methods is most
of the studies, while using laboratory confirmed influenza viruses, do not include virulence (i.e.
severe disease or death), as an endpoint, or give a clear link between specific mutations and
disease outcome (472;473). Therefore most of the evidence on the role of mutations on severity
are based on animal and cell line experiments (439;441;447;474-481) and evidence from human
infections is scanty. The December 2009 WHO report (482) and the November 2010 European
Centres for Disease Control and Prevention report (483) summarized on mutations in the
pandemic virus and disease severity but both dwelled only on the HA D222G mutation and no
study has systematically reviewed the evidence on the association between mutations in the HA,
PB2 and NS1 genes in the pandemic Flu A(H1N1)pdm09 and patient outcome, hence the
importance of this review.
2.5.2.6. Aims and objectives of the review
This study aims to review available epidemiological evidence on mutations on PB2, NS1 and
HA gene of influenza A (H1N1)pdm09 and their association with disease outcome. Also, it has
been suggested, by some studies, that respiratory virus co-infections affect disease severity
(76;77;484-487). Currently most of the studies on genetic mutations and virus virulence do not
investigate the role of co-infections in those circumstances. Our other study [Goka et al., 2013
(338)] investigated the association between co-infection among influenza A viruses and other
respiratory viruses (that have circulated between 2007 and 2012, including the pandemic
influenza A virus), and disease outcome. It is therefore imperative to investigate what other
factors, apart from co-infections, could contribute to severe disease. This review will help
answer, indirectly, the research question: “Did mutations previously describes to increase
109
severity of influenza A viruses occur in pandemic influenza A(H1N1)pdm09 virus that circulated
between 2009 and 2012?”
The objectives of the review therefore were:
1. To investigate the occurrence of HA mutations D222E, D222G and D222N, PB2
mutation E627K or D701N and NS1 mutations T123V, R38A, K41A, E96A or E97A in
mild, severe and fatal cases of influenza A(H1N1)pdm09.
2. To determine which mutation should be regarded as one that posed a major public health
concern.
3. To determine whether any other unknown new mutations on the HA, PB2 and NS1 gene
were associated with severe disease outcome.
2.5.3. Methodology
2.5.3.1. Protocol for the review
The authors of this manuscript developed the protocol of this review. The protocol was not
published or deposited to any online server.
2.5.3.2. Search strategy
The MEDLINE, EMBASE and WEB of Science databases were searched for primary
epidemiological studies on the role of the PB2, NS1 and HA genes in driving influenza virus A
severity. Specifically the search aimed at identifying literature on PB2 gene and its role in
promoting virus replication under high temperature, NS1 and inhibition of interferon production
and the role of HA mutations on glycosylation site, antigenic sites and receptor binding sites or
its vicinity, and observed outcomes in patients (mild, severe or fatal). Websites of health
organisations e.g. the WHO, UK Health Protection Agency, Centre for Disease control -USA,
World Influenza Network Centre, were visited to check Influenza bibliography references listed
therein or any published reports on influenza. Also reference lists of good quality studies,
identified through the electronic sources, were examined to look for studies addressing the
question under review.
For the electronic databases, the search technique involved combining a number of subject
headings, keywords, and scoping for text words including: Orthomyxovirus, influenza virus,
influenza A virus type H1N1, 2009 pandemic influenza virus, influenza A(H1N1)pdm09,
influenza virus haemagglutinin, HA gene, PB2 gene, non-structural protein 1, NS1, evolution,
molecular evolution, mutation, genetic mutation, virus mutation, genetic evolution, antigenicity,
110
prognosis, virulence, virulence, virus virulence, severity, severe disease, mild disease,
pathogenicity, hospitalization, admission, ICU, death, fatality, and mortality. A copy of the
electronic search conducted for this review on EMBASE is provided in supplementary Table S4,
at the last pages of this thesis as an example.
2.5.3.3. Study assessment tool and study selection criteria
The Preferred Reporting Items for Systematic Reviews and Meta-Analyses (PRISMA) guideline
for reporting systematic reviews and meta-analysis (109) and the Strengthening the Reporting of
Observational Studies in Epidemiology (STROBE) (108) tools were used as checklist for
writing this review and for critical appraisal of identified epidemiological studies. The principal
investigator of this review carried out the online and manual searches. Titles and abstracts were
first reviewed for relevance and those that were clearly not relevant (e.g. mutations on HA, PB2
and NS1 genes of pandemic Flu A(H1N1)pdm09 induces virulence in ferrets, mouse adapted
influenza A(H1N1) PB2, E627K mutation of H9N2 avian influenza virulence), were removed.
Papers that met minimum inclusion criteria were downloaded and read in full. A range of
epidemiological studies i.e. cross-sectional, case-control, or cohort studies, with endpoints of
laboratory confirmed influenza virus infection and prognosis of the patients i.e. mild, severe or
fatal [according to November 2009 WHO criteria for clinical classification of the disease due to
the pandemic virus (488)] were included. Due to inadequacy of genetic studies of large sample
sizes, studies with a sample size of ≥5 were included. Studies that did not investigate the role of
either PB2, NS1 and HA genes in driving influenza virus A viruses virulence, or did not report
the outcome which was being considered by this study, or were not written in English language,
were poorly designed and conducted e.g. the analysis did not give exact mutations that were
identified, or did not link observed mutations to prognosis and disease outcome, were excluded.
2.5.3.4. Assessment of bias in the studies
Since the included studies are not randomized control trials, they would be prone to bias due to
uncontrolled confounding factors such as: the study population and period of virus identification
[the representativeness of the population to the general population of viruses which were
circulating arising mainly due to differential surveillance (systematic differences in the way the
virus was identified from various study groups i.e. random sampling of severe or mild cases), or
what laboratory protocols used (PCR or not), and the possibility of contamination of samples];
data sources and measurement of outcomes (mutations and clinical disease outcomes) and the
type of outcome measure adopted e.g. classifying patients as mild, or severe (clinicians will use
different guidelines, what was classified as severe by one clinician might be classified as mild by
another. Bias due to co-infection with other respiratory viruses and bacteria, some of the patients
111
may have been infected with more than one respiratory virus and this, might have also
influenced the outcome. Bias by indication, such as comorbidities, immune status. Bias due to
other confounders such as, age of patients, vaccination status, immune status, and the kind of
clinical treatment they were given. All the studies included in this review were assessed using
the PRIMA guideline and a summary of the scores for the 18 included studies is provided in
supplementary Table 2.5S3.
2.5.3.5. Data extraction and statistical analysis
A data extraction form was designed by the principal investigator of this study and confirmed by
the co-authors. Data extracted from the studies included: the study setting i.e. author and year of
publication, where and when it was conducted, study design i.e. the viruses and genes that were
analysed, type of diagnostic method(s) used, observed mutations, prognosis in patients (mild,
moderate, severe, disease or death(s) associated with specific mutations). Association between
mutation type and disease outcome was assessed using risk differences. The differences between
these statistics was assessed using difference of two proportions (at significance level of α =
0.05), differences and results summarized using forest plots.
2.5.4. Results
2.5.4.1. Characteristics of the included studies
Two thousand Three hundred and ninety three (2,393) were obtained from the searches
conducted on MEDLINE, EMBASE and WEB of Science of which 307 were from MEDLINE,
703 from EMBASE and 1,383 from WEB of Science. Manual search of other published papers
yielded 25 papers. After removing the duplicates and irrelevant papers, 98 papers were reviewed.
Eighty (80) more papers were found ineligible to be included and were excluded, and 18 papers
were included in the systematic review (Figure 2.18). The included studies were conducted in
2009 and 2010 and published between 2010 and 2013.
Details of the studies included in this review are summarized in Table 2.10. Identified studies
were from all over the world; One from North America, 3 from South America, 6 from Europe, 1
from the Middle East, 5 from Asia, and 2 from Africa. Out of the 18 studies, 4 [Potdar et al.,
(489), Tse et al., (490), Baldanti et al., (491), and the Promed Email (492)] were conducted
during the first wave (April – September 2009), the majority, 9 [Puzelli et al., (493), Kilander et
al., (494), Mak et al., (495), Miller et al., (496), Graham et al., (497), Farooqui et al., (498), Chen
et al., (499), Venter et al., (500), and Akcay Ciblak et al., (501)] covered the 1st and second
wave, 1 [Vazquez-Perez et al., (502)] covered only the 2nd wave, 2 [Wedde et al., (503) and
Moussi et al., (504)] covered the 1st and 3rd wave, and 2 [Ferriera et al., (505) and Barrero et al.,
112
(506)] covered all the 3 waves of the 2009 influenza A(H1N1) pandemic – Table 2.10. The
number of viruses sequenced ranged from 13 to 357; 11 studies only sequenced the HA gene, 3
sequenced the HA, PB2 and NS1 genes, 2 sequenced the HA and PB2/NS1 and 1 sequenced
only the PB2 – Table 2.5S3.
2.5.4.2. Possible sources of bias in the included studies
The PRIMA guideline was used to assess bias in the included studies and the results are
presented in supplementary Table 2.5S3. The first issue concerns possibility of selection bias.
None of the included studies sequenced all the Flu Apdm09 viruses identified during the study
periods. It is understandable, because such an exercise would be very expensive. In that case,
samples were selected from the pool of the Flu Apdm09 viruses, with each study adopting its
own criteria to achieve representativeness. The age of the severe and fatal cases was mainly
people aged >5 -30 years and very few children ≤5 years old. This is not surprising as the
epidemiological studies have documented that the pandemic virus peaked in the 5 – 19 year olds
(213). Some studies did not control for comorbidities and other factors known to affect diseases
severity. Only one study each investigated bacterial, and other respiratory virus co-infections
respectively. Therefore these shortfalls should be born in mind when interpreting the results of
this review.
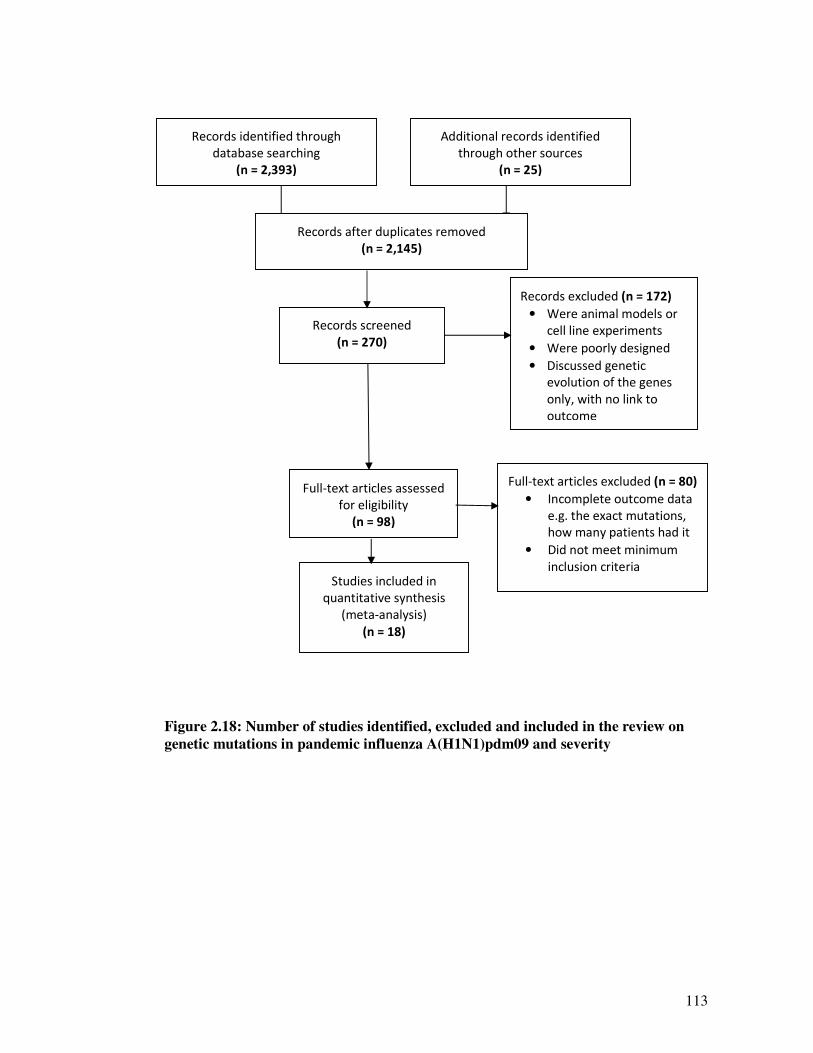
113
Figure 2.18: Number of studies identified, excluded and included in the review on
genetic mutations in pandemic influenza A(H1N1)pdm09 and severity
Records identified through
database searching
(n = 2,393)
Additional records identified
through other sources
(n = 25)
Records after duplicates removed
(n = 2,145)
Records screened
(n = 270)
Records excluded (n = 172)
• Were animal models or
cell line experiments
• Were poorly designed
• Discussed genetic
evolution of the genes
only, with no link to
outcome
Full-text articles assessed
for eligibility
(n = 98)
Full-text articles excluded (n = 80)
• Incomplete outcome data
e.g. the exact mutations,
how many patients had it
• Did not meet minimum
inclusion criteria
Studies included in
quantitative synthesis
(meta-analysis)
(n = 18)
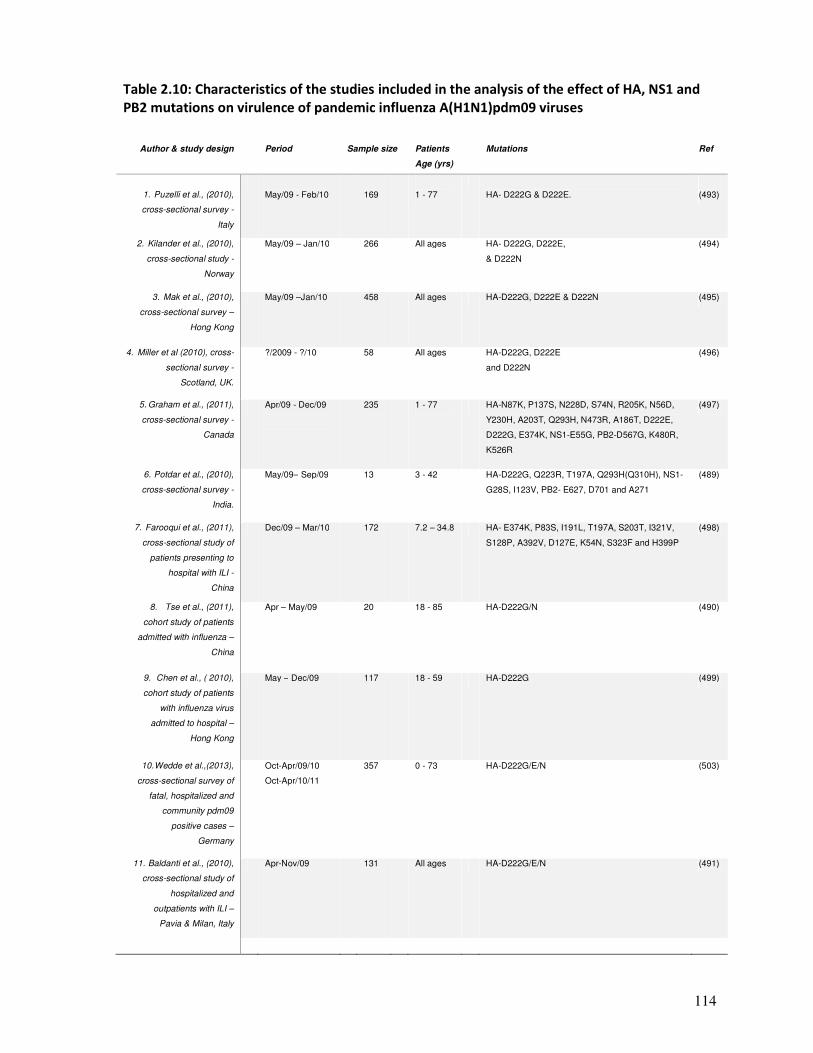
114
Table 2.10: Characteristics of the studies included in the analysis of the effect of HA, NS1 and
PB2 mutations on virulence of pandemic influenza A(H1N1)pdm09 viruses
Author & study design
Period
Sample size
Patients
Age (yrs)
Mutations
Ref
1. Puzelli et al., (2010),
cross-sectional survey -
Italy
May/09 - Feb/10
169
1 - 77
HA- D222G & D222E.
(493)
2. Kilander et al., (2010),
cross-sectional study -
Norway
May/09 – Jan/10 266 All ages HA- D222G, D222E,
& D222N
(494)
3. Mak et al., (2010),
cross-sectional survey –
Hong Kong
May/09 –Jan/10 458 All ages HA-D222G, D222E & D222N (495)
4. Miller et al (2010), cross-
sectional survey -
Scotland, UK.
?/2009 - ?/10
58 All ages HA-D222G, D222E
and D222N
(496)
5. Graham et al., (2011),
cross-sectional survey -
Canada
Apr/09 - Dec/09
235 1 - 77 HA-N87K, P137S, N228D, S74N, R205K, N56D,
Y230H, A203T, Q293H, N473R, A186T, D222E,
D222G, E374K, NS1-E55G, PB2-D567G, K480R,
K526R
(497)
6. Potdar et al., (2010),
cross-sectional survey -
India.
May/09– Sep/09 13 3 - 42 HA-D222G, Q223R, T197A, Q293H(Q310H), NS1-
G28S, I123V, PB2- E627, D701 and A271
(489)
7. Farooqui et al., (2011),
cross-sectional study of
patients presenting to
hospital with ILI -
China
Dec/09 – Mar/10 172 7.2 – 34.8 HA- E374K, P83S, I191L, T197A, S203T, I321V,
S128P, A392V, D127E, K54N, S323F and H399P
(498)
8. Tse et al., (2011),
cohort study of patients
admitted with influenza –
China
Apr – May/09 20 18 - 85 HA-D222G/N (490)
9. Chen et al., ( 2010),
cohort study of patients
with influenza virus
admitted to hospital –
Hong Kong
May – Dec/09 117 18 - 59 HA-D222G (499)
10. Wedde et al.,(2013),
cross-sectional survey of
fatal, hospitalized and
community pdm09
positive cases –
Germany
Oct-Apr/09/10
Oct-Apr/10/11
357 0 - 73 HA-D222G/E/N (503)
11. Baldanti et al., (2010),
cross-sectional study of
hospitalized and
outpatients with ILI –
Pavia & Milan, Italy
Apr-Nov/09 131 All ages HA-D222G/E/N (491)
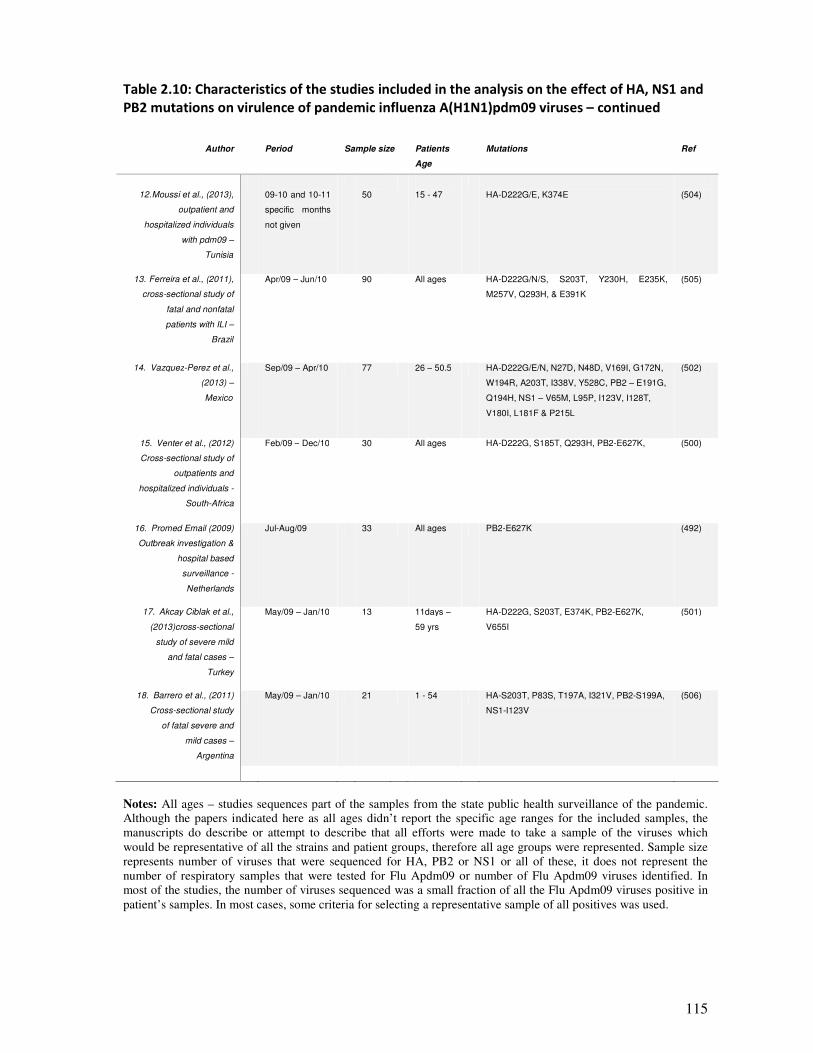
115
Table 2.10: Characteristics of the studies included in the analysis on the effect of HA, NS1 and
PB2 mutations on virulence of pandemic influenza A(H1N1)pdm09 viruses – continued
Author
Period
Sample size
Patients
Age
Mutations
Ref
12. Moussi et al., (2013),
outpatient and
hospitalized individuals
with pdm09 –
Tunisia
09-10 and 10-11
specific months
not given
50
15 - 47
HA-D222G/E, K374E
(504)
13. Ferreira et al., (2011),
cross-sectional study of
fatal and nonfatal
patients with ILI –
Brazil
Apr/09 – Jun/10 90 All ages HA-D222G/N/S, S203T, Y230H, E235K,
M257V, Q293H, & E391K
(505)
14. Vazquez-Perez et al.,
(2013) –
Mexico
Sep/09 – Apr/10 77 26 – 50.5 HA-D222G/E/N, N27D, N48D, V169I, G172N,
W194R, A203T, I338V, Y528C, PB2 – E191G,
Q194H, NS1 – V65M, L95P, I123V, I128T,
V180I, L181F & P215L
(502)
15. Venter et al., (2012)
Cross-sectional study of
outpatients and
hospitalized individuals -
South-Africa
Feb/09 – Dec/10 30 All ages HA-D222G, S185T, Q293H, PB2-E627K, (500)
16. Promed Email (2009)
Outbreak investigation &
hospital based
surveillance -
Netherlands
Jul-Aug/09 33 All ages PB2-E627K (492)
17. Akcay Ciblak et al.,
(2013)cross-sectional
study of severe mild
and fatal cases –
Turkey
May/09 – Jan/10 13 11days –
59 yrs
HA-D222G, S203T, E374K, PB2-E627K,
V655I
(501)
18. Barrero et al., (2011)
Cross-sectional study
of fatal severe and
mild cases –
Argentina
May/09 – Jan/10 21 1 - 54 HA-S203T, P83S, T197A, I321V, PB2-S199A,
NS1-I123V
(506)
Notes: All ages – studies sequences part of the samples from the state public health surveillance of the pandemic.
Although the papers indicated here as all ages didn’t report the specific age ranges for the included samples, the
manuscripts do describe or attempt to describe that all efforts were made to take a sample of the viruses which
would be representative of all the strains and patient groups, therefore all age groups were represented. Sample size
represents number of viruses that were sequenced for HA, PB2 or NS1 or all of these, it does not represent the
number of respiratory samples that were tested for Flu Apdm09 or number of Flu Apdm09 viruses identified. In
most of the studies, the number of viruses sequenced was a small fraction of all the Flu Apdm09 viruses positive in
patient’s samples. In most cases, some criteria for selecting a representative sample of all positives was used.
116
2.5.4.3. Association between mutations in influenza A(H1N1)pdm09 and severe disease
2.5.4.3.1. HA-D222G mutation and severity
Overall, the evidence suggests that the mutation HA-D222G was associated with severe disease
and mortality. Most of the risk differences on severity and death, and the pooled risk differences
(RD) were statistically significant (pooled RD: 11%, 95% CI: 3.0% - 18.0%, p = 0.004 for
severity and RD: 23%, 95% CI: 14.0% – 31.0%, p = <0.0001 for fatality) – Figure 2.19. It
should however be noted that the I2 statistic for severity indicates that the heterogeneity was
statistically significant (I2: 86.5, p = <0.0001), whereas that for mortality was not. Observational
studies are subject to bias due to uncontrolled confounders. Of the 8 studies included in the
severity analysis, 3; Chen et al., (499), Wedde et al., (503), and Vazquez-Perez et al., (502)
controlled for comorbidities such as pregnancy, hypertension, congenital heart disease,
myocarditis, asthma, diabetes and obesity, whereas the other 5 studies; Puzelli et al., (493),
Kilander et al., (494), Mak et al., (495), miller et al., (496), and Moussi et al., (504) did not
(supplementary Table 2.5S3). Further only Vazquez-Peres investigated and reported bacterial co-
infection (Table 2.5S3), and together these factors might have caused the slight differences.
However, despite this, we think that the evidence supports the hypothesis that D222G increased
risk of severity and mortality.
2.5.4.3.2. Mutation HA-D222E and D222N and disease outcome
Figures 2.20 and 2.23 presents the results of the analysis on association between D222E and
D222N and severity. For the former, there was no evidence for or against the role of this
mutations and disease severity (pooled RD: -2.0%, 95% CI: -5.0% - 1.0%, p = 0.2, and for RD:
1.0%, 95% CI: -3.0% - 6%, p =0.54). However none of the associations was statistically
significant. More research could, in due course, shed more light on the role of D222E.
As for the mutation D222N, all the risk differences (for individual studies and the pulled RDs)
suggested a positive association between this mutation and more severe disease and death
(pooled RD: 2.0%, 95% CI: 1.0% - 5.0%, p = 0.24 for severity analysis and RD: 5.0%, 95% CI:
1.0% - 9.0%, p = 0.09 for the fatality analysis). However, apart from Tse et al., (490), none of
the RDs for the individual studies were statistically significant (Figure 2.21). The problem here
could also be due to bias by uncontrolled confounders, as the I2 statistics in the mortality was
statistically significant (I2: 73.5, p = 0.001).
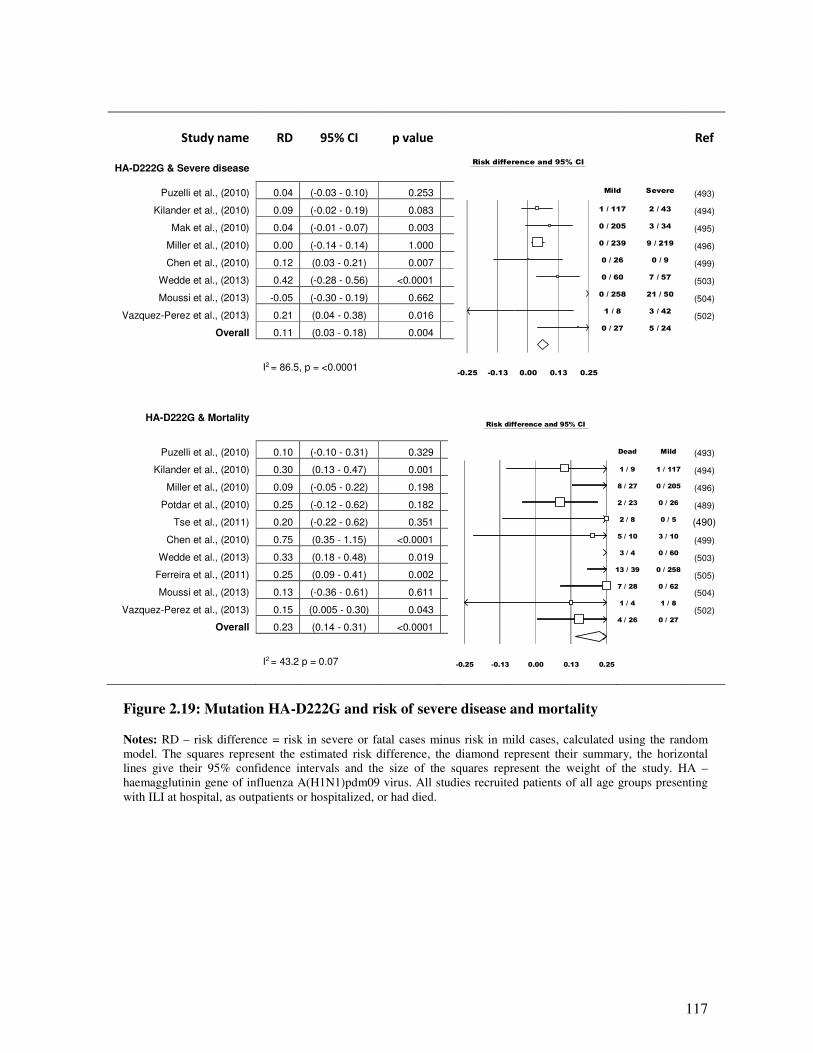
117
Study name RD 95% CI p value
Ref
HA-D222G & Severe disease
Puzelli et al., (2010) 0.04 (-0.03 - 0.10) 0.253 (493)
Kilander et al., (2010) 0.09 (-0.02 - 0.19) 0.083
(494)
Mak et al., (2010) 0.04 (-0.01 - 0.07) 0.003 (495)
Miller et al., (2010) 0.00 (-0.14 - 0.14) 1.000 (496)
Chen et al., (2010) 0.12 (0.03 - 0.21) 0.007
(499)
Wedde et al., (2013) 0.42 (-0.28 - 0.56) <0.0001 (503)
Moussi et al., (2013) -0.05 (-0.30 - 0.19) 0.662 (504)
Vazquez-Perez et al., (2013) 0.21 (0.04 - 0.38) 0.016
(502)
Overall 0.11 (0.03 - 0.18) 0.004
I2 = 86.5, p = <0.0001
HA-D222G & Mortality
Puzelli et al., (2010) 0.10 (-0.10 - 0.31) 0.329
(493)
Kilander et al., (2010) 0.30 (0.13 - 0.47) 0.001
(494)
Miller et al., (2010) 0.09 (-0.05 - 0.22) 0.198
(496)
Potdar et al., (2010) 0.25 (-0.12 - 0.62) 0.182
(489)
Tse et al., (2011) 0.20 (-0.22 - 0.62) 0.351
(490)
Chen et al., (2010) 0.75 (0.35 - 1.15) <0.0001
(499)
Wedde et al., (2013) 0.33 (0.18 - 0.48) 0.019
(503)
Ferreira et al., (2011) 0.25 (0.09 - 0.41) 0.002
(505)
Moussi et al., (2013) 0.13 (-0.36 - 0.61) 0.611
(504)
Vazquez-Perez et al., (2013) 0.15 (0.005 - 0.30) 0.043
(502)
Overall 0.23 (0.14 - 0.31) <0.0001
I2 = 43.2 p = 0.07
Figure 2.19: Mutation HA-D222G and risk of severe disease and mortality
Notes: RD – risk difference = risk in severe or fatal cases minus risk in mild cases, calculated using the random
model. The squares represent the estimated risk difference, the diamond represent their summary, the horizontal
lines give their 95% confidence intervals and the size of the squares represent the weight of the study. HA –
haemagglutinin gene of influenza A(H1N1)pdm09 virus. All studies recruited patients of all age groups presenting
with ILI at hospital, as outpatients or hospitalized, or had died.
Risk difference and 95% CI
Mild Severe
1 / 117 2 / 43
0 / 205 3 / 34
0 / 239 9 / 219
0 / 26 0 / 9
0 / 60 7 / 57
0 / 258 21 / 50
1 / 8 3 / 42
0 / 27 5 / 24
-0.25 -0.13 0.00 0.13 0.25
Risk difference and 95% CI
Dead Mild
1 / 9 1 / 117
8 / 27 0 / 205
2 / 23 0 / 26
2 / 8 0 / 5
5 / 10 3 / 10
3 / 4 0 / 60
13 / 39 0 / 258
7 / 28 0 / 62
1 / 4 1 / 8
4 / 26 0 / 27
-0.25 -0.13 0.00 0.13 0.25
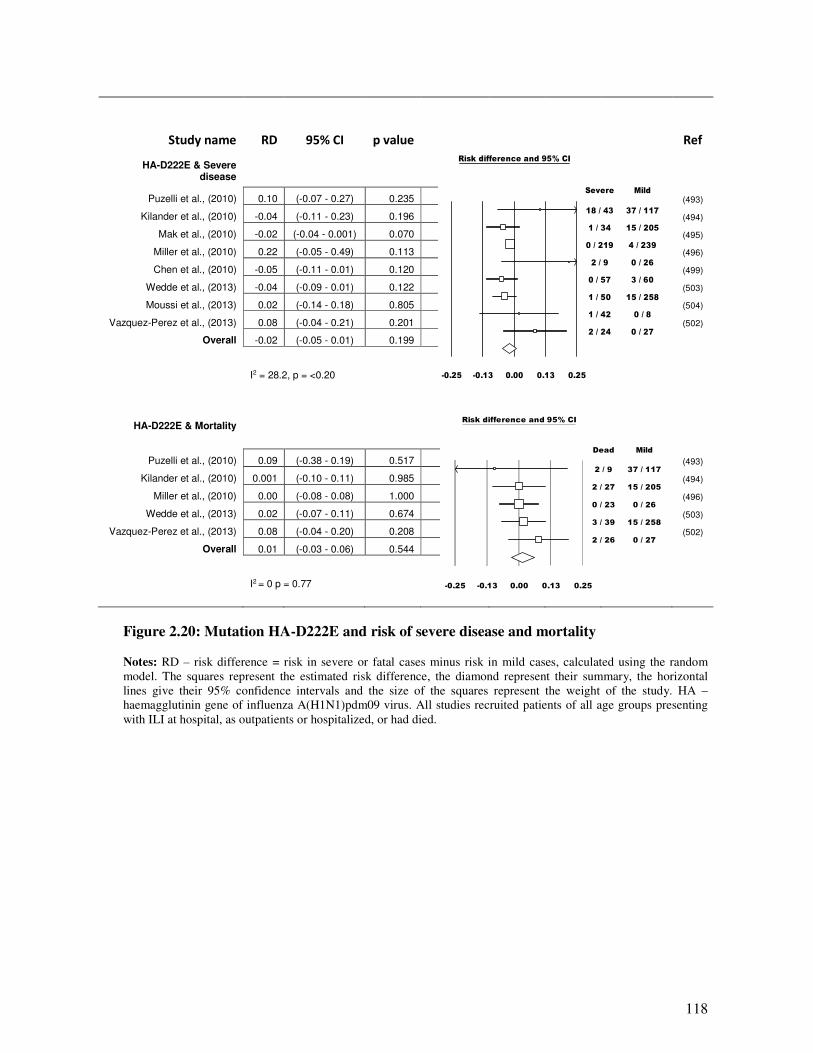
118
Study name RD 95% CI p value
Ref
HA-D222E & Severe disease
Puzelli et al., (2010) 0.10 (-0.07 - 0.27) 0.235 (493)
Kilander et al., (2010) -0.04 (-0.11 - 0.23) 0.196 (494)
Mak et al., (2010) -0.02 (-0.04 - 0.001) 0.070 (495)
Miller et al., (2010) 0.22 (-0.05 - 0.49) 0.113
(496)
Chen et al., (2010) -0.05 (-0.11 - 0.01) 0.120
(499)
Wedde et al., (2013) -0.04 (-0.09 - 0.01) 0.122
(503)
Moussi et al., (2013) 0.02 (-0.14 - 0.18) 0.805
(504)
Vazquez-Perez et al., (2013) 0.08 (-0.04 - 0.21) 0.201
(502)
Overall -0.02 (-0.05 - 0.01) 0.199
I2 = 28.2, p = <0.20
HA-D222E & Mortality
Puzelli et al., (2010) 0.09 (-0.38 - 0.19) 0.517 (493)
Kilander et al., (2010) 0.001 (-0.10 - 0.11) 0.985 (494)
Miller et al., (2010) 0.00 (-0.08 - 0.08) 1.000 (496)
Wedde et al., (2013) 0.02 (-0.07 - 0.11) 0.674 (503)
Vazquez-Perez et al., (2013) 0.08 (-0.04 - 0.20) 0.208 (502)
Overall 0.01 (-0.03 - 0.06) 0.544
I2 = 0 p = 0.77
Figure 2.20: Mutation HA-D222E and risk of severe disease and mortality
Notes: RD – risk difference = risk in severe or fatal cases minus risk in mild cases, calculated using the random
model. The squares represent the estimated risk difference, the diamond represent their summary, the horizontal
lines give their 95% confidence intervals and the size of the squares represent the weight of the study. HA –
haemagglutinin gene of influenza A(H1N1)pdm09 virus. All studies recruited patients of all age groups presenting
with ILI at hospital, as outpatients or hospitalized, or had died.
Risk difference and 95% CI
Severe Mild
18 / 43 37 / 117
1 / 34 15 / 205
0 / 219 4 / 239
2 / 9 0 / 26
0 / 57 3 / 60
1 / 50 15 / 258
1 / 42 0 / 8
2 / 24 0 / 27
-0.25 -0.13 0.00 0.13 0.25
Risk difference and 95% CI
Dead Mild
2 / 9 37 / 117
2 / 27 15 / 205
0 / 23 0 / 26
3 / 39 15 / 258
2 / 26 0 / 27
-0.25 -0.13 0.00 0.13 0.25
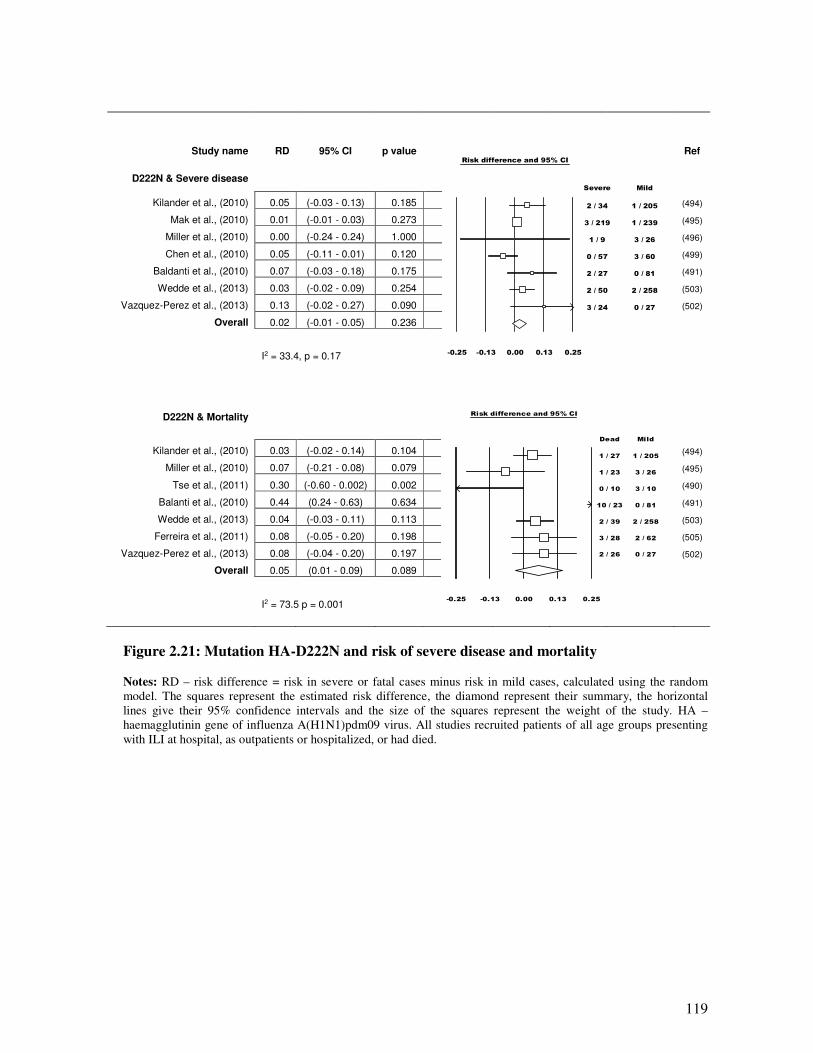
119
Study name RD 95% CI p value
Ref
D222N & Severe disease
Kilander et al., (2010) 0.05 (-0.03 - 0.13) 0.185 (494)
Mak et al., (2010) 0.01 (-0.01 - 0.03) 0.273 (495)
Miller et al., (2010) 0.00 (-0.24 - 0.24) 1.000 (496)
Chen et al., (2010) 0.05 (-0.11 - 0.01) 0.120 (499)
Baldanti et al., (2010) 0.07 (-0.03 - 0.18) 0.175 (491)
Wedde et al., (2013) 0.03 (-0.02 - 0.09) 0.254 (503)
Vazquez-Perez et al., (2013) 0.13 (-0.02 - 0.27) 0.090 (502)
Overall 0.02 (-0.01 - 0.05) 0.236
I2 = 33.4, p = 0.17
D222N & Mortality
Kilander et al., (2010) 0.03 (-0.02 - 0.14) 0.104 (494)
Miller et al., (2010) 0.07 (-0.21 - 0.08) 0.079 (495)
Tse et al., (2011) 0.30 (-0.60 - 0.002) 0.002 (490)
Balanti et al., (2010) 0.44 (0.24 - 0.63) 0.634 (491)
Wedde et al., (2013) 0.04 (-0.03 - 0.11) 0.113 (503)
Ferreira et al., (2011) 0.08 (-0.05 - 0.20) 0.198 (505)
Vazquez-Perez et al., (2013) 0.08 (-0.04 - 0.20) 0.197 (502)
Overall 0.05 (0.01 - 0.09) 0.089
I2 = 73.5 p = 0.001
Figure 2.21: Mutation HA-D222N and risk of severe disease and mortality
Notes: RD – risk difference = risk in severe or fatal cases minus risk in mild cases, calculated using the random
model. The squares represent the estimated risk difference, the diamond represent their summary, the horizontal
lines give their 95% confidence intervals and the size of the squares represent the weight of the study. HA –
haemagglutinin gene of influenza A(H1N1)pdm09 virus. All studies recruited patients of all age groups presenting
with ILI at hospital, as outpatients or hospitalized, or had died.
Risk difference and 95% CI
Severe Mild
2 / 34 1 / 205
3 / 219 1 / 239
1 / 9 3 / 26
0 / 57 3 / 60
2 / 27 0 / 81
2 / 50 2 / 258
3 / 24 0 / 27
-0.25 -0.13 0.00 0.13 0.25
Risk difference and 95% CI
Dead Mild
1 / 27 1 / 205
1 / 23 3 / 26
0 / 10 3 / 10
10 / 23 0 / 81
2 / 39 2 / 258
3 / 28 2 / 62
2 / 26 0 / 27
-0.25 -0.13 0.00 0.13 0.25
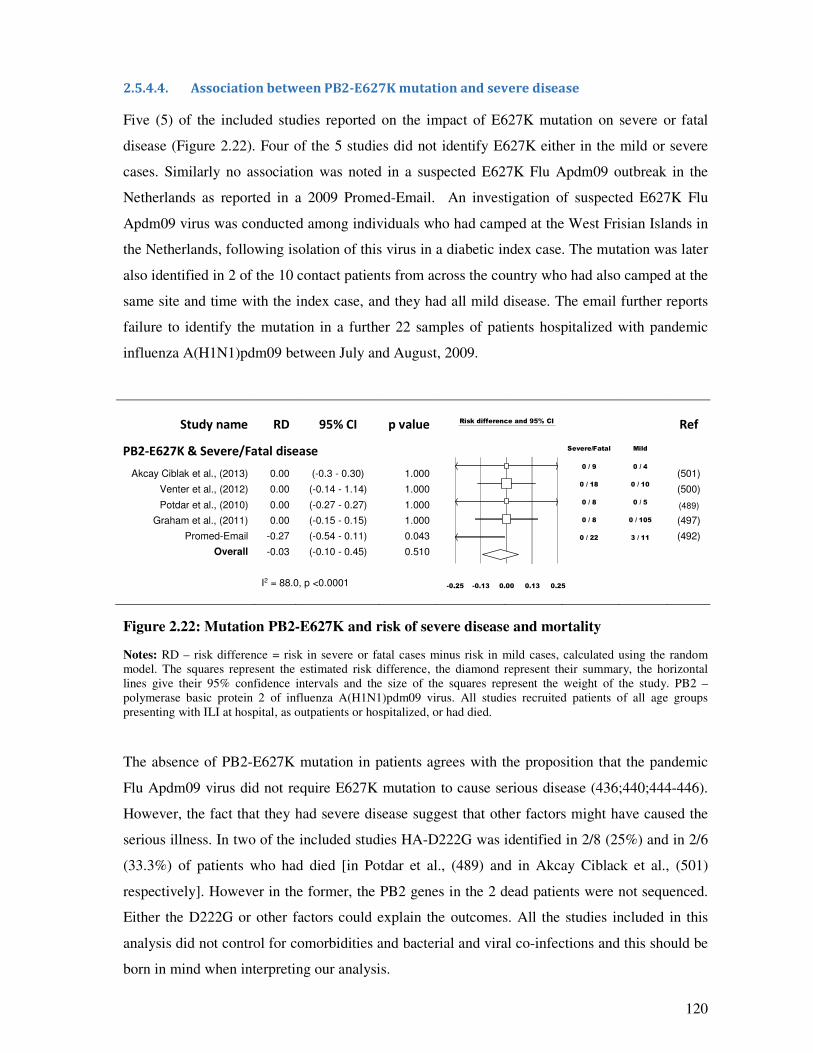
120
2.5.4.4. Association between PB2-E627K mutation and severe disease
Five (5) of the included studies reported on the impact of E627K mutation on severe or fatal
disease (Figure 2.22). Four of the 5 studies did not identify E627K either in the mild or severe
cases. Similarly no association was noted in a suspected E627K Flu Apdm09 outbreak in the
Netherlands as reported in a 2009 Promed-Email. An investigation of suspected E627K Flu
Apdm09 virus was conducted among individuals who had camped at the West Frisian Islands in
the Netherlands, following isolation of this virus in a diabetic index case. The mutation was later
also identified in 2 of the 10 contact patients from across the country who had also camped at the
same site and time with the index case, and they had all mild disease. The email further reports
failure to identify the mutation in a further 22 samples of patients hospitalized with pandemic
influenza A(H1N1)pdm09 between July and August, 2009.
Study name RD 95% CI p value
Ref
PB2-E627K & Severe/Fatal disease
Akcay Ciblak et al., (2013) 0.00 (-0.3 - 0.30) 1.000 (501)
Venter et al., (2012) 0.00 (-0.14 - 1.14) 1.000 (500)
Potdar et al., (2010) 0.00 (-0.27 - 0.27) 1.000
(489)
Graham et al., (2011) 0.00 (-0.15 - 0.15) 1.000
(497)
Promed-Email -0.27 (-0.54 - 0.11) 0.043 (492)
Overall -0.03 (-0.10 - 0.45) 0.510
I2 = 88.0, p <0.0001
Figure 2.22: Mutation PB2-E627K and risk of severe disease and mortality
Notes: RD – risk difference = risk in severe or fatal cases minus risk in mild cases, calculated using the random
model. The squares represent the estimated risk difference, the diamond represent their summary, the horizontal
lines give their 95% confidence intervals and the size of the squares represent the weight of the study. PB2 –
polymerase basic protein 2 of influenza A(H1N1)pdm09 virus. All studies recruited patients of all age groups
presenting with ILI at hospital, as outpatients or hospitalized, or had died.
The absence of PB2-E627K mutation in patients agrees with the proposition that the pandemic
Flu Apdm09 virus did not require E627K mutation to cause serious disease (436;440;444-446).
However, the fact that they had severe disease suggest that other factors might have caused the
serious illness. In two of the included studies HA-D222G was identified in 2/8 (25%) and in 2/6
(33.3%) of patients who had died [in Potdar et al., (489) and in Akcay Ciblack et al., (501)
respectively]. However in the former, the PB2 genes in the 2 dead patients were not sequenced.
Either the D222G or other factors could explain the outcomes. All the studies included in this
analysis did not control for comorbidities and bacterial and viral co-infections and this should be
born in mind when interpreting our analysis.
Risk difference and 95% CI
Severe/Fatal Mild
0 / 9 0 / 4
0 / 18 0 / 10
0 / 8 0 / 5
0 / 8 0 / 105
0 / 22 3 / 11
-0.25 -0.13 0.00 0.13 0.25
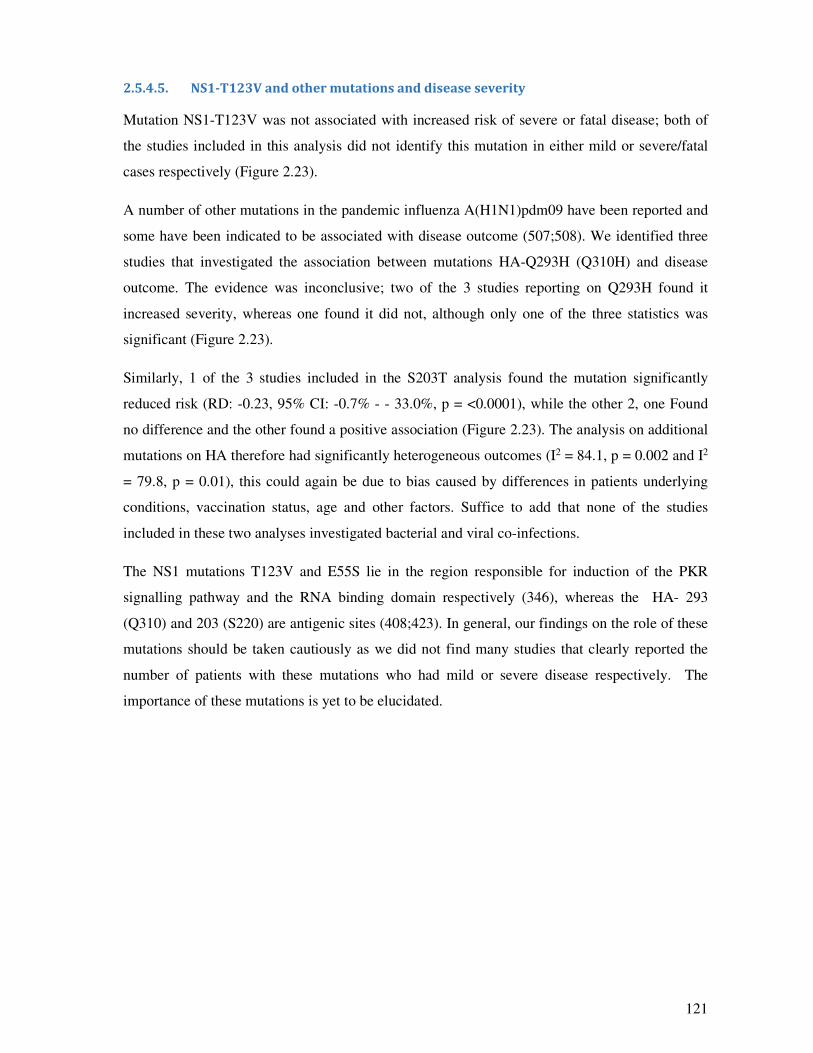
121
2.5.4.5. NS1-T123V and other mutations and disease severity
Mutation NS1-T123V was not associated with increased risk of severe or fatal disease; both of
the studies included in this analysis did not identify this mutation in either mild or severe/fatal
cases respectively (Figure 2.23).
A number of other mutations in the pandemic influenza A(H1N1)pdm09 have been reported and
some have been indicated to be associated with disease outcome (507;508). We identified three
studies that investigated the association between mutations HA-Q293H (Q310H) and disease
outcome. The evidence was inconclusive; two of the 3 studies reporting on Q293H found it
increased severity, whereas one found it did not, although only one of the three statistics was
significant (Figure 2.23).
Similarly, 1 of the 3 studies included in the S203T analysis found the mutation significantly
reduced risk (RD: -0.23, 95% CI: -0.7% - - 33.0%, p = <0.0001), while the other 2, one Found
no difference and the other found a positive association (Figure 2.23). The analysis on additional
mutations on HA therefore had significantly heterogeneous outcomes (I2 = 84.1, p = 0.002 and I2
= 79.8, p = 0.01), this could again be due to bias caused by differences in patients underlying
conditions, vaccination status, age and other factors. Suffice to add that none of the studies
included in these two analyses investigated bacterial and viral co-infections.
The NS1 mutations T123V and E55S lie in the region responsible for induction of the PKR
signalling pathway and the RNA binding domain respectively (346), whereas the HA- 293
(Q310) and 203 (S220) are antigenic sites (408;423). In general, our findings on the role of these
mutations should be taken cautiously as we did not find many studies that clearly reported the
number of patients with these mutations who had mild or severe disease respectively. The
importance of these mutations is yet to be elucidated.
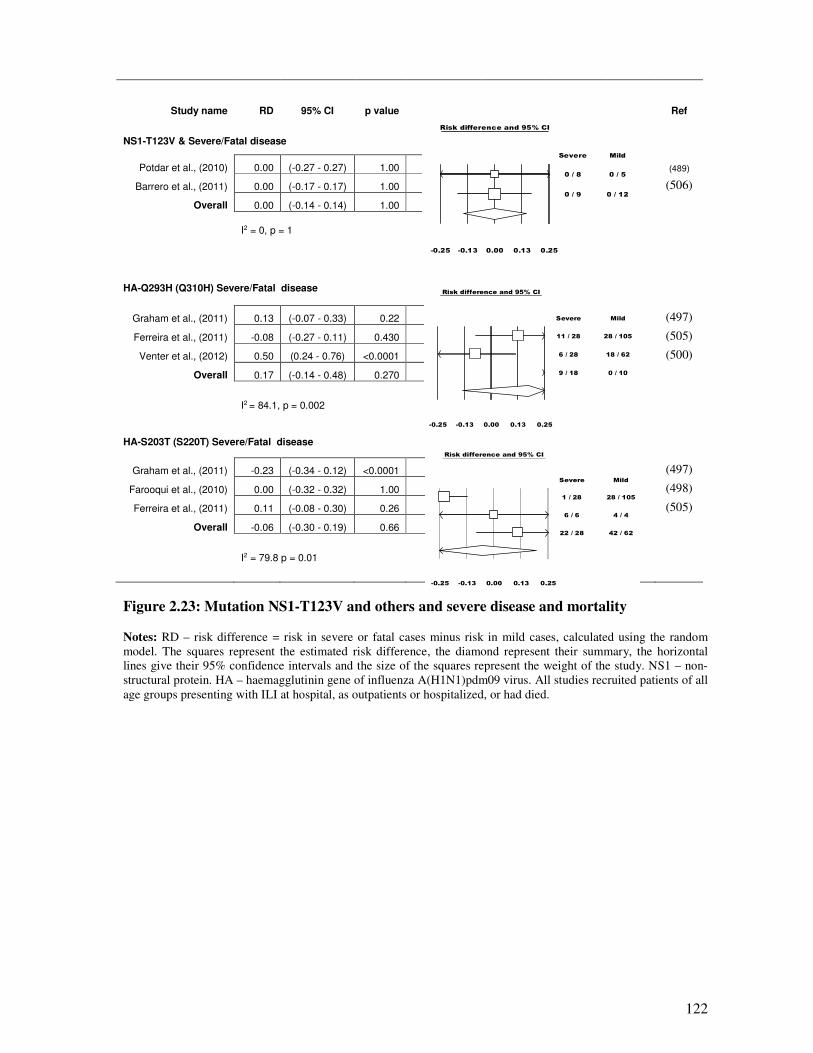
122
Study name RD 95% CI p value
Ref
NS1-T123V & Severe/Fatal disease
Potdar et al., (2010) 0.00 (-0.27 - 0.27) 1.00
(489)
Barrero et al., (2011) 0.00 (-0.17 - 0.17) 1.00 (506)
Overall 0.00 (-0.14 - 0.14) 1.00
I2 = 0, p = 1
HA-Q293H (Q310H) Severe/Fatal disease
Graham et al., (2011) 0.13 (-0.07 - 0.33) 0.22 (497)
Ferreira et al., (2011) -0.08 (-0.27 - 0.11) 0.430
(505)
Venter et al., (2012) 0.50 (0.24 - 0.76) <0.0001 (500)
Overall 0.17 (-0.14 - 0.48) 0.270
I2 = 84.1, p = 0.002
HA-S203T (S220T) Severe/Fatal disease
Graham et al., (2011) -0.23 (-0.34 - 0.12) <0.0001 (497)
Farooqui et al., (2010) 0.00 (-0.32 - 0.32) 1.00
(498)
Ferreira et al., (2011) 0.11 (-0.08 - 0.30) 0.26 (505)
Overall -0.06 (-0.30 - 0.19) 0.66
I2 = 79.8 p = 0.01
Figure 2.23: Mutation NS1-T123V and others and severe disease and mortality
Notes: RD – risk difference = risk in severe or fatal cases minus risk in mild cases, calculated using the random
model. The squares represent the estimated risk difference, the diamond represent their summary, the horizontal
lines give their 95% confidence intervals and the size of the squares represent the weight of the study. NS1 – non-
structural protein. HA – haemagglutinin gene of influenza A(H1N1)pdm09 virus. All studies recruited patients of all
age groups presenting with ILI at hospital, as outpatients or hospitalized, or had died.
Risk difference and 95% CI
Severe Mild
0 / 8 0 / 5
0 / 9 0 / 12
-0.25 -0.13 0.00 0.13 0.25
Risk difference and 95% CI
Severe Mild
11 / 28 28 / 105
6 / 28 18 / 62
9 / 18 0 / 10
-0.25 -0.13 0.00 0.13 0.25
Risk difference and 95% CI
Severe Mild
1 / 28 28 / 105
6 / 6 4 / 4
22 / 28 42 / 62
-0.25 -0.13 0.00 0.13 0.25
123
2.5.5. Discussion and conclusion
This review found that mutation HA-D222G significantly increased risk of severe disease and
fatality. Mutation HA-D222N was also found to be positively associated but this was not
statistically significant. However, there was no evidence linking mutation HA-D222E with
severe disease. The D222G and D222N single and mixed variants have been found in pandemic
viruses from approximately 20 countries, including Norway, Mexico, Ukraine and the USA
(482;507;508). Influenza viruses constantly change their genetic material - antigenic drift
(348;404;407), historical understanding of positively selected sites may help understand the
relevance of observed mutations. Position 222 resides in the receptor binding site of the HA
protein and may possibly influence binding specificity. The HA from the 1918 H1N1 pandemic
switched from avian to human receptor specificity through mutation at two positions G187D and
D222G (415); the A/New York/1/18 strain of the 1918 pandemic possessed a glycine (G) at
position 222 and this markedly affected receptor binding, reducing α2-6 preference and
increasing α2-3; the A/Memphis/42/1983, had an asparagine (N); whereas the 2009 pandemic
influenza virus A/C/04/2009 had an aspartic acid (D) on this position (Table 2.5S2). The results
of our study could therefore be useful in public health applications. Other HA mutations reported
by studies summarized in this review include; D293G (Q310H), S203T (S220T), E374K,
N156D, and N370H in the UK substitution (12). The importance of these mutations is yet to be
elucidated.
No association was observed between mutations PB2-E627K and NS1-T123V and severe and
fatal disease. Mutation PB2-E627K has previously been describe in animal models to be
associated with severe disease, the glutamic acid (E) is generally found in avian influenza
viruses, while lysine (K) is found in human viruses; i.e. this mutation determines host specificity
(435). In experiments with single gene reassortants of influenza viruses, it was shown that
changes in the NP, basic polymerase-2 (PB2), and M1 proteins were involved in host restriction
in monkeys (509), while attenuation of human viruses was achieved in human volunteers by
changes in the NP, non-structural- 1 (NS1), and PB1 and PB2 proteins (510). The virulence of
the pandemic virus has been reported to be affected by E627K by some studies is (447), but said
to not be necessary by others (436;440;444-446). The finding in this review supports the latter.
The NS1 mutations T123V and E55S lie in the region responsible for induction of the PKR
signalling pathway and the RNA binding domain respectively (346) and therefore aids in virus
replication. In this review, viruses that circulated had the mild PB2 and NS1 phenotypes
(489;497;506;508;511;512). Other mutations on the NS1 and PB2 genes reported by studies
included in this review include; PB2-K340N and NS1-G28S, E55G, G154R and T215P
124
(482;508). It should be noted that our results are prone to sampling, diagnostic/information bias.
None of the included studies sequenced all the viruses they identified. Each study used their own
sampling method to achieve representativeness of the strains circulating during the study period.
There is a possibility that the samples included were not representative enough of the virulence
mutations in circulation and that could affect the outcome in this study. Also not all included
studies sequences the PB2 and NS1 genes, most of the studies sequenced only the HA gene.
Perhaps there could be a different outcome if all the 18 included studies had sequenced the PB2
and NS1 genes in addition to the HA gene.
The limitations of this study include possible reporting, publication or selection bias. A number
of factors e.g. underlying chronic conditions, age, vaccination and patient’s immune status, and
co-infections between influenza and other respiratory viruses and with bacteria may affect the
severity of influenza virus infections. However, some of the studies reviewed here did not
control for these factors (Table 2.5S3) and this might bias the reported outcome. Regarding
selection or reporting bias, we might not have been able to identify and include other studies. In
addition, our inclusion of only studies that were written in the English language, might have
further confounded this problem. However, three electronic data bases were used (MEDLINE,
EMBASE and WEB of Science). In addition, official websites of different organisations were
visited to identify recommended references. It is believed that such an extensive effort
significantly reduced, if not eliminated, reporting, selection, and publication bias. Suffice to add
that a systematic error may have occurred in the designing and execution of studies included in
this review e.g. preferential admission and sample collection of only severe cases, laboratory
contamination or poor laboratory techniques would cause this study to inherit selection bias or
information bias. However, a standardised method for scrutinising the quality of studies included
in this study (PRISMA and STROBE) was adopted. Where studies had shortfalls, these shortfalls
have been mentioned as part of the reporting process (Table 2.5S3).
Studies have well documented the role of bacterial co-infection in causing ARIs and pneumonia.
A 2012 review by Punpanich and Chotpitayasunondh (15) reported that 43% of the pandemic
influenza A(H1N1)pdm09 virus associated paediatric deaths had bacterial co-infection. Similar
reports have been made by Ruuskanen et al., (59). On the other hand, respiratory virus co-
infections have been associated with severe disease outcome (76;513-517). However, in this
review, only Vazquez-Perez (502) and Barrero et al., (506) reported on patterns of bacterial co-
infections and respiratory virus co-infections respectively. Respiratory virus infection might lead
to destruction of epithelial cells, giving a leeway to bacterial infection [Peltola and McCullers
(60) and Bakaletz et al., (61)], or it could be the other way round. Sequential studies
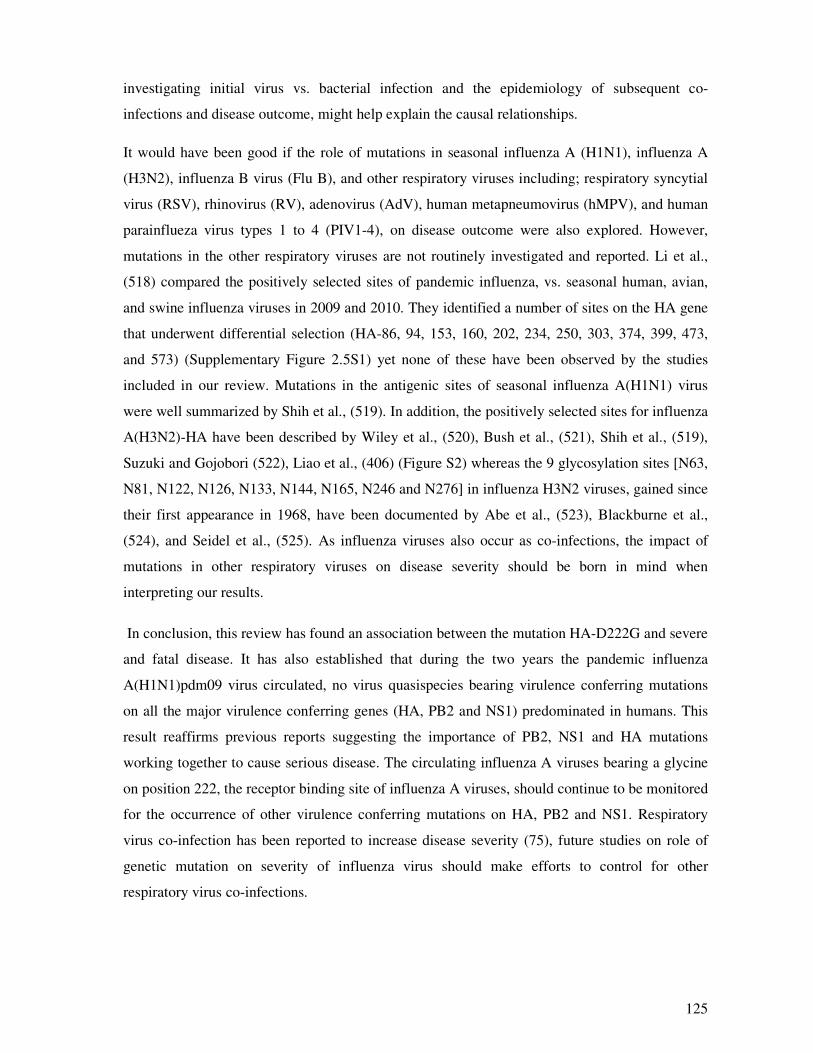
125
investigating initial virus vs. bacterial infection and the epidemiology of subsequent co-
infections and disease outcome, might help explain the causal relationships.
It would have been good if the role of mutations in seasonal influenza A (H1N1), influenza A
(H3N2), influenza B virus (Flu B), and other respiratory viruses including; respiratory syncytial
virus (RSV), rhinovirus (RV), adenovirus (AdV), human metapneumovirus (hMPV), and human
parainflueza virus types 1 to 4 (PIV1-4), on disease outcome were also explored. However,
mutations in the other respiratory viruses are not routinely investigated and reported. Li et al.,
(518) compared the positively selected sites of pandemic influenza, vs. seasonal human, avian,
and swine influenza viruses in 2009 and 2010. They identified a number of sites on the HA gene
that underwent differential selection (HA-86, 94, 153, 160, 202, 234, 250, 303, 374, 399, 473,
and 573) (Supplementary Figure 2.5S1) yet none of these have been observed by the studies
included in our review. Mutations in the antigenic sites of seasonal influenza A(H1N1) virus
were well summarized by Shih et al., (519). In addition, the positively selected sites for influenza
A(H3N2)-HA have been described by Wiley et al., (520), Bush et al., (521), Shih et al., (519),
Suzuki and Gojobori (522), Liao et al., (406) (Figure S2) whereas the 9 glycosylation sites [N63,
N81, N122, N126, N133, N144, N165, N246 and N276] in influenza H3N2 viruses, gained since
their first appearance in 1968, have been documented by Abe et al., (523), Blackburne et al.,
(524), and Seidel et al., (525). As influenza viruses also occur as co-infections, the impact of
mutations in other respiratory viruses on disease severity should be born in mind when
interpreting our results.
In conclusion, this review has found an association between the mutation HA-D222G and severe
and fatal disease. It has also established that during the two years the pandemic influenza
A(H1N1)pdm09 virus circulated, no virus quasispecies bearing virulence conferring mutations
on all the major virulence conferring genes (HA, PB2 and NS1) predominated in humans. This
result reaffirms previous reports suggesting the importance of PB2, NS1 and HA mutations
working together to cause serious disease. The circulating influenza A viruses bearing a glycine
on position 222, the receptor binding site of influenza A viruses, should continue to be monitored
for the occurrence of other virulence conferring mutations on HA, PB2 and NS1. Respiratory
virus co-infection has been reported to increase disease severity (75), future studies on role of
genetic mutation on severity of influenza virus should make efforts to control for other
respiratory virus co-infections.

126
Funding: This work received no funding from any funding organization.
Acknowledgements: The authors would like to acknowledge the University of Manchester, the
Manchester Academic Health Science Centre.
Conflict of interest: All authors, no conflict of interest.
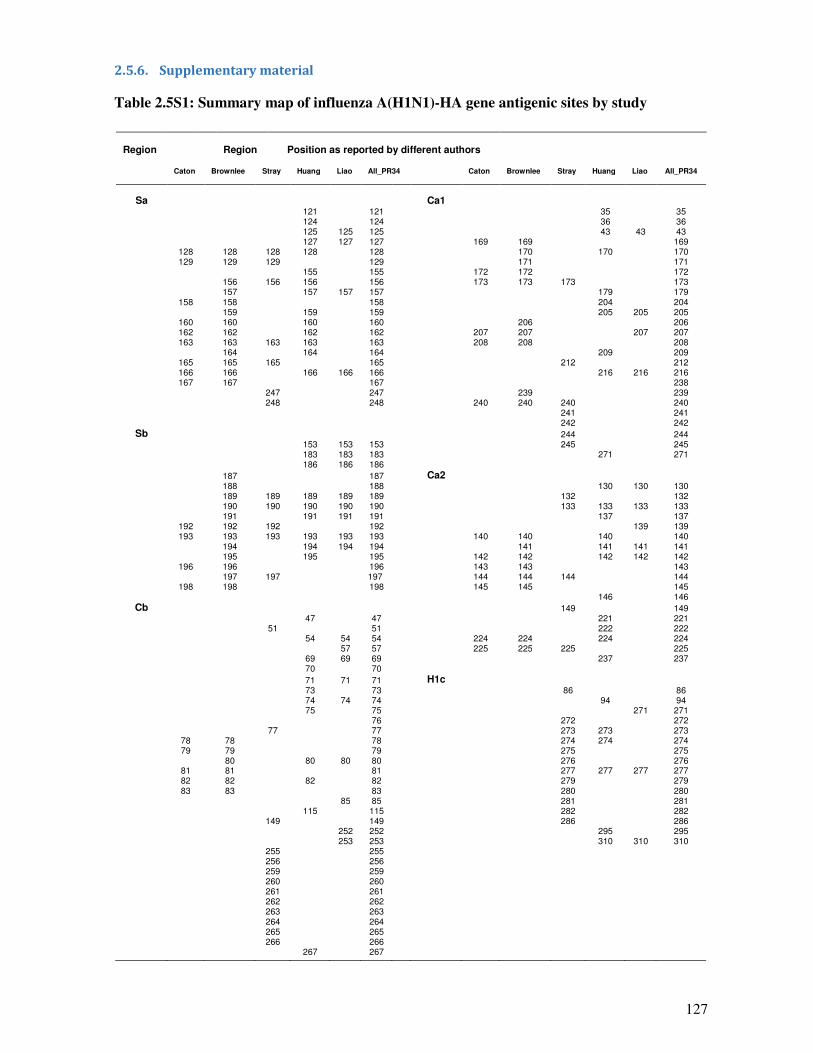
127
2.5.6. Supplementary material
Table 2.5S1: Summary map of influenza A(H1N1)-HA gene antigenic sites by study
Region
Region Position as reported by different authors
Caton
Brownlee
Stray
Huang
Liao
All_PR34
Caton
Brownlee
Stray
Huang
Liao
All_PR34
Sa Ca1 121 121 35 35 124 124 36 36 125 125 125 43 43 43 127 127 127 169 169 169
128 128 128 128 128 170 170 170 129 129 129 129 171 171
155 155 172 172 172 156 156 156 156 173 173 173 173 157 157 157 157 179 179
158 158 158 204 204 159 159 159 205 205 205
160 160 160 160 206 206 162 162 162 162 207 207 207 207 163 163 163 163 163 208 208 208
164 164 164 209 209 165 165 165 165 212 212 166 166 166 166 166 216 216 216 167 167 167 238
247 247 239 239 248 248 240 240 240 240
241 241 242 242
Sb 244 244 153 153 153 245 245 183 183 183 271 271 186 186 186
187
187
Ca2
188
188
130 130 130
189 189 189 189 189
132
132
190 190 190 190 190 133 133 133 133 191 191 191 191 137 137
192 192 192 192 139 139 193 193 193 193 193 193 140 140 140 140
194 194 194 194 141 141 141 141 195 195 195 142 142 142 142 142
196 196 196 143 143 143 197 197 197 144 144 144 144
198 198 198 145 145 145 146 146
Cb
149
149
47
47
221
221
51
51
222
222
54 54 54
224 224
224
224
57 57
225 225 225
225
69 69 69
237
237
70
70
71 71 71 H1c 73 73 86 86 74 74 74 94 94 75 75 271 271
76 272 272 77 77 273 273 273
78 78 78 274 274 274 79 79 79 275 275
80
80 80 80
276
276
81 81
81
277 277 277 277
82 82
82
82
279
279
83 83
83
280
280
85 85
281
281
115
115
282
282
149
149
286
286
252 252
295
295
253 253
310 310 310
255 255 256 256 259 259 260 260 261 261 262 262 263 263 264 264 265 265 266 266
267 267

128
Notes: Antigenic sites as reported by Caton et al., (418), Brownlee et al., (421), Huang et al., (423), Liao et al., (406).
The other authors numbering was based on influenza A/PR/8/1934 virus. A number of methods are used to identify
positively selected sites on the HA gene including: a serological method, the haemagglutination inhibition assay (HI);
genetic methods such as: pairwise analysis of the genome and determination of positively selected codons by
comparing differences between non-synonymous (non-silent) vs. synonymous (silent) codon substitutions (ω=dN/dS),
mapping amino acid changes using maximum parsimony tree, Shannon entropy (amino acid variation) and likelihood
ratio (for a given antigenic site - LR), or use of the hamming distance to determine the percentage difference between
vaccine strains (Pepitope), and determination of amino or 3D crystal structure of HA constructed using homology
modelling (405;406;423;424;519;521;526-529). The HI and 3D genetic comparison the 3D being the most commonly
used. The studies here used one or more of these methods to determine that these sites are antigenic sites.
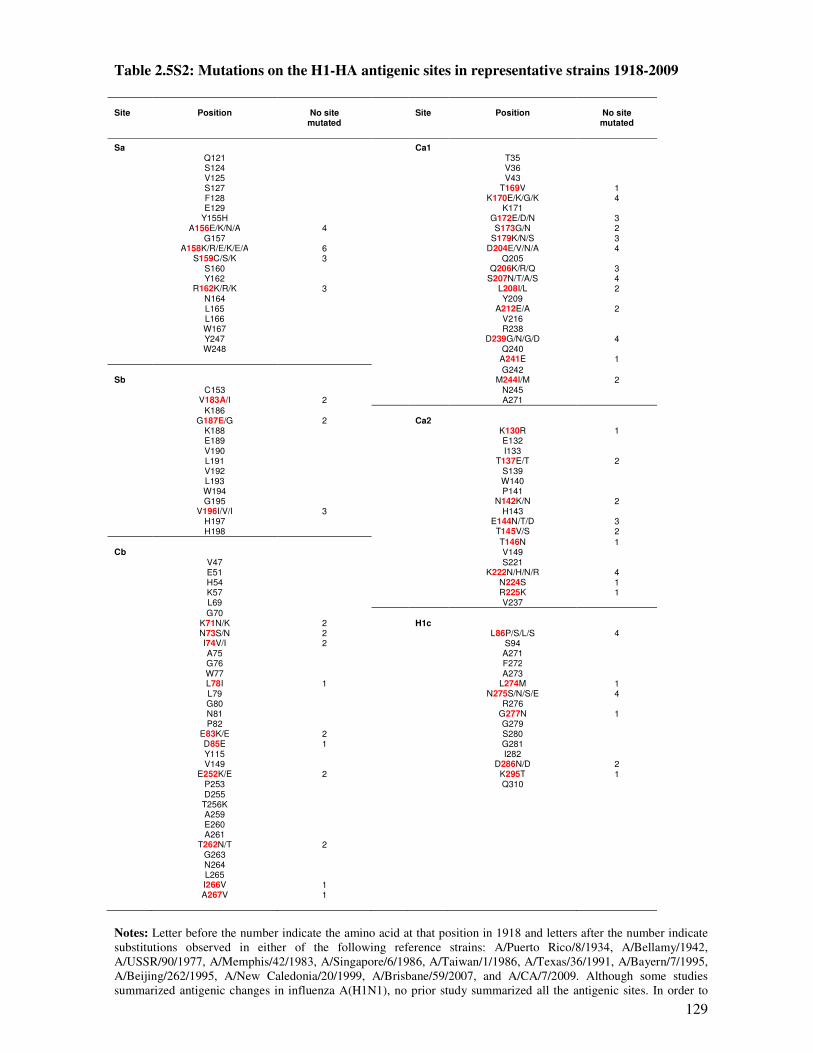
129
Table 2.5S2: Mutations on the H1-HA antigenic sites in representative strains 1918-2009
Site
Position
No site mutated
Site
Position
No site mutated
Sa
Ca1 Q121 T35
S124 V36 V125 V43 S127 T169V 1
F128
K170E/K/G/K 4
E129
K171
Y155H
G172E/D/N 3
A156E/K/N/A 4
S173G/N 2
G157
S179K/N/S 3
A158K/R/E/K/E/A 6
D204E/V/N/A 4
S159C/S/K 3
Q205
S160
Q206K/R/Q 3
Y162
S207N/T/A/S 4
R162K/R/K 3 L208I/L 2 N164 Y209 L165 A212E/A 2 L166 V216 W167 R238 Y247 D239G/N/G/D 4 W248 Q240
A241E 1
G242 Sb
M244I/M 2
C153 N245 V183A/I 2 A271
K186
G187E/G 2
Ca2
K188
K130R 1
E189
E132
V190
I133
L191
T137E/T 2
V192
S139
L193
W140 W194 P141
G195 N142K/N 2 V196I/V/I 3 H143
H197 E144N/T/D 3 H198 T145V/S 2
T146N 1 Cb
V149
V47 S221 E51 K222N/H/N/R 4 H54 N224S 1 K57 R225K 1 L69 V237
G70
K71N/K 2
H1c
N73S/N 2
L86P/S/L/S 4
I74V/I 2
S94
A75
A271
G76
F272
W77
A273
L78I 1
L274M 1
L79 N275S/N/S/E 4 G80 R276 N81 G277N 1 P82 G279
E83K/E 2 S280 D85E 1 G281 Y115 I282 V149 D286N/D 2
E252K/E 2 K295T 1 P253 Q310 D255
T256K A259 E260 A261
T262N/T 2 G263 N264 L265 I266V 1 A267V 1
Notes: Letter before the number indicate the amino acid at that position in 1918 and letters after the number indicate
substitutions observed in either of the following reference strains: A/Puerto Rico/8/1934, A/Bellamy/1942,
A/USSR/90/1977, A/Memphis/42/1983, A/Singapore/6/1986, A/Taiwan/1/1986, A/Texas/36/1991, A/Bayern/7/1995,
A/Beijing/262/1995, A/New Caledonia/20/1999, A/Brisbane/59/2007, and A/CA/7/2009. Although some studies
summarized antigenic changes in influenza A(H1N1), no prior study summarized all the antigenic sites. In order to

130
understand the changes in the antigenic sites of influenza A (H1N1), sequences of representative strains from 1918 to
2009 were downloaded from GenBank, aligned and analysed. A total of eleven HA sequences for representative
strains of influenza A(H1N1): A/Puerto Rico/8/1934 (accession number AF117241.1), A/Bellamy/1942
(CY009276.1), A/USSR/90/1977 (DQ508897.1), A/Memphis/42/1983 (CY019061.1), A/Singapore/6/1986
(CY020477.1), A/Taiwan/1/1986 (DQ508873.1), A/Texas/36/1991 (DQ508889.1), A/Bayern/7/1995 (EF566037.1),
A/Beijing/262/1995 (EF541421.1), A/New Caledonia/20/1999 (EF566076.1), A/Brisbane/59/2007 (CY163616.1)
A/CA/07/2009 (KC781785.1) were downloaded from GenBank and A/CA/04/2009 (3LZG:E) from the RCSB Protein
DataBank. For translation of the nucleotide sequences to protein sequences, the Fasta formats of were uploaded onto
the European Molecular Biology Laboratory (EMBL-EBI) protein conversion tool – Transq available at
(http://www.ebi.ac.uk/Tools/st/emboss_transeq/). Multiple alignment was conducted using ClustalW multiple
alignment in Bioedit Sequence alignment Editor version 7.1.3.0 (103). Changes in the antigenic sites were inspected
visually using conservation plot view and details of the changes at specific sites are summarized.
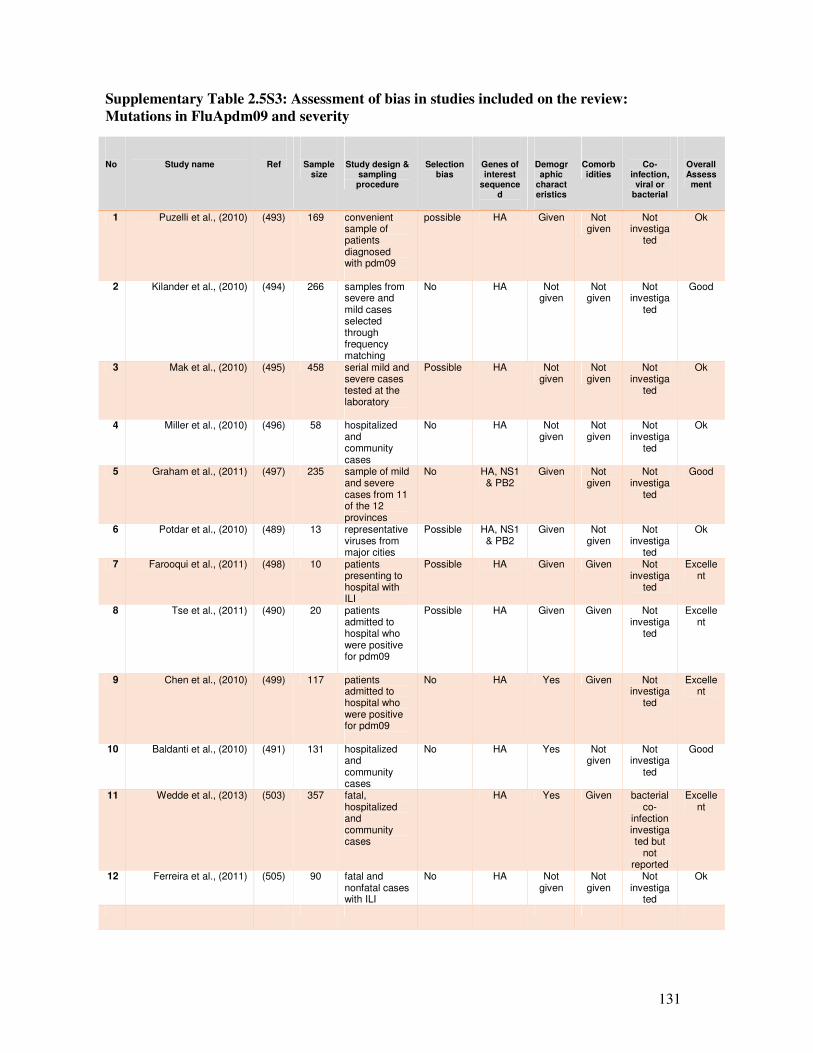
131
Supplementary Table 2.5S3: Assessment of bias in studies included on the review:
Mutations in FluApdm09 and severity
No
Study name
Ref
Sample size
Study design & sampling procedure
Selection bias
Genes of interest
sequenced
Demographic
characteristics
Comorbidities
Co-infection,
viral or bacterial
Overall Assessment
1 Puzelli et al., (2010) (493) 169 convenient sample of patients diagnosed with pdm09
possible HA Given Not given
Not investiga
ted
Ok
2 Kilander et al., (2010) (494) 266 samples from severe and mild cases selected through frequency matching
No HA Not given
Not given
Not investiga
ted
Good
3 Mak et al., (2010) (495) 458 serial mild and severe cases tested at the laboratory
Possible HA Not given
Not given
Not investiga
ted
Ok
4 Miller et al., (2010) (496) 58 hospitalized and community cases
No HA Not given
Not given
Not investiga
ted
Ok
5 Graham et al., (2011) (497) 235 sample of mild and severe cases from 11 of the 12 provinces
No HA, NS1 & PB2
Given Not given
Not investiga
ted
Good
6 Potdar et al., (2010) (489) 13 representative viruses from major cities
Possible HA, NS1 & PB2
Given Not given
Not investiga
ted
Ok
7 Farooqui et al., (2011) (498) 10 patients presenting to hospital with ILI
Possible HA Given Given Not investiga
ted
Excellent
8 Tse et al., (2011) (490) 20 patients admitted to hospital who were positive for pdm09
Possible HA Given Given Not investiga
ted
Excellent
9 Chen et al., (2010) (499) 117 patients admitted to hospital who were positive for pdm09
No HA Yes Given Not investiga
ted
Excellent
10 Baldanti et al., (2010) (491) 131 hospitalized and community cases
No HA Yes Not given
Not investiga
ted
Good
11 Wedde et al., (2013) (503) 357 fatal, hospitalized and community cases
HA Yes Given bacterial co-
infection investigated but
not reported
Excellent
12 Ferreira et al., (2011) (505) 90 fatal and nonfatal cases with ILI
No HA Not given
Not given
Not investiga
ted
Ok
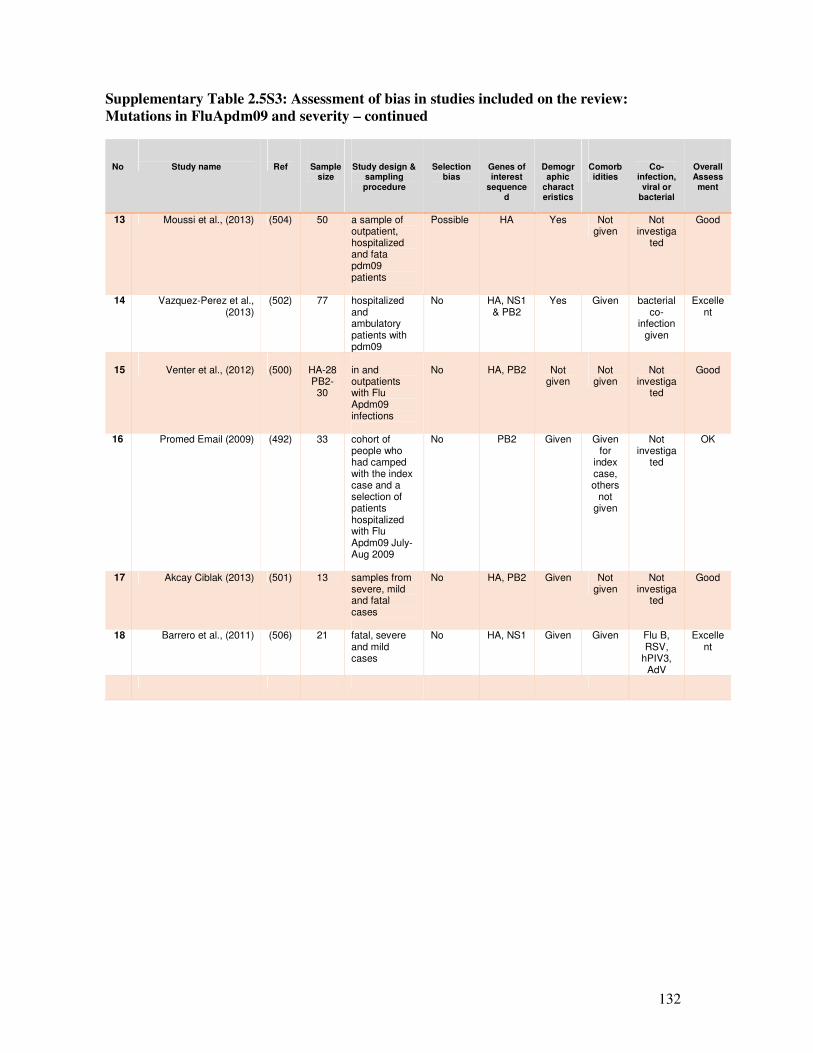
132
Supplementary Table 2.5S3: Assessment of bias in studies included on the review:
Mutations in FluApdm09 and severity – continued
No
Study name
Ref
Sample size
Study design & sampling procedure
Selection bias
Genes of interest
sequenced
Demographic
characteristics
Comorbidities
Co-infection,
viral or bacterial
Overall Assessment
13 Moussi et al., (2013) (504) 50 a sample of outpatient, hospitalized and fata pdm09 patients
Possible HA Yes Not given
Not investiga
ted
Good
14 Vazquez-Perez et al., (2013)
(502) 77 hospitalized and ambulatory patients with pdm09
No HA, NS1 & PB2
Yes Given bacterial co-
infection given
Excellent
15
Venter et al., (2012)
(500)
HA-28 PB2-30
in and outpatients with Flu Apdm09 infections
No
HA, PB2
Not
given
Not
given
Not
investigated
Good
16 Promed Email (2009) (492) 33 cohort of people who had camped with the index case and a selection of patients hospitalized with Flu Apdm09 July-Aug 2009
No PB2 Given Given for
index case, others
not given
Not investiga
ted
OK
17 Akcay Ciblak (2013) (501) 13 samples from severe, mild and fatal cases
No HA, PB2 Given Not given
Not investiga
ted
Good
18 Barrero et al., (2011) (506) 21 fatal, severe and mild cases
No HA, NS1 Given Given Flu B, RSV,
hPIV3, AdV
Excellent
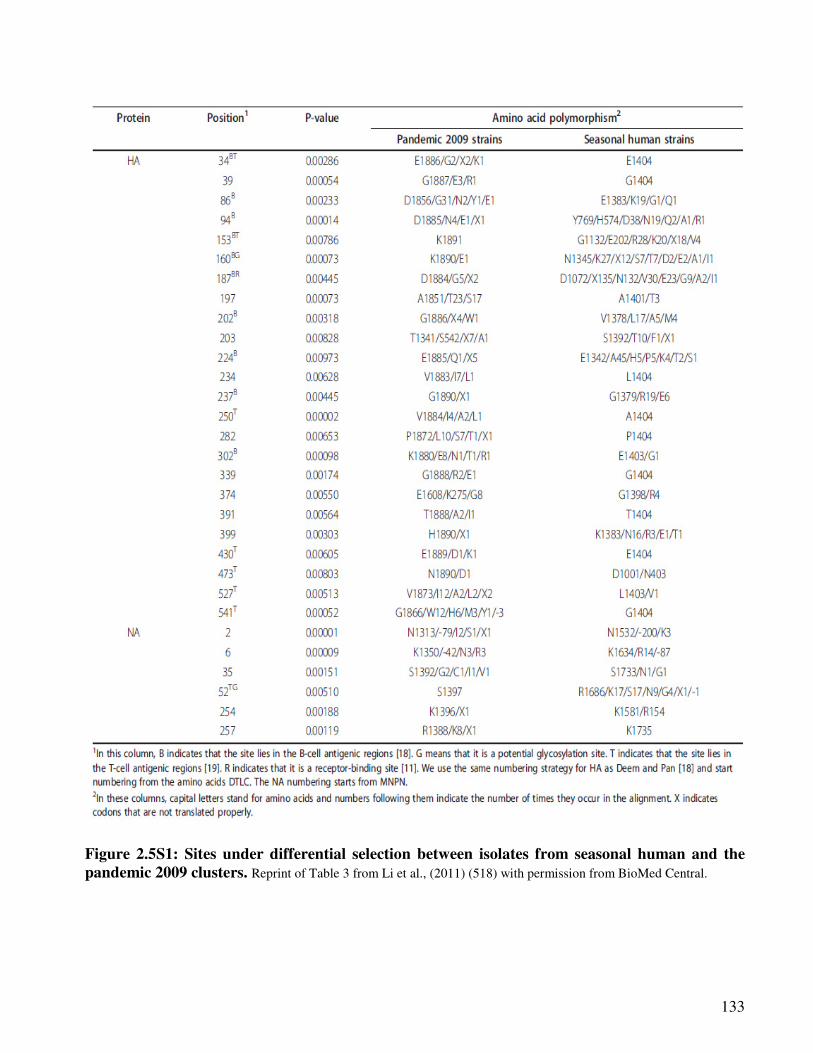
133
Figure 2.5S1: Sites under differential selection between isolates from seasonal human and the
pandemic 2009 clusters. Reprint of Table 3 from Li et al., (2011) (518) with permission from BioMed Central.
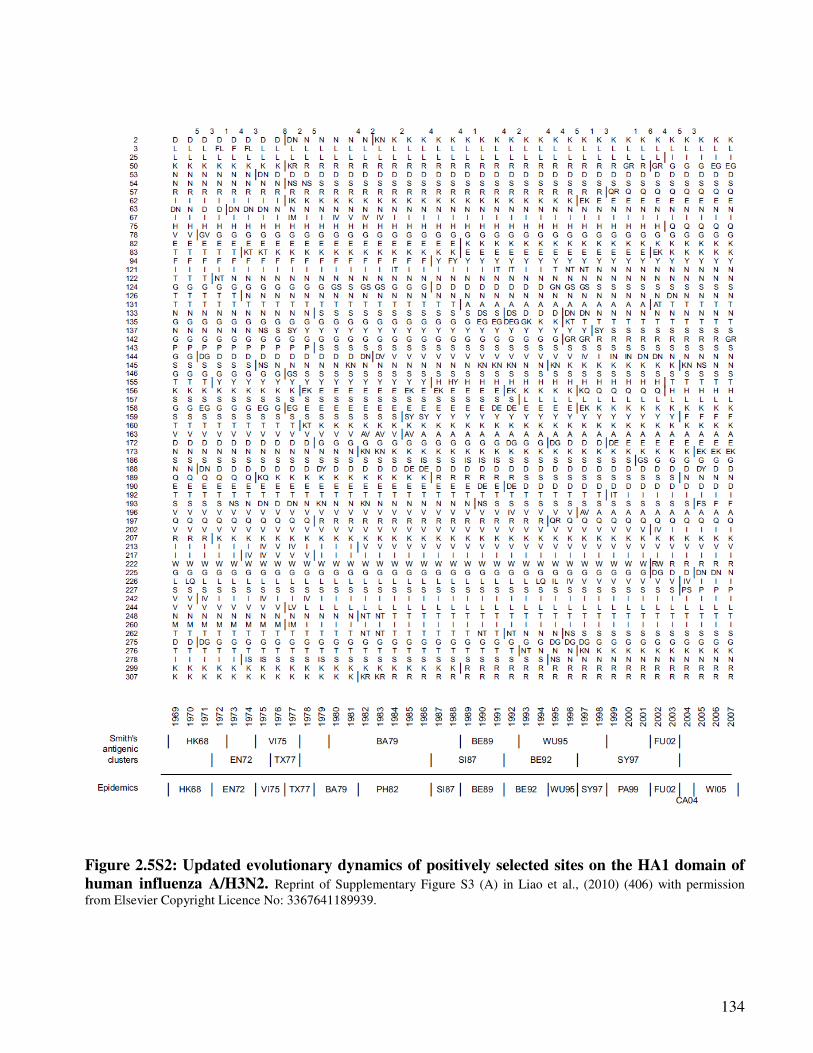
134
Figure 2.5S2: Updated evolutionary dynamics of positively selected sites on the HA1 domain of
human influenza A/H3N2. Reprint of Supplementary Figure S3 (A) in Liao et al., (2010) (406) with permission
from Elsevier Copyright Licence No: 3367641189939.
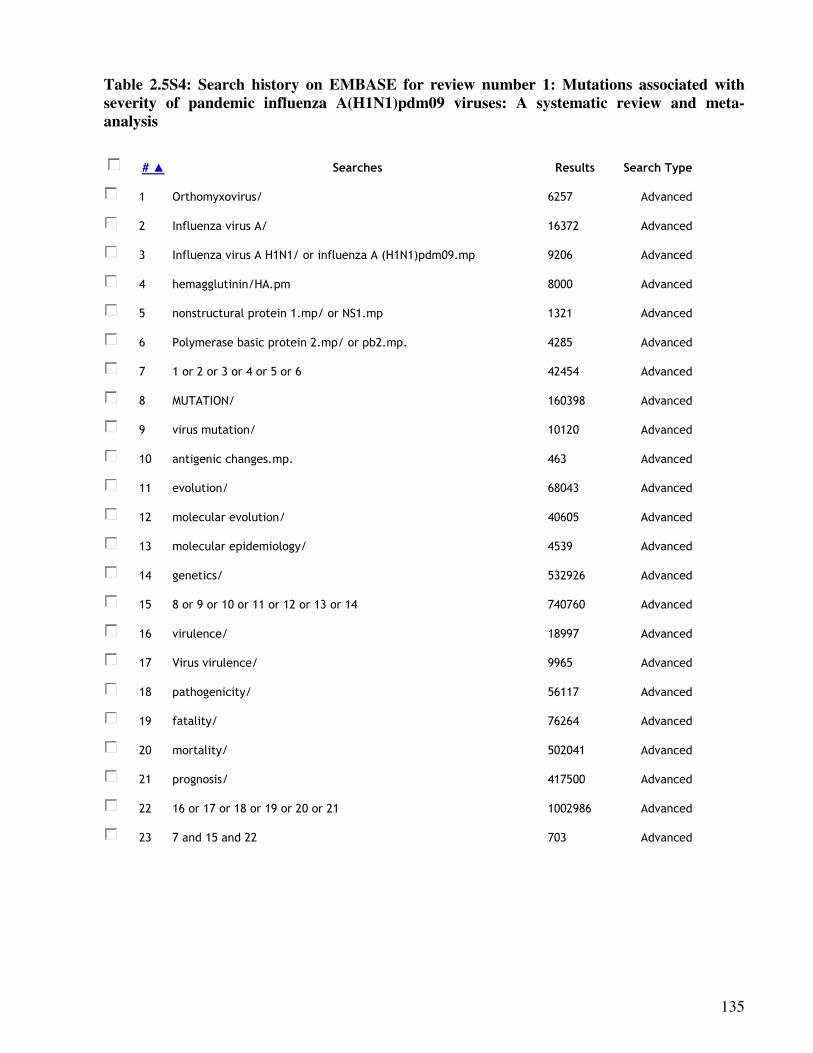
135
Table 2.5S4: Search history on EMBASE for review number 1: Mutations associated with
severity of pandemic influenza A(H1N1)pdm09 viruses: A systematic review and meta-
analysis
# ▲ Searches Results Search Type
1 Orthomyxovirus/ 6257 Advanced
2 Influenza virus A/ 16372 Advanced
3 Influenza virus A H1N1/ or influenza A (H1N1)pdm09.mp 9206 Advanced
4 hemagglutinin/HA.pm 8000 Advanced
5 nonstructural protein 1.mp/ or NS1.mp 1321 Advanced
6 Polymerase basic protein 2.mp/ or pb2.mp. 4285 Advanced
7 1 or 2 or 3 or 4 or 5 or 6 42454 Advanced
8 MUTATION/ 160398 Advanced
9 virus mutation/ 10120 Advanced
10 antigenic changes.mp. 463 Advanced
11 evolution/ 68043 Advanced
12 molecular evolution/ 40605 Advanced
13 molecular epidemiology/ 4539 Advanced
14 genetics/ 532926 Advanced
15 8 or 9 or 10 or 11 or 12 or 13 or 14 740760 Advanced
16 virulence/ 18997 Advanced
17 Virus virulence/ 9965 Advanced
18 pathogenicity/ 56117 Advanced
19 fatality/ 76264 Advanced
20 mortality/ 502041 Advanced
21 prognosis/ 417500 Advanced
22 16 or 17 or 18 or 19 or 20 or 21 1002986 Advanced
23 7 and 15 and 22 703 Advanced
136
2.5.6.1. The cause of influenza pandemics
Influenza pandemics have been documented since the 16th century at intervals varying from 11 to 42
years. In the 20th century, there has been no recognisable pattern with pandemic in 1918/19,
1957/58, 1968/69 and 1977-78 (261), and in the 21st century 2009/2012 (274). Antigenic shift, i.e. a
notable genetic change in the circulating strain of influenza virus to a novel virus, is responsible for
pandemics because the virus can easily spread because a large portion of the human population is
susceptible to infection with the new virus (530). Evidence from studies summarized in Table
2.5S5 and Figure 2.5S3 indicate that in the last decades influenza events have been marked by
antigenic shifts and antigenic drifts and the antigenic shifts have been due to the introduction of
interspecies genomes e.g. avian or swine into the human viruses. For example Morens et al., (266)
and Zimmer and Bulke (403) have indicated that the 1918-19 pandemic was due to an introduction
of a novel swine adapted avian virus, which circulated in swine shortly before the start of the
pandemic (Figure 2.5S3). Interspecies gene exchanges was also responsible for the appearance of
the pandemic influenza A(H2N2) virus in 1957, a reassortment of the human 1918 H1N1 virus with
the avian virus and then the pandemic influenza A(H3N2) virus in 1968 whose PB1 and HA genes
were of avian origin and the rest were human (266;403).
Since then, there appeared to be a break and then in 1998, a new triple-reassortant influenza
A(H3N2) virus derived from North American avian, classical swine A(H1N1) and human influenza
A(H3N2) viruses, caused outbreaks in North American swine (531;532). Mixing of the triple-
reassortant influenza A(H3N2) with established swine lineages gave rise to the influenza A(H1N1)
and influenza A(H1N2) reassortant swine viruses (533;534). The first case of human disease from
the 1998 swine influenza triple-reassortant influenza A (H1N2) virus was a 17-year-old who had
been exposed to pigs at a slaughterhouse in Wisconsin (533). Investigators later reported 11 known
human cases of infection with the triple-reassortant viruses between 2005 and 2009; most of these
patients had been exposed to swine (534). The pandemic influenza A(H1N1)pdm09 was a
reassortment of 2 viruses i.e. the 1998 triple-reassortant influenza A(H1N2) North American swine
virus, and the Eurasian H1N1 swine. In particular, 6 out of the 8 genes; the PB2 and PA, PB1, HA,
NP and NS were from the reassortant influenza A(H1N2) - introduced into swine populations
around 1998; the HA, NP, and NS genes descended directly from the classic swine influenza A
virus of North American lineage, which can be traced back to the 1918 virus; and NA and M were
from the Eurasian swine virus, introduced from birds around 1979 (266;535) - Figure 2.5S3.
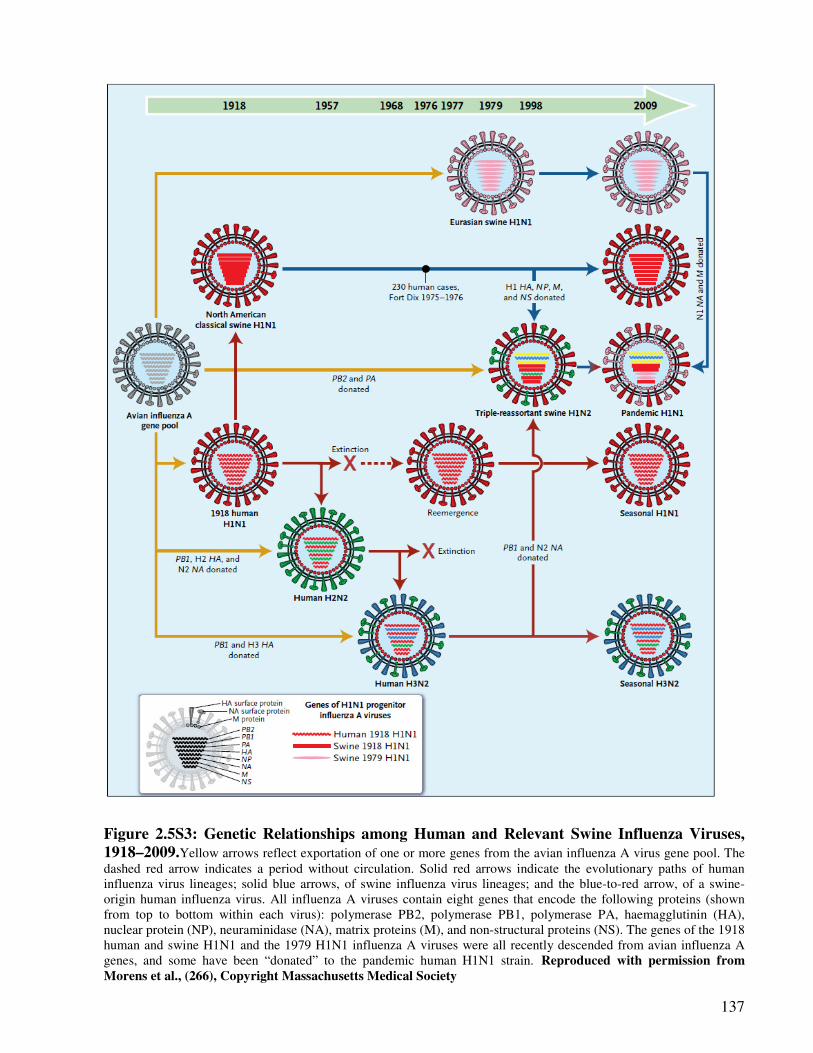
137
Figure 2.5S3: Genetic Relationships among Human and Relevant Swine Influenza Viruses,
1918–2009.Yellow arrows reflect exportation of one or more genes from the avian influenza A virus gene pool. The
dashed red arrow indicates a period without circulation. Solid red arrows indicate the evolutionary paths of human
influenza virus lineages; solid blue arrows, of swine influenza virus lineages; and the blue-to-red arrow, of a swine-
origin human influenza virus. All influenza A viruses contain eight genes that encode the following proteins (shown
from top to bottom within each virus): polymerase PB2, polymerase PB1, polymerase PA, haemagglutinin (HA),
nuclear protein (NP), neuraminidase (NA), matrix proteins (M), and non-structural proteins (NS). The genes of the 1918
human and swine H1N1 and the 1979 H1N1 influenza A viruses were all recently descended from avian influenza A
genes, and some have been “donated” to the pandemic human H1N1 strain. Reproduced with permission from
Morens et al., (266), Copyright Massachusetts Medical Society
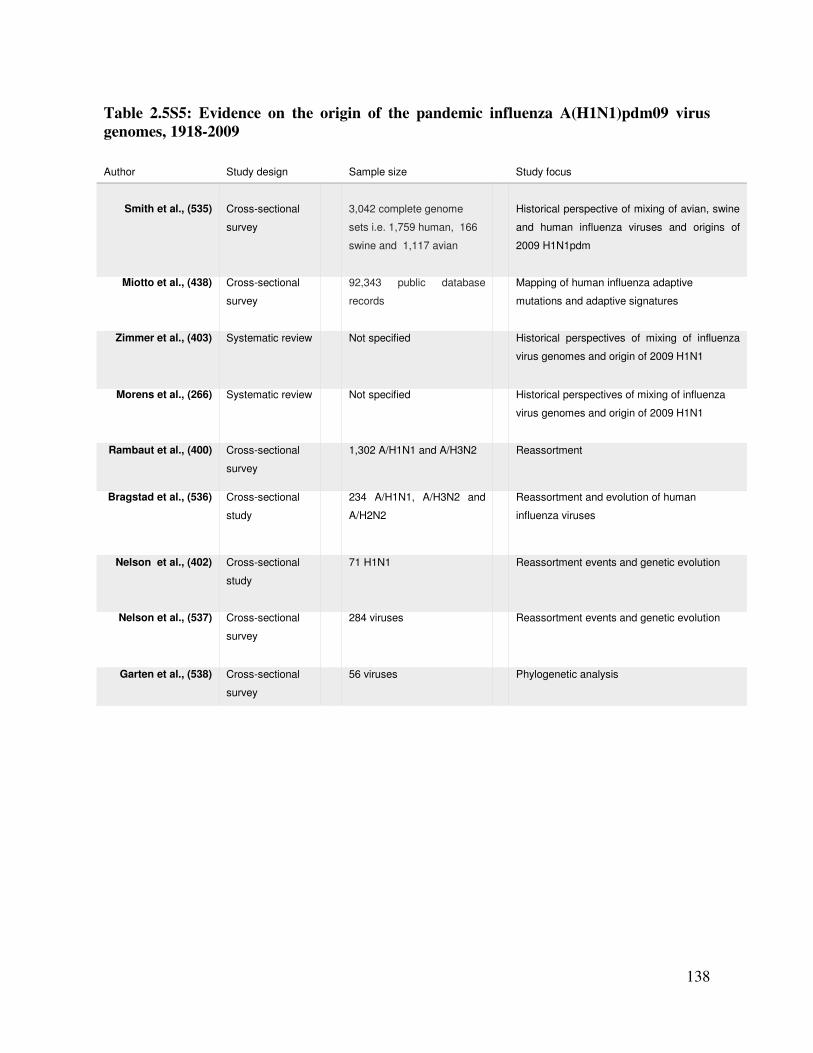
138
Table 2.5S5: Evidence on the origin of the pandemic influenza A(H1N1)pdm09 virus
genomes, 1918-2009
Author
Study design
Sample size
Study focus
Smith et al., (535)
Cross-sectional
survey
3,042 complete genome
sets i.e. 1,759 human, 166
swine and 1,117 avian
Historical perspective of mixing of avian, swine
and human influenza viruses and origins of
2009 H1N1pdm
Miotto et al., (438) Cross-sectional
survey
92,343 public database
records
Mapping of human influenza adaptive
mutations and adaptive signatures
Zimmer et al., (403) Systematic review Not specified Historical perspectives of mixing of influenza
virus genomes and origin of 2009 H1N1
Morens et al., (266) Systematic review Not specified Historical perspectives of mixing of influenza
virus genomes and origin of 2009 H1N1
Rambaut et al., (400) Cross-sectional
survey
1,302 A/H1N1 and A/H3N2 Reassortment
Bragstad et al., (536) Cross-sectional
study
234 A/H1N1, A/H3N2 and
A/H2N2
Reassortment and evolution of human
influenza viruses
Nelson et al., (402) Cross-sectional
study
71 H1N1 Reassortment events and genetic evolution
Nelson et al., (537) Cross-sectional
survey
284 viruses Reassortment events and genetic evolution
Garten et al., (538) Cross-sectional
survey
56 viruses Phylogenetic analysis
139
Part III: Review of available literature on patterns of co-infections and
association between co-infections and disease severity
3.1. Co-infections; patterns and severity Part A: The patterns of co-infection between
influenza A and other respiratory viruses and its effect on viral load and
interferon production: A systematic review and meta-analysis
Synopsis
This is the authors’ version of the paper submitted to Lancet Infectious Diseases for publication.
Since recent literature indicates that a good proportion of respiratory viruses’ infections occur as
co-infections, there is need to understand which pairs are most likely to occur as this could be used
to calculate population attributable fractions associated with the said pairings. This paper reviews
the patterns of co-infections between influenza A and other respiratory viruses.
140
3.1.1. Abstract
The patterns of co-infection between influenza A and other respiratory
viruses and its effect on viral load and interferon production:
A systematic review and meta-analysis
Edward A. Goka 1, Pamela J. Vallely 1, Kenneth J. Mutton 1,2, Paul E. Klapper 1,2
1: Institute of Inflammation and Repair, Faculty of Medical and Human Sciences, University of Manchester,
2: Department of Clinical Virology, Central Manchester Universities NHS Trust
Corresponding author: Edward Goka, Institute of Inflammation and Repair, Faculty of Medical and Human
Sciences, 1st Floor Stopford building, University of Manchester, Oxford Road, Manchester, M13 9PL, UK.
E-mail: [email protected]
Running head: Co-infection patterns, influenza & respiratory viruses
141
Summary
Objectives: Respiratory virus infections have mainly been regarded as single infections,
however research suggest a substantial number occur as co-infections. Knowledge on the burden
of co-infection in influenza would guide, clinical practice, vaccine and drug research. This
review summarizes the pattern of co-infections between influenza A viruses and other
respiratory viruses and its impact of viral load and interferon production.
Methods: A meta-analysis and a review was conducted using studies obtained from MEDLINE,
EMBASE and WEB of Science, websites of health organisations and reference lists of published
studies. Thirty (30) studies that recruited in and outpatients or only hospitalized children or
adults and children were included. The quality of studies was assessed using the PRISMA and
STROBE Guidelines.
Results: Co-infections with influenza A ranged from 1% to 26%. Respiratory syncytial virus
(RSV), human bocavirus (hBOV), rhinovirus (RV) and adenovirus (AdV) were the most
common viruses to co-infect with influenza A virus especially among children: overall co-
infection; RSV (26%) among children ≤5 years old hospitalized with influenza A illness; hBoV
(21%) among hospitalized and outpatient children ≤18 years old; RV (12%) among hospitalized
children ≤5 years old; and AdV 4.0% - 11.3% among hospitalized and outpatient children ≤5
years old. This was followed by human coronavirus (hCoV), human metapneumovirus (hMPV)
and least common being human parainfluenza virus types 1 to 4 (hPIV1-4). Co-infection patterns
varied with age, study design, season, year and region the study was conducted. There is no
enough evidence for or against the association between co-infection and viraemia or cytokine
release. The possibility of bias due to lack of information on patient’s influenza vaccination or
other predisposing factors should be born in mind when interpreting our results.
Conclusion: Routine testing of these viruses among patients with influenza infection is
recommended. Research aimed at elucidating the mechanisms of virulence or avirulence in these
co-infections is worth pursuing.
Key words: influenza A virus, co-infections, mixed infections, viral load, interferon release
142
3.1.2. Introduction
A substantial number of studies have reported viruses occuring as as dual or multiple infections
and that there is a relationship between the presence or absence of certain viruses (539-543).
For example, Greer et al., (541) reported that the presence of rhinoviruses (RV) led to a
reduced probability of co-infection of adenoviruses (AdV), human coronavirus (hCoV), human
bocavirus (hBoV), human metapneumovirus (hMPV), respiratory syncytial virus (RSV),
influenza A virus (Flu A), and parainfluenza viruses 1-4 (hPIV1-4). Whereas Linde et al., (544)
and Casalegno et al., (545) have suggested that rhinovirus interfered with the survival of the
pandemic influenza A(H1N1)pdm09 virus (Flu Apdm09).
Influenza viruses, and members of the paramoyxoviridae; [RSV, hMPV and hPIV1-4], are
enveloped single stranded negative sense RNA viruses. They all have surface attachment
proteins, penetrate cells through membrane fusion and replicate in the nuclease for influenza
viruses (432) and the cytoplasm for paramyxoviruses (361;546). On the other hand coronavirus
and rhinovirus are respectively enveloped and non-enveloped single stranded positive sense
RNA viruses. They also attach to cell membranes and replicate in the cytoplasm (367;381),
whereas bocavirus and adenovirus are respectively single strand and double stranded, circular
and linear DNA non-enveloped viruses (43;385). Both bocavirus and adenovirus enter the cell
through endocytosis and replicate in the nucleus (43;385). Respiratory viruses dsRNA and
ssRNA are recognized by toll like receptors: TL2, TLR4 and TLR6 on the external surface of
the cell; TLR3 TLR7, TLR8 and TLR9 in the endosome; and by the protein kinase RNA -
activated (PKR), the melanoma differentiation associated gene 5 (MAD-5), the retinoic
inducible gene I (RIG-I) and the 2',5'-Oligoadenylate synthetase (2',5'-OAS1&2) in respiratory
epithelial cells and dendritic cells (17;547-550), which then trigger production of cytokines
such as tumour necrosis factor (TNF) and type 1 proinflammatory cytokines; interleukin-6 (IL-
6), interleukin-18 (IL-18), interferon-alpha (IFN-α), and interferon-beta (IFN-β) (361;551;552).
Biomedical studies have indicated that the severity of influenza A virus infection is mediated
by the amount of cytokines produced following virus infection (553-555). The cytokines causes
damage by causing; loss of cell adhesion, cell membrane hyperpermeability, and release of
mitochondria reactive species, which leads to damage of blood vessels, cell death, and organ
failure (553).
143
3.1.2.1. Rationale for conducting this review
Co-infection among respiratory virus infections has been associated with increased risk of
hospitalization to a general ward (GW), admission to the intensive care unit (ICU) or death (75-
77;86;91;94;513;514). Among other factors, the ability of respiratory viruses to cause a severe
infection depends on their ability to antagonize the interferon pathways (19;34;37-44;46-
50;363;385;556). In influenza, RSV and hBoV, the NS1 protein is used to block the interferon
production (38-42;556). The E protein in AdV, and hCoV spike protein has also been reported
to perform a similar function (43-46;385), and the P, C, D and V proteins in hPIV1 and 3,
hPIV3, and hPIV2 and 4 respectively (47-50;363). The impact of the interaction of these
molecules during co-infection and how it affects length of viral shedding, viral load, interferon
production, and disease severity is not well understood. An understanding of the patterns of co-
infections with influenza A viruses would aid in determining which viruses would result in
severe disease (viral load and interferon production); calculation of population attributable risk
of hospitalization, admission to ICU or mortality associated with co-infections; and in
modelling the economic benefit of public health control measures.
Some studies have reviewed the magnitude of co-detection (84;540;557). Sly et al.,(557)
reported that co-detection may range from 4% to 44%, and almost a similar range of co-
infection patterns (14.3% - 47.0%) was reported by Stefanska et al., (84) review. A number of
studies found RSV and RV as the most frequently identified pairing (76;80;302;514;558), yet
others found RSV and human hBoV (559); RSV and AdV pairing (79;82;560); and some have
even suggested that coronavirus and influenza virus pairing is low (75;82). However, no
attempt has been made to summarize information on co-infections between influenza A viruses
and other respiratory viruses; which respiratory virus infections are most commonly involved in
such co-infections and how that influences virus replication and interferon production.
3.1.2.2. Aims and objectives of the systematic review and meta-analysis
This study aimed at summarizing the evidence on the patterns of co-infections between
influenza A virus and other respiratory virus infections and its impact on interferon production
and viral load with the following objectives:
1. To investigate the burden of specific types of co-infections between influenza A and
other respiratory virus infections.
2. To review evidence documenting; successful respiratory virus pairings that lead to
higher viral loads, and those that trigger more interferons when they co-infect.
144
The review was conducted to answer one of our research questions: “Which respiratory viruses
most commonly co-infect with influenza A viruses?” and therefore aimed to:
a) Generate knowledge on the role of co-infection in acute respiratory tract infection
(ARI).
b) Summarize evidence needed for prioritizing and making policy on the importance of
multiple testing of respiratory virus infections in patients presenting with influenza
virus infections, prioritizing research and development on combined respiratory viruses
vaccines and drugs, and calculation of population attributable fraction for co-infections.
3.1.3. Methodology
3.1.3.1. Review protocol
The supervisors of this PhD, who are coauthors of this manuscript, guided the principal
investigator in developing a review protocol. We did not deposit the protocol on any online
server.
3.1.3.2. Search strategy
A search for primary studies on the epidemiology of co-infections between influenza A viruses
and other respiratory virus infections was performed on: MEDLINE, EMBASE and WEB of
Science databases; websites of the World Health Organisation (WHO), UK Health Protection
Agency (HPA), United States Centres for Disease Control, World Influenza Network Centre,
UK’s Medical Research Council; and reference lists of well conducted studies. In the electronic
search, specific key words or text words and subject heading were used and combined
including: Respiratory tract Infections, respiratory virus infections. respirovirus infections,
Orthomyxovirus, Orthomyxoviridae infections, influenza virus, influenza human, influenza A
virus H1N1 subtype, influenza A virus H3N2 subtype, influenza A virus H2N2 subtype, avian
influenza, influenza in birds, influenza A virus H5N1 subtype, influenza A H7N9 subtype,
influenza A H7N7 subtype, 2009 pandemic influenza virus, pandemic influenza, 2009 H1N1
influenza, influenza A(H1N1)pdm09, Flu A, Picornaviridae infections, rhinovirus, human
rhinovirus, rhinovirus infection, RV, Adenoviridae, Adenoviridae infections, adenovirus,
adenovirus infection(s), human adenovirus, human adenovirus infection, AdV,
Paramyxoviridae infections, respiratory syncytial virus(es), respiratory syncytial virus
infection(s), RSV, metapneumovirus, human metapneumovirus, metapneumovirus human,
hMPV, parainfluenza virus 1 human, parainfluenza virus 2 human, parainfluenza virus 3
human, parainfluenza virus 4 human, hPIV1, hPIV2, hPIV3, hPIV4, Parvoviridae Infections,
145
bocavirus, bocavirus human, human bocavirus, bocavirus infection, coronavirus, coronavirus
infection(s), human coronavirus NL63, human coronavirus 229E, human coronavirus OC43,
human coronavirus HKU1, coinfection, co-infection(s), mixed infection, dual infection(s),
multiple infection(s), immune response, innate immune response , cytokine storm, cytokine,
cytokine release, interferon production, tumour necrosis factor alpha, gamma interferon,
interleukin 6, interleukin 12, interleukin 1, severe influenza, vascular hyperpermeability,
pathogenesis, viral load, virus titres. A result of the search on MEDLINE is provided in
supplementary Table 3.1S2 as an example.
3.1.3.3. Assessment of study quality and selection process
The Preferred Reporting Items for Systematic Reviews and Meta-Analyses (PRISMA)
guideline (109) was followed to write the reviews. In addition, The “Strengthening the
Reporting of Observational Studies in Epidemiology (STROBE)” tool for critical appraisal of
epidemiological studies (108), was used to assess the studies identified in the search. The
principal investigator of the study conducted the online and manual search of eligible studies.
Titles and abstracts of the studies identified online and through the other described means were
quickly scoped and scanned for relevance. Studies that were clearly not relevant (e.g. with the
title; respiratory viruses in bats or pigs, correlation between bocavirus infection and viral loads,
epidemiology of parainfluenza viruses), were removed. Papers that looked relevant were
downloaded and read in full.
3.1.3.4. Exclusion and inclusion criteria
Relevance of a study to be included depended on: whether it reported the patterns of co-
infections between influenza A viruses and other respiratory virus infections; and on the other
part of the study, description of viral loads and interferon release. Other factors considered
included: whether or not the following variables were reported; the source of samples i.e.
hospital or community based; the sample size; type of samples used to identify viruses e.g.
throat swabs or nasopharyngeal aspirates; method used to identify viruses [real time
polymerase chain reaction (TR-PCR), ordinary PCR, immunofluorescence tests or other test
types]. Because it is now generally acknowledged that use of diagnostic methods other than
RT-PCR or PCR would result in low virus yields (47), only studies that used RT-PCR or PCR
for virus identification were included. For part A, studies that did not report co-infection with
influenza A viruses were excluded. Some of the studies were left out because there were not
enough studies of the same age and study design in other pairs of respiratory virus co-
infections. For part B, studies that did not report viral load or interferon levels were excluded.
146
For both arms, studies that were not written in the English language, or were poorly designed
were excluded.
3.1.3.5. Assessment of bias
Influenza vaccine effectiveness studies suggest that vaccination increases the risk of non-
influenza respiratory virus infection (561-563). In addition, other factors including: chronic
conditions such as asthma, heart disease, COPD; obesity, socio-economic status, pregnancy,
prematurity and low birthweight, nutrition status and breastfeeding in infants, active and
passive smoking, immune status affect risk of infection with respiratory viruses
(9;10;13;21;23;53;564) also affect susceptibility to infection. Therefore studies were eligible
for inclusion if they recruited healthy adults or children presenting to hospitals, clinics,
emergency departments, or case-control studies. The studies must have documented at least two
of the above mentioned factors in their study design, so as to eliminate confounding by
indication and by those factors. Other issues considered included selection bias (how
participants were recruited, study population and demographic characteristics of the groups). A
summary of the inclusion criteria used and the rationale behind it is provided in Table 3.1. The
identified observational studies were appraised for presence of these factors at selection and
analysis stages of the review. Studies were scored based on this criteria using the method
described in the PRISMA and STROBE guidelines and a summary of the scores for all the 30
studies included in this review is provided in Supplementary table 3.1S1.
3.1.3.6. Data extraction and statistical analysis
An abstraction form was designed capturing the details of the study i.e. author, year and place
conducted, sample size, total number of respiratory viruses found, number of single and mixed
influenza A virus infections. A meta-analysis summarizing the observed number of co-
infections between influenza A virus and other respiratory viruses was conducted using the
random model. All analyses were conducted using the Comprehensive Meta-Analysis software
– version 2 (BIOSTAT, Englewood, NJ 07631 USA) and results summarized using forest plots
and tables. Also summed up in tables were results on association between viral load and
interferon levels and co-infection.
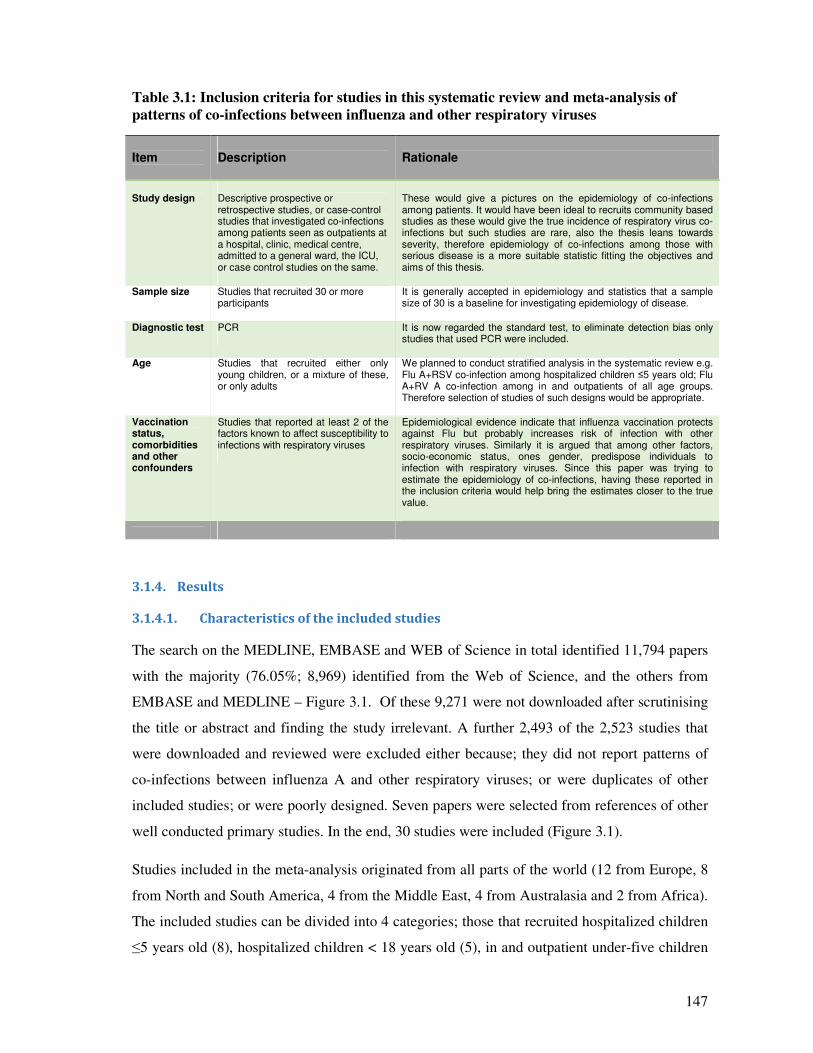
147
Table 3.1: Inclusion criteria for studies in this systematic review and meta-analysis of
patterns of co-infections between influenza and other respiratory viruses
Item
Description
Rationale
Study design
Descriptive prospective or retrospective studies, or case-control studies that investigated co-infections among patients seen as outpatients at a hospital, clinic, medical centre, admitted to a general ward, the ICU, or case control studies on the same.
These would give a pictures on the epidemiology of co-infections among patients. It would have been ideal to recruits community based studies as these would give the true incidence of respiratory virus co-infections but such studies are rare, also the thesis leans towards severity, therefore epidemiology of co-infections among those with serious disease is a more suitable statistic fitting the objectives and aims of this thesis.
Sample size Studies that recruited 30 or more participants
It is generally accepted in epidemiology and statistics that a sample size of 30 is a baseline for investigating epidemiology of disease.
Diagnostic test PCR It is now regarded the standard test, to eliminate detection bias only studies that used PCR were included.
Age Studies that recruited either only young children, or a mixture of these, or only adults
We planned to conduct stratified analysis in the systematic review e.g. Flu A+RSV co-infection among hospitalized children ≤5 years old; Flu A+RV A co-infection among in and outpatients of all age groups. Therefore selection of studies of such designs would be appropriate.
Vaccination status, comorbidities and other confounders
Studies that reported at least 2 of the factors known to affect susceptibility to infections with respiratory viruses
Epidemiological evidence indicate that influenza vaccination protects against Flu but probably increases risk of infection with other respiratory viruses. Similarly it is argued that among other factors, socio-economic status, ones gender, predispose individuals to infection with respiratory viruses. Since this paper was trying to estimate the epidemiology of co-infections, having these reported in the inclusion criteria would help bring the estimates closer to the true value.
3.1.4. Results
3.1.4.1. Characteristics of the included studies
The search on the MEDLINE, EMBASE and WEB of Science in total identified 11,794 papers
with the majority (76.05%; 8,969) identified from the Web of Science, and the others from
EMBASE and MEDLINE – Figure 3.1. Of these 9,271 were not downloaded after scrutinising
the title or abstract and finding the study irrelevant. A further 2,493 of the 2,523 studies that
were downloaded and reviewed were excluded either because; they did not report patterns of
co-infections between influenza A and other respiratory viruses; or were duplicates of other
included studies; or were poorly designed. Seven papers were selected from references of other
well conducted primary studies. In the end, 30 studies were included (Figure 3.1).
Studies included in the meta-analysis originated from all parts of the world (12 from Europe, 8
from North and South America, 4 from the Middle East, 4 from Australasia and 2 from Africa).
The included studies can be divided into 4 categories; those that recruited hospitalized children
≤5 years old (8), hospitalized children < 18 years old (5), in and outpatient under-five children
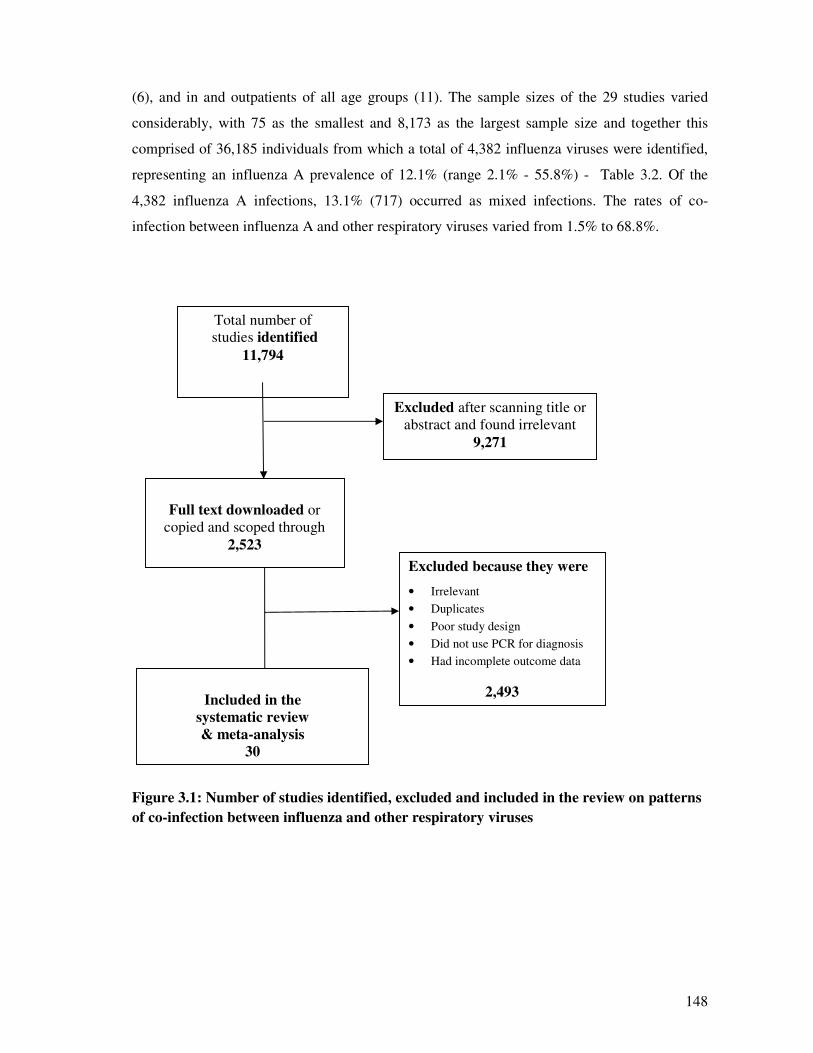
148
(6), and in and outpatients of all age groups (11). The sample sizes of the 29 studies varied
considerably, with 75 as the smallest and 8,173 as the largest sample size and together this
comprised of 36,185 individuals from which a total of 4,382 influenza viruses were identified,
representing an influenza A prevalence of 12.1% (range 2.1% - 55.8%) - Table 3.2. Of the
4,382 influenza A infections, 13.1% (717) occurred as mixed infections. The rates of co-
infection between influenza A and other respiratory viruses varied from 1.5% to 68.8%.
Figure 3.1: Number of studies identified, excluded and included in the review on patterns
of co-infection between influenza and other respiratory viruses
Excluded because they were
• Irrelevant
• Duplicates
• Poor study design
• Did not use PCR for diagnosis
• Had incomplete outcome data
2,493
Total number of
studies identified
11,794
Included in the
systematic review
& meta-analysis
30
Excluded after scanning title or
abstract and found irrelevant
9,271
Full text downloaded or
copied and scoped through
2,523
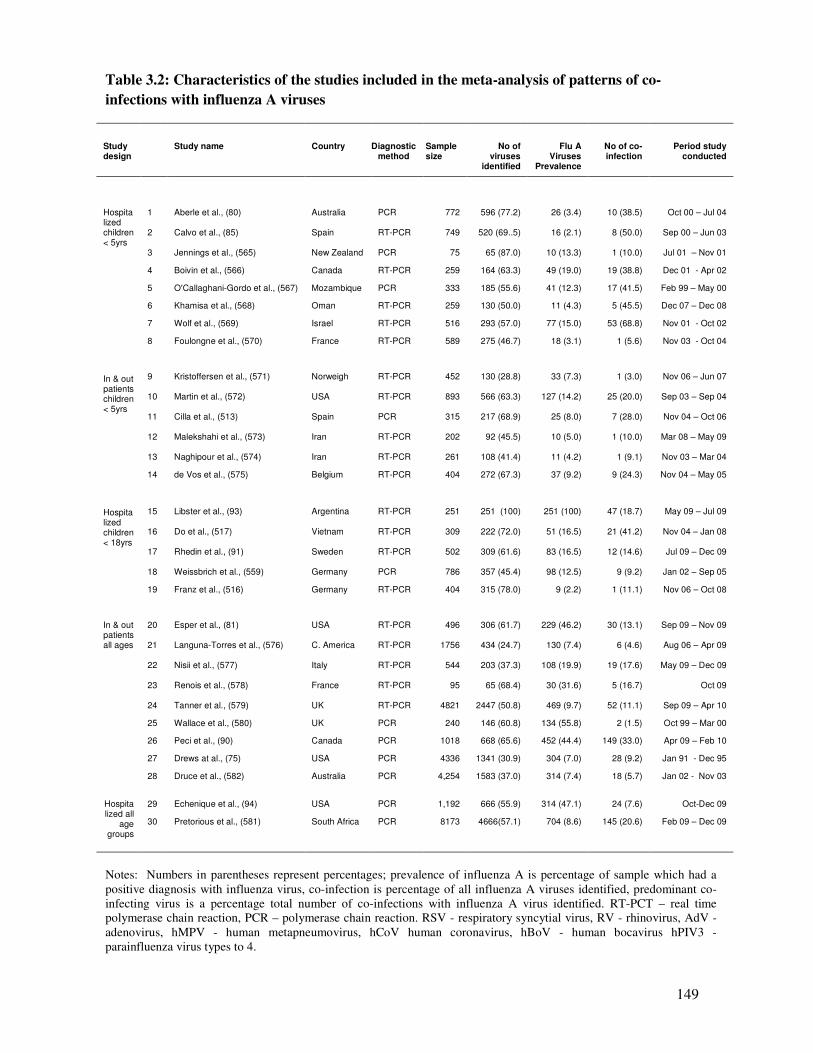
149
Table 3.2: Characteristics of the studies included in the meta-analysis of patterns of co-
infections with influenza A viruses
Study design
Study name Country Diagnostic method
Sample size
No of viruses
identified
Flu A Viruses
Prevalence
No of co-infection
Period study conducted
Hospitalized children < 5yrs
1 Aberle et al., (80) Australia PCR 772 596 (77.2) 26 (3.4) 10 (38.5) Oct 00 – Jul 04 2 Calvo et al., (85) Spain RT-PCR 749 520 (69..5) 16 (2.1) 8 (50.0) Sep 00 – Jun 03 3 Jennings et al., (565) New Zealand PCR 75 65 (87.0) 10 (13.3) 1 (10.0) Jul 01 – Nov 01
4 Boivin et al., (566) Canada RT-PCR 259 164 (63.3) 49 (19.0) 19 (38.8) Dec 01 - Apr 02
5 O'Callaghani-Gordo et al., (567) Mozambique PCR 333 185 (55.6) 41 (12.3) 17 (41.5) Feb 99 – May 00
6 Khamisa et al., (568) Oman RT-PCR 259 130 (50.0) 11 (4.3) 5 (45.5) Dec 07 – Dec 08
7 Wolf et al., (569) Israel RT-PCR 516 293 (57.0) 77 (15.0) 53 (68.8) Nov 01 - Oct 02
8 Foulongne et al., (570) France RT-PCR 589 275 (46.7) 18 (3.1) 1 (5.6) Nov 03 - Oct 04
In & out patients children < 5yrs
9 Kristoffersen et al., (571) Norweigh RT-PCR 452 130 (28.8) 33 (7.3) 1 (3.0) Nov 06 – Jun 07 10 Martin et al., (572) USA RT-PCR 893 566 (63.3) 127 (14.2) 25 (20.0) Sep 03 – Sep 04 11 Cilla et al., (513) Spain PCR 315 217 (68.9) 25 (8.0) 7 (28.0) Nov 04 – Oct 06 12 Malekshahi et al., (573) Iran RT-PCR 202 92 (45.5) 10 (5.0) 1 (10.0) Mar 08 – May 09 13 Naghipour et al., (574) Iran RT-PCR 261 108 (41.4) 11 (4.2) 1 (9.1) Nov 03 – Mar 04
14 de Vos et al., (575) Belgium RT-PCR 404 272 (67.3) 37 (9.2) 9 (24.3) Nov 04 – May 05
Hospitalized children < 18yrs
15 Libster et al., (93) Argentina RT-PCR 251 251 (100) 251 (100) 47 (18.7) May 09 – Jul 09 16 Do et al., (517) Vietnam RT-PCR 309 222 (72.0) 51 (16.5) 21 (41.2) Nov 04 – Jan 08 17 Rhedin et al., (91) Sweden RT-PCR 502 309 (61.6) 83 (16.5) 12 (14.6) Jul 09 – Dec 09 18 Weissbrich et al., (559) Germany PCR 786 357 (45.4) 98 (12.5) 9 (9.2) Jan 02 – Sep 05
19 Franz et al., (516) Germany RT-PCR 404 315 (78.0) 9 (2.2) 1 (11.1) Nov 06 – Oct 08
In & out patients all ages
20 Esper et al., (81) USA RT-PCR 496 306 (61.7) 229 (46.2) 30 (13.1) Sep 09 – Nov 09 21 Languna-Torres et al., (576) C. America RT-PCR 1756 434 (24.7) 130 (7.4) 6 (4.6) Aug 06 – Apr 09 22 Nisii et al., (577) Italy RT-PCR 544 203 (37.3) 108 (19.9) 19 (17.6) May 09 – Dec 09
23 Renois et al., (578) France RT-PCR 95 65 (68.4) 30 (31.6) 5 (16.7) Oct 09
24 Tanner et al., (579) UK RT-PCR 4821 2447 (50.8) 469 (9.7) 52 (11.1) Sep 09 – Apr 10
25 Wallace et al., (580) UK PCR 240 146 (60.8) 134 (55.8) 2 (1.5) Oct 99 – Mar 00
26 Peci et al., (90) Canada PCR 1018 668 (65.6) 452 (44.4) 149 (33.0) Apr 09 – Feb 10
27 Drews at al., (75) USA PCR 4336 1341 (30.9) 304 (7.0) 28 (9.2) Jan 91 - Dec 95
28 Druce et al., (582) Australia PCR 4,254 1583 (37.0) 314 (7.4) 18 (5.7) Jan 02 - Nov 03
Hospitalized all
age groups
29 Echenique et al., (94) USA PCR 1,192 666 (55.9) 314 (47.1) 24 (7.6) Oct-Dec 09
30 Pretorious et al., (581) South Africa PCR 8173 4666(57.1) 704 (8.6) 145 (20.6) Feb 09 – Dec 09
Notes: Numbers in parentheses represent percentages; prevalence of influenza A is percentage of sample which had a
positive diagnosis with influenza virus, co-infection is percentage of all influenza A viruses identified, predominant co-
infecting virus is a percentage total number of co-infections with influenza A virus identified. RT-PCT – real time
polymerase chain reaction, PCR – polymerase chain reaction. RSV - respiratory syncytial virus, RV - rhinovirus, AdV -
adenovirus, hMPV - human metapneumovirus, hCoV human coronavirus, hBoV - human bocavirus hPIV3 -
parainfluenza virus types to 4.
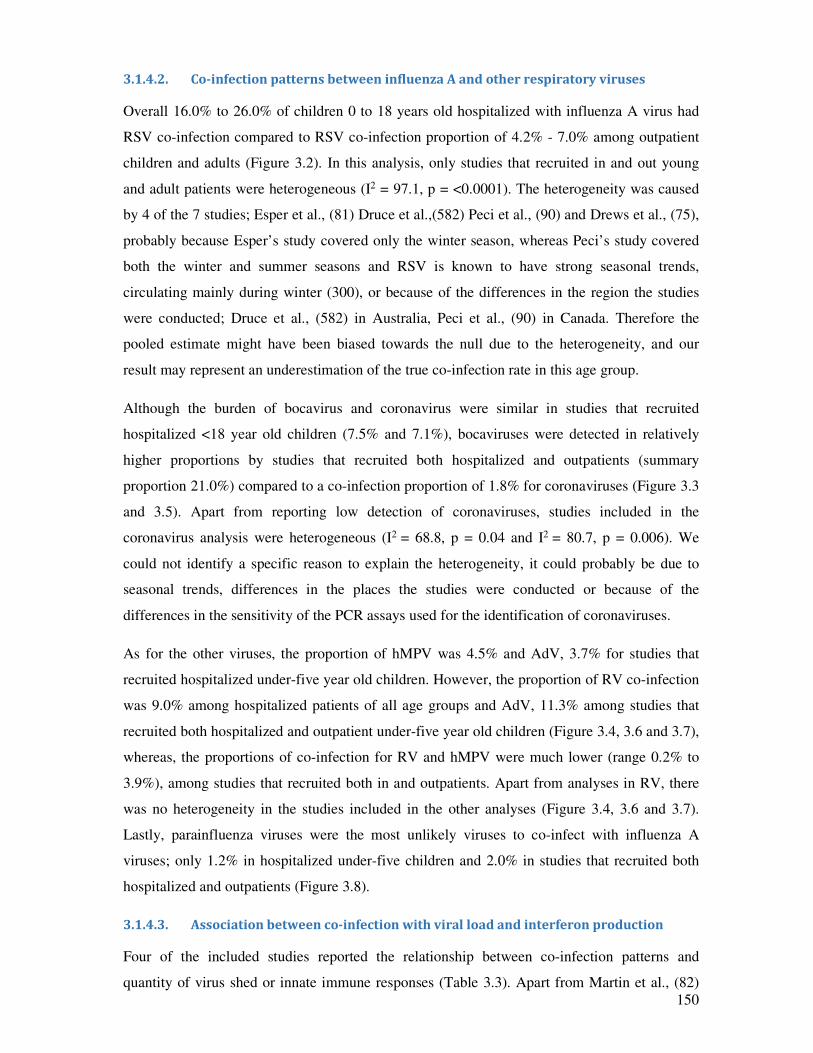
150
3.1.4.2. Co-infection patterns between influenza A and other respiratory viruses
Overall 16.0% to 26.0% of children 0 to 18 years old hospitalized with influenza A virus had
RSV co-infection compared to RSV co-infection proportion of 4.2% - 7.0% among outpatient
children and adults (Figure 3.2). In this analysis, only studies that recruited in and out young
and adult patients were heterogeneous (I2 = 97.1, p = <0.0001). The heterogeneity was caused
by 4 of the 7 studies; Esper et al., (81) Druce et al.,(582) Peci et al., (90) and Drews et al., (75),
probably because Esper’s study covered only the winter season, whereas Peci’s study covered
both the winter and summer seasons and RSV is known to have strong seasonal trends,
circulating mainly during winter (300), or because of the differences in the region the studies
were conducted; Druce et al., (582) in Australia, Peci et al., (90) in Canada. Therefore the
pooled estimate might have been biased towards the null due to the heterogeneity, and our
result may represent an underestimation of the true co-infection rate in this age group.
Although the burden of bocavirus and coronavirus were similar in studies that recruited
hospitalized <18 year old children (7.5% and 7.1%), bocaviruses were detected in relatively
higher proportions by studies that recruited both hospitalized and outpatients (summary
proportion 21.0%) compared to a co-infection proportion of 1.8% for coronaviruses (Figure 3.3
and 3.5). Apart from reporting low detection of coronaviruses, studies included in the
coronavirus analysis were heterogeneous (I2 = 68.8, p = 0.04 and I2 = 80.7, p = 0.006). We
could not identify a specific reason to explain the heterogeneity, it could probably be due to
seasonal trends, differences in the places the studies were conducted or because of the
differences in the sensitivity of the PCR assays used for the identification of coronaviruses.
As for the other viruses, the proportion of hMPV was 4.5% and AdV, 3.7% for studies that
recruited hospitalized under-five year old children. However, the proportion of RV co-infection
was 9.0% among hospitalized patients of all age groups and AdV, 11.3% among studies that
recruited both hospitalized and outpatient under-five year old children (Figure 3.4, 3.6 and 3.7),
whereas, the proportions of co-infection for RV and hMPV were much lower (range 0.2% to
3.9%), among studies that recruited both in and outpatients. Apart from analyses in RV, there
was no heterogeneity in the studies included in the other analyses (Figure 3.4, 3.6 and 3.7).
Lastly, parainfluenza viruses were the most unlikely viruses to co-infect with influenza A
viruses; only 1.2% in hospitalized under-five children and 2.0% in studies that recruited both
hospitalized and outpatients (Figure 3.8).
3.1.4.3. Association between co-infection with viral load and interferon production
Four of the included studies reported the relationship between co-infection patterns and
quantity of virus shed or innate immune responses (Table 3.3). Apart from Martin et al., (82)
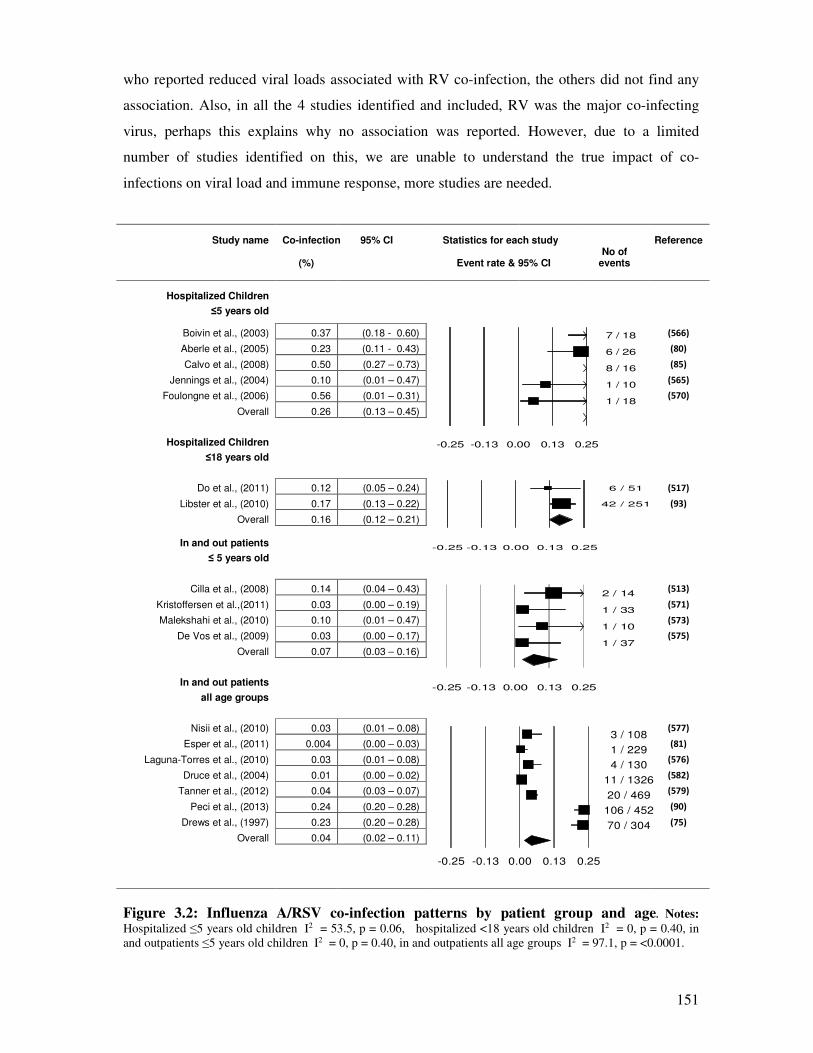
151
who reported reduced viral loads associated with RV co-infection, the others did not find any
association. Also, in all the 4 studies identified and included, RV was the major co-infecting
virus, perhaps this explains why no association was reported. However, due to a limited
number of studies identified on this, we are unable to understand the true impact of co-
infections on viral load and immune response, more studies are needed.
Study name Co-infection 95% CI Statistics for each study Reference
(%)
Event rate & 95% CI
No of events
Hospitalized Children
≤5 years old
Boivin et al., (2003) 0.37 (0.18 - 0.60) (566)
Aberle et al., (2005) 0.23 (0.11 - 0.43) (80)
Calvo et al., (2008) 0.50 (0.27 – 0.73) (85)
Jennings et al., (2004) 0.10 (0.01 – 0.47) (565)
Foulongne et al., (2006) 0.56 (0.01 – 0.31) (570)
Overall 0.26 (0.13 – 0.45)
Hospitalized Children
≤18 years old
Do et al., (2011) 0.12 (0.05 – 0.24) (517)
Libster et al., (2010) 0.17 (0.13 – 0.22) (93)
Overall 0.16 (0.12 – 0.21)
In and out patients
≤ 5 years old
Cilla et al., (2008) 0.14 (0.04 – 0.43) (513)
Kristoffersen et al.,(2011) 0.03 (0.00 – 0.19) (571)
Malekshahi et al., (2010) 0.10 (0.01 – 0.47) (573)
De Vos et al., (2009) 0.03 (0.00 – 0.17) (575)
Overall 0.07 (0.03 – 0.16)
In and out patients
all age groups
Nisii et al., (2010) 0.03 (0.01 – 0.08) (577)
Esper et al., (2011) 0.004 (0.00 – 0.03) (81)
Laguna-Torres et al., (2010) 0.03 (0.01 – 0.08) (576)
Druce et al., (2004) 0.01 (0.00 – 0.02) (582)
Tanner et al., (2012) 0.04 (0.03 – 0.07) (579)
Peci et al., (2013) 0.24 (0.20 – 0.28) (90)
Drews et al., (1997) 0.23 (0.20 – 0.28) (75)
Overall 0.04 (0.02 – 0.11)
Figure 3.2: Influenza A/RSV co-infection patterns by patient group and age. Notes:
Hospitalized ≤5 years old children I2 = 53.5, p = 0.06, hospitalized <18 years old children I2 = 0, p = 0.40, in
and outpatients ≤5 years old children I2 = 0, p = 0.40, in and outpatients all age groups I2 = 97.1, p = <0.0001.
6 / 51
42 / 251
-0.25 -0.13 0.00 0.13 0.25
7 / 18
6 / 26
8 / 16
1 / 10
1 / 18
-0.25 -0.13 0.00 0.13 0.25
2 / 14
1 / 33
1 / 10
1 / 37
-0.25 -0.13 0.00 0.13 0.25
3 / 108
1 / 229
4 / 130
11 / 1326
20 / 469
106 / 452
70 / 304
-0.25 -0.13 0.00 0.13 0.25
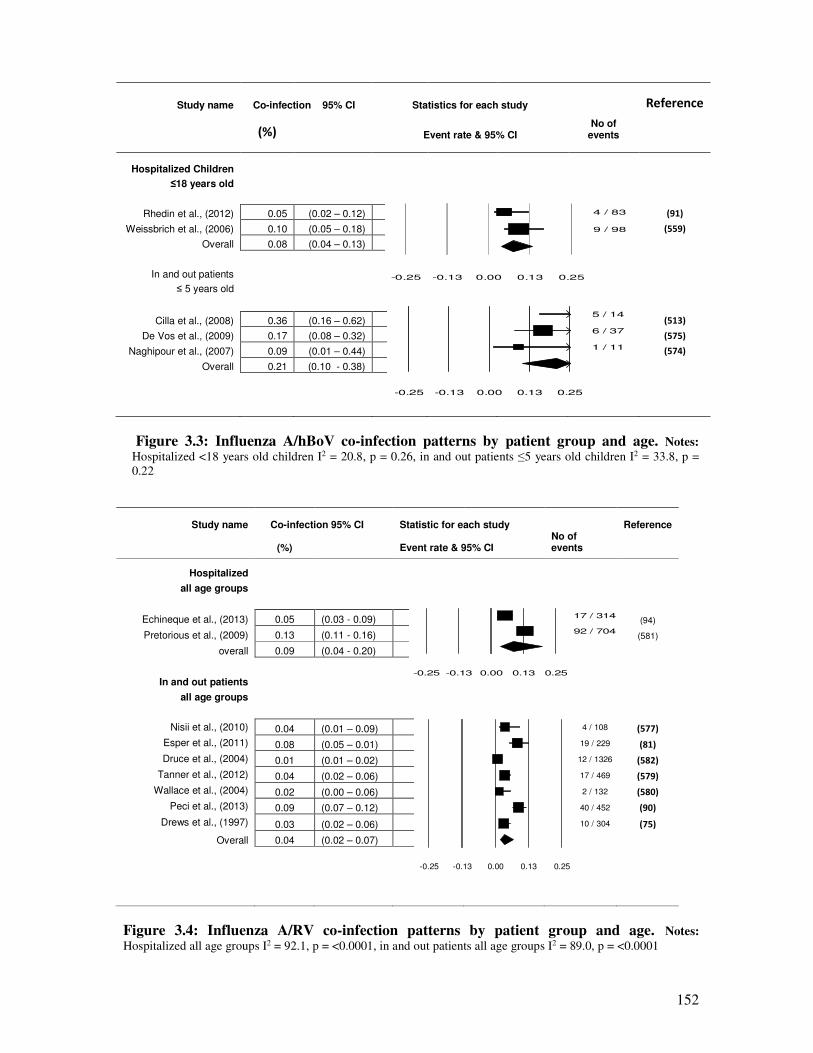
152
Study name Co-infection 95% CI Statistics for each study
Reference
(%)
Event rate & 95% CI
No of events
Hospitalized Children
≤18 years old
Rhedin et al., (2012) 0.05 (0.02 – 0.12) (91)
Weissbrich et al., (2006) 0.10 (0.05 – 0.18) (559)
Overall 0.08 (0.04 – 0.13)
In and out patients
≤ 5 years old
Cilla et al., (2008) 0.36 (0.16 – 0.62) (513)
De Vos et al., (2009) 0.17 (0.08 – 0.32) (575)
Naghipour et al., (2007) 0.09 (0.01 – 0.44) (574)
Overall 0.21 (0.10 - 0.38)
Figure 3.3: Influenza A/hBoV co-infection patterns by patient group and age. Notes:
Hospitalized <18 years old children I2 = 20.8, p = 0.26, in and out patients ≤5 years old children I2 = 33.8, p =
0.22
Study name Co-infection 95% CI Statistic for each study
Reference
(%)
Event rate & 95% CI
No of events
Hospitalized
all age groups
Echineque et al., (2013) 0.05 (0.03 - 0.09) (94)
Pretorious et al., (2009) 0.13 (0.11 - 0.16) (581)
overall 0.09 (0.04 - 0.20)
In and out patients
all age groups
Nisii et al., (2010) 0.04 (0.01 – 0.09) (577)
Esper et al., (2011) 0.08 (0.05 – 0.01)
(81)
Druce et al., (2004) 0.01 (0.01 – 0.02) (582)
Tanner et al., (2012) 0.04 (0.02 – 0.06) (579)
Wallace et al., (2004) 0.02 (0.00 – 0.06)
(580)
Peci et al., (2013) 0.09 (0.07 – 0.12) (90)
Drews et al., (1997) 0.03 (0.02 – 0.06)
(75)
Overall 0.04 (0.02 – 0.07)
Figure 3.4: Influenza A/RV co-infection patterns by patient group and age. Notes:
Hospitalized all age groups I2 = 92.1, p = <0.0001, in and out patients all age groups I2 = 89.0, p = <0.0001
4 / 83
9 / 98
-0.25 -0.13 0.00 0.13 0.25
5 / 14
6 / 37
1 / 11
-0.25 -0.13 0.00 0.13 0.25
17 / 314
92 / 704
-0.25 -0.13 0.00 0.13 0.25
4 / 108
19 / 229
12 / 1326
17 / 469
2 / 132
40 / 452
10 / 304
-0.25 -0.13 0.00 0.13 0.25
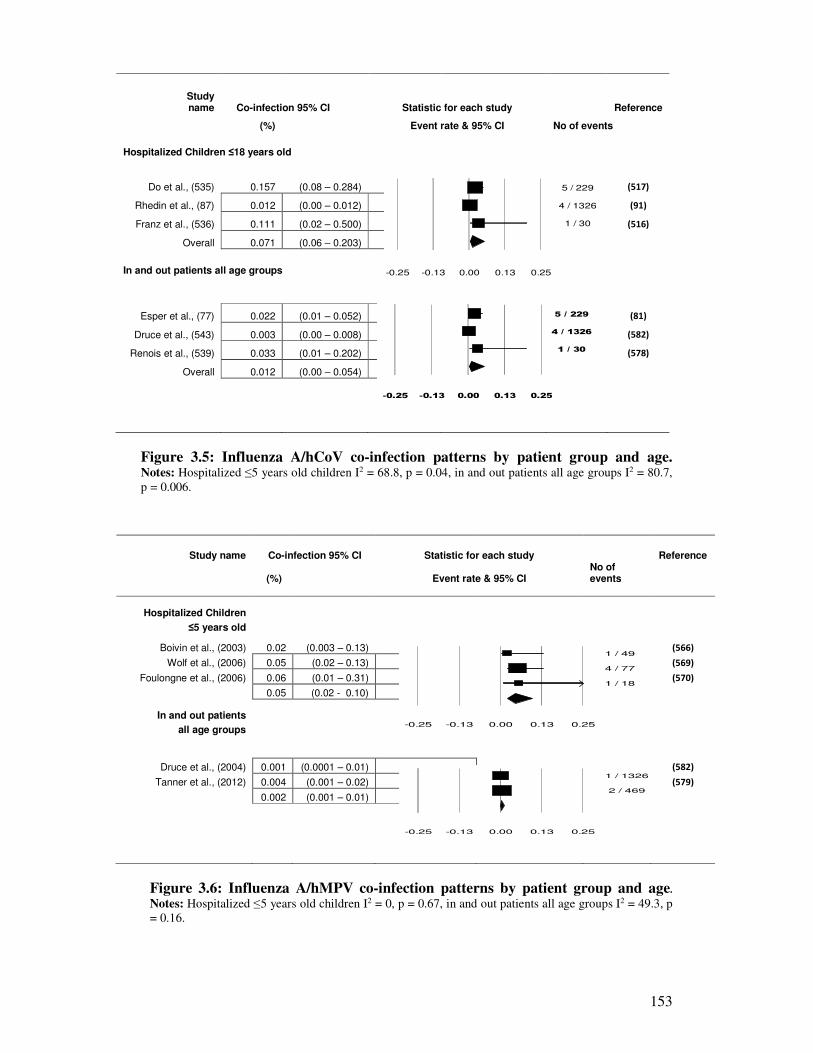
153
Study name Co-infection 95% CI Statistic for each study
Reference
(%)
Event rate & 95% CI No of events
Hospitalized Children ≤18 years old
Do et al., (535) 0.157 (0.08 – 0.284)
(517)
Rhedin et al., (87) 0.012 (0.00 – 0.012) (91)
Franz et al., (536) 0.111 (0.02 – 0.500)
(516)
Overall 0.071 (0.06 – 0.203)
In and out patients all age groups
Esper et al., (77) 0.022 (0.01 – 0.052) (81)
Druce et al., (543) 0.003 (0.00 – 0.008)
(582)
Renois et al., (539) 0.033 (0.01 – 0.202) (578)
Overall 0.012 (0.00 – 0.054)
Figure 3.5: Influenza A/hCoV co-infection patterns by patient group and age. Notes: Hospitalized ≤5 years old children I2 = 68.8, p = 0.04, in and out patients all age groups I2 = 80.7,
p = 0.006.
Study name Co-infection 95% CI Statistic for each study
Reference
(%)
Event rate & 95% CI
No of events
Hospitalized Children
≤5 years old
Boivin et al., (2003) 0.02 (0.003 – 0.13) (566)
Wolf et al., (2006) 0.05 (0.02 – 0.13) (569)
Foulongne et al., (2006) 0.06 (0.01 – 0.31) (570)
0.05 (0.02 - 0.10)
In and out patients
all age groups
Druce et al., (2004) 0.001 (0.0001 – 0.01) (582)
Tanner et al., (2012) 0.004 (0.001 – 0.02) (579)
0.002 (0.001 – 0.01)
Figure 3.6: Influenza A/hMPV co-infection patterns by patient group and age.
Notes: Hospitalized ≤5 years old children I2 = 0, p = 0.67, in and out patients all age groups I2 = 49.3, p
= 0.16.
1 / 49
4 / 77
1 / 18
-0.25 -0.13 0.00 0.13 0.25
1 / 1326
2 / 469
-0.25 -0.13 0.00 0.13 0.25
5 / 229
4 / 1326
1 / 30
-0.25 -0.13 0.00 0.13 0.25
5 / 229
4 / 1326
1 / 30
-0.25 -0.13 0.00 0.13 0.25
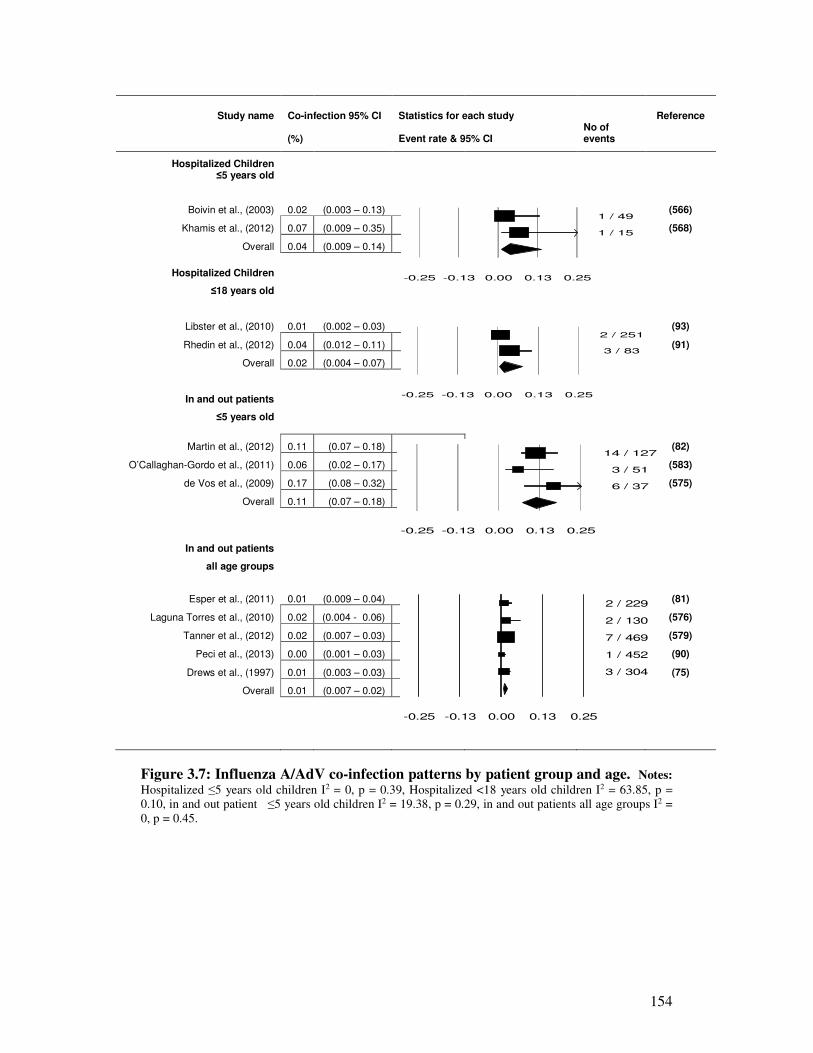
154
Study name Co-infection 95% CI Statistics for each study
Reference
(%)
Event rate & 95% CI
No of events
Hospitalized Children ≤5 years old
Boivin et al., (2003) 0.02
(0.003 – 0.13)
(566)
Khamis et al., (2012) 0.07 (0.009 – 0.35) (568)
Overall 0.04 (0.009 – 0.14)
Hospitalized Children
≤18 years old
Libster et al., (2010) 0.01 (0.002 – 0.03) (93)
Rhedin et al., (2012) 0.04 (0.012 – 0.11) (91)
Overall 0.02 (0.004 – 0.07)
In and out patients
≤5 years old
Martin et al., (2012) 0.11 (0.07 – 0.18) (82)
O’Callaghan-Gordo et al., (2011) 0.06 (0.02 – 0.17) (583)
de Vos et al., (2009) 0.17 (0.08 – 0.32) (575)
Overall 0.11 (0.07 – 0.18)
In and out patients
all age groups
Esper et al., (2011) 0.01 (0.009 – 0.04)
(81)
Laguna Torres et al., (2010) 0.02 (0.004 - 0.06) (576)
Tanner et al., (2012) 0.02 (0.007 – 0.03) (579)
Peci et al., (2013) 0.00 (0.001 – 0.03) (90)
Drews et al., (1997) 0.01 (0.003 – 0.03) (75)
Overall 0.01 (0.007 – 0.02)
Figure 3.7: Influenza A/AdV co-infection patterns by patient group and age. Notes:
Hospitalized ≤5 years old children I2 = 0, p = 0.39, Hospitalized <18 years old children I2 = 63.85, p =
0.10, in and out patient ≤5 years old children I2 = 19.38, p = 0.29, in and out patients all age groups I2 =
0, p = 0.45.
1 / 49
1 / 15
-0.25 -0.13 0.00 0.13 0.25
2 / 251
3 / 83
-0.25 -0.13 0.00 0.13 0.25
14 / 127
3 / 51
6 / 37
-0.25 -0.13 0.00 0.13 0.25
2 / 229
2 / 130
7 / 469
1 / 452
3 / 304
-0.25 -0.13 0.00 0.13 0.25
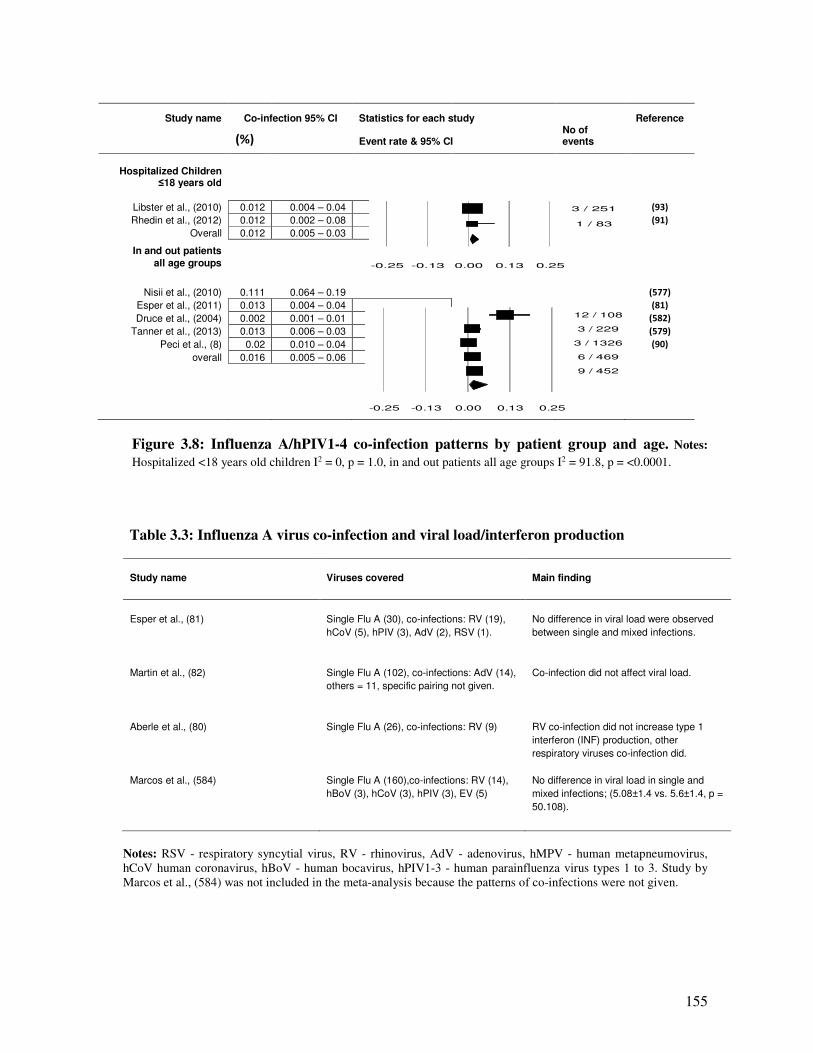
155
Study name Co-infection 95% CI Statistics for each study
Reference
(%)
Event rate & 95% CI
No of events
Hospitalized Children ≤18 years old
Libster et al., (2010) 0.012 0.004 – 0.04
(93)
Rhedin et al., (2012) 0.012 0.002 – 0.08
(91)
Overall 0.012 0.005 – 0.03
In and out patients
all age groups
Nisii et al., (2010) 0.111 0.064 – 0.19
(577)
Esper et al., (2011) 0.013 0.004 – 0.04 (81) Druce et al., (2004) 0.002 0.001 – 0.01 (582)
Tanner et al., (2013) 0.013 0.006 – 0.03 (579) Peci et al., (8) 0.02 0.010 – 0.04
(90)
overall 0.016 0.005 – 0.06
Figure 3.8: Influenza A/hPIV1-4 co-infection patterns by patient group and age. Notes:
Hospitalized <18 years old children I2 = 0, p = 1.0, in and out patients all age groups I2 = 91.8, p = <0.0001.
Table 3.3: Influenza A virus co-infection and viral load/interferon production
Study name
Viruses covered
Main finding
Esper et al., (81)
Single Flu A (30), co-infections: RV (19),
hCoV (5), hPIV (3), AdV (2), RSV (1).
No difference in viral load were observed
between single and mixed infections.
Martin et al., (82)
Single Flu A (102), co-infections: AdV (14),
others = 11, specific pairing not given.
Co-infection did not affect viral load.
Aberle et al., (80)
Single Flu A (26), co-infections: RV (9)
RV co-infection did not increase type 1
interferon (INF) production, other
respiratory viruses co-infection did.
Marcos et al., (584)
Single Flu A (160),co-infections: RV (14),
hBoV (3), hCoV (3), hPIV (3), EV (5)
No difference in viral load in single and
mixed infections; (5.08±1.4 vs. 5.6±1.4, p =
50.108).
Notes: RSV - respiratory syncytial virus, RV - rhinovirus, AdV - adenovirus, hMPV - human metapneumovirus,
hCoV human coronavirus, hBoV - human bocavirus, hPIV1-3 - human parainfluenza virus types 1 to 3. Study by
Marcos et al., (584) was not included in the meta-analysis because the patterns of co-infections were not given.
3 / 251
1 / 83
-0.25 -0.13 0.00 0.13 0.25
12 / 108
3 / 229
3 / 1326
6 / 469
9 / 452
-0.25 -0.13 0.00 0.13 0.25
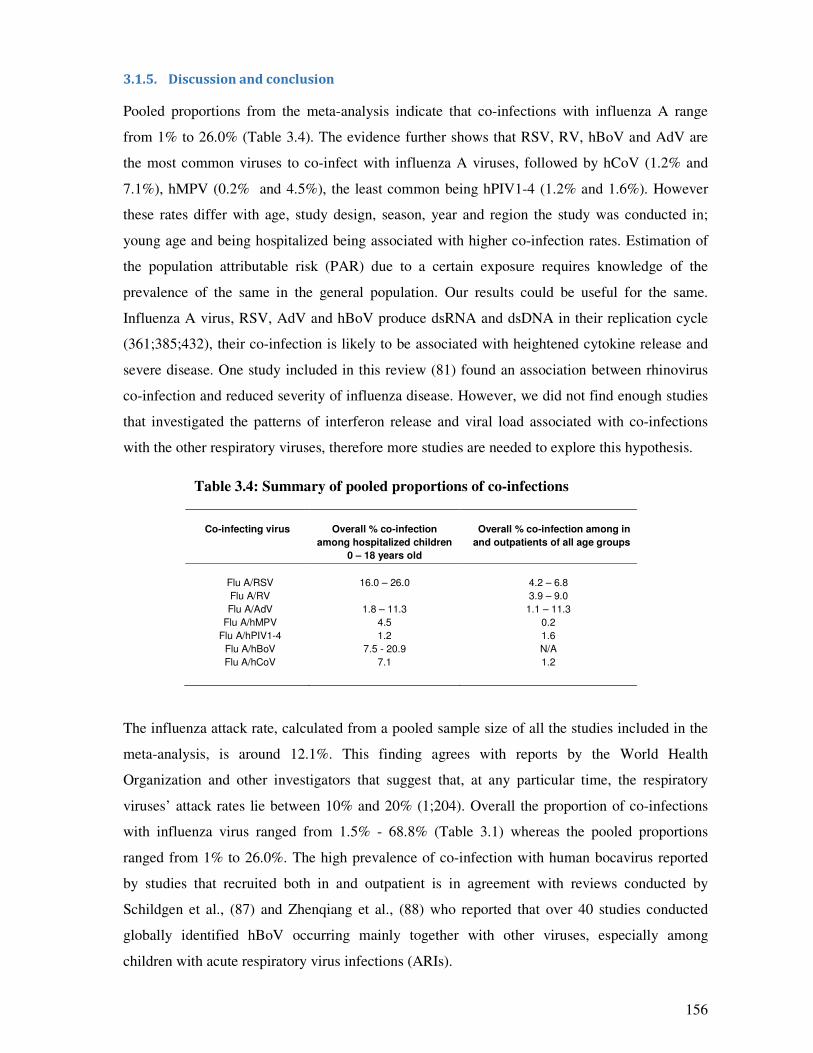
156
3.1.5. Discussion and conclusion
Pooled proportions from the meta-analysis indicate that co-infections with influenza A range
from 1% to 26.0% (Table 3.4). The evidence further shows that RSV, RV, hBoV and AdV are
the most common viruses to co-infect with influenza A viruses, followed by hCoV (1.2% and
7.1%), hMPV (0.2% and 4.5%), the least common being hPIV1-4 (1.2% and 1.6%). However
these rates differ with age, study design, season, year and region the study was conducted in;
young age and being hospitalized being associated with higher co-infection rates. Estimation of
the population attributable risk (PAR) due to a certain exposure requires knowledge of the
prevalence of the same in the general population. Our results could be useful for the same.
Influenza A virus, RSV, AdV and hBoV produce dsRNA and dsDNA in their replication cycle
(361;385;432), their co-infection is likely to be associated with heightened cytokine release and
severe disease. One study included in this review (81) found an association between rhinovirus
co-infection and reduced severity of influenza disease. However, we did not find enough studies
that investigated the patterns of interferon release and viral load associated with co-infections
with the other respiratory viruses, therefore more studies are needed to explore this hypothesis.
Table 3.4: Summary of pooled proportions of co-infections
Co-infecting virus
Overall % co-infection
among hospitalized children
0 – 18 years old
Overall % co-infection among in
and outpatients of all age groups
Flu A/RSV
16.0 – 26.0
4.2 – 6.8
Flu A/RV 3.9 – 9.0
Flu A/AdV 1.8 – 11.3 1.1 – 11.3
Flu A/hMPV 4.5 0.2
Flu A/hPIV1-4 1.2 1.6
Flu A/hBoV 7.5 - 20.9 N/A
Flu A/hCoV 7.1 1.2
The influenza attack rate, calculated from a pooled sample size of all the studies included in the
meta-analysis, is around 12.1%. This finding agrees with reports by the World Health
Organization and other investigators that suggest that, at any particular time, the respiratory
viruses’ attack rates lie between 10% and 20% (1;204). Overall the proportion of co-infections
with influenza virus ranged from 1.5% - 68.8% (Table 3.1) whereas the pooled proportions
ranged from 1% to 26.0%. The high prevalence of co-infection with human bocavirus reported
by studies that recruited both in and outpatient is in agreement with reviews conducted by
Schildgen et al., (87) and Zhenqiang et al., (88) who reported that over 40 studies conducted
globally identified hBoV occurring mainly together with other viruses, especially among
children with acute respiratory virus infections (ARIs).
157
Circulation of some respiratory viruses vary considerably with season and year (224;300). In
discussing their findings, Druce et al.,(582) stated that over the period they conducted their
study, there was lower than expected coronavirus activity, a factor that might have accounted for
the low proportions of coronavirus co-infections reported in their study. In this study, there were
low proportions of co-infection with coronavirus and in studies that recruited both hospitalized
and outpatients. It could be that the indeed coronaviruses rarely co-infect with influenza A
viruses or that the observed rates are biased by seasonal variations. Suffice to state that unlike
influenza, RSV, RV, AdV, hMPV and hPIV1-4, most studies do not test for hCoV, which could
be the reason for observed low proportions of hCoV co-infection. Esper et al., (81) called for the
use of more advanced methods for detection of co-infections such as deep sequencing, we add
that there should also be efforts to develop more sensitive RT-PCR assay(s).
A number of other factors affect the epidemiology of respiratory virus disease including: obesity,
pregnancy, prematurity and low birthweight, nutrition status and breastfeeding in infants, active
and passive smoking, immune status and vaccination (9;10;13;21;23;53;564). We made
deliberate effort when selecting studies to ensure that those included had controlled for at least
two of the known risk factors to virus infection. However, in those studies where only age and
sex were controlled for, e.g. O’Callaghan-Gordo et al., (583), Cilla et al., (513), Malekshahi et
al., (573), De Vos et al., (575) and a few others there is a possibility that their reports might be
biased and this should be born in mind when interpreting our results. Influenza vaccine
effectiveness studies suggest that vaccination increases the risk of non-influenza respiratory virus
infection (561-563). In this review, most of the studies did not control for patients vaccination
status, with only Renois et al., (578) mentioning the same. The observed epidemiology of co-
infections may have also been affected by patients influenza vaccination status and this should
also be born in mind.
There is a possibility that some studies that were published in languages other than English
might have found different results than those summarized here. Our choosing of only studies that
were published in English might possibly have introduced reporting or publication or selection
bias. The type of diagnostic method employed for identification of respiratory viruses greatly
affects the observed virus yield with RT-PCR generally being regarded as better than cell culture
due to the fact that some of the respiratory viruses cannot be easily grown in laboratory
environments (585). In order to eliminate measurement bias, only studies that used conventional
PCR or RT-PCR were included.
In conclusion, this meta-analysis has found RSV, hBoV, RV and AdV as the most common
viruses to co-infect with influenza A viruses mainly in children ≤5 years old. We did not find
158
enough studies that investigated association between co-infection and viraemia or cytokines over
production. Routine testing of these and the other respiratory virus infections among patients
with influenza A virus infection is recommended so as to help in patient management. Future
research should be directed at understanding the biomedical processes associated with different
respiratory virus co-infections with influenza A viruses so as to elucidate mechanisms of
virulence or avirulence.
Funding: This work had no funding.
Acknowledgements: The authors would like to acknowledge the University of Manchester, the
Manchester Academic Health Science Centre.
Conflict of interest: All authors, no conflict of interest.
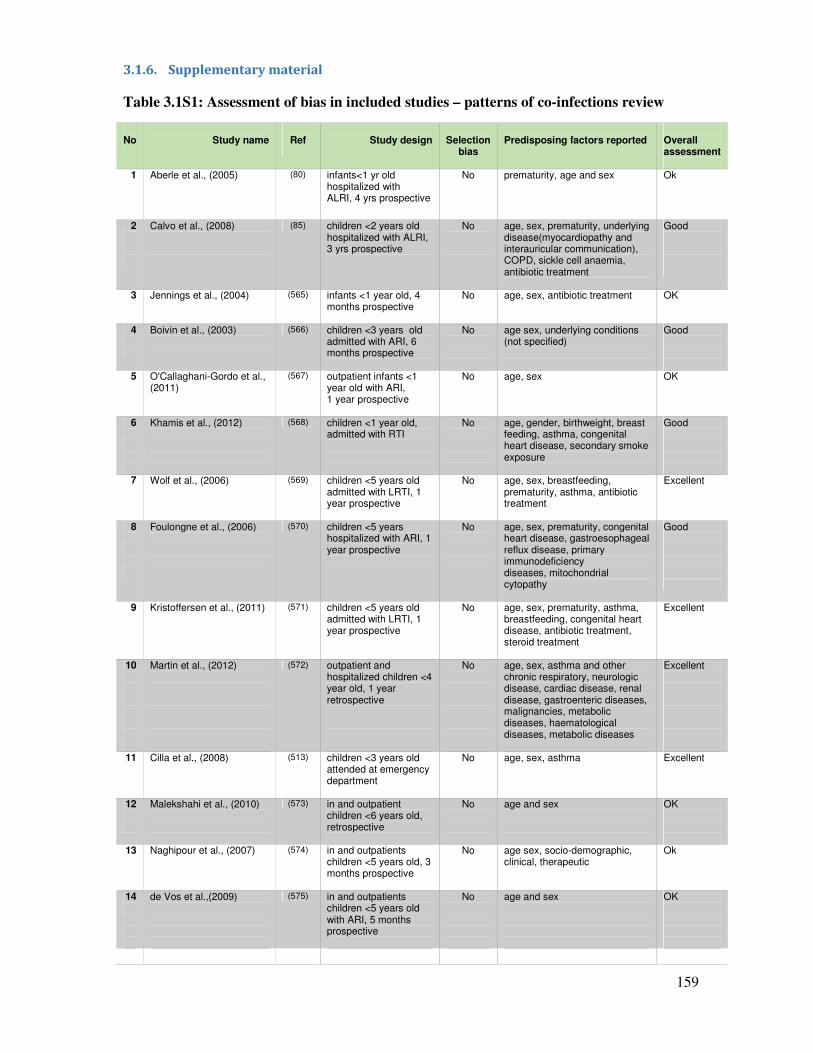
159
3.1.6. Supplementary material
Table 3.1S1: Assessment of bias in included studies – patterns of co-infections review
No
Study name
Ref
Study design
Selection
bias
Predisposing factors reported
Overall assessment
1
Aberle et al., (2005)
(80) infants<1 yr old hospitalized with ALRI, 4 yrs prospective
No
prematurity, age and sex
Ok
2
Calvo et al., (2008)
(85) children <2 years old hospitalized with ALRI, 3 yrs prospective
No
age, sex, prematurity, underlying disease(myocardiopathy and interauricular communication), COPD, sickle cell anaemia, antibiotic treatment
Good
3
Jennings et al., (2004)
(565) infants <1 year old, 4 months prospective
No
age, sex, antibiotic treatment
OK
4
Boivin et al., (2003)
(566) children <3 years old admitted with ARI, 6 months prospective
No
age sex, underlying conditions (not specified)
Good
5
O'Callaghani-Gordo et al., (2011)
(567) outpatient infants <1 year old with ARI, 1 year prospective
No
age, sex
OK
6
Khamis et al., (2012)
(568) children <1 year old, admitted with RTI
No
age, gender, birthweight, breast feeding, asthma, congenital heart disease, secondary smoke exposure
Good
7
Wolf et al., (2006)
(569) children <5 years old admitted with LRTI, 1 year prospective
No
age, sex, breastfeeding, prematurity, asthma, antibiotic treatment
Excellent
8
Foulongne et al., (2006)
(570) children <5 years hospitalized with ARI, 1 year prospective
No
age, sex, prematurity, congenital heart disease, gastroesophageal reflux disease, primary immunodeficiency diseases, mitochondrial cytopathy
Good
9
Kristoffersen et al., (2011)
(571) children <5 years old admitted with LRTI, 1 year prospective
No
age, sex, prematurity, asthma, breastfeeding, congenital heart disease, antibiotic treatment, steroid treatment
Excellent
10
Martin et al., (2012)
(572) outpatient and hospitalized children <4 year old, 1 year retrospective
No
age, sex, asthma and other chronic respiratory, neurologic disease, cardiac disease, renal disease, gastroenteric diseases, malignancies, metabolic diseases, haematological diseases, metabolic diseases
Excellent
11
Cilla et al., (2008)
(513) children <3 years old attended at emergency department
No
age, sex, asthma
Excellent
12
Malekshahi et al., (2010)
(573) in and outpatient children <6 years old, retrospective
No
age and sex
OK
13
Naghipour et al., (2007)
(574) in and outpatients children <5 years old, 3 months prospective
No
age sex, socio-demographic, clinical, therapeutic
Ok
14
de Vos et al.,(2009)
(575) in and outpatients children <5 years old with ARI, 5 months prospective
No
age and sex
OK
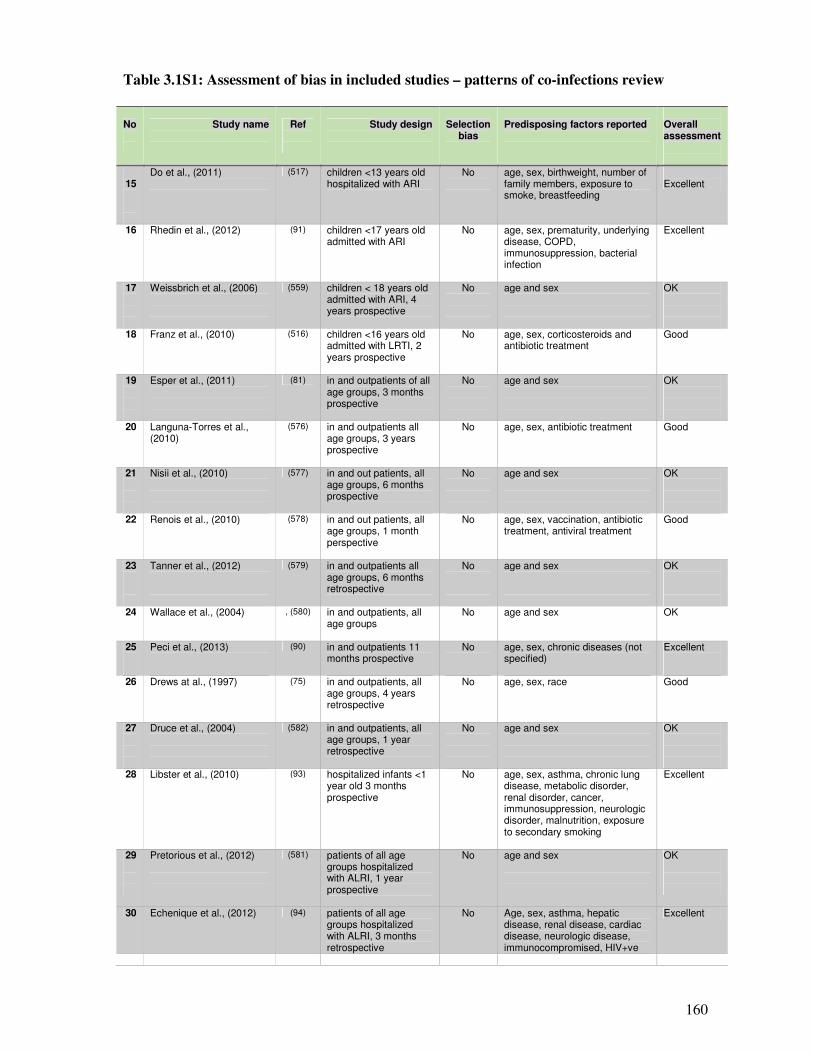
160
Table 3.1S1: Assessment of bias in included studies – patterns of co-infections review
No
Study name
Ref
Study design
Selection bias
Predisposing factors reported
Overall assessment
15
Do et al., (2011)
(517) children <13 years old hospitalized with ARI
No
age, sex, birthweight, number of family members, exposure to smoke, breastfeeding
Excellent
16
Rhedin et al., (2012)
(91) children <17 years old admitted with ARI
No
age, sex, prematurity, underlying disease, COPD, immunosuppression, bacterial infection
Excellent
17
Weissbrich et al., (2006)
(559) children < 18 years old admitted with ARI, 4 years prospective
No
age and sex
OK
18
Franz et al., (2010)
(516) children <16 years old admitted with LRTI, 2 years prospective
No
age, sex, corticosteroids and antibiotic treatment
Good
19
Esper et al., (2011)
(81) in and outpatients of all age groups, 3 months prospective
No
age and sex
OK
20
Languna-Torres et al., (2010)
(576) in and outpatients all age groups, 3 years prospective
No
age, sex, antibiotic treatment
Good
21
Nisii et al., (2010)
(577) in and out patients, all age groups, 6 months prospective
No
age and sex
OK
22
Renois et al., (2010)
(578) in and out patients, all age groups, 1 month perspective
No
age, sex, vaccination, antibiotic treatment, antiviral treatment
Good
23
Tanner et al., (2012)
(579) in and outpatients all age groups, 6 months retrospective
No
age and sex
OK
24
Wallace et al., (2004)
, (580) in and outpatients, all age groups
No
age and sex
OK
25
Peci et al., (2013)
(90) in and outpatients 11 months prospective
No
age, sex, chronic diseases (not specified)
Excellent
26
Drews at al., (1997)
(75) in and outpatients, all age groups, 4 years retrospective
No
age, sex, race
Good
27
Druce et al., (2004)
(582) in and outpatients, all age groups, 1 year retrospective
No
age and sex
OK
28
Libster et al., (2010)
(93) hospitalized infants <1 year old 3 months prospective
No
age, sex, asthma, chronic lung disease, metabolic disorder, renal disorder, cancer, immunosuppression, neurologic disorder, malnutrition, exposure to secondary smoking
Excellent
29
Pretorious et al., (2012)
(581) patients of all age groups hospitalized with ALRI, 1 year prospective
No age and sex
OK
30 Echenique et al., (2012) (94) patients of all age groups hospitalized with ALRI, 3 months retrospective
No Age, sex, asthma, hepatic disease, renal disease, cardiac disease, neurologic disease, immunocompromised, HIV+ve
Excellent
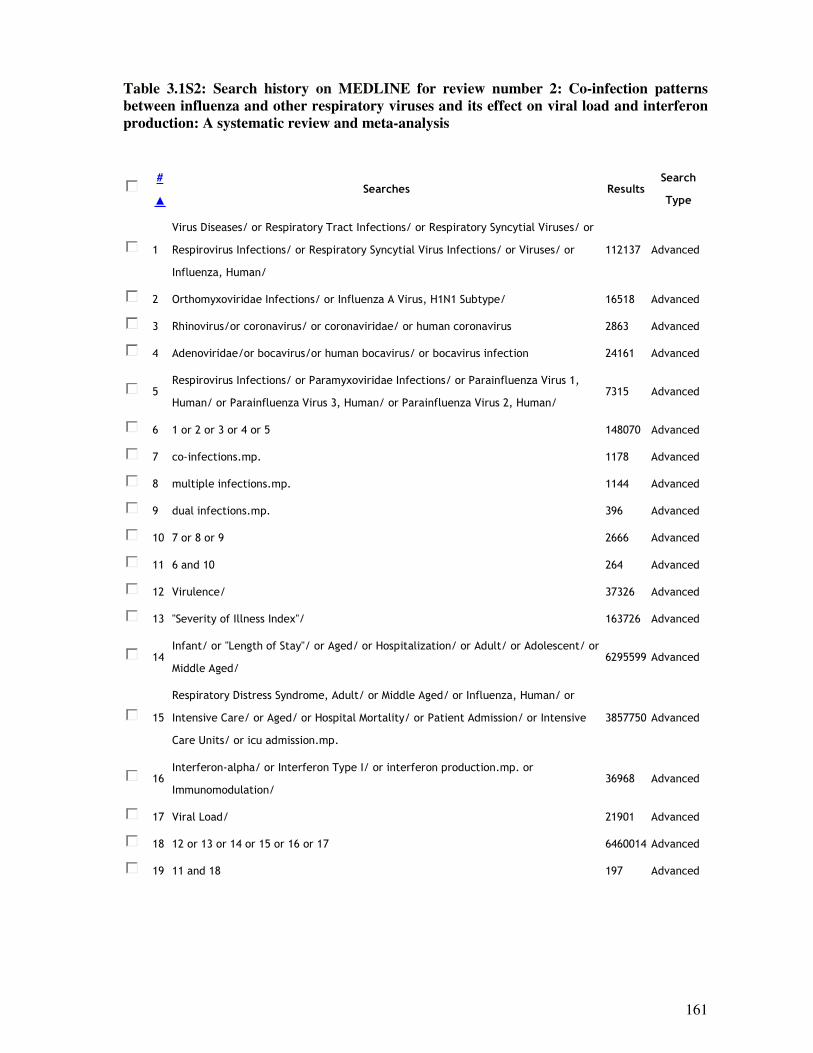
161
Table 3.1S2: Search history on MEDLINE for review number 2: Co-infection patterns
between influenza and other respiratory viruses and its effect on viral load and interferon
production: A systematic review and meta-analysis
#
▲
Searches Results Search
Type
1
Virus Diseases/ or Respiratory Tract Infections/ or Respiratory Syncytial Viruses/ or
Respirovirus Infections/ or Respiratory Syncytial Virus Infections/ or Viruses/ or
Influenza, Human/
112137 Advanced
2 Orthomyxoviridae Infections/ or Influenza A Virus, H1N1 Subtype/ 16518 Advanced
3 Rhinovirus/or coronavirus/ or coronaviridae/ or human coronavirus 2863 Advanced
4 Adenoviridae/or bocavirus/or human bocavirus/ or bocavirus infection 24161 Advanced
5 Respirovirus Infections/ or Paramyxoviridae Infections/ or Parainfluenza Virus 1,
Human/ or Parainfluenza Virus 3, Human/ or Parainfluenza Virus 2, Human/ 7315 Advanced
6 1 or 2 or 3 or 4 or 5 148070 Advanced
7 co-infections.mp. 1178 Advanced
8 multiple infections.mp. 1144 Advanced
9 dual infections.mp. 396 Advanced
10 7 or 8 or 9 2666 Advanced
11 6 and 10 264 Advanced
12 Virulence/ 37326 Advanced
13 "Severity of Illness Index"/ 163726 Advanced
14 Infant/ or "Length of Stay"/ or Aged/ or Hospitalization/ or Adult/ or Adolescent/ or
Middle Aged/ 6295599 Advanced
15
Respiratory Distress Syndrome, Adult/ or Middle Aged/ or Influenza, Human/ or
Intensive Care/ or Aged/ or Hospital Mortality/ or Patient Admission/ or Intensive
Care Units/ or icu admission.mp.
3857750 Advanced
16 Interferon-alpha/ or Interferon Type I/ or interferon production.mp. or
Immunomodulation/ 36968 Advanced
17 Viral Load/ 21901 Advanced
18 12 or 13 or 14 or 15 or 16 or 17 6460014 Advanced
19 11 and 18 197 Advanced
162
3.2. Co-infections patterns and severity Part B: Single and multiple respiratory virus
infections and severity of respiratory disease: A systematic review and meta-
analysis
Synopsis
This is the authors’ version of this paper, published in the journal of Paediatrics Respiratory
Reviews, on 1st November, 2013. dio: 10.1016/j.prrv.2013.11.001. Reprinted from Goka et al.,
(586) with permission from Elsevier, Copyright Licence number 3286790553919. A poster of an
earlier version of this paper was presented at the XV International Symposium on Respiratory Viral
Infections. 14 – 17 March 2013, Rotterdam, the Netherlands. Poster number P7. This review is to
summarize the available evidence on impact of co-infections on severity of respiratory virus
infections.
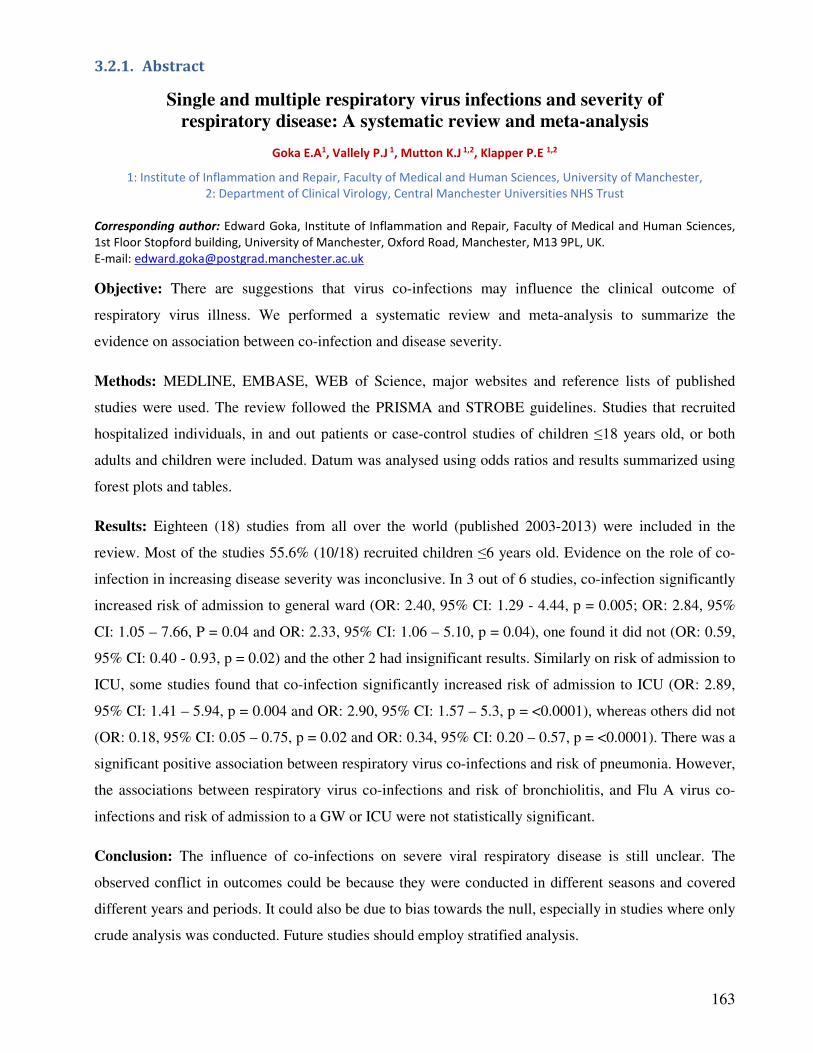
163
3.2.1. Abstract
Single and multiple respiratory virus infections and severity of
respiratory disease: A systematic review and meta-analysis
Goka E.A1, Vallely P.J 1, Mutton K.J 1,2, Klapper P.E 1,2
1: Institute of Inflammation and Repair, Faculty of Medical and Human Sciences, University of Manchester,
2: Department of Clinical Virology, Central Manchester Universities NHS Trust
Corresponding author: Edward Goka, Institute of Inflammation and Repair, Faculty of Medical and Human Sciences,
1st Floor Stopford building, University of Manchester, Oxford Road, Manchester, M13 9PL, UK.
E-mail: [email protected]
Objective: There are suggestions that virus co-infections may influence the clinical outcome of
respiratory virus illness. We performed a systematic review and meta-analysis to summarize the
evidence on association between co-infection and disease severity.
Methods: MEDLINE, EMBASE, WEB of Science, major websites and reference lists of published
studies were used. The review followed the PRISMA and STROBE guidelines. Studies that recruited
hospitalized individuals, in and out patients or case-control studies of children ≤18 years old, or both
adults and children were included. Datum was analysed using odds ratios and results summarized using
forest plots and tables.
Results: Eighteen (18) studies from all over the world (published 2003-2013) were included in the
review. Most of the studies 55.6% (10/18) recruited children ≤6 years old. Evidence on the role of co-
infection in increasing disease severity was inconclusive. In 3 out of 6 studies, co-infection significantly
increased risk of admission to general ward (OR: 2.40, 95% CI: 1.29 - 4.44, p = 0.005; OR: 2.84, 95%
CI: 1.05 – 7.66, P = 0.04 and OR: 2.33, 95% CI: 1.06 – 5.10, p = 0.04), one found it did not (OR: 0.59,
95% CI: 0.40 - 0.93, p = 0.02) and the other 2 had insignificant results. Similarly on risk of admission to
ICU, some studies found that co-infection significantly increased risk of admission to ICU (OR: 2.89,
95% CI: 1.41 – 5.94, p = 0.004 and OR: 2.90, 95% CI: 1.57 – 5.3, p = <0.0001), whereas others did not
(OR: 0.18, 95% CI: 0.05 – 0.75, p = 0.02 and OR: 0.34, 95% CI: 0.20 – 0.57, p = <0.0001). There was a
significant positive association between respiratory virus co-infections and risk of pneumonia. However,
the associations between respiratory virus co-infections and risk of bronchiolitis, and Flu A virus co-
infections and risk of admission to a GW or ICU were not statistically significant.
Conclusion: The influence of co-infections on severe viral respiratory disease is still unclear. The
observed conflict in outcomes could be because they were conducted in different seasons and covered
different years and periods. It could also be due to bias towards the null, especially in studies where only
crude analysis was conducted. Future studies should employ stratified analysis.
164
3.2.2. Introduction
Respiratory viruses including; influenza virus types A and B (Flu A/B), respiratory syncytial virus
(RSV), rhinovirus (RV), adenovirus (AdV), human metapneumovirus (hMPV), human
coronavirus (hCoV), human bocavirus (hBoV) and human parainfluenza viruses type 1, 2 and 3
(hPIV1-3), have been singly or jointly detected from patients suffering from respiratory diseases
(203;205;206;587). Incidence studies have indicated that 5-38% of respiratory infections develop
into acute respiratory tract infections (ARIs) with severe signs and symptoms including wheezing,
bronchiolitis, croup, high fever and pneumonia with subsequent increases in hospitalization to a
general ward (GW), admission to intensive care unit (ICU), or mortality
(17;204;216;217;330;588). A number of factors have been attributed to the severity of respiratory
viral disease including; underlying chronic diseases such as chronic respiratory diseases, diabetes,
chronic liver disease, chronic heart disease, chronic renal disease; and other factors such as
immunodeficiency, old age, young age, pregnancy, viral genome mutations (1;9;17;589). There
are suggestions that the presence of more than one type of virus in the respiratory specimen may
also affect the clinical presentation of respiratory tract infection (77;80;81;85). However, the
relationship between co-infection and severity of illness remains unclear.
3.2.2.1. Rationale for conducting the review
Knowledge on the impact of respiratory virus co-infections on disease outcome is needed to direct
policy on multiple respiratory virus testing, and prioritizing of research on integrated vaccine,
drug, and multi-targeted diagnostic tests. Although some researchers have reviewed the
association between respiratory virus infections and disease outcome, most of the reviews have
concentrated on outcomes in single infections. For example a meta-analysis published in 2013 by
Luksic et al., (590) looked at the association between severe LRTI and infection with specific
respiratory virus infections. Similarly a 2010 and 2011 meta-analyses by Nair et al., (227;228)
analysed the burden of ALRI due to RSV and influenza viruses respectively. Although a few
reviews have covered the association between respiratory virus co-infections and disease outcome;
a 2011 review by Sly et al., (83), a 2013 review by Stefansca et al., (84), the 2013 reviews by Dat
Tran (591) and Alvarez et al., (13), however, all of them have been narrative reviews. In addition,
some of the published reviews on the subject e.g. one by Ochoa Sangrador et al., (592), are in
addition to being narrative, also not in English Language. To our knowledge no prior published
study has synthesized the available evidence on co-infections in a systematic review and meta-
analysis, hence the importance of this paper.
165
3.2.2.2. Objectives and aims of the review and meta-analysis
This study investigated the relation between co-infection among respiratory viruses and co-
infection between influenza and other respiratory viruses and clinical outcome with the following
objectives:
a) To investigate the disease outcome (admission to a general ward, the intensive care unit,
bronchiolitis and pneumonia) in single vs. multiple respiratory virus infections as reported
by studies recruiting hospitalized individuals, outpatients, or community based controls of
all age groups globally.
b) To determine whether infection with influenza A viruses alone has a different disease
outcome, i.e. risk of hospitalization, admission to a general ward, ICU and death,
compared to co-infections with respiratory viruses.
c) To explore the bias and confounding factors associated with observed measures of
outcome in observational studies on respiratory virus co-infections.
The review was conducted to answer our research question: “What is the disease outcome in
single respiratory virus infections and in co-infections in general?” and therefore aimed to:
c) Generate knowledge on the role of co-infection in acute respiratory tract infection (ARI)
leading to hospitalization to a general ward or the ICU, bronchiolitis or pneumonia.
d) Highlight the confounding and bias when crude analysis is applied and the importance or
need of conducting stratified analysis in research on respiratory virus co-infections.
e) Summarize evidence that would be needed in prioritizing and making policy on the
importance of multiple testing of respiratory virus infections in patients presenting with
influenza like illness.
3.2.3. Methodology
3.2.3.1. Review protocol
A protocol for this review was developed together with the coauthors of this study as supervisors
of the principal investigator. The protocol was however not published or deposited to any online
server.
166
3.2.3.2. Literature search
We searched the electronic databases; MEDLINE, EMBASE and WEB of Science for primary
epidemiological studies on the role of co-infections in causing severe clinical disease; i.e. risk of
hospitalization to the GW, admission to ICU or death, and risk of developing bronchiolitis and
pneumonia. We also searched websites of health organisations e.g. the World Health Organisation
(WHO), United Kingdom’s Health Protection Agency (HPA), United States of America’s Centre
for Disease Control (CDC), World Influenza Network Centre, for bibliography or any published
reports on respiratory viruses’ co-infections and patient outcome. The MEDLINE and EMBASE
system have studies published from May, 1946 to date, whereas the Web of Science has studies
published from 1945 to date. The search was refined to include studies published in the English
language related to medicine in general or to specific branches i.e. infectious diseases, virology,
internal or respiratory system, pathology and critical care. Reference lists of good quality studies,
were also manually searched to identify studies addressing the question under review.
For the electronic databases, the search technique involved combining a number of subject
headings and keywords and the scoping of text words; words used included: Viruses, virus
diseases, virus infection, respiratory tract infections, respirovirus, respirovirus infections, lower
respiratory tract infection(s), upper respiratory tract infection(s), orthomyxoviridae,
orthomyxoviridae infections, orthomyxovirus, influenza human, influenza A virus, influenza A
virus H1N1 subtype, 2009 H1N1 influenza, influenza A(H1N1)pdm09, influenza A virus H3N2
subtype, rhinovirus, human rhinovirus, rhinovirus infection, adenovirus, adenovirus infection(s),
respiratory syncytial virus, respiratory syncytial virus infection(s), metapneumovirus,
metapneumovirus human, parainfluenza virus 1 human, parainfluenza virus 2 human,
parainfluenza virus 3 human, bocavirus, bocavirus infection, coronavirus, coronavirus infection,
co-infection(s), mixed infection, dual infection(s), multiple infection(s), virulence, virus virulence,
prognosis, pathogenicity, virus pneumonia, bronchiolitis, viral bronchiolitis, hospital,
hospitalization, hospital care, hospital admission, patient admission, length of stay, intensive care,
critical care, intensive care unit, ICU admission, fatality, mortality, death. Results of the electronic
search conducted for this review on Web of Science are provided in supplementary Table 3.2S3 as
an example.
167
3.2.3.3. Study quality assessment and selection criteria
The Preferred Reporting Items for Systematic Reviews and Meta-Analyses (PRISMA) guideline
(109) was followed to write the reviews. In addition, The “Strengthening the Reporting of
Observational Studies in Epidemiology (STROBE)” tool for critical appraisal of epidemiological
studies (108), was used to assess the studies identified in the search. The principal investigator of
the study conducted the online and manual search of eligible studies. First, only the title and
abstract of the studies were reviewed and those that were clearly not relevant (e.g. paper looked at
epidemiology of single respiratory virus infections, discussed bacterial vs respiratory virus co-
infections, reported circulation of virus strains), were removed. Those papers that seemed relevant
were downloaded and read in full. Descriptive prospective or retrospective cross-sectional, cohort
or case-control studies that investigated co-infection as a risk factor for disease outcome and
included the outcome measures; hospitalization to a general ward, admission to ICU, bronchiolitis
or pneumonia were included. Studies that investigated exposures other than those investigated in
this review i.e. did not include influenza and ≥4 of the other respiratory viruses considered as
exposures of interest in this study, did not give risk outcome in co-infections vs. single infections,
did not report risk of hospitalization to ICU, or general ward, bronchiolitis and pneumonia, did not
use PCR or RT-PCR as a diagnostic method, were conducted among patients with underlying
chronic diseases or impaired immunostatus, were duplicates of other included studies or had data
incompatible with odds ratios calculation, (i.e. with some cells having a zero) were excluded. In
some instances, where a paper seemed relevant but tables giving details of the outcome by virus
types was missing, the corresponding authors were contacted to provide these details if available.
3.2.3.4. Assessment of bias
Since this review investigated association between co-infection and disease severity, consideration
was made on the factors that might contribute to wrong evidence from the observational studies.
Issues considered included: declaration of conflict of interest, selection bias (how participants
were recruited, study population and demographic characteristics of the groups and if some
patients were excluded whether there was a statistical difference between included and excluded
patients), detection bias (sample size and laboratory methods used for virus identification),
reporting bias (preferences in what to report, outcome indicator used, validity of the calculations
and statistical methods used, the control/baseline population used for calculating the odds ratios),
confounding by indication or contraindication (whether a table on patients comorbidities and other
baseline characteristics was provided and whether these factors were controlled for in odds ratio
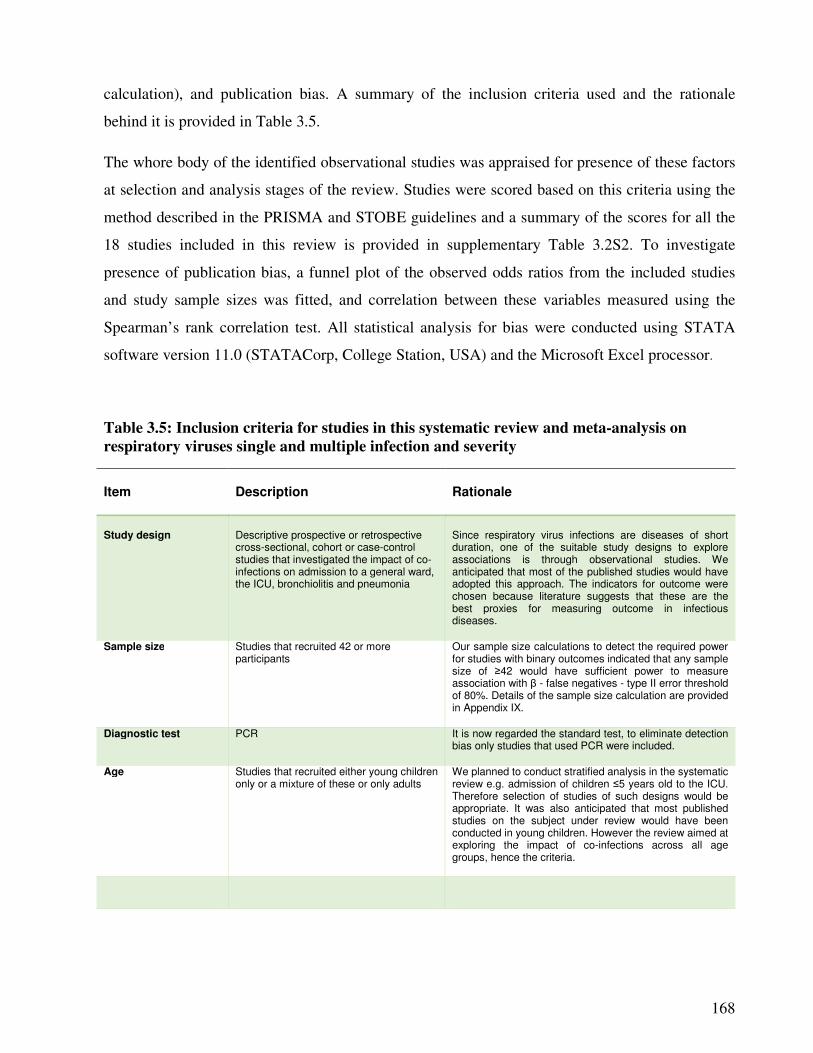
168
calculation), and publication bias. A summary of the inclusion criteria used and the rationale
behind it is provided in Table 3.5.
The whore body of the identified observational studies was appraised for presence of these factors
at selection and analysis stages of the review. Studies were scored based on this criteria using the
method described in the PRISMA and STOBE guidelines and a summary of the scores for all the
18 studies included in this review is provided in supplementary Table 3.2S2. To investigate
presence of publication bias, a funnel plot of the observed odds ratios from the included studies
and study sample sizes was fitted, and correlation between these variables measured using the
Spearman’s rank correlation test. All statistical analysis for bias were conducted using STATA
software version 11.0 (STATACorp, College Station, USA) and the Microsoft Excel processor.
Table 3.5: Inclusion criteria for studies in this systematic review and meta-analysis on
respiratory viruses single and multiple infection and severity
Item
Description
Rationale
Study design
Descriptive prospective or retrospective cross-sectional, cohort or case-control studies that investigated the impact of co-infections on admission to a general ward, the ICU, bronchiolitis and pneumonia
Since respiratory virus infections are diseases of short duration, one of the suitable study designs to explore associations is through observational studies. We anticipated that most of the published studies would have adopted this approach. The indicators for outcome were chosen because literature suggests that these are the best proxies for measuring outcome in infectious diseases.
Sample size Studies that recruited 42 or more participants
Our sample size calculations to detect the required power for studies with binary outcomes indicated that any sample size of ≥42 would have sufficient power to measure association with β - false negatives - type II error threshold of 80%. Details of the sample size calculation are provided in Appendix IX.
Diagnostic test PCR It is now regarded the standard test, to eliminate detection bias only studies that used PCR were included.
Age Studies that recruited either young children only or a mixture of these or only adults
We planned to conduct stratified analysis in the systematic review e.g. admission of children ≤5 years old to the ICU. Therefore selection of studies of such designs would be appropriate. It was also anticipated that most published studies on the subject under review would have been conducted in young children. However the review aimed at exploring the impact of co-infections across all age groups, hence the criteria.
169
3.2.3.5. Data extraction from the studies
A data extraction form was designed by the principal investigator based on directions from the
supervisors and advisor on what variables should be included in this study. Data extracted from
the studies included: Place it was conducted, year it was conducted (specific dates in month and
year of start and end of study), author and year of publication, participants age range, diagnostic
method(s) used for virus identification, number of participants (sample size), sources of
participants e.g. hospitalized individuals or patients attended at the emergency department,
community based controls (in case-control studies), clinic or medical centre. Results counts:
number of single or multiple virus infections observed, number of virus single and multiple for
specific outcomes e.g. hospitalization to a general ward, odds ratios or risk ratios and 95%
confidence interval. Confounding factors controlled for e.g. comorbidities – asthma, diabetes, age.
3.2.3.6. Statistical analysis
The exposure of interest was co-infection among eleven respiratory viruses i.e. Flu A/B, RSV,
RV, AdV, hMPV, hCoV, hBoV and PIV1-4. Association between co-infection and severe disease
(admission to general ward or ICU, bronchiolitis or pneumonia) was assessed using odds ratios
and 95% confidence intervals calculated using single infection(s) as the baseline, or single
influenza A infection as the baseline, in the analysis of influenza co-infections and severity of
respiratory disease. Results from individual studies were summarized using forest plots and tables
and all analyses were done using the Comprehensive Meta-Analysis software – version 2
(BIOSTAT, Englewood, NJ 07631 USA).
170
3.2.4. Results
3.2.4.1. Characteristics of the studies included in this review
A summary of the number of studies that were retrieved from each database and the studies that
were selected and included in this systematic review is provided in Figure 3.14. Out of the 3,423
papers identified through electronic and manual search, ninety two (92) papers were reviewed of
which 18 were included. All the studies that were eligible for inclusion were published between
2003 and 2013, owing to the use of PCR diagnosis as one of the inclusion criteria.
Studies included in this review were from all over the world, i.e. 5 of the included studies were
from Europe, 4 from North America, 3 from South America, 4 from Asia and 2 from Africa. The
details of the included studies are provided in Table 3.5. A large number of the studies, 13/18
(72.2%), involved patients hospitalized to a general ward or the intensive care unit with acute
respiratory infections, some (3/18; 16.7%) recruited in and outpatients, and 2/18 (11.1%) were
case-control studies recruiting hospitalized patients and healthy controls. The highest proportion
of studies 55.6% (10/18) recruited children <6 years old, 6 (33.3%) studies included children aged
≤18 years old, 3 (16.7%) included both adults and children. Most of the studies 14/18 (77.8%)
applied a prospective design covering periods ranging from 3 months to 4 years, and 4/18 (22.2%)
analysed patients data retrospectively. Together all the studies recruited 8,372 people with 48 as
the smallest sample size and 1,192 as the largest sample size, the majority recruiting between 200
and 900 patients.
3.2.4.2. Factors associated with positivity and co-infection rates
Positivity rates ranged from 54.8% to 96.1% (mean 69.7%) whereas co-infection ranged from
5.7% to 62.0% (mean 22.1%). Respiratory syncytial virus was the most predominant co-infecting
virus with most of the studies reporting RSV being the most common among all the viruses
involved in the co-infections (Supplementary Table 3.2S1). RSV was reported as the most
frequent co-infecting with adenovirus by Huguenin et al., (593) and Martin et al., (82) co-infecting
with bocavirus by Cilla et al., (513) and Franz et al., (516) and co-infecting with influenza A virus
by Boivin et al., (566). There was a weak negative correlation between age and high positivity/co-
infection rate, such that studies that recruited young children were more likely to report high rates
of infection and co-infection (correlation coefficients - 0.26 and - 0.35 for infection and co-
infection respectively). In studies that recruited both adults and children, the proportion of co-
infections were 7.4% and 14.4% of all the identified viruses, compared to co-infection rates of
5.7% to 62.0% in studies that recruited children < 6 years old (Table 3.6).
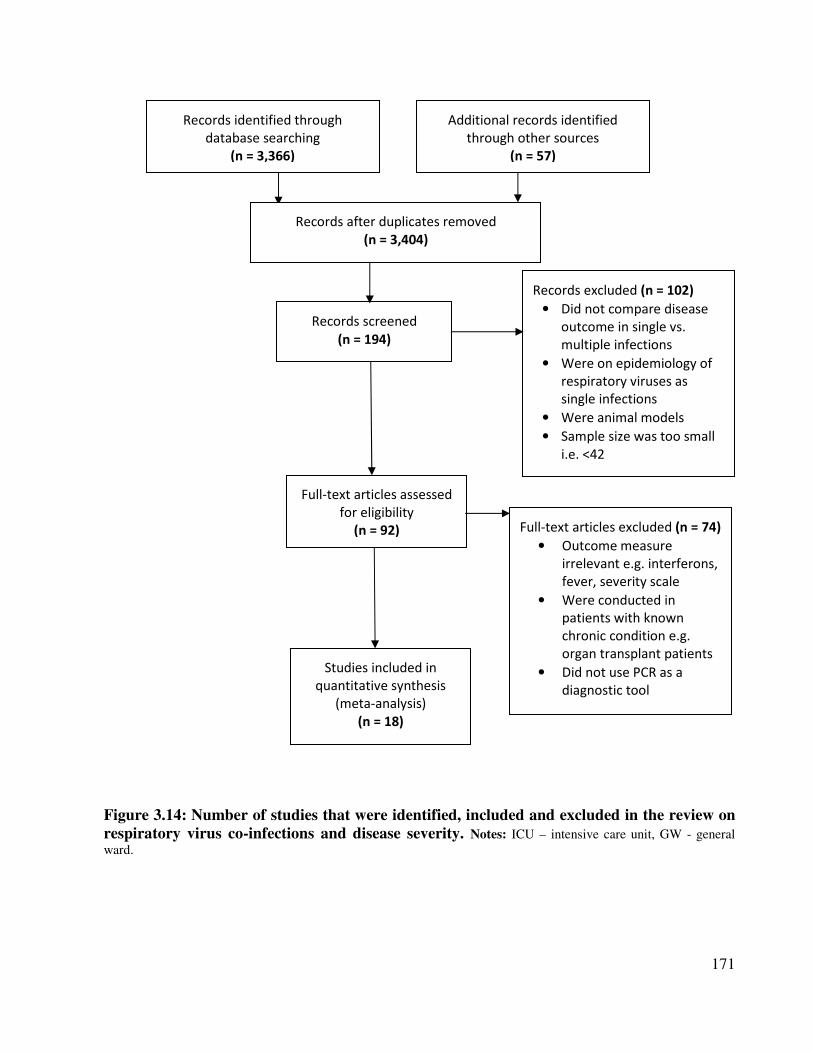
171
Figure 3.14: Number of studies that were identified, included and excluded in the review on
respiratory virus co-infections and disease severity. Notes: ICU – intensive care unit, GW - general
ward.
Records identified through
database searching
(n = 3,366)
Additional records identified
through other sources
(n = 57)
Records after duplicates removed
(n = 3,404)
Records screened
(n = 194)
Records excluded (n = 102)
• Did not compare disease
outcome in single vs.
multiple infections
• Were on epidemiology of
respiratory viruses as
single infections
• Were animal models
• Sample size was too small
i.e. <42
Full-text articles assessed
for eligibility
(n = 92) Full-text articles excluded (n = 74)
• Outcome measure
irrelevant e.g. interferons,
fever, severity scale
• Were conducted in
patients with known
chronic condition e.g.
organ transplant patients
• Did not use PCR as a
diagnostic tool
Studies included in
quantitative synthesis
(meta-analysis)
(n = 18)
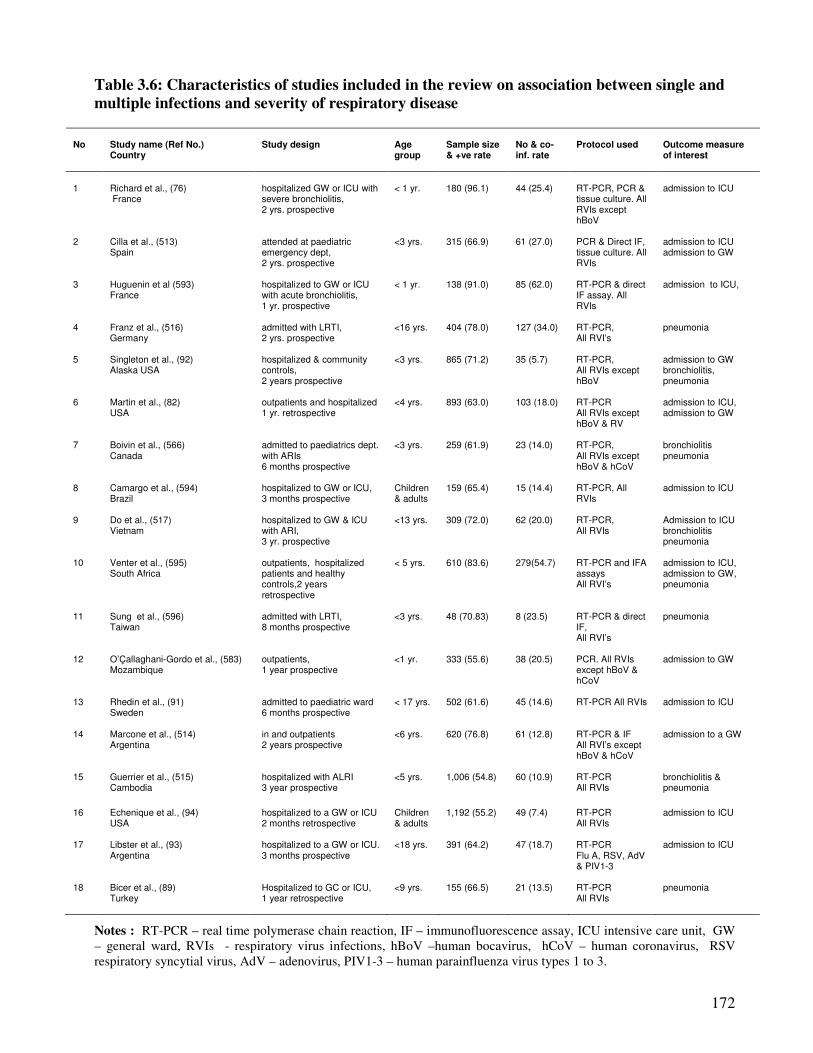
172
Table 3.6: Characteristics of studies included in the review on association between single and
multiple infections and severity of respiratory disease
No
Study name (Ref No.) Country
Study design
Age group
Sample size & +ve rate
No & co-inf. rate
Protocol used
Outcome measure of interest
1
Richard et al., (76)
France
hospitalized GW or ICU with severe bronchiolitis, 2 yrs. prospective
< 1 yr.
180 (96.1)
44 (25.4)
RT-PCR, PCR & tissue culture. All RVIs except hBoV
admission to ICU
2 Cilla et al., (513) Spain
attended at paediatric emergency dept, 2 yrs. prospective
<3 yrs. 315 (66.9) 61 (27.0) PCR & Direct IF, tissue culture. All RVIs
admission to ICU admission to GW
3 Huguenin et al (593) France
hospitalized to GW or ICU with acute bronchiolitis, 1 yr. prospective
< 1 yr. 138 (91.0) 85 (62.0) RT-PCR & direct IF assay. All RVIs
admission to ICU,
4 Franz et al., (516)
Germany
admitted with LRTI, 2 yrs. prospective
<16 yrs. 404 (78.0) 127 (34.0) RT-PCR, All RVI’s
pneumonia
5 Singleton et al., (92) Alaska USA
hospitalized & community controls, 2 years prospective
<3 yrs. 865 (71.2) 35 (5.7) RT-PCR, All RVIs except hBoV
admission to GW bronchiolitis, pneumonia
6 Martin et al., (82)
USA outpatients and hospitalized 1 yr. retrospective
<4 yrs. 893 (63.0) 103 (18.0) RT-PCR All RVIs except hBoV & RV
admission to ICU, admission to GW
7 Boivin et al., (566) Canada
admitted to paediatrics dept. with ARIs 6 months prospective
<3 yrs. 259 (61.9) 23 (14.0) RT-PCR, All RVIs except hBoV & hCoV
bronchiolitis pneumonia
8 Camargo et al., (594) Brazil
hospitalized to GW or ICU, 3 months prospective
Children & adults
159 (65.4) 15 (14.4) RT-PCR, All RVIs
admission to ICU
9 Do et al., (517) Vietnam
hospitalized to GW & ICU with ARI, 3 yr. prospective
<13 yrs. 309 (72.0) 62 (20.0) RT-PCR, All RVIs
Admission to ICU bronchiolitis pneumonia
10 Venter et al., (595) South Africa
outpatients, hospitalized patients and healthy controls,2 years retrospective
< 5 yrs. 610 (83.6) 279(54.7) RT-PCR and IFA assays All RVI’s
admission to ICU, admission to GW, pneumonia
11 Sung et al., (596) Taiwan
admitted with LRTI, 8 months prospective
<3 yrs. 48 (70.83) 8 (23.5) RT-PCR & direct IF, All RVI’s
pneumonia
12 O’Çallaghani-Gordo et al., (583) Mozambique
outpatients, 1 year prospective
<1 yr. 333 (55.6) 38 (20.5) PCR. All RVIs except hBoV & hCoV
admission to GW
13 Rhedin et al., (91)
Sweden
admitted to paediatric ward 6 months prospective
< 17 yrs. 502 (61.6) 45 (14.6) RT-PCR All RVIs admission to ICU
14 Marcone et al., (514)
Argentina in and outpatients 2 years prospective
<6 yrs. 620 (76.8) 61 (12.8) RT-PCR & IF All RVI’s except hBoV & hCoV
admission to a GW
15 Guerrier et al., (515) Cambodia
hospitalized with ALRI 3 year prospective
<5 yrs. 1,006 (54.8) 60 (10.9) RT-PCR All RVIs
bronchiolitis & pneumonia
16 Echenique et al., (94) USA
hospitalized to a GW or ICU 2 months retrospective
Children & adults
1,192 (55.2) 49 (7.4) RT-PCR All RVIs
admission to ICU
17 Libster et al., (93) Argentina
hospitalized to a GW or ICU. 3 months prospective
<18 yrs. 391 (64.2) 47 (18.7) RT-PCR Flu A, RSV, AdV & PIV1-3
admission to ICU
18 Bicer et al., (89) Turkey
Hospitalized to GC or ICU, 1 year retrospective
<9 yrs. 155 (66.5) 21 (13.5) RT-PCR All RVIs
pneumonia
Notes : RT-PCR – real time polymerase chain reaction, IF – immunofluorescence assay, ICU intensive care unit, GW
– general ward, RVIs - respiratory virus infections, hBoV –human bocavirus, hCoV – human coronavirus, RSV
respiratory syncytial virus, AdV – adenovirus, PIV1-3 – human parainfluenza virus types 1 to 3.
173
3.2.4.3. Assessment of bias in the studies
3.2.4.3.1. Study design, year of study and viral genetics
Some of the bias which still exists in this systematic review and meta-analysis include: differing
types of viruses that circulated in the different years and seasons the studies were conducted, the
adoption of crude analysis i.e. comparison of disease outcome in single vs. multiple respiratory
virus infections, and possible role of viruses’ genetic mutations on disease outcome.
It is known that circulation of respiratory viruses differ yearly and between winters and summers
(9;204;300). For example, the influenza strains that have been in circulation globally have been
changing (402). Particularly the influenza A(H1N1) viruses that have circulated over the last decade
which include: A/New Caledonia/20/1999, the A/Solomon Islands/3/2006, the A/Brisbane/59/2007
and the pandemic influenza virus A/California/04/2009. Under the study hypothesis, it was
impossible to stratify studies based on year and season they were conducted and studies from
different seasons were included. Also, the crude analysis approach to investigation of the
association between co-infections and disease outcome, employed by different authors, was a bias
which remained. Some authors did not declare whether a conflict of interest exists, as the format of
the journals they published with does not include such a statement and this should be born in mind.
Lastly, genetic mutations are known to influence disease outcome in respiratory viruses such as
influenza virus. The role of genetic mutation on disease outcome was beyond the scope of this
review and an attempt to review the same has been made elsewhere (by systematic review 1 in this
thesis).
3.2.4.3.2. Publication bias
A total of 25 odds ratios were calculated from the 18 studies as described in Figures 3.16 to 3.20.
The sample sizes ranged from 48 to 1,192 (Table 3.6). The highest odds ratio was 3.12 as reported
by Guerrier et al., (515) on co-infection and risk of pneumonia, and the lowest odds ratio was 0.18
reported by Martin et al., (82) in co-infection and risk of admission to a general ward. The funnel
plot (Figure 3.10) indicates that there was no publication bias as the ORs were symmetrically
distributed around the combined OR (with some ORs falling on the lower left corner of the funnel
as well), and the p-value of the Spearman’s rank correlation test was not significant (p = 0.58).
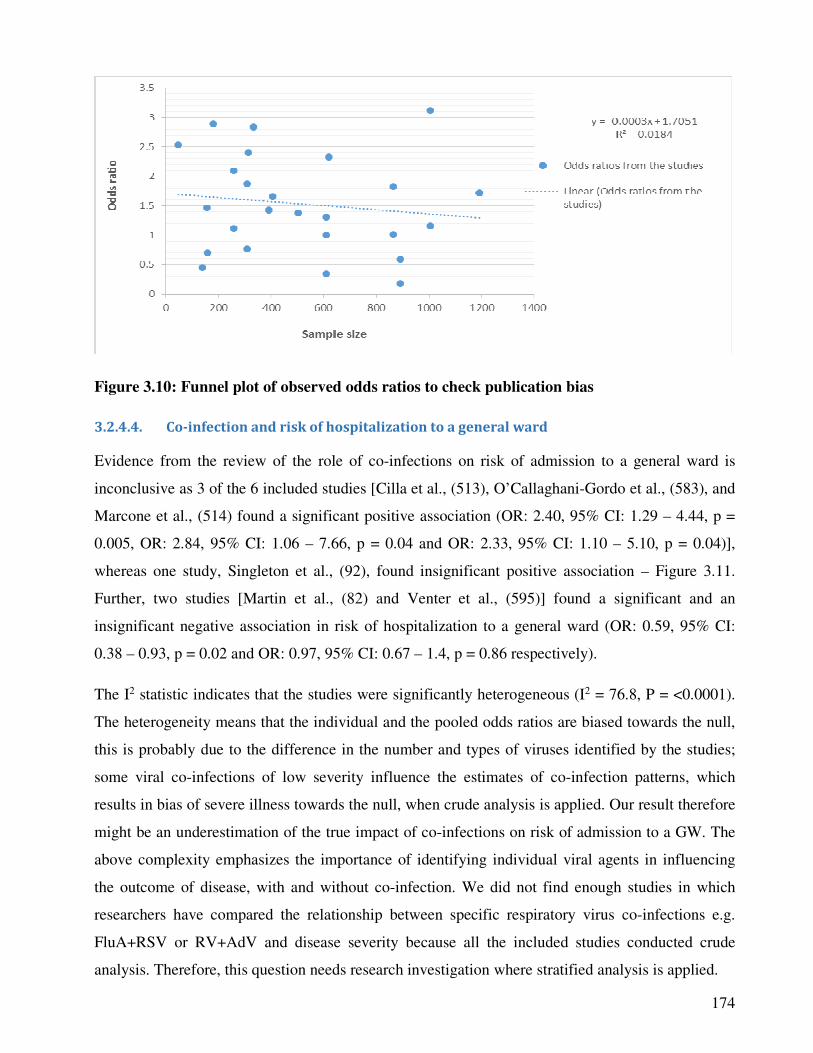
174
Figure 3.10: Funnel plot of observed odds ratios to check publication bias
3.2.4.4. Co-infection and risk of hospitalization to a general ward
Evidence from the review of the role of co-infections on risk of admission to a general ward is
inconclusive as 3 of the 6 included studies [Cilla et al., (513), O’Callaghani-Gordo et al., (583), and
Marcone et al., (514) found a significant positive association (OR: 2.40, 95% CI: 1.29 – 4.44, p =
0.005, OR: 2.84, 95% CI: 1.06 – 7.66, p = 0.04 and OR: 2.33, 95% CI: 1.10 – 5.10, p = 0.04)],
whereas one study, Singleton et al., (92), found insignificant positive association – Figure 3.11.
Further, two studies [Martin et al., (82) and Venter et al., (595)] found a significant and an
insignificant negative association in risk of hospitalization to a general ward (OR: 0.59, 95% CI:
0.38 – 0.93, p = 0.02 and OR: 0.97, 95% CI: 0.67 – 1.4, p = 0.86 respectively).
The I2 statistic indicates that the studies were significantly heterogeneous (I2 = 76.8, P = <0.0001).
The heterogeneity means that the individual and the pooled odds ratios are biased towards the null,
this is probably due to the difference in the number and types of viruses identified by the studies;
some viral co-infections of low severity influence the estimates of co-infection patterns, which
results in bias of severe illness towards the null, when crude analysis is applied. Our result therefore
might be an underestimation of the true impact of co-infections on risk of admission to a GW. The
above complexity emphasizes the importance of identifying individual viral agents in influencing
the outcome of disease, with and without co-infection. We did not find enough studies in which
researchers have compared the relationship between specific respiratory virus co-infections e.g.
FluA+RSV or RV+AdV and disease severity because all the included studies conducted crude
analysis. Therefore, this question needs research investigation where stratified analysis is applied.
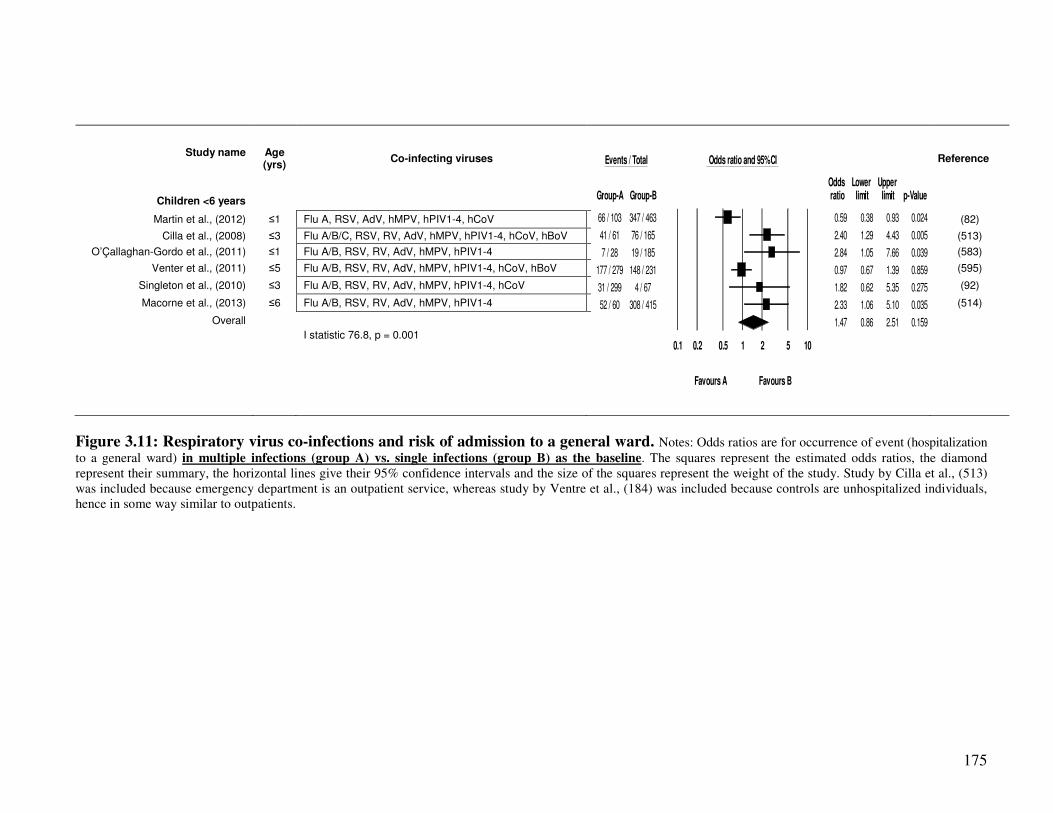
175
Study name
Age (yrs)
Co-infecting viruses
Reference
Children <6 years
Martin et al., (2012) ≤1 Flu A, RSV, AdV, hMPV, hPIV1-4, hCoV
(82)
Cilla et al., (2008) ≤3 Flu A/B/C, RSV, RV, AdV, hMPV, hPIV1-4, hCoV, hBoV
(513)
O’Çallaghan-Gordo et al., (2011) ≤1 Flu A/B, RSV, RV, AdV, hMPV, hPIV1-4
(583)
Venter et al., (2011) ≤5 Flu A/B, RSV, RV, AdV, hMPV, hPIV1-4, hCoV, hBoV
(595)
Singleton et al., (2010) ≤3 Flu A/B, RSV, RV, AdV, hMPV, hPIV1-4, hCoV
(92)
Macorne et al., (2013) ≤6 Flu A/B, RSV, RV, AdV, hMPV, hPIV1-4
(514)
Overall
I statistic 76.8, p = 0.001
Figure 3.11: Respiratory virus co-infections and risk of admission to a general ward. Notes: Odds ratios are for occurrence of event (hospitalization
to a general ward) in multiple infections (group A) vs. single infections (group B) as the baseline. The squares represent the estimated odds ratios, the diamond
represent their summary, the horizontal lines give their 95% confidence intervals and the size of the squares represent the weight of the study. Study by Cilla et al., (513)
was included because emergency department is an outpatient service, whereas study by Ventre et al., (184) was included because controls are unhospitalized individuals,
hence in some way similar to outpatients.
Events / Total Odds ratio and 95% CI
Odds Lower Upper Group-A Group-B ratio limit limit p-Value
66 / 103 347 / 463 0.59 0.38 0.93 0.024
41 / 61 76 / 165 2.40 1.29 4.43 0.005
7 / 28 19 / 185 2.84 1.05 7.66 0.039
177 / 279 148 / 231 0.97 0.67 1.39 0.859
31 / 299 4 / 67 1.82 0.62 5.35 0.275
52 / 60 308 / 415 2.33 1.06 5.10 0.035
1.47 0.86 2.51 0.159
0.1 0.2 0.5 1 2 5 10
Favours A Favours B
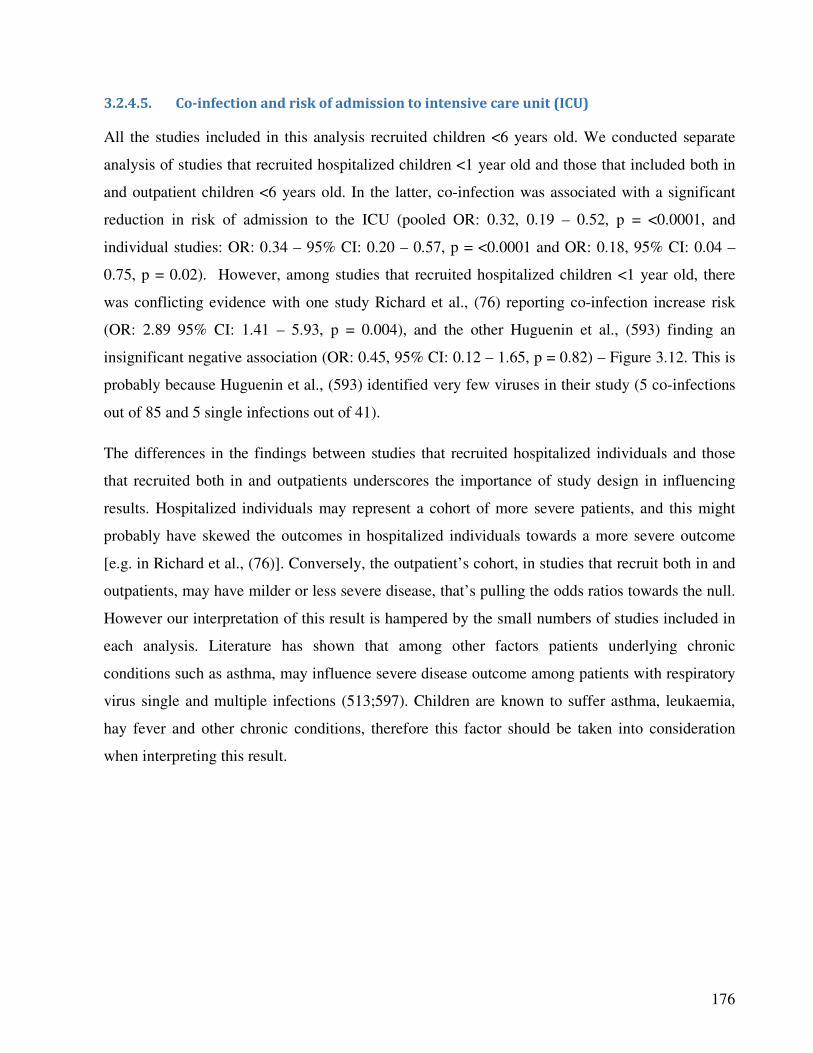
176
3.2.4.5. Co-infection and risk of admission to intensive care unit (ICU)
All the studies included in this analysis recruited children <6 years old. We conducted separate
analysis of studies that recruited hospitalized children <1 year old and those that included both in
and outpatient children <6 years old. In the latter, co-infection was associated with a significant
reduction in risk of admission to the ICU (pooled OR: 0.32, 0.19 – 0.52, p = <0.0001, and
individual studies: OR: 0.34 – 95% CI: 0.20 – 0.57, p = <0.0001 and OR: 0.18, 95% CI: 0.04 –
0.75, p = 0.02). However, among studies that recruited hospitalized children <1 year old, there
was conflicting evidence with one study Richard et al., (76) reporting co-infection increase risk
(OR: 2.89 95% CI: 1.41 – 5.93, p = 0.004), and the other Huguenin et al., (593) finding an
insignificant negative association (OR: 0.45, 95% CI: 0.12 – 1.65, p = 0.82) – Figure 3.12. This is
probably because Huguenin et al., (593) identified very few viruses in their study (5 co-infections
out of 85 and 5 single infections out of 41).
The differences in the findings between studies that recruited hospitalized individuals and those
that recruited both in and outpatients underscores the importance of study design in influencing
results. Hospitalized individuals may represent a cohort of more severe patients, and this might
probably have skewed the outcomes in hospitalized individuals towards a more severe outcome
[e.g. in Richard et al., (76)]. Conversely, the outpatient’s cohort, in studies that recruit both in and
outpatients, may have milder or less severe disease, that’s pulling the odds ratios towards the null.
However our interpretation of this result is hampered by the small numbers of studies included in
each analysis. Literature has shown that among other factors patients underlying chronic
conditions such as asthma, may influence severe disease outcome among patients with respiratory
virus single and multiple infections (513;597). Children are known to suffer asthma, leukaemia,
hay fever and other chronic conditions, therefore this factor should be taken into consideration
when interpreting this result.
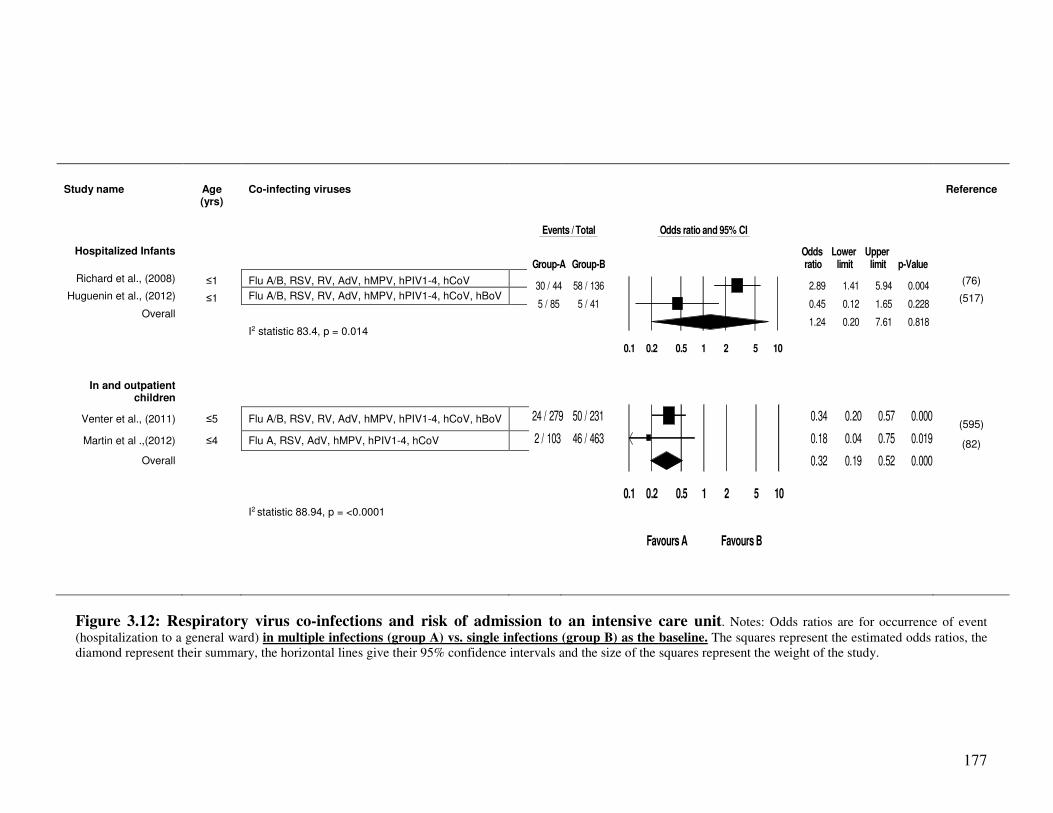
177
Study name
Age (yrs)
Co-infecting viruses
Reference
Hospitalized Infants
Richard et al., (2008) ≤1 Flu A/B, RSV, RV, AdV, hMPV, hPIV1-4, hCoV (76)
Huguenin et al., (2012) ≤1 Flu A/B, RSV, RV, AdV, hMPV, hPIV1-4, hCoV, hBoV (517)
Overall
I2 statistic 83.4, p = 0.014
In and outpatient children
Venter et al., (2011) ≤5 Flu A/B, RSV, RV, AdV, hMPV, hPIV1-4, hCoV, hBoV (595)
Martin et al .,(2012) ≤4 Flu A, RSV, AdV, hMPV, hPIV1-4, hCoV (82)
Overall
I2 statistic 88.94, p = <0.0001
Figure 3.12: Respiratory virus co-infections and risk of admission to an intensive care unit. Notes: Odds ratios are for occurrence of event
(hospitalization to a general ward) in multiple infections (group A) vs. single infections (group B) as the baseline. The squares represent the estimated odds ratios, the
diamond represent their summary, the horizontal lines give their 95% confidence intervals and the size of the squares represent the weight of the study.
Events / Total Odds ratio and 95% CI
Odds Lower Upper Group-A Group-B ratio limit limit p-Value
30 / 44 58 / 136 2.89 1.41 5.94 0.004
5 / 85 5 / 41 0.45 0.12 1.65 0.228
1.24 0.20 7.61 0.818
0.1 0.2 0.5 1 2 5 10
24 / 279 50 / 231 0.34 0.20 0.57 0.000
2 / 103 46 / 463 0.18 0.04 0.75 0.019
0.32 0.19 0.52 0.000
0.1 0.2 0.5 1 2 5 10
Favours A Favours B
178
3.2.4.6. Co-infection and risk of bronchiolitis
This analysis found an insignificant positive association between co-infection and risk of
developing bronchiolitis (pooled OR: 1.29, 95% CI: 0.79 – 2.11, p = 0.31), and for specific studies
(OR: 2.09, 95% CI: 0.67 – 6.58 and OR: 1.15, 95% CI: 0.67 – 2.0, p = 0.61). The two studies
included in this analysis recruited hospitalized children ≤5 years old and used RT-PCR for
identification of viruses; Boivin et al., (566) identified Flu A/B, RSV A/B, AdV, hMPV and PIV1-4
co-infections to which Guerrier et al., (515) added hBoV and hCoV. There was no heterogeneity in
their findings (I2 = 0, p = 0.36) (Figure 3.13). It would have been good if we were able to compare
this result with studies recruiting both hospitalized and community based controls or outpatients.
More studies are needed to further explore this possible positive association.
3.2.4.7. Co-infection and risk of pneumonia
Respiratory viruses have previously been identified as significant causes of community acquired
viral pneumonia (14), however the role of co-infection among respiratory viral infections has not
been previously explored. In this review all the studies had recruited hospitalized children. We
grouped the studies according to the age of the participants (children ≤5 years old and children ≤16
years old). Among children ≤5 years old, the pooled odds ratio indicate that co-infection
significantly increased the risk of pneumonia (summary OR: 2.17, 95% CI: 1.10 – 4.37, p = 0.03 -
Figure 3.14), but the study by Guerrier et al., (515) found a significant outcome (OR: 3.12, 95% CI:
1.75 – 5.54, p = <0.0001).
In studies that recruited children ≤16 years old, the pooled odds ratio suggested a positive
association between co-infection and risk of pneumonia (OR: 1.29, 95% CI: 0.79 – 2.11), but this
was not statistically significant (p = 0.30). As for the individual studies, only Franz et al., (516)
reported a statistically significant positive association (OR: 1.68, 95% CI: 1.03 – 2.75, p = 0.04).
The lack of statistical significance in this analysis is probably because the studies did not identify a
high number of co-infections; only 7 co-infections developed pneumonia in Boivin et al., (566)
study, 3 in Sung et al., (596), 9 in Bicer et al., (89) and 11 in Do et al., (517). Literature has shown
that bacterial co-infection aggravates disease severity (such as pneumonia complication) in patients
infected with respiratory viruses (94;277;597;598). A 2013 review by McCullers et al., (599) and a
2012 review by Viasus et al., (600) suggest that different influenza virus strains, will have different
ability to prime the host for secondary bacterial infection, their genetic fitness playing a role in the
same. This insight might offer some explanation to the mechanism behind the observed severity in
some respiratory virus co-infections.
179
Study name
Age (yrs)
Co-infecting viruses
Reference
Boivin et al., (2003) ≤3 Flu A/B, RSV, AdV, hMPV, hPIV1-4 (566)
Guerrier et al., (2013) ≤5 Flu A/B, RSV, RV, AdV, hMPV, hPIV1-4, hBoV, hCoV (515)
Overall
I2 statistic 0, p = 0.36
Figure 3.13: Respiratory virus co-infections and risk of bronchiolitis. Notes: Odds ratios are for occurrence of event (bronchiolitis) in multiple infections
(group A) vs. single infections (group B) as the baseline. The squares represent the estimated odds ratios, the diamond represent their summary, the horizontal lines give
their 95% confidence intervals and the size of the squares represent the weight of the study. For this category, we identified only studies that recruited hospitalized children
<5 years old.
Events / Total Odds ratio and 95% CI
Odds Lower Upper Group-A Group-B ratio limit limit p-Value
19 / 23 99 / 141 2.09 0.67 6.58 0.207
25 / 59 191 / 491 1.15 0.67 2.00 0.606
1.29 0.79 2.11 0.313
0.1 0.2 0.5 1 2 5 10
Favours A Favours B
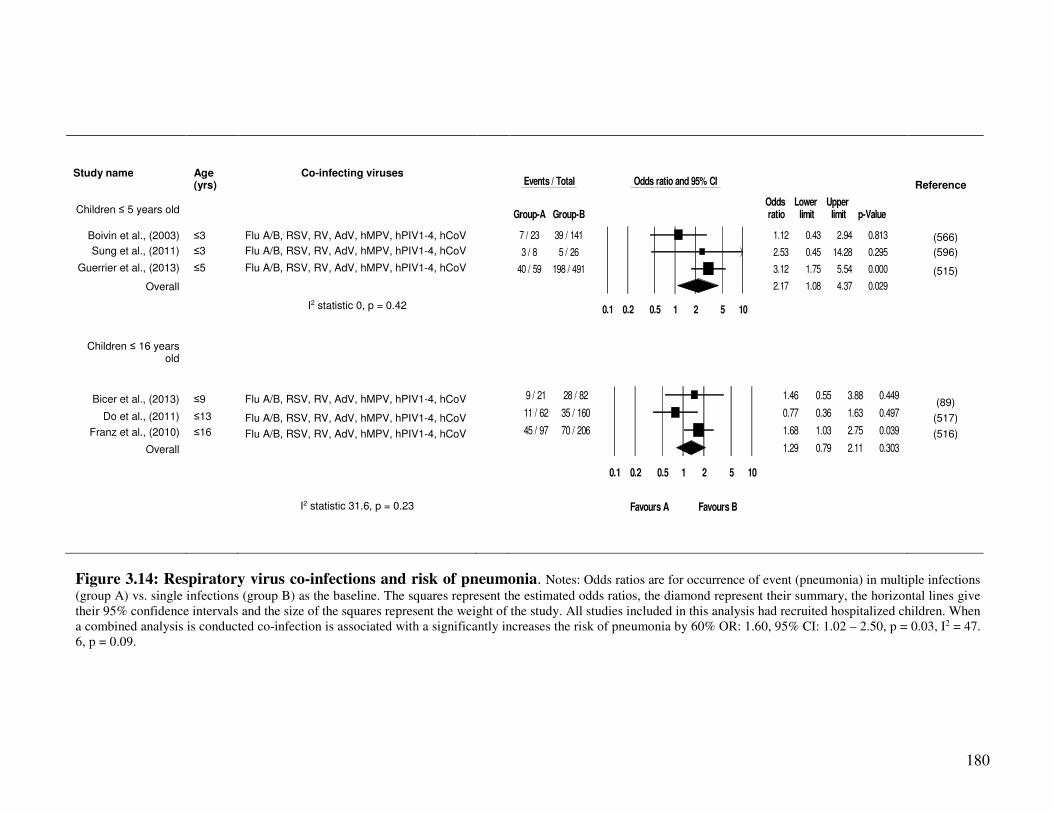
180
Study name
Age (yrs)
Co-infecting viruses
Reference
Children ≤ 5 years old
Boivin et al., (2003) ≤3 Flu A/B, RSV, RV, AdV, hMPV, hPIV1-4, hCoV (566)
Sung et al., (2011) ≤3 Flu A/B, RSV, RV, AdV, hMPV, hPIV1-4, hCoV (596)
Guerrier et al., (2013) ≤5 Flu A/B, RSV, RV, AdV, hMPV, hPIV1-4, hCoV (515)
Overall
I2 statistic 0, p = 0.42
Children ≤ 16 years old
Bicer et al., (2013) ≤9 Flu A/B, RSV, RV, AdV, hMPV, hPIV1-4, hCoV (89)
Do et al., (2011) ≤13 Flu A/B, RSV, RV, AdV, hMPV, hPIV1-4, hCoV (517)
Franz et al., (2010) ≤16 Flu A/B, RSV, RV, AdV, hMPV, hPIV1-4, hCoV (516)
Overall
I2 statistic 31.6, p = 0.23
Figure 3.14: Respiratory virus co-infections and risk of pneumonia. Notes: Odds ratios are for occurrence of event (pneumonia) in multiple infections
(group A) vs. single infections (group B) as the baseline. The squares represent the estimated odds ratios, the diamond represent their summary, the horizontal lines give
their 95% confidence intervals and the size of the squares represent the weight of the study. All studies included in this analysis had recruited hospitalized children. When
a combined analysis is conducted co-infection is associated with a significantly increases the risk of pneumonia by 60% OR: 1.60, 95% CI: 1.02 – 2.50, p = 0.03, I2 = 47.
6, p = 0.09.
Events / Total Odds ratio and 95% CI
Odds Lower Upper Group-A Group-B ratio limit limit p-Value
7 / 23 39 / 141 1.12 0.43 2.94 0.813
3 / 8 5 / 26 2.53 0.45 14.28 0.295
40 / 59 198 / 491 3.12 1.75 5.54 0.000
2.17 1.08 4.37 0.029
0.1 0.2 0.5 1 2 5 10
9 / 21 28 / 82 1.46 0.55 3.88 0.449
11 / 62 35 / 160 0.77 0.36 1.63 0.497
45 / 97 70 / 206 1.68 1.03 2.75 0.039
1.29 0.79 2.11 0.303
0.1 0.2 0.5 1 2 5 10
Favours A Favours B
181
3.2.4.8. Influenza A virus single and mixed infections and disease severity
The preceding sections looked at disease outcome in single vs. multiple infections involving all
respiratory viruses in general, with a condition that influenza was among the single or mixed
infections. That was done to explore whether or not disease in single respiratory virus infections is
more or less severe than mixed infections. As it was anticipated that crude analysis may obscure
the true effect of specific virus pairings, however, we did not find enough studies to conduct crude
analysis as two-by-two virus co-infection level to include in a meta-analysis. In trying to start this
exploration, a decision was made to investigate disease outcome in single vs. mixed influenza A
virus infections.
Seven studies were included in this analysis of which two investigated risk of admission to a
general ward in ≤5 year old children, and 5 reported admission to the ICU in children ≤18 years
old respectively (Figure 3.15). Regarding risk of admission to a general ward, both the pooled
odds ratio and that of the individual studies showed a positive association (pooled OR: 1.24, 95%
CI: 0.33 – 3.84, p = 0.85 and odds ratios of 1.01 and 1.31 for individual studies), but none of these
was statistically significant (Figure 3.20). Similarly, on admission to the ICU, both the individual
and pooled odds ratios showed positive association. For example among children ≤18 years old,
the pooled estimate was: OR: 1.46, 95% CI: 0.75 – 2.83, but again this was not statistically
significant (p = 0.26). Suffice to add that among studies that recruited both young children and
adults [Camargo et al., (594) and Singleton et al., (92)], the estimates were in conflict. Camargo et
al., (594) found that co-infection was actually protective against admission to ICU, however this
was also not statistically significant. There is therefore a need for more well designed studies
investigating the impact of co-infection on the outcome of influenza virus infection.
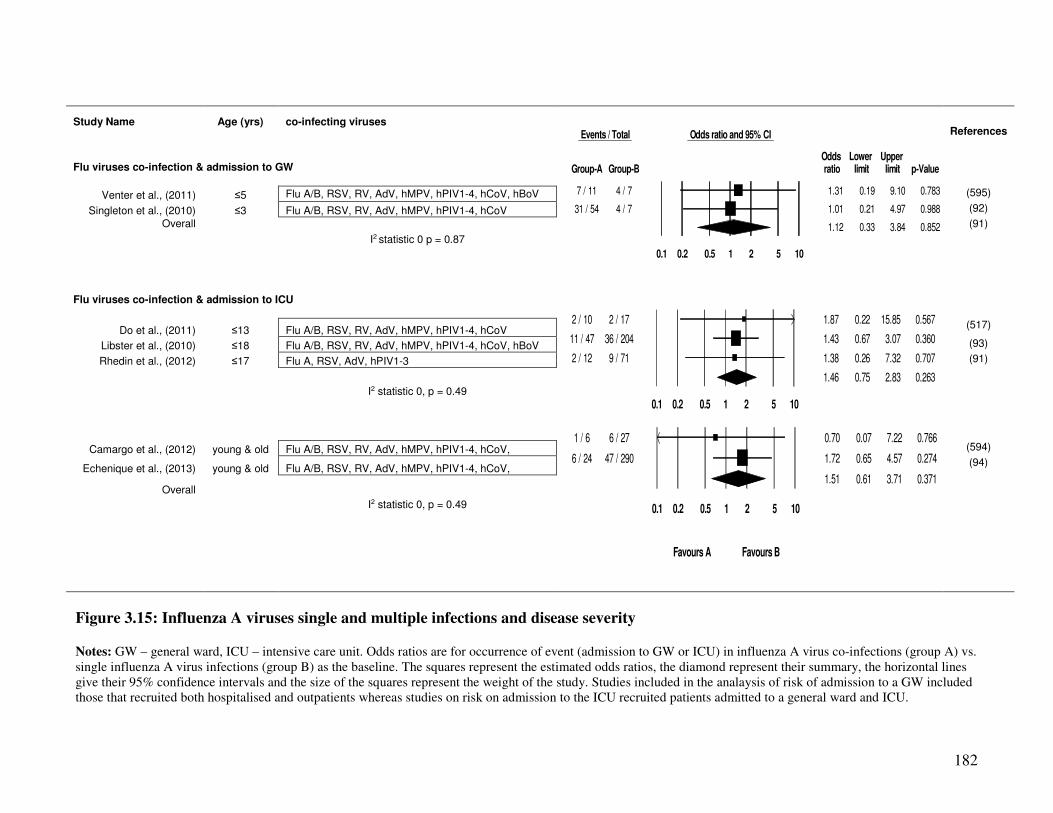
182
Study Name Age (yrs) co-infecting viruses
References
Flu viruses co-infection & admission to GW
Venter et al., (2011) ≤5 Flu A/B, RSV, RV, AdV, hMPV, hPIV1-4, hCoV, hBoV (595)
Singleton et al., (2010) ≤3 Flu A/B, RSV, RV, AdV, hMPV, hPIV1-4, hCoV (92)
Overall (91)
I2 statistic 0 p = 0.87
Flu viruses co-infection & admission to ICU
Do et al., (2011) ≤13 Flu A/B, RSV, RV, AdV, hMPV, hPIV1-4, hCoV (517)
Libster et al., (2010) ≤18 Flu A/B, RSV, RV, AdV, hMPV, hPIV1-4, hCoV, hBoV (93)
Rhedin et al., (2012) ≤17 Flu A, RSV, AdV, hPIV1-3 (91)
I2 statistic 0, p = 0.49
Camargo et al., (2012) young & old Flu A/B, RSV, RV, AdV, hMPV, hPIV1-4, hCoV, (594)
Echenique et al., (2013) young & old Flu A/B, RSV, RV, AdV, hMPV, hPIV1-4, hCoV, (94)
Overall
I2 statistic 0, p = 0.49
Figure 3.15: Influenza A viruses single and multiple infections and disease severity
Notes: GW – general ward, ICU – intensive care unit. Odds ratios are for occurrence of event (admission to GW or ICU) in influenza A virus co-infections (group A) vs.
single influenza A virus infections (group B) as the baseline. The squares represent the estimated odds ratios, the diamond represent their summary, the horizontal lines
give their 95% confidence intervals and the size of the squares represent the weight of the study. Studies included in the analaysis of risk of admission to a GW included
those that recruited both hospitalised and outpatients whereas studies on risk on admission to the ICU recruited patients admitted to a general ward and ICU.
2 / 10 2 / 17 1.87 0.22 15.85 0.567
11 / 47 36 / 204 1.43 0.67 3.07 0.360
2 / 12 9 / 71 1.38 0.26 7.32 0.707
1.46 0.75 2.83 0.263
0.1 0.2 0.5 1 2 5 10
1 / 6 6 / 27 0.70 0.07 7.22 0.766
6 / 24 47 / 290 1.72 0.65 4.57 0.274
1.51 0.61 3.71 0.371
0.1 0.2 0.5 1 2 5 10
Favours A Favours B
Events / Total Odds ratio and 95% CI
Odds Lower Upper Group-A Group-B ratio limit limit p-Value
7 / 11 4 / 7 1.31 0.19 9.10 0.783
31 / 54 4 / 7 1.01 0.21 4.97 0.988
1.12 0.33 3.84 0.852
0.1 0.2 0.5 1 2 5 10
183
3.2.5. Discussion and conclusion
In conclusion, this review found inconclusive results on the role of co-infections among
respiratory viruses on risk of admission to a general ward or the ICU; some studies found co-
infection increased the risk yet others did not. Similarly, some studies found that co-infection
significantly increased risk of pneumonia whereas others did not. Both of the studies that reported
on bronchiolitis found insignificant positive associations. Seven of the 18 included studies
reported disease outcome in single vs. multiple influenza A virus infection. Five out of the seven
found a positive association between co-infection and risk of admission to a GW or ICU, but none
was statistically significant.
Some of the included studies conducted both crude and multivariate analysis; controlling for co-
morbidities, patients age, gender, immune status and other covariates, whereas others only carried
out crude analysis (because they didn’t find statistically significant results). Since we did not find
enough studies that had carried out multivariate analysis, and because among the different studies
that carried out multivariate analysis the types of covariates controlled for were different, only
crude figures were used to conduct this meta-analysis. The estimated odds ratios might be biased
or confounded and could have been different if controlled for confounding factors and this should
be born in mind when interpreting the results of this review. Furthermore one of the main
objectives of this review was to investigate whether co-infection could increase disease severity
across the age spectrum or it would only be a burden in children ≤5 years or the elderly >65 years
old (holding other factors constant). However we did not find enough studies that recruited both
adults and children, only 2 out of the 18 included studies met this criteria. The results here means
this review was unable to answer this question, therefore more studies recruiting both adults and
children need to be carried out in order to answer it.
The studies included in the analysis on co-infection and risk of admission to the ICU were
heterogeneous (I2 = 83.4, p = 0.014 and 88.9, p = <0.001 – Figure 3.12). The differences in the
findings between these underscores the importance of study design in influencing results.
Evidence from other studies indicate that the rate of co-infection is higher when studies recruit
hospitalized patients and is lower when they recruit both hospitalized and outpatients or when only
outpatients are recruited (80;81;85;93;576;577). In this review, the studies that recruited
hospitalized patients; Libster et al., (93), Richard et al., (76) and Do et al., (517) reported higher
co-infection rates (19%, 25% and 20% respectively), and were more likely to find a positive
184
association between co-infection and severe outcome. Conversely, studies that recruited both
hospitalized and outpatients Martin et al., (82) and Venter et al., (595) were more likely to find no
association between co-infection and severe disease. A cohort of more severe patients among
hospitalized individuals [Richard et al., (76) and Do et al., (517)], might probably have skewed the
outcomes in these studies towards a more severe disease.
An additional bias in the studies included in this review may have been introduced by the crude
analysis adopted by many authors, as it may have introduced bias towards the null (odds ratios
being close to 1). For example, in a study where RSV/hBoV co-infections were predominant
[Cilla et al., (513) Supplementary Table 3.2S1, Figure 3.16], a significantly increased risk of
admission to a general ward was reported - and where RSV/AdV and RSV/RV co-infections were
predominant, a reduced risk of admission to a general ward was reported [Martin et al., (82), and
Venter et al., (595) – (Supplementary Table 3.2S1, Figure 3.11)]. This could be because some
viral co-infections of low severity influenced the estimates of co-infection patterns towards the
null when crude analysis was applied. Future studies should employ stratified analysis on the
effect of co-infections on disease outcome where effects of specific pairs of viruses e.g. Flu
A/RSV, RSV/hMPV or RSV/AdV are investigated so as to elucidate the type of virus pairs which
increase or decrease disease severity. There is overwhelming evidence of bacterial co-infection
among patients with ARIs and pneumonia. For example, in their 2012 review, Punpanich and
Chotpitayasunondh (15) reported that 43% of the pandemic influenza A(H1N1)pdm09 virus
associated paediatric deaths had bacterial co-infection. Similar reports have been made by
Ruuskanen et al., (59). In explaining the causal pathway to this, Peltola and McCullers (60) and
Bakaletz et al., (61) indicated that the destruction of respiratory epithelium by viruses may
increase bacterial adhesion leading to more pneumonia, bronchiolitis and other severe outcomes.
This suggests a possible mechanism behind the observed severity in patients with respiratory virus
co-infections. However, such causal hypothesis can only be best explored by sequential studies
where it is investigated which among the two pathogens, bacteria or viruses, infect patients first.
We therefore call for research investigating virus/bacteria colonization in order to shed more light
on this important subject.
Influenza A viruses, RSV, hMPV and AdV follow seasonal patterns, with higher virus activity in
winters and minimal activity in summers. RV circulate all year round whereas hPIV1-4 are
predominantly in summer (9;204;300). As the studies included here spanned over different time
185
periods, this might also have introduced some bias in the observed patterns of co-infections
reported by different studies, hence the outcomes, and this should be born in mind when
interpreting our results. It is possible that some of the co-infections indicated by different studies
were nosocomial infections, however, in all the included studies, ascertainment of disease status
was performed during the time of hospitalization or during the first consultation, ruling out the
possibility of nosocomial infections. Polymerase chain reaction (PCR) give better sensitivity and
specificity than other diagnostic methods as previously discussed by Henrickson (585) and Lee et
al., (238). In this review, only studies that used RT-PCR, PCR were included. If there is any yet
unknown systematic error due to application of RT-PCR or PCR, then the effect would be carried
over into the results of our study. However, at the present time, PCR remains the gold standard for
diagnosis, as some of the respiratory viruses cannot be cultured in laboratories; hence we believe
that the results summarized here closely resemble the epidemiological situation.
Literature has suggested that virus-virus interactions may influence host immune response in
driving other respiratory viruses’ virulence or a virulence. Respiratory virus proteins are detected
by host cell tall like receptors; TL2, TLR4 and TLR6 on the surface of the cell; TLR3 TLR7,
TLR8 and TLR9 in the endosome, and by the protein kinase RNA - activated (PKR), the
melanoma differentiation associated gene 5 (MAD-5), the retinoic inducible gene I (RIG-I) and
the 2',5'-Oligoadenylate synthetase (2',5'-OAS1&2) in respiratory epithelial cells and dendritic
cells, which in turn triggers host production of cytokines including; tumour necrosis factor (TNF),
type 1 proinflammatory cytokines; interferon-alpha (IFN-α), and interferon-beta (IFN-β),
interleukin-6 (IL-6), interleukin-18 (IL-18) (17;552), which counteract virus infection. Depending
on the type of virus, infection may lead to cytokine storm resulting into severe disease
characterised by organ failure. Casalegno et al., (545) and other researcher (541;544) suggested
that rhinoviruses interfered with circulation of other viruses, and some studies (80;81) indicated
that co-infections with rhinoviruses resulted in low risk. However the precise mechanisms in co-
infections that may affect virulence are not well understood and more research is needed to
understand the biomedical processes in respiratory virus co-infections and the co-infection
patterns that may increase or decrease virulence.
Studies have indicated that a number of other factors affect severity of respiratory virus disease
including: obesity, socio-economic status, pregnancy, prematurity and low birthweight, nutrition
status and breastfeeding in infants, active and passive smoking, immune status and vaccination
186
(9;10;13;21;23;53;564). It is observed here that most descriptive studies on epidemiology of
respiratory virus single and multiple infections do not collect information on patients
characteristics with regard to these factors. Similarly, most of the included studies did not.
Specifically, information on pregnancy was reported in only 2 studies Camargo et al., (594) and
Echenique et al., (94), nutrition status by Ventre et al., (184) and Libster et al., (93), and passive
smoking by Echenique et al., (94) and Libster et al., (93). It should therefore be born in mind that
the observed outcomes might have been affected by one or more of these factors. It is
recommended that researchers should endeavour to collect and control factors.
Also, studies included in this review were only those written in the English language. This might
have introduced selection bias into our review and this should be born in mind. Since reviews
mainly rely on published data, there is a danger of publication bias, where published studies
represent only those studies that had found a positive and significant association between exposure
and outcome. However we constructed a funnel plot of odds ratios reported by included studies
against their sample sizes and the results indicated that there was no publication bias (Spearman’s
rank correlation test was not significant, p = 0.58). In addition, we employed a standard search
strategy, making sure that we are able to capture all the possible studies covering the subject under
study. The search was performed on MEDLINE, EMBASE and WEB of Science, databases which
summarize publication in a wide variety of medical journals. We also manually searched studies
of good quality, for primary studies to include in the review and in this way hope to have
eliminated any study selection or publication bias.
In conclusion, this review found inconclusive results on the role of co-infections on severity of
respiratory disease. Many of the problems in interpretation of the evidence were because the
authors adopted crude analysis. Future studies should employ stratified analysis on the effect of
co-infections on disease outcome where the effects of specific pairs of viruses e.g. Flu A/RSV,
RSV/hMPV or RSV/AdV are studied so as to elucidate the type of virus pairs which increase or
decrease disease severity.
Funding: This work had no funding.
Acknowledgements: The authors would like to acknowledge the University of Manchester, the
Manchester Academic Health Science Centre
Conflict of interest: All authors, no conflict of interest.
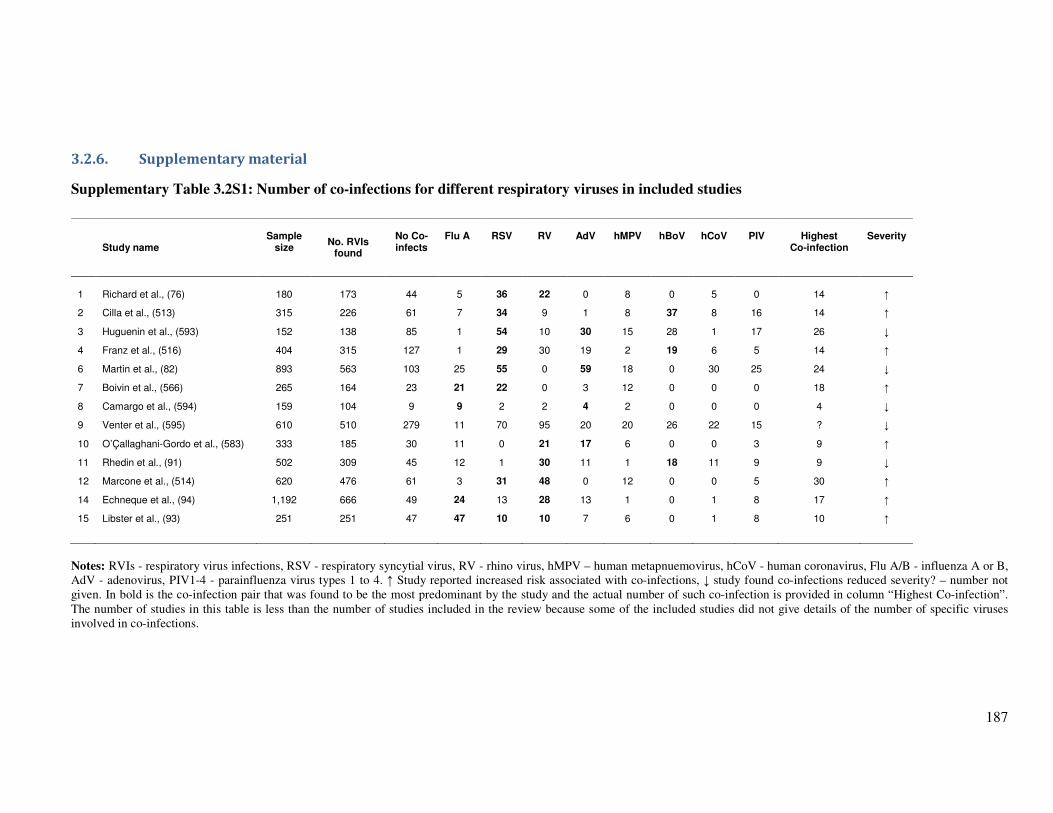
187
3.2.6. Supplementary material
Supplementary Table 3.2S1: Number of co-infections for different respiratory viruses in included studies
Study name Sample
size
No. RVIs
found
No Co-infects
Flu A
RSV
RV
AdV
hMPV
hBoV
hCoV
PIV
Highest
Co-infection
Severity
1
Richard et al., (76) 180 173 44 5 36 22 0 8 0 5 0 14 ↑
2 Cilla et al., (513) 315 226 61 7 34 9 1 8 37 8 16 14 ↑
3 Huguenin et al., (593) 152 138 85 1 54 10 30 15 28 1 17 26 ↓
4 Franz et al., (516) 404 315 127 1 29 30 19 2 19 6 5 14 ↑
6 Martin et al., (82) 893 563 103 25 55 0 59 18 0 30 25 24 ↓
7 Boivin et al., (566) 265 164 23 21 22 0 3 12 0 0 0 18 ↑
8 Camargo et al., (594) 159 104 9 9 2 2 4 2 0 0 0 4 ↓
9 Venter et al., (595) 610 510 279 11 70 95 20 20 26 22 15 ? ↓
10 O’Çallaghani-Gordo et al., (583) 333 185 30 11 0 21 17 6 0 0 3 9 ↑
11 Rhedin et al., (91) 502 309 45 12 1 30 11 1 18 11 9 9 ↓
12 Marcone et al., (514) 620 476 61 3 31 48 0 12 0 0 5 30 ↑
14 Echneque et al., (94) 1,192 666 49 24 13 28 13 1 0 1 8 17 ↑
15 Libster et al., (93) 251 251 47 47 10 10 7 6 0 1 8 10 ↑
Notes: RVIs - respiratory virus infections, RSV - respiratory syncytial virus, RV - rhino virus, hMPV – human metapnuemovirus, hCoV - human coronavirus, Flu A/B - influenza A or B,
AdV - adenovirus, PIV1-4 - parainfluenza virus types 1 to 4. ↑ Study reported increased risk associated with co-infections, ↓ study found co-infections reduced severity? – number not
given. In bold is the co-infection pair that was found to be the most predominant by the study and the actual number of such co-infection is provided in column “Highest Co-infection”.
The number of studies in this table is less than the number of studies included in the review because some of the included studies did not give details of the number of specific viruses
involved in co-infections.
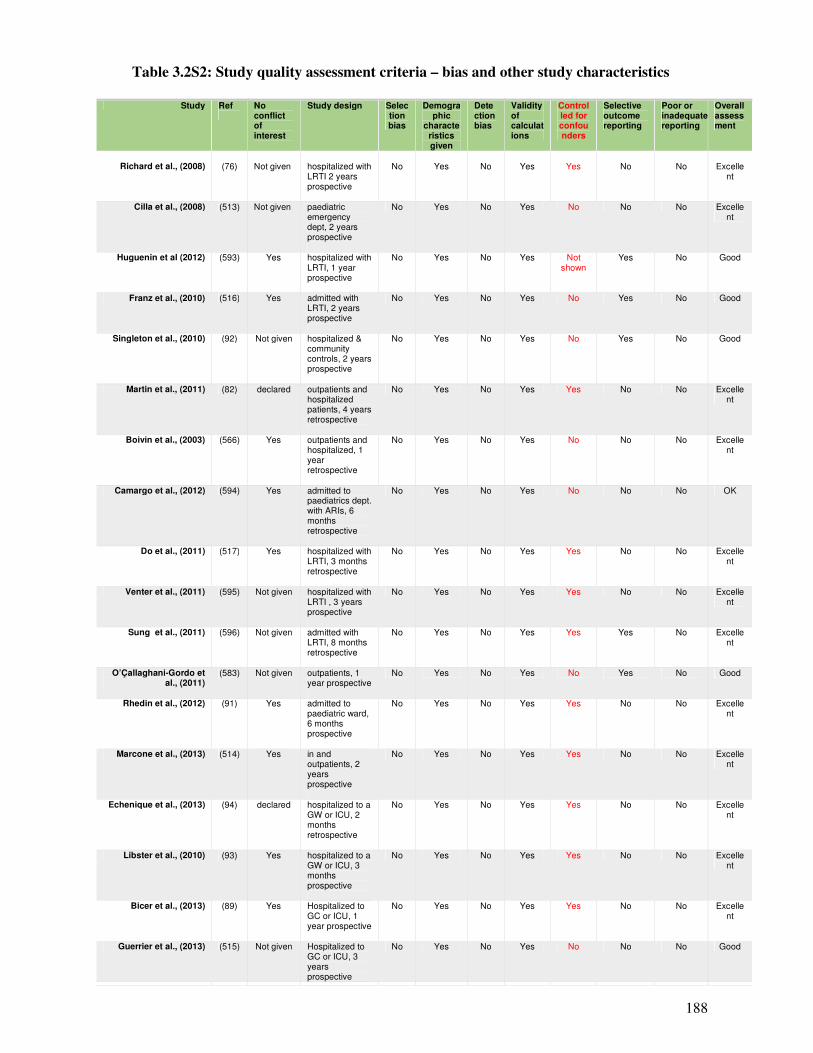
188
Table 3.2S2: Study quality assessment criteria – bias and other study characteristics
Study Ref
No conflict of interest
Study design Selection bias
Demographic
characteristics given
Detection bias
Validity of calculations
Controlled for confounders
Selective outcome reporting
Poor or inadequate reporting
Overall assessment
Richard et al., (2008)
(76)
Not given
hospitalized with LRTI 2 years prospective
No
Yes
No
Yes
Yes
No
No
Excelle
nt
Cilla et al., (2008) (513) Not given paediatric emergency dept, 2 years prospective
No Yes No Yes No No No Excellent
Huguenin et al (2012) (593) Yes hospitalized with LRTI, 1 year prospective
No Yes No Yes Not shown
Yes No Good
Franz et al., (2010) (516) Yes admitted with LRTI, 2 years prospective
No Yes No Yes No Yes No Good
Singleton et al., (2010) (92) Not given hospitalized & community controls, 2 years prospective
No Yes No Yes No Yes No Good
Martin et al., (2011) (82) declared outpatients and hospitalized patients, 4 years retrospective
No Yes No Yes Yes No No Excellent
Boivin et al., (2003) (566) Yes outpatients and hospitalized, 1 year retrospective
No Yes No Yes No No No Excellent
Camargo et al., (2012) (594) Yes admitted to paediatrics dept. with ARIs, 6 months retrospective
No Yes No Yes No No No OK
Do et al., (2011) (517) Yes hospitalized with LRTI, 3 months retrospective
No Yes No Yes Yes No No Excellent
Venter et al., (2011) (595) Not given hospitalized with LRTI , 3 years prospective
No Yes No Yes Yes No No Excellent
Sung et al., (2011) (596) Not given admitted with LRTI, 8 months retrospective
No Yes No Yes Yes Yes No Excellent
O’Çallaghani-Gordo et al., (2011)
(583) Not given outpatients, 1 year prospective
No Yes No Yes No Yes No Good
Rhedin et al., (2012) (91) Yes admitted to paediatric ward, 6 months prospective
No Yes No Yes Yes No No Excellent
Marcone et al., (2013) (514) Yes in and outpatients, 2 years prospective
No Yes No Yes Yes No No Excellent
Echenique et al., (2013) (94) declared hospitalized to a GW or ICU, 2 months retrospective
No Yes No Yes Yes No No Excellent
Libster et al., (2010) (93) Yes hospitalized to a GW or ICU, 3 months prospective
No Yes No Yes Yes No No Excellent
Bicer et al., (2013) (89) Yes Hospitalized to GC or ICU, 1 year prospective
No Yes No Yes Yes No No Excellent
Guerrier et al., (2013) (515) Not given Hospitalized to GC or ICU, 3 years prospective
No Yes No Yes No No No Good

189
Table 3.2S3: Search history on Web of Science for review number 3: Single and multiple
respiratory virus infections and severity of respiratory disease: A systematic review and
meta-analysis
Web of Science® now with books
Search History
Set
Results
Combine
Sets
AND
OR
Delete Sets
# 9 2,515 #6 AND #5 AND #4
Refined by: Web of Science Categories=( INFECTIOUS DISEASES
OR VIROLOGY OR MEDICINE GENERAL INTERNAL OR
RESPIRATORY SYSTEM OR PATHOLOGY OR CRITICAL CARE
MEDICINE ) AND Document Type=( ARTICLE )
Databases=SCI-EXPANDED, SSCI, A&HCI, CPCI-S, CPCI-SSH,
BKCI-S, BKCI-SSH Timespan=All Years
Lemmatization=On
Select to
combine
sets.
Select to
delete this
set.
# 8 2,839 #6 AND #5 AND #4
Refined by: Web of Science Categories=( INFECTIOUS DISEASES
OR VIROLOGY OR MEDICINE GENERAL INTERNAL OR
RESPIRATORY SYSTEM OR PATHOLOGY OR CRITICAL CARE
MEDICINE )
Databases=SCI-EXPANDED, SSCI, A&HCI, CPCI-S, CPCI-SSH,
BKCI-S, BKCI-SSH Timespan=All Years
Lemmatization=On
Select to
combine
sets.
Select to
delete this
set.
# 7 6,022 #6 AND #5 AND #4
Databases=SCI-EXPANDED, SSCI, A&HCI, CPCI-S, CPCI-SSH,
Select to
combine
Select to
delete this
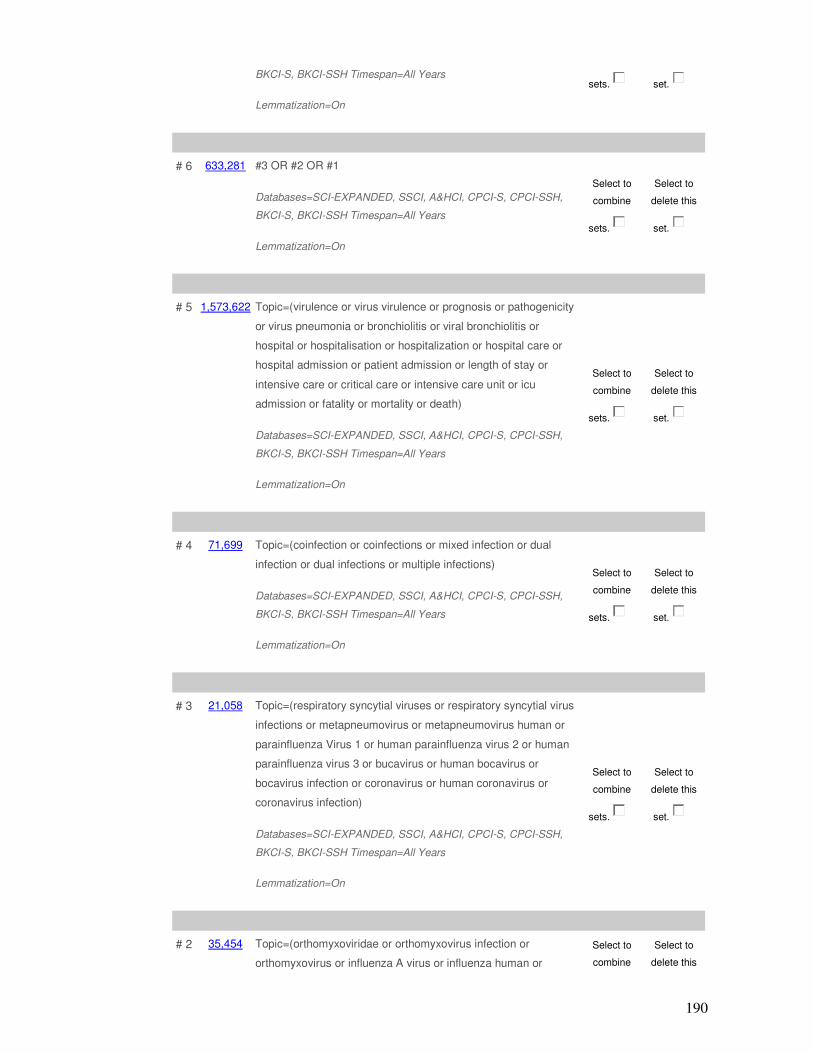
190
BKCI-S, BKCI-SSH Timespan=All Years
Lemmatization=On
sets. set.
# 6 633,281 #3 OR #2 OR #1
Databases=SCI-EXPANDED, SSCI, A&HCI, CPCI-S, CPCI-SSH,
BKCI-S, BKCI-SSH Timespan=All Years
Lemmatization=On
Select to
combine
sets.
Select to
delete this
set.
# 5 1,573,622 Topic=(virulence or virus virulence or prognosis or pathogenicity
or virus pneumonia or bronchiolitis or viral bronchiolitis or
hospital or hospitalisation or hospitalization or hospital care or
hospital admission or patient admission or length of stay or
intensive care or critical care or intensive care unit or icu
admission or fatality or mortality or death)
Databases=SCI-EXPANDED, SSCI, A&HCI, CPCI-S, CPCI-SSH,
BKCI-S, BKCI-SSH Timespan=All Years
Lemmatization=On
Select to
combine
sets.
Select to
delete this
set.
# 4 71,699 Topic=(coinfection or coinfections or mixed infection or dual
infection or dual infections or multiple infections)
Databases=SCI-EXPANDED, SSCI, A&HCI, CPCI-S, CPCI-SSH,
BKCI-S, BKCI-SSH Timespan=All Years
Lemmatization=On
Select to
combine
sets.
Select to
delete this
set.
# 3 21,058 Topic=(respiratory syncytial viruses or respiratory syncytial virus
infections or metapneumovirus or metapneumovirus human or
parainfluenza Virus 1 or human parainfluenza virus 2 or human
parainfluenza virus 3 or bucavirus or human bocavirus or
bocavirus infection or coronavirus or human coronavirus or
coronavirus infection)
Databases=SCI-EXPANDED, SSCI, A&HCI, CPCI-S, CPCI-SSH,
BKCI-S, BKCI-SSH Timespan=All Years
Lemmatization=On
Select to
combine
sets.
Select to
delete this
set.
# 2 35,454 Topic=(orthomyxoviridae or orthomyxovirus infection or
orthomyxovirus or influenza A virus or influenza human or
Select to
combine
Select to
delete this

191
influenza A virus or H1N1 subtype or 2009 H1N1 influenza or
influenza A(H1N1)pdm09 or influenza A virus H3N2 subtype)
Databases=SCI-EXPANDED, SSCI, A&HCI, CPCI-S, CPCI-SSH,
BKCI-S, BKCI-SSH Timespan=All Years
Lemmatization=On
sets. set.
# 1 627,947 Topic=(viruses or virus diseases or virus infection or respiratory
tract Infections or respirovirus infections or lower respiratory tract
infections or upper respiratory tract infections)
Databases=SCI-EXPANDED, SSCI, A&HCI, CPCI-S, CPCI-SSH,
BKCI-S, BKCI-SSH Timespan=All Years
Lemmatization=On
Select to
combine
sets.
Select to
delete this
set.
AND
OR
192
Part IV: Co-infections and risk of hospitalization and mortality in NW
England 2007 – 2012
4.1. Co-infections and risk of hospitalization and mortality Part A: Single, dual and
multiple respiratory virus infections and risk of hospitalization and
mortality
Synopsis
This is the authors’ version of the paper published in Epidemiology and Infection. On 28
January, 2014. Reproduced from Goka et al., with permission from Cambridge University
Press, Copyright Licence No: 3373750155325. This paper discusses the association between
mixed infections and severe disease outcome. The dataset was the electronic records of all
samples, from the North West region of England, received and tested for respiratory virus
infections between January 2007 and June, 2012. Some of the datum included in this study was
also presented as a poster at the poster day of the faculty of Medical and Health Sciences of the
University of Manchester held on 26th of January 2012.
193
Single, dual and multiple respiratory virus infections
and risk of hospitalization and mortality
E. A. Goka 1, P. J. Vallely 1, K. J. Mutton 1,2, P. E. Klapper 1,2
1: Institute of Inflammation and Repair, Faculty of Medical and Human Sciences, University of Manchester,
2: Department of Clinical Virology, Central Manchester University Hospitals - NHS Foundation Trust
Correspondence author: E. A. Goka: Institute of Inflammation and Repair, Faculty of Medical and Human
Sciences, 1st Floor Stopford building, University of Manchester, Oxford Road, Manchester, M13 9PL, UK. Email:
Running head: Single/mixed respiratory viruses & severity
194
4.1.1. Abstract
Respiratory virus infections cause a significant number of hospitalization and deaths globally.
This study investigated the association between single and multiple respiratory virus infections
and risk of admission to a general ward, ICU or death among patients aged 0 – 105 years old
[mean = 24.4 (SD±24.1) years], from North West England, that were tested for respiratory
virus infections between January 2007 and June 2012. The majority of infections were in
children ≤5 years old. Dual or multiple infections occurred in 10.4% (1,214/11,715) of patients,
whereas single infection occurred in 89% (10,501/11,715). Rhinovirus was the most common
co-infecting virus (occurring in 69.5%; 844/1,214 of the co-infections). In a multivariate
logistic regression model, multiple infections were associated with an increased risk of
admission to a general ward (OR: 1.43, 95% CI: 1.2 – 1.7, p = <0.0001). On the other hand,
patients with RSV and hPIV1-3, as a single infection, had a higher risk of being admitted to a
general ward (OR: 1.49, 95% CI: 1.28 – 1.73, p = <0.0001 and OR: 1.34, 95% CI: 1.003 – 1.8,
p = 0.05); admitted to the ICU or dying (OR: 1.5, 95% CI: 1.20 – 2.0, p = 0.001 and OR: 1.60,
95% CI: 1.02 – 2.40, p = 0.04). This result emphasises the importance of RSV, hPIV and mixed
infections and calls for research on vaccines, drugs and diagnostic tests targeting these
respiratory viruses.
Key words: respiratory virus infections, single and multiple infections, hospitalization,
parainfluenza virus types 1 to 3, influenza A(H1N1)pdm09 virus.
195
4.1.2. Introduction
Around 5.0% - 38.0% of respiratory virus infections develop into acute respiratory tract
infection (ARIs) leading to hospitalization and mortality (204;216;233;234;237;251).
Thompson et al., (253) estimated deaths associated with influenza A/B (Flu A/B) and
respiratory syncytial virus (RSV) between 1976 and 1999 in the USA. They reported that
between 1990 and 1999 there were an average of 8,097 (SD: 3084) influenza A/B/pneumonia
associated deaths and 2,707 (SD: 196) RSV/pneumonia associated deaths annually, with 90.0%
of influenza and 78.0% of RSV-associated deaths occurring in the elderly ≥65 years old. In the
United Kingdom a study by Nicholson (601) estimated that between 1975 and 1990 there were
between 6,244 (SD: 1,416) and 29,646 (SD: 6,723) influenza-related deaths annually. Two
recent meta-analyses on influenza and respiratory syncytial virus (RSV) in under-five year old
children (227;228) estimated that globally, 13.0% of all children with influenza infection
developed acute lower respiratory tract infections (ALRI) - equivalent to 20 million (95% CI:
13–32 million) ALRI cases per year, and that in 2008, influenza-associated ALRI caused
between 28,000 and 111, 500 deaths in children younger than 5 years. Nair et al., (227)
reported that 22.0% of ALRIs were associated with RSV (incidence 59.1 per 1,000 children in
developing countries and 24.0 per 1,000 children in developed countries respectively) -
equivalent to a global health burden of 33.8 million new cases each year; of which 3.4 million
cases (9.0%) required hospitalization, and 66,000 to 199,000 died. An earlier review by
Williams et al., (3) suggested that globally, ARIs were responsible for 1.9 million (95% CI 1.6–
2.2 million) deaths among under 5 children.
Some studies have reported an association between co-infection and severe disease outcome
(75-77;91;94;514), however, a number of other studies have reported no significant differences
in disease outcome between single or multiple virus infections (89;602;603). Our other study
(338) investigated the association between co-infection between pandemic influenza
A(H1N1)pdm09 (Flu Apdm09), seasonal Flu A (Seas Flu A) and other respiratory viruses and
risk of hospitalization and mortality. This study compared the disease outcome in single RSV,
rhinovirus (RV), adenovirus (AdV), human metapneumovirus (hMPV), human parainfluenza
viruses types 1 to 3 (hPIV1-3), influenza B, pandemic influenza A(H1N1)pdm09, and seasonal
influenza A viruses. It also investigated the association between single and multiple infections,
in general, and disease outcome. Knowledge on single infections will help determine the
relative important of these respiratory viruses in causing acute respiratory infections requiring
hospitalization or resulting in deaths, whereas an understanding of disease outcome in co-
infections may help generate information needed for patient management, direct research
196
efforts towards development of multi-targeted diagnostic tests, integrated vaccine, and
combined treatment for all respiratory viruses.
4.1.3. Methodology
4.1.3.1. Study design and setting
This descriptive cross-sectional study retrospectively analysed the results of respiratory virus
samples of patients 0 - 105 years old that were received and tested for ten respiratory virus
infections; Flu Apdm09, SeasFlu A (e.g. H3N2), Flu B, RSV, RV, AdV, hMPV, and hPIV1-3,
at Manchester Microbiology Partnership Laboratory (MMPL) between January 2007 and June
2012. The samples were from outpatients, hospitalized patients, or patients who had died, and
they originated from medical centres, surgeries and hospitals located in the North West region
of England, an area serving a population of over 7 million people (99). In total 30,975 samples
were received at the MMPL between January 2007 and June 2012, of which 35.9% (11,112)
were from children ≤5 years and 64.1% (19,863) were from patients >5 years old [mean 24.4
(SD±24.1) years, median 20.0 (25 – 75 percentiles 0.8 - 41.0 years)], and these proportions
were statistically significant (p = <0.0001).
4.1.3.2. Virus identification, inclusion and exclusion criteria
The types of samples that were tested for respiratory virus infection included: nose and throat
swabs (VNT), nasopharyngeal aspirates (VNPA), and swabs from other parts of the body
(VSW). Details of the laboratory protocols used to test for the viruses were published
elsewhere Goka et al., (338). Briefly well validated in-house polymerase chain reaction (RT-
PCR) assays were used for the identification of influenza and other respiratory virus infections.
A second RT-PCR assay by Ellis et al., (102) was used to further type the pandemic influenza
A(H1N1)pdm09 virus.
The majority, but not all samples were tested for all respiratory viruses as tests were conducted
according to the physicians’ request. All samples that were received at the MMPL and tested
for respiratory virus infections during the study period were eligible for inclusion. Samples that
did not have test results because of failure of PCR or insufficient sample, or had no outcome
[i.e. hospitalization to the general ward (GW) or intensive care unit (ICU) or died], were
excluded.
4.1.3.3. Statistical analysis
Descriptive statistics were calculated to explore the distribution of respiratory virus single, dual
and multiple infections by age and patients gender. Pearson’s chi-square test was used on this
197
categorical data at significance level of p = 0.05. Multiple logistic models, controlling for age,
season, gender and an interaction factor between age and co-infection, were used to measure
the association between single, dual, and multiple respiratory virus infections and risk of
admission to a general ward, admission to the ICU or death. First a univariate logistic model
was calculated and then a second covariate was added to the model up to the last and the best
model chosen. The significance of each covariate was assessed using the likelihood-ratio test.
Association was measured using odds ratios (OR) and 95% confidence intervals (CI) at
significance of p = 0.05. All analyses were conducted using STATA software version 11
(STATACorp, College Station, TX, USA).
4.1.3.4. Ethical and research and development approval
Ethical approval for this study was granted by the Greater Manchester NHS Ethics Committee
(Ref: 11/NW⁄0698) and the University of Manchester Research Ethics Office. Research and
Development approval was obtained from the Central Manchester Universities Hospitals NHS
Foundation Trust (Ref: R01835).
4.1.4. Results
4.1.4.1. Respiratory virus infections
During the 6 years of the study, 30,975 samples were tested and 11,715 (37.8%) were positive
for one or more respiratory virus of which, dual or multiple infections occurred in 10.4%
(1,214/11,715), and single infections occurred in 89.6% (10,501/11,715). Among dual
infections, the most common combination was RV/RSV; 30.2% (367) of all co-infections,
followed by RV/AdV 13.9% (169), RSV/AdV 7.2% (88), RV/hPIV3 5.2% (63), RV/hMPV
5.0% (61), AdV/hMPV 2.1% (25), RSV/hMPV 1.5% (18), AdV/hPIV3 1.4% (17) and
RV/hPIV1 1.3% (16) – (Table 4.1). Among triple and multiple infections, rhinoviruses and
respiratory syncytial viruses predominated with the RV/RSV/AdV triple infection comprising
32 (2.7%) of all co-infections, followed by a triple infection involving the three human
parainfluenza viruses hPIV1/hPIV2/hPIV3 16 (1.3%) and multiple infections of
RV/hPIV1/hPIV2/hPIV3 and RSV/hPIV1/hPIV2/hPIV3 - 13 (1.1%). In total rhinovirus was
involved in 844 of the 1,214 co-infections (69.5%) making them the most common co-infecting
virus. The pattern of co-infections between the pandemic influenza A(H1N1)pdm09 and
seasonal influenza A viruses and other respiratory viruses was presented elsewhere, Goka et al.,
(338).
198
4.1.4.2. Demographic and other factors associated with single or multiple infections
Age and Sex: Of the 11,715 patients that were positive for one or more virus, the majority
51.2% (6,065) were children ≤5 years old (mean age for all positive cases = 16.5 (SD: ±21.4)
years, range 0 – 99; median 3.0 (25 – 75 percentiles 0.42 - 28.0 years), and ≤5 year old children
had also the highest positivity rate (54.6%) – supplementary Table S1. Comparatively, the
proportion of ≤ 5 years olds among PCR negative and excluded cases were 26.6%
(4,579/17,248) and 23.3% (468/2,012) respectively, and these differences were statistically
significant (�2 = 1900, p = <0.0001 for positive and negative and �2 = 559.6, p = <0.0001 for
positive and excluded cases). The distribution of single and multiple infections by age and
gender is given in Table 4.2 (and Table 4.1S1). Overall children had a higher risk of having a
mixed infection, with 83.5% (1,014/1,214) of mixed infections occurring in under-five year old
children. Similar proportions were observed for specific respiratory virus infections. However,
apart from RV, Flu B and hMPV, the attack rates for the proportion of single and multiple
respiratory viruses did not significantly differ by sex.
Seasonality: There was a four-fold increase in the number of samples received at the MMPL
during the first and third waves of the 2009 influenza pandemic compared to the other periods
of the study (Supplementary Table 4.1S2A&B). Specifically 25.9% (8,032/30,975) of the
samples were tested between April – October 2009, and 25.3% (7,849/30,975) between
November 2010 – March 2011 compared to range of 474 and 2,196 in pre, inter and post-
pandemic periods. Correspondingly, the majority of the respiratory viruses 20.3%
(2,831/11,715) and 32.1% (3,756/11,715) were identified during these periods (Supplementary
Table 4.1S2A&B). The type of virus that predominated each period also differed; influenza
viruses were predominant during the 1st and 3rd wave (44.7% and 36.0% of all viruses
identified in the 2 periods respectively), whereas RV and RSV predominated in the pre, inter
and post-pandemic periods (RV mainly in summer and RSV mainly in winter) – Table
4.1S2A&B. However overall RV was the most predominant virus comprising 31.9%
(3,740/11,715) of all viruses identified between January 2007 and June 2012 followed by the
pandemic influenza A(H1N1) 24.6% (2,789/11,715) and RSV 24.2% (2,832/11,715).
4.1.4.3. Single and multiple infections and risk of hospitalization to a general ward, or
admission to an intensive care unit (ICU) and death
Of the 10,501 patients with single respiratory virus infections, 1,738 (16.6%) were seen as
outpatients, 8,009 (76.3%) were admitted to a general ward, 530 (5.1%) were admitted to the
ICU, and 224 (2.1%) died. Out of the 1,214 patients who had co-infections, 147 (12.2%) were
199
seen as outpatients, 992 (81.7%) were admitted to a general ward, 57 (4.7%) were admitted to
the ICU, and 18 (1.5%) died. In stratified analysis multiple infection in children ≤5 years old
was associated with an increased risk of admission to a general ward (OR: 1.32, 95% CI: 1.10 –
1.63, p = 0.01). In a multiple logistic model controlling for age and season, the risk was slightly
higher (OR: 1.43, 95% CI: 1.20 – 1.71, p = <0.0001) – Table 4.3.
We wanted to know whether the disease outcome in specific single respiratory virus infections
was less, or more severe, compared to other single respiratory virus infections. In this analysis,
stratified analysis showed that seasonal influenza A virus, and influenza B virus increased risk
of admission to a general ward among young children and adults >5 years old (OR: 2.37, 95%
CI: 1.85 – 3.04, p = <0.0001 for seasonal Flu A and OR: 1.31, 95% CI: 1.01 – 1.70, p = 0.04),
whereas RSV increased risk of admission to a general ward in children ≤5 years old (OR: 1.18,
95% CI: 1.03 – 1.40, p = 0.05). In a multiple logistic model, controlling for age and season,
RSV and hPIV1-3 single infections were associated with significant increase in risk of
admission to a general ward compared to other single respiratory virus infections (OR: 1.49,
95% CI: 1.28 – 1.73, p = <0.0001 and OR: 1.34, 95% CI: 1.003 – 1.80, p = 0.05).
Regarding risk of admission to the ICU/death, in general, multiple infection was associated
with an increase in the risk of admission to the ICU (OR: 1.15, 95% CI: 0.86 – 1.55), compared
to single infection but this was not statistically significant (p = 0.34). For specific viruses, RSV
and hPIV3 single infections were associated with an increased risk of admission to an
ICU/dying than single other respiratory virus infections (OR: 1.51, 95% CI: 1.20 – 2.0, p =
0.001 and OR: 1.60, 95% CI: 1.02 – 2.40, p = 0.04) for RSV and hPIV1-3 respectively – Table
4.4. Stratified analysis indicated that the risk of admission to the ICU associated with RSV and
hPIV were only significant among patients aged >5 years old (OR: 2.42, 95% CI: 1.36 – 4.33, p
= 0.003 for RSV and OR: 1.92, 95% CI: 1.10 – 3.74, p = 0.05 for PIV1-3).
In the multivariate logistic regression, separate models controlling for age group, season, sex,
and an interaction factor of age and co-infections were employed. After assessment using the
likelihood-ratio test, it was observed that models that included both age and season were the
best, probably because the distribution of single and multiple virus infections differed
statistically by age and season. For example, the result of likelihood test for a logistic model
measuring association between single rhinovirus infection and risk of admission to a general
ward; one without covariates, one with age group, and another with age group and season
included were: �2 = 3.74, P = 0.05 and �2 = 7.7, p = 0.02, indicating that both age and season
were significant variables.
200
4.1.5. Discussion and Conclusion
In general, patients with dual or mixed respiratory virus infections had an increased risk of
being admitted to a general ward compared to those with single infections. Patients with RSV
and hPIV1-3 single infections had a higher risk of being admitted to a general ward or to the
ICU or dying. The finding that co-infections increase disease severity is in agreement with
several other studies (75-77) that have reported an association between co-infections and
disease severity. Drews et al., (75) showed that co-infection increased risk of admission to a
general ward 3-fold, similarly Richard et al., (76) and Do et al., (517) also found that co-
infection increased risk of admission to ICU 3-fold (OR: 2.7, 95% CI: 1.2 -6.2 and OR: 3.0,
95% CI: 1.6 – 5.6). Whereas the latter finding is in agreement with other studies
(3;89;223;227;228;602-605) that observed severe disease in single respiratory virus infections.
The majority of single and multiple respiratory virus infections were in children < 5 years old
(Table 4.2). Also, in general, multiple respiratory virus infections caused more severe disease
in children ≤5 years old whereas for single virus infections: RSV accounted for severe disease
in both ≤5 years children (GW) and patients >5 years old (ICU/death); seasonal influenza A
virus (GW), influenza B (GW), and hPIV1-3 (GW) had higher impact on patients aged >5 year
old.
In this study, the pandemic influenza A(H1N1) was the predominant virus during the 1st and
3rd waves of the 2009 influenza pandemic, whereas RV and RSV were the main viruses in
summer and winter periods of the pre-pandemic and post-pandemic periods (Supplementary
Table S2). However, considering the entire study period RV was the most common virus
(31.9%; 3,740/11715), followed by the pandemic influenza A(H1N1)pdm09 virus and RSV. A
study by the European Paediatric Influenza Analysis (EPIA) project (230) on respiratory virus
activity between 2002 and 2008 in England, reported influenza A and RSV as the predominant
viruses. Elsewhere, epidemiological studies from across the globe (222;223;227;228;241;606)
have identified RSV as the most common virus among patients visiting outpatient clinics with
influenza like illnesses or hospitalized with acute respiratory tract infection or from the
community, followed by rhinovirus, and influenza A viruses.
RV, RSV and AdV caused the highest co-infection burden [occurring in 69.5% (844/1,214),
52.2% (634/1,214) and 32.5% (394/1,214) of all co-infections respectively]. Among others, RV
was detected in 367 co-infections with RSV and 169 with AdV (Table 4.1A). Our findings
agree with (89;94;602) but differ with (87;514). The high RV and RSV co-infections could
because they circulated all year round (RV mainly in summer, but a good number were also
identified during winter and vice versa for RSV - Table 4.1B). Further, hPIV1-3 were the
201
fourth most important co-infecting virus, involved in 17.6% (213/1,214) of co-infections and
most of the mixed infections. This cannot be explained by seasonal variations as hPIV1-3
circulated predominantly in spring and summer. Monto and Sullivan (204) and Macorne et al.,
(514) also found hPIV1-3 predominating in spring and summer whereas Bicer at al., (89)
reported that hPIVs circulate all year round. More research is needed to understand the
biomedical processes that favour these co-infections.
A shortfall of this study is that we did not control for other covariates known to affect disease
outcome; including patient’s immune status and co-morbidities, and genetic mutations
occurring in influenza A viruses and this should be born in mind when interpreting our results.
This study included both children and adults, however children ≤5 years old differ considerably
with adults in their exposure to infections, immunology and anatomy. The odds ratios among
different age strata were different amongst themselves and also differed with the crude odds
ratios which suggests effect modification by age, however we did not have serological data to
ascertain the patient’s immune status. In addition, the adjusted odds ratios differed with crude
odds ratios by more than 10% suggesting age was also a confounder. We therefore reported
both stratum specific and adjusted odds ratios. Further, samples were not tested for human
bocavirus and coronaviruses which are known to co-infect with other respiratory viruses
(87;88).
It is well understood that genetic mutations may affect the severity of respiratory viruses. For
example the severity of influenza viruses may be influenced by genetic mutations in the
haemagglutinin (HA), neuraminidase (NA), non-structural protein 1 (NS1), and polymerase
basic 1 gene (PB1) (18;342;401;415;436;438;461;464). Nevertheless, a UK study that
investigated the association between mutations in the pandemic influenza A(H1N1)pdm09 and
disease outcome (607) observed that similar mutations (39/40) occurred in fatal and none-fatal
cases suggesting that no significant virulence related mutations occurred in influenza
A(H1N1)pdm09 during the study period. It is thus unlikely that the severity observed in this
study was due to virus mutations in the influenza A viruses. However, as mutations on other
respiratory viruses; RSV, RV, AdV, hMPV, and hPIV1-3 are largely not studied, the
importance of these on virulence should be born in mind when interpreting the results of this
study.
In summary, in this study, co-infection was associated with an increased risk of admission to a
general ward, whereas single RSV or hPIV1-3 infections were associated with an increased risk
of admission to a general ward, the ICU or death. Evidence on the severity of disease by
202
laboratory confirmed respiratory virus infections is often lacking, the findings of this study
offer a better understanding of the importance of respiratory viruses and help define a place for
vaccine and drug development especially vaccines and drugs which may target several of these
viruses. It also elucidates the importance of research on development of multi-target diagnostic
tests.
Funding: This work was supported by the University of Manchester.
Acknowledgements: The authors would like to acknowledge the University of Manchester, the
Manchester Academic Health Science Centre, and the Central Manchester University Hospitals
NHS Foundation Trust and staff for their support in this research.
Conflict of interest: All authors, no conflict of interest.
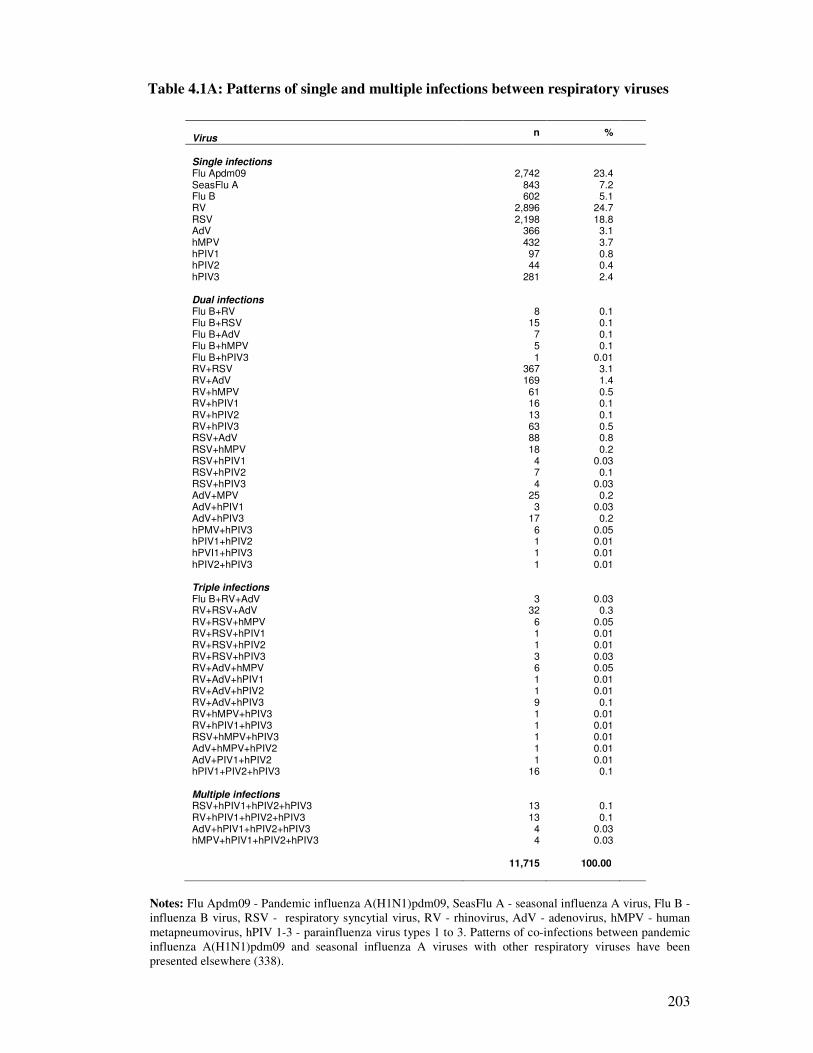
203
Table 4.1A: Patterns of single and multiple infections between respiratory viruses
Virus
n %
Single infections Flu Apdm09 2,742 23.4 SeasFlu A 843 7.2 Flu B 602 5.1 RV 2,896 24.7 RSV 2,198 18.8 AdV 366 3.1 hMPV 432 3.7 hPIV1 97 0.8 hPIV2 44 0.4 hPIV3 281 2.4 Dual infections Flu B+RV 8 0.1 Flu B+RSV 15 0.1 Flu B+AdV 7 0.1 Flu B+hMPV 5 0.1 Flu B+hPIV3 1 0.01 RV+RSV 367 3.1 RV+AdV 169 1.4 RV+hMPV 61 0.5 RV+hPIV1 16 0.1 RV+hPIV2 13 0.1 RV+hPIV3 63 0.5 RSV+AdV 88 0.8 RSV+hMPV 18 0.2 RSV+hPIV1 4 0.03 RSV+hPIV2 7 0.1 RSV+hPIV3 4 0.03 AdV+MPV 25 0.2 AdV+hPIV1 3 0.03 AdV+hPIV3 17 0.2 hPMV+hPIV3 6 0.05 hPIV1+hPIV2 1 0.01 hPVI1+hPIV3 1 0.01 hPIV2+hPIV3 1 0.01 Triple infections Flu B+RV+AdV 3 0.03 RV+RSV+AdV 32 0.3 RV+RSV+hMPV 6 0.05 RV+RSV+hPIV1 1 0.01 RV+RSV+hPIV2 1 0.01 RV+RSV+hPIV3 3 0.03 RV+AdV+hMPV 6 0.05 RV+AdV+hPIV1 1 0.01 RV+AdV+hPIV2 1 0.01 RV+AdV+hPIV3 9 0.1 RV+hMPV+hPIV3 1 0.01 RV+hPIV1+hPIV3 1 0.01 RSV+hMPV+hPIV3 1 0.01 AdV+hMPV+hPIV2 1 0.01 AdV+PIV1+hPIV2 1 0.01 hPIV1+PIV2+hPIV3 16 0.1 Multiple infections RSV+hPIV1+hPIV2+hPIV3 13 0.1 RV+hPIV1+hPIV2+hPIV3 13 0.1 AdV+hPIV1+hPIV2+hPIV3 4 0.03 hMPV+hPIV1+hPIV2+hPIV3 4 0.03
11,715
100.00
Notes: Flu Apdm09 - Pandemic influenza A(H1N1)pdm09, SeasFlu A - seasonal influenza A virus, Flu B -
influenza B virus, RSV - respiratory syncytial virus, RV - rhinovirus, AdV - adenovirus, hMPV - human
metapneumovirus, hPIV 1-3 - parainfluenza virus types 1 to 3. Patterns of co-infections between pandemic
influenza A(H1N1)pdm09 and seasonal influenza A viruses with other respiratory viruses have been
presented elsewhere (338).
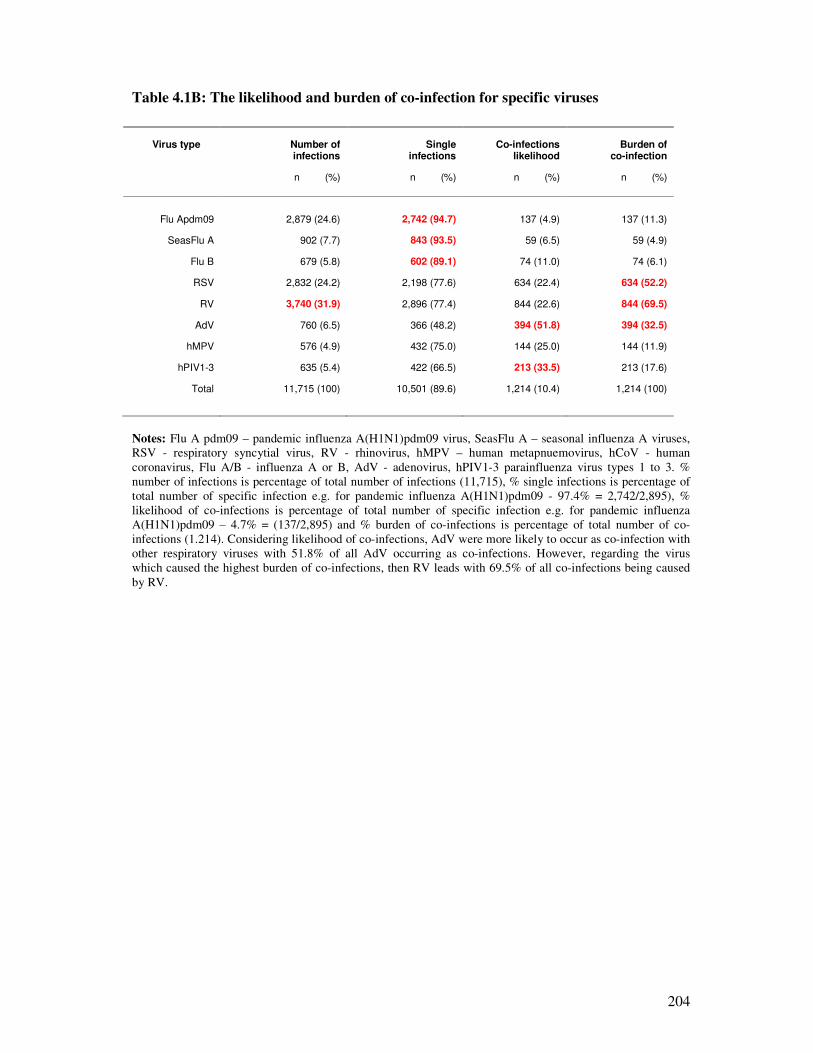
204
Table 4.1B: The likelihood and burden of co-infection for specific viruses
Virus type
Number of infections
Single
infections Co-infections
likelihood Burden of
co-infection
n (%) n (%) n (%) n (%)
Flu Apdm09 2,879 (24.6) 2,742 (94.7) 137 (4.9) 137 (11.3)
SeasFlu A 902 (7.7) 843 (93.5) 59 (6.5) 59 (4.9)
Flu B 679 (5.8) 602 (89.1) 74 (11.0) 74 (6.1)
RSV 2,832 (24.2) 2,198 (77.6) 634 (22.4) 634 (52.2)
RV 3,740 (31.9) 2,896 (77.4) 844 (22.6) 844 (69.5)
AdV 760 (6.5) 366 (48.2) 394 (51.8) 394 (32.5)
hMPV 576 (4.9) 432 (75.0) 144 (25.0) 144 (11.9)
hPIV1-3 635 (5.4) 422 (66.5) 213 (33.5) 213 (17.6)
Total 11,715 (100) 10,501 (89.6) 1,214 (10.4) 1,214 (100)
Notes: Flu A pdm09 – pandemic influenza A(H1N1)pdm09 virus, SeasFlu A – seasonal influenza A viruses,
RSV - respiratory syncytial virus, RV - rhinovirus, hMPV – human metapnuemovirus, hCoV - human
coronavirus, Flu A/B - influenza A or B, AdV - adenovirus, hPIV1-3 parainfluenza virus types 1 to 3. %
number of infections is percentage of total number of infections (11,715), % single infections is percentage of
total number of specific infection e.g. for pandemic influenza A(H1N1)pdm09 - 97.4% = 2,742/2,895), %
likelihood of co-infections is percentage of total number of specific infection e.g. for pandemic influenza
A(H1N1)pdm09 – 4.7% = (137/2,895) and % burden of co-infections is percentage of total number of co-
infections (1.214). Considering likelihood of co-infections, AdV were more likely to occur as co-infection with
other respiratory viruses with 51.8% of all AdV occurring as co-infections. However, regarding the virus
which caused the highest burden of co-infections, then RV leads with 69.5% of all co-infections being caused
by RV.
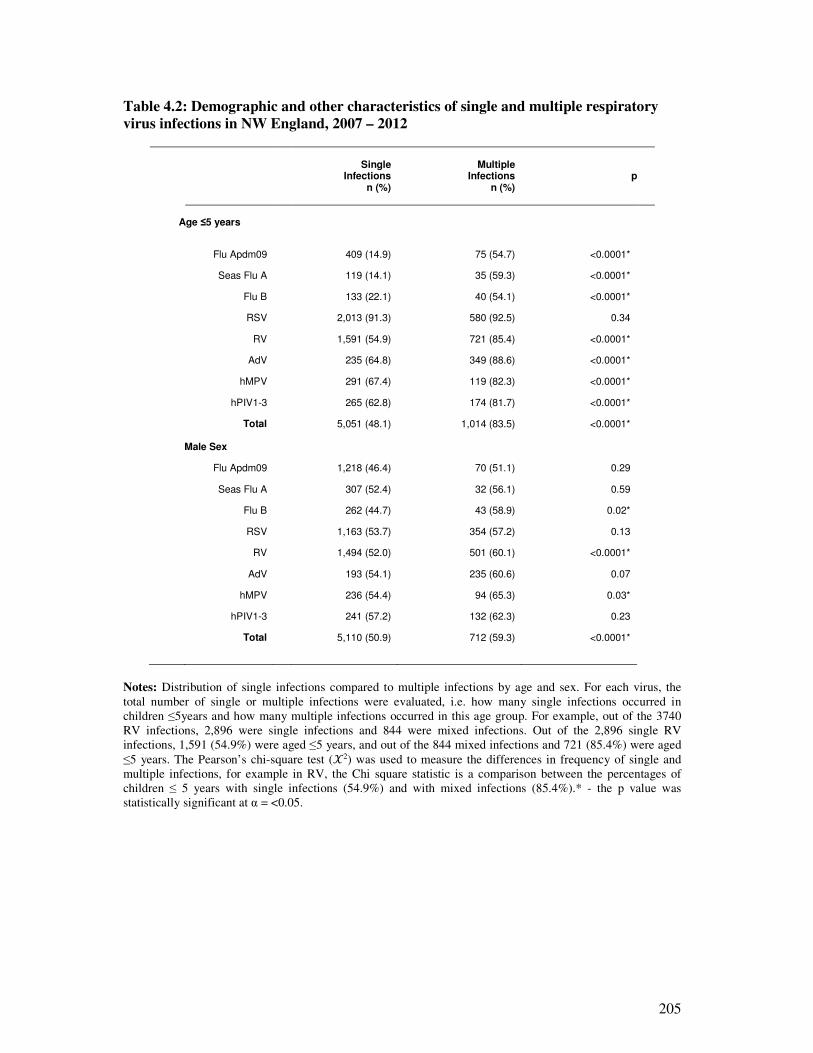
205
Table 4.2: Demographic and other characteristics of single and multiple respiratory
virus infections in NW England, 2007 – 2012
Single
Infections n (%)
Multiple Infections
n (%)
p
Age ≤5 years
Flu Apdm09 409 (14.9) 75 (54.7) <0.0001*
Seas Flu A 119 (14.1) 35 (59.3) <0.0001*
Flu B 133 (22.1) 40 (54.1) <0.0001*
RSV 2,013 (91.3) 580 (92.5) 0.34
RV 1,591 (54.9) 721 (85.4) <0.0001*
AdV 235 (64.8) 349 (88.6) <0.0001*
hMPV 291 (67.4) 119 (82.3) <0.0001*
hPIV1-3 265 (62.8) 174 (81.7) <0.0001*
Total 5,051 (48.1) 1,014 (83.5) <0.0001* Male Sex
Flu Apdm09 1,218 (46.4) 70 (51.1) 0.29
Seas Flu A 307 (52.4) 32 (56.1) 0.59
Flu B 262 (44.7) 43 (58.9) 0.02*
RSV 1,163 (53.7) 354 (57.2) 0.13
RV 1,494 (52.0) 501 (60.1) <0.0001*
AdV 193 (54.1) 235 (60.6) 0.07
hMPV 236 (54.4) 94 (65.3) 0.03*
hPIV1-3 241 (57.2) 132 (62.3) 0.23
Total 5,110 (50.9) 712 (59.3) <0.0001*
Notes: Distribution of single infections compared to multiple infections by age and sex. For each virus, the
total number of single or multiple infections were evaluated, i.e. how many single infections occurred in
children ≤5years and how many multiple infections occurred in this age group. For example, out of the 3740
RV infections, 2,896 were single infections and 844 were mixed infections. Out of the 2,896 single RV
infections, 1,591 (54.9%) were aged ≤5 years, and out of the 844 mixed infections and 721 (85.4%) were aged
≤5 years. The Pearson’s chi-square test (�2) was used to measure the differences in frequency of single and
multiple infections, for example in RV, the Chi square statistic is a comparison between the percentages of
children ≤ 5 years with single infections (54.9%) and with mixed infections (85.4%).* - the p value was
statistically significant at α = <0.05.
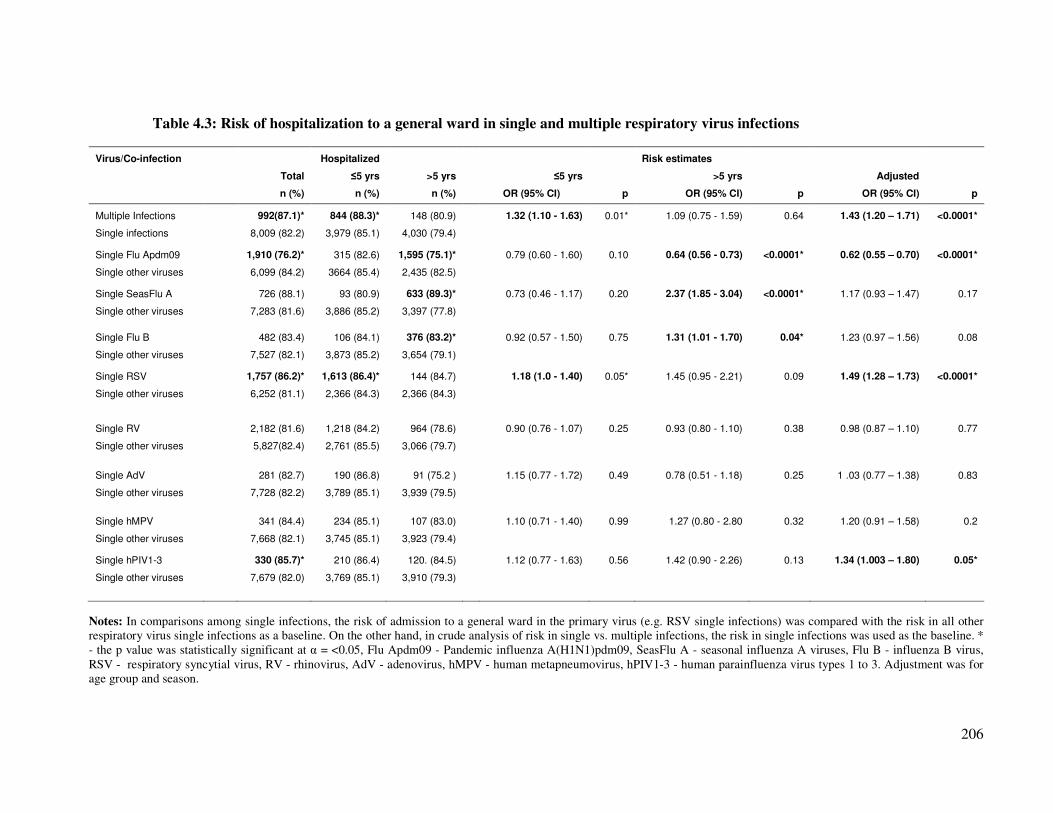
206
Table 4.3: Risk of hospitalization to a general ward in single and multiple respiratory virus infections
Virus/Co-infection
Hospitalized
Risk estimates
Total ≤5 yrs >5 yrs
≤5 yrs
>5 yrs
Adjusted
n (%) n (%) n (%)
OR (95% CI) p OR (95% CI) p OR (95% CI) p
Multiple Infections 992(87.1)* 844 (88.3)* 148 (80.9) 1.32 (1.10 - 1.63) 0.01* 1.09 (0.75 - 1.59) 0.64 1.43 (1.20 – 1.71) <0.0001*
Single infections 8,009 (82.2) 3,979 (85.1) 4,030 (79.4)
Single Flu Apdm09 1,910 (76.2)* 315 (82.6) 1,595 (75.1)* 0.79 (0.60 - 1.60) 0.10 0.64 (0.56 - 0.73) <0.0001* 0.62 (0.55 – 0.70) <0.0001*
Single other viruses 6,099 (84.2) 3664 (85.4) 2,435 (82.5)
Single SeasFlu A 726 (88.1) 93 (80.9) 633 (89.3)* 0.73 (0.46 - 1.17) 0.20 2.37 (1.85 - 3.04) <0.0001* 1.17 (0.93 – 1.47) 0.17
Single other viruses 7,283 (81.6) 3,886 (85.2) 3,397 (77.8)
Single Flu B 482 (83.4) 106 (84.1) 376 (83.2)* 0.92 (0.57 - 1.50) 0.75 1.31 (1.01 - 1.70) 0.04* 1.23 (0.97 – 1.56) 0.08
Single other viruses 7,527 (82.1) 3,873 (85.2) 3,654 (79.1)
Single RSV 1,757 (86.2)* 1,613 (86.4)* 144 (84.7) 1.18 (1.0 - 1.40) 0.05* 1.45 (0.95 - 2.21) 0.09 1.49 (1.28 – 1.73) <0.0001*
Single other viruses 6,252 (81.1) 2,366 (84.3) 2,366 (84.3)
Single RV 2,182 (81.6) 1,218 (84.2) 964 (78.6) 0.90 (0.76 - 1.07) 0.25 0.93 (0.80 - 1.10) 0.38 0.98 (0.87 – 1.10) 0.77
Single other viruses 5,827(82.4) 2,761 (85.5) 3,066 (79.7)
Single AdV 281 (82.7) 190 (86.8) 91 (75.2 ) 1.15 (0.77 - 1.72) 0.49 0.78 (0.51 - 1.18) 0.25 1 .03 (0.77 – 1.38) 0.83
Single other viruses 7,728 (82.2) 3,789 (85.1) 3,939 (79.5)
Single hMPV 341 (84.4) 234 (85.1) 107 (83.0) 1.10 (0.71 - 1.40) 0.99 1.27 (0.80 - 2.80 0.32 1.20 (0.91 – 1.58) 0.2
Single other viruses 7,668 (82.1) 3,745 (85.1) 3,923 (79.4)
Single hPIV1-3 330 (85.7)* 210 (86.4) 120. (84.5) 1.12 (0.77 - 1.63) 0.56 1.42 (0.90 - 2.26) 0.13 1.34 (1.003 – 1.80) 0.05*
Single other viruses 7,679 (82.0) 3,769 (85.1) 3,910 (79.3)
Notes: In comparisons among single infections, the risk of admission to a general ward in the primary virus (e.g. RSV single infections) was compared with the risk in all other
respiratory virus single infections as a baseline. On the other hand, in crude analysis of risk in single vs. multiple infections, the risk in single infections was used as the baseline. *
- the p value was statistically significant at α = <0.05, Flu Apdm09 - Pandemic influenza A(H1N1)pdm09, SeasFlu A - seasonal influenza A viruses, Flu B - influenza B virus,
RSV - respiratory syncytial virus, RV - rhinovirus, AdV - adenovirus, hMPV - human metapneumovirus, hPIV1-3 - human parainfluenza virus types 1 to 3. Adjustment was for
age group and season.
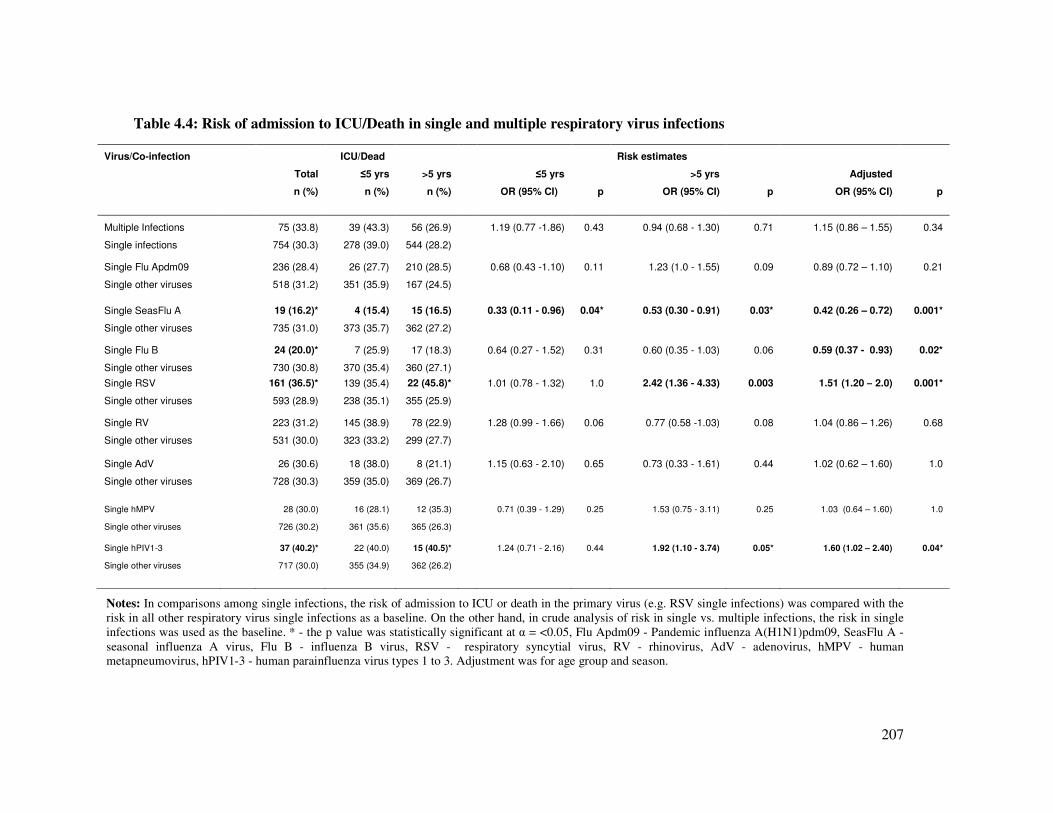
207
Table 4.4: Risk of admission to ICU/Death in single and multiple respiratory virus infections
Virus/Co-infection
ICU/Dead
Risk estimates
Total ≤5 yrs >5 yrs
≤5 yrs
>5 yrs
Adjusted
n (%) n (%) n (%)
OR (95% CI) p OR (95% CI) p OR (95% CI) p
Multiple Infections 75 (33.8) 39 (43.3) 56 (26.9) 1.19 (0.77 -1.86) 0.43 0.94 (0.68 - 1.30) 0.71 1.15 (0.86 – 1.55) 0.34
Single infections 754 (30.3) 278 (39.0) 544 (28.2)
Single Flu Apdm09 236 (28.4) 26 (27.7) 210 (28.5) 0.68 (0.43 -1.10) 0.11 1.23 (1.0 - 1.55) 0.09 0.89 (0.72 – 1.10) 0.21
Single other viruses 518 (31.2) 351 (35.9) 167 (24.5)
Single SeasFlu A 19 (16.2)* 4 (15.4) 15 (16.5) 0.33 (0.11 - 0.96) 0.04* 0.53 (0.30 - 0.91) 0.03* 0.42 (0.26 – 0.72) 0.001*
Single other viruses 735 (31.0) 373 (35.7) 362 (27.2)
Single Flu B 24 (20.0)* 7 (25.9) 17 (18.3) 0.64 (0.27 - 1.52) 0.31 0.60 (0.35 - 1.03) 0.06 0.59 (0.37 - 0.93) 0.02*
Single other viruses 730 (30.8) 370 (35.4) 360 (27.1)
Single RSV 161 (36.5)* 139 (35.4) 22 (45.8)* 1.01 (0.78 - 1.32) 1.0 2.42 (1.36 - 4.33) 0.003 1.51 (1.20 – 2.0) 0.001*
Single other viruses 593 (28.9) 238 (35.1) 355 (25.9)
Single RV 223 (31.2) 145 (38.9) 78 (22.9) 1.28 (0.99 - 1.66) 0.06 0.77 (0.58 -1.03) 0.08 1.04 (0.86 – 1.26) 0.68
Single other viruses 531 (30.0) 323 (33.2) 299 (27.7)
Single AdV 26 (30.6) 18 (38.0) 8 (21.1) 1.15 (0.63 - 2.10) 0.65 0.73 (0.33 - 1.61) 0.44 1.02 (0.62 – 1.60) 1.0
Single other viruses 728 (30.3) 359 (35.0) 369 (26.7)
Single hMPV 28 (30.0) 16 (28.1) 12 (35.3) 0.71 (0.39 - 1.29) 0.25 1.53 (0.75 - 3.11) 0.25 1.03 (0.64 – 1.60) 1.0
Single other viruses 726 (30.2) 361 (35.6) 365 (26.3)
Single hPIV1-3 37 (40.2)* 22 (40.0) 15 (40.5)*
1.24 (0.71 - 2.16) 0.44 1.92 (1.10 - 3.74) 0.05* 1.60 (1.02 – 2.40) 0.04*
Single other viruses 717 (30.0) 355 (34.9) 362 (26.2)
Notes: In comparisons among single infections, the risk of admission to ICU or death in the primary virus (e.g. RSV single infections) was compared with the
risk in all other respiratory virus single infections as a baseline. On the other hand, in crude analysis of risk in single vs. multiple infections, the risk in single
infections was used as the baseline. * - the p value was statistically significant at α = <0.05, Flu Apdm09 - Pandemic influenza A(H1N1)pdm09, SeasFlu A -
seasonal influenza A virus, Flu B - influenza B virus, RSV - respiratory syncytial virus, RV - rhinovirus, AdV - adenovirus, hMPV - human
metapneumovirus, hPIV1-3 - human parainfluenza virus types 1 to 3. Adjustment was for age group and season.
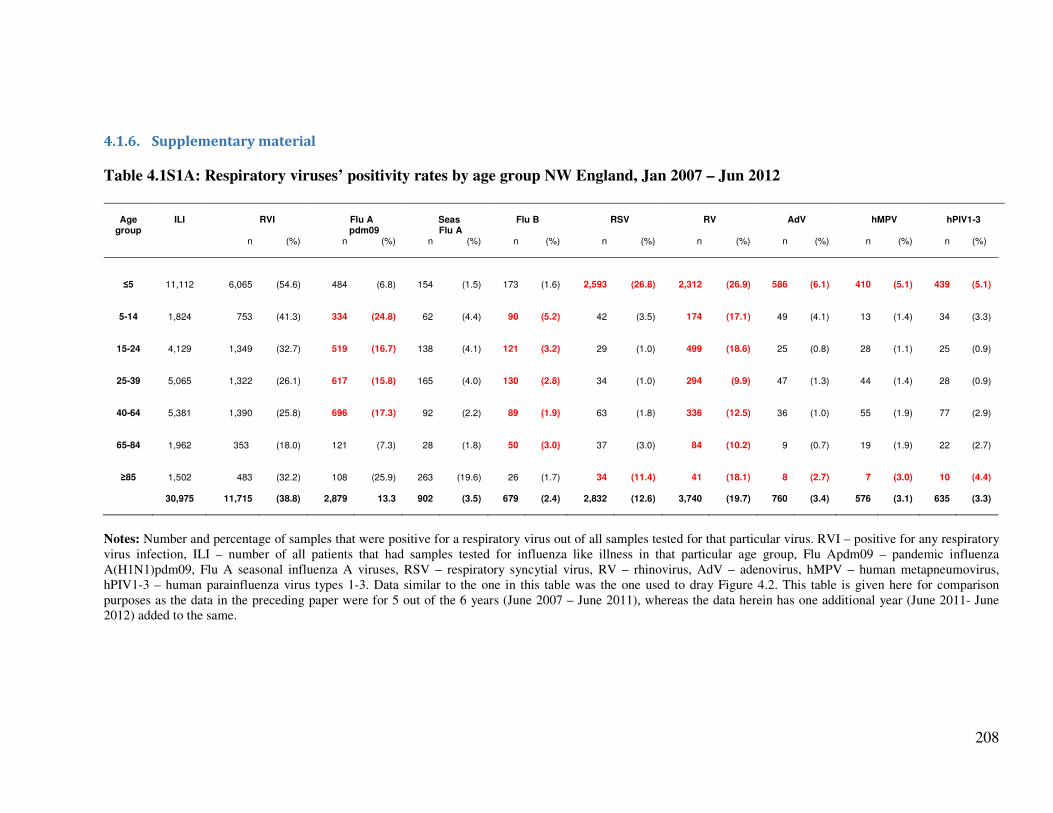
208
4.1.6. Supplementary material
Table 4.1S1A: Respiratory viruses’ positivity rates by age group NW England, Jan 2007 – Jun 2012
Age
group
ILI
RVI
Flu A
pdm09
Seas Flu A
Flu B
RSV
RV
AdV
hMPV
hPIV1-3
n
(%)
n
(%)
n
(%)
n
(%)
n
(%)
n
(%)
n
(%)
n
(%)
n
(%)
≤5 11,112 6,065 (54.6) 484 (6.8) 154 (1.5) 173 (1.6) 2,593 (26.8) 2,312 (26.9) 586 (6.1) 410 (5.1) 439 (5.1)
5-14 1,824
753 (41.3) 334 (24.8) 62 (4.4) 90 (5.2) 42 (3.5) 174 (17.1) 49 (4.1) 13 (1.4) 34 (3.3)
15-24 4,129 1,349 (32.7) 519 (16.7) 138 (4.1) 121 (3.2) 29 (1.0) 499 (18.6) 25 (0.8) 28 (1.1) 25 (0.9)
25-39 5,065 1,322 (26.1) 617 (15.8) 165 (4.0) 130 (2.8) 34 (1.0) 294 (9.9) 47 (1.3) 44 (1.4) 28 (0.9)
40-64 5,381 1,390 (25.8) 696 (17.3) 92 (2.2) 89 (1.9) 63 (1.8) 336 (12.5) 36 (1.0) 55 (1.9) 77 (2.9)
65-84 1,962
353 (18.0) 121 (7.3) 28 (1.8) 50 (3.0) 37 (3.0) 84 (10.2) 9 (0.7) 19 (1.9) 22 (2.7)
≥85 1,502
483 (32.2) 108 (25.9) 263 (19.6) 26 (1.7) 34 (11.4) 41 (18.1) 8 (2.7) 7 (3.0) 10 (4.4)
30,975 11,715 (38.8) 2,879 13.3 902 (3.5) 679 (2.4) 2,832 (12.6) 3,740 (19.7) 760 (3.4) 576 (3.1) 635 (3.3)
Notes: Number and percentage of samples that were positive for a respiratory virus out of all samples tested for that particular virus. RVI – positive for any respiratory
virus infection, ILI – number of all patients that had samples tested for influenza like illness in that particular age group, Flu Apdm09 – pandemic influenza
A(H1N1)pdm09, Flu A seasonal influenza A viruses, RSV – respiratory syncytial virus, RV – rhinovirus, AdV – adenovirus, hMPV – human metapneumovirus,
hPIV1-3 – human parainfluenza virus types 1-3. Data similar to the one in this table was the one used to dray Figure 4.2. This table is given here for comparison
purposes as the data in the preceding paper were for 5 out of the 6 years (June 2007 – June 2011), whereas the data herein has one additional year (June 2011- June
2012) added to the same.
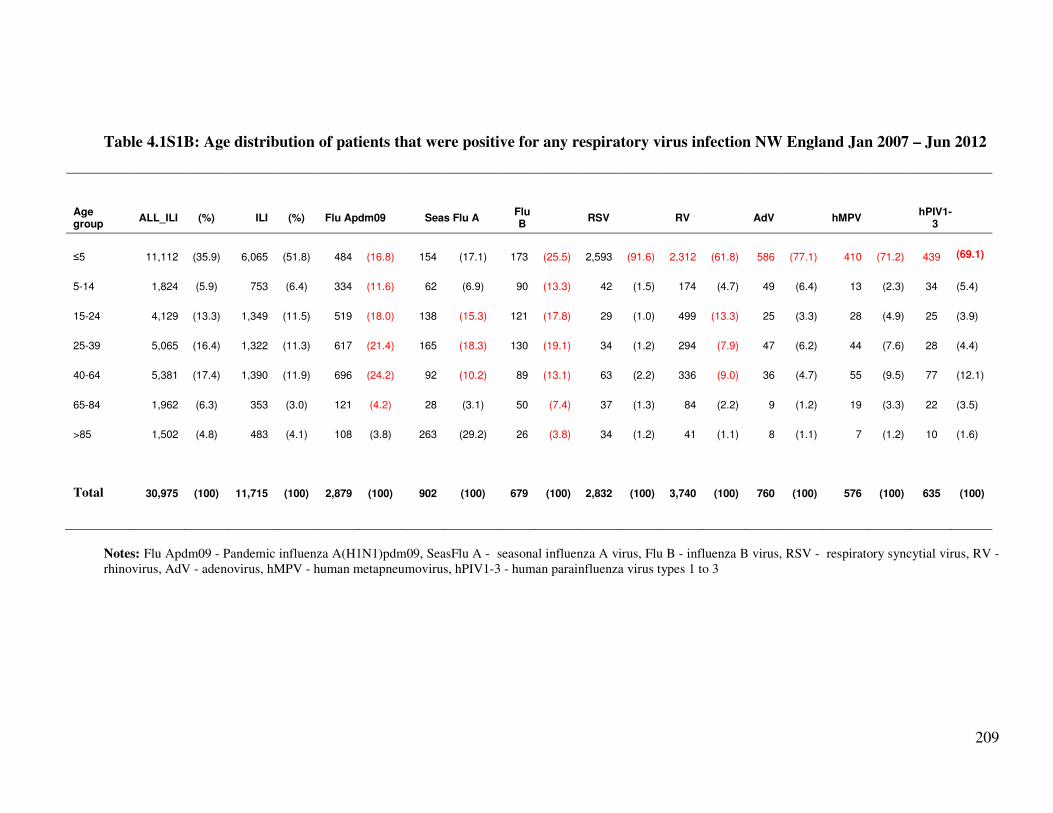
209
Table 4.1S1B: Age distribution of patients that were positive for any respiratory virus infection NW England Jan 2007 – Jun 2012
Age group
ALL_ILI (%) ILI (%) Flu Apdm09 Seas Flu A Flu B
RSV
RV
AdV
hMPV
hPIV1-3
≤5 11,112 (35.9)
6,065 (51.8) 484 (16.8) 154 (17.1) 173 (25.5) 2,593 (91.6) 2,312 (61.8) 586 (77.1) 410 (71.2) 439
(69.1)
5-14 1,824 (5.9) 753 (6.4) 334 (11.6) 62 (6.9) 90 (13.3) 42 (1.5) 174 (4.7) 49 (6.4) 13 (2.3) 34 (5.4)
15-24 4,129 (13.3)
1,349 (11.5) 519 (18.0) 138 (15.3) 121 (17.8) 29 (1.0) 499 (13.3) 25 (3.3) 28 (4.9) 25 (3.9)
25-39 5,065 (16.4)
1,322 (11.3) 617 (21.4) 165 (18.3) 130 (19.1) 34 (1.2) 294 (7.9) 47 (6.2) 44 (7.6) 28 (4.4)
40-64 5,381 (17.4)
1,390 (11.9) 696 (24.2) 92 (10.2) 89 (13.1) 63 (2.2) 336 (9.0) 36 (4.7) 55 (9.5) 77 (12.1)
65-84 1,962 (6.3) 353 (3.0) 121 (4.2) 28 (3.1) 50 (7.4) 37 (1.3) 84 (2.2) 9 (1.2) 19 (3.3) 22 (3.5)
>85 1,502 (4.8) 483 (4.1) 108 (3.8) 263 (29.2) 26 (3.8) 34 (1.2) 41 (1.1) 8 (1.1) 7 (1.2) 10 (1.6)
Total 30,975 (100)
11,715 (100) 2,879 (100) 902 (100) 679 (100) 2,832 (100) 3,740 (100) 760 (100) 576 (100) 635 (100)
Notes: Flu Apdm09 - Pandemic influenza A(H1N1)pdm09, SeasFlu A - seasonal influenza A virus, Flu B - influenza B virus, RSV - respiratory syncytial virus, RV -
rhinovirus, AdV - adenovirus, hMPV - human metapneumovirus, hPIV1-3 - human parainfluenza virus types 1 to 3
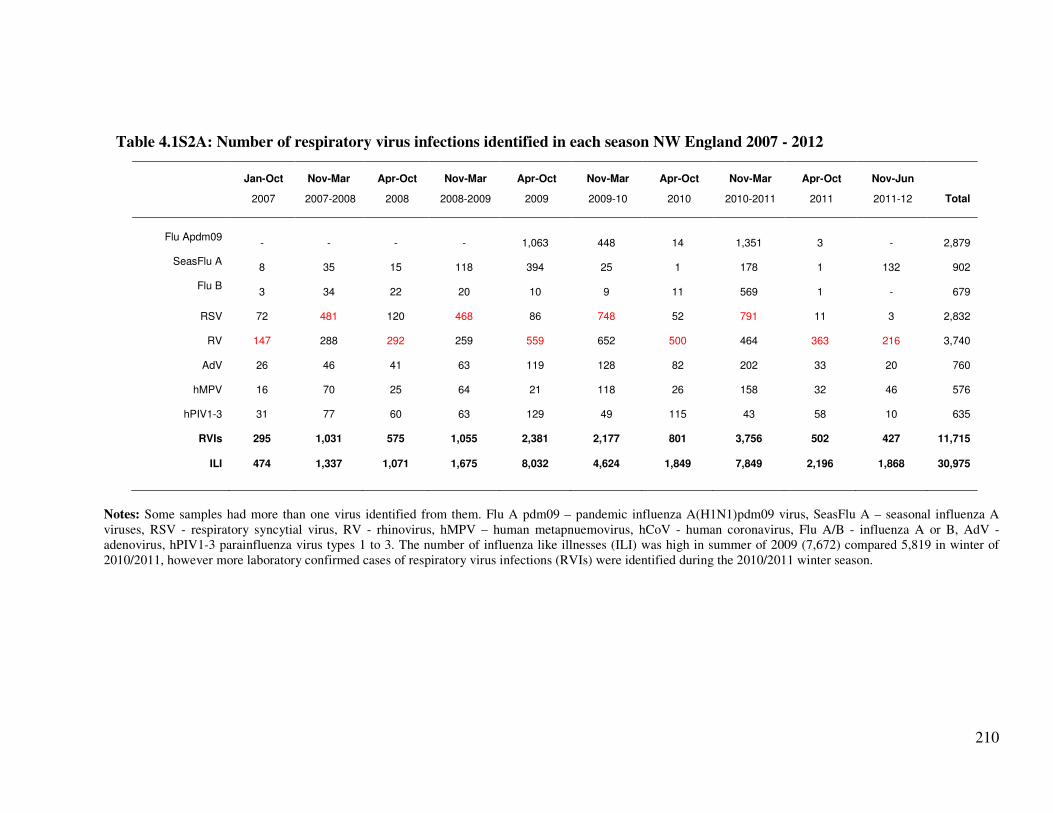
210
Table 4.1S2A: Number of respiratory virus infections identified in each season NW England 2007 - 2012
Jan-Oct Nov-Mar Apr-Oct Nov-Mar Apr-Oct Nov-Mar Apr-Oct Nov-Mar Apr-Oct Nov-Jun
2007
2007-2008
2008
2008-2009
2009
2009-10
2010
2010-2011
2011
2011-12
Total
Flu Apdm09
-
-
-
-
1,063
448
14
1,351
3
-
2,879
SeasFlu A
8
35
15
118
394
25
1
178
1
132
902
Flu B
3
34
22
20
10
9
11
569
1 -
679
RSV
72
481
120
468
86
748
52
791
11
3
2,832
RV
147
288
292
259
559
652
500
464
363
216
3,740
AdV
26
46
41
63
119
128
82
202
33
20
760
hMPV
16
70
25
64
21
118
26
158
32
46
576
hPIV1-3
31
77
60
63
129
49
115
43
58
10
635
RVIs
295
1,031
575
1,055
2,381
2,177
801
3,756
502
427
11,715
ILI
474
1,337
1,071
1,675
8,032
4,624
1,849
7,849
2,196
1,868
30,975
Notes: Some samples had more than one virus identified from them. Flu A pdm09 – pandemic influenza A(H1N1)pdm09 virus, SeasFlu A – seasonal influenza A
viruses, RSV - respiratory syncytial virus, RV - rhinovirus, hMPV – human metapnuemovirus, hCoV - human coronavirus, Flu A/B - influenza A or B, AdV -
adenovirus, hPIV1-3 parainfluenza virus types 1 to 3. The number of influenza like illnesses (ILI) was high in summer of 2009 (7,672) compared 5,819 in winter of
2010/2011, however more laboratory confirmed cases of respiratory virus infections (RVIs) were identified during the 2010/2011 winter season.
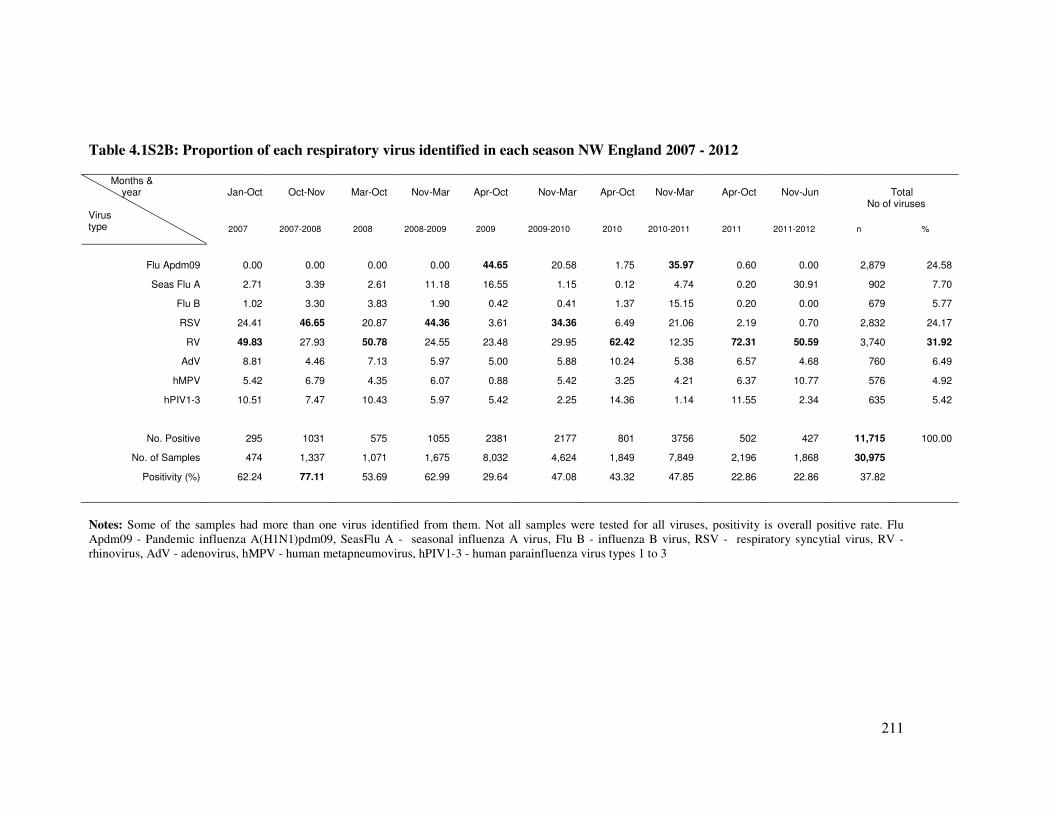
211
Table 4.1S2B: Proportion of each respiratory virus identified in each season NW England 2007 - 2012
Months & year Virus type
Jan-Oct
Oct-Nov
Mar-Oct
Nov-Mar
Apr-Oct
Nov-Mar
Apr-Oct
Nov-Mar
Apr-Oct
Nov-Jun
Total
No of viruses
2007
2007-2008
2008
2008-2009
2009
2009-2010
2010
2010-2011
2011
2011-2012
n
%
Flu Apdm09 0.00 0.00 0.00 0.00 44.65 20.58 1.75 35.97 0.60 0.00 2,879 24.58
Seas Flu A 2.71 3.39 2.61 11.18 16.55 1.15 0.12 4.74 0.20 30.91 902 7.70
Flu B 1.02 3.30 3.83 1.90 0.42 0.41 1.37 15.15 0.20 0.00 679 5.77
RSV 24.41 46.65 20.87 44.36 3.61 34.36 6.49 21.06 2.19 0.70 2,832 24.17
RV 49.83 27.93 50.78 24.55 23.48 29.95 62.42 12.35 72.31 50.59 3,740 31.92
AdV 8.81 4.46 7.13 5.97 5.00 5.88 10.24 5.38 6.57 4.68 760 6.49
hMPV 5.42 6.79 4.35 6.07 0.88 5.42 3.25 4.21 6.37 10.77 576 4.92
hPIV1-3 10.51 7.47 10.43 5.97 5.42 2.25 14.36 1.14 11.55 2.34 635 5.42
No. Positive 295 1031 575 1055 2381 2177 801 3756 502 427 11,715 100.00
No. of Samples 474 1,337 1,071 1,675 8,032 4,624 1,849 7,849 2,196 1,868 30,975
Positivity (%) 62.24 77.11 53.69 62.99 29.64 47.08 43.32 47.85 22.86 22.86 37.82
Notes: Some of the samples had more than one virus identified from them. Not all samples were tested for all viruses, positivity is overall positive rate. Flu
Apdm09 - Pandemic influenza A(H1N1)pdm09, SeasFlu A - seasonal influenza A virus, Flu B - influenza B virus, RSV - respiratory syncytial virus, RV -
rhinovirus, AdV - adenovirus, hMPV - human metapneumovirus, hPIV1-3 - human parainfluenza virus types 1 to 3
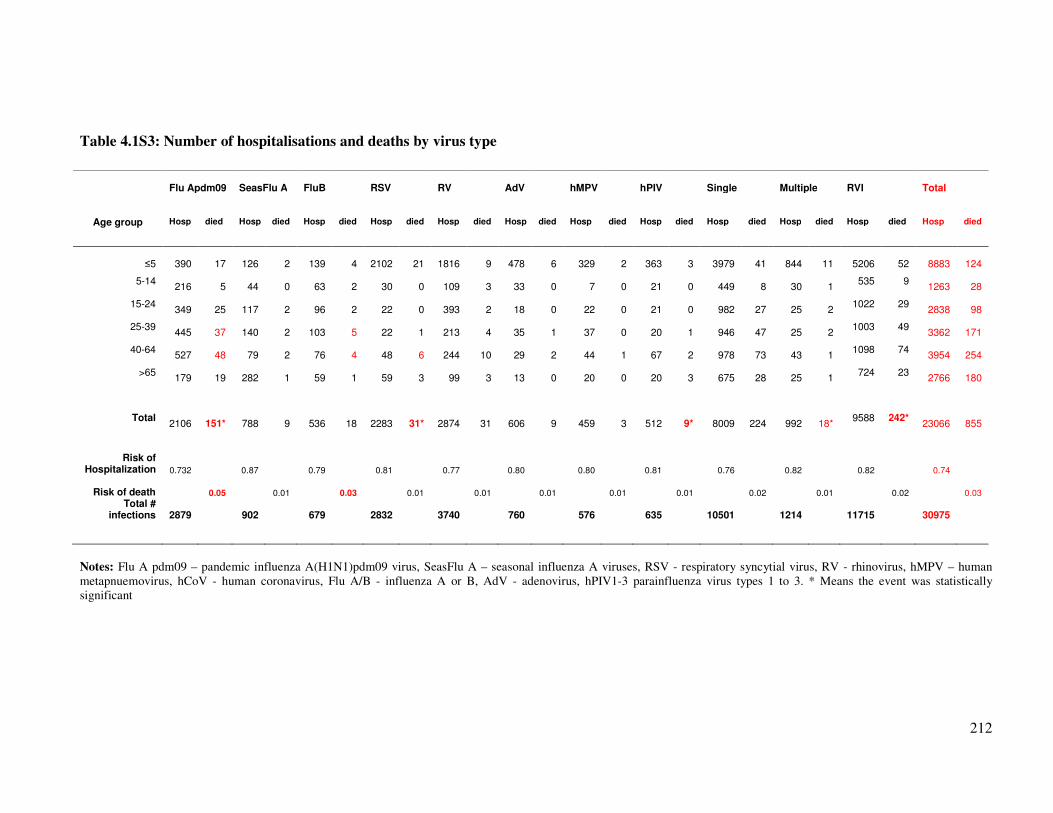
212
Table 4.1S3: Number of hospitalisations and deaths by virus type
Flu Apdm09 SeasFlu A FluB RSV RV AdV hMPV hPIV Single Multiple RVI Total
Age group Hosp died Hosp died Hosp died Hosp died Hosp died Hosp died Hosp died Hosp died Hosp died Hosp died Hosp died Hosp died
≤5 390 17 126 2 139 4 2102 21 1816 9 478 6 329 2 363 3 3979 41 844 11
5206
52 8883 124
5-14 216 5 44 0 63 2 30 0 109 3 33 0 7 0 21 0 449 8 30 1
535 9 1263 28
15-24 349 25 117 2 96 2 22 0 393 2 18 0 22 0 21 0 982 27 25 2
1022 29 2838 98
25-39 445 37 140 2 103 5 22 1 213 4 35 1 37 0 20 1 946 47 25 2
1003 49 3362 171
40-64 527 48 79 2 76 4 48 6 244 10 29 2 44 1 67 2 978 73 43 1
1098 74 3954 254
>65 179 19 282 1 59 1 59 3 99 3 13 0 20 0 20 3 675 28 25 1
724 23 2766 180
Total 2106 151* 788 9 536 18 2283 31* 2874 31 606 9 459 3 512 9* 8009 224 992 18*
9588 242* 23066 855
Risk of Hospitalization 0.732 0.87 0.79 0.81 0.77 0.80 0.80 0.81 0.76 0.82 0.82 0.74
Risk of death
0.05
0.01
0.03
0.01
0.01
0.01
0.01
0.01
0.02
0.01
0.02
0.03
Total # infections 2879
902
679
2832
3740
760
576
635 10501
1214
11715
30975
Notes: Flu A pdm09 – pandemic influenza A(H1N1)pdm09 virus, SeasFlu A – seasonal influenza A viruses, RSV - respiratory syncytial virus, RV - rhinovirus, hMPV – human
metapnuemovirus, hCoV - human coronavirus, Flu A/B - influenza A or B, AdV - adenovirus, hPIV1-3 parainfluenza virus types 1 to 3. * Means the event was statistically
significant
213
4.2. Co-infections and risk of hospitalization and mortality Part B: Influenza A
viruses dual and multiple infections with other respiratory viruses and risk
of hospitalization and mortality
Synopsis
This is the authors’ version of the paper published in Influenza and other Respiratory
viruses. Reprint of Goka et al., (338). doi: 10.1111/irv.12020. Epub 19 October 2012.
Reproduced with permission from John Wiley & Sons Ltd, Copyright Licence number
3273250460066. This paper discusses the co-infection pattern between influenza A viruses and
other respiratory viruses and how that affected disease outcome. Similar to the preceding paper,
the data here were for samples, tested at the Manchester Microbiology Partnership Laboratory
(MMPL) between January 2007 and June 2012.
214
4.2.1. Abstract
Influenza A viruses dual and multiple infections with other respiratory
viruses and risk of hospitalization and mortality
Goka E.A1, Vallely P.J 1, Mutton K.J 1, 2, Klapper P.E 1, 2
1: Institute of Inflammation and Repair, University of Manchester,
2: Clinical Virology, Central Manchester University Hospitals - NHS Foundation Trust
Correspondence author: E. A. Goka: Institute of Inflammation and Repair, Faculty of Medical and Human Sciences,
1st Floor Stopford building, University of Manchester, Oxford Road, Manchester, M13 9PL, UK. Email:
Introduction: Recent literature suggests that dual or multiple virus infections may affect disease
severity. However, few studies have investigated the effect of co-infection in influenza A
viruses.
Objectives: To identify the association between influenza A viruses and respiratory viruses co-
infections with disease outcome.
Methodology: Electronic data of results of samples from North West England tested between
January 2007 and June 2011 was analysed for patterns of co-infection between influenza A
viruses and 8 respiratory viruses. Risk of hospitalization to ICU or GW in single vs. co-
infections was assessed using logistic regression.
Results: Of the 25,596 samples analysed for respiratory viruses 40.7% (10,501) were positive
for any virus. Co-infections were detected in 4.7% (137/2,879) of all patients with influenza
A(H1N1)pdm09, and 7.3% (57/779) of those with other influenza A viruses infections. Co-
infection between seasonal influenza viruses and influenza B virus was associated with a
significant increase in the risk of admission to ICU/death (OR: 22.0, 95% CI: 2.21 – 219.8, p =
0.008). RSV/Flu A co-infection also increased this risk but was not statistically significant. For
influenza A(H1N1)pdm09, RSV and AdV co-infection increased risk of hospitalization to
general ward whereas Flu B increased risk of admission to ICU, but all of these were not
statistically significant.
Conclusion: Co-infection is a significant predictor of disease outcome; integration of respiratory
viruses’ co-infections into public health reports could also contribute to the building up of
evidence. Research on combined treatment, introduction of an integrated vaccine for all
respiratory viruses and development of multi-target rapid diagnostic tests is recommended.
Key words: Co-infection, dual or multiple infections, influenza A viruses, respiratory virus
infections, respiratory syncytial virus, rhinovirus.
215
4.2.2. Introduction
Influenza virus and other acute respiratory tract infections (ARIs) cause considerable mortality
and morbidity worldwide with each winter season having between 10% and 20% of populations
suffering from influenza (1) and at least 2.2 million deaths occurring from ARI throughout the
world (3). In the United States of America (USA), influenza is responsible for 20-40 million
outpatient visits, 330,000 hospitalizations and 30,000 deaths annually (8). Whereas a UK study
study estimated that influenza causes between 779,000 and 1,164,000 general practice
consultations, 19,000 and 31,200 hospital admissions and 18,500 and 24,800 deaths per annum
(7).
Although respiratory viral infections have traditionally been thought to be caused by single
viruses, an increasing number of reports have reported respiratory viruses occurring as dual or
multiple virus infections (75-77;79-82;86;513;541). There are suggestions that respiratory viral
co-infections affect disease severity with some studies suggesting that dual and multiple
infections increase severity of respiratory disease (75-77;86;513), while others have found either
no association (560;578;593;608;609), or that dual or multiple infection may actually be
protective (82). Influenza A viruses cause varying disease severity in different persons. For
example, the pandemic influenza A(H1N1)pdm09 virus caused widely differing outcomes
ranging from mild respiratory illness to severe disease or death in some cases (278;610). Thus
whilst there is currently some conflicting data on the subject, most studies have been in infants
less than 1 year old where the infection pattern is different from adults (due to pre-existing
passive immunity in adults) and very few studies have investigated the effect of co-infection in
influenza A viruses on disease outcome. This study aimed to identify the association between the
pandemic influenza A(H1N1)pdm09 and seasonal influenza A viruses, dual or multiple
infections with other respiratory viruses and severity of influenza disease.
4.2.3. Methodology
4.2.3.1. Study Design and setting
Electronic data on samples that were sent to the Manchester Microbiology Partnership
Laboratory (MMPL) in the North West of England, for viral detection, between 1st January,
2007 and 23rd June, 2011, was interrogated to determine the association between a positive
diagnosis of influenza A(H1N1)pdm09 or other influenza A viruses, and influenza B virus (Flu
B) or other respiratory viruses including respiratory syncytial virus (RSV), rhinoviruses (RV),
adenoviruses (AdV) and parainfluenza viruses 1-3 (hPIV1-3), and severity of influenza disease.
The MMPL is a reference virology laboratory for the North West region of England receiving
216
respiratory viral samples from all hospitals, medical centres and surgeries located in the region
and caters for a population of 6.9 million people (101).
The database records only results for samples from patients whose reason for admission or
medical consultation was due to respiratory virus infection. Apart from indicating types of all
tests that were requested and results of testing, the database also contains information on
patients’ age (in years), date sample was collected and date received, medical facility which
submitted the sample or the secondary locations and the type of sample that was submitted. A
one step reverse transcriptase real-time polymerase chain reaction (RT-PCR) protocol was used
in the identification of respiratory viruses. Nucleic acid was extracted from samples using the
Qiagen total nucleic acid extraction kit run on the Qiagen Biorobot MDX (Qiagen, Crawley,
United Kingdom). Reverse transcription was accomplished using the Invitrogen Superscipt III
platinum one step RT-PCR Kit (Invitrogen, Paisley, United Kingdom). Influenza A and B
viruses were tested using a duplex assay and additionally for influenza A (H1N1) using the
Health Protection Agency (HPA (H1)v) assay (102). Duplex assays of well characterised ‘in-
house’ RT-PCR assays (unpublished) were used for the identification of respiratory syncytial
virus, metapneumoviruses, adenoviruses, rhinoviruses and triplex assays for parainfluenza
viruses 1-3. All the PCRs were run on the ABI7500 real-time PCR instrument (Applied
Biosystems, Warrington, United Kingdom). Positive amplification was determined using
amplicon specific probes labelled with MGB or TAMRA (Applied Biosystems). Samples that
were submitted by attending physicians for respiratory virus identification included: nose and
throat swabs (VNT), throat swabs (VTS), nasopharyngeal aspirates (VNPA), and other types of
swabs taken from the mouth and nose area (VSW).
All patients with a positive polymerase chain reaction (PCR) test for influenza A(H1N1)pdm09
virus or seasonal influenza A viruses who were hospitalized, seen as outpatients, or who died
within the study period were eligible for inclusion. All entries where outcome datum was
missing i.e. either because PCR test was not performed, or where there was insufficient sample,
were excluded from the analysis. In addition, for the calculation of measures of association,
entries that did not have information as to whether the patient was seen as an outpatient,
admitted to general ward, or the ICU were omitted.
217
4.2.3.2. Statistical analysis
Descriptive statistics were computed to describe co-infection patterns among different age and
sex and differences calculated using Pearson’s Chi square (�2) statistic. The measure of
outcome was the risk of hospitalization to a general ward or the ICU or death and the exposure
of interest was whether or not the patient had dual or multiple respiratory viral infections.
Association between influenza A viruses and respiratory viruses co-infection and risk of
hospitalization and admission to ICU or death were assessed using simple logistic regression
models. Further, multivariate logistic regression models, including age and interaction term as
covariates, were employed and the significance of the covariate assessed using the likelihood
ratio test. For each of the co-infections with respiratory viruses, separate multivariate logistic
models, controlling for age and an interaction term between age and co-infections, were applied
to assess the risk of hospitalization using other respiratory virus single infections as the baseline.
Results are presented as odds ratios (ORs) with 95% confidence intervals (CIs) with significance
level of p = 0.05. All analyses were done using the STATA software, version 11.0.
(STATACorp, Texas 77845, USA).
The study received ethical approval (National Health Service - Research Ethics Committee
(NHS-REC), reference number 11/NW/0698) and the University of Manchester Research Ethics
Office. In addition, the Central Manchester Universities Hospitals NHS Foundation Trust also
granted Research and Development approval for this project (reference number R01835).
4.2.4. Results
4.2.4.1. Identification of influenza and respiratory viral infections Jan 2007 – June 2011
Of the 27,575 samples that were received at the MMPL between the 10th of January 2007 and
23rd of June 2011, a large proportion 25,596 (92.8%) had complete information on the RT-PCR
results on respiratory viral infections and were included in the analysis, 1,979 (7.2%) had this
information missing and were excluded. Of the 25,596 samples included in this study, 40.7%
(10,501) were positive for any of the respiratory virus of which 14.4% (3,658/25,489) were
positive in a generic influenza A PCR with 2,879 typed as influenza A(H1N1)pdm09 virus and
779 as seasonal influenza A viruses. The positivity rates for the other respiratory infections
were: influenza B 2.7% (679/25,043), RV 20.9% (3,262/15,635), RSV 14.8% (2,825/19,067),
AdV 3.9% (738/18,890), hMPV 3.4% (530/15,586), hPIV1 - 1.1% (175/15,662), hPIV2 – V
0.8% (119/15,660) and hPIV3 - 2.8% (436/15,660) – Figure 4.1.
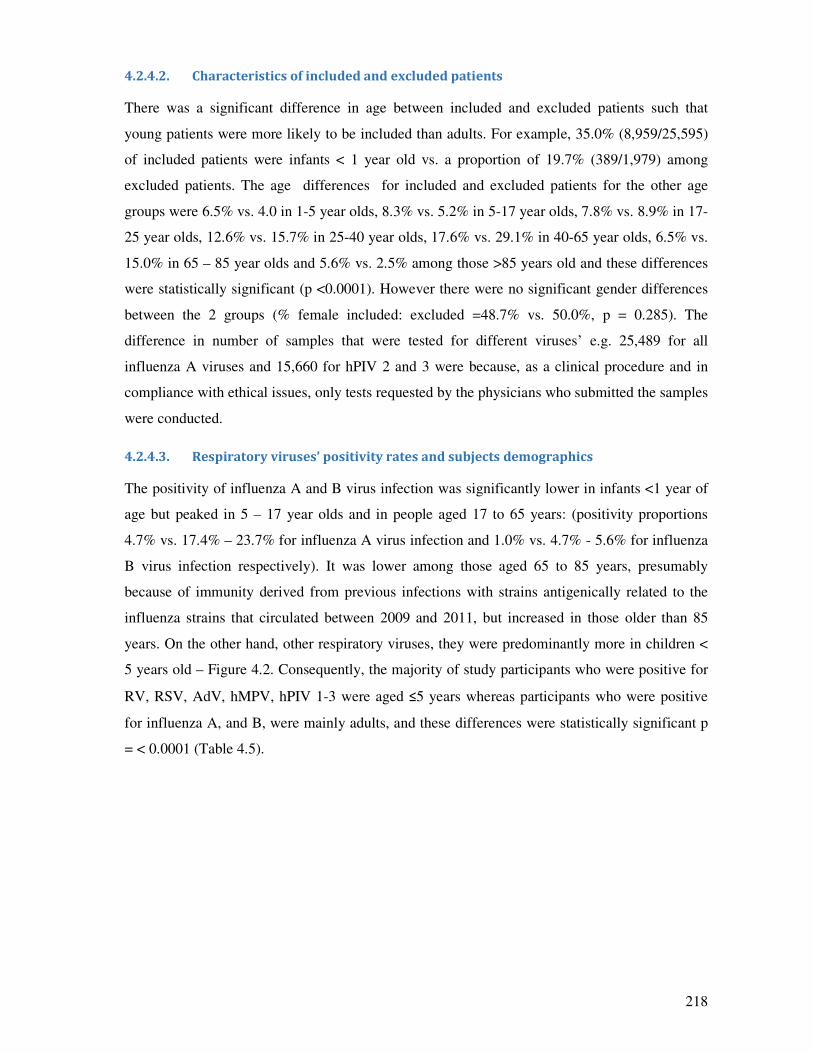
218
4.2.4.2. Characteristics of included and excluded patients
There was a significant difference in age between included and excluded patients such that
young patients were more likely to be included than adults. For example, 35.0% (8,959/25,595)
of included patients were infants < 1 year old vs. a proportion of 19.7% (389/1,979) among
excluded patients. The age differences for included and excluded patients for the other age
groups were 6.5% vs. 4.0 in 1-5 year olds, 8.3% vs. 5.2% in 5-17 year olds, 7.8% vs. 8.9% in 17-
25 year olds, 12.6% vs. 15.7% in 25-40 year olds, 17.6% vs. 29.1% in 40-65 year olds, 6.5% vs.
15.0% in 65 – 85 year olds and 5.6% vs. 2.5% among those >85 years old and these differences
were statistically significant (p <0.0001). However there were no significant gender differences
between the 2 groups (% female included: excluded =48.7% vs. 50.0%, p = 0.285). The
difference in number of samples that were tested for different viruses’ e.g. 25,489 for all
influenza A viruses and 15,660 for hPIV 2 and 3 were because, as a clinical procedure and in
compliance with ethical issues, only tests requested by the physicians who submitted the samples
were conducted.
4.2.4.3. Respiratory viruses’ positivity rates and subjects demographics
The positivity of influenza A and B virus infection was significantly lower in infants <1 year of
age but peaked in 5 – 17 year olds and in people aged 17 to 65 years: (positivity proportions
4.7% vs. 17.4% – 23.7% for influenza A virus infection and 1.0% vs. 4.7% - 5.6% for influenza
B virus infection respectively). It was lower among those aged 65 to 85 years, presumably
because of immunity derived from previous infections with strains antigenically related to the
influenza strains that circulated between 2009 and 2011, but increased in those older than 85
years. On the other hand, other respiratory viruses, they were predominantly more in children <
5 years old – Figure 4.2. Consequently, the majority of study participants who were positive for
RV, RSV, AdV, hMPV, hPIV 1-3 were aged ≤5 years whereas participants who were positive
for influenza A, and B, were mainly adults, and these differences were statistically significant p
= < 0.0001 (Table 4.5).
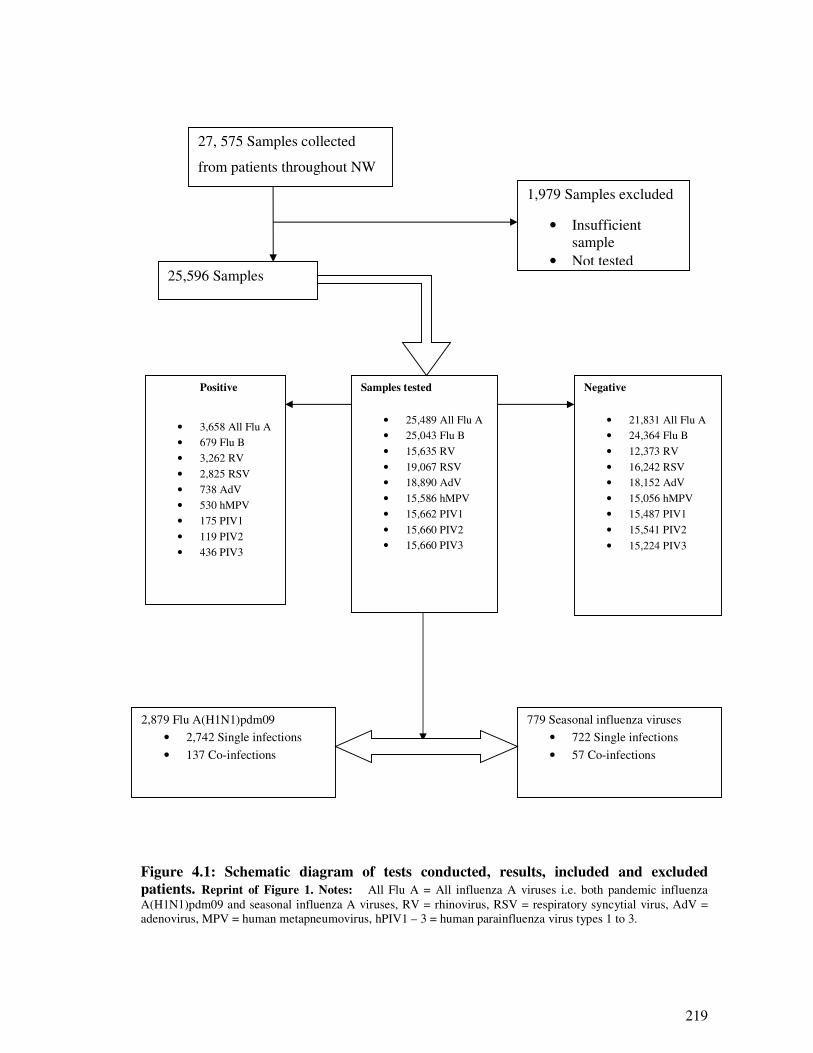
219
Figure 4.1: Schematic diagram of tests conducted, results, included and excluded
patients. Reprint of Figure 1. Notes: All Flu A = All influenza A viruses i.e. both pandemic influenza
A(H1N1)pdm09 and seasonal influenza A viruses, RV = rhinovirus, RSV = respiratory syncytial virus, AdV =
adenovirus, MPV = human metapneumovirus, hPIV1 – 3 = human parainfluenza virus types 1 to 3.
27, 575 Samples collected
from patients throughout NW
Positive
• 3,658 All Flu A
• 679 Flu B
• 3,262 RV
• 2,825 RSV
• 738 AdV
• 530 hMPV
• 175 PIV1
• 119 PIV2
• 436 PIV3
1,979 Samples excluded
• Insufficient
sample
• Not tested
Samples tested
• 25,489 All Flu A
• 25,043 Flu B
• 15,635 RV
• 19,067 RSV
• 18,890 AdV
• 15,586 hMPV
• 15,662 PIV1
• 15,660 PIV2
• 15,660 PIV3
Negative
• 21,831 All Flu A
• 24,364 Flu B
• 12,373 RV
• 16,242 RSV
• 18,152 AdV
• 15,056 hMPV
• 15,487 PIV1
• 15,541 PIV2
• 15,224 PIV3
2,879 Flu A(H1N1)pdm09
• 2,742 Single infections
• 137 Co-infections
779 Seasonal influenza viruses
• 722 Single infections
• 57 Co-infections
25,596 Samples
included
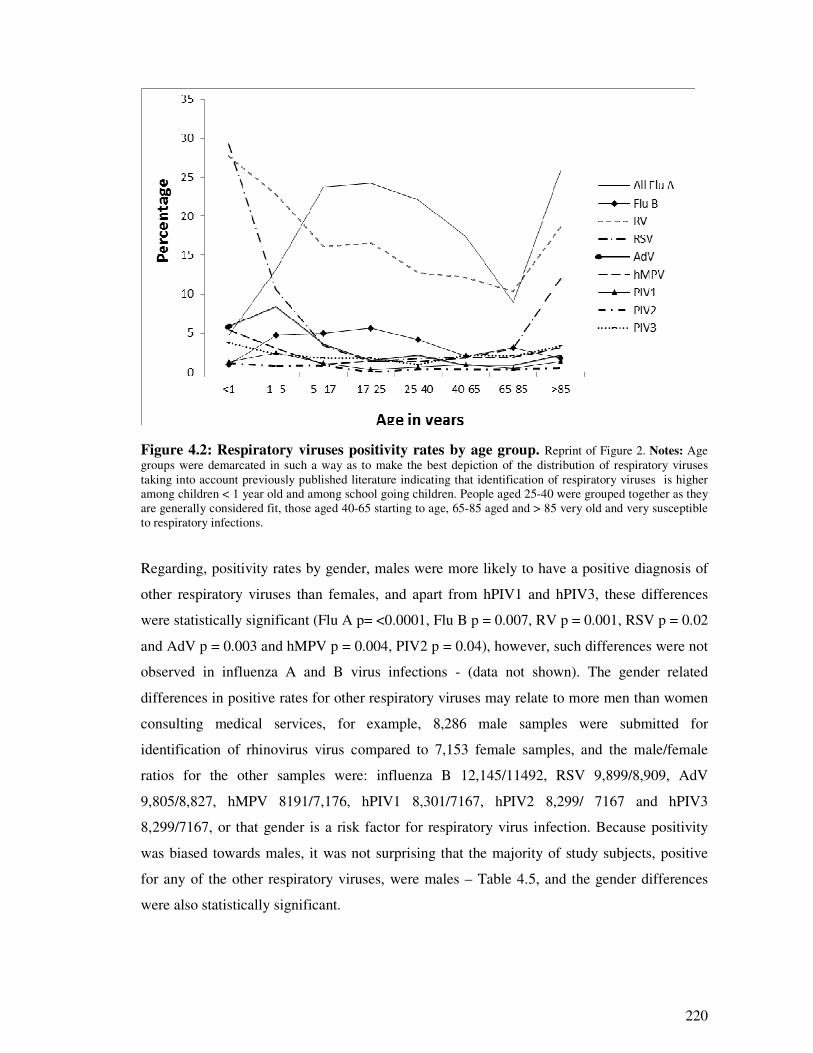
220
Figure 4.2: Respiratory viruses positivity rates by age group. Reprint of Figure 2. Notes: Age
groups were demarcated in such a way as to make the best depiction of the distribution of respiratory viruses
taking into account previously published literature indicating that identification of respiratory viruses is higher
among children < 1 year old and among school going children. People aged 25-40 were grouped together as they
are generally considered fit, those aged 40-65 starting to age, 65-85 aged and > 85 very old and very susceptible
to respiratory infections.
Regarding, positivity rates by gender, males were more likely to have a positive diagnosis of
other respiratory viruses than females, and apart from hPIV1 and hPIV3, these differences
were statistically significant (Flu A p= <0.0001, Flu B p = 0.007, RV p = 0.001, RSV p = 0.02
and AdV p = 0.003 and hMPV p = 0.004, PIV2 p = 0.04), however, such differences were not
observed in influenza A and B virus infections - (data not shown). The gender related
differences in positive rates for other respiratory viruses may relate to more men than women
consulting medical services, for example, 8,286 male samples were submitted for
identification of rhinovirus virus compared to 7,153 female samples, and the male/female
ratios for the other samples were: influenza B 12,145/11492, RSV 9,899/8,909, AdV
9,805/8,827, hMPV 8191/7,176, hPIV1 8,301/7167, hPIV2 8,299/ 7167 and hPIV3
8,299/7167, or that gender is a risk factor for respiratory virus infection. Because positivity
was biased towards males, it was not surprising that the majority of study subjects, positive
for any of the other respiratory viruses, were males – Table 4.5, and the gender differences
were also statistically significant.
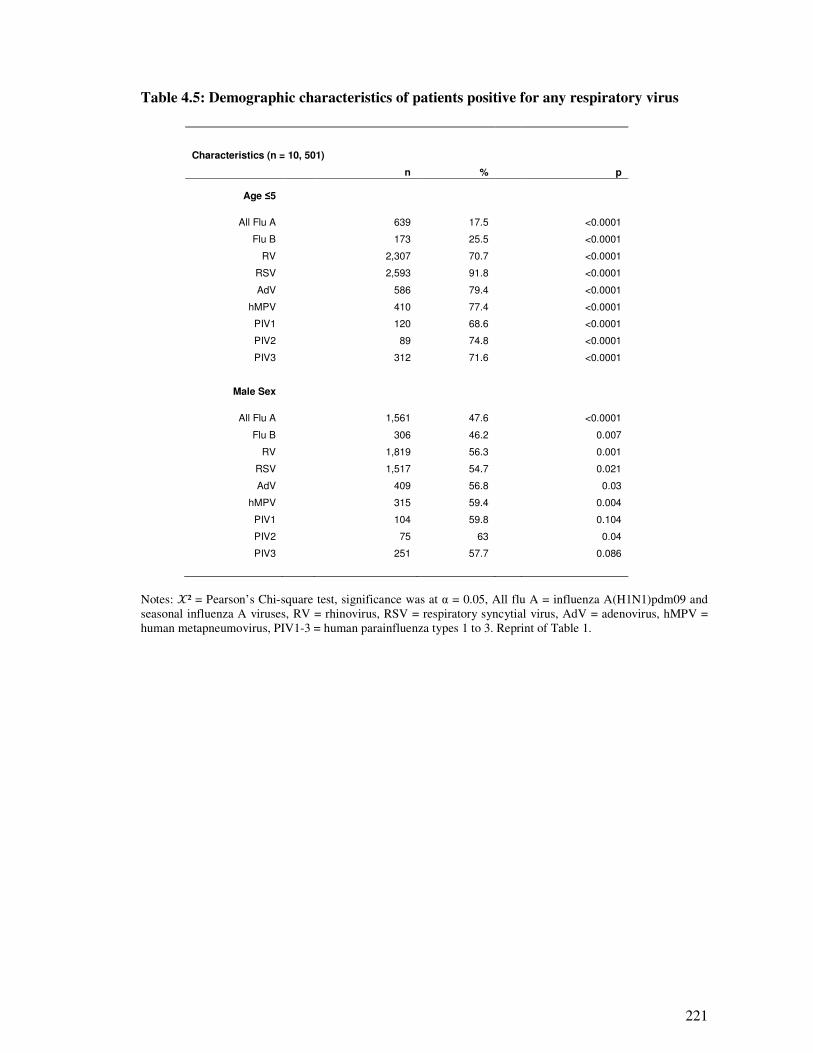
221
Table 4.5: Demographic characteristics of patients positive for any respiratory virus
Characteristics (n = 10, 501)
n % p
Age ≤5
All Flu A 639 17.5 <0.0001
Flu B 173 25.5 <0.0001
RV 2,307 70.7 <0.0001
RSV 2,593 91.8 <0.0001
AdV 586 79.4 <0.0001
hMPV 410 77.4 <0.0001
PIV1 120 68.6 <0.0001
PIV2 89 74.8 <0.0001
PIV3 312 71.6 <0.0001
Male Sex
All Flu A 1,561 47.6 <0.0001
Flu B 306 46.2 0.007
RV 1,819 56.3 0.001
RSV 1,517 54.7 0.021
AdV 409 56.8 0.03
hMPV 315 59.4 0.004
PIV1 104 59.8 0.104
PIV2 75 63 0.04
PIV3 251 57.7 0.086
Notes: �² = Pearson’s Chi-square test, significance was at α = 0.05, All flu A = influenza A(H1N1)pdm09 and
seasonal influenza A viruses, RV = rhinovirus, RSV = respiratory syncytial virus, AdV = adenovirus, hMPV =
human metapneumovirus, PIV1-3 = human parainfluenza types 1 to 3. Reprint of Table 1.
222
4.2.4.4. Respiratory viral infections yield by type of sample
Influenza viruses were mainly identified from nose and throat swabs (VNT), with half (50.3%)
of the Flu A viruses and 44.3% of Flu B viruses identified from VNT. The majority of
respiratory viruses, i.e. rhinoviruses (59.3%), RSV (74.9%), AdV (53.9%), hMPV (66.0%) and
hPIV 1-3 (47.4% - 72.3%), were identified from nasopharyngeal aspirates (VNPA). Swabs
where the site of swabbing was not given (VSW) and throat swabs (VTS) yielded almost equal
proportions of influenza and respiratory viruses. This trend is probably because more VNTs
were obtained from adults. The physiological changes of the nasopharynx (narrowing of the
orifice) and other morphological changes beginning at six (6) months and continuing through
adolescence make it painful to draw adequate nasopharyngeal aspirates in adults (611).
4.2.4.5. Seasonal distribution of respiratory viral infections
Influenza A viruses, rhinoviruses and adenoviruses showed no distinct seasonal patterns.
Specifically, there was little influenza A activity during the 2007/2008 summer season and
2008/2009 winter seasons. However, from April, 2009, a rise in the number of influenza A
viruses was noted coinciding with the WHO declaration of the influenza A(H1N1)pdm09
pandemic. There was little influenza activity between April and October 2010 but the virus
returned in the 2010/2011 winter season. Influenza B virus activity, however, was low during
the study period although the virus co-circulated with the influenza A(H1N1)pdm09 virus in
winter 2010/2011. Conversely, RSV and hMPV had a clear seasonal pattern, predominating
during winter and subsiding during summer; and this trend was the same throughout the study
period, whereas Hpiv1-3 were predominatly in spring and summer (Figure 4.3).
4.2.4.6. Flu A(H1N1)pdm09 and seasonal Flu A, pattern of co-infections and patients
demographics
Co-infection was identified in 4.7% (137/2,879) of patients who had influenza A(H1N1)pdm09
with rhinovirus as the most common, accounting for 39.4% (54/137) of all co-infections,
followed by respiratory syncytial virus (27.7%; 38/137), influenza B virus 11.7% (16/137),
adenovirus (10.2%; 14/137), human metapneumovirus (2.9%; 4/137), parainfluenza type 1
viruses (2.2%; 3/137) and parainfluenza type 3 viruses (0.7%; 1/137). Among patients who
were positive for seasonal influenza A viruses, co-infections occurred in 7.3% (57/779). In this
group, RSV was the most predominant virus, occurring in 36.8% (21/779) of all co-infections,
followed by influenza B viruses (28.1%; 16/779), rhinoviruses (12.3%; 7/779), adenoviruses
(8.8%; 5/779) and human metapneumovirus (7.0%; 4/779). Tables 4.6 and 4.7. Thus RSV co-
infection was the highest among seasonal influenza A viruses, whereas rhinovirus was more
frequent in influenza A(H1N1)pdm09 co-infections. The difference is likely because RSV
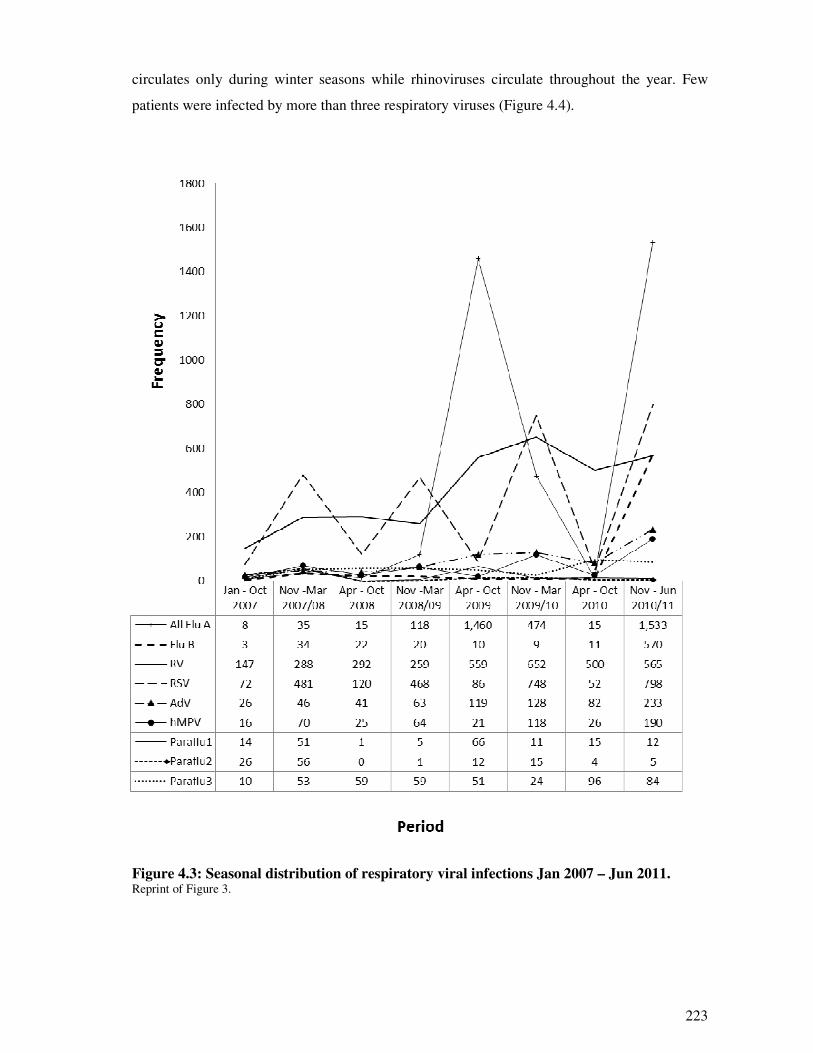
223
circulates only during winter seasons while rhinoviruses circulate throughout the year. Few
patients were infected by more than three respiratory viruses (Figure 4.4).
Figure 4.3: Seasonal distribution of respiratory viral infections Jan 2007 – Jun 2011. Reprint of Figure 3.
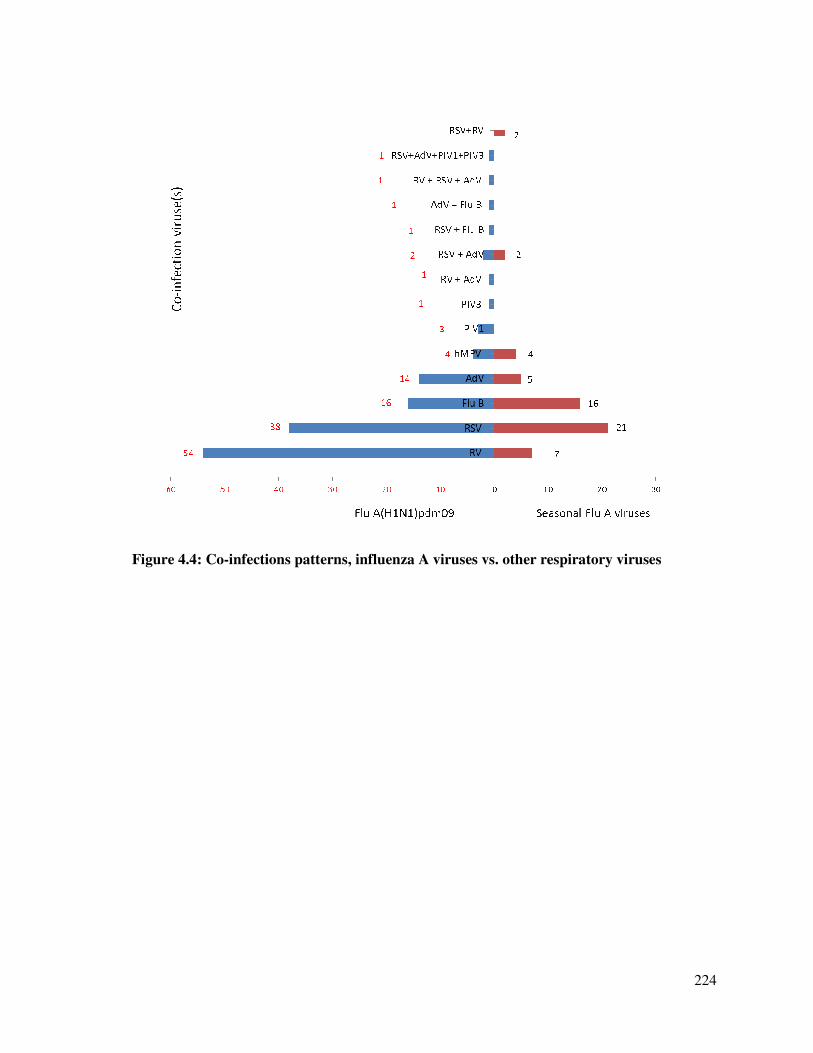
224
Figure 4.4: Co-infections patterns, influenza A viruses vs. other respiratory viruses
225
Co-infections were predominantly identified in children ≤5 years old. Thus 83.3% (45/54) of
patients with Flu A(H1N1)pdm09/RV co-infection 92.1% (35/38) Flu A(H1N1)pdm09/RSV,
100% (14/14), Flu A(H1N1)pdm09/AdV, 75%; (3/4) Flu A(H1N1)pdm09/hMPV and 68%
(11/16) Flu A(H1N1)pdm09/Flu B were under five years of age, and these differences were
statistically significant (p = 0.002 to p = <0.0001) – Table 4.6. A similar age distribution was
observed among patients who were diagnosed with seasonal influenza A virus co-infections -
Table 4.7. As for gender, apart from hMPV co-infection, there were no significant differences
in the proportion of males and females diagnosed with single versus dual or multiple
respiratory viral infections. The male to female ratios among different types of co-infections
were 57.4%/43.6% for Flu A(H1N1)pdm09/RV, 50%/50% for Flu A(H1N1)pdm09/RSV –
Table 4.6. Similar proportions were observed among seasonal influenza A viruses co-infections
- Table 4.7.
4.2.4.7. Risk of hospitalization, admission to ICU and death associated with influenza
A(H1N1)pdm09 co-infections
Seventy six point two percent (76.2%) of patients who had single influenza A(H1N1)pdm09
were hospitalized in a general ward. Comparatively, a higher proportion of patients with RSV
and AdV co-infection were hospitalized in a general ward (86.1%; 31/36 and 92.9%; 13/14
respectively), but the general ward hospitalization among patient with RV and influenza B co-
infection was lower than that in single influenza A(H1N1)pdm09 (75.0%; 9/12 and 73.5%;
36/49 respectively) – Table 4.6. The majority of co-infections were in children < 5 years old, so
when patients were stratified by age group, rates of admission to a general ward were still high
among patients co-infected with either Flu B, RV, RSV or AdV than those who had single Flu
A(H1N1)pdm09 infection (Supplimentary Table 4.2S1). On the other hand, only RSV and AdV
co-infection had higher hospitalization among patients aged five years of age or older – Table
4.6. However in a simple and multiple logistic regression, controlling for age and age*co-
infection interaction factor, these increases in risk were not statistically significant.
Regarding risk of admission to the ICU or death, 28.4% of patients with single influenza
A(H1N1)pdm09 infection were admitted to the ICU or died compared to rates of 57.1% among
those with influenza B co-infection and 27.8% and 28.6% among those with RV and RSV co-
infection respectively. Young age was again also associated with higher proportions of
hospitalization to ICU/death due to co-infection but again, in simple and multivariate logistic
regression models this increase in risk was not statistically significant.
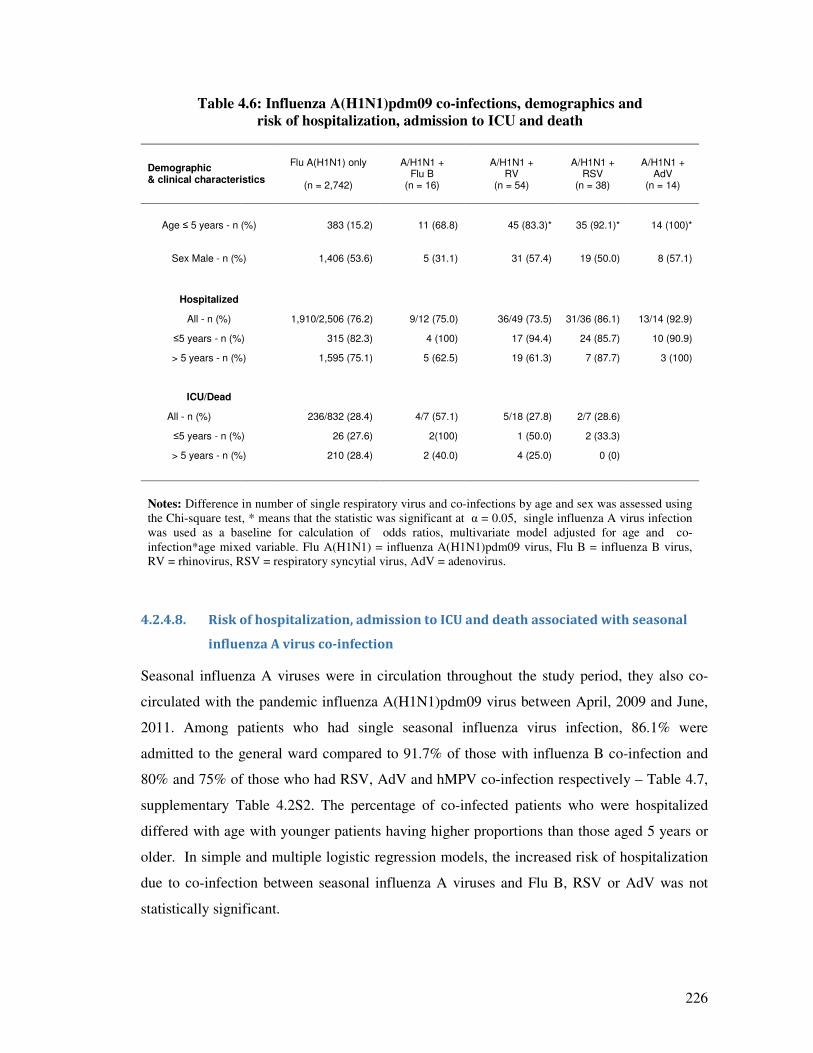
226
Table 4.6: Influenza A(H1N1)pdm09 co-infections, demographics and
risk of hospitalization, admission to ICU and death
Demographic & clinical characteristics
Flu A(H1N1) only
(n = 2,742)
A/H1N1 + Flu B
(n = 16)
A/H1N1 + RV
(n = 54)
A/H1N1 + RSV
(n = 38)
A/H1N1 + AdV
(n = 14)
Age ≤ 5 years - n (%) 383 (15.2) 11 (68.8) 45 (83.3)* 35 (92.1)* 14 (100)*
Sex Male - n (%) 1,406 (53.6) 5 (31.1) 31 (57.4) 19 (50.0) 8 (57.1)
Hospitalized
All - n (%) 1,910/2,506 (76.2) 9/12 (75.0) 36/49 (73.5) 31/36 (86.1) 13/14 (92.9)
≤5 years - n (%) 315 (82.3) 4 (100) 17 (94.4) 24 (85.7) 10 (90.9)
> 5 years - n (%) 1,595 (75.1) 5 (62.5) 19 (61.3) 7 (87.7) 3 (100)
ICU/Dead
All - n (%) 236/832 (28.4) 4/7 (57.1) 5/18 (27.8) 2/7 (28.6)
≤5 years - n (%) 26 (27.6) 2(100) 1 (50.0) 2 (33.3)
> 5 years - n (%) 210 (28.4) 2 (40.0) 4 (25.0) 0 (0)
Notes: Difference in number of single respiratory virus and co-infections by age and sex was assessed using
the Chi-square test, * means that the statistic was significant at α = 0.05, single influenza A virus infection
was used as a baseline for calculation of odds ratios, multivariate model adjusted for age and co-
infection*age mixed variable. Flu A(H1N1) = influenza A(H1N1)pdm09 virus, Flu B = influenza B virus,
RV = rhinovirus, RSV = respiratory syncytial virus, AdV = adenovirus.
4.2.4.8. Risk of hospitalization, admission to ICU and death associated with seasonal
influenza A virus co-infection
Seasonal influenza A viruses were in circulation throughout the study period, they also co-
circulated with the pandemic influenza A(H1N1)pdm09 virus between April, 2009 and June,
2011. Among patients who had single seasonal influenza virus infection, 86.1% were
admitted to the general ward compared to 91.7% of those with influenza B co-infection and
80% and 75% of those who had RSV, AdV and hMPV co-infection respectively – Table 4.7,
supplementary Table 4.2S2. The percentage of co-infected patients who were hospitalized
differed with age with younger patients having higher proportions than those aged 5 years or
older. In simple and multiple logistic regression models, the increased risk of hospitalization
due to co-infection between seasonal influenza A viruses and Flu B, RSV or AdV was not
statistically significant.
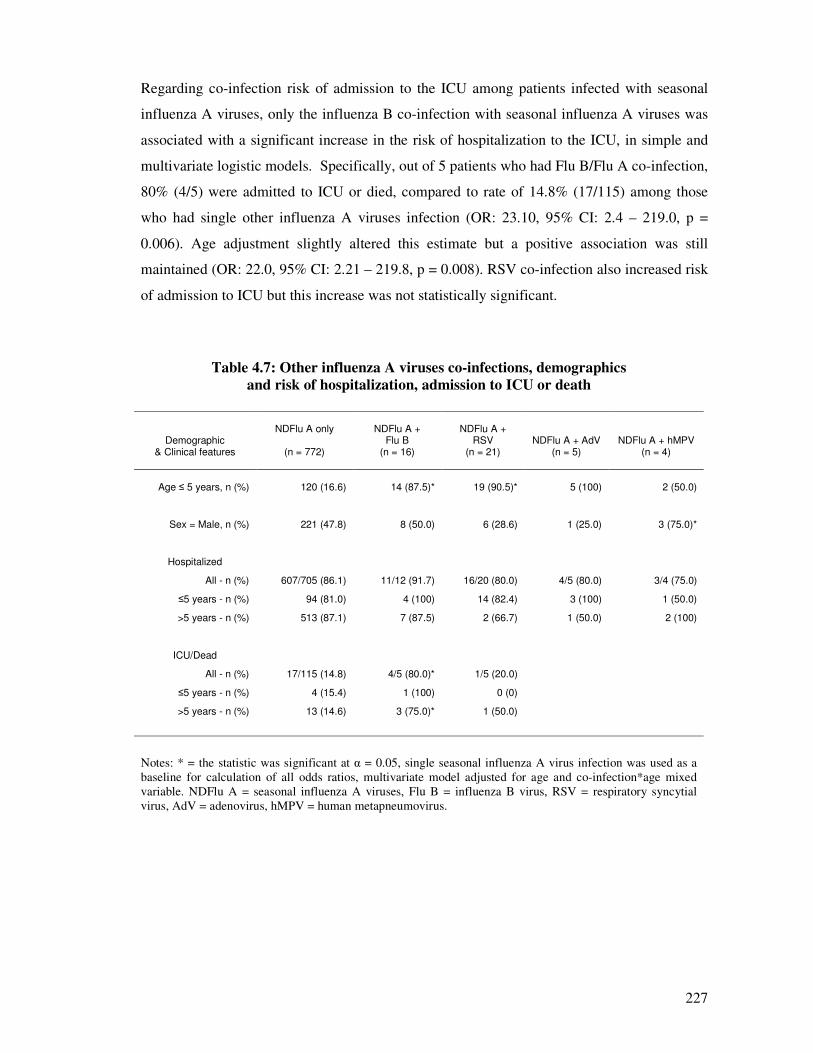
227
Regarding co-infection risk of admission to the ICU among patients infected with seasonal
influenza A viruses, only the influenza B co-infection with seasonal influenza A viruses was
associated with a significant increase in the risk of hospitalization to the ICU, in simple and
multivariate logistic models. Specifically, out of 5 patients who had Flu B/Flu A co-infection,
80% (4/5) were admitted to ICU or died, compared to rate of 14.8% (17/115) among those
who had single other influenza A viruses infection (OR: 23.10, 95% CI: 2.4 – 219.0, p =
0.006). Age adjustment slightly altered this estimate but a positive association was still
maintained (OR: 22.0, 95% CI: 2.21 – 219.8, p = 0.008). RSV co-infection also increased risk
of admission to ICU but this increase was not statistically significant.
Table 4.7: Other influenza A viruses co-infections, demographics
and risk of hospitalization, admission to ICU or death
Demographic & Clinical features
NDFlu A only
(n = 772)
NDFlu A + Flu B
(n = 16)
NDFlu A + RSV
(n = 21)
NDFlu A + AdV (n = 5)
NDFlu A + hMPV (n = 4)
Age ≤ 5 years, n (%) 120 (16.6) 14 (87.5)* 19 (90.5)* 5 (100) 2 (50.0)
Sex = Male, n (%) 221 (47.8) 8 (50.0) 6 (28.6) 1 (25.0) 3 (75.0)*
Hospitalized
All - n (%) 607/705 (86.1) 11/12 (91.7) 16/20 (80.0) 4/5 (80.0) 3/4 (75.0)
≤5 years - n (%) 94 (81.0) 4 (100) 14 (82.4) 3 (100) 1 (50.0)
>5 years - n (%) 513 (87.1) 7 (87.5) 2 (66.7) 1 (50.0) 2 (100)
ICU/Dead
All - n (%) 17/115 (14.8) 4/5 (80.0)* 1/5 (20.0)
≤5 years - n (%) 4 (15.4) 1 (100) 0 (0)
>5 years - n (%) 13 (14.6) 3 (75.0)* 1 (50.0)
Notes: * = the statistic was significant at α = 0.05, single seasonal influenza A virus infection was used as a
baseline for calculation of all odds ratios, multivariate model adjusted for age and co-infection*age mixed
variable. NDFlu A = seasonal influenza A viruses, Flu B = influenza B virus, RSV = respiratory syncytial
virus, AdV = adenovirus, hMPV = human metapneumovirus.
228
4.2.5. Discussion and conclusion
The overall positive rate for any respiratory virus of 40.7% (10,501/25,596) in this study is
generally lower than positive rates of between 60% -96% identified by most studies which
recruited hospitalized patients (76;86;517;560;593) but is generally higher than rates reported
by studies which recruited patients from the emergency department or recruited patients
presenting with influenza like illnesses to the general practitioners (GPs) (range 15% -31.0%)
(75;513;578). Co-infections occurred in 4.7% (137/2,879) of patients who had a positive
diagnosis of influenza A(H1N1)pdm09 and 7.3% (57/779) of samples with seasonal influenza
A virus infections. The rates of co-infections observed in this study are similar to those
observed in studies which recruited similar study populations; however, they are generally
lower than those which recruited infants and children. For example among studies of both
adults and children (75;81;302) in USA, France, and Madagascar, reported co-infection rates
of 5.0% (66/1,347), 13.1% (30/226) and 29.4% (53/389) respectively. In contrast in studies
conducted in infants and children (76-78;608;612) rates of 16.8% - 36.1% have been
reported.
Co-infection between seasonal influenza A viruses and influenza B virus was associated with
a significant increase in risk of admission to ICU or death whereas co-infection between
influenza A(H1N1)pdm09 and AdV and RSV were associated with insignificant increases of
risk of admission to a general ward. The findings of this study are in agreement with previous
studies which implicated AdV, RSV and flu B virus co-infection in aggravating respiratory
disease outcome (75-77;517;612;613). Further, in this study, RV co-infection was associated
with an insignificant increase in risk of hospitalization to a general ward, ICU or death among
children < 5 years old but no such increases among adults. Reports from other studies on role
of RV on disease outcome have been contradictory with some studies indicating that they
decreased severity (80;81) and others indicating they increase the risk (614;615). More
recently, studies from Australia, Sweden and USA have suggested that rhinoviruses reduce or
interfere with circulation of influenza viruses (82;541;544;545). The mechanisms driving
virus virulence in co-infections are not clearly understood. However, some authors have
suggested that it could either be due to virus-virus interactions in the form of protein-protein
or protein-RNA interactions such as the direct or indirect heterologous transactivation (616)
that aid in their co-existence and replication.
In this study, co-infections were predominantly among children ≤5 years old which could
introduce confounding into the calculated measures of risk. Therefore in the logistic
229
regression models, age was adjusted for so as to eliminate any change of such confounding.
Also, in this study, the positivity of most of the respiratory viruses was higher in males than in
females and, apart from hPIV1 and hPIV3, these differences were statistically significant.
This could be either because of differences in the health seeking behaviours of men and
women or because gender is a risk factor for respiratory virus infection. Some previous
studies have also reported higher positivity rates in males (578;617;618) while others have
reported higher rates in females (75;302;582;619;620).
The weaknesses of this study are that it was retrospective and because the database included
limited information on disease outcome, therefore we could not measure the impact of other
covariates like disease comorbidities. Most of the co-infections (range: 68.8% - 100%)
occurred in children ≤5 years old Tables 4.6 and 4.7. Children could suffer from chronic
conditions like leukaemia, cystic fibrosis asthma and immune suppressing infections like
HIV, therefore these factors should be born in mind when interpreting our results. Also, as
genetic mutations i.e. antigenic drift and reassortment can play a major role in the virulence of
influenza A viruses, it would have been useful to sequence the identified influenza A viruses.
However as no major mutation to influence disease virulence was observed during the period
of study it is unlikely that major change occurred as exemplified by, similar mutations (39/40)
occurring in almost all fatal and non-fatal influenza A(H1N1)pdm09 infections in 2010/11
winter season in the UK (607).
Further, excluded patients significantly differed by age from included patients such that
infants and children were more likely to be included than adults (e.g. inclusion: exclusion
rates 35.0%/19.7% vs. 29.1%/17.62% among those aged 40-65 years) and these differences
were statistically significant p = <0.0001. If there was a systematic error leading to young
children’s samples not being tested than older patients, it might have introduced diagnostic
bias leading to an exaggeration of the observed number of co-infections among young
children. However, this study investigated co-infections among patients primarily infected
with influenza virus infection. As influenza is an acute respiratory infection; the nature of the
sickness would drastically reduce the possibility of patients not seeking medical treatment or
physicians not requesting viral testing. We therefore believe that the information contained in
the database closely estimates the epidemiology of influenza A and respiratory viral infections
in North West England. However, the possibility of diagnostic bias should be born in mind
when interpreting our results.
230
In conclusion, despite some shortcomings, this study found that influenza B co-infection,
among patients infected with seasonal influenza A virus, significantly increased the risk of
admission to ICU or death. It also observed positive associations between influenza A
(H1N1)pdm09 and RSV, AdV and risk of hospitalization to the general ward, although these
associations were not statistically significant. We recommend comprehensive testing and a
careful integration of the patterns of co-infections among respiratory viruses into public health
reports so as to help accumulate evidence on the role of co-infections on patient outcome in
respiratory infections. Such information would be vital in shaping policy on an integrated
investigation and treatment of respiratory viral infections, introduction of an integrated
vaccine for all respiratory viruses and development of multi-target rapid diagnostic tests.
Funding: This work was supported by the University of Manchester.
Acknowledgements: The authors would like to acknowledge the University of Manchester,
the Manchester Academic Health Science Centre, and the Central Manchester University
Hospitals NHS Foundation Trust and staff for their support in this research.
Conflict of interest: All authors, no conflict of interest.
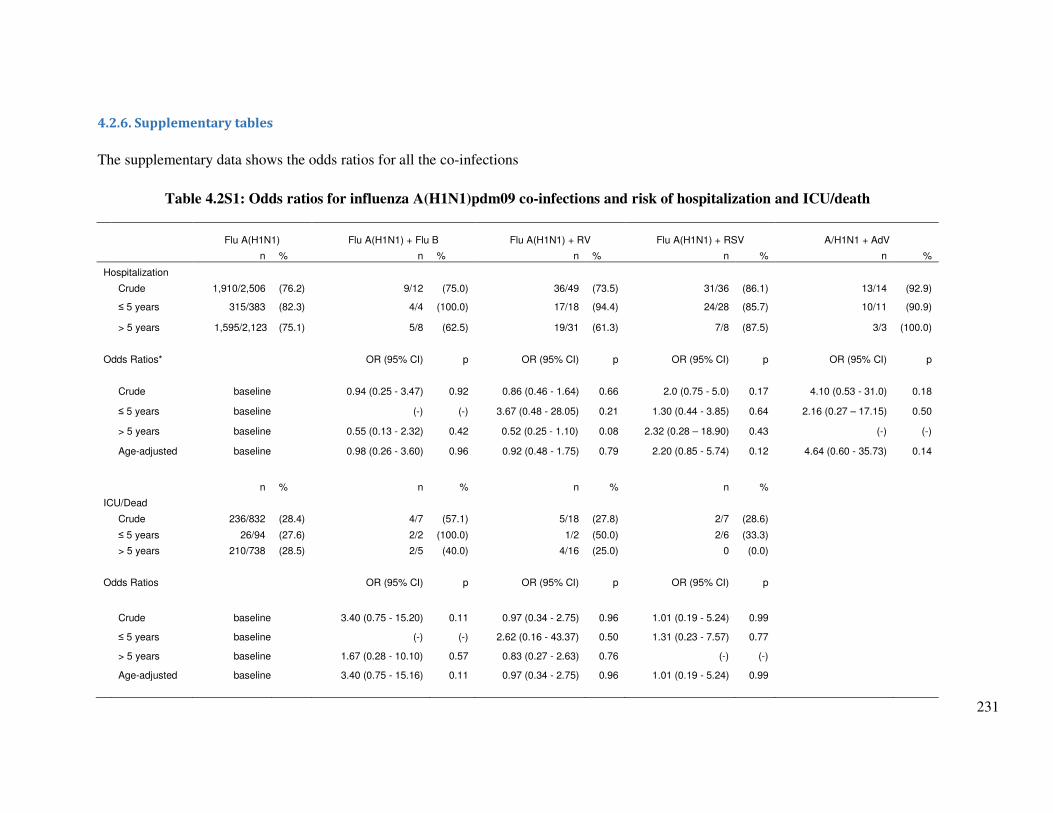
231
4.2.6. Supplementary tables
The supplementary data shows the odds ratios for all the co-infections
Table 4.2S1: Odds ratios for influenza A(H1N1)pdm09 co-infections and risk of hospitalization and ICU/death
Flu A(H1N1) Flu A(H1N1) + Flu B Flu A(H1N1) + RV Flu A(H1N1) + RSV A/H1N1 + AdV
n % n % n % n % n %
Hospitalization
Crude 1,910/2,506 (76.2) 9/12 (75.0) 36/49 (73.5) 31/36 (86.1) 13/14 (92.9)
≤ 5 years 315/383 (82.3) 4/4 (100.0) 17/18 (94.4) 24/28 (85.7) 10/11 (90.9)
> 5 years 1,595/2,123 (75.1) 5/8 (62.5) 19/31 (61.3) 7/8 (87.5) 3/3 (100.0)
Odds Ratios* OR (95% CI) p OR (95% CI) p OR (95% CI) p OR (95% CI) p
Crude baseline 0.94 (0.25 - 3.47) 0.92 0.86 (0.46 - 1.64) 0.66 2.0 (0.75 - 5.0) 0.17 4.10 (0.53 - 31.0) 0.18
≤ 5 years baseline (-) (-) 3.67 (0.48 - 28.05) 0.21 1.30 (0.44 - 3.85) 0.64 2.16 (0.27 – 17.15) 0.50
> 5 years baseline 0.55 (0.13 - 2.32) 0.42 0.52 (0.25 - 1.10) 0.08 2.32 (0.28 – 18.90) 0.43 (-) (-)
Age-adjusted baseline 0.98 (0.26 - 3.60) 0.96 0.92 (0.48 - 1.75) 0.79 2.20 (0.85 - 5.74) 0.12 4.64 (0.60 - 35.73) 0.14
n % n % n % n %
ICU/Dead
Crude 236/832 (28.4) 4/7 (57.1) 5/18 (27.8) 2/7 (28.6)
≤ 5 years 26/94 (27.6) 2/2 (100.0) 1/2 (50.0) 2/6 (33.3)
> 5 years 210/738 (28.5) 2/5 (40.0) 4/16 (25.0) 0 (0.0)
Odds Ratios OR (95% CI) p OR (95% CI) p OR (95% CI) p
Crude baseline 3.40 (0.75 - 15.20) 0.11 0.97 (0.34 - 2.75) 0.96 1.01 (0.19 - 5.24) 0.99
≤ 5 years baseline (-) (-) 2.62 (0.16 - 43.37) 0.50 1.31 (0.23 - 7.57) 0.77
> 5 years baseline 1.67 (0.28 - 10.10) 0.57 0.83 (0.27 - 2.63) 0.76 (-) (-)
Age-adjusted baseline 3.40 (0.75 - 15.16) 0.11 0.97 (0.34 - 2.75) 0.96 1.01 (0.19 - 5.24) 0.99
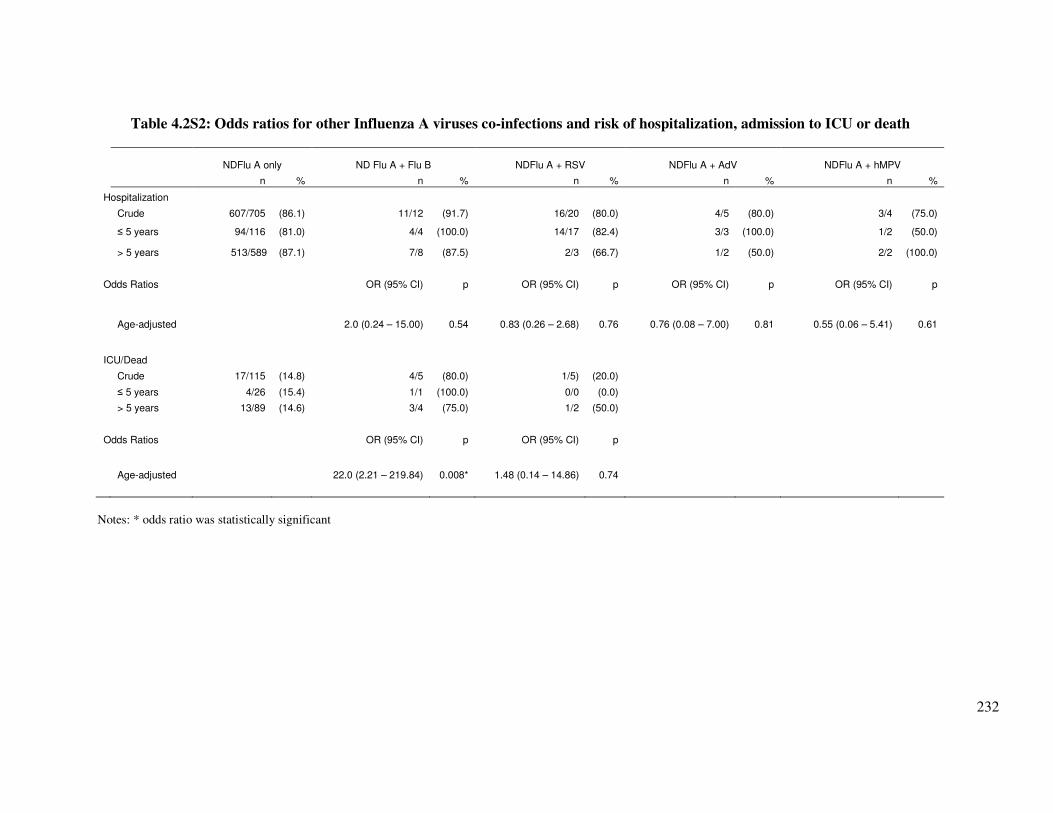
232
Table 4.2S2: Odds ratios for other Influenza A viruses co-infections and risk of hospitalization, admission to ICU or death
NDFlu A only ND Flu A + Flu B NDFlu A + RSV NDFlu A + AdV NDFlu A + hMPV
n % n % n % n % n %
Hospitalization
Crude 607/705 (86.1) 11/12 (91.7) 16/20 (80.0) 4/5 (80.0) 3/4 (75.0)
≤ 5 years 94/116 (81.0) 4/4 (100.0) 14/17 (82.4) 3/3 (100.0) 1/2 (50.0)
> 5 years 513/589 (87.1) 7/8 (87.5) 2/3 (66.7) 1/2 (50.0) 2/2 (100.0)
Odds Ratios OR (95% CI) p OR (95% CI) p OR (95% CI) p OR (95% CI) p
Age-adjusted 2.0 (0.24 – 15.00) 0.54 0.83 (0.26 – 2.68) 0.76 0.76 (0.08 – 7.00) 0.81 0.55 (0.06 – 5.41) 0.61
ICU/Dead
Crude 17/115 (14.8) 4/5 (80.0) 1/5) (20.0)
≤ 5 years 4/26 (15.4) 1/1 (100.0) 0/0 (0.0)
> 5 years 13/89 (14.6) 3/4 (75.0) 1/2 (50.0)
Odds Ratios OR (95% CI) p OR (95% CI) p
Age-adjusted 22.0 (2.21 – 219.84) 0.008* 1.48 (0.14 – 14.86) 0.74
Notes: * odds ratio was statistically significant
233
4.3. Co-infections and risk of hospitalization and mortality Part C: Influenza A
viruses co-infection with human coronavirus and bocavirus and risk of
hospitalization: Use of SYBR Green and TaqMan RT-PCR assays for virus
identification
Synopsis
This is the authors’ version of the paper submitted to Diagnostics Microbiology and
Infectious Disease Journal. During the study period, coronaviruses and bocavirus were not
being tested at the MMPL. This paper presents pan-coronavirus primers designed and used for
identification of hCoV in samples that were positive for influenza A virus at MMPL from June
2011 to June 2012. The samples were also tested for hBoV using previously published primers.
234
Influenza A viruses co-infection with human coronavirus and bocavirus
and risk of hospitalization: Use of SYBR Green and
TaqMan RT-PCR assays for virus identification
Edward A. Goka a, Pamela J. Vallely a, Kenneth J. Mutton a,b, Paul E. Klapper a,b
a Institute of Inflammation and Repair, Faculty of Medical and Human Sciences, University of Manchester,
Oxford Road, Manchester, M13 9PL, United Kingdom. b Department of Clinical Virology, Central Manchester Universities NHS Trust, Oxford Road, Manchester, M13
9WL, United Kingdom.
Corresponding author: Edward Goka, Institute of Inflammation and Repair, Faculty of Medical and Human
Sciences, 1st Floor Stopford building, University of Manchester, Oxford Road, Manchester, M13 9PL, UK.
E-mail: [email protected]
235
4.3.1. Abstract
Human coronaviruses (hCoV) and bocavirus (hBoV) have been associated with lower
respiratory tract infection (LRTI); for coronaviruses, the Middle East respiratory syndrome
(MERS) in 2012/13 and severe acute respiratory syndrome (SARS) in 2003. This study
investigated the association between their co-infection with influenza A viruses and severity. We
tested 217 samples from adults and children [mean age 37.7 (SD±30.4)] with seasonal influenza
A viruses (SeasFlu A) identified between 06/2011 - 06/2012 in NW England for hCoV and
hBoV using real-time RT-PCR. A total of 12 hCoV and 17 hBoV were identified in the 217
influenza A positive samples. The risks of admission to a general ward were: thirty nine point
four percent (39.4%; 54/137) in single SeasFlu A virus infection compared to 58.3% (7/12) in
SeasFluA/hBoV and 22.2% (2/9) in SeasFluA/hCoV co-infections respectively (OR: 2.19 95%
CI: 0.65 – 7.33, p = 0.21 and OR: 0.93, 95% CI: 0.42 – 2.06, p = 0.86). Whereas the risk of
admission to the intensive care unit were: 12.6% (12/95) in single SeasFlu A virus vs. 22.2%
(2/9) in SeasFluA/hCoV and 16.7% (1/6) in SeasFluA/hBoV (OR: 2.0, 95% CI: 0.33 – 10.70, p
= 0.48 and OR: 1.40, 95% CI: 0.14 – 13.98, p = 0.77), but none of these associations was
statistically significant in the logistic regression model controlling for age and season. More and
larger studies are needed to confirm the role of hCoV, hBoV co-infection in increasing influenza
A severity. Our hCoV RT-PCR protocol appeared to be of adequate analytical sensitivity for
diagnosis.
Key words: influenza A virus, coronavirus, bocavirus, co-infection, severity, hospitalization
236
4.3.2. Introduction
Influenza A viruses are a significant cause of acute lower respiratory tract infections (ALRI),
with 13.0% of all children with influenza infection developing ALRI - equivalent to 20 million
(95% CI: 13–32 million) ALRI cases per year (228); and according to these authors, in 2008,
between 28,000 and 111,500 children younger than 5 years died of influenza-associated ALRI.
On the other hand, the human coronavirus (hCoV) and human bocavirus (hBoV) are emerging
important respiratory viruses (87;368). Some recent studies have indicated that respiratory virus
co-infections increases disease severity (75;76;513;517), however the pattern of co-infection
between influenza A viruses and hCoV and hBoV and their association with severe disease has
not been clearly elucidated.
Coronaviruses infect a wide variety of hosts (animals and humans); Alphacoronaviruses and
Betacoronaviruses infect mammals, whereas Gammacoronaviruses infect birds (367). Most of
the human coronaviruses (Alphacoronaviruses 229E and NL63 and Betacoronaviruses OC43,
HKU1) cause mild influenza like illnesses, however in 2003, the severe acute respiratory
syndrome (SARS) coronavirus caused a very severe form of respiratory disease in humans
globally (45;621;622), resulting in over 900 deaths (623). On 21 September 2012, a novel
coronavirus was identified in lower respiratory tract of an adult male Qatari national in London
(624). Three months earlier (13 June 2012), Dutch researchers identified a similar virus in a
Saudi Arabian national presenting with pneumonia (625-627). As of 20th September 2013, the
novel coronavirus, now known as the Middle East respiratory syndrome coronavirus (MERS-
CoV) had caused a total of 130 laboratory confirmed and 17 probable cases globally. Of the 130
confirmed cases, 58 (45.0%) died (623).
Human bocavirus, was first discovered in respiratory specimens of patients with lower
respiratory disease in 2005 by Allander et al., (398) using a random polymerase chain reaction
(PCR)-cloning-sequencing protocol. Reviews by Schildgen et al., (87) and Zhenqiang et al., (88)
showed that, since 2005, over 40 studies conducted globally identified human bocavirus in
children with acute respiratory virus infections; and that most of these prevalence studies found
hBoV occurring mainly together with other viruses.
The emergence of the human coronaviruses and bocavirus as significant pathogens in LRTI,
created a need for the characterization of the epidemiology of these viruses. However these
viruses are not at present routinely tested in clinical settings. We designed primers and optimized
a real-time polymerase chain reaction (RT-PCR) assay for identification of 15 coronaviruses and
used the RT-PCR targeting the NS1 region of the hBoV described by Qu et al., (106) to
237
investigate the patterns of co-infections between influenza A virus with hCoV and hBoV and
their association with severe clinical disease.
4.3.3. Methodology
4.3.3.1. Clinical samples and setting
From 1st May to 30th August 2013, we tested for hCoV and hBoV in residual nucleic acids
extracts from 217 samples randomly sampled from a set of samples received at the Manchester
Micribiology Partnership Laboratory (MMPL) between 24th June 2011 and 30th June, 2012 and
were positive for influenza A viruses in a well characterised in-house duplex real-time polymeras
chain reaction assay. Nucleic acids were extracted from combined nose and throat samples in
virus transport medium using Qiagen Biorobot MDX and the QIAamp Virus Biorobot Mdx kit.
For influenza A viruses, reverse transcription was accomplished using the Invitrogen Superscipt
III platinum one step RT-PCR Kit (Invitrogen, Paisley, United Kingdom). Positive amplification
for influenza A viruses was determined using amplicon specific probes quenched with
tetramethylrhodamine (TAMRA) and dihydrocyclopyrroloindole tripeptide minor groove binder
(MGB) (Applied Biosystems). Influenza A(H1N1) was subtyped using the Health Protection
Agency (HPA (H1)v) assay (102). The same samples were also previously tested for other
respiratory virus infections: influenza B virus (Flu B), respiratory syncytial virus (RSV),
rhinoviruses (RV), adenovirus (AdV), human metapneumovirus (hMPV), and human
parainfluenza virus types 1 to 3 (hPIV1-3), using well characterised and validated in-house real-
time PCR assays. The PCRs were run on the ABI7500 real-time PCR instrument (Applied
Biosystems, Warrington, United Kingdom). The MMPL is a reference laboratory for the North
West England which has a population of around 7 million people (99). Samples were for patients
age between 1 and 98 years old (mean age 37.7, SD±30.4), seen as outpatients (at medical
centres, clinics or hospitals), or admitted to a hospital in North West England.
4.3.3.2. Primers, templates and probes for hCoV, hBoV
Primers for hCoV were designed using the BLAST program [GenBank, Bethesda MD, 20894
USA]. Complete genomic sequences for 15 coronavirus subtypes (151 in total); the 4 human
coronaviruses and 11 representatives of animal coronaviruses (Table 4.8), were downloaded
from the GenBank (and details of their GenBank accession numbers available on request). The
retrieved sequences were aligned with BioEdit Sequence alignment Editor version 7.1.3.0 (103)
and, where more than one sequence for each subtype was available, a consensus sequence for
each subtype generated. All the consensus sequences were then aligned to generate one
consensus for all consensuses (Figure 4.5) which was then blasted on Primer Blast on the
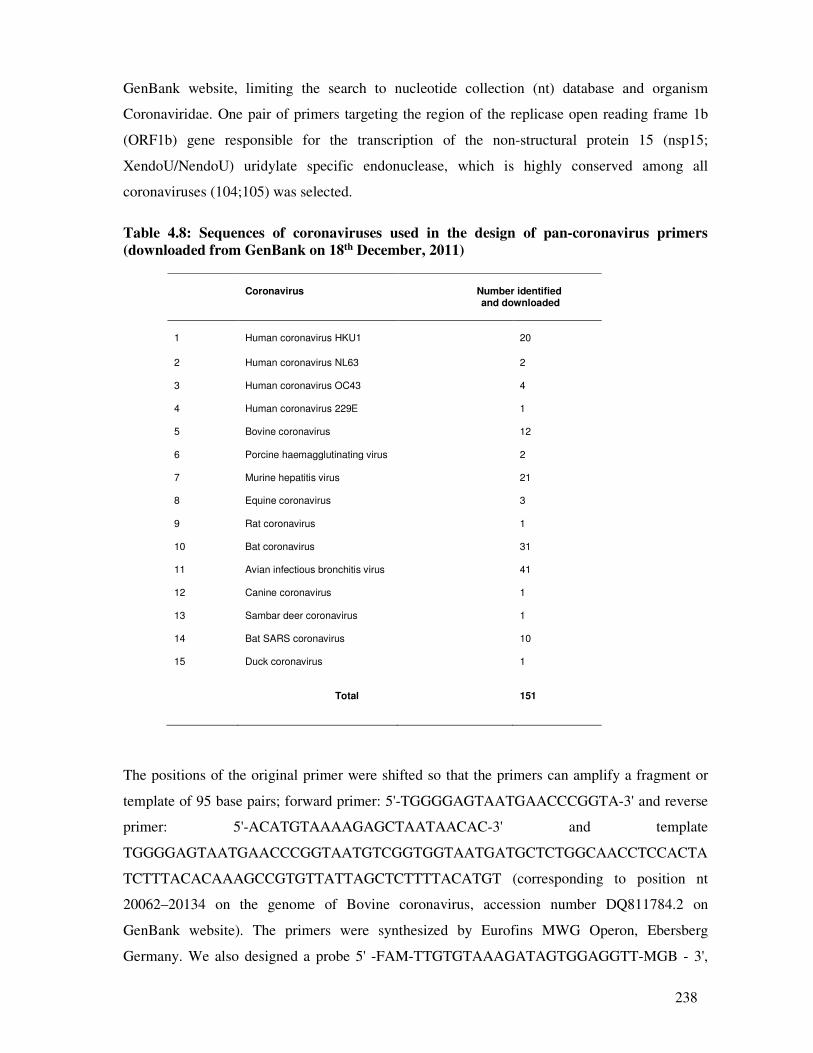
238
GenBank website, limiting the search to nucleotide collection (nt) database and organism
Coronaviridae. One pair of primers targeting the region of the replicase open reading frame 1b
(ORF1b) gene responsible for the transcription of the non-structural protein 15 (nsp15;
XendoU/NendoU) uridylate specific endonuclease, which is highly conserved among all
coronaviruses (104;105) was selected.
Table 4.8: Sequences of coronaviruses used in the design of pan-coronavirus primers
(downloaded from GenBank on 18th December, 2011)
Coronavirus
Number identified and downloaded
1
Human coronavirus HKU1
20
2
Human coronavirus NL63
2
3 Human coronavirus OC43
4
4 Human coronavirus 229E
1
5 Bovine coronavirus
12
6 Porcine haemagglutinating virus
2
7 Murine hepatitis virus
21
8 Equine coronavirus
3
9 Rat coronavirus
1
10 Bat coronavirus
31
11 Avian infectious bronchitis virus
41
12 Canine coronavirus
1
13 Sambar deer coronavirus
1
14 Bat SARS coronavirus
10
15 Duck coronavirus
1
Total
151
The positions of the original primer were shifted so that the primers can amplify a fragment or
template of 95 base pairs; forward primer: 5'-TGGGGAGTAATGAACCCGGTA-3' and reverse
primer: 5'-ACATGTAAAAGAGCTAATAACAC-3' and template
TGGGGAGTAATGAACCCGGTAATGTCGGTGGTAATGATGCTCTGGCAACCTCCACTA
TCTTTACACAAAGCCGTGTTATTAGCTCTTTTACATGT (corresponding to position nt
20062–20134 on the genome of Bovine coronavirus, accession number DQ811784.2 on
GenBank website). The primers were synthesized by Eurofins MWG Operon, Ebersberg
Germany. We also designed a probe 5' -FAM-TTGTGTAAAGATAGTGGAGGTT-MGB - 3',
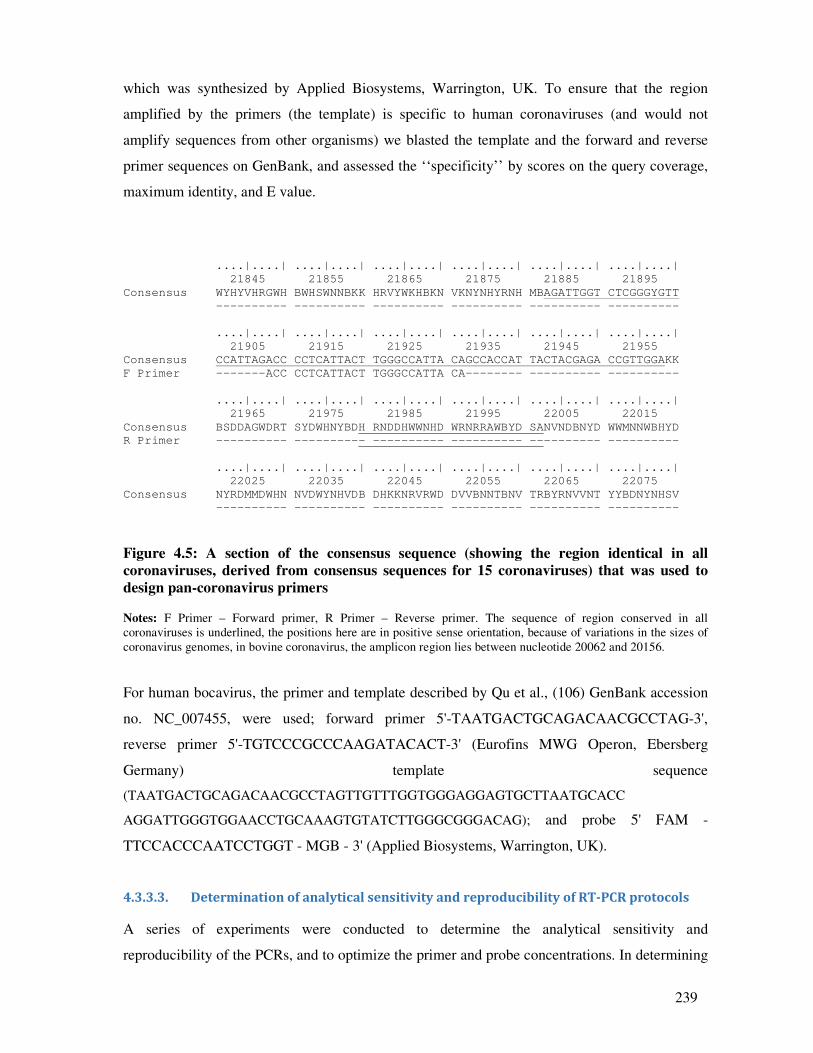
239
which was synthesized by Applied Biosystems, Warrington, UK. To ensure that the region
amplified by the primers (the template) is specific to human coronaviruses (and would not
amplify sequences from other organisms) we blasted the template and the forward and reverse
primer sequences on GenBank, and assessed the ‘‘specificity’’ by scores on the query coverage,
maximum identity, and E value.
....|....| ....|....| ....|....| ....|....| ....|....| ....|....|
21845 21855 21865 21875 21885 21895
Consensus WYHYVHRGWH BWHSWNNBKK HRVYWKHBKN VKNYNHYRNH MBAGATTGGT CTCGGGYGTT
---------- ---------- ---------- ---------- ---------- ----------
....|....| ....|....| ....|....| ....|....| ....|....| ....|....|
21905 21915 21925 21935 21945 21955
Consensus CCATTAGACC CCTCATTACT TGGGCCATTA CAGCCACCAT TACTACGAGA CCGTTGGAKK
F Primer -------ACC CCTCATTACT TGGGCCATTA CA-------- ---------- ----------
....|....| ....|....| ....|....| ....|....| ....|....| ....|....|
21965 21975 21985 21995 22005 22015
Consensus BSDDAGWDRT SYDWHNYBDH RNDDHWWNHD WRNRRAWBYD SANVNDBNYD WWMNNWBHYD
R Primer ---------- ---------- ---------- ---------- ---------- ----------
....|....| ....|....| ....|....| ....|....| ....|....| ....|....|
22025 22035 22045 22055 22065 22075
Consensus NYRDMMDWHN NVDWYNHVDB DHKKNRVRWD DVVBNNTBNV TRBYRNVVNT YYBDNYNHSV
---------- ---------- ---------- ---------- ---------- ----------
Figure 4.5: A section of the consensus sequence (showing the region identical in all
coronaviruses, derived from consensus sequences for 15 coronaviruses) that was used to
design pan-coronavirus primers Notes: F Primer – Forward primer, R Primer – Reverse primer. The sequence of region conserved in all
coronaviruses is underlined, the positions here are in positive sense orientation, because of variations in the sizes of
coronavirus genomes, in bovine coronavirus, the amplicon region lies between nucleotide 20062 and 20156.
For human bocavirus, the primer and template described by Qu et al., (106) GenBank accession
no. NC_007455, were used; forward primer 5'-TAATGACTGCAGACAACGCCTAG-3',
reverse primer 5'-TGTCCCGCCCAAGATACACT-3' (Eurofins MWG Operon, Ebersberg
Germany) template sequence
(TAATGACTGCAGACAACGCCTAGTTGTTTGGTGGGAGGAGTGCTTAATGCACC
AGGATTGGGTGGAACCTGCAAAGTGTATCTTGGGCGGGACAG); and probe 5' FAM -
TTCCACCCAATCCTGGT - MGB - 3' (Applied Biosystems, Warrington, UK).
4.3.3.3. Determination of analytical sensitivity and reproducibility of RT-PCR protocols
A series of experiments were conducted to determine the analytical sensitivity and
reproducibility of the PCRs, and to optimize the primer and probe concentrations. In determining
240
the analytical sensitivity of hCoV, both a live coronavirus 229E (Public Health England Culte
Collection, Salisbury UK) and RNA transcribed from the templates (or amplicon sequences)
inserted into a bacterial plasmid pEX-A vector (Eurofins MWG Operon, Ebersberg Germany)
were used. Both the coronavirus and bocavirus amplicon sequences were inserted into a pEX-A
plasmid vector (Eurofins MWG Operon, Ebersberg Germany) and utilized as positive control
material and quantification standard for the assays. For use in the coronavirus RT-PCR, RNA
was synthesized from the coronavirus pEX-A insert (the map of the pEX-A vector and sequence
of the insert is provided in supplementary Figure 4.3S7). To transcribe the RNA, the pEX-A
plasmid was first linearized using Bacillus amyloliquefaciens (BamHI) restriction enzyme (New
England BioLabs, Ipswich USA) and ribonucleic acid (RNA) transcribed using the T7
polymerase enzyme using the T7 High Yield RNA synthesis Kit (New England BioLabs,
Ipswich USA).
To determine the analytical sensitivity, seven 1:4 serial dilutions (in duplicate) of the RNA
transcribed from the pEX-A plasmid vector (Eurofins MWG Operon, Ebersberg Germany) and
RNA extracted from the live human coronavirus (Public Health England Culture Collection,
Salisbury UK) were used in standard curve experiments. Details of the standard curve
experiments calculations done are provided in supplementary text provided in pages following
this paper]. To optimize the primer concentration, duplicate preparations of coronavirus 229E
and pEX-A RNA template, 20µM, 10µM, 7.50µM, and 5µM serial dilutions of forward and
reverse primer and 10µM, 6.60µM, 3.3µM, 0.37µM probe concentrations were set up in
MicroAmp Fast Reaction PCR tubes and mounted on a 48 well plate (details of the optimisation
experiments are provided in supplementary text ahead). Similarly, for analytical sensitivity of the
hBoV PCR, 1:4 serial dilutions (in duplicates) of the pEX-A plasmid (Eurofins MWG Operon,
Ebersberg Germany) were used in standard curve experiments (details of the hBoV standard
curve experiments and the calculation of number of plasmid copies in serial dilutions are
provided in supplementary text).
4.3.3.4. PCR for identification of coronaviruses and bocavirus in samples
The Power SYBR Green RNA-to-CT 1-Step Kit (Applied Biosystems) was used in a one-step
RT-PCR for detection of coronavirus, the reaction mixture comprised: 10µl of Power SYBR
Green RT-PCR Master Mix (2X), 2.5µl forward and reverse primer (20µM), 1µl of Arrayscript
RT Enzyme mix (125X), 2µl of RNAse free water and 3µl of RNA template in positive control
well or sample in test wells. For identification of bocavirus the Power SYBR Green PCR Master
Mix (Applied Biosystems) was used: reaction mixture 10µl of Power SYBR Green PCR Master
241
Mix (2X), 2.5µl forward and reverse primer (20µM), 2µl RNAse free water and 3µl of template
in positive control well or sample in test wells. RT-PCR experiments were conducted on the
StepOne and StepOne Plus Real Time PCR machine (Applied Biosystems) with cycling
parameters for coronavirus of: 48oC for 30 minutes, 95oC for 10 minutes; followed by 40 cycles
of denaturing at 95oC for 15 seconds and 57oC for 1 minute; and a melting curve of 95oC for 15
seconds, 57oC for 15 seconds and 95oC for 15 seconds. The bocavirus PCR used 95oC for 10
minutes, 40 cycles of 95oC for 15 seconds and 60oC for 1 minute and a melting curve of 95oC for
15 seconds, 60oC for 15 seconds and 95oC for 15 seconds. The number of viral copies was
calculated using the absolute quantification method published by Brankatschk et al., (107).
4.3.3.5. Confirmation of positive samples using MGB probes
Samples that were positive for coronavirus or bocavirus were confirmed with a TaqMan based
RT-PCR. The probe concentrations were first optimized using duplicate preparations of 10µM,
6.6µM, 5µM, 3.3µM, 0.3µM and 0.12 probe concentrations. Each well contained 10µl of
TaqMan Fast Universal PCR Master Mix (2X) (Applied Biosystems), 2.5µl of probe, 2.5µl
forward and reverse primer, 2µl of RNAse free water and 3ul of RNA template. The coronavirus
PCR also contained the 1µl Multiscribe Reverse Transcriptase (Applied Biosystems) and 1µl of
RNase inhibitor. The cycling conditions were; for coronavirus experiments: 50oC for 2 minutes,
95oC for 20 seconds, followed by 40 cycles of 95oC for 1 second and 57oC for 20 seconds;
whereas for bocavirus: 95oC for 20 seconds, followed by 40 cycles of 95oC for 1 second and
60oC for 20 seconds. An amplification plot from one of the probe confirmation experiments is
provided in supplementary Figure 4.3S6 as an example.
4.3.3.6. Polyacrylamide gel (PAGE) electrophoresis
Amplicons for coronavirus and bocavirus PCR were visualized using precast 8% TBE
polyacrylamide gel 1mm 15 well (Applied Biosystems) run on an XCell SureLock™ Mini-Cell
Electrophoresis chamber (Invitrogen Novex Mini cell), filled with 200 ml and 600ml 1X BTE
Running Buffer in upper and lower chambers respectively. Ten (10µl) of PCR product was
mixed with 9µl of Deionised water and 1µl 5X DNA Loading Buffer (Bioline, London) and
loaded into the wells and the positive control well loaded with HyperLadder V (Bioline). The
loaded XCell SureLock™ Mini-Cell chamber was run at 200V, 18mA for 35 minutes, stained
with GelRed Nucleic Acid Stain (Biotium, Hayward, UK) for 30 minutes, and visualised under
UV light on an Alphaimager 2200 machine (Alpha Innotech, San Leandro, California).
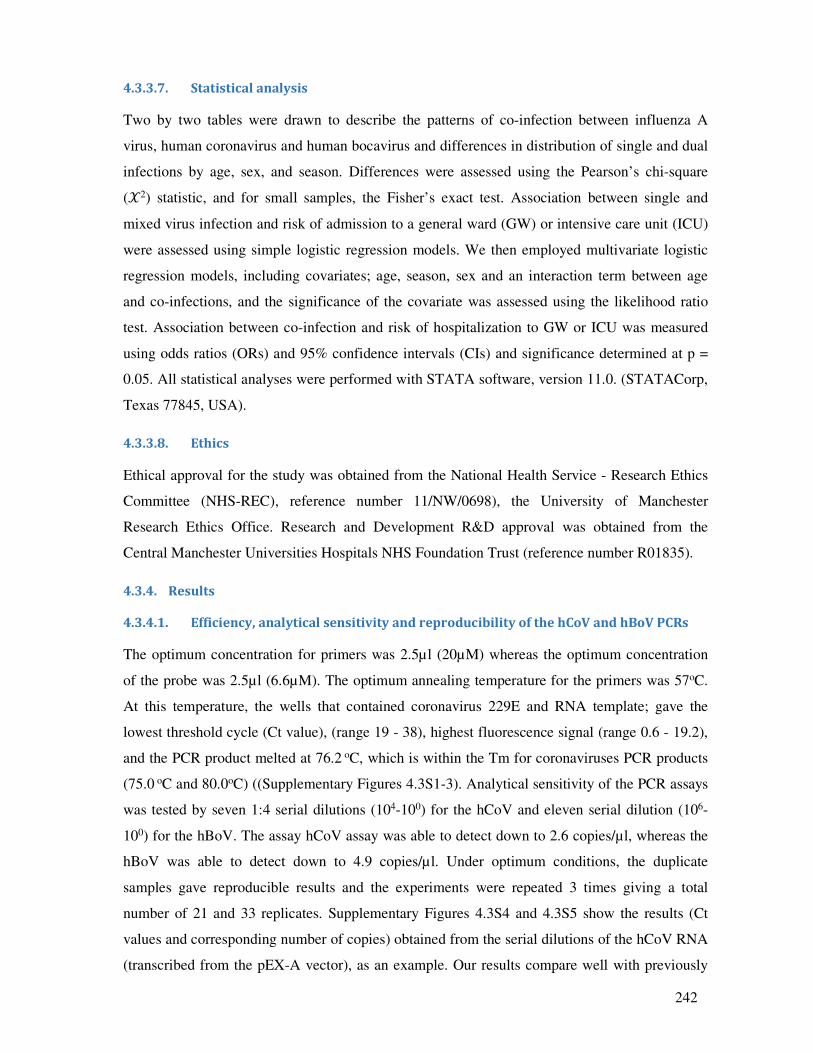
242
4.3.3.7. Statistical analysis
Two by two tables were drawn to describe the patterns of co-infection between influenza A
virus, human coronavirus and human bocavirus and differences in distribution of single and dual
infections by age, sex, and season. Differences were assessed using the Pearson’s chi-square
(�2) statistic, and for small samples, the Fisher’s exact test. Association between single and
mixed virus infection and risk of admission to a general ward (GW) or intensive care unit (ICU)
were assessed using simple logistic regression models. We then employed multivariate logistic
regression models, including covariates; age, season, sex and an interaction term between age
and co-infections, and the significance of the covariate was assessed using the likelihood ratio
test. Association between co-infection and risk of hospitalization to GW or ICU was measured
using odds ratios (ORs) and 95% confidence intervals (CIs) and significance determined at p =
0.05. All statistical analyses were performed with STATA software, version 11.0. (STATACorp,
Texas 77845, USA).
4.3.3.8. Ethics
Ethical approval for the study was obtained from the National Health Service - Research Ethics
Committee (NHS-REC), reference number 11/NW/0698), the University of Manchester
Research Ethics Office. Research and Development R&D approval was obtained from the
Central Manchester Universities Hospitals NHS Foundation Trust (reference number R01835).
4.3.4. Results
4.3.4.1. Efficiency, analytical sensitivity and reproducibility of the hCoV and hBoV PCRs
The optimum concentration for primers was 2.5µl (20µM) whereas the optimum concentration
of the probe was 2.5µl (6.6µM). The optimum annealing temperature for the primers was 57oC.
At this temperature, the wells that contained coronavirus 229E and RNA template; gave the
lowest threshold cycle (Ct value), (range 19 - 38), highest fluorescence signal (range 0.6 - 19.2),
and the PCR product melted at 76.2 oC, which is within the Tm for coronaviruses PCR products
(75.0 oC and 80.0oC) ((Supplementary Figures 4.3S1-3). Analytical sensitivity of the PCR assays
was tested by seven 1:4 serial dilutions (104-100) for the hCoV and eleven serial dilution (106-
100) for the hBoV. The assay hCoV assay was able to detect down to 2.6 copies/µl, whereas the
hBoV was able to detect down to 4.9 copies/µl. Under optimum conditions, the duplicate
samples gave reproducible results and the experiments were repeated 3 times giving a total
number of 21 and 33 replicates. Supplementary Figures 4.3S4 and 4.3S5 show the results (Ct
values and corresponding number of copies) obtained from the serial dilutions of the hCoV RNA
(transcribed from the pEX-A vector), as an example. Our results compare well with previously
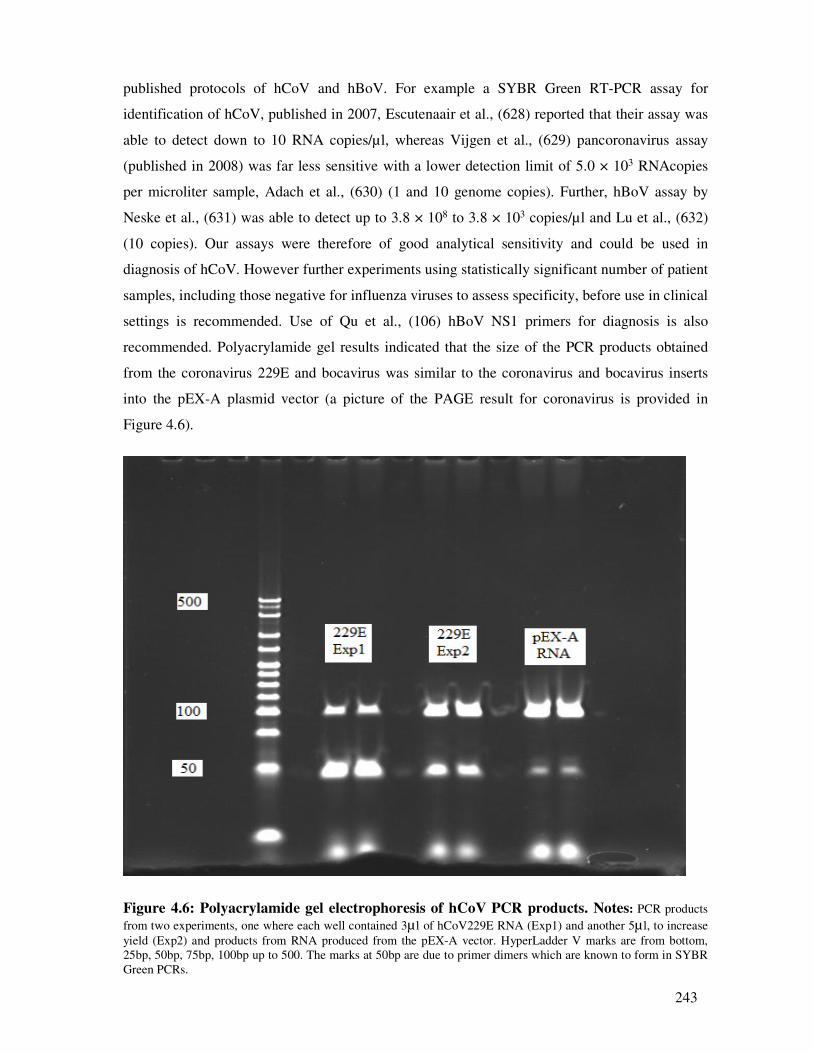
243
published protocols of hCoV and hBoV. For example a SYBR Green RT-PCR assay for
identification of hCoV, published in 2007, Escutenaair et al., (628) reported that their assay was
able to detect down to 10 RNA copies/µl, whereas Vijgen et al., (629) pancoronavirus assay
(published in 2008) was far less sensitive with a lower detection limit of 5.0 × 10³ RNAcopies
per microliter sample, Adach et al., (630) (1 and 10 genome copies). Further, hBoV assay by
Neske et al., (631) was able to detect up to 3.8 × 10⁸ to 3.8 × 10³ copies/µl and Lu et al., (632)
(10 copies). Our assays were therefore of good analytical sensitivity and could be used in
diagnosis of hCoV. However further experiments using statistically significant number of patient
samples, including those negative for influenza viruses to assess specificity, before use in clinical
settings is recommended. Use of Qu et al., (106) hBoV NS1 primers for diagnosis is also
recommended. Polyacrylamide gel results indicated that the size of the PCR products obtained
from the coronavirus 229E and bocavirus was similar to the coronavirus and bocavirus inserts
into the pEX-A plasmid vector (a picture of the PAGE result for coronavirus is provided in
Figure 4.6).
Figure 4.6: Polyacrylamide gel electrophoresis of hCoV PCR products. Notes: PCR products
from two experiments, one where each well contained 3µ l of hCoV229E RNA (Exp1) and another 5µ l, to increase
yield (Exp2) and products from RNA produced from the pEX-A vector. HyperLadder V marks are from bottom,
25bp, 50bp, 75bp, 100bp up to 500. The marks at 50bp are due to primer dimers which are known to form in SYBR
Green PCRs.
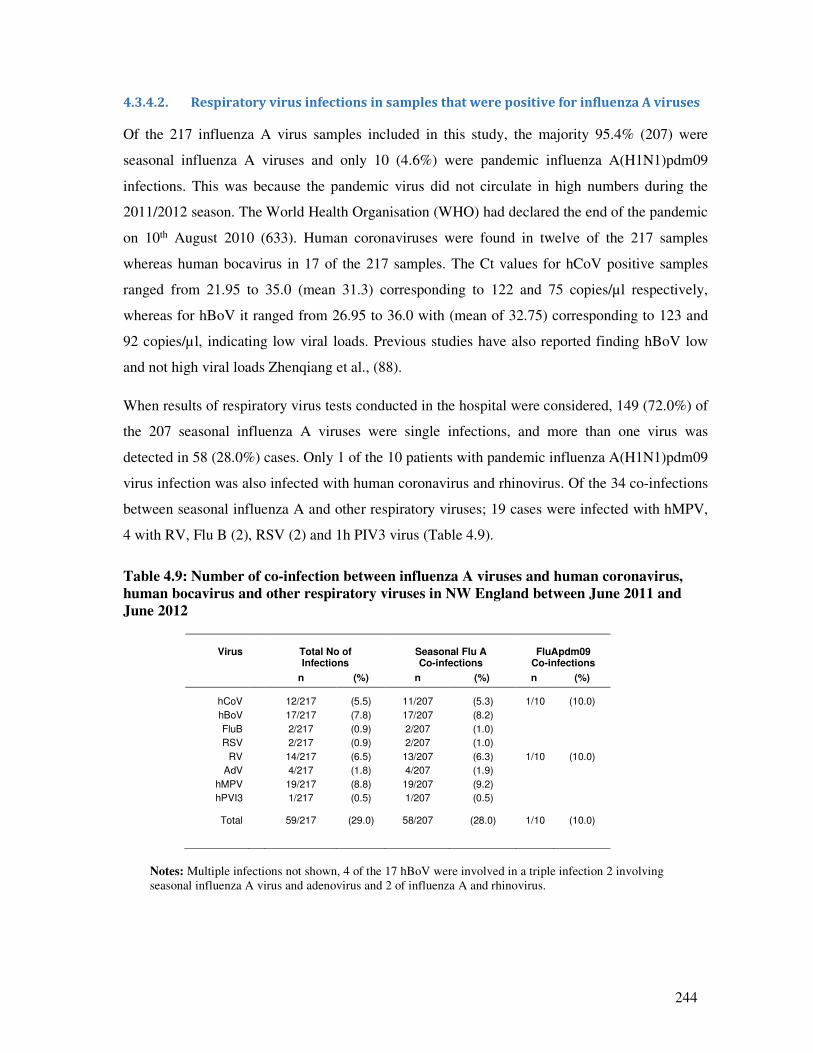
244
4.3.4.2. Respiratory virus infections in samples that were positive for influenza A viruses
Of the 217 influenza A virus samples included in this study, the majority 95.4% (207) were
seasonal influenza A viruses and only 10 (4.6%) were pandemic influenza A(H1N1)pdm09
infections. This was because the pandemic virus did not circulate in high numbers during the
2011/2012 season. The World Health Organisation (WHO) had declared the end of the pandemic
on 10th August 2010 (633). Human coronaviruses were found in twelve of the 217 samples
whereas human bocavirus in 17 of the 217 samples. The Ct values for hCoV positive samples
ranged from 21.95 to 35.0 (mean 31.3) corresponding to 122 and 75 copies/µl respectively,
whereas for hBoV it ranged from 26.95 to 36.0 with (mean of 32.75) corresponding to 123 and
92 copies/µl, indicating low viral loads. Previous studies have also reported finding hBoV low
and not high viral loads Zhenqiang et al., (88).
When results of respiratory virus tests conducted in the hospital were considered, 149 (72.0%) of
the 207 seasonal influenza A viruses were single infections, and more than one virus was
detected in 58 (28.0%) cases. Only 1 of the 10 patients with pandemic influenza A(H1N1)pdm09
virus infection was also infected with human coronavirus and rhinovirus. Of the 34 co-infections
between seasonal influenza A and other respiratory viruses; 19 cases were infected with hMPV,
4 with RV, Flu B (2), RSV (2) and 1h PIV3 virus (Table 4.9).
Table 4.9: Number of co-infection between influenza A viruses and human coronavirus,
human bocavirus and other respiratory viruses in NW England between June 2011 and
June 2012
Virus
Total No of Infections
Seasonal Flu A Co-infections
FluApdm09
Co-infections
n (%) n (%) n (%)
hCoV 12/217 (5.5) 11/207 (5.3) 1/10 (10.0)
hBoV 17/217 (7.8) 17/207 (8.2)
FluB 2/217 (0.9) 2/207 (1.0)
RSV 2/217 (0.9) 2/207 (1.0)
RV 14/217 (6.5) 13/207 (6.3) 1/10 (10.0)
AdV 4/217 (1.8) 4/207 (1.9)
hMPV 19/217 (8.8) 19/207 (9.2)
hPVI3 1/217 (0.5) 1/207 (0.5)
Total 59/217 (29.0) 58/207 (28.0) 1/10 (10.0)
Notes: Multiple infections not shown, 4 of the 17 hBoV were involved in a triple infection 2 involving
seasonal influenza A virus and adenovirus and 2 of influenza A and rhinovirus.
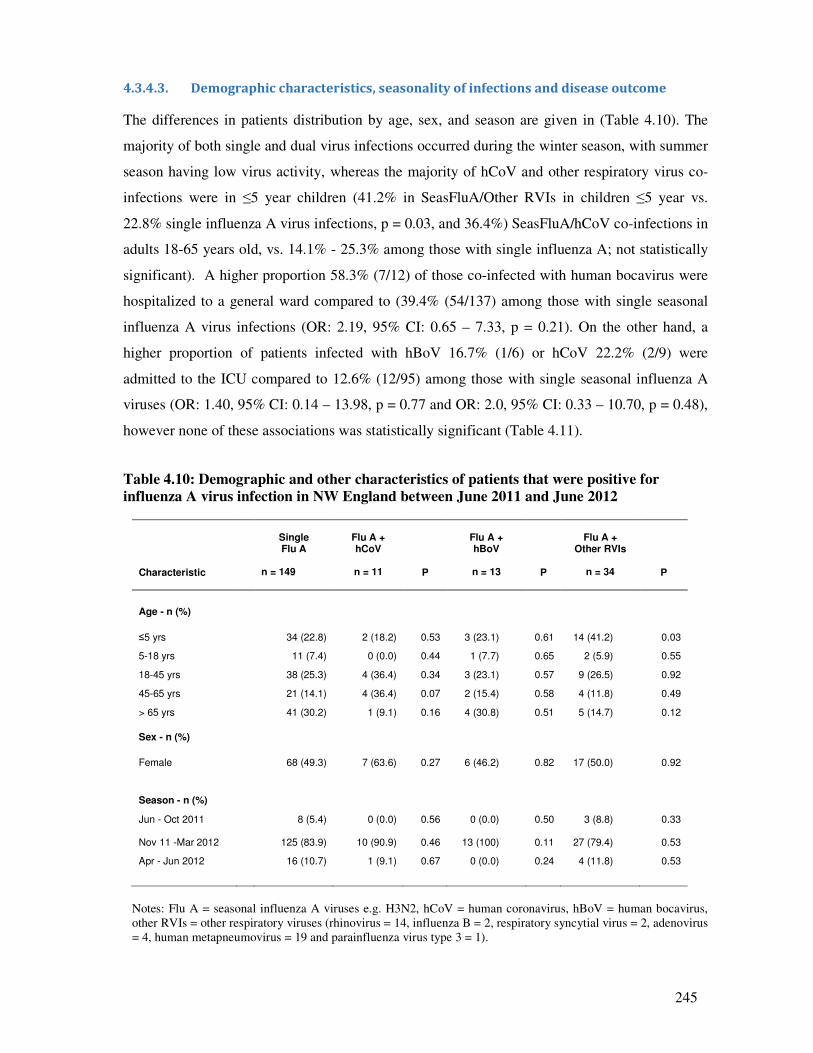
245
4.3.4.3. Demographic characteristics, seasonality of infections and disease outcome
The differences in patients distribution by age, sex, and season are given in (Table 4.10). The
majority of both single and dual virus infections occurred during the winter season, with summer
season having low virus activity, whereas the majority of hCoV and other respiratory virus co-
infections were in ≤5 year children (41.2% in SeasFluA/Other RVIs in children ≤5 year vs.
22.8% single influenza A virus infections, p = 0.03, and 36.4%) SeasFluA/hCoV co-infections in
adults 18-65 years old, vs. 14.1% - 25.3% among those with single influenza A; not statistically
significant). A higher proportion 58.3% (7/12) of those co-infected with human bocavirus were
hospitalized to a general ward compared to (39.4% (54/137) among those with single seasonal
influenza A virus infections (OR: 2.19, 95% CI: 0.65 – 7.33, p = 0.21). On the other hand, a
higher proportion of patients infected with hBoV 16.7% (1/6) or hCoV 22.2% (2/9) were
admitted to the ICU compared to 12.6% (12/95) among those with single seasonal influenza A
viruses (OR: 1.40, 95% CI: 0.14 – 13.98, p = 0.77 and OR: 2.0, 95% CI: 0.33 – 10.70, p = 0.48),
however none of these associations was statistically significant (Table 4.11).
Table 4.10: Demographic and other characteristics of patients that were positive for
influenza A virus infection in NW England between June 2011 and June 2012
Characteristic
Single Flu A
n = 149
Flu A + hCoV
n = 11 P
Flu A + hBoV
n = 13 P
Flu A +
Other RVIs
n = 34
P
Age - n (%)
≤5 yrs 34 (22.8) 2 (18.2) 0.53 3 (23.1) 0.61 14 (41.2) 0.03
5-18 yrs 11 (7.4) 0 (0.0) 0.44 1 (7.7) 0.65 2 (5.9) 0.55
18-45 yrs 38 (25.3) 4 (36.4) 0.34 3 (23.1) 0.57 9 (26.5) 0.92
45-65 yrs 21 (14.1) 4 (36.4) 0.07 2 (15.4) 0.58 4 (11.8) 0.49
> 65 yrs 41 (30.2) 1 (9.1) 0.16 4 (30.8) 0.51 5 (14.7) 0.12
Sex - n (%)
Female 68 (49.3) 7 (63.6) 0.27 6 (46.2) 0.82 17 (50.0) 0.92
Season - n (%)
Jun - Oct 2011
8 (5.4)
0 (0.0)
0.56
0 (0.0)
0.50
3 (8.8)
0.33
Nov 11 -Mar 2012 125 (83.9) 10 (90.9) 0.46 13 (100) 0.11 27 (79.4) 0.53
Apr - Jun 2012 16 (10.7) 1 (9.1) 0.67 0 (0.0) 0.24 4 (11.8) 0.53
Notes: Flu A = seasonal influenza A viruses e.g. H3N2, hCoV = human coronavirus, hBoV = human bocavirus,
other RVIs = other respiratory viruses (rhinovirus = 14, influenza B = 2, respiratory syncytial virus = 2, adenovirus
= 4, human metapneumovirus = 19 and parainfluenza virus type 3 = 1).
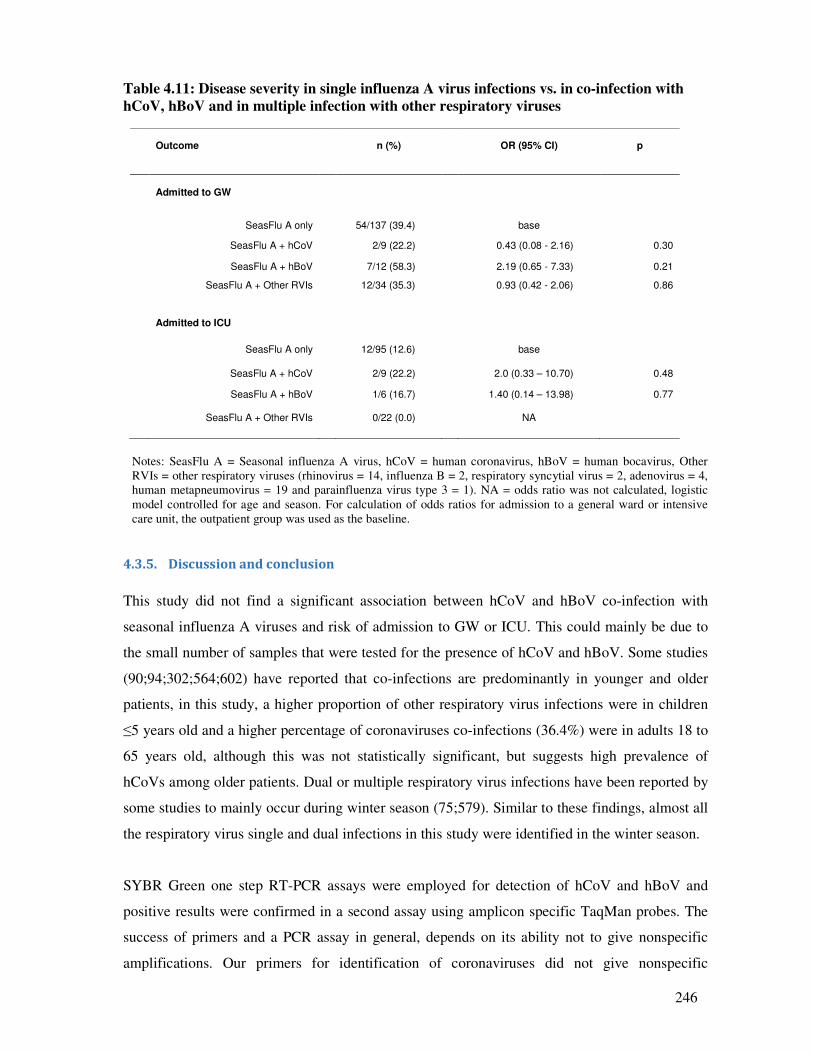
246
Table 4.11: Disease severity in single influenza A virus infections vs. in co-infection with
hCoV, hBoV and in multiple infection with other respiratory viruses
Notes: SeasFlu A = Seasonal influenza A virus, hCoV = human coronavirus, hBoV = human bocavirus, Other
RVIs = other respiratory viruses (rhinovirus = 14, influenza B = 2, respiratory syncytial virus = 2, adenovirus = 4,
human metapneumovirus = 19 and parainfluenza virus type 3 = 1). NA = odds ratio was not calculated, logistic
model controlled for age and season. For calculation of odds ratios for admission to a general ward or intensive
care unit, the outpatient group was used as the baseline.
4.3.5. Discussion and conclusion
This study did not find a significant association between hCoV and hBoV co-infection with
seasonal influenza A viruses and risk of admission to GW or ICU. This could mainly be due to
the small number of samples that were tested for the presence of hCoV and hBoV. Some studies
(90;94;302;564;602) have reported that co-infections are predominantly in younger and older
patients, in this study, a higher proportion of other respiratory virus infections were in children
≤5 years old and a higher percentage of coronaviruses co-infections (36.4%) were in adults 18 to
65 years old, although this was not statistically significant, but suggests high prevalence of
hCoVs among older patients. Dual or multiple respiratory virus infections have been reported by
some studies to mainly occur during winter season (75;579). Similar to these findings, almost all
the respiratory virus single and dual infections in this study were identified in the winter season.
SYBR Green one step RT-PCR assays were employed for detection of hCoV and hBoV and
positive results were confirmed in a second assay using amplicon specific TaqMan probes. The
success of primers and a PCR assay in general, depends on its ability not to give nonspecific
amplifications. Our primers for identification of coronaviruses did not give nonspecific
Outcome
n (%)
OR (95% CI)
p
Admitted to GW
SeasFlu A only 54/137 (39.4) base
SeasFlu A + hCoV 2/9 (22.2) 0.43 (0.08 - 2.16) 0.30
SeasFlu A + hBoV 7/12 (58.3) 2.19 (0.65 - 7.33) 0.21
SeasFlu A + Other RVIs 12/34 (35.3) 0.93 (0.42 - 2.06) 0.86
Admitted to ICU
SeasFlu A only 12/95 (12.6) base
SeasFlu A + hCoV 2/9 (22.2) 2.0 (0.33 – 10.70) 0.48
SeasFlu A + hBoV 1/6 (16.7) 1.40 (0.14 – 13.98) 0.77
SeasFlu A + Other RVIs 0/22 (0.0) NA
247
amplifications as indicated by the melting curves and our assays results compare equally with
those of a previously published SYBR green assay for coronaviruses (628). The importance of
developing a coronavirus RT-PCR assay that is able to identify both Alphacoronaviruses and
Betacoronaviruses which attack animals and humans, and Gammacoronaviruses which attack
birds, is that such assays could identify zoonotic coronaviruses associated with more severe
disease in humans (45;368;621;622).
The clinical usability of any PCR assay for the identification of all or most coronaviruses
depends on its ability to amplify a region which is common to all coronaviruses (both human and
human adapted animal viruses), and its sensitivity. The primers for coronavirus, we designed,
target the replicase ORF1b nsp15 (XendoU/NendoU) uridylate specific endonuclease gene,
which is highly conserved among all coronaviruses (104;105). In addition, the hCoV standard
curve experiments were able to pick up to 2 copies/µl of human coronavirus RNA template and
we confirmed our results with a TaqMan probe. We are therefore confident that it could be
applied for diagnosis of coronaviruses in clinical settings. Further experiments in statistically
significant number of patient samples is recommended, before se in clinical settings.
A limitation of the study is that only a part of the total number of samples that were positive for
influenza A virus between 24 June 2011 and 29 June 2012 in North West England were tested
for bocavirus and coronavirus. The 217 samples included in this study represent 36.4% of the
596 samples that were positive for influenza A virus and 5.7% of 3,804 samples tested for
respiratory virus infections during this period. Given the high co-infection rates for bocavirus
reported by other studies (87;88), probably more bocavirus infections could have been identified
if all the samples were tested. A possibility of finding more coronaviruses could also not be ruled
out.
In conclusion, this study found insignificant association between hCoV and hBoV co-infection
with seasonal influenza A viruses and risk of admission to ICU and general ward respectively,
more and larger studies are needed to confirm whether these viruses do increase disease severity
when they co-infect with influenza A viruses. Our RT-PCR protocol for the identification of
coronaviruses is sensitive, specific and reliable and could be used for diagnosis of coronaviruses.
248
Acknowledgements:
The authors would like to acknowledge the University of Manchester, the Manchester Academic
Health Science Centre, and the Central Manchester University Hospitals NHS Foundation Trust
and staff for their support in this research.
Funding:
This work was supported by the University of Manchester.
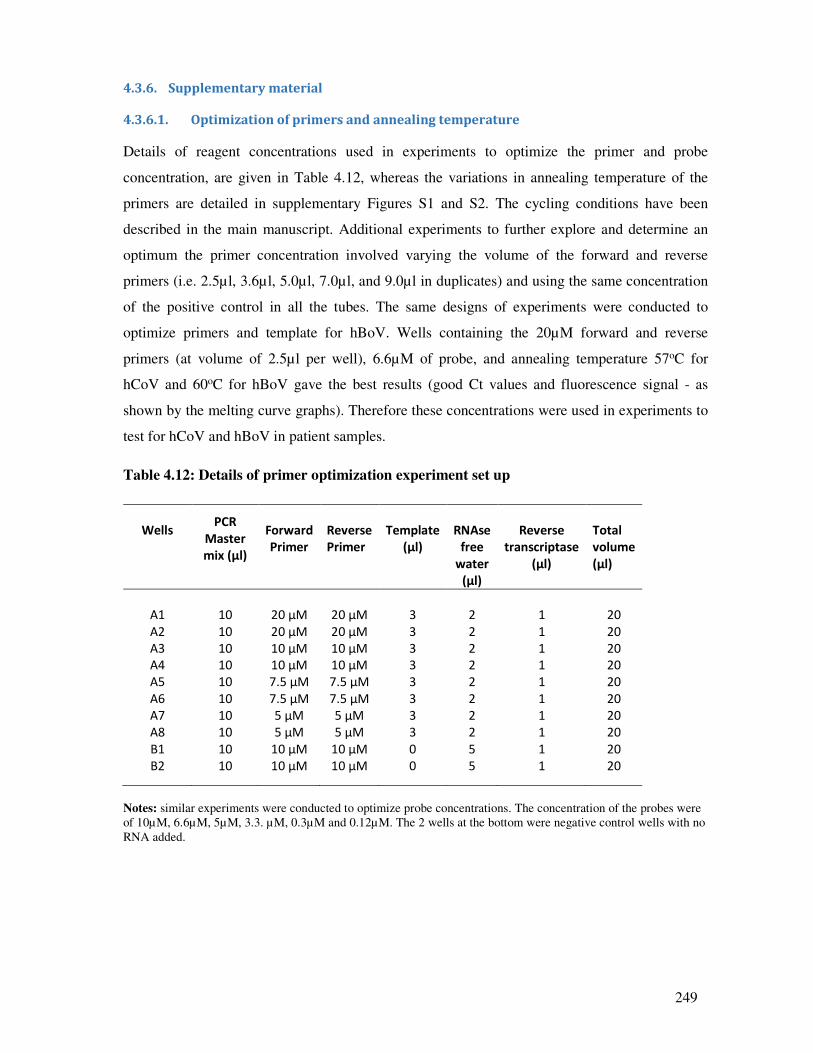
249
4.3.6. Supplementary material
4.3.6.1. Optimization of primers and annealing temperature
Details of reagent concentrations used in experiments to optimize the primer and probe
concentration, are given in Table 4.12, whereas the variations in annealing temperature of the
primers are detailed in supplementary Figures S1 and S2. The cycling conditions have been
described in the main manuscript. Additional experiments to further explore and determine an
optimum the primer concentration involved varying the volume of the forward and reverse
primers (i.e. 2.5µl, 3.6µl, 5.0µl, 7.0µl, and 9.0µl in duplicates) and using the same concentration
of the positive control in all the tubes. The same designs of experiments were conducted to
optimize primers and template for hBoV. Wells containing the 20µM forward and reverse
primers (at volume of 2.5µl per well), 6.6µM of probe, and annealing temperature 57oC for
hCoV and 60oC for hBoV gave the best results (good Ct values and fluorescence signal - as
shown by the melting curve graphs). Therefore these concentrations were used in experiments to
test for hCoV and hBoV in patient samples.
Table 4.12: Details of primer optimization experiment set up
Wells
PCR
Master
mix (µl)
Forward
Primer
Reverse
Primer
Template
(µl)
RNAse
free
water
(µl)
Reverse
transcriptase
(µl)
Total
volume
(µl)
A1 10 20 µM 20 µM 3 2 1 20
A2 10 20 µM 20 µM 3 2 1 20
A3 10 10 µM 10 µM 3 2 1 20
A4 10 10 µM 10 µM 3 2 1 20
A5 10 7.5 µM 7.5 µM 3 2 1 20
A6 10 7.5 µM 7.5 µM 3 2 1 20
A7 10 5 µM 5 µM 3 2 1 20
A8 10 5 µM 5 µM 3 2 1 20
B1 10 10 µM 10 µM 0 5 1 20
B2 10 10 µM 10 µM 0 5 1 20
Notes: similar experiments were conducted to optimize probe concentrations. The concentration of the probes were
of 10µM, 6.6µM, 5µM, 3.3. µM, 0.3µM and 0.12µM. The 2 wells at the bottom were negative control wells with no
RNA added.
250
4.3.6.2. Standard curve experiments for hCoV using RNA from 229E and pEX-A vector
The StepOne and StepOne Plus software (Applied Biosystems) was used to write the PCR
protocol. Calculation of the number of copies in each well for RNA transcribed from the pEX-A
vector is shown in Table S1, as an example. Seven serial dilutions of the RNA were pipetted into
MicroAmp Fast Reaction PCR tubes and mounted on a 48 well plate. The reaction mixture
comprised: 10µl of Power SYBR Green RT-PCR Master Mix (2X), 2.5µl forward and reverse
primer (20µM), 1µl of Arrayscript RT Enzyme mix (125X), 2µl of RNAse free water and 3µl of
RNA template in positive control well or sample. Two wells were filled with RNase free was as
negative controls. Real-time PCR experiments were conducted on the StepOne and StepOne Plus
PCR machine (Applied Biosystems) with the following cycling parameters:
Step
Parameter
Reverse transcription 48oC for 30 minutes
Enzyme activation 95oC for 10 minutes
Denaturation 95oC for 15 seconds x 40 cycles
Annealing and extension 57oC for 1 minute
Melting curve 95oC for 15 seconds
57oC for 15 seconds
95oC for 15 seconds
4.3.6.3. RNA extraction from the live hCoV 229E virus
The QIAamp® Viral RNA Mini Kit Qiagen RNA Extraction Protocol was used to extract RNA
from the live hCoV 229E (Public Health England Culture Collection, Salisbury UK), as follows:
Preparation of reagents
Addition of carrier RNA to Buffer AVL
Add 1 ml Buffer AVL to the tube containing 310 µg lyophilized carrier RNA to obtain 5.6 µg of
carrier RNA per sample. Buffer AVL/carrier is stable at 4 °C.
Buffer AW1
Buffer AW1 is supplied as a concentrate. Before using for the first time, amount of ethanol (96–
100%) as indicated on the bottle was added.
251
Buffer AW2
Buffer AW2 is supplied as a concentrate. Before using for the first time, appropriate amount of
ethanol (96–100%) was added to Buffer AW2 concentrate as indicated on the bottle.
Resuspending QIAGEN Protease
To suspend the enzyme, 6.2 of carrier RNA-AVE was added to 220µl of buffer AL.
Procedure
1. Pipette 25µl QIAGEN Protease into a 1.5ml eppendorf tube.
2. Add 200µl of hCoV virus sample.
3. Add 200µl of Buffer AL (containing 28µg/ml of carrier RNA). Close lid and mix by
pulse-vortexing for 15 seconds.
4. Incubate at 56°C for 15 minutes in a heating block.
5. Briefly centrifuge the 1.5ml tube to remove drops from the inside lid.
6. Add 250µl of ethanol (96–100%) to the sample, close the lid and mix by pulse-vortexing
for 15 seconds. Incubate the lysate with the ethanol at room temperature (15-25°C) for 5
minutes.
7. Briefly centrifuge the 1.5ml tube to remove drops from the inside of the lid.
8. Carefully apply all of the lysate into the QIAamp MinElute column without wetting the
rim. Close the lid, and centrifuge at 8000 rpm for 1 minute. Place the QIAamp Mini
column into a clean 2ml collection tube, and discard the tube containing the filtrate.
9. Carefully open the QIAamp MinElute column, and add 500µl of Buffer AW1 without
wetting the rim. Close the lid, and centrifuge at 8000 rpm for 1 min. Place the QIAamp
Mini column in a clean 2ml collection tube (provided), and discard the tube containing the
filtrate.
10. Carefully open the QIAamp MinElute column, and add 500 µl of Buffer AW2. Close the
lid and centrifuge at 8000 rpm (full speed) for 1 minute. Place the QIAamp MinElute
column in a new 2 ml collection and discard the tube containing the filtrate.
11. Carefully open the QIAamp MinElute column, and add 500 µl of ethanol (96-100%).
Close the lid and centrifuge at 8,000 rpm for 1 minute. Place the QIAamp MinElute
column in a new 2ml collection tube, and discard the tube containing the filtrate.
12. Place the QIAamp MinElute column in new 2ml collection tube and centrifuge at 14,000
rpm for 3 minutes to dry the membrane completely.
13. Place the QIAamp MinElute column in new 2ml collection tube, open the lid and incubate
at 56°C for 3 minutes in a heating block.
252
14. Place the QIAamp MinElute column into a clean 1.5ml eppendorf, and discard the
collection tube with the filtrate. Carefully open the QIAamp MinElute column and add 20-
150µl of RNase free water to the centre of the membrane. Close the lid, and incubate at
room temperature for 1 minute. Centrifuge at 14,000 rpm for 1 min.
15. To increase yield, repeat step 14, reuse elute from step 14.
4.3.6.4. RNA Synthesis and associated protocols
Linearization of plasmid
First the plasmid was digested using the following procedure:
RNAse free water 20μl
NE Buffer # 3 3μl
Acetyle BSA 10μg/ μl 0.4μl
Plasmid 3μl
Mix by pipetting then add 0.5 μl of BAMHI restriction enzyme 10units/μl
Incubated at 37°C for 2 hours.
Purification of digested plasmid
The digested plasmid was then purified using the QIAGEN Miniprep Kit as below:
Procedure
1. Preheat TE Buffer (TE) to 65-70°C for elution. Heating is optional for eluting DNA of 1-30
kilobases (kb) but is recommended for eluting DNA of >30kb.
2. Place the spin column with supernatant from restriction digestion and centrifuge for 1
minute at 12,000 rpm. Discard flow through.
3. Add 700μl Wash Buffer (W9), with ethanol, to the column and centrifuge for 1 minute at
12,000 rpm. Discard flow through.
4. Centrifuge again for 1 minute at 12,000 rpm to discharge any residual Wash Buffer (W9).
Discard flow through.
5. Place spin column in a new 1.5ml eppendorf tube. Add 75μl of preheated Buffer TE to the
centre of the column.
6. Incubate column for 1 minute at room temperature.
7. Centrifuge for 2 minutes at 12,000 rpm.
253
RNA Synthesis protocol (adopted from T7 High Yield RNA synthesis manual (New
England BioLabs, Ipswich USA)
RNA was then synthesized from the hCoV insert into the plasmid using the following protocol:
Procedure
1. Prepared master mix of reagents by mixing 10X reaction buffer and four ribonucleotide
(NTP) solutions as follows.
Nuclease-free water 5μl
10X Reaction Buffer 2μl
ATP (100 mM) 2μl 10 mM final
GTP (100 mM) 2μl 10 mM final
UTP (100 mM) 2μl 10 mM final
CTP (100 mM) 2μl 10 mM final
Template DNA 3μl (of the stock sample of pEX-A vector)
T7 RNA Polymerase Mix 5μl
Total reaction volume 20 μl
2. Mixed thoroughly by pulse-spin in microfuge. Incubated at 37°C for 2 hours using a water
bath.
DNAse treatment of synthesized RNA
DNAse treatment was conducted to remove the DNA from the synthesized RNA. The QIAGEN
RNeasy Minikit, part 2 DNAse treatment protocol (below) as described in RNeasy® Mini
Handbook (QIAGEN) was used.
Procedure:
1. Add 350μl Buffer RW1 to the RNeasy spin column. Close the lid gently, and
centrifuge for 15 seconds at 10,000 rounds per minute (rpm) to wash the spin column
membrane. Discard the flow-through.
2. Add 10μl DNase I stock solution to 70μl of Buffer RDD. Mix well by gently inverting the
tube. Centrifuge briefly.
3. Add the DNase I mix (80μl, from 2 above) directly to the RNeasy column membrane and
place on bench (20-30°C) for 15 minutes.
4. Add 350μl Buffer RW1 to the RNeasy spin column. Close the lid gently, and centrifuge
for 15 seconds at 10,000 rpm. Discard flow through.
5. Add 500 μl Buffer RPE to the RNeasy spin column. Close the lid gently, and centrifuge
for 15 seconds at 10,000 rpm to wash the spin column membrane. Discard flow through.
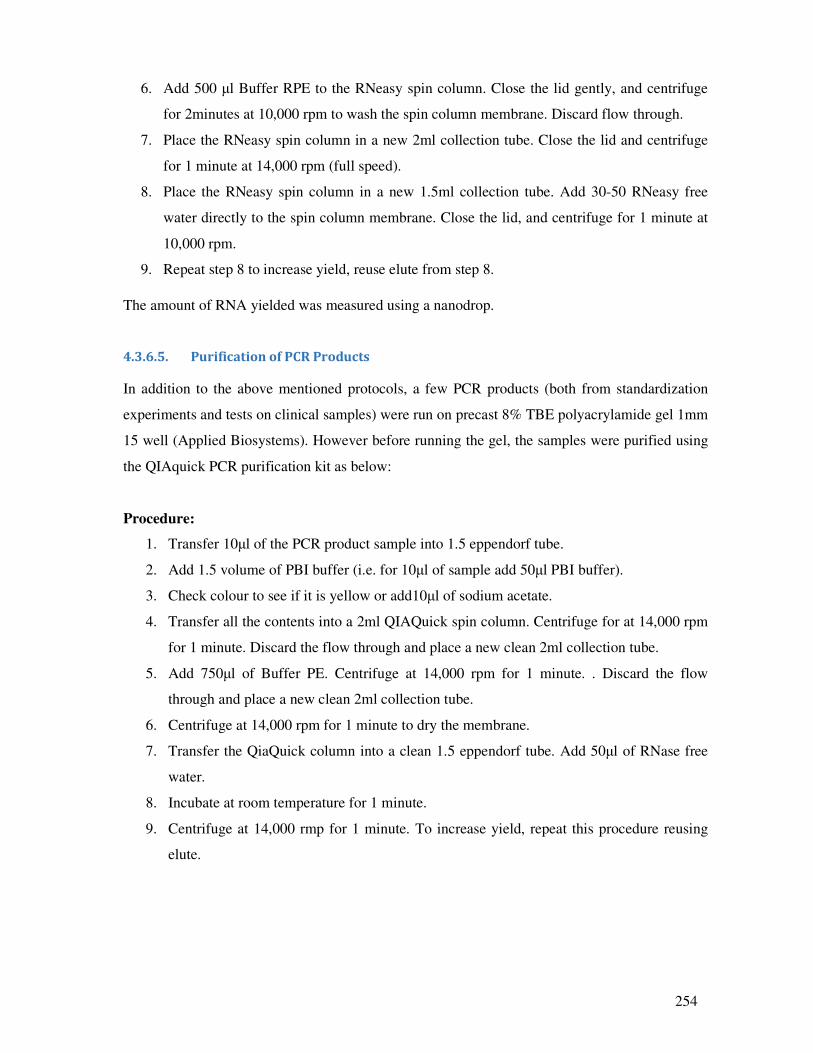
254
6. Add 500 μl Buffer RPE to the RNeasy spin column. Close the lid gently, and centrifuge
for 2minutes at 10,000 rpm to wash the spin column membrane. Discard flow through.
7. Place the RNeasy spin column in a new 2ml collection tube. Close the lid and centrifuge
for 1 minute at 14,000 rpm (full speed).
8. Place the RNeasy spin column in a new 1.5ml collection tube. Add 30-50 RNeasy free
water directly to the spin column membrane. Close the lid, and centrifuge for 1 minute at
10,000 rpm.
9. Repeat step 8 to increase yield, reuse elute from step 8.
The amount of RNA yielded was measured using a nanodrop.
4.3.6.5. Purification of PCR Products
In addition to the above mentioned protocols, a few PCR products (both from standardization
experiments and tests on clinical samples) were run on precast 8% TBE polyacrylamide gel 1mm
15 well (Applied Biosystems). However before running the gel, the samples were purified using
the QIAquick PCR purification kit as below:
Procedure:
1. Transfer 10μl of the PCR product sample into 1.5 eppendorf tube.
2. Add 1.5 volume of PBI buffer (i.e. for 10μl of sample add 50μl PBI buffer).
3. Check colour to see if it is yellow or add10μl of sodium acetate.
4. Transfer all the contents into a 2ml QIAQuick spin column. Centrifuge for at 14,000 rpm
for 1 minute. Discard the flow through and place a new clean 2ml collection tube.
5. Add 750μl of Buffer PE. Centrifuge at 14,000 rpm for 1 minute. . Discard the flow
through and place a new clean 2ml collection tube.
6. Centrifuge at 14,000 rpm for 1 minute to dry the membrane.
7. Transfer the QiaQuick column into a clean 1.5 eppendorf tube. Add 50μl of RNase free
water.
8. Incubate at room temperature for 1 minute.
9. Centrifuge at 14,000 rmp for 1 minute. To increase yield, repeat this procedure reusing
elute.
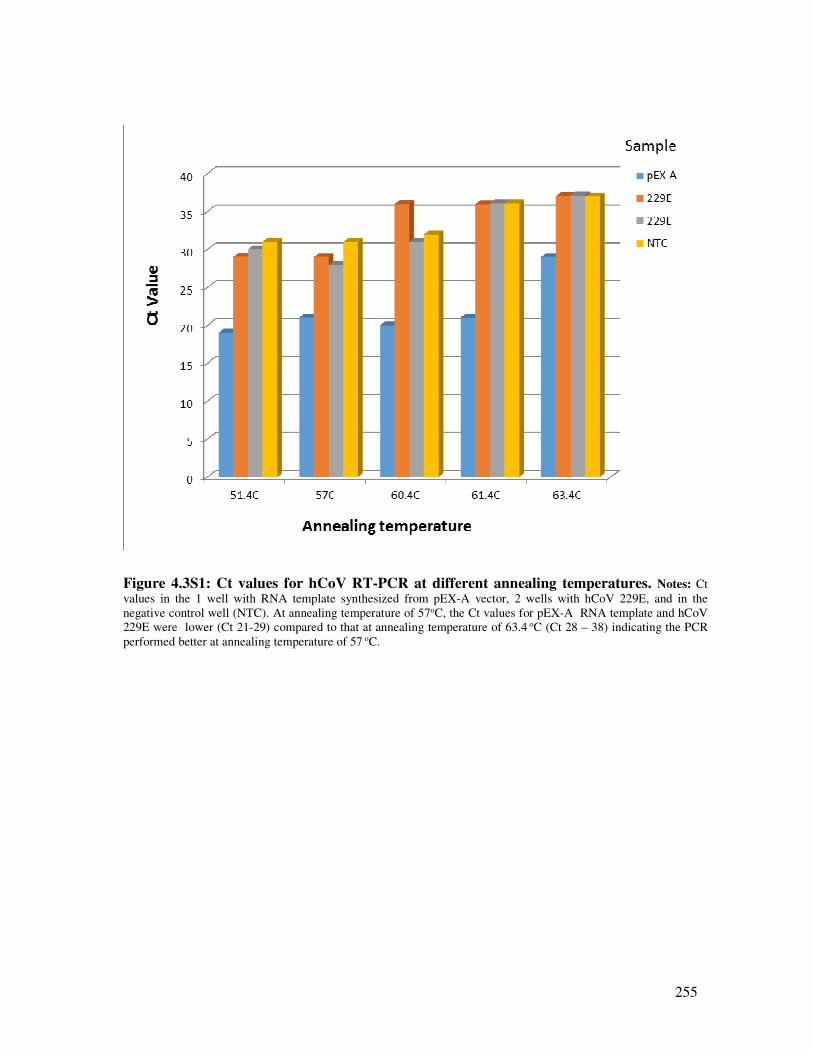
255
Figure 4.3S1: Ct values for hCoV RT-PCR at different annealing temperatures. Notes: Ct
values in the 1 well with RNA template synthesized from pEX-A vector, 2 wells with hCoV 229E, and in the
negative control well (NTC). At annealing temperature of 57oC, the Ct values for pEX-A RNA template and hCoV
229E were lower (Ct 21-29) compared to that at annealing temperature of 63.4 oC (Ct 28 – 38) indicating the PCR
performed better at annealing temperature of 57 oC.
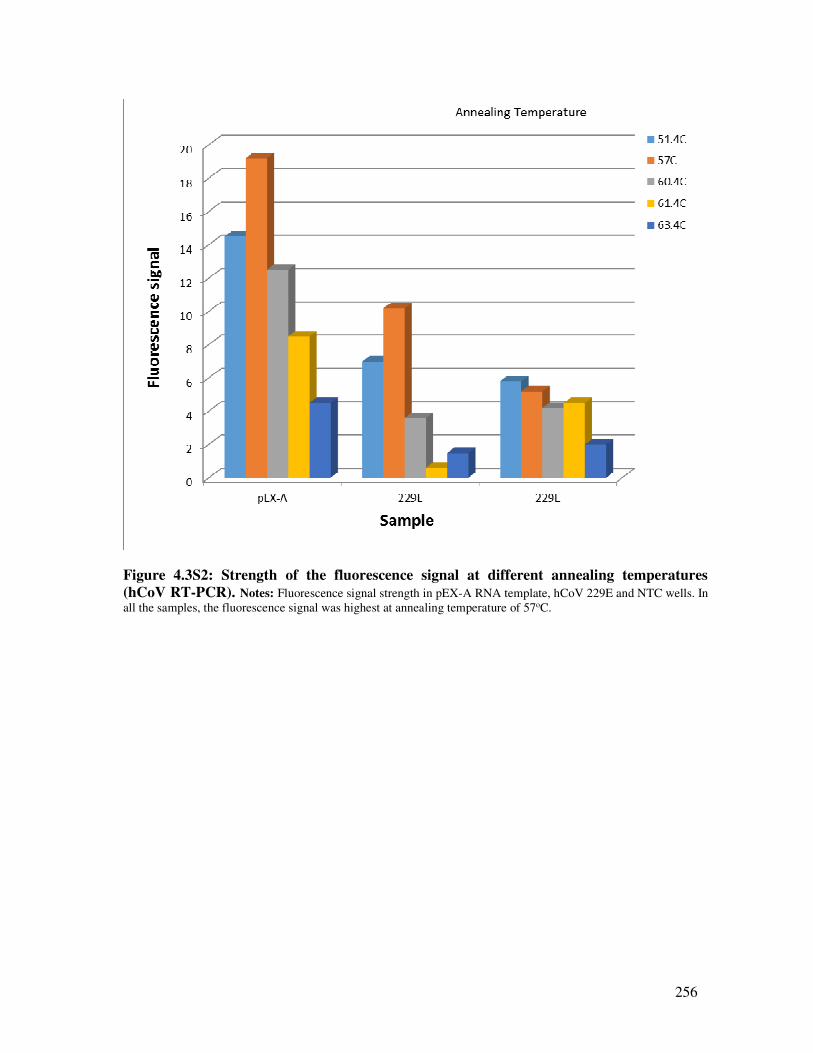
256
Figure 4.3S2: Strength of the fluorescence signal at different annealing temperatures
(hCoV RT-PCR). Notes: Fluorescence signal strength in pEX-A RNA template, hCoV 229E and NTC wells. In
all the samples, the fluorescence signal was highest at annealing temperature of 57oC.
257
Figure 4.3S3: Melting curves for the hCoV 229E, pEX-A vector RNA and the negative
control wells for the hCoV RT-PCR at annealing temperature of 57oC. Notes: Melting curve
plots for the RNA template generated from the pEX-A vector (pEX-A RNA), 2 hCoV 229E coronavirus samples,
and 2 negative control wells (NTCs) with only RNAse free water. Both the pEX-A RNA template and the
hCoV229E had their peaks at 76.63oC which lies within the Tm for coronaviruses (75.5 – 80.0oC), whereas the
primer dimers in negative control wells (formed due to use of SYBR Green dye) had Tm of 67.0oC
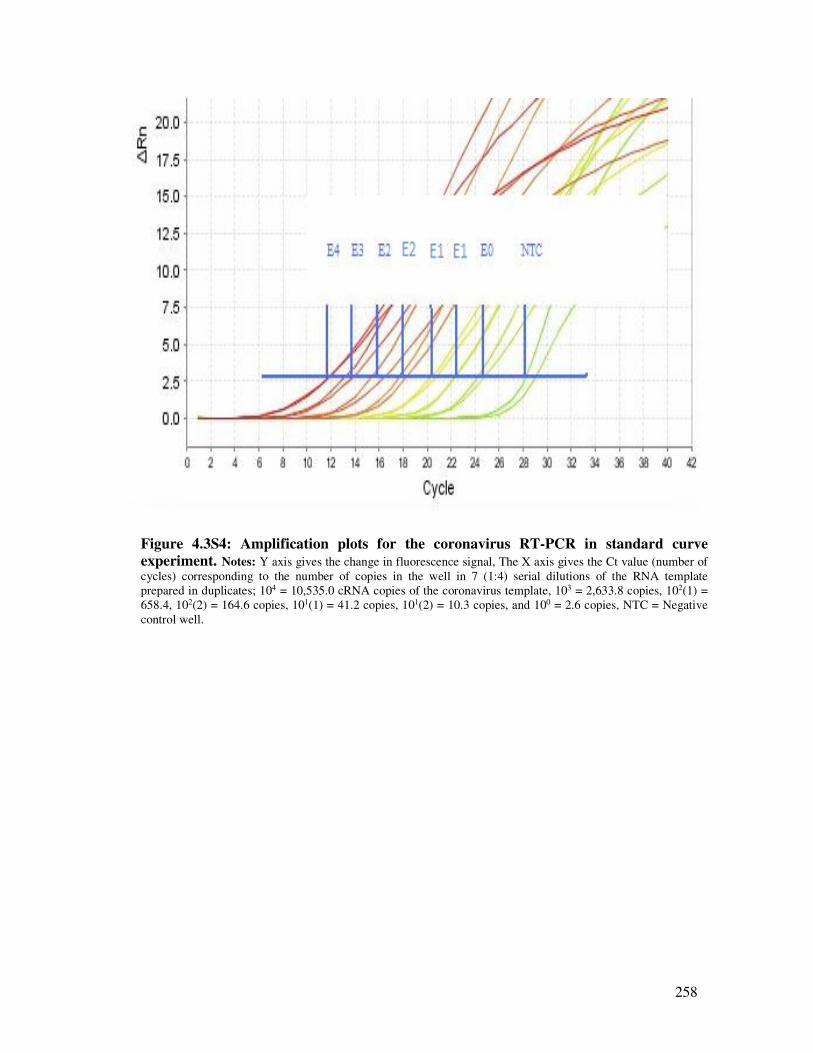
258
Figure 4.3S4: Amplification plots for the coronavirus RT-PCR in standard curve
experiment. Notes: Y axis gives the change in fluorescence signal, The X axis gives the Ct value (number of
cycles) corresponding to the number of copies in the well in 7 (1:4) serial dilutions of the RNA template
prepared in duplicates; 104 = 10,535.0 cRNA copies of the coronavirus template, 103 = 2,633.8 copies, 102(1) =
658.4, 102(2) = 164.6 copies, 101(1) = 41.2 copies, 101(2) = 10.3 copies, and 100 = 2.6 copies, NTC = Negative
control well.
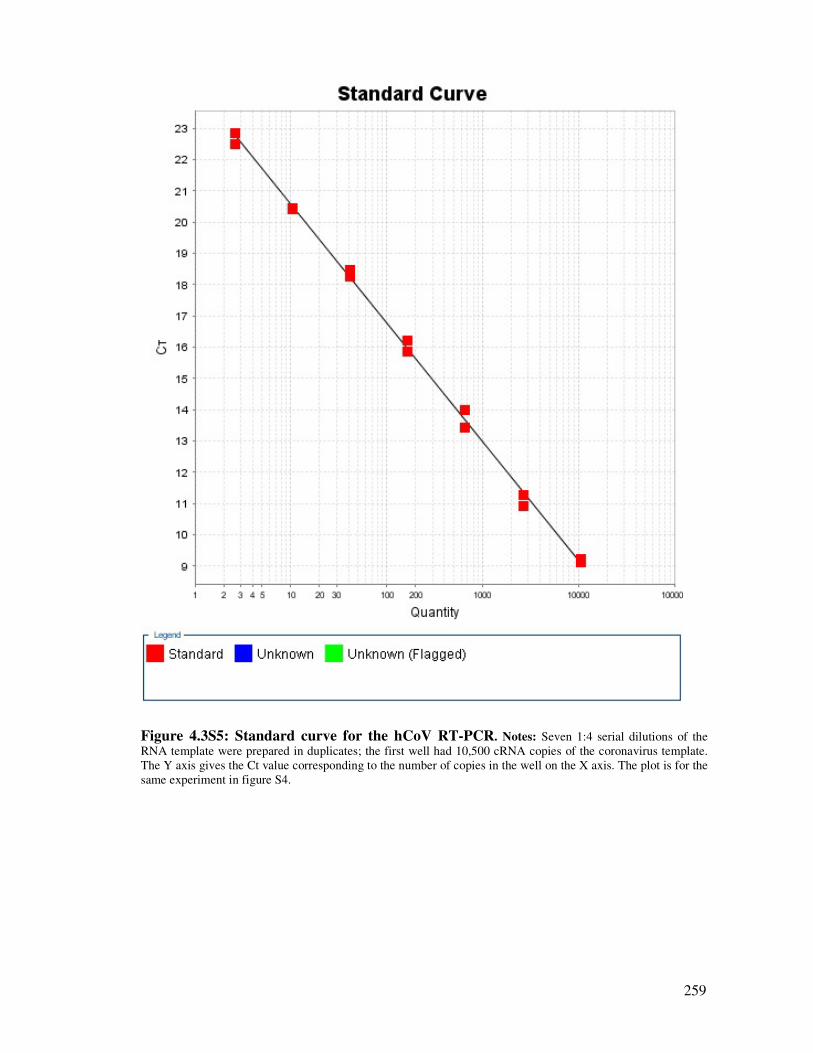
259
Figure 4.3S5: Standard curve for the hCoV RT-PCR. Notes: Seven 1:4 serial dilutions of the
RNA template were prepared in duplicates; the first well had 10,500 cRNA copies of the coronavirus template.
The Y axis gives the Ct value corresponding to the number of copies in the well on the X axis. The plot is for the
same experiment in figure S4.

260
Figure 4.3S6: Amplification plot for probe confirmation experiment for a few hCoV
positive patient samples.
Notes: The red line is for the positive control and the Ct values for the samples are 27.93, 29.01, and 29.98. All
samples that were positive in SYBR green but could not be confirmed using a probe were regarded as negative.
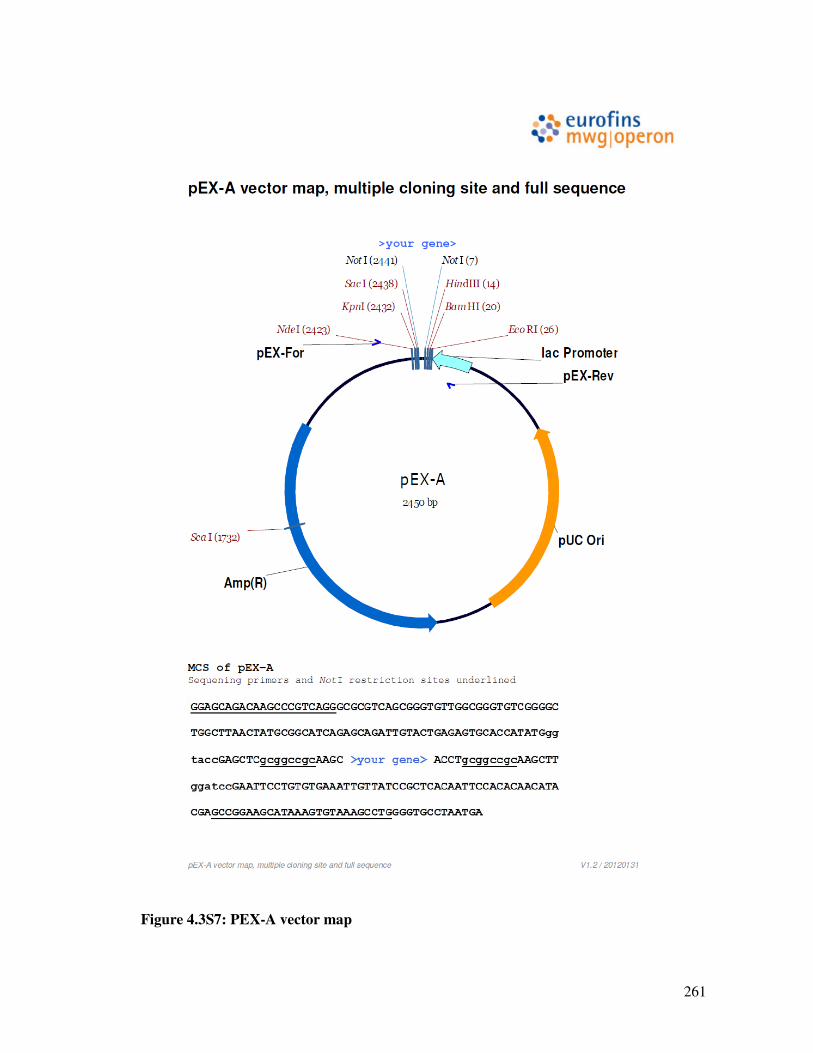
261
Figure 4.3S7: PEX-A vector map
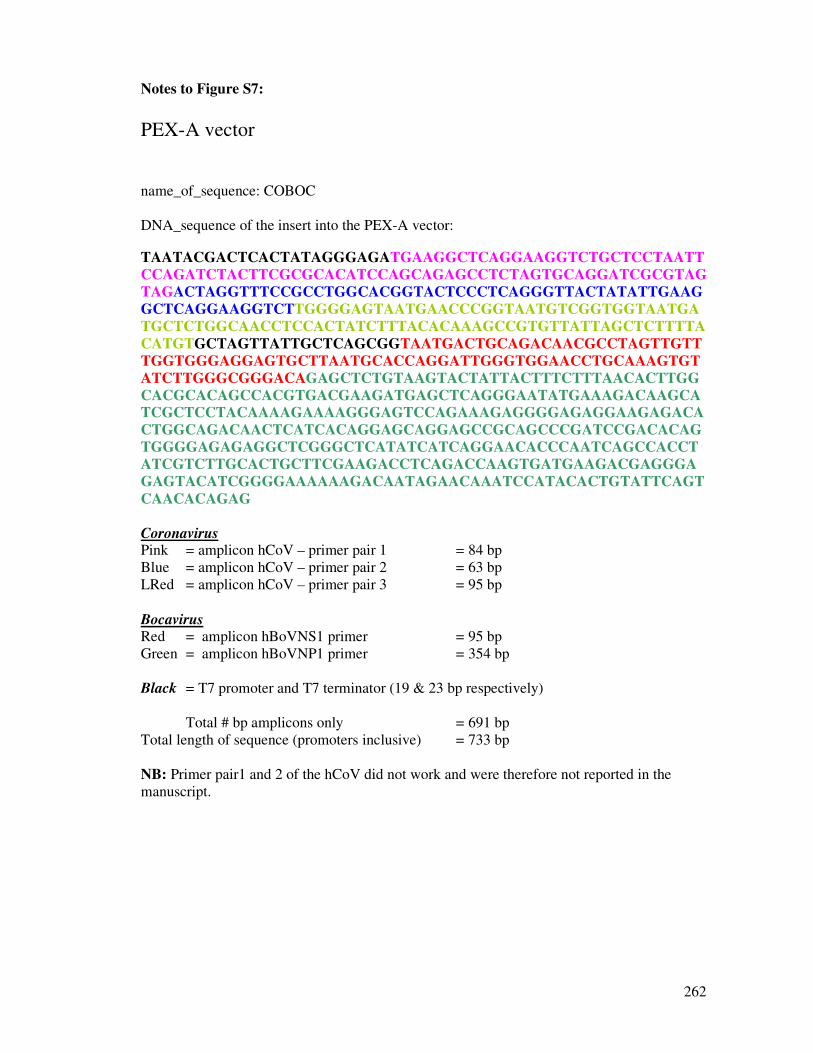
262
Notes to Figure S7:
PEX-A vector
name_of_sequence: COBOC
DNA_sequence of the insert into the PEX-A vector:
TAATACGACTCACTATAGGGAGATGAAGGCTCAGGAAGGTCTGCTCCTAATT
CCAGATCTACTTCGCGCACATCCAGCAGAGCCTCTAGTGCAGGATCGCGTAG
TAGACTAGGTTTCCGCCTGGCACGGTACTCCCTCAGGGTTACTATATTGAAG
GCTCAGGAAGGTCTTGGGGAGTAATGAACCCGGTAATGTCGGTGGTAATGA
TGCTCTGGCAACCTCCACTATCTTTACACAAAGCCGTGTTATTAGCTCTTTTA
CATGTGCTAGTTATTGCTCAGCGGTAATGACTGCAGACAACGCCTAGTTGTT
TGGTGGGAGGAGTGCTTAATGCACCAGGATTGGGTGGAACCTGCAAAGTGT
ATCTTGGGCGGGACAGAGCTCTGTAAGTACTATTACTTTCTTTAACACTTGG
CACGCACAGCCACGTGACGAAGATGAGCTCAGGGAATATGAAAGACAAGCA
TCGCTCCTACAAAAGAAAAGGGAGTCCAGAAAGAGGGGAGAGGAAGAGACA
CTGGCAGACAACTCATCACAGGAGCAGGAGCCGCAGCCCGATCCGACACAG
TGGGGAGAGAGGCTCGGGCTCATATCATCAGGAACACCCAATCAGCCACCT
ATCGTCTTGCACTGCTTCGAAGACCTCAGACCAAGTGATGAAGACGAGGGA
GAGTACATCGGGGAAAAAAGACAATAGAACAAATCCATACACTGTATTCAGT
CAACACAGAG
Coronavirus Pink = amplicon hCoV – primer pair 1 = 84 bp
Blue = amplicon hCoV – primer pair 2 = 63 bp
LRed = amplicon hCoV – primer pair 3 = 95 bp
Bocavirus Red = amplicon hBoVNS1 primer = 95 bp
Green = amplicon hBoVNP1 primer = 354 bp
Black = T7 promoter and T7 terminator (19 & 23 bp respectively)
Total # bp amplicons only = 691 bp
Total length of sequence (promoters inclusive) = 733 bp
NB: Primer pair1 and 2 of the hCoV did not work and were therefore not reported in the
manuscript.
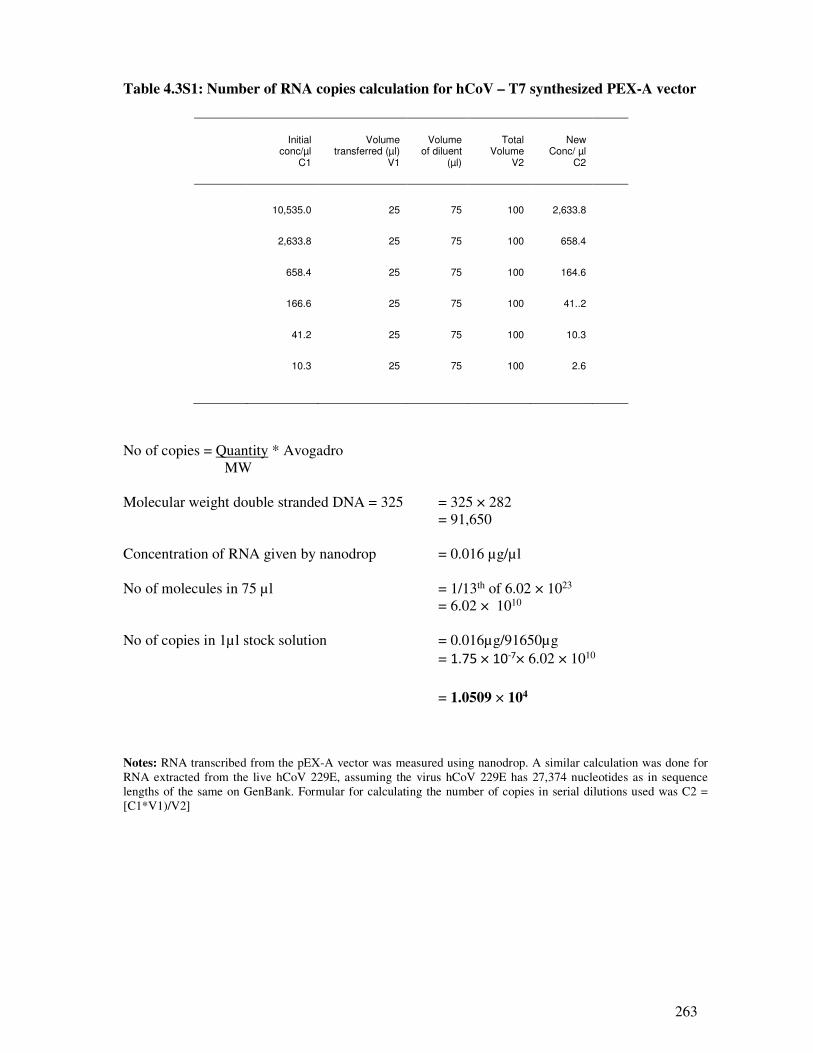
263
Table 4.3S1: Number of RNA copies calculation for hCoV – T7 synthesized PEX-A vector
Initial
conc/µl C1
Volume transferred (µl)
V1
Volume of diluent
(µl)
Total Volume
V2
New Conc/ µl
C2
10,535.0 25 75 100 2,633.8
2,633.8 25 75 100 658.4
658.4 25 75 100 164.6
166.6 25 75 100 41..2
41.2 25 75 100 10.3
10.3 25 75 100 2.6
No of copies = Quantity * Avogadro
MW
Molecular weight double stranded DNA = 325 = 325 × 282
= 91,650
Concentration of RNA given by nanodrop = 0.016 µg/µl
No of molecules in 75 µl = 1/13th of 6.02 × 1023
= 6.02 × 10¹⁰
No of copies in 1µl stock solution = 0.016µg/91650µg
= 1.75 × 10-7× 6.02 × 1010
= 1.0509 × 10⁴
Notes: RNA transcribed from the pEX-A vector was measured using nanodrop. A similar calculation was done for
RNA extracted from the live hCoV 229E, assuming the virus hCoV 229E has 27,374 nucleotides as in sequence
lengths of the same on GenBank. Formular for calculating the number of copies in serial dilutions used was C2 =
[C1*V1)/V2]
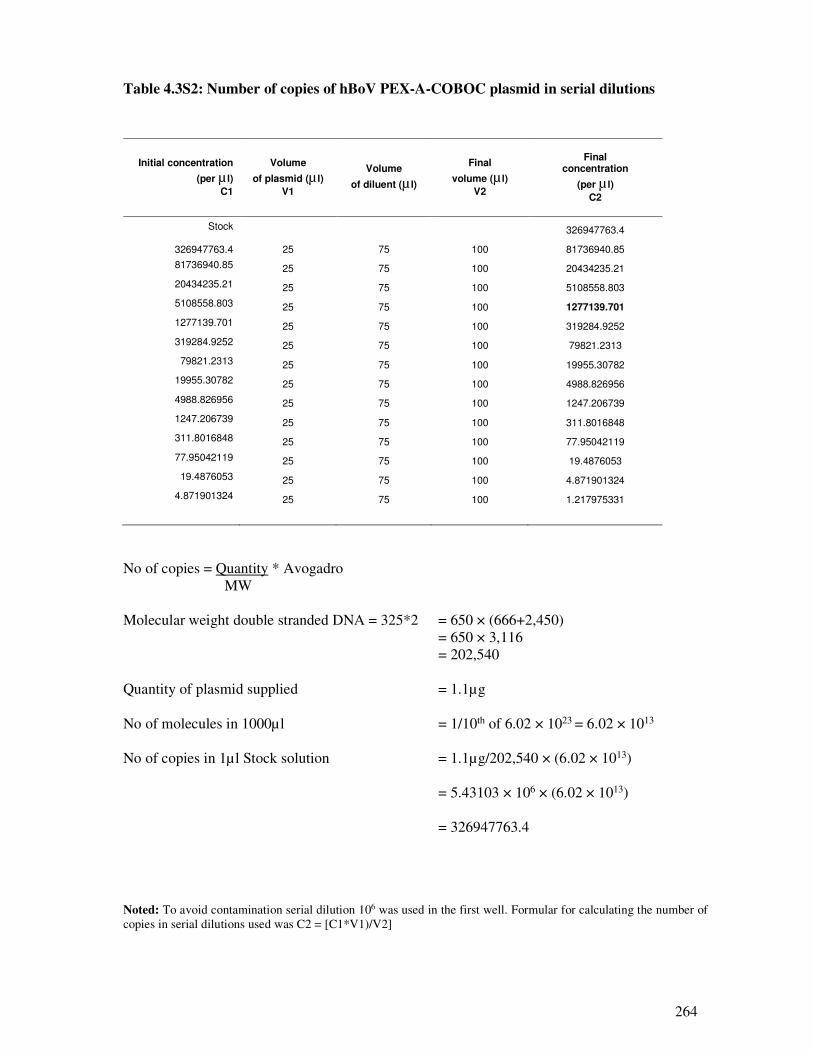
264
Table 4.3S2: Number of copies of hBoV PEX-A-COBOC plasmid in serial dilutions
Initial concentration
(per µ l)
C1
Volume
of plasmid (µ l)
V1
Volume
of diluent (µ l)
Final
volume (µ l)
V2
Final concentration
(per µ l)
C2
Stock 326947763.4
326947763.4 25 75 100 81736940.85
81736940.85 25 75 100 20434235.21
20434235.21 25 75 100 5108558.803
5108558.803 25 75 100 1277139.701
1277139.701 25 75 100 319284.9252
319284.9252 25 75 100 79821.2313
79821.2313 25 75 100 19955.30782
19955.30782 25 75 100 4988.826956
4988.826956 25 75 100 1247.206739
1247.206739 25 75 100 311.8016848
311.8016848 25 75 100 77.95042119
77.95042119 25 75 100 19.4876053
19.4876053 25 75 100 4.871901324
4.871901324 25 75 100 1.217975331
No of copies = Quantity * Avogadro
MW
Molecular weight double stranded DNA = 325*2 = 650 × (666+2,450)
= 650 × 3,116
= 202,540
Quantity of plasmid supplied = 1.1µg
No of molecules in 1000µl = 1/10th of 6.02 × 1023 = 6.02 × 10¹³
No of copies in 1µl Stock solution = 1.1µg/202,540 × (6.02 × 1013)
= 5.43103 × 106 × (6.02 × 1013)
= 326947763.4
Noted: To avoid contamination serial dilution 106 was used in the first well. Formular for calculating the number of
copies in serial dilutions used was C2 = [C1*V1)/V2]
265
Part V: Discussion and conclusion
Synopsis
This section present a summary of all the results presented in the previous sections of the thesis
and draws conclusions from the results. It also suggests directions for future research.
266
5.1. Discussion and conclusion
5.1.1. Age, gender and epidemiology of respiratory viruses
The role of age in the epidemiology of respiratory viruses is well documented (204;207-211).
In this study the majority of the identified viruses (51.8%) were in children ≤5 years old and the
incidence of ARI and influenza A viruses associated hospitalization was higher in children ≤5
years old and the elderly > 65 years old; age-specific incidence of ARI hospitalization; 4,726.3
per 100,000 in children ≤5 years old to 2,628.7 and 6,167.4 per 100,000 in patients 65 -84
years and the elderly >85 years old compared to 189.51/100,000 in 25-65 year olds. Pandemic
influenza A(H1N1)pdm09 and the seasonal influenza A viruses associated hospitalizations
ranged from 192.8 to, 86.9 per 100,000 and 23.6 to 99.8 per 100,000, respectively. In addition,
the majority of the respiratory virus co-infections 83.5% (1,014/1,214) were in under-five year
old children. Correspondingly, the majority (54.7%; 75/137) of pandemic influenza
A(H1N1)pdm09 virus co-infections and seasonal influenza A viruses co-infections (59.3%;
35/59) occurred in ≤5 year old children. This finding is in agreement with the reviewed
literature which showed that, in general, studies that recruited children <6 years old reported
higher co-infection rates (5.7 - 62.0%) than those that recruited both children and adults (5.0 –
14.0%). This study included both children and adults and this finding supports targeted
influenza vaccination of ≤5 year old children and the elderly ≥65 years old.
In this study, respiratory virus infections were significantly higher in males than in females. Of
the 11,236 PCR positive for any respiratory virus, that had information on their gender
available, the majority, 5,822 (51.8%) were males compared to 5,414 (48.2%) females and the
difference was statistically significant (p = 0.01). Historical evidence has been divided with
some studies finding high levels of infections in females (204;210) and others indicating
respiratory viruses are higher in males, especially young boys (64;208;324). The reason for the
“male flu” are not well understood, it could however be due to gender related immune
responses (28-30). Some studies have suggested that gender may predispose individuals to
susceptible genes (28), or sex specific hormones e.g. testosterone select men to poor immunity
phenotype (29;30). It could also be due to differences in service utilisation between males and
females. Public health educational programmes raising awareness on the subject in order to
improve health are recommended. More research to elucidate the gender related risk factors in
encouraged.
267
5.1.2. Burden of co-infection and associated hospitalizations and mortality
5.1.2.1. Influenza A viruses co-infections and disease outcome
Among influenza viruses, RSV had the highest number of co-infections (68), of which 43 were
with the pandemic virus and 25 with the seasonal virus, followed by RV (65/56; 9), Flu B
(35/18; 17), AdV (27/20; 7), hBoV (17), hCoV (12), hMPV (10/4; 6), and hPIV1-3 (5; 0). The
results of logistic regression models controlling for age, presented in the preceding chapters,
indicate that co-infection with Flu B, RSV, hCoV and hBoV increased risk of admission to ICU
or death: (OR: 22.0, 95% CI: 2.21 – 219.84, p = 0.008 for Seasflu A/Flu B, OR: 3.40, 95% CI:
0.75 – 15.15, p = 0.11 for Flu Apdm09/Flu B, OR: 1.48, 95% CI: 0.14 – 14.86, p = 0.74
SeasFlu A/RSV, OR: 2.0, 95% CI: 0.33 – 10.70, p = 0.48 SeasFlu A/hCoV and OR: 1.40, 95%
CI: 0.14 – 13.98, p = 0.77 for SeasFlu A/hBoV), although the other four associations were not
statistically significant. In addition, the results also suggest an association between Flu B, RSV,
AdV and hBoV co-infection and increased risk of admission to a general ward (OR: 2.20, 95%
CI: 0.85 – 5.74, p 0.12 for Flu Apdm09/RSV, OR: 4.64, 95% CI: 0.60 – 35.73, p = 0.14 for Flu
Apdm09/AdV, OR: 2.0, 95% CI: 0.24 – 15.0, p = 0.54 for SeasFlu A/Flu B, and OR: 2.19, 95%
CI: 0.65 – 7.33, p = 0.21 for SeasFlu A/hBoV) respectively but none of these associations was
statistically significant.
To understand the public health significance of the various co-infections, a Population
Attributable Risk Percent (PAR%) analysis was conducted and results on the role of different
co-infections summarized in Table 5.1. A review of the co-infection patterns between influenza
and other respiratory viruses was conducted using a meta-analysis. Combining the data from
the primary study and the meta-analysis, the evidence suggest that Flu B virus co-infection
would be responsible for up to 12.2% of all influenza A virus associated hospitalizations and up
to 94.6% of admissions to ICU or deaths, whereas RSV and AdV would contribute to 31.1%
and 18. 4% of influenza virus A associated admissions to the ICU respectively. Since only a
small proportion (0.07%; 217/30,975) of the samples in this study were tested for hCoV and
hBoV, PAR% was not calculated for hCoV and hBoV despite the observed high Flu A/hBoV
co-infection rate (20.9%), in the meta-analysis, and similar rates in previous reviews (87;88).
Research on vaccines (e.g. AdV- serotype 5 based with Flu A/RSV inserts vaccine and drugs
targeting Flu A, RSV/AdV attachment proteins), combined drugs, and multi-target tests for
these viruses is recommended.
Influenza A and B viruses differ only in the their NP and M genes (130), therefore competition
between them is driven by, among other factors, positive selection (527;634;635). The positive
association between Flu A and RSV, AdV, hCoV and hBoV co-infections and severe or fatal
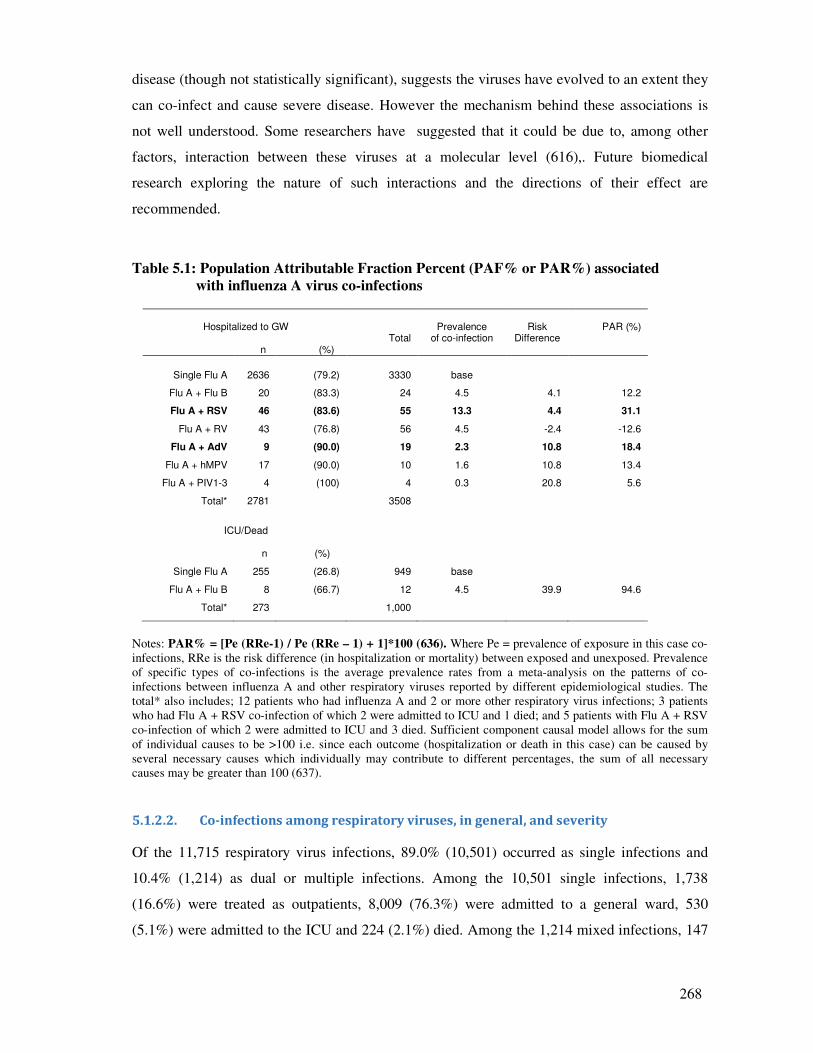
268
disease (though not statistically significant), suggests the viruses have evolved to an extent they
can co-infect and cause severe disease. However the mechanism behind these associations is
not well understood. Some researchers have suggested that it could be due to, among other
factors, interaction between these viruses at a molecular level (616),. Future biomedical
research exploring the nature of such interactions and the directions of their effect are
recommended.
Table 5.1: Population Attributable Fraction Percent (PAF% or PAR%) associated
with influenza A virus co-infections
Hospitalized to GW
n (%)
Total
Prevalence
of co-infection
Risk
Difference
PAR (%)
Single Flu A 2636 (79.2) 3330 base
Flu A + Flu B 20 (83.3) 24 4.5 4.1 12.2
Flu A + RSV 46 (83.6) 55 13.3 4.4 31.1
Flu A + RV 43 (76.8) 56 4.5 -2.4 -12.6
Flu A + AdV 9 (90.0) 19 2.3 10.8 18.4
Flu A + hMPV 17 (90.0) 10 1.6 10.8 13.4
Flu A + PIV1-3 4 (100) 4 0.3 20.8 5.6
Total* 2781 3508
ICU/Dead
n (%)
Single Flu A 255 (26.8) 949 base
Flu A + Flu B 8 (66.7) 12 4.5 39.9 94.6
Total* 273 1,000
Notes: PAR% = [Pe (RRe-1) / Pe (RRe – 1) + 1]*100 (636). Where Pe = prevalence of exposure in this case co-
infections, RRe is the risk difference (in hospitalization or mortality) between exposed and unexposed. Prevalence
of specific types of co-infections is the average prevalence rates from a meta-analysis on the patterns of co-
infections between influenza A and other respiratory viruses reported by different epidemiological studies. The
total* also includes; 12 patients who had influenza A and 2 or more other respiratory virus infections; 3 patients
who had Flu A + RSV co-infection of which 2 were admitted to ICU and 1 died; and 5 patients with Flu A + RSV
co-infection of which 2 were admitted to ICU and 3 died. Sufficient component causal model allows for the sum
of individual causes to be >100 i.e. since each outcome (hospitalization or death in this case) can be caused by
several necessary causes which individually may contribute to different percentages, the sum of all necessary
causes may be greater than 100 (637).
5.1.2.2. Co-infections among respiratory viruses, in general, and severity
Of the 11,715 respiratory virus infections, 89.0% (10,501) occurred as single infections and
10.4% (1,214) as dual or multiple infections. Among the 10,501 single infections, 1,738
(16.6%) were treated as outpatients, 8,009 (76.3%) were admitted to a general ward, 530
(5.1%) were admitted to the ICU and 224 (2.1%) died. Among the 1,214 mixed infections, 147
269
(12.1%) were outpatients, 992 (81.7%) were hospitalized to a general ward, 57 (4.7%) were
admitted to ICU and 18 (1.5%) died.
In a multivariate logistic regression, controlling for age and season, co-infection among
respiratory viruses, in general, was associated with a 43% increase in risk of admission to a
general ward (OR: 1.43, 95% CI: 1.20 – 1.71, p = <0.0001) and a 15% increase in risk of
admission to ICU or death (OR: 1.15, 95% CI: 0.86 – 1.55), although the association with ICU
was not statistically significant (p = 0.34). In the stratified analysis, Flu Apdm09/Flu B co-
infection increased the risk of admission to ICU 22-fold (OR: 22.0, 95% CI: 2.21 – 219.8, p =
0.008), yet the pandemic influenza A(H1N1)pdm09 virus caused mild illness as a single
infection (risk of admission to GW, OR: 0.62, 95% CI: 0.55 – 0.70, p = <0.0001, and
ICU/death OR: 0.89, 95% CI: 0.72 – 1.10, p = 0.21) . This result suggest that co-infection is a
significant predictor of respiratory virus illness, however, its true effect is obscured, or biases
towards the null, when crude analysis is applied. Future studies should endeavour to carry out
stratified analysis.
The risks of hospitalization and mortality identified by this study were substantial and fall
within the risks reported by the reviewed studies (range 18.8 – 3,046 per 100,000 population)
for hospitalization and for mortality (range 5.0 -220.9) (232;249;250;293-296). Vaccination
and early treatment with anti-viral drugs would produce economic gains. The World Health
Organisation called for concerted efforts in research to generate evidence on need for
development of vaccines and drugs for respiratory viruses, and R&D on vaccines and drugs
(98). The results of this study provide the much needed evidence for the same. As co-infection
has been found here to be a significant contributor to respiratory viruses’ disease severity,
multi-targeted testing, combined treatment and vaccination would be more cost-effective.
However, as described in the preceding paragraphs, this research found that Flu A co-infection
with Flu B, RSV, and AdV would more likely cause illnesses of public health significance,
therefore we reiterate our recommendations towards development of integrated drugs and
vaccines targeting these viruses. A number of potential vaccines and treatment protocols, are
under development, an AdV based vaccine with influenza and RSV inserts; and drugs targeting
the attachment proteins has been recommended because some researchers have already
described the limitations of serum antibody responses, hence antibody therapeutics to RNA
viruses (141-145;638).
270
5.1.3. Possible interaction between RV and influenza A viruses
The logistic models suggested that rhinoviruses reduced severity of influenza A viruses (OR:
0.92, 95% CI: 0.48 – 1.74, p = 0.79 in pandemic virus analysis), and the PAR analysis here
attribute a 12.6% reduction of this risk. Aberle et al., (80) and Esper et al., (81) also found
reduction in disease severity among co-infections involving rhinoviruses. Some studies that
investigated interaction between rhinovirus and other respiratory viruses Greer et al., (541),
Linde et al.,(544) and Casalegno et al., (545) suggested that rhinovirus interfere with influenza
virus or other respiratory viruses infection. Evidence from this study indicates that influenza
virus co-circulated with rhinovirus, for example between November 2008 and March 2010
(Figure 5.1). However, the majority 97.0% (3,626/3740) of RV infections occurred in samples
that were negative for influenza A viruses, so did the majority of RSV (96.2%; 2,725/2,832),
AdV (95.4%; 725/760), hMPV (97.4%; 561/576), and hPIV1-3 (98.1%; 623/635). RV was the
most co-infecting virus, involved in among others; 367 exclusive dual-infections with RSV,
169 with AdV, 63 with hPIV-3, 61 with hMPV, 56 with pandemic influenza A(H1N1)pdm09
and 9 with seasonal influenza A viruses (Table 4.1). In addition, the majority of the RV co-
infections with other respiratory viruses e.g. 98.8% (413/418) of RV/RSV, 97.8% (222/227) of
RV/AdV, occurred in patients who were negative for influenza viruses, suggesting that RV
interferes with influenza virus.
Although there is a possibility that this outcome could be due to ecological fallacy, where
observations at ecological and individual level have no direct association. Nevertheless, these
results, highlight the need for further research investigating the virus-virus interactions between
influenza A and rhinovirus, or among other respiratory viruses, exploring the biomedical
processes involved and their association with virulence. Such as in vivo studies in knockout
mice [i.e. mice with mitochondrial antiviral signaling protein (MAVS), or toll like receptor
(TLR) and other genes involved in signalling of interferon innate immune response knocked
out], investigating the pathogenicity of influenza A and RV co-infection; histological changes
in the lungs, interferon produced, viral loads and survival of the mice maybe worthwhile.
Alternatively a selective of these outcomes could also be investigated in vitro experiments
using cell culture systems. Currently, most of vaccine research concentrates on use of
baculovirus or adenovirus expression vectors. Rhinovirus might offer good alternatives for
RNA virus-virus and virus-host interactions, the results of which could be used for research on
development of vaccines or drugs against influenza and other respiratory virus infections
(639;640).
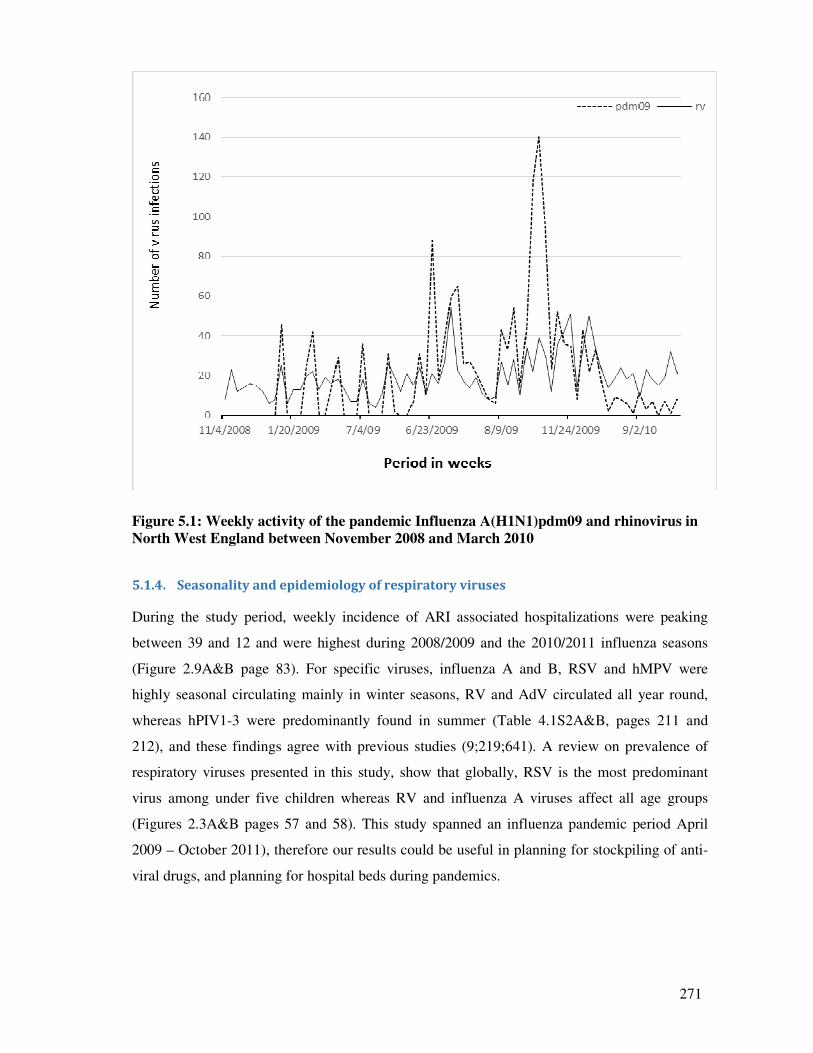
271
Figure 5.1: Weekly activity of the pandemic Influenza A(H1N1)pdm09 and rhinovirus in
North West England between November 2008 and March 2010
5.1.4. Seasonality and epidemiology of respiratory viruses
During the study period, weekly incidence of ARI associated hospitalizations were peaking
between 39 and 12 and were highest during 2008/2009 and the 2010/2011 influenza seasons
(Figure 2.9A&B page 83). For specific viruses, influenza A and B, RSV and hMPV were
highly seasonal circulating mainly in winter seasons, RV and AdV circulated all year round,
whereas hPIV1-3 were predominantly found in summer (Table 4.1S2A&B, pages 211 and
212), and these findings agree with previous studies (9;219;641). A review on prevalence of
respiratory viruses presented in this study, show that globally, RSV is the most predominant
virus among under five children whereas RV and influenza A viruses affect all age groups
(Figures 2.3A&B pages 57 and 58). This study spanned an influenza pandemic period April
2009 – October 2011), therefore our results could be useful in planning for stockpiling of anti-
viral drugs, and planning for hospital beds during pandemics.
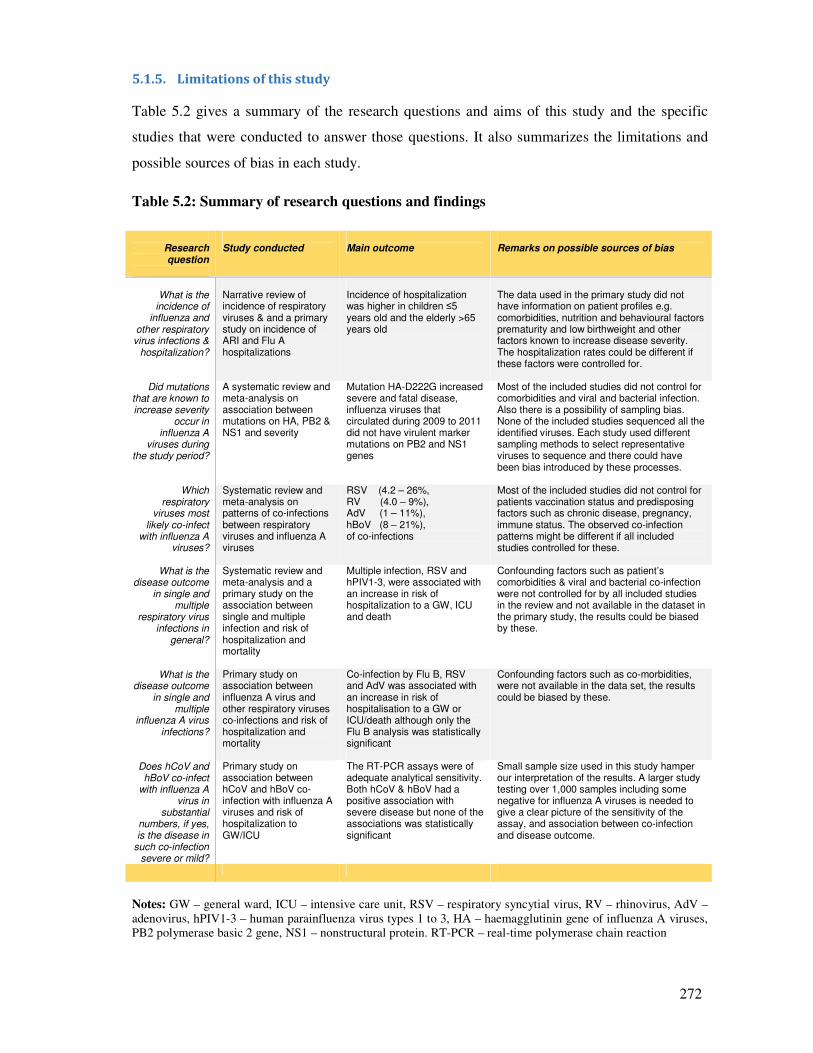
272
5.1.5. Limitations of this study
Table 5.2 gives a summary of the research questions and aims of this study and the specific
studies that were conducted to answer those questions. It also summarizes the limitations and
possible sources of bias in each study.
Table 5.2: Summary of research questions and findings
Research question
Study conducted
Main outcome
Remarks on possible sources of bias
What is the
incidence of influenza and
other respiratory virus infections &
hospitalization?
Narrative review of incidence of respiratory viruses & and a primary study on incidence of ARI and Flu A hospitalizations
Incidence of hospitalization was higher in children ≤5 years old and the elderly >65 years old
The data used in the primary study did not have information on patient profiles e.g. comorbidities, nutrition and behavioural factors prematurity and low birthweight and other factors known to increase disease severity. The hospitalization rates could be different if these factors were controlled for.
Did mutations that are known to increase severity
occur in influenza A
viruses during the study period?
A systematic review and meta-analysis on association between mutations on HA, PB2 & NS1 and severity
Mutation HA-D222G increased severe and fatal disease, influenza viruses that circulated during 2009 to 2011 did not have virulent marker mutations on PB2 and NS1 genes
Most of the included studies did not control for comorbidities and viral and bacterial infection. Also there is a possibility of sampling bias. None of the included studies sequenced all the identified viruses. Each study used different sampling methods to select representative viruses to sequence and there could have been bias introduced by these processes.
Which respiratory
viruses most likely co-infect
with influenza A viruses?
Systematic review and meta-analysis on patterns of co-infections between respiratory viruses and influenza A viruses
RSV (4.2 – 26%, RV (4.0 – 9%), AdV (1 – 11%), hBoV (8 – 21%), of co-infections
Most of the included studies did not control for patients vaccination status and predisposing factors such as chronic disease, pregnancy, immune status. The observed co-infection patterns might be different if all included studies controlled for these.
What is the disease outcome
in single and multiple
respiratory virus infections in
general?
Systematic review and meta-analysis and a primary study on the association between single and multiple infection and risk of hospitalization and mortality
Multiple infection, RSV and hPIV1-3, were associated with an increase in risk of hospitalization to a GW, ICU and death
Confounding factors such as patient’s comorbidities & viral and bacterial co-infection were not controlled for by all included studies in the review and not available in the dataset in the primary study, the results could be biased by these.
What is the disease outcome
in single and multiple
influenza A virus infections?
Primary study on association between influenza A virus and other respiratory viruses co-infections and risk of hospitalization and mortality
Co-infection by Flu B, RSV and AdV was associated with an increase in risk of hospitalisation to a GW or ICU/death although only the Flu B analysis was statistically significant
Confounding factors such as co-morbidities, were not available in the data set, the results could be biased by these.
Does hCoV and hBoV co-infect
with influenza A virus in
substantial numbers, if yes, is the disease in
such co-infection severe or mild?
Primary study on association between hCoV and hBoV co-infection with influenza A viruses and risk of hospitalization to GW/ICU
The RT-PCR assays were of adequate analytical sensitivity. Both hCoV & hBoV had a positive association with severe disease but none of the associations was statistically significant
Small sample size used in this study hamper our interpretation of the results. A larger study testing over 1,000 samples including some negative for influenza A viruses is needed to give a clear picture of the sensitivity of the assay, and association between co-infection and disease outcome.
Notes: GW – general ward, ICU – intensive care unit, RSV – respiratory syncytial virus, RV – rhinovirus, AdV –
adenovirus, hPIV1-3 – human parainfluenza virus types 1 to 3, HA – haemagglutinin gene of influenza A viruses,
PB2 polymerase basic 2 gene, NS1 – nonstructural protein. RT-PCR – real-time polymerase chain reaction
273
5.1.5.1. Limitations in the systematic review and meta-analysis papers
In the review of the mutations associated with severity of the pandemic influenza
A(H1N1)pdm09 virus, the three major sources of bias included how was sampling of the
viruses that were sequenced done? Was the selection process good enough to achieve a
representative sample of all the influenza viruses circulating during the study period? Secondly,
did the studies control for demographic, comorbidities and bacteria and virus co-infections?
Lastly the number of genes sequenced in each study.
Most of the studies did not control for comorbidities; only 6/18 (33.3%) of the included studies
controlled for comorbidities. Further, only one study each investigated and reported bacterial
and respiratory virus co-infections. Patients with comorbidities such as chronic renal disease,
chronic heart disease, chronic liver disease, chronic neurological disease, atopic dermatitis for
example, have been reported to have more severe form of disease (severity increasing up to 35
fold) compared to those without these factors (9-13). Similarly, bacterial and respiratory virus
co-infections have been associated with more severe outcome (15;59;76;513-517). Therefore,
the observed risk differences in the meta-analysis could have been biased towards the null due
to the crude estimates we have used, higher risk differences could have been observed if
stratified analysis, controlling for these factors, was conducted and this should be born in mind
when interpreting our results.
In addition, the review on patterns of co-infections between influenza A and other respiratory
viruses, apart from comorbidities, factors such as immune status, pregnancy, malnutrition,
obesity, are known to increase risk of infection with respiratory viruses (10;11;13;23). Also
important is vaccination status. Some studies have indicated that influenza vaccination might
increase patients susceptibility to infection by other respiratory virus (561-563). The inclusion
criteria adopted in this review was for studies to have had controlled for at least 2 of these
confounding factors. However, there was a great variation in the number of factors controlled
for by included studies and this might, again, have biased the estimates towards the null, in
those cases where very few confounding factors were controlled for. Therefore this should be
born in mind when interpreting our co-infections estimates. Similar observation are made for
the review on association between co-infections and risk of hospitalization to a GW or the ICU,
risk of developing bronchiolitis, and pneumonia.
274
5.1.5.2. Limitations inherent in the four primary studies
A general observation is that the dataset used to write the 4 primary studies (listed in Table 5.2)
did not contain information on the variables known to affect susceptibility to respiratory virus
infections or affect disease severity. The dataset only contained age, sex, season/year, and
disease outcome (admission to GW, ICU or death). It did not contain factors such as: co-
morbidities [chronic respiratory disease such as asthma and chronic obstructive pulmonary
disease (COPD), diabetes, ischaemic heart disease, chronic renal disease, chronic heart disease,
chronic liver disease, chronic neurological disease], obesity, pregnancy, immune status,
influenza vaccination status and treatment regiments administered, bacterial co-infection,
prematurity, low birthweight, malnutrition, host genetics and mutations in human gene. In
addition, due to cost implications, we did not sequence the influenza or other respiratory
viruses identified in the patient samples included in this study.
Table 5.3 summarizes the prevalence of these factors in the United Kingdom. The most
important risk factors are: obesity (affecting 26.2% of adults aged ≥16 years old and 8.8 – 20%
of children <11 years old - UK); asthma (5.4 million - UK), COPD (3.8 million – England);
diabetes (2.5 million - England); and coronary heart disease (2.3 million - UK). Most of the at
risk individuals, i.e. children >6 months old and ≤5 years old, and the elderly >65 years old,
responded very well to influenza vaccination campaigns during the study period; Vaccine
uptakes reaching up to 74% among the elderly >65 years old in England in 2011/12 season.
However vaccine uptake among pregnant women was lower (51%).
It is, therefore more likely that some of the patients who had samples sent to MMPL for
screening for respiratory viruses, might have had one or two of these factors. Apart from
asthma, leukaemia, and low birthweight, most of these factors affect mainly adults ≥40 years
old. Figure 5.2 gives a plot of the ratio between the numbers of hospitalizations to deaths
among patients who had a sample tested for a respiratory virus at MMPL between 2007 and
2012. There was a positive correlation between age and risk of hospitalization and subsequent
death. For example, among patients positive for any respiratory virus, the hospitalization: death
ratio was 0.01 in ≤5 year olds, steadily increasing to 0.07 among patients ages 40-64 years old.
Similar results are observed for Flu Apdm09 and seasonal influenza A viruses (Figure 5.2).
Given the correlation between age and comorbidities, it would be plausible to conclude that the
deaths also correlate with comorbidities. As these factors are known to increase severity of
respiratory virus infections, and since we did not control for them in our analysis, our estimated
odds ratios, for the association between co-infections and risk of hospitalization and death,
might have been biased towards the null and could have been higher.
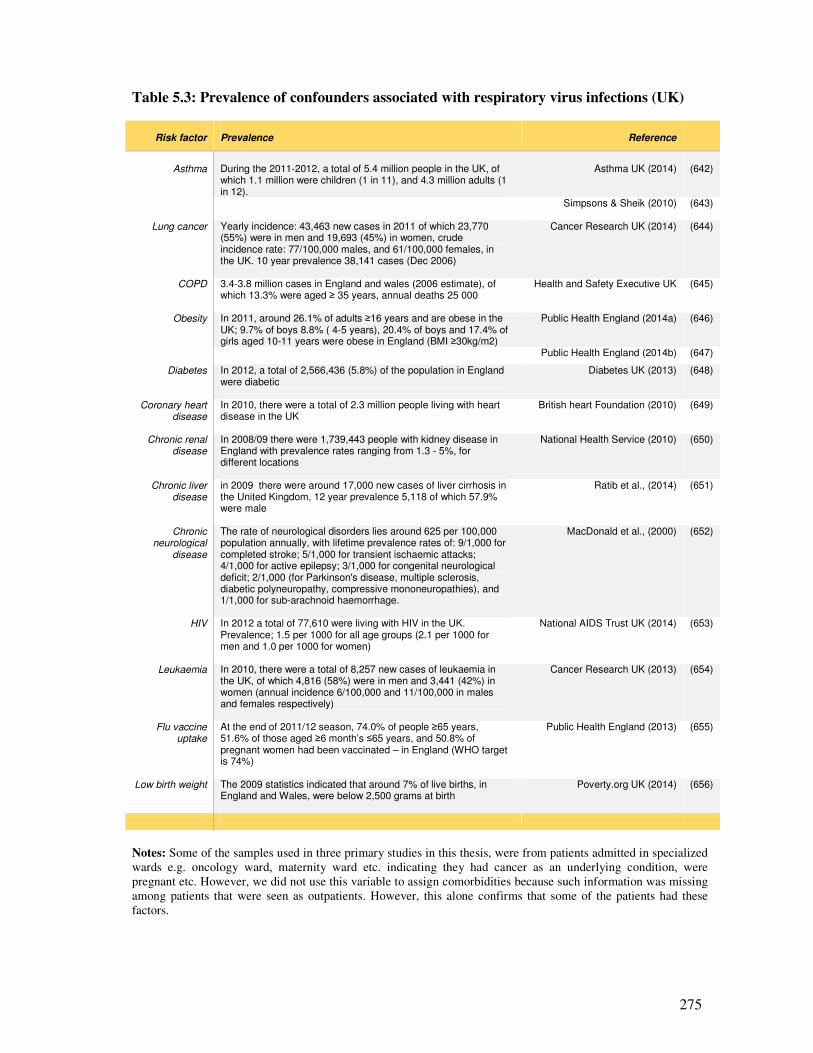
275
Table 5.3: Prevalence of confounders associated with respiratory virus infections (UK)
Risk factor
Prevalence
Reference
Asthma
During the 2011-2012, a total of 5.4 million people in the UK, of which 1.1 million were children (1 in 11), and 4.3 million adults (1 in 12).
Asthma UK (2014)
(642)
Simpsons & Sheik (2010) (643)
Lung cancer Yearly incidence: 43,463 new cases in 2011 of which 23,770 (55%) were in men and 19,693 (45%) in women, crude incidence rate: 77/100,000 males, and 61/100,000 females, in the UK. 10 year prevalence 38,141 cases (Dec 2006)
Cancer Research UK (2014) (644)
COPD 3.4-3.8 million cases in England and wales (2006 estimate), of which 13.3% were aged ≥ 35 years, annual deaths 25 000
Health and Safety Executive UK (645)
Obesity In 2011, around 26.1% of adults ≥16 years and are obese in the UK; 9.7% of boys 8.8% ( 4-5 years), 20.4% of boys and 17.4% of girls aged 10-11 years were obese in England (BMI ≥30kg/m2)
Public Health England (2014a) (646)
Public Health England (2014b) (647)
Diabetes In 2012, a total of 2,566,436 (5.8%) of the population in England were diabetic
Diabetes UK (2013) (648)
Coronary heart disease
In 2010, there were a total of 2.3 million people living with heart disease in the UK
British heart Foundation (2010) (649)
Chronic renal disease
In 2008/09 there were 1,739,443 people with kidney disease in England with prevalence rates ranging from 1.3 - 5%, for different locations
National Health Service (2010) (650)
Chronic liver disease
in 2009 there were around 17,000 new cases of liver cirrhosis in the United Kingdom, 12 year prevalence 5,118 of which 57.9% were male
Ratib et al., (2014) (651)
Chronic neurological
disease
The rate of neurological disorders lies around 625 per 100,000 population annually, with lifetime prevalence rates of: 9/1,000 for completed stroke; 5/1,000 for transient ischaemic attacks; 4/1,000 for active epilepsy; 3/1,000 for congenital neurological deficit; 2/1,000 (for Parkinson's disease, multiple sclerosis, diabetic polyneuropathy, compressive mononeuropathies), and 1/1,000 for sub-arachnoid haemorrhage.
MacDonald et al., (2000) (652)
HIV In 2012 a total of 77,610 were living with HIV in the UK. Prevalence; 1.5 per 1000 for all age groups (2.1 per 1000 for men and 1.0 per 1000 for women)
National AIDS Trust UK (2014) (653)
Leukaemia In 2010, there were a total of 8,257 new cases of leukaemia in the UK, of which 4,816 (58%) were in men and 3,441 (42%) in women (annual incidence 6/100,000 and 11/100,000 in males and females respectively)
Cancer Research UK (2013) (654)
Flu vaccine uptake
At the end of 2011/12 season, 74.0% of people ≥65 years, 51.6% of those aged ≥6 month’s ≤65 years, and 50.8% of pregnant women had been vaccinated – in England (WHO target is 74%)
Public Health England (2013) (655)
Low birth weight The 2009 statistics indicated that around 7% of live births, in England and Wales, were below 2,500 grams at birth
Poverty.org UK (2014) (656)
Notes: Some of the samples used in three primary studies in this thesis, were from patients admitted in specialized
wards e.g. oncology ward, maternity ward etc. indicating they had cancer as an underlying condition, were
pregnant etc. However, we did not use this variable to assign comorbidities because such information was missing
among patients that were seen as outpatients. However, this alone confirms that some of the patients had these
factors.
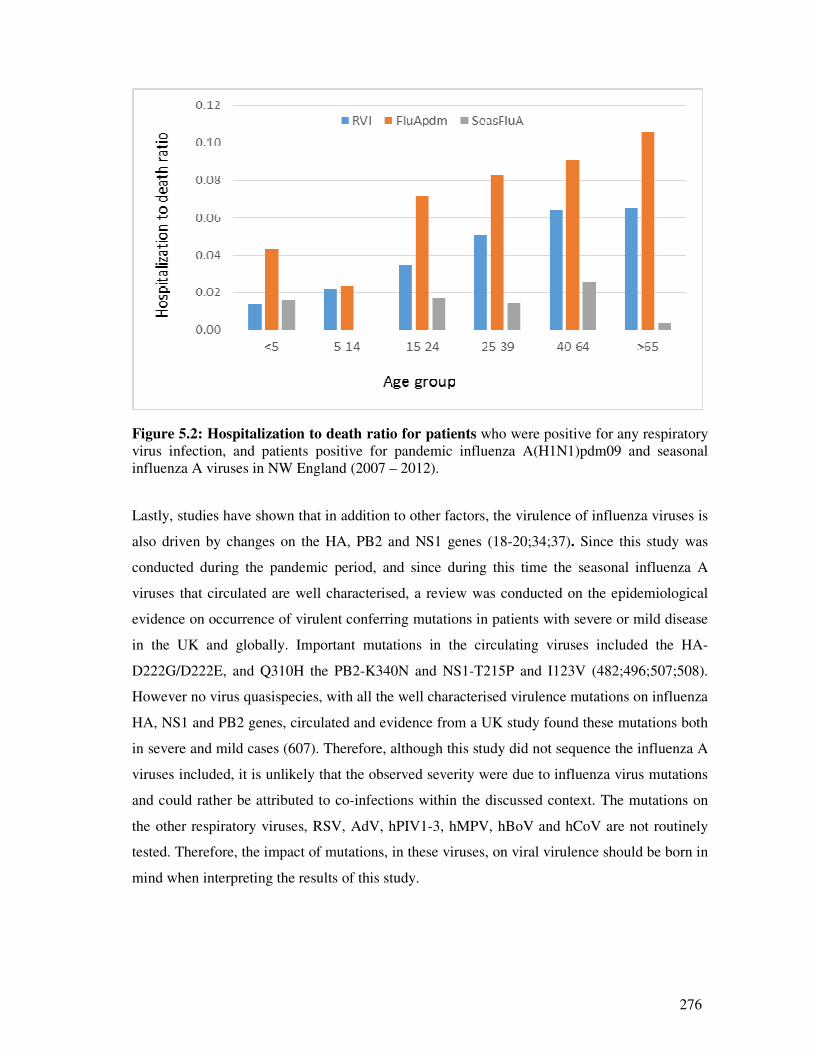
276
Figure 5.2: Hospitalization to death ratio for patients who were positive for any respiratory
virus infection, and patients positive for pandemic influenza A(H1N1)pdm09 and seasonal
influenza A viruses in NW England (2007 – 2012).
Lastly, studies have shown that in addition to other factors, the virulence of influenza viruses is
also driven by changes on the HA, PB2 and NS1 genes (18-20;34;37). Since this study was
conducted during the pandemic period, and since during this time the seasonal influenza A
viruses that circulated are well characterised, a review was conducted on the epidemiological
evidence on occurrence of virulent conferring mutations in patients with severe or mild disease
in the UK and globally. Important mutations in the circulating viruses included the HA-
D222G/D222E, and Q310H the PB2-K340N and NS1-T215P and I123V (482;496;507;508).
However no virus quasispecies, with all the well characterised virulence mutations on influenza
HA, NS1 and PB2 genes, circulated and evidence from a UK study found these mutations both
in severe and mild cases (607). Therefore, although this study did not sequence the influenza A
viruses included, it is unlikely that the observed severity were due to influenza virus mutations
and could rather be attributed to co-infections within the discussed context. The mutations on
the other respiratory viruses, RSV, AdV, hPIV1-3, hMPV, hBoV and hCoV are not routinely
tested. Therefore, the impact of mutations, in these viruses, on viral virulence should be born in
mind when interpreting the results of this study.
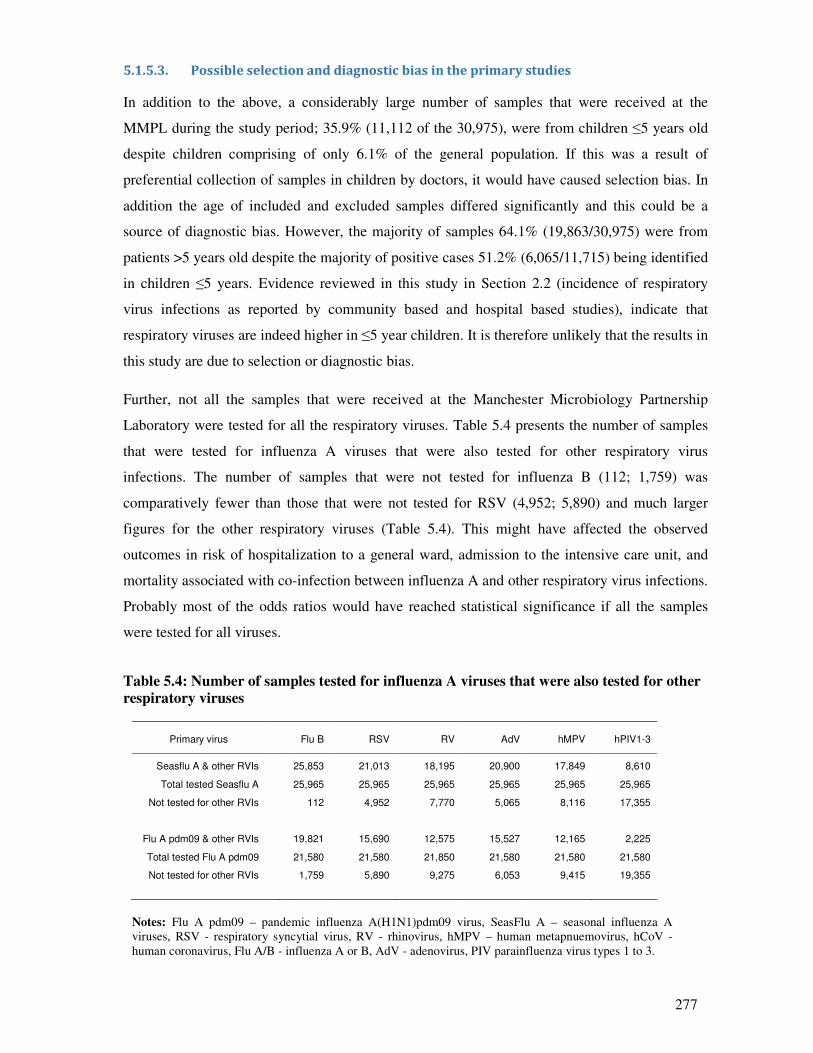
277
5.1.5.3. Possible selection and diagnostic bias in the primary studies
In addition to the above, a considerably large number of samples that were received at the
MMPL during the study period; 35.9% (11,112 of the 30,975), were from children ≤5 years old
despite children comprising of only 6.1% of the general population. If this was a result of
preferential collection of samples in children by doctors, it would have caused selection bias. In
addition the age of included and excluded samples differed significantly and this could be a
source of diagnostic bias. However, the majority of samples 64.1% (19,863/30,975) were from
patients >5 years old despite the majority of positive cases 51.2% (6,065/11,715) being identified
in children ≤5 years. Evidence reviewed in this study in Section 2.2 (incidence of respiratory
virus infections as reported by community based and hospital based studies), indicate that
respiratory viruses are indeed higher in ≤5 year children. It is therefore unlikely that the results in
this study are due to selection or diagnostic bias.
Further, not all the samples that were received at the Manchester Microbiology Partnership
Laboratory were tested for all the respiratory viruses. Table 5.4 presents the number of samples
that were tested for influenza A viruses that were also tested for other respiratory virus
infections. The number of samples that were not tested for influenza B (112; 1,759) was
comparatively fewer than those that were not tested for RSV (4,952; 5,890) and much larger
figures for the other respiratory viruses (Table 5.4). This might have affected the observed
outcomes in risk of hospitalization to a general ward, admission to the intensive care unit, and
mortality associated with co-infection between influenza A and other respiratory virus infections.
Probably most of the odds ratios would have reached statistical significance if all the samples
were tested for all viruses.
Table 5.4: Number of samples tested for influenza A viruses that were also tested for other
respiratory viruses
Primary virus
Flu B
RSV
RV
AdV
hMPV
hPIV1-3
Seasflu A & other RVIs 25,853 21,013 18,195 20,900 17,849 8,610
Total tested Seasflu A 25,965 25,965 25,965 25,965 25,965 25,965
Not tested for other RVIs 112 4,952 7,770 5,065 8,116 17,355
Flu A pdm09 & other RVIs 19,821 15,690 12,575 15,527 12,165 2,225
Total tested Flu A pdm09 21,580 21,580 21,850 21,580 21,580 21,580
Not tested for other RVIs 1,759 5,890 9,275 6,053 9,415 19,355
Notes: Flu A pdm09 – pandemic influenza A(H1N1)pdm09 virus, SeasFlu A – seasonal influenza A
viruses, RSV - respiratory syncytial virus, RV - rhinovirus, hMPV – human metapnuemovirus, hCoV -
human coronavirus, Flu A/B - influenza A or B, AdV - adenovirus, PIV parainfluenza virus types 1 to 3.
278
HBoV have been reported to cause significant disease and to co-infect with other viruses (87;88),
and the role of hCoV and hBoV co-infections on disease outcome might not be clearly elucidated
by this study. Since human coronavirus and human bocaviruses were not routinely tested during
the study period, we designed pan-coronavirus primers and used previous designed primers for
hBoV to identify these viruses. Both the hCoV and hBoV PCRs had adequate analytical
sensitivity, and could therefore be used for diagnosis of these viruses. The fact that a positive
association between co-infection between these viruses and influenza A (though not statistically
significant), despite only a few samples being tested suggest their importance in influenza like
illnesses. Therefore routine testing for these two viruses should be piloted, or a larger study on
their co-infection with influenza A be conducted; as these would further explore this possible
association.
5.1.6. Summary of limitations in the study design and recommendations for future designs
The above mentioned complexities are an example of the shortfalls of observational studies
where bias arises due to lack of completeness in the information obtained from secondary
sources, as it was not primarily collected for use in studies. In addition, we employed a cross-
sectional study design to make inference on possible association between co-infection and
disease severity. Cross-sectional studies cannot establish temporal relationship between exposure
and effect, therefore it is difficult to make causal inference from them. For example in the
respiratory virus co-infections, it is difficult to ascertain whether influenza A virus infection
occurred first, then other respiratory viruses followed. Some of the patients must also have had
bacterial co-infection. It again is difficult to ascertain whether, in those patients, influenza/other
respiratory virus infection was the first to ensure then a bacterial infection followed. In the
absence of patients’ hospital records, it is difficult to ascertain whether there were other
competing causes of hospitalization or death, other than respiratory virus infection(s).
However, cross-sectional studies are useful for understanding disease aetiology and generation
of hypotheses of possible causal associations. They are useful for the assessment of possible risk
factors and to assess most outcomes [Rothman et al., (657)]. Therefore the associations observed
in our study should be interpreted as such. Future studies could employ longitudinal follow-up or
serial study design (on virus and bacterial colonization and disease outcome); collecting
information on patients’ comorbidities and other variables described in the preceding chapters.
Such studies could further the understanding on the association between co-infection between
respiratory viruses and influenza A viruses, or among respiratory viruses themselves, or with
bacteria, and disease outcome.
279
5.1.7. Summary of the major findings and recommendations
In conclusion, despite any shortfalls, this study has found that:
1. Flu B, RSV, RV, AdV and hBoV are the respiratory viruses most likely to co-infect with
influenza A viruses. Multiple testing for these respiratory viruses, in samples being tested
for influenza A viruses, is recommended. Multiplex real-time PCR or alternative multiplex
nucleic acid amplification procedures for these or all respiratory viruses, would be an
economical way of achieving this.
2. Influenza B, RSV and AdV are the co-infecting viruses most likely to, co-infect with
influenza A viruses to numbers, large enough to cause public health concern and, be
associated with increased risk of hospitalization and mortality. Research on vaccines (e.g.
AdV- serotype 5 based with Flu A/RSV inserts vaccine and drugs targeting Flu A,
RSV/AdV attachment proteins), combined drugs, and multi-target tests for these viruses is
recommended.
3. RV co-infection with influenza A viruses might interfere with severity of influenza A
viruses, further research is needed to understand the biomedical mechanisms in their co-
infection and the role of RV co-infection with other respiratory viruses on disease outcome.
Results of this research could aid in drug and vaccine development.
4. In general the greatest burden of infection and co-infection, was in children ≤5 years old
years old, whereas hospitalization was predominantly in children ≤5 years old and the
elderly ≥65. This result agrees with the policy of vaccinating these age groups.
5. This study found that males are more susceptible to respiratory virus infection than females.
Educational programmes aimed at raising awareness on this subject, with the aim of
improving public health, are recommended. More research aimed at understanding the
gender specific, environmental, biomedical, and other risk factors associated with this
difference is encouraged.
6. In NW England, UK, it is more likely to have high influenza A and B, RSV and hMPV
circulation during winter seasons; RV and AdV activity all year round and hPIV1-3
predominantly in summer. This result could be helpful in planning public health
interventions, and during epidemics and pandemics planning for hospital beds.
280
References
1. World Health Organisation (WHO) 2009. Acute Respiratory Infections (Update September
2009). Available from: http://apps.who.int/vaccine_research/diseases/ari/en/. Accessed on 12
Nov 2012.
2. World Health Organisation (WHO) 2002. The World Health Report 2002. Available at:
http://www.who.int/whr/2002/whr2002_annex2.pdf. Accessed on 20 Dec 2012.
3. Williams B, Boschi-Pinto CF, Bryce JF, Dye C. Estimates of world-wide distribution of
child deaths from acute respiratory infections. Lancet Infect Dis 2002;2(1):25-32.
4. Walker CL, Rudan I, Liu L, Nair H, Theodoratou E, Bhutta ZA, et al. Global burden of
childhood pneumonia and diarrhoea. Lancet 2013;381(9875):1405-16.
5. Rudan I, O'Brien KL, Nair H, Liu L, Theodoratou E, Qazi S, et al. Epidemiology and
etiology of childhood pneumonia in 2010: estimates of incidence, severe morbidity,
mortality, underlying risk factors and causative pathogens for 192 countries. J Glob Health
2013;3(1):010401.
6. Rudan I, Tomaskovic L, Boschi-Pinto C, ampbell H. Global estimate of the incidence of
clinical pneumonia among children under five years of age. Bull World Health Organ
2004;82(12):895-903.
7. Pitman RJ, Melegaro A, Gelb D, Siddiqui MR, Gay NJ, Edmunds WJ. Assessing the burden
of influenza and other respiratory infections in England and Wales. J Infect 2007;54(6):530-
8.
8. Molinari NA, Ortega-Sanchez IR, Messonnier ML, Thompson WW, Wortley PM,
Weintraub E, et al. The annual impact of seasonal influenza in the US: measuring disease
burden and costs. Vaccine 2007;25(27):5086-96.
9. Health Protection Agency (HPA) 2011. Surveillance of influenza and other respiratory
viruses in the UK, 2010 - 2011 report. Avaialble at:
http://www.hpa.org.uk/webc/HPAwebFile/HPAweb_C/1296687414154. Accessed on 1
August 2011.
10. Van Kerkhove MD, Vandemaele KA, Shinde V, Jaramillo-Gutierrez G, Koukounari A,
Donnelly CA, et al. Risk factors for severe outcomes following 2009 influenza A (H1N1)
infection: a global pooled analysis. PLoS Med 2011;8(7):e1001053.
11. Ren YY, Yin YY, Li WQ, Lin Y, Liu T, Wang S, et al. Risk factors associated with severe
manifestations of 2009 pandemic influenza A (H1N1) infection in China: a case-control
study. Virol J 2013;10:149.
12. Health Protection Agency (HPA) 2010. Epidemiological report of pandemic (H1N1) 2009 in
the UK.. Available at:
http://www.hpa.org.uk/webc/HPAwebFile/HPAweb_C/1284475321350. Accessed on 1 Dec
2011.
13. Alvarez AE, Marson FA, Bertuzzo CS, Arns CW, Ribeiro JD. Epidemiological and genetic
characteristics associated with the severity of acute viral bronchiolitis by respiratory
syncytial virus. J Pediatr (Rio J ) 2013;89(6):531-43.
281
14. Ruuskanen O, Lahti E, Jennings LC, Murdoch DR. Viral pneumonia. Lancet
2011;377(9773):1264-75.
15. Punpanich W, Chotpitayasunondh T. A review on the clinical spectrum and natural history
of human influenza. Int J Infect Dis 2012;16(10):e714-e723.
16. Ali S, Hirschfeld AF, Mayer ML, Fortuno ES, III, Corbett N, Kaplan M, et al. Functional
genetic variation in NFKBIA and susceptibility to childhood asthma, bronchiolitis, and
bronchopulmonary dysplasia. J Immunol 2013;190(8):3949-58.
17. Tregoning JS, Schwarze J. Respiratory viral infections in infants: causes, clinical symptoms,
virology, and immunology. Clin Microbiol Rev 2010;23(1):74-98.
18. Tumpey TM, Maines TR, Van HN, Glaser L, Solorzano A, Pappas C, et al. A two-amino
acid change in the hemagglutinin of the 1918 influenza virus abolishes transmission. Science
2007;315(5812):655-9.
19. Geiss GK, Salvatore M, Tumpey TM, Carter VS, Wang X, Basler CF, et al. Cellular
transcriptional profiling in influenza A virus-infected lung epithelial cells: the role of the
nonstructural NS1 protein in the evasion of the host innate defense and its potential
contribution to pandemic influenza. Proc Natl Acad Sci U S A 2002;99(16):10736-41.
20. Van HN, Pappas C, Belser JA, Maines TR, Zeng H, Garcia-Sastre A, et al. Human HA and
polymerase subunit PB2 proteins confer transmission of an avian influenza virus through the
air. Proc Natl Acad Sci U S A 2009;106(9):3366-71.
21. Wlodarczyk MF, Kraft AR, Chen HD, Kenney LL, Selin LK. Anti-IFN-gamma and peptide-
tolerization therapies inhibit acute lung injury induced by cross-reactive influenza A-specific
memory T cells. J Immunol 2013;190(6):2736-46.
22. Welliver RC. Review of epidemiology and clinical risk factors for severe respiratory
syncytial virus (RSV) infection. J Pediatr 2003;143(5 Suppl):S112-S117.
23. Jackson S, Mathews KH, Pulanic D, Falconer R, Rudan I, Campbell H, et al. Risk factors for
severe acute lower respiratory infections in children: a systematic review and meta-analysis.
Croat Med J 2013;54(2):110-21.
24. Prakash S, Agrawal S, Cao JN, Gupta S, Agrawal A. Impaired secretion of interferons by
dendritic cells from aged subjects to influenza : Role of histone modifications. Age (Dordr)
2012;35(5):1785-97.
25. Sridharan A, Esposo M, Kaushal K, Tay J, Osann K, Agrawal S, et al. Age-associated
impaired plasmacytoid dendritic cell functions lead to decreased CD4 and CD8 T cell
immunity. Age (Dordr ) 2011;33(3):363-76.
26. Liu AH, Murphy JR. Hygiene hypothesis: fact or fiction? J Allergy Clin Immunol
2003;111(3):471-8.
27. Grammatikos AP. The genetic and environmental basis of atopic diseases. Ann Med
2008;40(7):482-95.
28. Boivin GA, Pothlichet J, Skamene E, Brown EG, Loredo-Osti JC, Sladek R, et al. Mapping
of clinical and expression quantitative trait loci in a sex-dependent effect of host
susceptibility to mouse-adapted influenza H3N2/HK/1/68. J Immunol 2012;188(8):3949-60.
282
29. Gonzalez DA, Diaz BB, Rodriguez Perez MC, Hernandez AG, Chico BN, de Leon AC. Sex
hormones and autoimmunity. Immunol Lett 2010;133(1):6-13.
30. Cutolo M, Sulli A, Capellino S, Villaggio B, Montagna P, Seriolo B, et al. Sex hormones
influence on the immune system: basic and clinical aspects in autoimmunity. Lupus
2004;13(9):635-8.
31. Sanders CJ, Doherty PC, Thomas PG. Respiratory epithelial cells in innate immunity to
influenza virus infection. Cell Tissue Res 2011;343(1):13-21.
32. Bermejo-Martin JF, Martin-Loeches I, Rello J, Anton A, Almansa R, Xu L, et al. Host
adaptive immunity deficiency in severe pandemic influenza. Crit Care 2010;14(5):R167.
33. Martinello RA, Chen MD, Weibel C, Kahn JS. Correlation between respiratory syncytial
virus genotype and severity of illness. J Infect Dis 2002;186(6):839-42.
34. Hatta M, Gao P, Halfmann P, Kawaoka Y. Molecular basis for high virulence of Hong Kong
H5N1 influenza A viruses. Science 2001;293:1840-2.
35. Matsuoka Y, Swayne DE, Thomas C, Rameix-Welti MA, Naffakh N, Warnes C, et al.
Neuraminidase stalk length and additional glycosylation of the hemagglutinin influence the
virulence of influenza H5N1 viruses for mice. Journal of Virology 2009;83(9):4704-8.
36. Seo SH, Webster RG. Tumor necrosis factor alpha exerts powerful anti-influenza virus
effects in lung epithelial cells. J Virol 2002;76:1071-6.
37. Munster VJ, de WE, van RD, Beyer WE, Rimmelzwaan GF, Osterhaus AD, et al. The
molecular basis of the pathogenicity of the Dutch highly pathogenic human influenza A
H7N7 viruses. Journal of Infectious Diseases 2007;196(2):258-65.
38. Boyapalle S, Wong T, Garay J, Teng M, San Juan-Vergara H, Mohapatra S, et al.
Respiratory syncytial virus NS1 protein colocalizes with mitochondrial antiviral signaling
protein MAVS following infection. PLoS One 2012;7(2):e29386.
39. Munir S, Hillyer P, Le NC, Buchholz UJ, Rabin RL, Collins PL, et al. Respiratory syncytial
virus interferon antagonist NS1 protein suppresses and skews the human T lymphocyte
response. PLoS Pathog 2011;7(4):e1001336.
40. Moore EC, Barber J, Tripp RA. Respiratory syncytial virus (RSV) attachment and
nonstructural proteins modify the type I interferon response associated with suppressor of
cytokine signaling (SOCS) proteins and IFN-stimulated gene-15 (ISG15). Virol J
2008;5:116. doi: 10.1186/1743-422X-5-116.:116-5.
41. Luo Y, Chen AY, Qiu J. Bocavirus infection induces a DNA damage response that
facilitates viral DNA replication and mediates cell death. J Virol 2011;85(1):133-45.
42. Adeyemi RO, Landry S, Davis ME, Weitzman MD, Pintel DJ. Parvovirus minute virus of
mice induces a DNA damage response that facilitates viral replication. PLoS Pathog
2010;6(10):e1001141.
43. Berk A. Adenoviridae: The viruses and their replication. In: Knipe DM, Griffin DE, Lamb
RA, Straus SE, Howley PM, Martin MA, et al., editors. Fields Virology. 5 ed. Philadelphia:
Lippincott Williams and Wilkins; 2007. p. 2355-94.
283
44. Weiss SR, Leibowitz JL. Coronavirus pathogenesis. Adv Virus Res 2011;81:85-164. doi:
10.1016/B978-0-12-385885-6.00009-2.:85-164.
45. Weiss SR, Navas-Martin S. Coronavirus pathogenesis and the emerging pathogen severe
acute respiratory syndrome coronavirus. Microbiol Mol Biol Rev 2005;69(4):635-64.
46. Navas-Martin S, Weiss SR. SARS: lessons learned from other coronaviruses. Viral Immunol
2003;16(4):461-74.
47. Henrickson KJ. Parainfluenza viruses. Clin Microbiol Rev 2003;16(2):242-64.
48. Vainionpaa R, Hyypia T. Biology of parainfluenza viruses. Clin Microbiol Rev
1994;7(2):265-75.
49. Karron RA, Collins PL. Parainfluenza viruses. In: Knipe DM, Griffin DE, Lamb RA, Straus
SE, Howley PM, Martin MA, et al., editors. Fields virology. 5 ed. Philadelphia: Lippincott
Williams and Wilkins; 2007. p. 1497-526.
50. Collins PL, Crowe JEJ. Respiratory syncytial virus and Metapneumovirus. In: Knipe DM,
Griffin DE, Lamb RA, Straus SE, Howley PM, Martin MA, et al., editors. Fields Virology. 5
ed. Philadelphia: Lippincott Williams and Wilkins; 2007. p. 1601-46.
51. Walker EJ, Younessi P, Fulcher AJ, McCuaig R, Thomas BJ, Bardin PG, et al. Rhinovirus
3C protease facilitates specific nucleoporin cleavage and mislocalisation of nuclear proteins
in infected host cells. PLoS One 2013;8(8):e71316.
52. Gustin KE, Sarnow P. Inhibition of nuclear import and alteration of nuclear pore complex
composition by rhinovirus. J Virol 2002;76(17):8787-96.
53. Grant CC, Wall CR, Gibbons MJ, Morton SM, Santosham M, Black RE. Child nutrition and
lower respiratory tract disease burden in New Zealand: a global context for a national
perspective. J Paediatr Child Health 2011;47(8):497-504.
54. Jones LL, Hashim A, McKeever T, Cook DG, Britton J, Leonardi-Bee J. Parental and
household smoking and the increased risk of bronchitis, bronchiolitis and other lower
respiratory infections in infancy: systematic review and meta-analysis. Respir Res
2011;12:5. doi: 10.1186/1465-9921-12-5.:5-12.
55. Sigurdsson GH, Moller AD, Kristinsson B, Gudlaugsson O, Karason S, Sigurdsson SE, et al.
[Intensive care patients with influenza A (H1N1) infection in Iceland 2009]. Laeknabladid
2010;96(2):83-90.
56. Noah TL, Zhou H, Jaspers I. Alteration of the nasal responses to influenza virus by tobacco
smoke. Curr Opin Allergy Clin Immunol 2012;12(1):24-31.
57. Venarske DL, Busse WW, Griffin MR, Gebretsadik T, Shintani AK, Minton PA, et al. The
relationship of rhinovirus-associated asthma hospitalizations with inhaled corticosteroids and
smoking. J Infect Dis 2006;193(11):1536-43.
58. Gualano RC, Hansen MJ, Vlahos R, Jones JE, Park-Jones RA, Deliyannis G, et al. Cigarette
smoke worsens lung inflammation and impairs resolution of influenza infection in mice.
Respir Res 2008;9:53. doi: 10.1186/1465-9921-9-53.:53-9.
59. Ruuskanen O, Lahti E, Jennings LC, Murdoch DR. Viral pneumonia. Lancet
2011;377(9773):1264-75.
284
60. Peltola VT, McCullers JA. Respiratory viruses predisposing to bacterial infections: role of
neuraminidase. Pediatr Infect Dis J 2004;23(1 Suppl):S87-S97.
61. Bakaletz LO. Viral potentiation of bacterial superinfection of the respiratory tract. Trends
Microbiol 1995;3(3):110-4.
62. Haroon SM, Barbosa GP, Saunders PJ. The determinants of health-seeking behaviour during
the A/H1N1 influenza pandemic: an ecological study. J Public Health (Oxf) 2011;33(4):503-
10.
63. Cohen S. Social status and susceptibility to respiratory infections. Ann N Y Acad Sci
1999;896:246-53.
64. Townsend JG, Sydenstricker E. Epidemiological study of minor respiratory diseases. Public
Health Reports 1927;42(2):99-121.
65. Etiler N, Velipasaoglu S, Aktekin M. Incidence of acute respiratory infections and the
relationship with some factors in infancy in Antalya, Turkey. Pediatr Int 2002;44(1):64-9.
66. Forshey BM, Laguna-Torres VA, Vilcarromero S, Bazan I, Rocha C, Morrison AC, et al.
Epidemiology of influenza-like illness in the Amazon Basin of Peru, 2008-2009. Influenza
Other Respi Viruses 2010;4(4):235-43.
67. Lowcock EC, Rosella LC, Foisy J, McGeer A, Crowcroft N. The social determinants of
health and pandemic H1N1 2009 influenza severity. Am J Public Health 2012;102(8):e51-
e58.
68. Gao P, Watanabe S, Ito T, Goto H, Wells K, McGregor M, et al. Biological heterogeneity,
including systemic replication in mice, of H5N1 influenza A virus isolates from humans in
Hong Kong. J Virol 1999;73(4):3184-9.
69. Lu X, Tumpey TM, Morken T, Zaki SR, Cox NJ, Katz JM. A mouse model for the
evaluation of pathogenesis and immunity to influenza A (H5N1) viruses isolated from
humans. J Virol 1999;73(7):5903-11.
70. Zitzow LA, Rowe T, Morken T, Shieh WJ, Zaki S, Katz JM. Pathogenesis of avian
influenza A (H5N1) viruses in ferrets. J Virol 2002;76(9):4420-9.
71. Jameson J, Cruz J, Terajima M, Ennis FA. Human CD8+ and CD4+ T lymphocyte memory
to influenza A viruses of swine and avian species. J Immunol 1999;162(12):7578-83.
72. Foster DA, Talsma A, Furumoto-Dawson A, Ohmit SE, Margulies JR, Arden NH, et al.
Influenza Vaccine Effectiveness in Preventing Hospitalization for Pneumonia in the Elderly.
Am J Epidemiol 1992;136(3):296-307.
73. Ohmit SE, Monto AS. Influenza Vaccine Effectiveness in Preventing Hospitalization among
the Elderly during Influenza Type A and Type B Seasons. International Journal of
Epidemiology 1995;24(6):1240-8.
74. Shahid Z, Kleppinger A, Gentleman B, Falsey AR, McElhaney JE. Clinical and
immunologic predictors of influenza illness among vaccinated older adults. Vaccine
2010;28(38):6145-51.
75. Drews AL, Atmar RL, Glezen WP, Baxter BD, Piedra PA, Greenberg SB. Dual respiratory
virus infections. Clinical Infectious Diseases 1997;25(6):1421-9.
285
76. Richard N, Komurian-Pradel F, Javouhey E, Perret M, Rajoharison A, Bagnaud A, et al. The
impact of dual viral infection in infants admitted to a paediatric intensive care unit associated
with severe bronchiolitis. Pediatric Infectious Disease Journal 2008;27(3):213-7.
77. Semple MG, Cowell A, Dove W, Greensill J, McNamara PS, Halfhide C, et al. Dual
infection of infants by human metapneumovirus and human respiratory syncytial virus is
strongly associated with severe bronchiolitis. Journal of Infectious Diseases
2005;191(3):382-6.
78. Legg JP, Warner JA, Johnston SL, Warner JO. Frequency of detection of picornaviruses and
seven other respiratory pathogens in infants. Pediatr Infect Dis J 2005;24(7):611-6.
79. Portnoy BE, Eckert HL, Hanes B, Salvatore MA. Multiple respiratory virus infections in
hospitalized children. Am J Epidemiol 1965;82(3):262-72.
80. Aberle JH, Aberle SW, Pracher E, Hutter HP, Kundi M, Popow-Kraupp T. Single versus
dual respiratory virus infections in hospitalized infants: impact on clinical course of disease
and interferon-gamma response. Pediatric Infectious Disease Journal 2005;24(7):605-10.
81. Esper FP, Spahlinger T, Zhou L. Rate and influence of respiratory virus co-infection on
pandemic (H1N1) influenza disease. J Infect 2011;63(4):260-6.
82. Martin ET, Kuypers J, Wald A, Englund JA. Multiple versus single virus respiratory
infections: viral load and clinical disease severity in hospitalized children. Influenza and
Other Respiratory Viruses 2011;6(1):71-7.
83. Sly PD, Jones CM. Viral co-detection in infants hospitalized with respiratory disease: is it
important to detect? J Pediatr (Rio J ) 2011;87(4):277-80.
84. Stefanska I, Romanowska M, Donevski S, Gawryluk D, Brydak LB. Co-infections with
influenza and other respiratory viruses. Adv Exp Med Biol 2013;756:291-301. doi:
10.1007/978-94-007-4549-0_36.:291-301.
85. Calvo C, Garcia-Garcia ML, Blanco C, Vazquez MC, Frias ME, Perez-Brena P, et al.
Multiple simultaneous viral infections in infants with acute respiratory tract infections in
Spain. J Clin Virol 2008;42(3):268-72.
86. Ali SA, Williams JV, Chen Q, Faori S, Shehabi A, Jundi EA, et al. Human
metapneumovirus in hospitalized children in Amman, Jordan. J Med Virol 2010;82(6):1012-
6.
87. Schildgen O, Muller A, Allander T, Mackay IM, Volz S, Kupfer B, et al. Human bocavirus:
passenger or pathogen in acute respiratory tract infections? Clin Microbiol Rev
2008;21(2):291-304, table.
88. Zhenqiang BA, Formenty PBH, Roth CE. Human bocavirus, a real respiratory tract
pathogen. African Journal of Microbiology Research 2007;1(5):51-6.
89. Bicer S, Giray T, Col D, Erdag GC, Vitrinel A, Gurol Y, et al. Virological and clinical
characterizations of respiratory infections in hospitalized children. Ital J Pediatr 2013;39:22.
90. Peci A, Winter AL, Gubbay JB, Skowronski DM, Balogun EI, De LC, et al. Community-
acquired respiratory viruses and co-infection among patients of Ontario sentinel practices,
April 2009 to February 2010. Influenza Other Respi Viruses 2013;7(4):559-66.
286
91. Rhedin S, Hamrin J, Naucler P, Bennet R, Rotzen-Ostlund M, Farnert A, et al. Respiratory
viruses in hospitalized children with influenza-like illness during the H1n1 2009 pandemic
in Sweden. PLoS ONE 2012;7(12):e51491.
92. Singleton RJ, Bulkow LR, Miernyk K, DeByle C, Pruitt L, Hummel KB, et al. Viral
respiratory infections in hospitalized and community control children in Alaska. J Med Virol
2010;82(7):1282-90.
93. Libster R, Bugna J, Coviello S, Hijano DR, Dunaiewsky M, Reynoso N, et al. Paediatric
hospitalizations associated with 2009 pandemic influenza A (H1N1) in Argentina. N Engl J
Med 2010;362(1):45-55.
94. Echenique IA, Chan PA, Chapin KC, Andrea SB, Fava JL, Mermel LA. Clinical
characteristics and outcomes in hospitalized patients with respiratory viral co-infection
during the 2009 H1N1 influenza pandemic. PLoS ONE 2013;8(4):e60845.
95. Greenberg HB, Piedra PA. Immunization against viral respiratory disease: a review. Pediatr
Infect Dis J 2004;23(11 Suppl):S254-S261.
96. Gillim-Ross L, Subbarao K. Emerging respiratory viruses: challenges and vaccine strategies.
Clin Microbiol Rev 2006;19(4):614-36.
97. Olszewska W, Zambon M, Openshaw PJ. Development of vaccines against common colds.
Br Med Bull 2002;62:99-111.
98. World Health Organisation (WHO) 2013. Battle against Respiratory Viruses (BRaVe)
initiative. Available at:
http://www.who.int/influenza/patient_care/clinical/BRaVe_Research_Agenda_2013.pdf.
Accessed on 5 Feb 2013.
99. Office of National Statistics (ONS) 2012. 2011 Census: Usual resident population by five-
year age group, local authorities in the United Kingdom. Available at:
http://www.ons.gov.uk/ons/datasets-and-
tables/index.html?pageSize=50&sortBy=none&sortDirection=none&newquery=2011+censu
s+usual+population+by+five+year. Accessed on 17 Dec 2012.
100. Health and Social Welfare Information Network (HSCIC) 2013. Hospital Episodes
Statistic (HES). Available at: http://www.hscic.gov.uk/hes. Accessed on 10 Dec 2013.
101. Office of the National Statistics (ONS) 2011. Regional Profiles - Population and Migration
- North West - October 2011. Available from: URL:
http://www.ons.gov.uk/ons/rel/regional-trends/region-and-country-profiles/population-and-
migration/population-and-migration---north-west.html. Accessed on 2 Jul 2012.
102. Ellis J, Iturriza M, Allen R, Bermingham A, Brown K, Gray J, et al. Evaluation of four
real-time PCR assays for detection of influenza A(H1N1)v viruses. Euro Surveill
2009;14(22).
103. Hall TA. BioEdit: a user-friendly biological sequence alignment editor and analysis
program for Windows 95/98/NT. Nucleic acids symposium series 1999;41:95-8.
104. Marra MA, Jones SJ, Astell CR, Holt RA, Brooks-Wilson A, Butterfield YS, et al. The
Genome sequence of the SARS-associated coronavirus. Science 2003;300(5624):1399-
404.
287
105. Ivanov KA, Hertzig T, Rozanov M, Bayer S, Thiel V, Gorbalenya AE, et al. Major genetic
marker of nidoviruses encodes a replicative endoribonuclease. Proc Natl Acad Sci U S A
2004;101(34):12694-9.
106. Qu XW, Duan ZJ, Qi ZY, Xie ZP, Gao HC, Liu WP, et al. Human bocavirus infection,
People's Republic of China. Emerg Infect Dis 2007;13(1):165-8.
107. Brankatschk R, Bodenhausen N, Zeyer J, Burgmann H. Simple absolute quantification
method correcting for quantitative PCR efficiency variations for microbial community
samples. Appl Environ Microbiol 2012;78(12):4481-9.
108. von EE, Altman DG, Egger M, Pocock SJ, Gotzsche PC, Vandenbroucke JP. The
Strengthening the Reporting of Observational Studies in Epidemiology (STROBE)
statement: guidelines for reporting observational studies. Lancet 2007;370(9596):1453-7.
109. Liberati A, Altman DG, Tetzlaff J, Mulrow C, Gotzsche PC, Ioannidis JP, et al. The
PRISMA statement for reporting systematic reviews and meta-analyses of studies that
evaluate healthcare interventions: explanation and elaboration. BMJ 2009;339:b2700. doi:
10.1136/bmj.b2700.:b2700.
110. Anderson RM, May RM. Infectious diseases of humans, dynamics and control. 1 ed.
Oxford: Oxford University Press; 1991.
111. Chowell G, Nishiura H, Bettencourt LM. Comparative estimation of the reproduction
number for pandemic influenza from daily case notification data. J R Soc Interface
2007;4(12):155-66.
112. Ravchev LA. A mathematical model for the global spread of influenza. Mathematical
Biosciences 1985;75(1):3-22.
113. Vynnycky E, Edmunds WJ. Analyses of the 1957 (Asian) influenza pandemic in the
United Kingdom and the impact of school closures. Epidemiol Infect 2008;136(2):166-79.
114. Glass K, Kelly H, Mercer GN. Pandemic influenza H1N1: reconciling serosurvey data
with estimates of the reproduction number. Epidemiology 2012;23(1):86-94.
115. Boelle PY, Ansart S, Cori A, Valleron AJ. Transmission parameters of the A/H1N1 (2009)
influenza virus pandemic: a review. Influenza Other Respi Viruses 2011;5(5):306-16.
116. Cintron-Arias A, Castillo-Chavez C, Bettencourt LM, Lloyd AL, Banks HT. The
estimation of the effective reproductive number from disease outbreak data. Math Biosci
Eng 2009;6(2):261-82.
117. Weber A, Weber M, Milligan P. Modeling epidemics caused by respiratory syncytial virus
(RSV). Math Biosci 2001;172(2):95-113.
118. Riley S, Fraser C, Donnelly CA, Ghani AC, Abu-Raddad LJ, Hedley AJ, et al.
Transmission dynamics of the etiological agent of SARS in Hong Kong: impact of public
health interventions. Science 2003;300(5627):1961-6.
119. Liao CM, Chang CF, Liang HM. A probabilistic transmission dynamic model to assess
indoor airborne infection risks. Risk Anal 2005;25(5):1097-107.
288
120. Hayden FG, Fritz R, Lobo MC, Alvord W, Strober W, Straus SE. Local and systemic
cytokine responses during experimental human influenza A virus infection. Relation to
symptom formation and host defense. J Clin Invest 1998;101(3):643-9.
121. Eccles R. Understanding the symptoms of the common cold and influenza. Lancet Infect
Dis 2005;5(11):718-25.
122. Beadling C, Slifka MK. How do viral infections predispose patients to bacterial infections?
Curr Opin Infect Dis 2004;17(3):185-91.
123. Johnstone J, Majumdar SR, Fox JD, Marrie TJ. Viral infection in adults hospitalized with
community-acquired pneumonia: prevalence, pathogens, and presentation. Chest
2008;134(6):1141-8.
124. Angeles MM, Camps M, Pumarola T, Antonio MJ, Martinez E, Mensa J, et al. The role of
viruses in the aetiology of community-acquired pneumonia in adults. Antivir Ther
2006;11(3):351-9.
125. Kusel MM, de Klerk NH, Holt PG, Kebadze T, Johnston SL, Sly PD. Role of respiratory
viruses in acute upper and lower respiratory tract illness in the first year of life: a birth
cohort study. Pediatr Infect Dis J 2006;25(8):680-6.
126. Dakhama A, Lee YM, Gelfand EW. Virus-induced airway dysfunction: pathogenesis and
biomechanisms. Pediatr Infect Dis J 2005;24(11 Suppl):S159-69, discussion.
127. Bont L, Van Aalderen WM, Versteegh J, Brus F, Draaisma JT, Pekelharing-Berghuis M, et
al. Airflow limitation during respiratory syncytial virus lower respiratory tract infection
predicts recurrent wheezing. Pediatr Infect Dis J 2001;20(3):277-82.
128. Puddu M, Fanos V. Respiratory syncytial virus infection and recurrent wheezing: what
next? J Chemother 2007;19 Suppl 2:8-11.:8-11.
129. Lusebrink J, Wittleben F, Schildgen V, Schildgen O. Human bocavirus - insights into a
newly identified respiratory virus. Viruses 2009;1(1):3-12.
130. Wright PF, Neuman G, Kawaoka Y. Orthomyxoviruses. In: Knipe DM, Griffin DE, Lamb
RA, Straus SE, Howley PM, Martin MA, et al., editors. Fields Virology. 5th ed.
Philadelphia: Lippincott Williams and Wilkins; 2007. p. 1690-789.
131. Weinstock DM, Gubareva LV, Zuccotti G. Prolonged shedding of multidrug-resistant
influenza A virus in an immunocompromised patient. N Engl J Med 2003;348(9):867-8.
132. Baz M, Abed Y, McDonald J, Boivin G. Characterization of multidrug-resistant influenza
A/H3N2 viruses shed during 1 year by an immunocompromised child. Clin Infect Dis
2006;43(12):1555-61.
133. Ison MG, Gubareva LV, Atmar RL, Treanor J, Hayden FG. Recovery of drug-resistant
influenza virus from immunocompromised patients: a case series. J Infect Dis
2006;193(6):760-4.
134. McMinn P, Carrello A, Cole C, Baker D, Hampson A. Antigenic drift of influenza A
(H3N2) virus in a persistently infected immunocompromised host is similar to that
occurring in the community. Clin Infect Dis 1999;29(2):456-8.
289
135. Rocha E, Cox NJ, Black RA, Harmon MW, Harrison CJ, Kendal AP. Antigenic and
genetic variation in influenza A (H1N1) virus isolates recovered from a persistently
infected immunodeficient child. J Virol 1991;65(5):2340-50.
136. Okomo-Adhiambo M, Demmler-Harrison GJ, Deyde VM, Sheu TG, Xu X, Klimov AI, et
al. Detection of E119V and E119I mutations in influenza A (H3N2) viruses isolated from
an immunocompromised patient: challenges in diagnosis of oseltamivir resistance.
Antimicrob Agents Chemother 2010;54(5):1834-41.
137. Giannella M, Alonso M, Garcia d, V, Lopez RP, Catalan P, Padilla B, et al. Prolonged viral
shedding in pandemic influenza A(H1N1): clinical significance and viral load analysis in
hospitalized patients. Clin Microbiol Infect 2011;17(8):1160-5.
138. Delves PJ, Roitt IM. The immune system. Second of two parts. N Engl J Med
2000;343(2):108-17.
139. Hilleman MR. Strategies and mechanisms for host and pathogen survival in acute and
persistent viral infections. Proc Natl Acad Sci U S A 2004;101 Suppl 2:14560-6.
140. Francis T, Jr., Davenport FM, Hennessy AV. A serological recapitulation of human
infection with different strains of influenza virus. Trans Assoc Am Physicians
1953;66:231-9.
141. Muelenaer PM, Henderson FW, Hemming VG, Walsh EE, Anderson LJ, Prince GA, et al.
Group-specific serum antibody responses in children with primary and recurrent
respiratory syncytial virus infections. J Infect Dis 1991;164(1):15-21.
142. Gorse GJ, Patel GB, Vitale JN, O'Connor TZ. Prevalence of antibodies to four human
coronaviruses is lower in nasal secretions than in serum. Clin Vaccine Immunol
2010;17(12):1875-80.
143. Kirchberger S, Majdic O, Stockl J. Modulation of the immune system by human
rhinoviruses. Int Arch Allergy Immunol 2007;142(1):1-10.
144. Ray R, Matsuoka Y, Burnett TL, Glaze BJ, Compans RW. Human parainfluenza virus
induces a type-specific protective immune response. J Infect Dis 1990;162(3):746-9.
145. Yewdell JW, Gerhard W. Antigenic characterization of viruses by monoclonal antibodies.
Annu Rev Microbiol 1981;35:185-206.
146. Boon AC, de MG, Graus YM, Fouchier RA, Sintnicolaas K, Osterhaus AD, et al.
Sequence variation in a newly identified HLA-B35-restricted epitope in the influenza A
virus nucleoprotein associated with escape from cytotoxic T lymphocytes. J Virol
2002;76(5):2567-72.
147. Flomenberg P, Piaskowski V, Truitt RL, Casper JT. Characterization of human
proliferative T cell responses to adenovirus. J Infect Dis 1995;171(5):1090-6.
148. Olive M, Eisenlohr LC, Flomenberg P. Quantitative analysis of adenovirus-specific CD4+
T-cell responses from healthy adults. Viral Immunol 2001;14(4):403-13.
149. Olive M, Eisenlohr L, Flomenberg N, Hsu S, Flomenberg P. The adenovirus capsid protein
hexon contains a highly conserved human CD4+ T-cell epitope. Hum Gene Ther
2002;13(10):1167-78.
290
150. Shirkoohi R, Endo R, Ishiguro N, Teramoto S, Kikuta H, Ariga T. Antibodies against
structural and nonstructural proteins of human bocavirus in human sera. Clin Vaccine
Immunol 2010;17(1):190-3.
151. Lindner J, Zehentmeier S, Franssila R, Barabas S, Schroeder J, Deml L, et al. CD4+ T
helper cell responses against human bocavirus viral protein 2 viruslike particles in healthy
adults. J Infect Dis 2008;198(11):1677-84.
152. Russell CA, Jones TC, Barr IG, Cox NJ, Garten RJ, Gregory V, et al. Influenza vaccine
strain selection and recent studies on the global migration of seasonal influenza viruses.
Vaccine 2008;26 Suppl 4:D31-D34.
153. Fiore AE, Uyeki TM, Broder K, Finelli L, Euler GL, Singleton JA, et al. Prevention and
control of influenza with vaccines: recommendations of the Advisory Committee on
Immunization Practices (ACIP), 2010. MMWR Recomm Rep 2010;59(RR-8):1-62.
154. Tang DC, Zhang J, Toro H, Shi Z, Van Kampen KR. Adenovirus as a carrier for the
development of influenza virus-free avian influenza vaccines. Expert Rev Vaccines
2009;8(4):469-81.
155. Zhang J. Advances and future challenges in recombinant adenoviral vectored H5N1
influenza vaccines. Viruses 2012;4(11):2711-35.
156. Tucker SN, Tingley DW, Scallan CD. Oral adenoviral-based vaccines: historical
perspective and future opportunity. Expert Rev Vaccines 2008;7(1):25-31.
157. Kimpen JL. Prevention and treatment of respiratory syncytial virus bronchiolitis and
postbronchiolitic wheezing. Respir Res 2002;3 Suppl 1:S40-S45.
158. Sun Z, Pan Y, Jiang S, Lu L. Respiratory syncytial virus entry inhibitors targeting the F
protein. Viruses 2013;5(1):211-25.
159. Schmidt AC. Progress in respiratory virus vaccine development. Semin Respir Crit Care
Med 2011;32(4):527-40.
160. Collins PL, Murphy BR. Respiratory syncytial virus: reverse genetics and vaccine
strategies. Virology 2002;296(2):204-11.
161. Belshe RB, Newman FK, Anderson EL, Wright PF, Karron RA, Tollefson S, et al.
Evaluation of combined live, attenuated respiratory syncytial virus and parainfluenza 3
virus vaccines in infants and young children. J Infect Dis 2004;190(12):2096-103.
162. Olszewska W, Helson R, Openshaw PJ. Vaccines for the prevention of respiratory viral
infections: problems and current status. Expert Opin Investig Drugs 2004;13(6):681-9.
163. Feuillet F, Lina B, Rosa-Calatrava M, Boivin G. Ten years of human metapneumovirus
research. J Clin Virol 2012;53(2):97-105.
164. Papi A, Contoli M. Rhinovirus vaccination: the case against. Eur Respir J 2011;37(1):5-7.
165. Belshe RB, Burk B, Newman F, Cerruti RL, Sim IS. Resistance of influenza A virus to
amantadine and rimantadine: results of one decade of surveillance. J Infect Dis
1989;159(3):430-5.
291
166. Tominack RL, Hayden FG. Rimantadine hydrochloride and amantadine hydrochloride use
in influenza A virus infections. Infect Dis Clin North Am 1987;1(2):459-78.
167. Gubareva LV, Kaiser L, Hayden FG. Influenza virus neuraminidase inhibitors. Lancet
2000;355(9206):827-35.
168. Ferraris O, Escuret V, Bouscambert-Duchamp M, Lina B, Morfin F. [Role of
neuraminidase inhibitors for the treatment of influenza A virus infections]. Pathol Biol
(Paris) 2010;58(2):e69-e78.
169. Bright RA, Medina MJ, Xu X, Perez-Oronoz G, Wallis TR, Davis XM, et al. Incidence of
adamantane resistance among influenza A (H3N2) viruses isolated worldwide from 1994
to 2005: a cause for concern. Lancet 2005;366(9492):1175-81.
170. Reece PA. Neuraminidase inhibitor resistance in influenza viruses. J Med Virol
2007;79(10):1577-86.
171. Nelson MI, Simonsen L, Viboud C, Miller MA, Holmes EC. The origin and global
emergence of adamantane resistant A/H3N2 influenza viruses. Virology 2009;388(2):270-
8.
172. Zambon M, Hayden FG. Position statement: global neuraminidase inhibitor susceptibility
network. Antiviral Res 2001;49(3):147-56.
173. Nguyen HT, Fry AM, Gubareva LV. Neuraminidase inhibitor resistance in influenza
viruses and laboratory testing methods. Antivir Ther 2012;17(1 Pt B):159-73.
174. Lackenby A, Hungnes O, Dudman SG, Meijer A, Paget WJ, Hay AJ, et al. Emergence of
resistance to oseltamivir among influenza A(H1N1) viruses in Europe. Euro Surveill
2008;13(5):8026.
175. Okomo-Adhiambo M, Sleeman K, Ballenger K, Nguyen HT, Mishin VP, Sheu TG, et al.
Neuraminidase inhibitor susceptibility testing in human influenza viruses: a laboratory
surveillance perspective. Viruses 2010;2(10):2269-89.
176. Wang MZ, Tai CY, Mendel DB. Mechanism by which mutations at his274 alter sensitivity
of influenza a virus n1 neuraminidase to oseltamivir carboxylate and zanamivir.
Antimicrob Agents Chemother 2002;46(12):3809-16.
177. Gubareva LV. Molecular mechanisms of influenza virus resistance to neuraminidase
inhibitors. Virus Res 2004;103(1-2):199-203.
178. Le QM, Kiso M, Someya K, Sakai YT, Nguyen TH, Nguyen KH, et al. Avian flu: isolation
of drug-resistant H5N1 virus. Nature 2005;437(7062):1108.
179. Abed Y, Baz M, Boivin G. A novel neuraminidase deletion mutation conferring resistance
to oseltamivir in clinical influenza A/H3N2 virus. J Infect Dis 2009;199(2):180-3.
180. Lan Y, Zhang Y, Dong L, Wang D, Huang W, Xin L, et al. A comprehensive surveillance
of adamantane resistance among human influenza A virus isolated from mainland China
between 1956 and 2009. Antivir Ther 2010;15(6):853-9.
181. Kneyber MC, Moll HA, de GR. Treatment and prevention of respiratory syncytial virus
infection. Eur J Pediatr 2000;159(6):399-411.
292
182. van WJ, Kimpen J. Therapy for respiratory tract infections caused by respiratory syncytial
virus. Eur J Pediatr 2000;159(6):391-8.
183. Krilov LR. Respiratory syncytial virus disease: update on treatment and prevention. Expert
Rev Anti Infect Ther 2011;9(1):27-32.
184. Ventre K, Randolph AG. Ribavirin for respiratory syncytial virus infection of the lower
respiratory tract in infants and young children. Cochrane Database Syst Rev
2007;(1):CD000181.
185. Flores G, Horwitz RI. Efficacy of beta2-agonists in bronchiolitis: a reappraisal and meta-
analysis. Pediatrics 1997;100(2 Pt 1):233-9.
186. Morris SK, Dzolganovski B, Beyene J, Sung L. A meta-analysis of the effect of antibody
therapy for the prevention of severe respiratory syncytial virus infection. BMC Infect Dis
2009;9:106.
187. Patel H, Platt R, Lozano JM, Wang EE. Glucocorticoids for acute viral bronchiolitis in
infants and young children. Cochrane Database Syst Rev 2004;(3):CD004878.
188. Lanari M, Vandini S, Arcuri S, Galletti S, Faldella G. The use of humanized monoclonal
antibodies for the prevention of respiratory syncytial virus infection. Clin Dev Immunol
2013;2013:359683. doi: 10.1155/2013/359683.
189. Resch B, Michel-Behnke I. Respiratory syncytial virus infections in infants and children
with congenital heart disease: update on the evidence of prevention with palivizumab. Curr
Opin Cardiol 2013;28(2):85-91.
190. Murata Y, Falsey A. Respiratory syncytial virus in adults. In: Cane P, editor. Perspectives
in medical virology. 1 ed. Oxford, United Kingdom: Elsevier; 2007. p. 163-83.
191. Lambert DM, Barney S, Lambert AL, Guthrie K, Medinas R, Davis DE, et al. Peptides
from conserved regions of paramyxovirus fusion (F) proteins are potent inhibitors of viral
fusion. Proc Natl Acad Sci U S A 1996;93(5):2186-91.
192. Yao Q, Compans RW. Peptides corresponding to the heptad repeat sequence of human
parainfluenza virus fusion protein are potent inhibitors of virus infection. Virology
1996;223(1):103-12.
193. Luczak M, Korbecki M, Kobus M, Hankiewicz W. Puromycin as an inhibitor of
parainfluenza 3 virus multiplication. Acta Virol 1971;15(5):374-80.
194. Karagoz A, Arda N, Goren N, Nagata K, Kuru A. Antiviral activity of Sanicula europaea
L. extracts on multiplication of human parainfluenza virus type 2. Phytother Res
1999;13(5):436-8.
195. Ausejo M, Saenz A, Pham B, Moher D, Chalmers TC, Kellner JD, et al. The effectiveness
of glucocorticoids in treating croup: meta-analysis. West J Med 1999;171(4):227-32.
196. Ausejo M, Saenz A, Pham B, Kellner JD, Johnson DW, Moher D, et al. Glucocorticoids
for croup. Cochrane Database Syst Rev 2000;(2):CD001955.
197. Falsey AR. Current management of parainfluenza pneumonitis in immunocompromised
patients: a review. Infect Drug Resist 2012;5:121-7.
293
198. Anzueto A, Niederman MS. Diagnosis and treatment of rhinovirus respiratory infections.
Chest 2003;123(5):1664-72.
199. Patick AK, Brothers MA, Maldonado F, Binford S, Maldonado O, Fuhrman S, et al. In
vitro antiviral activity and single-dose pharmacokinetics in humans of a novel, orally
bioavailable inhibitor of human rhinovirus 3C protease. Antimicrob Agents Chemother
2005;49(6):2267-75.
200. Wanga QM, Chen SH. Human rhinovirus 3C protease as a potential target for the
development of antiviral agents. Curr Protein Pept Sci 2007;8(1):19-27.
201. Lenaerts L, De CE, Naesens L. Clinical features and treatment of adenovirus infections.
Rev Med Virol 2008;18(6):357-74.
202. Kinchington PR, Romanowski EG, Jerold GY. Prospects for adenovirus antivirals. J
Antimicrob Chemother 2005;55(4):424-9.
203. Chanock R, Chambon L, Chang W, Goncalves FF, Gharpure P, Grant L, et al. WHO
respiratory disease survey in children: a serological study. Bull World Health Organ
1967;37(3):363-9.
204. Monto AS, Sullivan KM. Acute respiratory illness in the community. Frequency of illness
and the agents involved. Epidemiol Infect 1993;110(1):145-60.
205. Allander T. Human bocavirus. J Clin Virol 2008;41(1):29-33.
206. van den Hoogen BG, de Jong JC, Groen J, Kuiken T, de GR, Fouchier RA, et al. A newly
discovered human pneumovirus isolated from young children with respiratory tract
disease. Nat Med 2001;7(6):719-24.
207. Frost WH, Gover M. The Incidence and Time Distribution of Common Colds in Several
Groups Kept under Continuous Observation. Public Health Reports 1932;47(36):1815-41.
208. van Volkenburgh VE, Frost W. Acute minor respiratory diseases prevailing in a group of
families residing in Baltimore, Maryland, 1928-1930, prevalence, distribution and clinical
description of of observed cases. Am J Epidemiol 1933;17(1):122-53.
209. Fox JP, Elveback LR, Spigland I, Frothingham TE, Stevens DA, Hunger M. The virus
watch programme: A continuing surveillance of of viral infections in metropolitan New
York Families: I. Overall plan, methods of collecting and handling information and a
summary report of specimen collection and illness observed. Am J Epidemiol
1966;83(3):389-411.
210. Badger GF, Dingle JH, Feller AE, Hodges RG, Jordan WSJ, Rammelkamp CHJ. A study
of illness in a group of Cleveland families. II. Incidence of the common respiratory
diseases. Am J Hyg 1953;58(1):31-40.
211. van Loghem JJ. An Epidemiological Contribution to the Knowledge of the Respiratory
Diseases. J Hyg (Lond) 1928;28(1):33-54.
212. Azziz-Baumgartner E, Alamgir AS, Rahman M, Homaira N, Sohel BM, Sharker MA, et al.
Incidence of influenza-like illness and severe acute respiratory infection during three
influenza seasons in Bangladesh, 2008-2010. Bull World Health Organ 2012;90(1):12-9.
294
213. Van Kerkhove MD, Hirve S, Koukounari A, Mounts AW. Estimating age-specific
cumulative incidence for the 2009 influenza pandemic: a meta-analysis of A(H1N1)pdm09
serological studies from 19 countries. Influenza Other Respi Viruses 2013; 7(5):872-86.
doi: 10.1111/irv.12074.
214. Jordan S, Jr., Denny FW, Jr., BADGER GF, Curtiss C, DINGLE JH, Oseasohn R, et al. A
study of illness in a group of Cleveland families. XVII. The occurrence of Asian influenza.
Am J Hyg 1958;68(2):190-212.
215. Fowlkes A, Dasgupta S, Chao E, Lemmings J, Goodin K, Harris M, et al. Estimating
influenza incidence and rates of influenza-like illness in the outpatient setting. Influenza
Other Respi Viruses 2012;7(5):694-700. doi: 10.1111/irv.12014.
216. Glezen WP, Decker M, Joseph SW, Mercready RG, Jr. Acute respiratory disease
associated with influenza epidemics in Houston, 1981-1983. J Infect Dis
1987;155(6):1119-26.
217. Hak E, Rovers MM, Kuyvenhoven MM, Schellevis FG, Verheij TJ. Incidence of GP-
diagnosed respiratory tract infections according to age, gender and high-risk co-morbidity:
the Second Dutch National Survey of General Practice. Fam Pract 2006;23(3):291-4.
218. Elliot AJ, Fleming DM. Surveillance of influenza-like illness in England and Wales during
1966-2006. Euro Surveill 2006;11(10):249-50.
219. Health Protection Agency (HPA) 2012. Surveillance of influenza and other respiratory
pathogens in the UK, October 2011 - April 2012. Available at:
http://www.hpa.org.uk/webc/HPAwebFile/HPAweb_C/1317134705939. Accessed on 1
Dec 2012.
220. Royal College of General Practitioners (RCGP) 2007. Royal College of General
Practitioners Weekly Returns Service Annual Prevalence Report 2007. Available at:
http://www.rcgp.org.uk/clinical-and-research/~/media/Files/CIRC/CIRC-76-
80/BRU_Annual_prevalence_report_2007.ashx . Accessed on 17 Aug 2012
221. Royal College of General Practitioners (RCGP) 2011. Royal College of General
Practitioners Weekly Returns Service Annual Report 2011. Available at:
http://www.rcgp.org.uk/clinical-and-
research/~/media/Files/CIRC/Research%20and%20Surveillance%20Centre/RSC%20Annu
al%20Report%20-
%202011/Annual%20Report%202011%20Final%20%282%29/RSC%20Annual%20Repor
t%202011.ashx. Accessed on 17 Aug 2012.
222. Gessner BD, Shindo N, Briand S. Seasonal influenza epidemiology in sub-Saharan Africa:
a systematic review. Lancet Infect Dis 2011;11(3):223-35.
223. Weber MW, Mulholland EK, Greenwood BM. Respiratory syncytial virus infection in
tropical and developing countries. Trop Med Int Health 1998;3(4):268-80.
224. Shek LP, Lee BW. Epidemiology and seasonality of respiratory tract virus infections in the
tropics. Paediatr Respir Rev 2003;4(2):105-11.
225. Madhi SA, Klugman KP. Acute Respiratory Infections. In: Jamison DT, Feachem RG,
Makgoba MW, et al., editors. Disease and Mortality in Sub-Saharan Africa. 2nd ed. World
Bank; 2006. p. 149-93.
295
226. Crowcroft NS, Cutts F, Zambon MC. Respiratory syncytial virus: an underestimated cause
of respiratory infection, with prospects for a vaccine. Commun Dis Public Health
1999;2(4):234-41.
227. Nair H, Nokes DJ, Gessner BD, Dherani M, Madhi SA, Singleton RJ, et al. Global burden
of acute lower respiratory infections due to respiratory syncytial virus in young children: a
systematic review and meta-analysis. Lancet 2010;375(9725):1545-55.
228. Nair H, Brooks WA, Katz M, Roca A, Berkley JA, Madhi SA, et al. Global burden of
respiratory infections due to seasonal influenza in young children: a systematic review and
meta-analysis. Lancet 2011;378(9807):1917-30.
229. Rudan I, Boschi-Pinto C, Biloglav Z, Mulholland K, Campbell H. Epidemiology and
etiology of childhood pneumonia. Bull World Health Organ 2008;86(5):408-16.
230. Paget WJ, Balderston C, Casas I, Donker G, Edelman L, Fleming D, et al. Assessing the
burden of paediatric influenza in Europe: the European Paediatric Influenza Analysis
(EPIA) project. Eur J Pediatr 2010;169(8):997-1008.
231. Ajayi-Obe EK, Coen PG, Handa R, Hawrami K, Aitken C, McIntosh ED, et al. Influenza
A and respiratory syncytial virus hospital burden in young children in East London.
Epidemiol Infect 2008;136(8):1046-58.
232. Feikin DR, Njenga MK, Bigogo G, Aura B, Aol G, Audi A, et al. Etiology and Incidence
of viral and bacterial acute respiratory illness among older children and adults in rural
western Kenya, 2007-2010. PLoS ONE 2012;7(8):e43656.
233. Fisher RG, Gruber WC, Edwards KM, Reed GW, Tollefson SJ, Thompson JM, et al.
Twenty years of outpatient respiratory syncytial virus infection: a framework for vaccine
efficacy trials. Pediatrics 1997;99(2):E7.
234. Wright AL, Taussig LM, Ray CG, Harrison HR, Holberg CJ. The Tucson Children's
Respiratory Study. II. Lower respiratory tract illness in the first year of life. Am J
Epidemiol 1989;129(6):1232-46.
235. Knott AM, Long CE, Hall CB. Parainfluenza viral infections in paediatric outpatients:
seasonal patterns and clinical characteristics. Pediatr Infect Dis J 1994;13(4):269-73.
236. Monto AS, Koopman JS, Longini IM, Jr. Tecumseh study of illness. XIII. Influenza
infection and disease, 1976-1981. Am J Epidemiol 1985;121(6):811-22.
237. Nicholson KG, Kent J, Hammersley V, Cancio E. Acute viral infections of upper
respiratory tract in elderly people living in the community: comparative, prospective,
population based study of disease burden. BMJ 1997;315(7115):1060-4.
238. Lee MS, Walker RE, Mendelman PM. Medical burden of respiratory syncytial virus and
parainfluenza virus type 3 infection among US children. Implications for design of vaccine
trials. Hum Vaccin 2005;1(1):6-11.
239. Miller DL. Collaborative studies of acute respiratory disease in patients seen in general
practice and in children admitted to hospital: aims, field methods and morbidity rates.
Postgrad Med J 1973;49(577):749-62.
296
240. Hall CB, Weinberg GA, Iwane MK, Blumkin AK, Edwards KM, Staat MA, et al. The
burden of respiratory syncytial virus infection in young children. N Engl J Med
2009;360(6):588-98.
241. Simmerman JM, Uyeki TM. The burden of influenza in East and South-East Asia: a review
of the English language literature. Influenza Other Respi Viruses 2008;2(3):81-92.
242. Munoz FM. The impact of influenza in children. Semin Pediatr Infect Dis 2002;13(2):72-8.
243. Presanis AM, De AD, Hagy A, Reed C, Riley S, Cooper BS, et al. The severity of
pandemic H1N1 influenza in the United States, from April to July 2009: a Bayesian
analysis. PLoS Med 2009;6(12):e1000207.
244. Falsey AR, Hennessey PA, Formica MA, Cox C, Walsh EE. Respiratory syncytial virus
infection in elderly and high-risk adults. N Engl J Med 2005;352(17):1749-59.
245. Falsey AR, Treanor JJ, Betts RF, Walsh EE. Viral respiratory infections in the
institutionalized elderly: clinical and epidemiologic findings. J Am Geriatr Soc
1992;40(2):115-9.
246. Falsey AR, Cunningham CK, Barker WH, Kouides RW, Yuen JB, Menegus M, et al.
Respiratory syncytial virus and influenza A infections in the hospitalized elderly. J Infect
Dis 1995;172(2):389-94.
247. Barker WH, Mullooly JP. Impact of epidemic type A influenza in a defined adult
population. Am J Epidemiol 1980;112(6):798-811.
248. Borja-Aburto VH, Chowell G, Viboud C, Simonsen L, Miller MA, Grajales-Muniz C, et
al. Epidemiological characterization of a fourth wave of pandemic A/H1N1 influenza in
Mexico, winter 2011-2012: age shift and severity. Arch Med Res 2012;43(7):563-70.
249. Schanzer DL, Langley JM, Tam TW. Hospitalization attributable to influenza and other
viral respiratory illnesses in Canadian children. Pediatr Infect Dis J 2006;25(9):795-800.
250. Schanzer DL, Langley JM, Tam TW. Role of influenza and other respiratory viruses in
admissions of adults to Canadian hospitals. Influenza Other Respi Viruses 2008;2(1):1-8.
251. Nicholson KG, McNally T, Silverman M, Simons P, Stockton JD, Zambon MC. Rates of
hospitalisation for influenza, respiratory syncytial virus and human metapneumovirus
among infants and young children. Vaccine 2006;24(1):102-8.
252. Meltzer MI, Cox NJ, Fukuda K. The economic impact of pandemic influenza in the United
States: priorities for intervention. Emerg Infect Dis 1999;5(5):659-71.
253. Thompson WW, Shay DK, Weintraub E, Brammer L, Cox N, Anderson LJ, et al. Mortality
Associated With Influenza and Respiratory Syncytial Virus in the United States. JAMA:
The Journal of the American Medical Association 2003;289(2):179-86.
254. Thompson WW, Weintraub E, Dhankhar P, Cheng PY, Brammer L, Meltzer MI, et al.
Estimates of US influenza-associated deaths made using four different methods. Influenza
Other Respi Viruses 2009;3(1):37-49.
255. Simonsen L, Clarke MJ, Schonberger LB, Arden NH, Cox NJ, Fukuda K. Pandemic versus
epidemic influenza mortality: a pattern of changing age distribution. J Infect Dis
1998;178(1):53-60.
297
256. Simonsen L, Fukuda K, Schonberger LB, Cox NJ. The impact of influenza epidemics on
hospitalizations. J Infect Dis 2000;181(3):831-7.
257. Simonsen L, Reichert TA, Viboud C, Blackwelder WC, Taylor RJ, Miller MA. Impact of
influenza vaccination on seasonal mortality in the US elderly population. Arch Intern Med
2005;165(3):265-72.
258. Izurieta HS, Thompson WW, Kramarz P, Shay DK, Davis RL, DeStefano F, et al.
Influenza and the rates of hospitalization for respiratory disease among infants and young
children. N Engl J Med 2000;342(4):232-9.
259. Simonsen L, Clarke MJ, Williamson GD, Stroup DF, Arden NH, Schonberger LB. The
impact of influenza epidemics on mortality: introducing a severity index. Am J Public
Health 1997;87(12):1944-50.
260. Forster J, Ihorst G, Rieger CH, Stephan V, Frank HD, Gurth H, et al. Prospective
population-based study of viral lower respiratory tract infections in children under 3 years
of age (the PRI.DE study). Eur J Pediatr 2004;163(12):709-16.
261. Potter CW. Chronicle of Influenza Pandemic. In: Nicholson KG Webster RG Hay AJ,
editor. Textbook of influenza. 1998.
262. Johnson NP, Mueller J. Updating the accounts: global mortality of the 1918-1920
"Spanish" influenza pandemic. Bull Hist Med 2002;76(1):105-15.
263. Nguyen-Van-Tam JS, Hampson AW. The epidemiology and clinical impact of pandemic
influenza. Vaccine 2003;21(16):1762-8.
264. Glezen WP. Emerging infections: pandemic influenza. Epidemiol Rev 1996;18(1):64-76.
265. Taubenberger JK, Morens DM. 1918 Influenza: the mother of all pandemics. Emerging
Infectious Diseases 2006;12(1):15-22.
266. Morens DM, Taubenberger JK, Fauci AS. The persistent legacy of the 1918 influenza
virus. N Engl J Med 2009;361(3):225-9.
267. Dunn FL. Pandemic influenza in 1957; review of international spread of new Asian strain.
J Am Med Assoc 1958;166(10):1140-8.
268. Chang WK. National influenza experience in Hong Kong, 1968. Bull World Health Organ
1969;41(3):349-51.
269. Cockburn WC, Delon PJ, Ferreira W. Origin and progress of the 1968-69 Hong Kong
influenza epidemic. Bull World Health Organ 1969;41(3):345-8.
270. Sharrar RG. National influenza experience in the USA, 1968-69. Bull World Health Organ
1969;41(3):361-6.
271. Scholtissek C, Rohde W, Von Hoyningen V, Rott R. On the origin of the human influenza
virus subtypes H2N2 and H3N2. Virology 1978;87(1):13-20.
272. Tillett HE, Smith JW, Gooch CD. Excess deaths attributable to influenza in England and
Wales: age at death and certified cause. Int J Epidemiol 1983;12(3):344-52.
273. Gregg MB, Hinman AR, Craven RB. The Russian flu. Its history and implications for this
year's influenza season. JAMA 1978;240(21):2260-3.
298
274. World Health Organisation (WHO) 2009. World now at the start of 2009 influenza
pandemic. Available at:
http://www.who.int/mediacentre/news/statements/2009/h1n1_pandemic_phase6_20090611
/en/ . Accessed on 20 Feb 2011.
275. World Health Organisation (WHO) 2009. Pandemic (H1N1) 2009 - update 76. Available
at: http://www.who.int/csr/don/2009_11_27a/en/2009. Accessed on 2 Dec 2011.
276. Pebody RG, McLean E, Zhao H, Cleary P, Bracebridge S, Foster K, et al. Pandemic
Influenza A (H1N1) 2009 and mortality in the United Kingdom: risk factors for death,
April 2009 to March 2010. Euro Surveill 2010;15(20). pii: 19571.
277. Orsted I, Molvadgaard M, Nielsen HL, Nielsen H. The first, second and third wave of
pandemic influenza A (H1N1)pdm09 in North Denmark Region 2009-2011: a population-
based study of hospitalizations. Influenza Other Respi Viruses 2013; 7(5):776-82. doi:
10.1111/irv.12093.
278. World Health Organisation (WHO) 2011. Weekly epidemiological record (No. 8, 2011, 86,
61-72). February 18. Available from: URL: http://www.who.int/wer/2011/wer8608.pdf.
Accessed on 8 October 2011.
279. Dawood FS, Iuliano AD, Reed C, Meltzer MI, Shay DK, Cheng PY, et al. Estimated global
mortality associated with the first 12 months of 2009 pandemic influenza A H1N1 virus
circulation: a modelling study. Lancet Infect Dis 2012;12(9):687-95.
280. Wong JY, Kelly H, Ip DK, Wu JT, Leung GM, Cowling BJ. Case Fatality Risk of
Influenza A (H1N1pdm09): A Systematic Review. Epidemiology 2013;24(6):830-41.
281. Koch A, Sorensen P, Homoe P, Molbak K, Pedersen FK, Mortensen T, et al. Population-
based study of acute respiratory infections in children, Greenland. Emerg Infect Dis
2002;8(6):586-93.
282. Zaman K, Baqui AH, Yunus M, Sack RB, Bateman OM, Chowdhury HR, et al. Acute
respiratory infections in children: a community-based longitudinal study in rural
Bangladesh. J Trop Pediatr 1997;43(3):133-7.
283. Bourgeois FT, Valim C, Wei JC, McAdam AJ, Mandl KD. Influenza and other respiratory
virus-related emergency department visits among young children. Pediatrics
2006;118(1):e1-e8.
284. Broor S, Parveen S, Bharaj P, Prasad VS, Srinivasulu KN, Sumanth KM, et al. A
prospective three-year cohort study of the epidemiology and virology of acute respiratory
infections of children in rural India. PLoS One 2007;2(6):e491.
285. Monto AS, Kioumehr F. The Tecumseh Study of Respiratory Illness. IX. Occurence of
influenza in the community, 1966--1971. Am J Epidemiol 1975;102(6):553-63.
286. Neuzil KM, Zhu Y, Griffin MR, Edwards KM, Thompson JM, Tollefson SJ, et al. Burden
of interpandemic influenza in children younger than 5 years: a 25-year prospective study. J
Infect Dis 2002;185(2):147-52.
287. Banatvala JE, Aanderson B, Reiss BB. Viruses in acute respiratory infection in a general
community. J Hyg (Lond) 1965;63:155-67.
299
288. Mullooly JP, Barker WH. Impact of type A influenza on children: a retrospective study.
Am J Public Health 1982;72(9):1008-16.
289. Nokes DJ, Ngama M, Bett A, Abwao J, Munywoki P, English M, et al. Incidence and
severity of respiratory syncytial virus pneumonia in rural Kenyan children identified
through hospital surveillance. Clin Infect Dis 2009;49(9):1341-9.
290. Iwane MK, Edwards KM, Szilagyi PG, Walker FJ, Griffin MR, Weinberg GA, et al.
Population-based surveillance for hospitalizations associated with respiratory syncytial
virus, influenza virus, and parainfluenza viruses among young children. Pediatrics
2004;113(6):1758-64.
291. Chiu SS, Chan KH, Chen H, Young BW, Lim W, Wong WH, et al. Virologically
confirmed population-based burden of hospitalization caused by respiratory syncytial
virus, adenovirus, and parainfluenza viruses in children in Hong Kong. Pediatr Infect Dis J
2010;29(12):1088-92.
292. Stockman LJ, Curns AT, Anderson LJ, Fischer-Langley G. Respiratory syncytial virus-
associated hospitalizations among infants and young children in the United States, 1997-
2006. Pediatr Infect Dis J 2012;31(1):5-9.
293. Karstaedt AS, Hopley M, Wong M, Crewe-Brown HH, Tasset-Tisseau A. Influenza- and
respiratory syncytial virus-associated adult mortality in Soweto. S Afr Med J
2009;99(10):750-4.
294. Wong CM, Yang L, Chan KP, Leung GM, Chan KH, Guan Y, et al. Influenza-associated
hospitalization in a subtropical city. PLoS Med 2006;3(4):e121.
295. Glezen WP. Serious morbidity and mortality associated with influenza epidemics.
Epidemiologic Reviews 1982;4(1):25-44.
296. Azziz-Baumgartner E, Cabrera AM, Cheng PY, Garcia E, Kusznierz G, Calli R, et al.
Incidence of influenza-associated mortality and hospitalizations in Argentina during 2002-
2009. Influenza Other Respi Viruses 2012; 7(5):710-7. doi: 10.1111/irv.12022.
297. Chew FT, Doraisingham S, Ling AE, Kumarasinghe G, Lee BW. Seasonal trends of viral
respiratory tract infections in the tropics. Epidemiol Infect 1998;121(1):121-8.
298. Khor CS, Sam IC, Hooi PS, Quek KF, Chan YF. Epidemiology and seasonality of
respiratory viral infections in hospitalized children in Kuala Lumpur, Malaysia: a
retrospective study of 27 years. BMC Pediatr 2012;12:32.
299. Welliver R. The relationship of meteorological conditions to the epidemic activity of
respiratory syncytial virus. Paediatr Respir Rev 2009;10 Suppl 1:6-8.
300. Yusuf S, Piedimonte G, Auais A, Demmler G, Krishnan S, Van CP, et al. The relationship
of meteorological conditions to the epidemic activity of respiratory syncytial virus.
Epidemiol Infect 2007;135(7):1077-90.
301. Jansen AG, Sanders EA, Hoes AW, van Loon AM, Hak E. Influenza- and respiratory
syncytial virus-associated mortality and hospitalisations. Eur Respir J 2007;30(6):1158-66.
302. Razanajatovo NH, Richard V, Hoffmann J, Reynes JM, Razafitrimo GM, Randremanana
RV, et al. Viral etiology of influenza-like illnesses in Antananarivo, Madagascar, July
2008 to June 2009. PLoS ONE 2011;6(3):e17579.
300
303. Mak GC, Wong AH, Ho WY, Lim W. The impact of pandemic influenza A (H1N1) 2009
on the circulation of respiratory viruses 2009-2011. Influenza Other Respi Viruses
2012;6(3):e6-10.
304. Colley JR, Douglas JW, Reid DD. Respiratory disease in young adults: influence of early
childhood lower respiratory tract illness, social class, air pollution, and smoking. Br Med J
1973;3(5873):195-8.
305. de FA, Morris J, Hall AJ, Armstrong Schellenberg JR, Greenwood BM. Risk factors for
mortality from acute lower respiratory tract infections in young Gambian children. Int J
Epidemiol 1993;22(6):1174-82.
306. Maliszewski PJ, Wei R. Ecological factors associated with pandemic influenza A (H1N1)
hospitalization rates in California, USA: a geospatial analysis. Geospat Health
2011;6(1):95-105.
307. Sutmoller F, Maia PR. Acute respiratory infections in children living in two low income
communities of Rio de Janeiro, Brazil. Mem Inst Oswaldo Cruz 1995;90(6):665-74.
308. Yousey-Hindes KM, Hadler JL. Neighborhood socioeconomic status and influenza
hospitalizations among children: New Haven County, Connecticut, 2003-2010. Am J
Public Health 2011;101(9):1785-9.
309. Sims DG, Downham MA, McQuillin J, Gardner PS. Respiratory syncytial virus infection
in north-east England. Br Med J 1976;2(6044):1095-8.
310. Mayoral JM, Alonso J, Garin O, Herrador Z, Astray J, Baricot M, et al. Social factors
related to the clinical severity of influenza cases in Spain during the A (H1N1) 2009 virus
pandemic. BMC Public Health 2013;13:118.
311. Ballard TJ, Neumann CG. The effects of malnutrition, parental literacy and household
crowding on acute lower respiratory infections in young Kenyan children. J Trop Pediatr
1995;41(1):8-13.
312. Margolis PA, Greenberg RA, Keyes LL, LaVange LM, Chapman RS, Denny FW, et al.
Lower respiratory illness in infants and low socioeconomic status. Am J Public Health
1992;82(8):1119-26.
313. Lenzi L, Wiens A, Grochocki MH, Pontarolo R. Study of the relationship between socio-
demographic characteristics and new influenza A (H1N1). Braz J Infect Dis
2011;15(5):457-61.
314. Launes C, Garcia-Garcia JJ, Martinez-Planas A, Moraga F, Astigarraga I, Aristegui J, et al.
2009 H1N1: risk factors for hospitalization in a matched case-control study. Eur J Pediatr
2012;171(7):1127-31.
315. Wenger JB, Naumova EN. Seasonal synchronization of influenza in the United States older
adult population. PLoS ONE 2010;5(4):e10187.
316. Gardner G, Frank AL, Taber LH. Effects of social and family factors on viral respiratory
infection and illness in the first year of life. J Epidemiol Community Health 1984;38(1):42-
8.
301
317. Fox J, Hall C, Cooney M, Foy HM. Influenzavirus infections in Seattle families, 1975-
1979. I. Study design, methods and the occurrence of infections by time and age. Am J
Epidemiol 1982;116(2):212-27.
318. Bansal S, Pourbohloul B, Hupert N, Grenfell B, Meyers LA. The shifting demographic
landscape of pandemic influenza. PLoS ONE 2010;5(2):e9360.
319. Charland KM, Brownstein JS, Verma A, Brien S, Buckeridge DL. Socio-economic
disparities in the burden of seasonal influenza: the effect of social and material deprivation
on rates of influenza infection. PLoS ONE 2011;6(2):e17207.
320. Mamelund SE. A socially neutral disease? Individual social class, household wealth and
mortality from Spanish influenza in two socially contrasting parishes in Kristiania 1918-
19. Soc Sci Med 2006;62(4):923-40.
321. Tsai HP, Kuo PH, Liu CC, Wang JR. Respiratory viral infections among paediatric
inpatients and outpatients in Taiwan from 1997 to 1999. J Clin Microbiol 2001;39(1):111-
8.
322. Sung RY, Chan RC, Tam JS, Cheng AF, Murray HG. Epidemiology and aetiology of acute
bronchiolitis in Hong Kong infants. Epidemiol Infect 1992;108(1):147-54.
323. Chan PW, Goh AY, Chua KB, Kharullah NS, Hooi PS. Viral aetiology of lower
respiratory tract infection in young Malaysian children. J Paediatr Child Health
1999;35(3):287-90.
324. Glezen WP, Loda FA, Clyde WA, Jr., Senior RJ, Sheaffer CI, Conley WG, et al.
Epidemiologic patterns of acute lower respiratory disease of children in a paediatric group
practice. J Pediatr 1971;78(3):397-406.
325. Denny FW, Collier AM, Henderson FW. Acute respiratory infections in day care. Rev
Infect Dis 1986;8(4):527-32.
326. Garder P. Respiratory viral infection and wheezy bronchitis in childhood. Arch Dis Childh,
1968;43(232):629-45.
327. Rutter PD, Mytton OT, Mak M, Donaldson LJ. Socio-economic disparities in mortality due
to pandemic influenza in England. Int J Public Health 2012;57(4):745-50.
328. Sydenstricker E. The incidence of influenza among persons of different economic status
during the epidemic of 1918. 1931. Public Health Rep 2006;121 Suppl 1:191-204.
329. Thompson DL, Jungk J, Hancock E, Smelser C, Landen M, Nichols M, et al. Risk factors
for 2009 pandemic influenza A (H1N1)-related hospitalization and death among
racial/ethnic groups in New Mexico. Am J Public Health 2011;101(9):1776-84.
330. Fleming DM, Zambon M, Bartelds AI. Population estimates of persons presenting to
general practitioners with influenza-like illness, 1987-96: a study of the demography of
influenza-like illness in sentinel practice networks in England and Wales, and in The
Netherlands. Epidemiol Infect 2000;124(2):245-53.
331. Fleming DM, Elliot AJ, Cross KW. Morbidity profiles of patients consulting during
influenza and respiratory syncytial virus active periods. Epidemiol Infect
2007;135(7):1099-108.
302
332. Lopez AD, Mathers CD. Measuring the global burden of disease and epidemiological
transitions: 2002-2030. Ann Trop Med Parasitol 2006;100(5-6):481-99.
333. Tumova B, Heinz F, Syrucek L, Bruckova M, Fedova D, Kunzova L, et al. Occurrence and
aetiology of acute respiratory diseases: results of a longterm surveillance programme. Acta
Virol 1989;33(1):50-62.
334. Holmes EC. The Evolutionary Genetics of Emerging Viruses. Annual Review of Ecology
2009;40:353-72.
335. Eccles R. An explanation for the seasonality of acute upper respiratory tract viral
infections. Acta Otolaryngol 2002;122(2):183-91.
336. Centres for Disease Control (CDC), USA 2013. Seasonal flu - What sort of flu season is
expected this year? Available at: http://www.cdc.gov/flu/pastseasons/1213season.htm.
Accessed 11 Jan 2013.
337. Health Protection Agency (HPA) 2012. Sources of UK flu data. Available at:
http://www.hpa.org.uk/web/HPAweb&HPAwebStandard/HPAweb_C/1195733821514.
Accessed on 27 Dec 2012.
338. Goka E, Vallely P, Mutton K, Klapper P. Influenza A viruses dual and multiple infections
with other respiratory viruses and risk of hospitalisation and mortality. Influenza Other
Respi Viruses 2013;7(6):1079-87.
339. Fouchier RA, Munster V, Wallensten A, Bestebroer TM, Herfst S, Smith D, et al.
Characterization of a novel influenza A virus hemagglutinin subtype (H16) obtained from
black-headed gulls. J Virol 2005;79(5):2814-22.
340. Tong S, Li Y, Rivailler P, Conrardy C, Castillo DA, Chen LM, et al. A distinct lineage of
influenza A virus from bats. Proc Natl Acad Sci U S A 2012;109(11):4269-74.
341. Lamb RA. Genes and proteins of the influenza viruses. In: Krug RM, editor. The Influenza
Viruses. 1 ed. New York: Plenum Press; 1989. p. 1-87.
342. Horimoto T, Kawaoka Y. Influenza: lessons from past pandemics, warnings from current
incidents. Nat Rev Microbiol 2005;3(8):591-600.
343. Honda A, Ishihama A. Structure-function relationships of the influenza virus RNA
polymerase. International Congress Series 2004;1263:21-4.
344. Liang Y, Hong Y, Parslow TG. cis-Acting packaging signals in the influenza virus PB1,
PB2, and PA genomic RNA segments. J Virol 2005;79(16):10348-55.
345. Chunlong MA, Pinto LH, Lamb RA. Proton channels of influenza A and B viruses. In:
Webster RG, Monto AS, Braciale TJ, Lamb RA, editors. Textbook of Influenza. 2nd ed.
2013. p. 101-13.
346. Hale BG, Randall RE, Ortin J, Jackson D. The multifunctional NS1 protein of influenza A
viruses. Journal of General Virology 2008;89(Pt:10):10-76.
347. Enami M. Structure and function of influenza virus NS1 and NS2 proteins. Nihon Rinsho
1997;55(10):2605-9.
303
348. Wilson IA, Cox NJ. Structural basis of immune recognition of influenza virus
hemagglutinin. Annual Review of Immunology 1990;8:737-71.
349. Shtyrya YA, Mochalova LV, Bovin NV. Influenza virus neuraminidase: structure and
function. Acta Naturae 2009;1(2):26-32.
350. Colman PM. Influenza virus neuraminidase: structure, antibodies, and inhibitors. Protein
Sci 1994;3(10):1687-96.
351. Palese P, Schulman JL, Bodo G, Meindl P. Inhibition of influenza and parainfluenza virus
replication in tissue culture by 2-deoxy-2,3-dehydro-N-trifluoroacetylneuraminic acid
(FANA). Virology 1974;59(2):490-8.
352. Zambon M, Potter C. Influenza. In: Zuckerman AJ, Banatvala JE, Schoub BD, Griffins
PD, Mortimer P, editors. Principles and Practice of Clinical Virology. 6 ed. West Sussex:
Wiley-Blackwell; 2009. p. 372-408.
353. Suzuki Y. Sialobiology of influenza: molecular mechanism of host range variation of
influenza viruses. Biol Pharm Bull 2005;28(3):399-408.
354. Public Health Agency of Canada (PHAC) 2012. Influenza A virus subtypes H5, H7 and
H9. Available at: http://www.phac-aspc.gc.ca/lab-bio/res/psds-ftss/influenza-grippe-a-
eng.php. Accessed on 26 Dec 2013.
355. Subbarao K. Characterization of an avian influenza A (H5N1) virus isolated from a child
with a fatal respiratory illness. Science 1998;279:393-6.
356. Neumann G, Green MA, Macken CA. Evolution of highly pathogenic avian H5N1
influenza viruses and the emergence of dominant variants. J Gen Virol 2010;91(Pt
8):1984-95.
357. Du Ry van Beest Holle, Meijer A, Koopmans M, de Jager CM. Human-to-human
transmission of avian influenza A/H7N7, The Netherlands, 2003. Euro Surveill
2005;10(12):264-8.
358. Wong SS, Yuen KY. Avian influenza virus infections in humans. Chest 2006;129(1):156-
68.
359. Lam TT, Wang J, Shen Y, Zhou B, Duan L, Cheung CL, et al. The genesis and source of
the H7N9 influenza viruses causing human infections in China. Nature
2013;502(7470):241-4.
360. Peiris JS, de Jong MD, Guan Y. Avian influenza virus (H5N1): a threat to human health.
Clin Microbiol Rev 2007;20(2):243-67.
361. Lamb RA, Parks GD. Paramyxoviridae: The viruses and their replication. In: Knipe DM,
Griffin DE, Lamb RA, Straus SE, Howley PM, Martin MA, et al., editors. Fields Virology.
5 ed. Philadelphia: Lippincott Williams and Wilkins; 2007. p. 1449-96.
362. Hall CB. Respiratory syncytial virus and parainfluenza virus. N Engl J Med
2001;344(25):1917-28.
363. Kahn JS. Epidemiology of human metapneumovirus. Clin Microbiol Rev 2006;19(3):546-
57.
304
364. Chambers R, Takimoto T. Parainfluenza Viruses. Encyclopedia of Life Sciences 2011.
365. Gotoh B, Komatsu T, Takeuchi K, Yokoo J. Paramyxovirus accessory proteins as
interferon antagonists. Microbiol Immunol 2001;45(12):787-800.
366. Nishio M, Tsurudome M, Ito M, Kawano M, Komada H, Ito Y. High resistance of human
parainfluenza type 2 virus protein-expressing cells to the antiviral and anti-cell
proliferative activities of alpha/beta interferons: cysteine-rich V-specific domain is
required for high resistance to the interferons. J Virol 2001;75(19):9165-76.
367. Lai MMC, Perlan S, Anderson LJ. Coronaviridae. In: Knipe DM, Griffin DE, Lamb RA,
Straus SE, Howley PM, Martin MA, et al., editors. Fields Virology. 5 ed. Philadelphia:
Lippincott Williams and Wilkins; 2007. p. 1305-35.
368. Masters PS. The molecular biology of coronaviruses. Adv Virus Res 2006;66:193-292.
369. Gorbalenya AE, Enjuanes L, Ziebuhr J, Snijder EJ. Nidovirales: evolving the largest RNA
virus genome. Virus Res 2006;117(1):17-37.
370. Brian DA, Baric RS. Coronavirus genome structure and replication. Curr Top Microbiol
Immunol 2005;287:1-30.
371. Brian DA, Chang RY, Hofmann MA, Sethna PB. Role of subgenomic minus-strand RNA
in coronavirus replication. Arch Virol Suppl 1994;9:173-80.
372. Dennis DE, Brian DA. RNA-dependent RNA polymerase activity in coronavirus- infected
cells. J Virol 1982;42(1):153-64.
373. Ziebuhr J. The coronavirus replicase. Curr Top Microbiol Immunol 2005;287:57-94.
374. Snijder E, Wassenaar AL, Den Boon JA, Spaan WJ. Proteolytic processing of the
arterivirus replicase. Adv Exp Med Biol 1995;380:443-51.
375. Minskaia E, Hertzig T, Gorbalenya AE, Campanacci V, Cambillau C, Canard B, et al.
Discovery of an RNA virus 3'->5' exoribonuclease that is critically involved in coronavirus
RNA synthesis. Proc Natl Acad Sci U S A 2006;103(13):5108-13.
376. Vennema H, Godeke GJ, Rossen JW, Voorhout WF, Horzinek MC, Opstelten DJ, et al.
Nucleocapsid-independent assembly of coronavirus-like particles by co-expression of viral
envelope protein genes. EMBO J 1996;15(8):2020-8.
377. Malik Peiris JS, Poon LLM. Coronaviruses and Toroviruses. In: Zuckerman AJ, Banatvala
JE, Schoub BD, Griffins PD, Mortimer P, editors. Principles and Practice of Clinical
Virology. 6 ed. West Sussex: Wiley-Blackwell; 2009. p. 511-31.
378. de Groot RJ, Baker SC, Baric RS, Brown CS, Drosten C, Enjuanes L, et al. Middle East
respiratory syndrome coronavirus (MERS-CoV): announcement of the Coronavirus Study
Group. J Virol 2013;87(14):7790-2.
379. Gorbalenya AE, Snijder EJ, Spaan WJ. Severe acute respiratory syndrome coronavirus
phylogeny: toward consensus. J Virol 2004;78(15):7863-6.
380. Alekseev KP, Vlasova AN, Jung K, Hasoksuz M, Zhang X, Halpin R, et al. Bovine-like
coronaviruses isolated from four species of captive wild ruminants are homologous to
305
bovine coronaviruses, based on complete genomic sequences. J Virol 2008;82(24):12422-
31.
381. Racaniello VR. Picornaviridae: The viruses and their replication. In: Knipe DM, Griffin
DE, Lamb RA, Straus SE, Howley PM, Martin MA, et al., editors. Fields Virology. 5 ed.
Philadelphia: Lippincott Williams and Wilkins; 2007. p. 795-838.
382. Palmenberg AC, Spiro D, Kuzmickas R, Wang S, Djikeng A, Rathe JA, et al. Sequencing
and analyses of all known human rhinovirus genomes reveal structure and evolution.
Science 2009;324(5923):55-9.
383. Palmenberg AC, Rathe JA, Liggett SB. Analysis of the complete genome sequences of
human rhinovirus. J Allergy Clin Immunol 2010;125(6):1190-9.
384. Echavarria M. Adenoviruses. In: Zuckerman AJ, Banatvala JE, Schoub BD, Griffins PD,
Mortimer P, editors. Principles and practice of clinical virology. 6 ed. West Sussex: Wiley-
Blackwell; 2009. p. 463-510.
385. Berns K, Parrish CR. Parvoviridae. In: Knipe DM, Griffin DE, Lamb RA, Straus SE,
Howley PM, Martin MA, et al., editors. Fields Virology. 5 ed. Philadelphia: Lippincott
Williams and Wilkins; 2007. p. 2437-77.
386. Gao W, Robbins PD, Gambotto A. Human adenovirus type 35: nucleotide sequence and
vector development. Gene Ther 2003;10(23):1941-9.
387. Torres S, Chodosh J, Seto D, Jones MS. The revolution in viral genomics as exemplified
by the bioinformatic analysis of human adenoviruses. Viruses 2010;2(7):1367-81.
388. Benko M, Harrach B. Molecular evolution of adenoviruses. Curr Top Microbiol Immunol
2003;272:3-35.
389. Windheim M, Hilgendorf A, Burgert HG. Immune evasion by adenovirus E3 proteins:
exploitation of intracellular trafficking pathways. Curr Top Microbiol Immunol
2004;273:29-85.
390. Mahr JA, Gooding LR. Immune evasion by adenoviruses. Immunol Rev 1999;168:121-30.
391. Hierholzer JC, Stone YO, Broderson JR. Antigenic relationships among the 47 human
adenoviruses determined in reference horse antisera. Arch Virol 1991;121(1-4):179-97.
392. Rosen I. hemagglutination - inhibitor technique for classification of human adenoviruses.
American Journal of Hygiene 1960;71:120-8.
393. Li QG, Zheng QJ, Liu YH, Wadell G. Molecular epidemiology of adenovirus types 3 and 7
isolated from children with pneumonia in Beijing. J Med Virol 1996;49(3):170-7.
394. Lacy S, Green M. Biochemical studies on adenovirus multiplication. VII. Homology
between DNA's of tumorgenic and nonturmorgenic humn adenoviruses. Proc Natl Acad
Sci U S A 1964;52:1053-9.
395. Green M, Mackey JK, Wold WS, Rigden P. Thirty-one human adenovirus serotypes (Ad1-
Ad31) form five groups (A-E) based upon DNA genome homologies. Virology
1979;93(2):481-92.
306
396. Kim YJ, Hong JY, Lee HJ, Shin SH, Kim YK, Inada T, et al. Genome type analysis of
adenovirus types 3 and 7 isolated during successive outbreaks of lower respiratory tract
infections in children. J Clin Microbiol 2003;41(10):4594-9.
397. Jin XH, Aoki K, Kitaichi N, Ariga T, Ishida S, Ohno S. Genome variability of human
adenovirus type 8 causing epidemic keratoconjunctivitis during 1986-2003 in Japan. Mol
Vis 2011;17:3121-7.
398. Allander T, Tammi MT, Eriksson M, Bjerkner A, Tiveljung-Lindell A, Andersson B.
Cloning of a human parvovirus by molecular screening of respiratory tract samples. Proc
Natl Acad Sci U S A 2005;102(36):12891-6.
399. Kapoor A, Simmonds P, Slikas E, Li L, Bodhidatta L, Sethabutr O, et al. Human
bocaviruses are highly diverse, dispersed, recombination prone, and prevalent in enteric
infections. J Infect Dis 2010;201(11):1633-43.
400. Rambaut A, Pybus OG, Nelson MI, Viboud C, Taubenberger JK, Holmes EC. The
genomic and epidemiological dynamics of human influenza A virus. Nature
2008;453(7195):615-9.
401. Kawaoka Y, Webster RG. Sequence requirements for cleavage activation of influenza
virus hemagglutinin expressed in mammalian cells. Proc Natl Acad Sci U S A
1988;85(2):324-8.
402. Nelson MI, Viboud C, Simonsen L, Bennett RT, Griesemer SB, St GK, et al. Multiple
reassortment events in the evolutionary history of H1N1 influenza A virus since 1918.
PLoS Pathog 2008;4(2):e1000012.
403. Zimmer SM, Burke DS. Historical perspective--Emergence of influenza A (H1N1) viruses.
N Engl J Med 2009;361(3):279-85.
404. McDonald NJ, Smith CB, Cox NJ. Antigenic drift in the evolution of H1N1 influenza A
viruses resulting from deletion of a single amino acid in the haemagglutinin gene. Journal
of General Virology 2007;88(Pt:12):12-3.
405. Xu R, Ekiert DC, Krause JC, Hai R, Crowe JE, Jr., Wilson IA. Structural basis of
preexisting immunity to the 2009 H1N1 pandemic influenza virus. Science
2010;328(5976):357-60.
406. Liao YC, Chen FC, Hsiung CA. Contrasting substitution patterns between HA proteins of
avian and human influenza viruses: Implication for monitoring human influenza
epidemics. Vaccine 2010;28(50):7890-6.
407. Shen J, Ma J, Wang Q. Evolutionary trends of A(H1N1) influenza virus hemagglutinin
since 1918. PLoS ONE 2009;4(11):e7789.
408. Igarashi M, Ito K, Yoshida R, Tomabechi D, Kida H, Takada A. Predicting the antigenic
structure of the pandemic (H1N1) 2009 influenza virus hemagglutinin. PLoS ONE
2010;5(1):e8553.
409. Nobusawa E, Nakajima K, Nakajima S. Determination of the epitope 264 on the
hemagglutinin molecule of influenza H1N1 virus by site-specific mutagenesis. Virology
1987;159(1):10-9.
307
410. Vines A, Wells K, Matrosovich M, Castrucci MR, Ito T, Kawaoka Y. The Role of
Influenza A Virus Hemagglutinin Residues 226á and 228á in Receptor Specificity and
Host Range Restriction. J Virol 1998;72(9):7626-31.
411. Connor RJ, Kawaoka Y, Webster RG, Paulson JC. Receptor Specificity in Human, Avian,
and Equine H2 and H3 Influenza Virus Isolates. Virology 1994;205(1):17-23.
412. Matrosovich MN, Gambaryan AS, - Teneberg SP, Piskarev VE, Yamnikova SS, Lvov DK,
et al. Avian influenza A viruses differ from human viruses by recognition of
sialyloligosaccharides and gangliosides and by a higher conservation of the HA receptor-
binding site. Virology 1997;233(1):224-34 2001;-34.
413. Skehel JJ, Wiley DC. Receptor binding and membrane fusion in virus entry: the influenza
hemagglutinin. Annu Rev Biochem 2000;69:531-69.
414. Srinivasan A, Viswanathan K, Raman R, Chandrasekaran A, Raguram S, Tumpey TM, et
al. Quantitative biochemical rationale for differences in transmissibility of 1918 pandemic
influenza A viruses. Proc Natl Acad Sci U S A 2008;105(8):2800-5.
415. Stevens J, Blixt O, Glaser L, Taubenberger JK, Palese P, Paulson JC, et al. Glycan
microarray analysis of the hemagglutinins from modern and pandemic influenza viruses
reveals different receptor specificities. J Mol Biol 2006;355(5):1143-55.
416. Gamblin SJ, Haire LF, Russell RJ, Stevens DJ, Xiao B, Ha Y, et al. The structure and
receptor binding properties of the 1918 influenza hemagglutinin. Science
2004;303(5665):1838-42.
417. Zhang Y, Zhang Q, Gao Y, He X, Kong H, Jiang Y, et al. Key molecular factors in
hemagglutinin and PB2 contribute to efficient transmission of the 2009 H1N1 pandemic
influenza virus. J Virol 2012;86(18):9666-74.
418. Caton AJ, Brownlee GG, Yewdell JW, Gerhard W. The antigenic structure of the influenza
virus A/PR/8/34 hemagglutinin (H1 subtype). Cell 1982;31(2, Part 1):417-27.
419. Luoh SM, McGregor MW, Hinshaw VS. Hemagglutinin mutations related to antigenic
variation in H1 swine influenza viruses. J Virol 1992;66(2):1066-73 2002;-73.
420. Gerhard W, ewdell J, ankel ME, bster R. Antigenic structure of influenza virus
haemagglutinin defined by hybridoma antibodies. Nature 1981;290(5808):713-7.
421. Brownlee GG, Fodor E. The predicted antigenicity of the haemagglutinin of the 1918
Spanish influenza pandemic suggests an avian origin. Philos Trans R Soc Lond B Biol Sci
2001;356(1416):1871-6 2001;-6.
422. Cox NJ, Black RA, Kendal AP. Pathways of evolution of influenza A (H1N1) viruses from
1977 to 1986 as determined by oligonucleotide mapping and sequencing studies. J Gen
Virol 1989;70(Pt 2):299-313.
423. Huang JW, Lin WF, Yang JM. Antigenic sites of H1N1 influenza virus hemagglutinin
revealed by natural isolates and inhibition assays. Vaccine 2012;30(44):6327-37.
424. Stray SJ, Pittman LB. Subtype- and antigenic site-specific differences in biophysical
influences on evolution of influenza virus hemagglutinin. Virol J 2012;9:91. doi:
10.1186/1743-422X-9-91.:91-9.
308
425. Garten W, Klenk HD. Understanding influenza virus pathogenicity. Trends in
Microbiology 1999;7(3):99-100.
426. Schwarz F, Aebi M. Mechanisms and principles of N-linked protein glycosylation. Curr
Opin Struct Biol 2011;21(5):576-82.
427. Sun X, Jayaraman A, Maniprasad P, Raman R, Houser KV, Pappas C, et al. N-linked
glycosylation of the hemagglutinin protein influences virulence and antigenicity of the
1918 pandemic and seasonal H1N1 influenza A viruses. J Virol 2013;87(15):8756-66.
428. Sun S, Wang Q, Zhao F, Chen W, Li Z. Glycosylation site alteration in the evolution of
influenza A (H1N1) viruses. PLoS One 2011;6(7):e22844.
429. Huang TS, Palese P, Krystal M. Determination of influenza virus proteins required for
genome replication. Journal of Virology 1990;64(11):5669-73.
430. Li ML, Rao P, Krug RM. The active sites of the influenza cap-dependent endonuclease are
on different polymerase subunits. EMBO Journal 2001;20(8):2078-86.
431. Honda A, Mizumoto K, Ishihama A. Two separate sequences of PB2 subunit constitute the
RNA cap-binding site of influenza virus RNA polymerase. Genes to Cells 1999;4(8):475-
85.
432. Palese P, Shaw ML. Othomyxoviridae: The viruses and their Replication. In: Knipe DM,
Griffin DE, Lamb RA, Straus SE, Howley PM, Martin MA, et al., editors. Fields Virology.
5th ed. Philadelphia: Lippincott Williams and Wilkins; 2007. p. 1647-89.
433. Fechter P, Mingay L, Sharps J, Chambers A, Fodor E, Brownlee GG. Two aromatic
residues in the PB2 subunit of influenza A RNA polymerase are crucial for cap binding.
Journal of Biological Chemistry 2003;278(22):20381-8.
434. Poole E, Elton D, Medcalf L, Digard P. Functional domains of the influenza A virus PB2
protein: identification of NP- and PB1-binding sites. Virology 2004;321(1):120-33.
435. Subbarao EK, London W, Murphy BR. A single amino acid in the PB2 gene of influenza
A virus is a determinant of host range. Journal of Virology 1993;67(4):1761-4.
436. Herfst S, Chutinimitkul S, Ye J, de WE, Munster VJ, Schrauwen EJ, et al. Introduction of
virulence markers in PB2 of pandemic swine-origin influenza virus does not result in
enhanced virulence or transmission. Journal of Virology 2010;84(8):3752-8.
437. Gabriel G, Herwig A, Klenk HD. Interaction of polymerase subunit PB2 and NP with
importin alpha1 is a determinant of host range of influenza A virus. PLoS Pathog
2008;4(2):e11.
438. Miotto O, Heiny AT, Albrecht R, Garcia-Sastre A, Tan TW, August JT, et al. Complete-
proteome mapping of human influenza A adaptive mutations: implications for human
transmissibility of zoonotic strains. PLoS ONE 2010;5(2):e9025.
439. Zhou B, Pearce MB, Li Y, Wang J, Mason RJ, Tumpey TM, et al. Asparagine substitution
at PB2 residue 701 enhances the replication, pathogenicity, and transmission of the 2009
pandemic H1N1 influenza A virus. PLoS One 2013;8(6):e67616.
309
440. Jagger BW, Memoli MJ, Sheng ZM, Qi L, Hrabal RJ, Allen GL, et al. The PB2-E627K
mutation attenuates viruses containing the 2009 H1N1 influenza pandemic polymerase.
MBio 2010;1(1):e00067-10.
441. Zhao Z, Yi C, Zhao L, Wang S, Zhou L, Hu Y, et al. PB2-588I Enhances 2009 H1N1
Pandemic Influenza Virus Virulence by Increasing Viral Replication and Exacerbating
PB2 Inhibition of Beta Interferon Expression. J Virol 2014;88(4):2260-7.
442. Liu Q, Qiao C, Marjuki H, Bawa B, Ma J, Guillossou S, et al. Combination of PB2 271A
and SR polymorphism at positions 590/591 is critical for viral replication and virulence of
swine influenza virus in cultured cells and in vivo. J Virol 2012;86(2):1233-7.
443. Bussey KA, Bousse TL, Desmet EA, Kim B, Takimoto T. PB2 residue 271 plays a key
role in enhanced polymerase activity of influenza A viruses in mammalian host cells. J
Virol 2010;84(9):4395-406.
444. Zhu H, Wang J, Wang P, Song W, Zheng Z, Chen R, et al. Substitution of lysine at 627
position in PB2 protein does not change virulence of the 2009 pandemic H1N1 virus in
mice. Virology 2010;401(1):1-5.
445. Yamada S, Hatta M, Staker BL, Watanabe S, Imai M, Shinya K, et al. Biological and
structural characterization of a host-adapting amino acid in influenza virus. PLoS Pathog
2010;6(8):e1001034.
446. Zhou B, Li Y, Halpin R, Hine E, Spiro DJ, Wentworth DE. PB2 residue 158 is a
pathogenic determinant of pandemic H1N1 and H5 influenza a viruses in mice. J Virol
2011;85(1):357-65.
447. Zhu W, Zhu Y, Qin K, Yu Z, Gao R, Yu H, et al. Mutations in polymerase genes enhanced
the virulence of 2009 pandemic H1N1 influenza virus in mice. PLoS One
2012;7(3):e33383.
448. Mehle A, Doudna JA. Adaptive strategies of the influenza virus polymerase for replication
in humans. Proc Natl Acad Sci U S A 2009;106(50):21312-6.
449. Qian XY, Alonso-Caplen F, Krug RM. Two functional domains of the influenza virus NS1
protein are required for regulation of nuclear export of mRNA. Journal of Virology
1994;68(4):2433-41.
450. Lin D, Lan J, Zhang Z. Structure and function of the NS1 protein of influenza A virus.
Acta Biochimica et Biophysica Sinica 2007;39(3):155-62.
451. Li Y, Chen ZY, Wang W, Baker CC, Krug RM. The 3'-end-processing factor CPSF is
required for the splicing of single-intron pre-mRNAs in vivo. Rna-A Publication of the
Rna Society 2001;7(6):920-31.
452. Kochs G, Garcia-Sastre A, Martinez-Sobrido L. Multiple anti-interferon actions of the
influenza A virus NS1 protein. Journal of Virology 2007;81(13):7011-21.
453. Qiu Y, Krug RM. The influenza virus NS1 protein is a poly(A)-binding protein that
inhibits nuclear export of mRNAs containing poly(A). J Virol 1994;68(4):2425-32.
454. Wang W, Riedel K, Lynch P, Chien CY, Montelione GT, Krug RM. RNA binding by the
novel helical domain of the influenza virus NS1 protein requires its dimer structure and a
small number of specific basic amino acids. RNA 1999;5(2):195-205.
310
455. Cheng A, Wong SM, Yuan YA. Structural basis for dsRNA recognition by NS1 protein of
influenza A virus. Cell Res 2009;19(2):187-95.
456. Yin C, Khan JA, Swapna GV, Ertekin A, Krug RM, Tong L, et al. Conserved surface
features form the double-stranded RNA binding site of non-structural protein 1 (NS1) from
influenza A and B viruses. J Biol Chem 2007;282(28):20584-92.
457. Bergmann M, Garcia-Sastre A, Carnero E, Pehamberger H, Wolff K, Palese P, et al.
Influenza virus NS1 protein counteracts PKR-mediated inhibition of replication. Journal of
Virology 2000;74(13):6203-6.
458. Min JY, Li S, Sen GC, Krug RM. A site on the influenza A virus NS1 protein mediates
both inhibition of PKR activation and temporal regulation of viral RNA synthesis.
Virology 2007;363(1):236-43.
459. Pu J, Wang J, Zhang Y, Fu G, Bi Y, Sun Y, et al. Synergism of co-mutation of two amino
acid residues in NS1 protein increases the pathogenicity of influenza virus in mice. Virus
Res 2010;151(2):200-4.
460. Gack MU, Albrecht RA, Urano T, Inn KS, Huang IC, Carnero E, et al. Influenza A virus
NS1 targets the ubiquitin ligase TRIM25 to evade recognition by the host viral RNA
sensor RIG-I. Cell Host & Microbe 2009;5(5):439-49.
461. Mibayashi M, Martinez-Sobrido L, Loo YM, Cardenas WB, Gale M, Jr., Garcia-Sastre A.
Inhibition of retinoic acid-inducible gene I-mediated induction of beta interferon by the
NS1 protein of influenza A virus. J Virol 2007;81(2):514-24.
462. Bornholdt ZA, Prasad BV. X-ray structure of influenza virus NS1 effector domain. Nature
Structural & Molecular Biology 2006;13(6):559-60.
463. Chien Cy, Xu Y, Xiao R, Aramini JM, Sahasrabudhe PV, Krug RM, et al. Biophysical
Characterization of the Complex between Double-Stranded RNA and the N-Terminal
Domain of the NS1 Protein from Influenza A Virus:GÇë Evidence for a Novel RNA-
Binding ModeGÇá. Biochemistry 2004;43(7):1950-62.
464. Donelan NR, Basler CF, Garcia-Sastre A. A recombinant influenza A virus expressing an
RNA-binding-defective NS1 protein induces high levels of beta interferon and is
attenuated in mice. J Virol 2003;77(24):13257-66.
465. Talon J, Horvath CM, Polley R, Basler CF, Muster T, Palese P, et al. Activation of
interferon regulatory factor 3 is inhibited by the influenza A virus NS1 protein. J Virol
2000;74(17):7989-96.
466. Mok BW, Song W, Wang P, Tai H, Chen Y, Zheng M, et al. The NS1 protein of influenza
A virus interacts with cellular processing bodies and stress granules through RNA-
associated protein 55 (RAP55) during virus infection. J Virol 2012;86(23):12695-707.
467. Giria MT, Rebelo de AH, Santos LA, Correia VM, Pedro SV, Santos MA. Genomic
signatures and antiviral drug susceptibility profile of A(H1N1)pdm09. J Clin Virol
2012;53(2):140-4.
468. Minor PD. Vaccines against seasonal and pandemic influenza and the implications of
changes in substrates for virus production. Clin Infect Dis 2010;50(4):560-5.
311
469. World Health Organisation (WHO) 2007. A description of the process of seasonal and
H5N1 influenza vaccine virus selection and development. Available at:
http://www.who.int/influenza/resources/documents/Fluvaccvirusselection.pdf?ua=1.
Accessed on 10 October 2013.
470. Kelly H, Carville K, Grant K, Jacoby P, Tran T, Barr I. Estimation of influenza vaccine
effectiveness from routine surveillance data. PLoS One 2009;4(3):e5079.
471. Skowronski DM, Masaro C, Kwindt TL, Mak A, Petric M, Li Y, et al. Estimating vaccine
effectiveness against laboratory-confirmed influenza using a sentinel physician network:
results from the 2005-2006 season of dual A and B vaccine mismatch in Canada. Vaccine
2007;25(15):2842-51.
472. Valenciano M, Kissling E, Ciancio BC, Moren A. Study designs for timely estimation of
influenza vaccine effectiveness using European sentinel practitioner networks. Vaccine
2010;28(46):7381-8.
473. De SG, Skowronski DM, Wu XW, Ambrose CS. The test-negative design: validity,
accuracy and precision of vaccine efficacy estimates compared to the gold standard of
randomised placebo-controlled clinical trials. Euro Surveill 2013;18(37):20585.
474. Lakdawala SS, Shih AR, Jayaraman A, Lamirande EW, Moore I, Paskel M, et al. Receptor
specificity does not affect replication or virulence of the 2009 pandemic H1N1 influenza
virus in mice and ferrets. Virology 2013;446(1-2):349-56.
475. Zhang Y, Zhu J, Li Y, Bradley KC, Cao J, Chen H, et al. Glycosylation on hemagglutinin
affects the virulence and pathogenicity of pandemic H1N1/2009 influenza A virus in mice.
PLoS One 2013;8(4):e61397.
476. Kim JI, Lee I, Park S, Hwang MW, Bae JY, Lee S, et al. Genetic requirement for
hemagglutinin glycosylation and its implications for influenza A H1N1 virus evolution. J
Virol 2013;87(13):7539-49.
477. Zou W, Chen D, Xiong M, Zhu J, Lin X, Wang L, et al. Insights into the increasing
virulence of the swine-origin pandemic H1N1/2009 influenza virus. Sci Rep 2013;3:1601.
doi: 10.1038/srep01601.:1601.
478. Uraki R, Kiso M, Shinya K, Goto H, Takano R, Iwatsuki-Horimoto K, et al. Virulence
determinants of pandemic A(H1N1)2009 influenza virus in a mouse model. J Virol
2013;87(4):2226-33.
479. Pan D, Xue W, Wang X, Guo J, Liu H, Yao X. Molecular mechanism of the enhanced
virulence of 2009 pandemic influenza A (H1N1) virus from D222G mutation in the
hemagglutinin: a molecular modeling study. J Mol Model 2012;18(9):4355-66.
480. Seyer R, Hrincius ER, Ritzel D, Abt M, Mellmann A, Marjuki H, et al. Synergistic
adaptive mutations in the hemagglutinin and polymerase acidic protein lead to increased
virulence of pandemic 2009 H1N1 influenza A virus in mice. J Infect Dis
2012;205(2):262-71.
481. Belser JA, Jayaraman A, Raman R, Pappas C, Zeng H, Cox NJ, et al. Effect of D222G
mutation in the hemagglutinin protein on receptor binding, pathogenesis and
transmissibility of the 2009 pandemic H1N1 influenza virus. PLoS One 2011;6(9):e25091.
312
482. World Health Organisation, (WHO) 2009. Preliminary review of D222G amino acid
substitution in the haemagglutinin of pandemic influenza A (H1N1) 2009 viruses..
Available at:
http://www.who.int/csr/resources/publications/swineflu/cp165_2009_2812_review_d222g
_amino_acid_substitution_in_ha_h1n1_viruses.pdf. Accessed on 15 July, 2012.
483. European Centre for Disease Prevention and Control (ECDPC) 2010. The 2009 A(H1N1)
pandemic in Europe: A review of the experience. Available at:
http://www.ecdc.europa.eu/en/publications/Publications/101108_SPR_pandemic_experien
ce.pdf. Accessed on 10 December 2012.
484. Drews AL, Atmar RL, Glezen WP, Baxter BD, Piedra PA, Greenberg SB. Dual respiratory
virus infections. [Review] [53 refs]. Clinical Infectious Diseases 1997;25(6):1421-9.
485. Rhedin S, Hamrin J, Naucler P, Bennet R, Rotzen-Ostlund M, Farnert A, et al. Respiratory
viruses in hospitalized children with influenza-like illness during the H1n1 2009 pandemic
in Sweden. PLoS ONE 2012;7(12):e51491.
486. Echenique IA, Chan PA, Chapin KC, Andrea SB, Fava JL, Mermel LA. Clinical
characteristics and outcomes in hospitalized patients with respiratory viral co-infection
during the 2009 H1N1 influenza pandemic. PLoS ONE 2013;8(4):e60845.
487. Marcone DN, Ellis A, Videla C, Ekstrom J, Ricarte C, Carballal G, et al. Viral etiology of
acute respiratory infections in hospitalized and outpatient children in Buenos Aires,
Argentina. Pediatr Infect Dis J 2013;32(3):e105-e110.
488. World Health Orgnisation (WHO) 2009. Clinical management of human infection with
pandemic (H1N1) 2009: revised guidance (Nov 2009). Available at:
http://www.who.int/csr/resources/publications/swineflu/clinical_management_h1n1.pdf?ua
=1. Accessed on 1 October 2012. 2012.
489. Potdar VA, Chadha MS, Jadhav SM, Mullick J, Cherian SS, Mishra AC. Genetic
characterization of the influenza A pandemic (H1N1) 2009 virus isolates from India. PLoS
ONE 2010;5(3):e9693.
490. Tse H, To KK, Wen X, Chen H, Chan KH, Tsoi HW, et al. Clinical and virological factors
associated with viremia in pandemic influenza A/H1N1/2009 virus infection. PLoS ONE
2011;6(9):e22534.
491. Baldanti F, Campanini G, Piralla A, Rovida F, Braschi A, Mojoli F, et al. Severe outcome
of influenza A/H1N1/09v infection associated with 222G/N polymorphisms in the
haemagglutinin: a multicentre study. Clin Microbiol Infect 2011;17(8):1166-9.
492. Promed Email. Influenza pandemic (H1N1) 2009 (58): The Netherlands, PB2 Mutation.
Promed Email ID:1000,79432 . Accessed on 20 Novevember 2013.
493. Puzelli S, Facchini M, De Marco MA, Palmieri A, Spagnolo D, Boros S, et al. Molecular
surveillance of pandemic influenza A(H1N1) viruses circulating in Italy from May 2009 to
February 2010: association between haemagglutinin mutations and clinical outcome. Euro
Surveill 2010;15(43). pii: 19696.
494. Kilander A, Rykkvin R, Dudman SG, Hungnes O. Observed association between the HA1
mutation D222G in the 2009 pandemic influenza A(H1N1) virus and severe clinical
outcome, Norway 2009-2010. Euro Surveill 2010;15(9). pii: 19498.
313
495. Mak GC, Au KW, Tai LS, Chuang KC, Cheng KC, Shiu TC, et al. Association of D222G
substitution in haemagglutinin of 2009 pandemic influenza A (H1N1) with severe disease.
Euro Surveill 2010;15(14). pii: 19534.
496. Miller RR, MacLean AR, Gunson RN, Carman WF. Occurrence of haemagglutinin
mutation D222G in pandemic influenza A(H1N1) infected patients in the West of
Scotland, United Kingdom, 2009-10. Euro Surveill 2010;15(16). pii: 19546.
497. Graham M, Liang B, Van DG, Bastien N, Beaudoin C, Tyler S, et al. Nationwide
molecular surveillance of pandemic H1N1 influenza A virus genomes: Canada, 2009.
PLoS ONE 2011;6(1):e16087.
498. Farooqui A, Lei Y, Wang P, Huang J, Lin J, Li G, et al. Genetic and clinical assessment of
2009 pandemic influenza in southern China. J Infect Dev Ctries 2011;5(10):700-10.
499. Chen H, Wen X, To KK, Wang P, Tse H, Chan JF, et al. Quasispecies of the D225G
substitution in the hemagglutinin of pandemic influenza A(H1N1) 2009 virus from patients
with severe disease in Hong Kong, China. J Infect Dis 2010;201(10):1517-21.
500. Venter M, Naidoo D, Pretorius M, Buys A, McAnerney J, Blumberg L, et al. Evolutionary
dynamics of 2009 pandemic influenza A virus subtype H1N1 in South Africa during 2009-
2010. J Infect Dis 2012;206 Suppl 1:S166-72. doi: 10.1093/infdis/jis539.:S166-S172.
501. Akcay CM, Hasoksuz M, Kanturvardar M, Asar S, Badur S. Molecular and serological
investigations of the Influenza A(H1N1) 2009 pandemic virus in Turkey. Med Microbiol
Immunol 2013;202(4):277-84.
502. Vazquez-Perez JA, Isa P, Kobasa D, Ormsby CE, Ramirez-Gonzalez JE, Romero-
Rodriguez DP, et al. A (H1N1) pdm09 HA D222 variants associated with severity and
mortality in patients during a second wave in Mexico. Virol J 2013;10:41. doi:
10.1186/1743-422X-10-41.:41-10.
503. Wedde M, Wahlisch S, Wolff T, Schweiger B. Predominance of HA-222D/G
polymorphism in influenza A(H1N1)pdm09 viruses associated with fatal and severe
outcomes recently circulating in Germany. PLoS One 2013;8(2):e57059.
504. Moussi AE, Kacem MA, Pozo F, Ledesma J, Cuevas MT, Casas I, et al. Frequency of
D222G haemagglutinin mutant of pandemic (H1N1) pdm09 influenza virus in Tunisia
between 2009 and 2011. Diagn Pathol 2013;8(1):124-8.
505. Ferreira JL, Borborema SE, Brigido LF, Oliveira MI, Paiva TM, Santos CL. Sequence
analysis of the 2009 pandemic influenza A H1N1 virus haemagglutinin gene from 2009-
2010 Brazilian clinical samples. Mem Inst Oswaldo Cruz 2011;106(5):613-6.
506. Barrero PR, Viegas M, Valinotto LE, Mistchenko AS. Genetic and phylogenetic analyses
of influenza A H1N1pdm virus in Buenos Aires, Argentina. J Virol 2011;85(2):1058-66.
507. Glinsky GV. Genomic analysis of pandemic (H1N1) 2009 reveals association of increasing
disease severity with emergence of novel hemagglutinin mutations. Cell Cycle
2010;9(5):958-70.
508. Lee RT, Santos CL, de Paiva TM, Cui L, Sirota FL, Eisenhaber F, et al. All that glitters is
not gold--founder effects complicate associations of flu mutations to disease severity. Virol
J 2010;7:297.
314
509. Murphy BR, Buckler-White AJ, London WT, Snyder MH. Characterization of the M
protein and nucleoprotein genes of an avian influenza A virus which are involved in host
range restriction in monkeys. Vaccine 1989;7(6):557-61.
510. Clements ML, Subbarao EK, Fries LF, Karron RA, London WT, Murphy BR. Use of
single-gene reassortant viruses to study the role of avian influenza A virus genes in
attenuation of wild-type human influenza A virus for squirrel monkeys and adult human
volunteers. J Clin Microbiol 1992;30(3):655-62.
511. Pascalis H, Temmam S, Wilkinson DA, Dsouli N, Turpin M, de L, X, et al. Molecular
evolutionary analysis of pH1N1 2009 influenza virus in Reunion Island, South West Indian
Ocean region: a cohort study. PLoS ONE 2012;7(8):e43742.
512. Mullick J, Cherian SS, Potdar VA, Chadha MS, Mishra AC. Evolutionary dynamics of the
influenza A pandemic (H1N1) 2009 virus with emphasis on Indian isolates: evidence for
adaptive evolution in the HA gene. Infect Genet Evol 2011;11(5):997-1005.
513. Cilla G, Onate E, Perez-Yarza EG, Montes M, Vicente D, Perez-Trallero E. Viruses in
community-acquired pneumonia in children aged less than 3 years old: High rate of viral
coinfection. J Med Virol 2008;80(10):1843-9.
514. Marcone DN, Ellis A, Videla C, Ekstrom J, Ricarte C, Carballal G, et al. Viral etiology of
acute respiratory infections in hospitalized and outpatient children in Buenos Aires,
Argentina. Pediatr Infect Dis J 2013;32(3):e105-e110.
515. Guerrier G, Goyet S, Chheng ET, Rammaert B, Borand L, Te V, et al. Acute viral lower
respiratory tract infections in Cambodian children: clinical and epidemiologic
characteristics. Pediatr Infect Dis J 2013;32(1):e8-13.
516. Franz A, Adams O, Willems R, Bonzel L, Neuhausen N, Schweizer-Krantz S, et al.
Correlation of viral load of respiratory pathogens and co-infections with disease severity in
children hospitalized for lower respiratory tract infection. J Clin Virol 2010;48(4):239-45.
517. Do AHL, van Doorn HR, Nghiem MN, Bryant JE, Hoang THt, Do QH, et al. Viral
Etiologies of Acute Respiratory Infections among Hospitalized Vietnamese Children in Ho
Chi Minh City, 2004GÇô2008. PLoS ONE 2011;6(3):e18176.
518. Li W, Shi W, Qiao H, Ho SY, Luo A, Zhang Y, et al. Positive selection on hemagglutinin
and neuraminidase genes of H1N1 influenza viruses. Virol J 2011;8:183. doi:
10.1186/1743-422X-8-183.:183-8.
519. Shih AC, Hsiao TC, Ho MS, Li WH. Simultaneous amino acid substitutions at antigenic
sites drive influenza A hemagglutinin evolution. Proc Natl Acad Sci U S A
2007;104(15):6283-8.
520. Wiley DC, Wilson IA, Skehel JJ. Structural identification of the antibody-binding sites of
Hong Kong influenza haemagglutinin and their involvement in antigenic variation. Nature
1981;289(5796):373-8.
521. Bush RM, Bender CA, Subbarao K, Cox NJ, Fitch WM. Predicting the evolution of human
influenza A. Science 1999;286(5446):1921-5.
522. Suzuki Y, Gojobori T. A method for detecting positive selection at single amino acid sites.
Mol Biol Evol 1999;16(10):1315-28.
315
523. Abe Y, Takashita E, Sugawara K, Matsuzaki Y, Muraki Y, Hongo S. Effect of the addition
of oligosaccharides on the biological activities and antigenicity of influenza A/H3N2 virus
hemagglutinin. J Virol 2004;78(18):9605-11.
524. Blackburne BP, Hay AJ, Goldstein RA. Changing selective pressure during antigenic
changes in human influenza H3. PLoS Pathog 2008;4(5):e1000058.
525. Seidel W, Kunkel F, Geisler B, Garten W, Herrmann B, Dohner L, et al. Intraepidemic
variants of influenza virus H3 hemagglutinin differing in the number of carbohydrate side
chains. Arch Virol 1991;120(3-4):289-96.
526. Deem MW, Pan K. The epitope regions of H1-subtype influenza A, with application to
vaccine efficacy. Protein Eng Des Sel 2009;22(9):543-6.
527. Smith DJ, Lapedes AS, de Jong JC, Bestebroer TM, Rimmelzwaan GF, Osterhaus AD, et
al. Mapping the antigenic and genetic evolution of influenza virus. Science
2004;305(5682):371-6.
528. Anisimova M, Kosiol C. Investigating protein-coding sequence evolution with
probabilistic codon substitution models. Mol Biol Evol 2009;26(2):255-71.
529. Delport W, Scheffler K, Botha G, Gravenor MB, Muse SV, Kosakovsky Pond SL.
CodonTest: modeling amino acid substitution preferences in coding sequences. PLoS
Comput Biol 2010;6(8):e1000885.
530. Nicholson KG, Webster R.G, Hay A. Textbook of influenza. 2 ed. London: Blackwell
Science; 1998.
531. Reid AH, Fanning TG, Janczewski TA, Lourens RM, Taubenberger JK. Novel origin of
the 1918 pandemic influenza virus nucleoprotein gene. J Virol 2004;78(22):12462-70.
532. Webby RJ, Swenson SL, Krauss SL, Gerrish PJ, Goyal SM, Webster RG. Evolution of
swine H3N2 influenza viruses in the United States. J Virol 2000;74(18):8243-51.
533. Newman AP, Reisdorf E, Beinemann J, Uyeki TM, Balish A, Shu B, et al. Human case of
swine influenza A (H1N1) triple reassortant virus infection, Wisconsin. Emerg Infect Dis
2008;14(9):1470-2.
534. Shinde V, Bridges CB, Uyeki TM, Shu B, Balish A, Xu X, et al. Triple-reassortant swine
influenza A (H1) in humans in the United States, 2005-2009. N Engl J Med
2009;360(25):2616-25.
535. Smith GJ, Vijaykrishna D, Bahl J, Lycett SJ, Worobey M, Pybus OG, et al. Origins and
evolutionary genomics of the 2009 swine-origin H1N1 influenza A epidemic. Nature
2009;459(7250):1122-5.
536. Bragstad K, Nielsen LP, Fomsgaard A. The evolution of human influenza A viruses from
1999 to 2006: a complete genome study. Virol J 2008;5:40.
537. Nelson MI, Edelman L, Spiro DJ, Boyne AR, Bera J, Halpin R, et al. Molecular
epidemiology of A/H3N2 and A/H1N1 influenza virus during a single epidemic season in
the United States. PLoS Pathog 2008;4(8):e1000133.
316
538. Garten RJ, Davis CT, Russell CA, Shu B, Lindstrom S, Balish A, et al. Antigenic and
genetic characteristics of swine-origin 2009 A(H1N1) influenza viruses circulating in
humans. Science 2009;325(5937):197-201.
539. Brunstein JD, Cline CL, McKinney S, Thomas E. Evidence from multiplex molecular
assays for complex multipathogen interactions in acute respiratory infections. J Clin
Microbiol 2008;46(1):97-102.
540. Debiaggi M, Canducci F, Ceresola ER, Clementi M. The role of infections and
coinfections with newly identified and emerging respiratory viruses in children. Virol J
2012;9:247. doi: 10.1186/1743-422X-9-247.:247-9.
541. Greer RM, McErlean P, Arden KE, Faux CE, Nitsche A, Lambert SB, et al. Do
rhinoviruses reduce the probability of viral co-detection during acute respiratory tract
infections? Journal of Clinical Virology 2009;45(1):10-5.
542. Yang Y, Wang Z, Ren L, Wang W, Vernet G, Paranhos-Baccala G, et al. Influenza
A/H1N1 2009 pandemic and respiratory virus infections, Beijing, 2009-2010. PLoS One
2012;7(9):e45807.
543. Kloepfer KM, Olenec JP, Lee WM, Liu G, Vrtis RF, Roberg KA, et al. Increased H1N1
infection rate in children with asthma. Am J Respir Crit Care Med 2012;185(12):1275-9.
544. Linde A, Rotzen-Ostlund M, Zweygberg-Wirgart B, Rubinova S, Brytting M. Does viral
interference affect spread of influenza? Euro Surveillance: Bulletin Europeen sur les
Maladies Transmissibles = European Communicable Disease Bulletin 2009;14(40):2009.
545. Casalegno JS, Ottmann M, Duchamp MB, Escuret V, Billaud G, Frobert E, et al.
Rhinoviruses delayed the circulation of the pandemic influenza A (H1N1) 2009 virus in
France. Clinical Microbiology & Infection 2010;16(4):326-9.
546. Psarras S, Papadopoulas NG, Johnston SL. Parainfluenza viruses. In: Zuckerman AJ,
Banatvala JE, Schoub BD, Griffins PD, Mortimer P, editors. Principles and Practice of
Clinical Virology. 6 ed. West Sussex: Wiley-Blackwell; 2009. p. 409-39.
547. Silverman RH. Viral encounters with 2',5'-oligoadenylate synthetase and RNase L during
the interferon antiviral response. J Virol 2007;81(23):12720-9.
548. Hovanessian AG, Justesen J. The human 2'-5'oligoadenylate synthetase family: unique
interferon-inducible enzymes catalyzing 2'-5' instead of 3'-5' phosphodiester bond
formation. Biochimie 2007;89(6-7):779-88.
549. McAllister CS, Samuel CE. The RNA-activated protein kinase enhances the induction of
interferon-beta and apoptosis mediated by cytoplasmic RNA sensors. J Biol Chem
2009;284(3):1644-51.
550. Lu HL, Liao F. Melanoma differentiation-associated gene 5 senses hepatitis B virus and
activates innate immune signaling to suppress virus replication. J Immunol
2013;191(6):3264-76.
551. Schiff LA, Nibert MI, Kenneth LT. Othomyxoviriruses and their replication. In: Knipe
DM, Griffin DE, Lamb RA, Straus SE, Howley PM, Martin MA, et al., editors. Fields
Virology. 5 ed. Philadelphia: Lippincott Williams and Wilkins; 2007. p. 1853-916.
317
552. Biron CA, Sen GC. Innate Immune Responses to Viral Infections. In: Knipe DM, Griffin
DE, Lamb RA, Straus SE, Howley PM, Martin MA, et al., editors. Fields Virology. 5 ed.
Philadelphia: Lippincott Williams and Wilkins; 2007. p. 249-78.
553. Wang S, Le TQ, Kurihara N, Chida J, Cisse Y, Yano M, et al. Influenza virus-cytokine-
protease cycle in the pathogenesis of vascular hyperpermeability in severe influenza. J
Infect Dis 2010;202(7):991-1001.
554. Cheung CY, Poon LL, Lau AS, Luk W, Lau YL, Shortridge KF, et al. Induction of
proinflammatory cytokines in human macrophages by influenza A (H5N1) viruses: a
mechanism for the unusual severity of human disease? Lancet 2002;360(9348):1831-7.
555. Julkunen I, Sareneva T, Pirhonen J, Ronni T, Melen K, Matikainen S. Molecular
pathogenesis of influenza A virus infection and virus-induced regulation of cytokine gene
expression. Cytokine Growth Factor Rev 2001;12(2-3):171-80.
556. Belgnaoui SM, Paz S, Hiscott J. Orchestrating the interferon antiviral response through the
mitochondrial antiviral signaling (MAVS) adapter. Curr Opin Immunol 2011;23(5):564-
72.
557. Sly PD, Jones CM. Viral co-detection in infants hospitalized with respiratory disease: is it
important to detect? J Pediatr (Rio J ) 2011;87(4):277-80.
558. Navarro-Mari JM, Perez-Ruiz M, Galan Montemayor JC, Marcos Maeso MA, Reina J, de
Ona NM, et al. Circulation of other respiratory viruses and viral co-infection during the
2009 pandemic influenza. Enferm Infecc Microbiol Clin 2012 Oct;30 Suppl 4:25-31. doi:
10.1016/S0213-005X(12)70101-5.
559. Weissbrich B, Neske F, Schubert J, Tollmann F, Blath K, Blessing K, et al. Frequent
detection of bocavirus DNA in German children with respiratory tract infections. BMC
Infect Dis 2006;6:109.:109.
560. De PM, Gilio AE, Ferraro AA, Ferronato AE, do Sacramento PR, Botosso VF, et al.
Severity of viral coinfection in hospitalized infants with respiratory syncytial virus
infection. J Pediatr (Rio J ) 2011;87(4):307-13.
561. Cowling BJ, Fang VJ, Nishiura H, Chan KH, Ng S, Ip DK, et al. Increased risk of
noninfluenza respiratory virus infections associated with receipt of inactivated influenza
vaccine. Clin Infect Dis 2012;54(12):1778-83.
562. Sundaram ME, McClure DL, VanWormer JJ, Friedrich TC, Meece JK, Belongia EA.
Influenza vaccination is not associated with detection of noninfluenza respiratory viruses
in seasonal studies of influenza vaccine effectiveness. Clin Infect Dis 2013;57(6):789-93.
563. Dierig A, Heron LG, Lambert SB, Yin JK, Leask J, Chow MY, et al. Epidemiology of
respiratory viral infections in children enrolled in a study of influenza vaccine
effectiveness. Influenza Other Respir Viruses 2014;8(3):293-301. DOI: 10.1111/irv.12229.
564. Ren L, Gonzalez R, Wang Z, Xiang Z, Wang Y, Zhou H, et al. Prevalence of human
respiratory viruses in adults with acute respiratory tract infections in Beijing, 2005-2007.
Clin Microbiol Infect 2009;15(12):1146-53.
565. Jennings LC, Anderson TP, Werno AM, Beynon KA, Murdoch DR. Viral etiology of acute
respiratory tract infections in children presenting to hospital: role of polymerase chain
reaction and demonstration of multiple infections. Pediatr Infect Dis J 2004;23(11):1003-7.
318
566. Boivin G, De SG, Cote S, Gilca R, Abed Y, Rochette L, et al. Human metapneumovirus
infections in hospitalized children. Emerg Infect Dis 2003;9(6):634-40.
567. O'Callaghan-Gordo C, Bassat Q, Morais L, Diez-Padrisa N, Machevo S, Nhampossa T, et
al. Etiology and epidemiology of viral pneumonia among hospitalized children in rural
Mozambique: a malaria endemic area with high prevalence of human immunodeficiency
virus. Pediatr Infect Dis J 2011;30(1):39-44.
568. Khamis FA, Al-Kobaisi MF, Al-Areimi WS, Al-Kindi H, Al-Zakwani I. Epidemiology of
respiratory virus infections among infants and young children admitted to hospital in
Oman. J Med Virol 2012;84(8):1323-9.
569. Wolf DG, Greenberg D, Kalkstein D, Shemer-Avni Y, Givon-Lavi N, Saleh N, et al.
Comparison of human metapneumovirus, respiratory syncytial virus and influenza A virus
lower respiratory tract infections in hospitalized young children. Pediatr Infect Dis J
2006;25(4):320-4.
570. Foulongne V, Guyon G, Rodiere M, Segondy M. Human metapneumovirus infection in
young children hospitalized with respiratory tract disease. Pediatr Infect Dis J
2006;25(4):354-9.
571. Kristoffersen AW, Nordbo SA, Rognlien AG, Christensen A, Dollner H. Coronavirus
causes lower respiratory tract infections less frequently than RSV in hospitalized
Norwegian children. Pediatr Infect Dis J 2011;30(4):279-83.
572. Martin AJ, Gardner PS, McQuillin J. Epidemiology of respiratory viral infection among
paediatric inpatients over a six-year period in north-east England. Lancet
1978;2(8098):1035-8.
573. Malekshahi SS, Azad TM, Yavarian J, Shahmahmoodi S, Naseri M, Rezaei F. Molecular
detection of respiratory viruses in clinical specimens from children with acute respiratory
disease in Iran. Pediatr Infect Dis J 2010;29(10):931-3.
574. Naghipour M, Cuevas LE, Bakhshinejad T, Dove W, Hart CA. Human bocavirus in Iranian
children with acute respiratory infections. J Med Virol 2007;79(5):539-43.
575. De VN, Vankeerberghen A, Vaeyens F, Van VK, Boel A, De BH. Simultaneous detection
of human bocavirus and adenovirus by multiplex real-time PCR in a Belgian paediatric
population. Eur J Clin Microbiol Infect Dis 2009;28(11):1305-10.
576. Laguna-Torres VA, Sanchez-Largaespada JF, Lorenzana I, Forshey B, Aguilar P, Jimenez
M, et al. Influenza and other respiratory viruses in three Central American countries.
Influenza Other Respi Viruses 2011;5(2):123-34.
577. Nisii C, Meschi S, Selleri M, Bordi L, Castilletti C, Valli MB, et al. Frequency of
Detection of Upper Respiratory Tract Viruses in Patients Tested for Pandemic H1N1/09
Viral Infection. Journal of Clinical Microbiology 2010;48(9):3383-5.
578. Renois F, Talmud D, Huguenin A, Moutte L, Strady C, Cousson J, et al. Rapid detection of
respiratory tract viral infections and coinfections in patients with influenza-like illnesses by
use of reverse transcription-PCR DNA microarray systems. J Clin Microbiol
2010;48(11):3836-42.
319
579. Tanner H, Boxall E, Osman H. Respiratory viral infections during the 2009-2010 winter
season in Central England, UK: incidence and patterns of multiple virus co-infections. Eur
J Clin Microbiol Infect Dis 2012;31(11):3001-6.
580. Wallace LA, Collins TC, Douglas JD, McIntyre S, Millar J, Carman WF. Virological
surveillance of influenza-like illness in the community using PCR and serology. J Clin
Virol 2004;31(1):40-5.
581. Pretorius MA, Madhi SA, Cohen C, Naidoo D, Groome M, Moyes J, et al. Respiratory
viral coinfections identified by a 10-plex real-time reverse-transcription polymerase chain
reaction assay in patients hospitalized with severe acute respiratory illness--South Africa,
2009-2010. J Infect Dis 2012;206 Suppl 1:S159-65. doi: 10.1093/infdis/jis538.:S159-S165.
582. Druce J, Tran T, Kelly H, Kaye M, Chibo D, Kostecki R, et al. Laboratory diagnosis and
surveillance of human respiratory viruses by PCR in Victoria, Australia, 2002-2003. J Med
Virol 2005;75(1):122-9.
583. O'Callaghan-Gordo C, Diez-Padrisa N, Abacassamo F, Perez-Brena P, Casas I, Alonso PL,
et al. Viral acute respiratory infections among infants visited in a rural hospital of southern
Mozambique. Trop Med Int Health 2011;16(9):1054-60.
584. Marcos MA, Ramon S, Anton A, Martinez E, Vilella A, Olive V, et al. Clinical relevance
of mixed respiratory viral infections in adults with influenza A H1N1. Eur Respir J
2011;38(3):739-42.
585. Henrickson KJ. Advances in the laboratory diagnosis of viral respiratory disease.
Paediatric Infectious Disease Journal 2004;23(1:Suppl):Suppl-10.
586. Goka EA, Valelly PJ, Mutton KJ, Klapper PE. Single and multiple respiratory virus
infections and severity of respiratory disease: A systematic review. Paediatric Respiratory
Reviews 2013;Epub ahead of print: doi.org/10.1016/j.prrv.2013.11.001.
587. Pyrc K, Berkhout B, van der Hoek L. Identification of new human coronaviruses. Expert
Rev Anti Infect Ther 2007;5(2):245-53.
588. Jin Y, Zhang RF, Xie ZP, Yan KL, Gao HC, Song JR, et al. Newly identified respiratory
viruses associated with acute lower respiratory tract infections in children in Lanzou,
China, from 2006 to 2009. Clin Microbiol Infect 2012;18(1):74-80.
589. Graham NM. The epidemiology of acute respiratory infections in children and adults: a
global perspective. Epidemiol Rev 1990;12:149-78.
590. Luksic I, Kearns PK, Scott F, Rudan I, Campbell H, Nair H. Viral etiology of hospitalized
acute lower respiratory infections in children under 5 years of age -- a systematic review
and meta-analysis. Croat Med J 2013;54(2):122-34.
591. Tran D. Respiratory viral coinfection and clinical disease severity. J Pediatr (Rio J )
2013;89(5):421-3.
592. Ochoa SC, Gonzalez de DJ. [Consensus conference on acute bronchiolitis (VI): prognosis
of acute bronchiolitis. Review of scientific evidence]. An Pediatr (Barc) 2010;72(5):354.
593. Huguenin A, Moutte L, Renois F, Leveque N, Talmud D, Abely M, et al. Broad respiratory
virus detection in infants hospitalized for bronchiolitis by use of a multiplex RT-PCR DNA
microarray system. J Med Virol 2012;84(6):979-85.
320
594. Camargo C, Guatura SB, Bellei N. Respiratory viral coinfection among hospitalized
patients with H1N1 2009 during the first pandemic wave in Brazil. Braz J Infect Dis
2012;16(2):180-3.
595. Venter M, Lassauniere R, Kresfelder TL, Westerberg Y, Visser A. Contribution of
common and recently described respiratory viruses to annual hospitalizations in children in
South Africa. J Med Virol 2011;83(8):1458-68.
596. Sung CC, Chi H, Chiu NC, Huang DT, Weng LC, Wang NY, et al. Viral etiology of acute
lower respiratory tract infections in hospitalized young children in Northern Taiwan. J
Microbiol Immunol Infect 2011;44(3):184-90.
597. Speers DJ, Moss DM, Minney-Smith C, Levy A, Smith DW. Influenza and respiratory
syncytial virus are the major respiratory viruses detected from prospective testing of
paediatric and adult coronial autopsies. Influenza Other Respir Viruses 2013;7(6):1113-21.
598. Dhanoa A, Fang NC, Hassan SS, Kaniappan P, Rajasekaram G. Epidemiology and clinical
characteristics of hospitalized patients with pandemic influenza A (H1N1) 2009 infections:
the effects of bacterial coinfection. Virol J 2011;8:501. doi: 10.1186/1743-422X-8-
501.:501-8.
599. McCullers JA. Do specific virus-bacteria pairings drive clinical outcomes of pneumonia?
Clin Microbiol Infect 2013;19(2):113-8.
600. Viasus D, Oteo Revuelta JA, Martinez-Montauti J, Carratala J. Influenza A(H1N1)pdm09-
related pneumonia and other complications. Enferm Infecc Microbiol Clin 2012;30 Suppl
4:43-8. doi: 10.1016/S0213-005X(12)70104-0.):-0.
601. Nicholson KG. Impact of influenza and respiratory syncytial virus on mortality in England
and Wales from January 1975 to December 1990. Epidemiol Infect 1996;116(1):51-63.
602. Schnepf N, Resche-Rigon M, Chaillon A, Scemla A, Gras G, Semoun O, et al. High
burden of non-influenza viruses in influenza-like illness in the early weeks of H1N1v
epidemic in France. PLoS ONE 2011;6(8):e23514.
603. Zuccotti G, Dilillo D, Zappa A, Galli E, Amendola A, Martinelli M, et al. Epidemiological
and clinical features of respiratory viral infections in hospitalized children during the
circulation of influenza virus A(H1N1) 2009. Influenza Other Respi Viruses
2011;5(6):e528-e534.
604. Banerji A, Greenberg D, White LF, Macdonald WA, Saxton A, Thomas E, et al. Risk
factors and viruses associated with hospitalization due to lower respiratory tract infections
in Canadian Inuit children : a case-control study. Pediatr Infect Dis J 2009;28(8):697-701.
605. Watanabe AS, Carraro E, Moreira L, Camargo C, Sinohara J, Puerari D, et al. Respiratory
virus infections among hospitalized patients with suspected influenza A H1N1 2009 virus
during the first pandemic wave in Brazil. Braz J Infect Dis 2011;15(3):220-4.
606. Bueving HJ, van der Wouden JC, Berger MY, Thomas S. Incidence of influenza and
associated illness in children aged 0-19 years: a systematic review. Rev Med Virol
2005;15(6):383-91.
607. Ellis J, Galiano M, Pebody R, Lackenby A, Thompson C, Bermingham A, et al.
Virological analysis of fatal influenza cases in the United Kingdom during the early wave
of influenza in winter 2010/11. Euro Surveill 2011;16(1). pii: 19760.
321
608. Huang JJ, Huang TY, Huang MY, Chen BH, Lin KH, Jeng JE, et al. Simultaneous
Multiple Viral Infections in Childhood Acute Lower Respiratory Tract Infections in
Southern Taiwan. J Trop Pediatr 1998;44(5):308-11.
609. Subbarao EK, Griffis J, Waner JL. Detection of multiple viral agents in nasopharyngeal
specimens yielding respiratory syncytial virus (RSV). An assessment of diagnostic strategy
and clinical significance. Diagnostic Microbiology & Infectious Disease 1989;12(4):327-
32.
610. World Health Organisation (WHO) 2009. Global Alert and Response (GAR): Clinical
features of severe cases of pandemic influenza (Pandemic (H1N1) 2009 briefing note 13).
Available at:
http://www.who.int/csr/disease/swineflu/notes/h1n1_clinical_features_20091016/en/index.
html. Accessed on 15 September 2011.
611. Lieberman DE, McCarthy RC, Hiiemae KM, Palmer JB. Ontogeny of postnatal hyoid and
larynx descent in humans. Arch Oral Biol 2001;46(2):117-28.
612. Peng D, Zhao D, Liu J, Wang X, Yang K, Xicheng H, et al. Multipathogen infections in
hospitalized children with acute respiratory infections. Virology Journal 2009;6:155.
613. Aebi T, Weisser M, Bucher E, Hirsch HH, Marsch S, Siegemund M. Co-infection of
Influenza B and Streptococci causing severe pneumonia and septic shock in healthy
women. BMC Infectious Diseases 2010;10:308.
614. Cheuk DK, Tang IW, Chan KH, Woo PC, Peiris MJ, Chiu SS. Rhinovirus infection in
hospitalized children in Hong Kong: a prospective study. Pediatr Infect Dis J
2007;26(11):995-1000.
615. Miller EK, Khuri-Bulos N, Williams JV, Shehabi AA, Faouri S, Al J, I, et al. Human
rhinovirus C associated with wheezing in hospitalised children in the Middle East. J Clin
Virol 2009;46(1):85-9.
616. DaPalma T, Doonan BP, Trager NM, Kasman LM. A systematic approach to virus-virus
interactions. Virus Res 2010;149(1):1-9.
617. Gencay M, Roth M, Christ-Crain M, Mueller B, Tamm M, Stolz D. Single and multiple
viral infections in lower respiratory tract infection. Respiration 2010;80(6):560-7.
618. Venter M, Visser A, Lassauniere R. Human polyomaviruses, WU and KI in HIV exposed
children with acute lower respiratory tract infections in hospitals in South Africa. J Clin
Virol 2009;44(3):230-4.
619. Al-Turab M, Chehadeh W, Al-Mulla F, Al-Nakib W. Human metapneumovirus in patients
with respiratory tract infection in Kuwait. J Med Virol 2011;83(10):1811-7.
620. Malato L, Llavador V, Marmier E, Youssef J, Balick WC, Roze H, et al. Pandemic
influenza A(H1N1) 2009: molecular characterisation and duration of viral shedding in
intensive care patients in Bordeaux, south-west France, May 2009 to January 2010. Euro
Surveill 2011;16(4). pii: 19776.
621. Peiris JS, Lai ST, Poon LL, Guan Y, Yam LY, Lim W, et al. Coronavirus as a possible
cause of severe acute respiratory syndrome. Lancet 2003;361(9366):1319-25.
322
622. Guan Y, Peiris JS, Zheng B, Poon LL, Chan KH, Zeng FY, et al. Molecular epidemiology
of the novel coronavirus that causes severe acute respiratory syndrome. Lancet
2004;363(9403):99-104.
623. World Health Organisation (WHO) 2013. Middle East respiratory syndrome coronavirus
(MERS-CoV) summary and literature update – as of 20 September 2013. WHO global
alert and response. 20-9-2013. Available at:
http://www.who.int/csr/disease/coronavirus_infections/update_20130920/en/index.html.
Accessed on 8 Oct 2013.
624. Health Protection Agency (HPA) 2012. Acute respiratory illness associated with a new
virus identified in the UK. London (Press release). Available at:
http://www.hpa.org.uk/NewsCentre/NationalPressReleases/2012PressReleases/120923acut
erespiratoryillnessidentified/ . Accessed on 27 Sep 2012.
625. Promed Email September 20 2012. Novel coronavirus - Saudi Arabia: human isolate
Archive Number. Archive Number: 20120920.1302733. Accessed on 13 August 2013.
626. Zaki AM, van BS, Bestebroer TM, Osterhaus AD, Fouchier RA. Isolation of a novel
coronavirus from a man with pneumonia in Saudi Arabia. N Engl J Med
2012;367(19):1814-20.
627. Bermingham A, Chand MA, Brown CS, Aarons E, Tong C, Langrish C, et al. Severe
respiratory illness caused by a novel coronavirus, in a patient transferred to the United
Kingdom from the Middle East, September 2012. Euro Surveill 2012;17(40):20290.
628. Escutenaire S, Mohamed N, Isaksson M, Thoren P, Klingeborn B, Belak S, et al. SYBR
Green real-time reverse transcription-polymerase chain reaction assay for the generic
detection of coronaviruses. Arch Virol 2007;152(1):41-58.
629. Vijgen L, Moes E, Keyaerts E, Li S, Van RM. A pancoronavirus RT-PCR assay for
detection of all known coronaviruses. Methods Mol Biol 2008;454:3-12. doi: 10.1007/978-
1-59745-181-9_1.:3-12.
630. Adachi D, Johnson G, Draker R, Ayers M, Mazzulli T, Talbot PJ, et al. Comprehensive
detection and identification of human coronaviruses, including the SARS-associated
coronavirus, with a single RT-PCR assay. J Virol Methods 2004;122(1):29-36.
631. Neske F, Blessing K, Tollmann F, Schubert J, Rethwilm A, Kreth HW, et al. Real-time
PCR for diagnosis of human bocavirus infections and phylogenetic analysis. J Clin
Microbiol 2007;45(7):2116-22.
632. Lu X, Chittaganpitch M, Olsen SJ, Mackay IM, Sloots TP, Fry AM, et al. Real-time PCR
assays for detection of bocavirus in human specimens. J Clin Microbiol 2006;44(9):3231-
5.
633. World Health Organisation (WHO) 2010. H1N1 in post-pandemic period. Available at:
http://www.who.int/mediacentre/news/statements/2010/h1n1_vpc_20100810/en/ .
Accessed on 9 November 2011.
634. Plotkin JB, Dushoff J, Levin SA. Hemagglutinin sequence clusters and the antigenic
evolution of influenza A virus. Proc Natl Acad Sci U S A 2002;99(9):6263-8.
323
635. Fitch WM, Bush RM, Bender CA, Subbarao K, Cox NJ. The Wilhelmine E. Key 1999
Invitational lecture. Predicting the evolution of human influenza A. J Hered
2000;91(3):183-5.
636. Levin ML. The occurrence of lung cancer in man. Acta Unio Int Contra Cancrum
1953;9(3):531-41.
637. Rowe AK, Powell KE, Flanders WD. Why population attributable fractions can sum to
more than one. Am J Prev Med 2004;26(3):243-9.
638. Belser JA, Bridges CB, Katz JM, Tumpey TM. Past, present, and possible future human
infection with influenza virus A subtype H7. Emerg Infect Dis 2009;15(6):859-65.
639. Garcia-Sastre A, Palese P. Genetic manipulation of negative-strand RNA virus genomes.
Annu Rev Microbiol 1993;47:765-90.:765-90.
640. Mahalingam S, Meanger J, Foster PS, Lidbury BA. The viral manipulation of the host
cellular and immune environments to enhance propagation and survival: a focus on RNA
viruses. J Leukoc Biol 2002;72(3):429-39.
641. Monto AS. The seasonality of rhinovirus infections and its implications for clinical
recognition. Clin Ther 2002;24(12):1987-97.
642. Asthma UK 2014. Facts about Asthma in the UK. Available at:
http://www.asthma.org.uk/asthma-facts-and-statistics. Accessed on 18 April 2014.
643. Simpson CR, Sheikh A. Trends in the epidemiology of asthma in England: a national study
of 333,294 patients. J R Soc Med 2010;103(3):98-106.
644. Cancer Research UK 2014. Lung cancer incidence statistics. Available at:
http://www.cancerresearchuk.org/cancer-info/cancerstats/types/lung/incidence/uk-lung-
cancer-incidence-statistics . Accessed on 18 April 2014.
645. Health and Safety Executive 2014. Chronic Obstructive Pulmonary Disease (COPD).
http://www.hse.gov.uk/STATISTICS/causdis/copd/copd.pdf. Available at Accessed on 18
April 2014.
646. Public Health England (PHE) 2014. Trends in obesity prevalence (UK). Available at:
http://www.noo.org.uk/NOO_about_obesity/trends . Accessed on 18 April 2014.
647. Public Health England (PHE) 2014. Percentage of children obese and overweight
(including obese) in the UK and Ireland. Available at:
http://www.noo.org.uk/NOO_about_obesity/child_obesity/UK_prevalence . Accessed on
18 April 2014.
648. Diabetes UK 2013. Diabetes prevalence 2012 (March 2013). Available at:
https://www.diabetes.org.uk/About_us/What-we-say/Statistics/Diabetes-prevalence-2012/.
Accessed on 18 April 2014.
649. The British Heart Foundation 2010. Coronary Heart Disease Statistics 2010. Available at:
https://www.bhf.org.uk/idoc.ashx?docid=9ef69170-3edf-4fbb-a202.Accessed on 18 April
2014.
650. National Health Service (NHS) 2010. Kidney Disease: Key Facts and Figures. Available
at: www.healthcheck.nhs.uk/document.php?o=81?. Accessed on 18 April 2014.
324
651. Ratib S, West J, Crooks CJ, Fleming KM. Diagnosis of liver cirrhosis in England, a cohort
study, 1998-2009: a comparison with cancer. Am J Gastroenterol 2014;109(2):190-8.
652. MacDonald BK, Cockerell OC, Sander JW, Shorvon SD. The incidence and lifetime
prevalence of neurological disorders in a prospective community-based study in the UK.
Brain 2000;123(Pt 4):665-76.
653. National AIDS Trust UK 2014. People living with HIV in the UK. Available at:
http://www.nat.org.uk/HIV-Facts/Statistics/Latest-UK-statistics/People-with-HIV-in-
UK.aspx . Accessed on 18 April 2014.
654. Cancer Research UK 2013. Leukaemia incidence statistics . Available at:
http://www.cancerresearchuk.org/cancer-info/cancerstats/types/leukaemia/incidence/uk-
leukaemia-incidence-statistics . Accessed on 18 April 2014.
655. Public Health England (PHE) 2013. Influenza vaccination uptake monitoring on behalf of
the Department of Health. Public Health England (HPE)
http://www.hpa.org.uk/web/HPAweb&HPAwebStandard/HPAweb_C/1195733756886.
Accessed on 18 April 2014.
656. Poverty.org UK 2014. Low birthweight babies. 2014. Available at:
http://www.poverty.org.uk/20/index.shtml?2 . Accessed on 18 April 2014.
657. Rothman KJ, Greenland S, Lash T. Types of epidemiologic studies. In: Rothman KJ, Lash
TL, Greenland S, editors. Modern epidemiology. 3 ed. Philadelphia: Lippincott, Williams,
& Wilkins; 2012.
658. Weigl JA, Puppe W, Meyer CU, Berner R, Forster J, Schmitt HJ, et al. Ten years'
experience with year-round active surveillance of up to 19 respiratory pathogens in
children. Eur J Pediatr 2007;166(9):957-66.
659. Ruutu P, Halonen P, Meurman O, Torres C, Paladin F, Yamaoka K, et al. Viral lower
respiratory tract infections in Filipino children. J Infect Dis 1990;161(2):175-9.
660. Brandt CD, Kim HW, Rodriguez WJ, Arrobio JO, Jeffries BC, Parrott RH. Simultaneous
infections with different enteric and respiratory tract viruses. J Clin Microbiol
1986;23(1):177-9.
661. Wake Z, Conway N, Williams S, Keil A, Smith D, Richmond P, et al. Acute viral
respiratory tract infections in preschool children, the importance of viral co-infections.
Paediatric and Child Health 2011;47(Suppl2):2-17.
662. Lin TY, Huang YC, Ning HC, Tsao KC. Surveillance of respiratory viral infections among
paediatric outpatients in northern Taiwan. J Clin Virol 2004;30(1):81-5.
663. Yu X, Lu R, Wang Z, Zhu N, Wang W, Julian D, et al. Etiology and clinical
characterization of respiratory virus infections in adult patients attending an emergency
department in Beijing. PLoS One 2012;7(2):e32174.
664. Alonso WJ, Laranjeira BJ, Pereira SA, Florencio CM, Moreno EC, Miller MA, et al.
Comparative dynamics, morbidity and mortality burden of paediatric viral respiratory
infections in an equatorial city. Pediatr Infect Dis J 2012;31(1):e9-14.
325
665. Sasaki A, Suzuki H, Saito R, Sato M, Sato I, Sano Y, et al. Prevalence of human
metapneumovirus and influenza virus infections among Japanese children during two
successive winters. Pediatr Infect Dis J 2005;24(10):905-8.
666. Kouni S, Karakitsos P, Chranioti A, Theodoridou M, Chrousos G, Michos A. Evaluation of
viral co-infections in hospitalized and non-hospitalized children with respiratory infections
using microarrays. Clin Microbiol Infect 2013;19(8):772-7.
667. Thiberville SD, Ninove L, Vu H, V, Botelho-Nevers E, Gazin C, Thirion L, et al. The viral
etiology of an influenza-like illness during the 2009 pandemic. J Med Virol
2012;84(7):1071-9.
668. Tsuchiya LR, Costa LM, Raboni SM, Nogueira MB, Pereira LA, Rotta I, et al. Viral
respiratory infection in Curitiba, Southern Brazil. J Infect 2005;51(5):401-7.
669. Lina B, Valette M, Foray S, Luciani J, Stagnara J, See DM, et al. Surveillance of
community-acquired viral infections due to respiratory viruses in Rhone-Alpes (France)
during winter 1994 to 1995. J Clin Microbiol 1996;34(12):3007-11.
670. Raboni SM, Stella V, Cruz CR, Franca JB, Moreira S, Goncalves L, et al. Laboratory
diagnosis, epidemiology, and clinical outcomes of pandemic influenza A and community
respiratory viral infections in southern Brazil. J Clin Microbiol 2011;49(4):1287-93.
671. Forgie IM, O'Neill KP, Lloyd-Evans N, Leinonen M, Campbell H, Whittle HC, et al.
Etiology of acute lower respiratory tract infections in Gambian children: I. Acute lower
respiratory tract infections in infants presenting at the hospital. Pediatr Infect Dis J
1991;10(1):33-41.
672. Christensen A, Nordbo SA, Krokstad S, Rognlien AG, Dollner H. Human bocavirus
commonly involved in multiple viral airway infections. J Clin Virol 2008;41(1):34-7.
673. Tan BH, Lim EA, Seah SG, Loo LH, Tee NW, Lin RT, et al. The incidence of human
bocavirus infection among children admitted to hospital in Singapore. J Med Virol
2009;81(1):82-9.
674. Park JS. Viral etiology and Epidemiology of Acute Lower Respiratory Tract Infections in
Hospitalized Children (Choongchung Province in May 2001 through April 2004) . Pediatr
Allergy Respir Dis 2004;14(4):366-76.
675. Suwanjutha S, Chantarojanasiri T, Watthana-kasetr S, Sirinavin S, Ruangkanchanasetr S,
Hotrakitya S, et al. A study of nonbacterial agents of acute lower respiratory tract infection
in Thai children. Rev Infect Dis 1990;12 Suppl 8:S923-8.:S923-S928.
676. Jain A, Pande A, Misra PK, Mathur A, Chaturvedi UC. An Indian hospital study of viral
causes of acute respiratory infection in children. J Med Microbiol 1991;35(4):219-23.
677. Kwofie TB, Anane YA, Nkrumah B, Annan A, Nguah SB, Owusu M. Respiratory viruses
in children hospitalized for acute lower respiratory tract infection in Ghana. Virol J
2012;9:78. doi: 10.1186/1743-422X-9-78.:78-9.
678. Zhang G, Hu Y, Wang H, Zhang L, Bao Y, Zhou X. High incidence of multiple viral
infections identified in upper respiratory tract infected children under three years of age in
Shanghai, China. PLoS One 2012;7(9):e44568.
326
679. Suryadevara M, Cummings E, Bonville CA, Bartholoma N, Riddell S, Kiska D, et al. Viral
etiology of acute febrile respiratory illnesses in hospitalized children younger than 24
months. Clin Pediatr (Phila) 2011;50(6):513-7.
680. Canducci F, Debiaggi M, Sampaolo M, Marinozzi MC, Berre S, Terulla C, et al. Two-year
prospective study of single infections and co-infections by respiratory syncytial virus and
viruses identified recently in infants with acute respiratory disease. J Med Virol
2008;80(4):716-23.
681. Mansbach JM, McAdam AJ, Clark S, Hain PD, Flood RG, Acholonu U, et al. Prospective
multicenter study of the viral etiology of bronchiolitis in the emergency department. Acad
Emerg Med 2008;15(2):111-8.
682. Chung JY, Han TH, Kim SW, Kim CK, Hwang ES. Detection of viruses identified
recently in children with acute wheezing. J Med Virol 2007;79(8):1238-43.
683. Midulla F, Scagnolari C, Bonci E, Pierangeli A, Antonelli G, De AD, et al. Respiratory
syncytial virus, human bocavirus and rhinovirus bronchiolitis in infants. Arch Dis Child
2010;95(1):35-41.
684. Marguet C, Lubrano M, Gueudin M, Le RP, Deschildre A, Forget C, et al. In very young
infants severity of acute bronchiolitis depends on carried viruses. PLoS One
2009;4(2):e4596.
685. Pierangeli A, Gentile M, Di MP, Pagnotti P, Scagnolari C, Trombetti S, et al. Detection
and typing by molecular techniques of respiratory viruses in children hospitalized for acute
respiratory infection in Rome, Italy. J Med Virol 2007;79(4):463-8.
686. Miller EK, Lu X, Erdman DD, Poehling KA, Zhu Y, Griffin MR, et al. Rhinovirus-
associated hospitalizations in young children. J Infect Dis 2007;195(6):773-81.
687. Garcia-Garcia ML, Calvo C, Pozo F, Villadangos PA, Perez-Brena P, Casas I. Spectrum of
respiratory viruses in children with community-acquired pneumonia. Pediatr Infect Dis J
2012;31(8):808-13.
688. Weigl JA, Puppe W, Grondahl B, Schmitt HJ. Epidemiological investigation of nine
respiratory pathogens in hospitalized children in Germany using multiplex reverse-
transcriptase polymerase chain reaction. Eur J Clin Microbiol Infect Dis 2000;19(5):336-
43.
689. Kim MR, Lee HR, Lee GM. Epidemiology of acute viral respiratory tract infections in
Korean children. J Infect 2000;41(2):152-8.
690. Yun BY, Kim MR, Park JY, Choi EH, Lee HJ, Yun CK. Viral etiology and epidemiology
of acute lower respiratory tract infections in Korean children. Pediatr Infect Dis J
1995;14(12):1054-9.
691. Stempel HE, Martin ET, Kuypers J, Englund JA, Zerr DM. Multiple viral respiratory
pathogens in children with bronchiolitis. Acta Paediatr 2009;98(1):123-6.
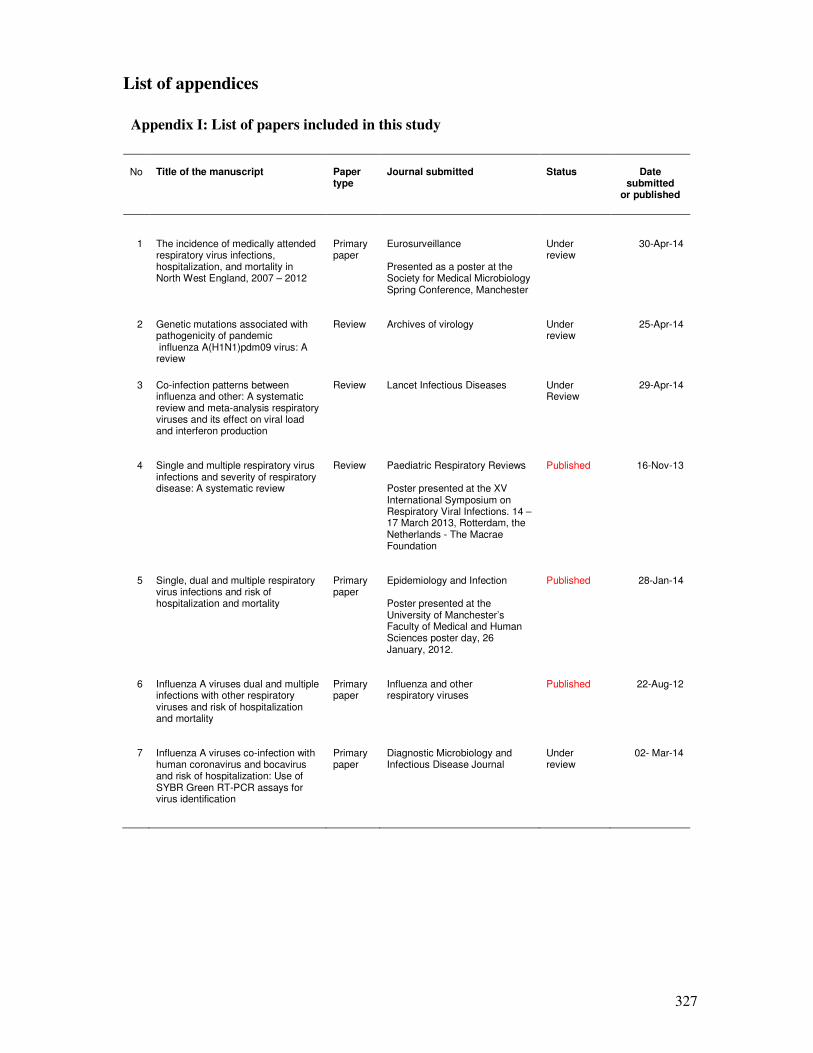
327
List of appendices
Appendix I: List of papers included in this study
No
Title of the manuscript
Paper type
Journal submitted
Status
Date
submitted or published
1 The incidence of medically attended respiratory virus infections, hospitalization, and mortality in North West England, 2007 – 2012
Primary paper
Eurosurveillance Presented as a poster at the Society for Medical Microbiology Spring Conference, Manchester
Under review
30-Apr-14
2 Genetic mutations associated with pathogenicity of pandemic influenza A(H1N1)pdm09 virus: A review
Review Archives of virology Under review
25-Apr-14
3 Co-infection patterns between influenza and other: A systematic review and meta-analysis respiratory viruses and its effect on viral load and interferon production
Review Lancet Infectious Diseases Under Review
29-Apr-14
4 Single and multiple respiratory virus infections and severity of respiratory disease: A systematic review
Review Paediatric Respiratory Reviews Poster presented at the XV International Symposium on Respiratory Viral Infections. 14 – 17 March 2013, Rotterdam, the Netherlands - The Macrae Foundation
Published 16-Nov-13
5 Single, dual and multiple respiratory virus infections and risk of hospitalization and mortality
Primary paper
Epidemiology and Infection Poster presented at the University of Manchester’s Faculty of Medical and Human Sciences poster day, 26 January, 2012.
Published 28-Jan-14
6 Influenza A viruses dual and multiple infections with other respiratory viruses and risk of hospitalization and mortality
Primary paper
Influenza and other respiratory viruses
Published 22-Aug-12
7 Influenza A viruses co-infection with human coronavirus and bocavirus and risk of hospitalization: Use of SYBR Green RT-PCR assays for virus identification
Primary paper
Diagnostic Microbiology and Infectious Disease Journal
Under review
02- Mar-14
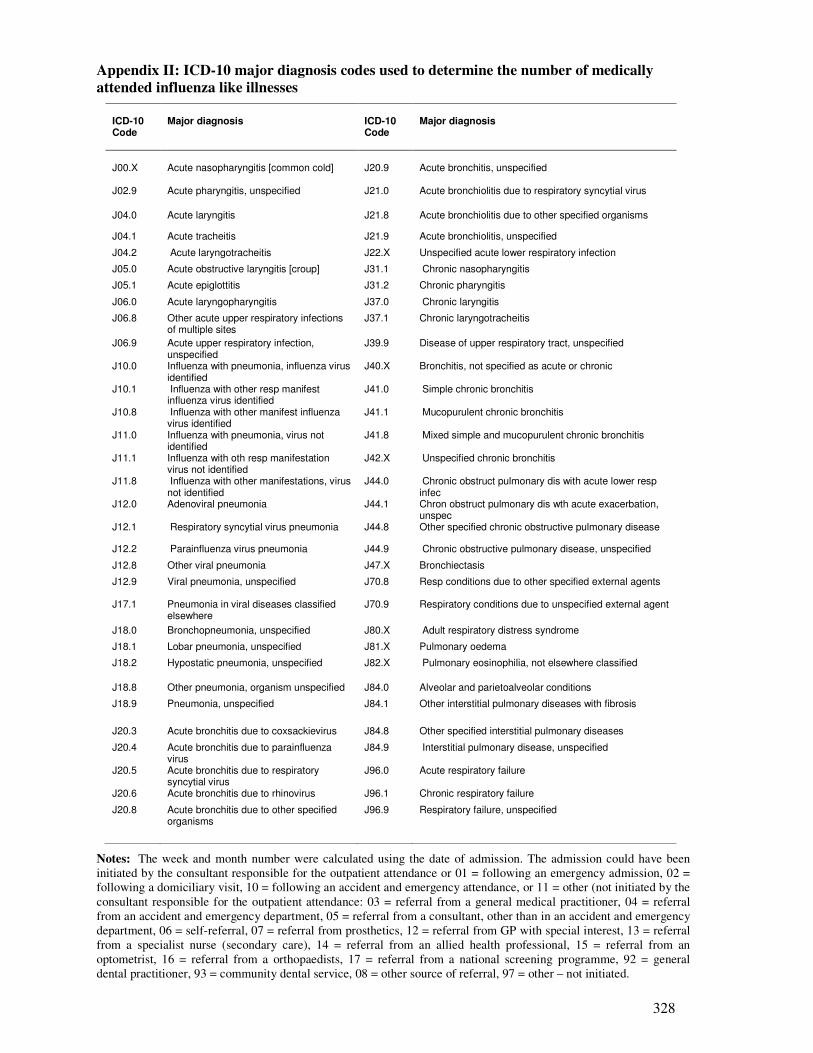
328
Appendix II: ICD-10 major diagnosis codes used to determine the number of medically
attended influenza like illnesses
ICD-10 Code
Major diagnosis
ICD-10 Code
Major diagnosis
J00.X
Acute nasopharyngitis [common cold]
J20.9
Acute bronchitis, unspecified
J02.9 Acute pharyngitis, unspecified J21.0 Acute bronchiolitis due to respiratory syncytial virus
J04.0 Acute laryngitis J21.8 Acute bronchiolitis due to other specified organisms
J04.1 Acute tracheitis J21.9 Acute bronchiolitis, unspecified
J04.2 Acute laryngotracheitis J22.X Unspecified acute lower respiratory infection
J05.0 Acute obstructive laryngitis [croup] J31.1 Chronic nasopharyngitis
J05.1 Acute epiglottitis J31.2 Chronic pharyngitis
J06.0 Acute laryngopharyngitis J37.0 Chronic laryngitis
J06.8 Other acute upper respiratory infections of multiple sites
J37.1 Chronic laryngotracheitis
J06.9 Acute upper respiratory infection, unspecified
J39.9 Disease of upper respiratory tract, unspecified
J10.0 Influenza with pneumonia, influenza virus identified
J40.X Bronchitis, not specified as acute or chronic
J10.1 Influenza with other resp manifest influenza virus identified
J41.0 Simple chronic bronchitis
J10.8 Influenza with other manifest influenza virus identified
J41.1 Mucopurulent chronic bronchitis
J11.0 Influenza with pneumonia, virus not identified
J41.8 Mixed simple and mucopurulent chronic bronchitis
J11.1 Influenza with oth resp manifestation virus not identified
J42.X Unspecified chronic bronchitis
J11.8 Influenza with other manifestations, virus not identified
J44.0 Chronic obstruct pulmonary dis with acute lower resp infec
J12.0 Adenoviral pneumonia J44.1 Chron obstruct pulmonary dis wth acute exacerbation, unspec
J12.1 Respiratory syncytial virus pneumonia J44.8 Other specified chronic obstructive pulmonary disease
J12.2 Parainfluenza virus pneumonia J44.9 Chronic obstructive pulmonary disease, unspecified
J12.8 Other viral pneumonia J47.X Bronchiectasis
J12.9 Viral pneumonia, unspecified J70.8 Resp conditions due to other specified external agents
J17.1 Pneumonia in viral diseases classified elsewhere
J70.9 Respiratory conditions due to unspecified external agent
J18.0 Bronchopneumonia, unspecified J80.X Adult respiratory distress syndrome
J18.1 Lobar pneumonia, unspecified J81.X Pulmonary oedema
J18.2 Hypostatic pneumonia, unspecified J82.X Pulmonary eosinophilia, not elsewhere classified
J18.8 Other pneumonia, organism unspecified J84.0 Alveolar and parietoalveolar conditions
J18.9 Pneumonia, unspecified J84.1 Other interstitial pulmonary diseases with fibrosis
J20.3 Acute bronchitis due to coxsackievirus J84.8 Other specified interstitial pulmonary diseases
J20.4 Acute bronchitis due to parainfluenza virus
J84.9 Interstitial pulmonary disease, unspecified
J20.5 Acute bronchitis due to respiratory syncytial virus
J96.0 Acute respiratory failure
J20.6 Acute bronchitis due to rhinovirus J96.1 Chronic respiratory failure
J20.8 Acute bronchitis due to other specified organisms
J96.9 Respiratory failure, unspecified
Notes: The week and month number were calculated using the date of admission. The admission could have been
initiated by the consultant responsible for the outpatient attendance or 01 = following an emergency admission, 02 =
following a domiciliary visit, 10 = following an accident and emergency attendance, or 11 = other (not initiated by the
consultant responsible for the outpatient attendance: 03 = referral from a general medical practitioner, 04 = referral
from an accident and emergency department, 05 = referral from a consultant, other than in an accident and emergency
department, 06 = self-referral, 07 = referral from prosthetics, 12 = referral from GP with special interest, 13 = referral
from a specialist nurse (secondary care), 14 = referral from an allied health professional, 15 = referral from an
optometrist, 16 = referral from a orthopaedists, 17 = referral from a national screening programme, 92 = general
dental practitioner, 93 = community dental service, 08 = other source of referral, 97 = other – not initiated.
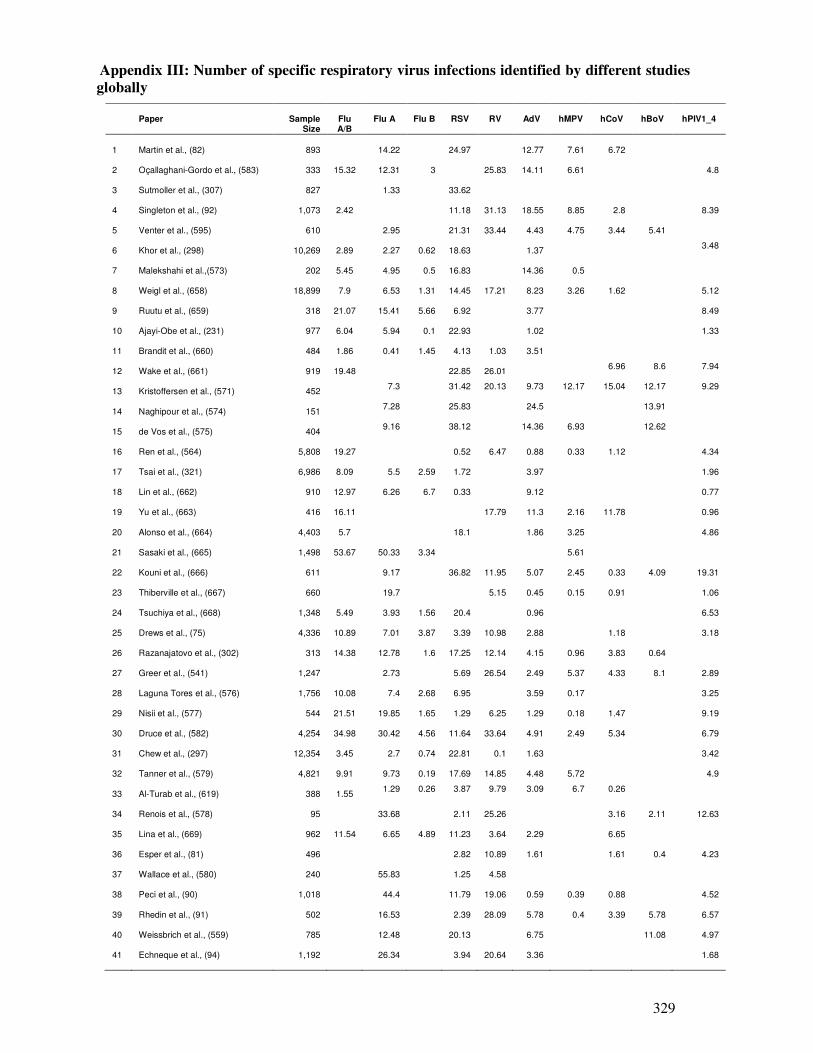
329
Appendix III: Number of specific respiratory virus infections identified by different studies
globally
Paper
Sample
Size
Flu A/B
Flu A Flu B RSV RV AdV hMPV hCoV hBoV hPIV1_4
1 Martin et al., (82) 893
14.22
24.97
12.77
7.61
6.72 2 Oçallaghani-Gordo et al., (583) 333
15.32
12.31
3
25.83
14.11
6.61
4.8
3 Sutmoller et al., (307) 827
1.33
33.62
4 Singleton et al., (92) 1,073
2.42
11.18
31.13
18.55
8.85
2.8
8.39
5 Venter et al., (595) 610
2.95
21.31
33.44
4.43
4.75
3.44
5.41
6 Khor et al., (298) 10,269
2.89
2.27
0.62
18.63
1.37
3.48
7 Malekshahi et al.,(573) 202
5.45
4.95
0.5
16.83
14.36
0.5
8 Weigl et al., (658) 18,899
7.9
6.53
1.31
14.45
17.21
8.23
3.26
1.62
5.12
9 Ruutu et al., (659) 318
21.07
15.41
5.66
6.92
3.77
8.49
10 Ajayi-Obe et al., (231) 977
6.04
5.94
0.1
22.93
1.02
1.33
11 Brandit et al., (660) 484
1.86
0.41
1.45
4.13
1.03
3.51
12 Wake et al., (661) 919
19.48
22.85
26.01
6.96 8.6 7.94
13 Kristoffersen et al., (571) 452
7.3 31.42 20.13 9.73 12.17 15.04 12.17 9.29
14 Naghipour et al., (574) 151
7.28 25.83 24.5 13.91
15 de Vos et al., (575) 404
9.16 38.12 14.36 6.93 12.62
16 Ren et al., (564) 5,808
19.27
0.52
6.47
0.88
0.33
1.12
4.34
17 Tsai et al., (321) 6,986
8.09
5.5
2.59
1.72
3.97
1.96
18 Lin et al., (662) 910
12.97
6.26
6.7
0.33
9.12
0.77
19 Yu et al., (663) 416
16.11
17.79
11.3
2.16
11.78
0.96
20 Alonso et al., (664) 4,403
5.7
18.1
1.86
3.25
4.86
21 Sasaki et al., (665) 1,498
53.67
50.33
3.34
5.61
22 Kouni et al., (666) 611
9.17 36.82
11.95
5.07
2.45
0.33 4.09
19.31
23 Thiberville et al., (667) 660
19.7
5.15
0.45
0.15
0.91
1.06
24 Tsuchiya et al., (668) 1,348
5.49
3.93
1.56
20.4
0.96
6.53
25 Drews et al., (75) 4,336
10.89
7.01
3.87
3.39
10.98
2.88
1.18
3.18
26 Razanajatovo et al., (302) 313
14.38
12.78
1.6
17.25
12.14
4.15
0.96
3.83
0.64
27 Greer et al., (541) 1,247
2.73
5.69
26.54
2.49
5.37
4.33
8.1
2.89
28 Laguna Tores et al., (576) 1,756
10.08
7.4
2.68
6.95
3.59
0.17
3.25
29 Nisii et al., (577) 544
21.51
19.85
1.65
1.29
6.25
1.29
0.18
1.47
9.19
30 Druce et al., (582) 4,254
34.98
30.42
4.56
11.64
33.64
4.91
2.49
5.34
6.79
31 Chew et al., (297) 12,354
3.45
2.7
0.74
22.81
0.1
1.63
3.42
32 Tanner et al., (579) 4,821
9.91
9.73
0.19
17.69
14.85
4.48
5.72
4.9
33 Al-Turab et al., (619) 388
1.55
1.29 0.26 3.87 9.79 3.09 6.7 0.26
34 Renois et al., (578) 95
33.68
2.11
25.26
3.16
2.11
12.63
35 Lina et al., (669) 962
11.54
6.65
4.89
11.23
3.64
2.29
6.65
36 Esper et al., (81) 496
2.82
10.89
1.61
1.61
0.4
4.23
37 Wallace et al., (580) 240
55.83
1.25
4.58
38 Peci et al., (90) 1,018
44.4
11.79
19.06
0.59
0.39
0.88
4.52
39 Rhedin et al., (91) 502
16.53
2.39
28.09
5.78
0.4
3.39
5.78
6.57
40 Weissbrich et al., (559) 785
12.48
20.13
6.75
11.08
4.97
41 Echneque et al., (94) 1,192
26.34
3.94
20.64
3.36
1.68
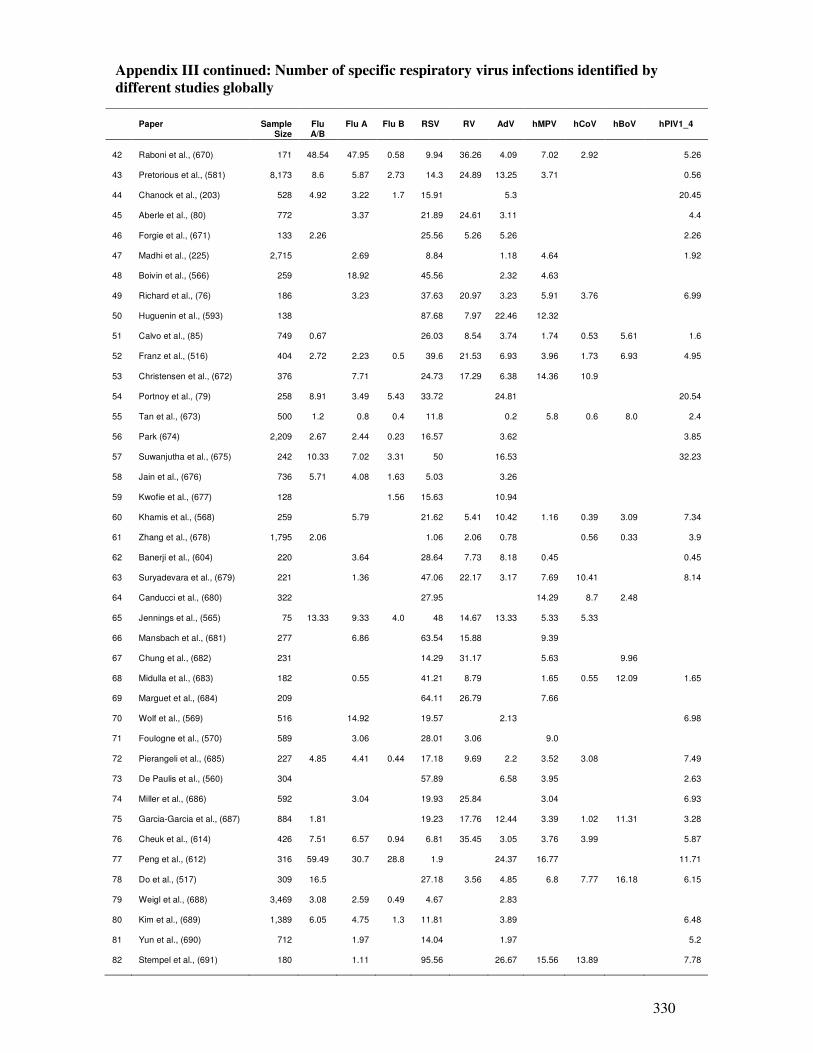
330
Appendix III continued: Number of specific respiratory virus infections identified by
different studies globally
Paper
Sample
Size
Flu A/B
Flu A Flu B RSV RV AdV hMPV hCoV hBoV hPIV1_4
42 Raboni et al., (670) 171
48.54
47.95
0.58
9.94
36.26
4.09
7.02
2.92
5.26
43 Pretorious et al., (581) 8,173
8.6
5.87
2.73
14.3
24.89
13.25
3.71
0.56
44 Chanock et al., (203) 528
4.92
3.22
1.7
15.91
5.3
20.45
45 Aberle et al., (80) 772
3.37
21.89
24.61
3.11
4.4
46 Forgie et al., (671) 133
2.26
25.56
5.26
5.26
2.26
47 Madhi et al., (225) 2,715
2.69
8.84
1.18
4.64
1.92
48 Boivin et al., (566) 259
18.92
45.56
2.32
4.63
49 Richard et al., (76) 186
3.23
37.63
20.97
3.23
5.91
3.76
6.99
50 Huguenin et al., (593) 138
87.68
7.97
22.46
12.32
51 Calvo et al., (85) 749
0.67
26.03
8.54
3.74
1.74
0.53
5.61
1.6
52 Franz et al., (516) 404
2.72
2.23
0.5
39.6
21.53
6.93
3.96
1.73
6.93
4.95
53 Christensen et al., (672) 376
7.71
24.73
17.29
6.38
14.36
10.9
54 Portnoy et al., (79) 258
8.91
3.49
5.43
33.72
24.81
20.54
55 Tan et al., (673) 500
1.2
0.8
0.4
11.8
0.2
5.8
0.6
8.0
2.4
56 Park (674) 2,209
2.67
2.44
0.23
16.57
3.62
3.85
57 Suwanjutha et al., (675) 242
10.33
7.02
3.31
50
16.53
32.23
58 Jain et al., (676) 736
5.71
4.08
1.63
5.03
3.26
59 Kwofie et al., (677) 128
1.56
15.63
10.94
60 Khamis et al., (568) 259
5.79
21.62
5.41
10.42
1.16
0.39
3.09
7.34
61 Zhang et al., (678) 1,795
2.06
1.06
2.06
0.78
0.56
0.33
3.9
62 Banerji et al., (604) 220
3.64
28.64
7.73
8.18
0.45
0.45
63 Suryadevara et al., (679) 221
1.36
47.06
22.17
3.17
7.69
10.41
8.14
64 Canducci et al., (680) 322
27.95
14.29
8.7
2.48
65 Jennings et al., (565) 75
13.33
9.33
4.0
48
14.67
13.33
5.33
5.33
66 Mansbach et al., (681) 277
6.86
63.54
15.88
9.39
67 Chung et al., (682) 231
14.29
31.17
5.63
9.96
68 Midulla et al., (683) 182
0.55
41.21
8.79
1.65
0.55
12.09
1.65
69 Marguet et al., (684) 209
64.11
26.79
7.66
70 Wolf et al., (569) 516
14.92
19.57
2.13
6.98
71 Foulogne et al., (570) 589
3.06
28.01
3.06
9.0
72 Pierangeli et al., (685) 227
4.85
4.41
0.44
17.18
9.69
2.2
3.52
3.08
7.49
73 De Paulis et al., (560) 304
57.89
6.58
3.95
2.63
74 Miller et al., (686) 592
3.04
19.93
25.84
3.04
6.93
75 Garcia-Garcia et al., (687) 884
1.81
19.23
17.76
12.44
3.39
1.02
11.31
3.28
76 Cheuk et al., (614) 426
7.51
6.57
0.94
6.81
35.45
3.05
3.76
3.99
5.87
77 Peng et al., (612) 316
59.49
30.7
28.8
1.9
24.37
16.77
11.71
78 Do et al., (517) 309
16.5
27.18
3.56
4.85
6.8
7.77
16.18
6.15
79 Weigl et al., (688) 3,469
3.08
2.59
0.49
4.67
2.83
80 Kim et al., (689) 1,389
6.05
4.75
1.3
11.81
3.89
6.48
81 Yun et al., (690) 712
1.97
14.04
1.97
5.2
82 Stempel et al., (691) 180
1.11
95.56
26.67
15.56
13.89
7.78
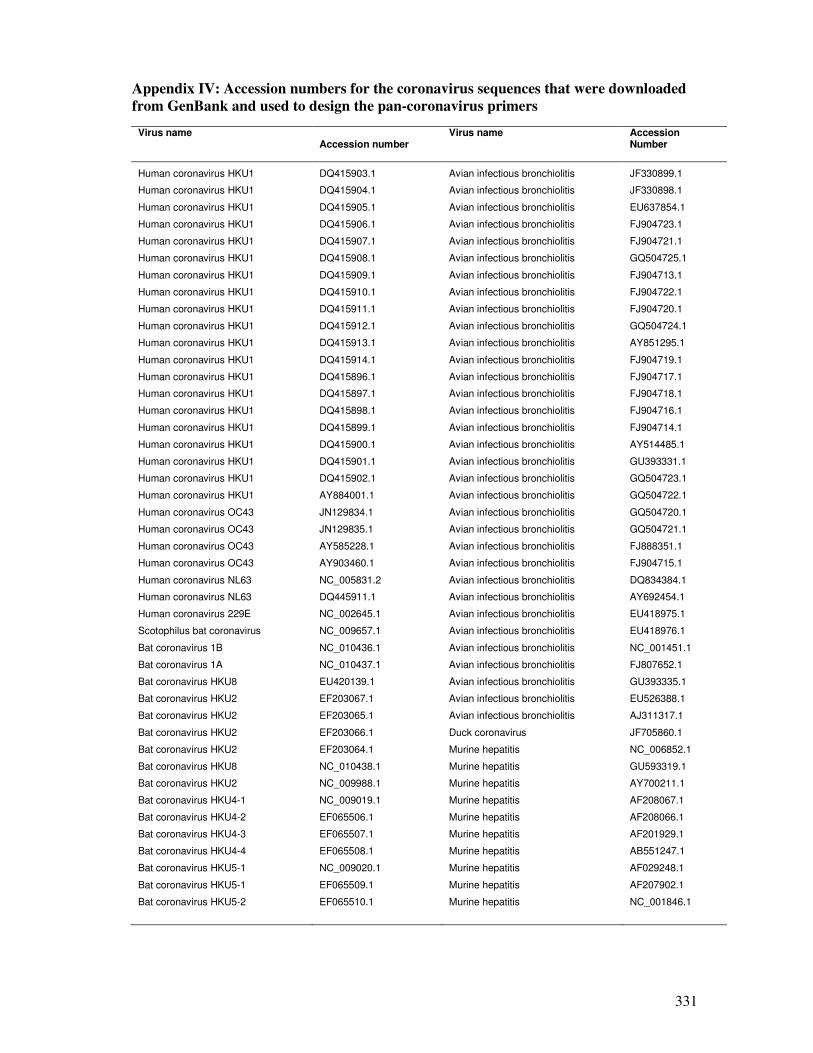
331
Appendix IV: Accession numbers for the coronavirus sequences that were downloaded
from GenBank and used to design the pan-coronavirus primers
Virus name
Accession number
Virus name
Accession Number
Human coronavirus HKU1 DQ415903.1 Avian infectious bronchiolitis JF330899.1
Human coronavirus HKU1 DQ415904.1 Avian infectious bronchiolitis JF330898.1
Human coronavirus HKU1 DQ415905.1 Avian infectious bronchiolitis EU637854.1
Human coronavirus HKU1 DQ415906.1 Avian infectious bronchiolitis FJ904723.1
Human coronavirus HKU1 DQ415907.1 Avian infectious bronchiolitis FJ904721.1
Human coronavirus HKU1 DQ415908.1 Avian infectious bronchiolitis GQ504725.1
Human coronavirus HKU1 DQ415909.1 Avian infectious bronchiolitis FJ904713.1
Human coronavirus HKU1 DQ415910.1 Avian infectious bronchiolitis FJ904722.1
Human coronavirus HKU1 DQ415911.1 Avian infectious bronchiolitis FJ904720.1
Human coronavirus HKU1 DQ415912.1 Avian infectious bronchiolitis GQ504724.1
Human coronavirus HKU1 DQ415913.1 Avian infectious bronchiolitis AY851295.1
Human coronavirus HKU1 DQ415914.1 Avian infectious bronchiolitis FJ904719.1
Human coronavirus HKU1 DQ415896.1 Avian infectious bronchiolitis FJ904717.1
Human coronavirus HKU1 DQ415897.1 Avian infectious bronchiolitis FJ904718.1
Human coronavirus HKU1 DQ415898.1 Avian infectious bronchiolitis FJ904716.1
Human coronavirus HKU1 DQ415899.1 Avian infectious bronchiolitis FJ904714.1
Human coronavirus HKU1 DQ415900.1 Avian infectious bronchiolitis AY514485.1
Human coronavirus HKU1 DQ415901.1 Avian infectious bronchiolitis GU393331.1
Human coronavirus HKU1 DQ415902.1 Avian infectious bronchiolitis GQ504723.1
Human coronavirus HKU1 AY884001.1 Avian infectious bronchiolitis GQ504722.1
Human coronavirus OC43 JN129834.1 Avian infectious bronchiolitis GQ504720.1
Human coronavirus OC43 JN129835.1 Avian infectious bronchiolitis GQ504721.1
Human coronavirus OC43 AY585228.1 Avian infectious bronchiolitis FJ888351.1
Human coronavirus OC43 AY903460.1 Avian infectious bronchiolitis FJ904715.1
Human coronavirus NL63 NC_005831.2 Avian infectious bronchiolitis DQ834384.1
Human coronavirus NL63 DQ445911.1 Avian infectious bronchiolitis AY692454.1
Human coronavirus 229E NC_002645.1 Avian infectious bronchiolitis EU418975.1
Scotophilus bat coronavirus NC_009657.1 Avian infectious bronchiolitis EU418976.1
Bat coronavirus 1B NC_010436.1 Avian infectious bronchiolitis NC_001451.1
Bat coronavirus 1A NC_010437.1 Avian infectious bronchiolitis FJ807652.1
Bat coronavirus HKU8 EU420139.1 Avian infectious bronchiolitis GU393335.1
Bat coronavirus HKU2 EF203067.1 Avian infectious bronchiolitis EU526388.1
Bat coronavirus HKU2 EF203065.1 Avian infectious bronchiolitis AJ311317.1
Bat coronavirus HKU2 EF203066.1 Duck coronavirus JF705860.1
Bat coronavirus HKU2 EF203064.1 Murine hepatitis NC_006852.1
Bat coronavirus HKU8 NC_010438.1 Murine hepatitis GU593319.1
Bat coronavirus HKU2 NC_009988.1 Murine hepatitis AY700211.1
Bat coronavirus HKU4-1 NC_009019.1 Murine hepatitis AF208067.1
Bat coronavirus HKU4-2 EF065506.1 Murine hepatitis AF208066.1
Bat coronavirus HKU4-3 EF065507.1 Murine hepatitis AF201929.1
Bat coronavirus HKU4-4 EF065508.1 Murine hepatitis AB551247.1
Bat coronavirus HKU5-1 NC_009020.1 Murine hepatitis AF029248.1
Bat coronavirus HKU5-1 EF065509.1 Murine hepatitis AF207902.1
Bat coronavirus HKU5-2 EF065510.1 Murine hepatitis NC_001846.1
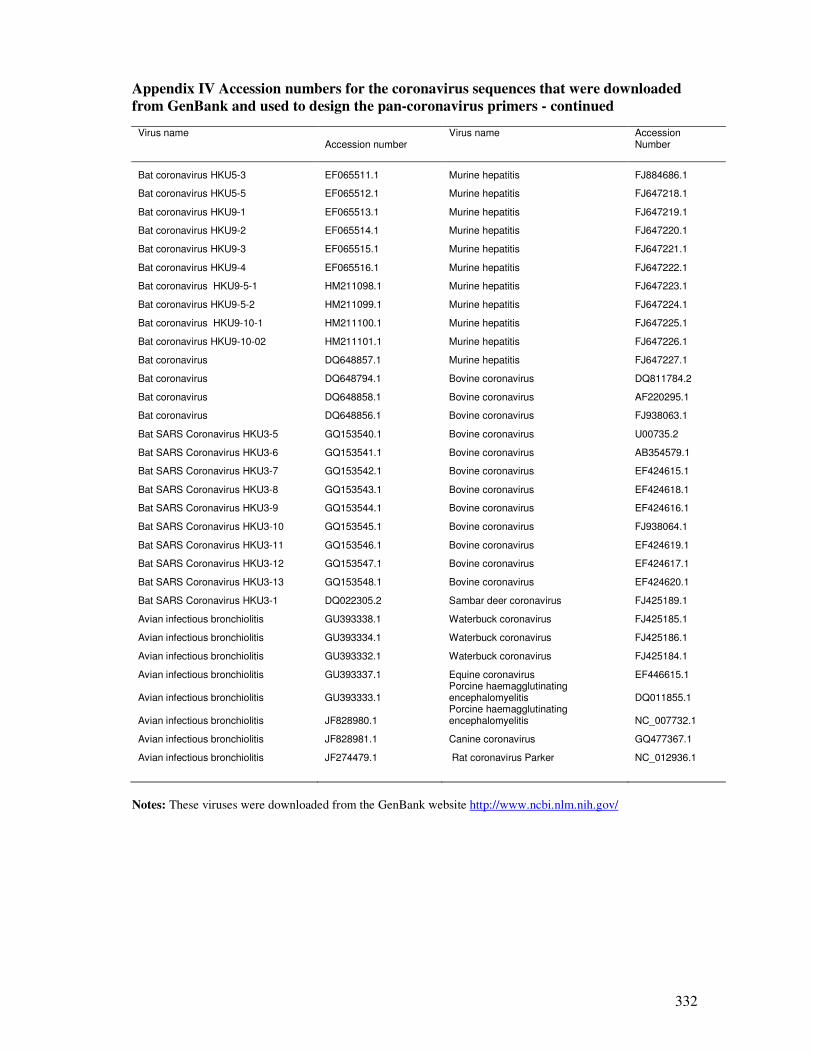
332
Appendix IV Accession numbers for the coronavirus sequences that were downloaded
from GenBank and used to design the pan-coronavirus primers - continued
Virus name
Accession number
Virus name
Accession Number
Bat coronavirus HKU5-3 EF065511.1 Murine hepatitis FJ884686.1
Bat coronavirus HKU5-5 EF065512.1 Murine hepatitis FJ647218.1
Bat coronavirus HKU9-1 EF065513.1 Murine hepatitis FJ647219.1
Bat coronavirus HKU9-2 EF065514.1 Murine hepatitis FJ647220.1
Bat coronavirus HKU9-3 EF065515.1 Murine hepatitis FJ647221.1
Bat coronavirus HKU9-4 EF065516.1 Murine hepatitis FJ647222.1
Bat coronavirus HKU9-5-1 HM211098.1 Murine hepatitis FJ647223.1
Bat coronavirus HKU9-5-2 HM211099.1 Murine hepatitis FJ647224.1
Bat coronavirus HKU9-10-1 HM211100.1 Murine hepatitis FJ647225.1
Bat coronavirus HKU9-10-02 HM211101.1 Murine hepatitis FJ647226.1
Bat coronavirus DQ648857.1 Murine hepatitis FJ647227.1
Bat coronavirus DQ648794.1 Bovine coronavirus DQ811784.2
Bat coronavirus DQ648858.1 Bovine coronavirus AF220295.1
Bat coronavirus DQ648856.1 Bovine coronavirus FJ938063.1
Bat SARS Coronavirus HKU3-5 GQ153540.1 Bovine coronavirus U00735.2
Bat SARS Coronavirus HKU3-6 GQ153541.1 Bovine coronavirus AB354579.1
Bat SARS Coronavirus HKU3-7 GQ153542.1 Bovine coronavirus EF424615.1
Bat SARS Coronavirus HKU3-8 GQ153543.1 Bovine coronavirus EF424618.1
Bat SARS Coronavirus HKU3-9 GQ153544.1 Bovine coronavirus EF424616.1
Bat SARS Coronavirus HKU3-10 GQ153545.1 Bovine coronavirus FJ938064.1
Bat SARS Coronavirus HKU3-11 GQ153546.1 Bovine coronavirus EF424619.1
Bat SARS Coronavirus HKU3-12 GQ153547.1 Bovine coronavirus EF424617.1
Bat SARS Coronavirus HKU3-13 GQ153548.1 Bovine coronavirus EF424620.1
Bat SARS Coronavirus HKU3-1 DQ022305.2 Sambar deer coronavirus FJ425189.1
Avian infectious bronchiolitis GU393338.1 Waterbuck coronavirus FJ425185.1
Avian infectious bronchiolitis GU393334.1 Waterbuck coronavirus FJ425186.1
Avian infectious bronchiolitis GU393332.1 Waterbuck coronavirus FJ425184.1
Avian infectious bronchiolitis GU393337.1 Equine coronavirus EF446615.1
Avian infectious bronchiolitis GU393333.1 Porcine haemagglutinating encephalomyelitis DQ011855.1
Avian infectious bronchiolitis JF828980.1 Porcine haemagglutinating encephalomyelitis NC_007732.1
Avian infectious bronchiolitis JF828981.1 Canine coronavirus GQ477367.1
Avian infectious bronchiolitis JF274479.1 Rat coronavirus Parker NC_012936.1
Notes: These viruses were downloaded from the GenBank website http://www.ncbi.nlm.nih.gov/
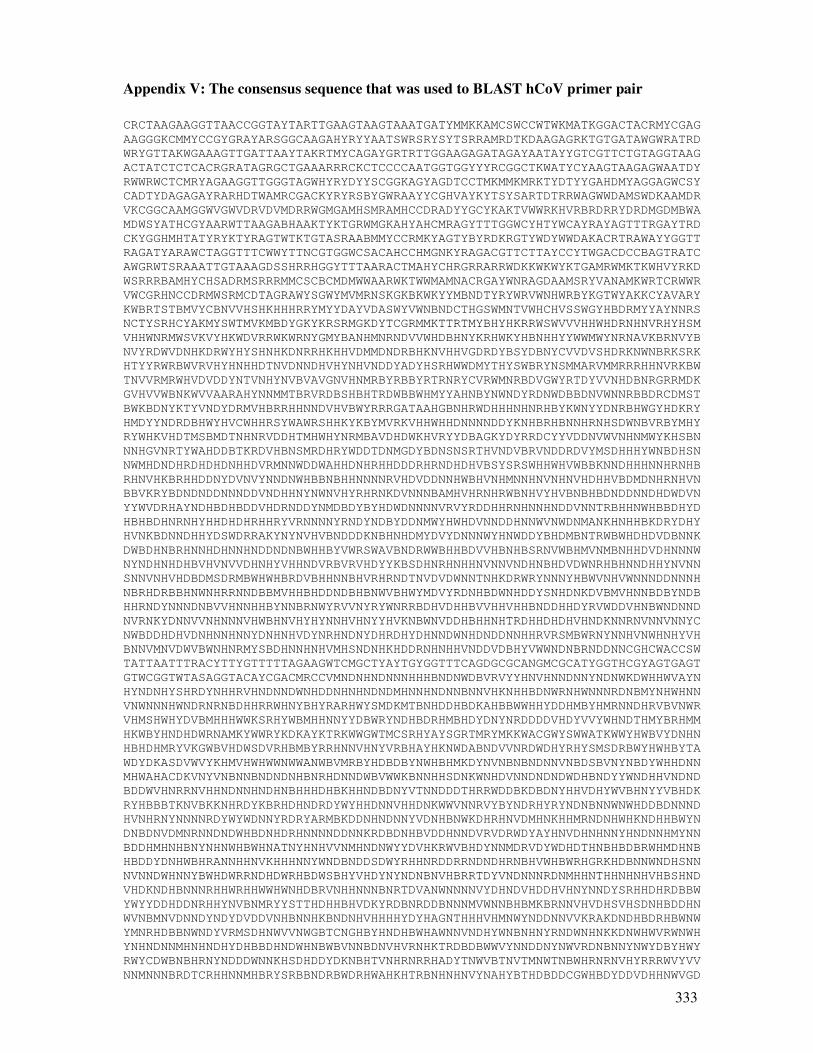
333
Appendix V: The consensus sequence that was used to BLAST hCoV primer pair
CRCTAAGAAGGTTAACCGGTAYTARTTGAAGTAAGTAAATGATYMMKKAMCSWCCWTWKMATKGGACTACRMYCGAG
AAGGGKCMMYCCGYGRAYARSGGCAAGAHYRYYAATSWRSRYSYTSRRAMRDTKDAAGAGRKTGTGATAWGWRATRD
WRYGTTAKWGAAAGTTGATTAAYTAKRTMYCAGAYGRTRTTGGAAGAGATAGAYAATAYYGTCGTTCTGTAGGTAAG
ACTATCTCTCACRGRATAGRGCTGAAARRRCKCTCCCCAATGGTGGYYYRCGGCTKWATYCYAAGTAAGAGWAATDY
RWWRWCTCMRYAGAAGGTTGGGTAGWHYRYDYYSCGGKAGYAGDTCCTMKMMKMRKTYDTYYGAHDMYAGGAGWCSY
CADTYDAGAGAYRARHDTWAMRCGACKYRYRSBYGWRAAYYCGHVAYKYTSYSARTDTRRWAGWWDAMSWDKAAMDR
VKCGGCAAMGGWVGWVDRVDVMDRRWGMGAMHSMRAMHCCDRADYYGCYKAKTVWWRKHVRBRDRRYDRDMGDMBWA
MDWSYATHCGYAARWTTAAGABHAAKTYKTGRWMGKAHYAHCMRAGYTTTGGWCYHTYWCAYRAYAGTTTRGAYTRD
CKYGGHMHTATYRYKTYRAGTWTKTGTASRAABMMYCCRMKYAGTYBYRDKRGTYWDYWWDAKACRTRAWAYYGGTT
RAGATYARAWCTAGGTTTCWWYTTNCGTGGWCSACAHCCHMGNKYRAGACGTTCTTAYCCYTWGACDCCBAGTRATC
AWGRWTSRAAATTGTAAAGDSSHRRHGGYTTTAARACTMAHYCHRGRRARRWDKKWKWYKTGAMRWMKTKWHVYRKD
WSRRRBAMHYCHSADRMSRRRMMCSCBCMDMWWAARWKTWWMAMNACRGAYWNRAGDAAMSRYVANAMKWRTCRWWR
VWCGRHNCCDRMWSRMCDTAGRAWYSGWYMVMRNSKGKBKWKYYMBNDTYRYWRVWNHWRBYKGTWYAKKCYAVARY
KWBRTSTBMVYCBNVVHSHKHHHRRYMYYDAYVDASWYVWNBNDCTHGSWMNTVWHCHVSSWGYHBDRMYYAYNNRS
NCTYSRHCYAKMYSWTMVKMBDYGKYKRSRMGKDYTCGRMMKTTRTMYBHYHKRRWSWVVVHHWHDRNHNVRHYHSM
VHHWNRMWSVKVYHKWDVRRWKWRNYGMYBANHMNRNDVVWHDBHNYKRHWKYHBNHHYYWWMWYNRNAVKBRNVYB
NVYRDWVDNHKDRWYHYSHNHKDNRRHKHHVDMMDNDRBHKNVHHVGDRDYBSYDBNYCVVDVSHDRKNWNBRKSRK
HTYYRWRBWVRVHYHNHHDTNVDNNDHVHYNHVNDDYADYHSRHWWDMYTHYSWBRYNSMMARVMMRRRHHNVRKBW
TNVVRMRWHVDVDDYNTVNHYNVBVAVGNVHNMRBYRBBYRTRNRYCVRWMNRBDVGWYRTDYVVNHDBNRGRRMDK
GVHVVWBNKWVVAARAHYNNMMTBRVRDBSHBHTRDWBBWHMYYAHNBYNWNDYRDNWDBBDNVWNNRBBDRCDMST
BWKBDNYKTYVNDYDRMVHBRRHHNNDVHVBWYRRRGATAAHGBNHRWDHHHNHNRHBYKWNYYDNRBHWGYHDKRY
HMDYYNDRDBHWYHVCWHHRSYWAWRSHHKYKBYMVRKVHHWHHDNNNNDDYKNHBRHBNNHRNHSDWNBVRBYMHY
RYWHKVHDTMSBMDTNHNRVDDHTMHWHYNRMBAVDHDWKHVRYYDBAGKYDYRRDCYYVDDNVWVNHNMWYKHSBN
NNHGVNRTYWAHDDBTKRDVHBNSMRDHRYWDDTDNMGDYBDNSNSRTHVNDVBRVNDDRDVYMSDHHHYWNBDHSN
NWMHDNDHRDHDHDNHHDVRMNNWDDWAHHDNHRHHDDDRHRNDHDHVBSYSRSWHHWHVWBBKNNDHHHNNHRNHB
RHNVHKBRHHDDNYDVNVYNNDNWHBBNBHHNNNNRVHDVDDNNHWBHVNHMNNHNVNHNVHDHHVBDMDNHRNHVN
BBVKRYBDNDNDDNNNDDVNDHHNYNWNVHYRHRNKDVNNNBAMHVHRNHRWBNHVYHVBNBHBDNDDNNDHDWDVN
YYWVDRHAYNDHBDHBDDVHDRNDDYNMDBDYBYHDWDNNNNVRVYRDDHHRNHNNHNDDVNNTRBHHNWHBBDHYD
HBHBDHNRNHYHHDHDHRHHRYVRNNNNYRNDYNDBYDDNMWYHWHDVNNDDHNNWVNWDNMANKHNHHBKDRYDHY
HVNKBDNNDHHYDSWDRRAKYNYNVHVBNDDDKNBHNHDMYDVYDNNNWYHNWDDYBHDMBNTRWBWHDHDVDBNNK
DWBDHNBRHNNHDHNNHNDDNDNBWHHBYVWRSWAVBNDRWWBHHBDVVHBNHBSRNVWBHMVNMBNHHDVDHNNNW
NYNDHNHDHBVHVNVVDHNHYVHHNDVRBVRVHDYYKBSDHNRHNHHNVNNVNDHNBHDVDWNRHBHNNDHHYNVNN
SNNVNHVHDBDMSDRMBWHWHBRDVBHHNNBHVRHRNDTNVDVDWNNTNHKDRWRYNNNYHBWVNHVWNNNDDNNNH
NBRHDRBBHNWNHRRNNDBBMVHHBHDDNDBHBNWVBHWYMDVYRDNHBDWNHDDYSNHDNKDVBMVHNNBDBYNDB
HHRNDYNNNDNBVVHNNHHBYNNBRNWYRVVNYRYWNRRBDHVDHHBVVHHVHHBNDDHHDYRVWDDVHNBWNDNND
NVRNKYDNNVVNHNNNVHWBHNVHYHYNNHVHNYYHVKNBWNVDDHBHHNHTRDHHDHDHVHNDKNNRNVNNVNNYC
NWBDDHDHVDNHNNHNNYDNHNHVDYNRHNDNYDHRDHYDHNNDWNHDNDDNNHHRVRSMBWRNYNNHVNWHNHYVH
BNNVMNVDWVBWNHNRMYSBDHNNHNHVMHSNDNHKHDDRNHNHHVNDDVDBHYVWWNDNBRNDDNNCGHCWACCSW
TATTAATTTRACYTTYGTTTTTAGAAGWTCMGCTYAYTGYGGTTTCAGDGCGCANGMCGCATYGGTHCGYAGTGAGT
GTWCGGTWTASAGGTACAYCGACMRCCVMNDNHNDNNNHHHBNDNWDBVRVYYHNVHNNDNNYNDNWKDWHHWVAYN
HYNDNHYSHRDYNHHRVHNDNNDWNHDDNHNHNDNDMHNNHNDNNBNNVHKNHHBDNWRNHWNNNRDNBMYNHWHNN
VNWNNNHWNDRNRNBDHHRRWHNYBHYRARHWYSMDKMTBNHDDHBDKAHBBWWHHYDDHMBYHMRNNDHRVBVNWR
VHMSHWHYDVBMHHHWWKSRHYWBMHHNNYYDBWRYNDHBDRHMBHDYDNYNRDDDDVHDYVVYWHNDTHMYBRHMM
HKWBYHNDHDWRNAMKYWWRYKDKAYKTRKWWGWTMCSRHYAYSGRTMRYMKKWACGWYSWWATKWWYHWBVYDNHN
HBHDHMRYVKGWBVHDWSDVRHBMBYRRHNNVHNYVRBHAYHKNWDABNDVVNRDWDHYRHYSMSDRBWYHWHBYTA
WDYDKASDVWVYKHMVHWHWWNWWANWBVMRBYHDBDBYNWHBHMKDYNVNBNBNDNNVNBDSBVNYNBDYWHHDNN
MHWAHACDKVNYVNBNNBNDNDNHBNRHDNNDWBVWWKBNNHHSDNKWNHDVNNDNDNDWDHBNDYYWNDHHVNDND
BDDWVHNRRNVHHNDNNHNDHNBHHHDHBKHHNDBDNYVTNNDDDTHRRWDDBKDBDNYHHVDHYWVBHNYYVBHDK
RYHBBBTKNVBKKNHRDYKBRHDHNDRDYWYHHDNNVHHDNKWWVNNRVYBYNDRHYRYNDNBNNWNWHDDBDNNND
HVNHRNYNNNNRDYWYWDNNYRDRYARMBKDDNHNDNNYVDNHBNWKDHRHNVDMHNKHHMRNDNHWHKNDHHBWYN
DNBDNVDMNRNNDNDWHBDNHDRHNNNNDDNNKRDBDNHBVDDHNNDVRVDRWDYAYHNVDHNHNNYHNDNNHMYNN
BDDHMHNHBNYNHNWHBWHNATNYHNHVVNMHNDNWYYDVHKRWVBHDYNNMDRVDYWDHDTHNBHBDBRWHMDHNB
HBDDYDNHWBHRANNHHNVKHHHNNYWNDBNDDSDWYRHHNRDDRRNDNDHRNBHVWHBWRHGRKHDBNNWNDHSNN
NVNNDWHNNYBWHDWRRNDHDWRHBDWSBHYVHDYNYNDNBNVHBRRTDYVNDNNNRDNMHHNTHHNHNHVHBSHND
VHDKNDHBNNNRHHWRHHWWHWNHDBRVNHHNNNBNRTDVANWNNNNVYDHNDVHDDHVHNYNNDYSRHHDHRDBBW
YWYYDDHDDNRHHYNVBNMRYYSTTHDHHBHVDKYRDBNRDDBNNNMVWNNBHBMKBRNNVHVDHSVHSDNHBDDHN
WVNBMNVDNNDYNDYDVDDVNHBNNHKBNDNHVHHHHYDYHAGNTHHHVHMNWYNDDNNVVKRAKDNDHBDRHBWNW
YMNRHDBBNWNDYVRMSDHNWVVNWGBTCNGHBYHNDHBWHAWNNVNDHYWNBNHNYRNDWNHNKKDNWHWVRWNWH
YNHNDNNMHNHNDHYDHBBDHNDWHNBWBVNNBDNVHVRNHKTRDBDBWWVYNNDDNYNWVRDNBNNYNWYDBYHWY
RWYCDWBNBHRNYNDDDWNNKHSDHDDYDKNBHTVNHRNRRHADYTNWVBTNVTMNWTNBWHRNRNVHYRRRWVYVV
NNMNNNBRDTCRHHNNMHBRYSRBBNDRBWDRHWAHKHTRBNHNHNVYNAHYBTHDBDDCGWHBDYDDVDHHNWVGD

334
BNHHNDVNNHYDYMHNBNBNHDVRBNKDBDNYMNNBDNDDBNDHDHHNHKRWBHBDVRVNHVANVDNHNVYYNWNWY
NNNNDHYNHDCTAAATVRRBDHNDNNNWBDYYNNDAHNHVYSDDWHHWNNWDVNRYBNNNDHNNYDDWVBNYATDHD
HHHDYWNNNHHVVNDNHBDHHNNDDNDRYDDNNHNWHNDMHDNNVWNHNYKTNKBRWNYHDVHVMNWDHDHYWMKCK
GGWHMDTSAMSWAAAYMCKKNNDHMWBBDHNNNVDYBNHWBHBWHNDNNBYKDHSNNHNNWVYHNHVHBKHHHAYKN
YWRNDDNBRBDVHDDDMNNKRNDNNNNNNVNHHBDHNHWNVAHYHNHANDKYDRNHNNDHRDHNNDHVHDMNDWKRW
YNYYVWHNNANHWRNVNDWHNYHHMNHDDNNBDHRHNVHDNHWDNBDBHNNHRNADNNNKBWHYBNVHHDVBAWHNN
WDNHNNDWDNBDNBDDNYNHDHVHNDNWYNWNYNBHRNYHNWHYNRTBDNNDHSWYDNNYAHVDYNDNRDNYHYHDB
DVNHWNDHBNRBBNDDVNMBDWHYVNYBDNKWHBVBNWNNDHNHHNBHHHNRMNDRNDNBHTVKTHGDNNDNDNDHB
DHRHWNBBWNDVWVANNDNBDNRMBTNNNDBYDNHYDHBBDNDVWNHVNDYNDMBDYHVRNNRBNNHBNDNBRDVBN
NNNNWDVHDHNCTTCTCCWYYWWBWYHNNNDHHDYNDYADBBKNNNYWNBDBHNHNRNDNNHNHNWNNWDHNNDYWN
NNNDBRHYNTNNNHNWNWNNHYDNHHDWMNYRDYBDHNVHRHBDNNDHHDTBNDBRDHDDRSKWNHHRRWKVHVNHC
NNNNNNVMNDBNNHDHHHNNNBHRKDHNHYNHNBVHNNNHDDDAWHDHWDANDCBWYNDHDBHDYKWHBNMKYCYWY
DBMRHNNBMVHWHNYVNHRNHDBBBNKHNDRHVRYWCBBNBBNHDNHDHSDDYNWHNDBDNRHHRDHBHDHNHWHYW
RNNVNHDHSDHNHNTNHDHHNDYRMHHBYNKYVNDKNNWBHDMNDHRNHYMVVBHWDRHHABYHDNHRNHDTDDNWV
NDNWHHHHVBKRVACYRVHVWWYRHBBHVKNDNHARHRTDDWNDRDRHBDNHVNWYNHNNNWDNDNNNRYDWHNBNN
NWDYNBYKNDHNRYNTYBYNVDHBNBKDYKDYNNKYDBVDWDVVHDNTNNBBYWRYNNBTDYWATCYRHBKWBDHNN
VDNVNVNNHNBRKKBDNDBDNDNBNGKTNVRNTDYHHHMRNHNHBNNDMNHHNTNVDNVWVDYNBNVHYRCYRWAYT
AYVYADNDWHSDNNDNDHHHNNDNNDVDWNDTVYVRDAYNWDDDVNHSYBRHNRHRBHNDWYVNRVDTVNHNYNNDD
VNHDHRNBHHYKTMKRDYYNHVBDNBHNNVDHNNHNNDNDYHHNHNKDWHYWNNNBVRNNBDNNHNNDNMWYMDTKW
MHNYKNDNDTBHRVHHNNDNYGNDYVTNVWNBBNWYHVNNNYHNNNDWNNDVRHNBYNYDNWHBHWBDNNHDNNVNV
HNVVWNNNNNBNDYHNWDNNHNDVNWNNNBNBNNHBHHNWWDBNTNHHDHNNNVNNNNNNRNADDDNNHYNDRYWWN
HDNMDNNNHYRNNHHKWHDHNHNNDVBWNKYWNYNNDHNHWNYWHHDNKVDWYYWBBNDBRVNKMCRVNNNBDDNHN
YNDNHBNDDBHMRAYDNBKDNBWNDDDHVRHWWHBRYBBDHNWDVHNWNHHBNDHYNDNWDBNDMDHWBKMRDNVNH
NWNNNDYWRMHVWHRYNHYNAYYDYNVHHVWDYDWVDHNNNRDDDHNVWHRHHDHDHHNBHDRVNYYTNNYRNDYWN
VMNBBVWNVRYDYYBHHSKYVDDNNNVNDNYRDYMYBVDRHNRTBTVRRYADNTRDHWHNVHVWYMVDWTHNVHNNA
HHRDNNYDNDNVVHYDNVRYVRNWNDRRYVWBDWWNNNWHNYHBDDHNBDHVTHRNYHHVNNYNDWYNSHHSVBKHY
AAYTTHHWYDDWHDNHYHDWNBWRNAHBHDRNVSDHMHNWHHNBDSYNYNNHSNNHNHHHMNHNNWHNNRWHNNDRN
NKHNWNHVDBRNNVBDYYWANNVHDDVDDNDVYHMWDNVHHNHNBNNVDYHDNNHNDNVRNDYNRNYHWWYGNWWRB
RKNHSHBDDVHHVNHYYWMVDBNDVDDHNHBADDHATNHYKRASDNNNBRVRVDVHBHDBHBWRNKDABHNBVDHVD
YYDHMDYVNNNNWYDYWRHVRKTAWHVVAHHANBHNWHNHNNKYDBHNHWVRMVNMNHWWHMRMASDTNBYNNNDYN
VNWMVKWDVKHWVKRHBRHNNNNNHNNNRAHKBHWYNRWHDYYHDYWHBVWVNNKYNHDNHBWYBRHNNWVYDKNDD
NWYDYDNDHNBDDNDHKRWHNHHYKNDNNAYDWDWNNYDDHHNNHNHNBYNDVDDNRHWNNBNWHYBWHDYBNWHWT
WNSRHVNNVNNWBDVYHRHRWBHWYRNKBHHDBNDYKVNHADNNKKHNBYVBRDHDBDHDYDHDVRDNMDVNHDYDD
WNRYNBBNBNWDVHRKKNHBDNNVNWBDKDNNNHYRNDDYYNDRHHVHBHDNHYRHDBDBDRKYADVVWNHHDHNDN
NHNDBDNNNNVHNHYRANNNWDHWBHDHMNRDNNDHHYVWHDHHRNDNNBWBWNYRVNAMADDHWHHVNKVDKKKYR
RGWSWCMWBDWHVNHDNHDBNANHBSRNNDYDWWMVDTNHVRTDYBYDHHHNNDHHVYHHNNRHNVNNVDNRYNRDY
DNVDHNNYHWNHNRNKWYDDNHNNNRNDNHVRHDDNHNDNNDVRNNNHDMDVDHYRDWMBYNKHYDKDHRDHRVHNW
YTRYYHDNNHNTDWHNHNHNHRHYDDDNWYSDDDDHHBNYDHVDYNHHDNNDNWWBNDHHNHNHHNGWDHANYVHHH
NNNHNNKDKNWNNNNNHDVHYWHNHHNKRNHRNHYNWMYDHWNYWNNDYWWWYBNVWNWRNBVHHRHYHBTDYNDHD
DGGACCWMDNNDDDHNYDVHDHNVHHDSTDDHBBWHRDDNDHDHSDHHRHBNNNYNYNHNVNNNNVRHHNYHDHNDN
HHBRATGGARWYYVRVDHBNNNNNHDHNWYBBDVAHDDYNNNKDDDNBNDDNSNDHHNDDBDHHHDBHNNHNHNDYN
WYNNDDNHBDTTAAACCAHRHYNNBRHHRAYVHDWKNVKKWHYHRHDNRWYBBNDNTDYBNHVNDWNDYNNNVWHVD
RHDRYWYCAAKTYVDNHDNDHBYHDHBHDVHNNWYVNWNNWVDBDNWNHBNDHYDHHHYDNNVDHHDWYDKANWVDH
NDHNNBYNWNHBWWDKNHNWHHRNYBWBDNDDDYNYHMWBNDNDBYVBDNHHDBHAYNNNWHNHYBBNRHNDDNBDH
NBNHRYNKBNNNDDYNDNNWBBDHNRYNBWMRHMNWDTDDNYHNDYNDBRNHBNRHNNDHYWBNDYVNDHDHVRDMB
NBBDBHHRBWVHVWBHNNNNHNNAHBDDRDWNNHDRNSDDDHYVNHWDWWDKHHHHDNRRWDRHNHDVWYWDNHDYS
WHHDWMNBRMYDHHWHYRNNNHDHNHHNYNDVNYRYCHVRWBVNCNNBDNHNNWVHNNDYWBNBDDNHNVNVWNVRB
DTDRNDWAAGTCCTACVYYYHVRWWDHHKRVWYVNDWNWBYDYNWNNHNNDMRNNBDNDBVNNDHNRWYYVHNVDRW
DSWNNNHDVHVDMYKNDHDDBDNKNNDVNTDHDHYRDNHBDWHNHWNDNVNYMVNTNWNNDHYBNNNDNNRHYNWND
NTVDNYNBVRRCCTAAGMMHHRKYNHHDNBNDNVHNNNDNNHRNHNHNHNNYNVDNDHHDNNWDYSKTVNYVRDDND
DNYHHHAHHNDNDVHBDNWYDTHRDDHWVNDDVHVNHVRNMYDHNDBNYNYBVHHRRKRHSMWWMMDVKNDNNWHDH
NBNDHHMNYHNWVNHNYHBDDVHHNYBHDHVDDHNDYNDHHNTBKRNWHDDHNNBDNNRWHDYVHHRDWVDNNVDND
BRRHVNNRVKNMBVNHHRNHNHHVNMHYHNBBHHWNYNNHNDHSTSRCCVWSRWNDWNNNNRHVNNVWNNBDNHNHN
HNRYYBDNNHBDNMNBBVDNDBHWYHDNDTDMVDHNBNDBNDHWWYHDHYVHVNNVNNHDDNVNNRNWRBRVBNHYR
DNTDNHVBVVHABNDNNDHHBRRWWYVDNNBKTRKRKDDDNVNYDWYVDWDNWHDYNNBHHNRHVDRHYDVVNHHNY
DDYBVDNDNWDWVVBDRHBNNVVHVHNHHHBDDNDDNNNWNHBDNVNBBNDHHNVDYMRNDNBKHTNNHBRYHDHDV
DTDBBHBDNYWDBNNHNNBHDHBBDNNNDVBHDHYNWWRTVMVNBDHHDWDVWNBDNNNNNHMHHNNHNNNVDDDHK
DTTHKNWKWDRDNVHNBNNNHHDHHRHHRWYDNNNHHAHNNNNRHNHNDVHKVYHRNNRDWHNHYBWWDVDYDNNNN
YWMNHNHAHNVWNKVNWVNWRYHRNHNNHBHHNNDDHNHNNNHDBNKVNNWYSDHHRHNRBNNHBWNBDNNHYNNNW
NANDNBHBYYDDHWWNVHMDHYDBNTRDMDKACCAAGGGCTCCAHHRDDYBDHBHHHKDWHWYNDDWNDWDNDDHND
HNHHNDBDNHNDNDBVKNHRDBDDBBKYRDDWNDWNNNHHVWHBNBHMHBVHDYDWHHNHDKWWRMDRRYWHNHBYW
NNRNHNHYYYNNDHNHHRRHRRDRNDWNYNNYVDBNHDTVNRRHNDDVWDHKDDVHHRYRBNDVBAVHVNWTBYMRH
VBHDRHNGWHNDRBHNRWBMVKRRHRDAGWYWHVWHSWHRWBRVBWWWKWNWRNVVHBHDVWBHVWBDVHHDYYDVH
HVYDNDHHNDDHDDRHBDNDWRKNYNBYNRDNNNDDHVMNDNYWHHYWDBNWHDNWMDDNMNNHHDHKVHKVDWNNW

335
VNBNVDRHYHNKVWYDBHVNMHNBDHBHYWWNWWBSWMTRMVWNWYDMANKBNHHNDHHNHNHHRHRBNHBWBNYNH
DNVDVNVDDDDHHDNDNNHDNHNDRKDHNHWYDMHHNVNHVBYWYKHHWVNNNBTHSDWHHVNRNYYDRAVNDBNHD
WNDHNNTBVDNDNRDDNVHNMYDWNDRHNDDDHNDDNDVHNVBWDDVDWHDHWDWBBNDVDWVHRRNWHYHRWBNYR
DDDDHDDWDBVNVHRVHCVBMRNDNBNHNNDYNWBMMHHBNSGKDDYNDDSNNVNVWMWDDWRDWTWWTGNRWVDWY
DTWHNDHNNWHVDWVDNNRNVYNWHWBNWSWMVDWVDDAHHDDWYRYVHHDHDNKDRYYVNRYNNHDNDDNVRDSNK
WWNHBDHYRDNWBHBDRDVDRNNHNYNHDRMTYWRMMDTBKRNNDHYNYNHNHDDRWNBHTHRBBDNHWYNHBYYVD
WHHHYYKBHMHNNNHDNNDHYMVNNBKDDYDNDHDNDYHYBBTRHVNBHVWNRSYAHWBTYHRWWDYHWRVYVDAWY
RHVWNWRDKHYVMHWRNSRTWBYKDDBDNDBDRVBRVNHDYVDNGMNWDNWHVTBRDMYKDNDANVVWBNDKHHVHN
NNNTRVWNNRRYVRNWDNASHRNDMVDRHKDWYHVMDKVNWSHBVDCRNVRWMNNHBRWDBDYNNNNWWRAMBVVDW
NBWBWBKNYNHVWYAHBMKNNKNNNHVNNDHDHNDMWYVWBMHDRMRRWTDHRWNYRYBRAHCRYACDWNNBRHRRH
GDHVRWKRWDHDHNNDDHVSHNRNHWYMRYVDDKYKDWBRWWTAHSRNKNDKBBTYNSVRADNVHNYYHYACGWNBV
BAVDYRHMDNBWNRHYWYBKDNYRVDBDBHDYDYKHDDDNDVDYRHBHNDDYMDDWHNRDDHDHAMGGTYBWHHHDA
VDCWHYDVMWNHRBCGTWNBSWHRRHRVBYHYSDDYHVRAHRNNRHWTDNYDTVNYVNHYHHWYWYAYWHYTDNVRY
HWSDMMBVDNWRYRAHMBHDVMWNHRBNRDBNHHHMRVDDAHWNWDDVTVVHAVHVWYWHSTATAYRGWCWHYWDKN
DDHYAVBDYNHHHRBDARDHHNNHHWDHMRDHRWBKWNRWRDNYNBHRHDHNYNKNDDHSMVYAKWVWKHRHHKHMV
HHNNYDWWSHARHDRWYRHYNNYVWYAWKRWCGWMMKKWDSDGACGGATTCTTAHVRNRBNVBDMMRTHVBDNRHDR
WWTYDWRWYNNBWHRRDMMHCRNTRWNGDRDNMRDVDYRRHMRHRSDWNYAMNWDNDBNVMVHAYAHTHSDHMHWSH
VNRWDRMAHMVHVANHWNWHHWKRDVTRWGDWHDAMHMAYATRWAHBRKWRHMAVTDRWWWDWHGKWSWYSMRWWDV
ADBDDSSDHRBSDYHDYWMDVHNTNYNWHBDWSMRRKRWWHNBBNDHRVRWYWHNDHRYAYHKHDDBWCCRTAYNNW
AWBRBYVHRHVDRWNRDYMDDMDDBDRAYDHHDRVWVMBDKHDKHMMNHNNWDNNNNDRDWBNARYDKDBKDYHRBM
NDWNVHNDWHVVNWMBHWHMRHWVHHWBKDNMRHWBHKDHRMYSWDAMYVWDBRWDDYVNNWNHDNDWYNBAMRWRD
ANYNDKVNMDNWNYTWHRRHRVDWYRATTDWHHABDHNBWDWMWYDWBTRWNVRMWHVWHSDWNBWRDBHRDMWBYW
KDVWBTNDYHHDDHBDNVHNYNHVRHYDBAKNHYNHNHCRVHNNWBDMKDRNHNRNHVRTYNHDHNDNHDWNVDDHD
DVDKHHHDRWHNBBWTVDYBDYWYGAAAYDKBTGGHGGWTNDHVDMVDMMMMDHTDWRRTRDBAWDAYSWYRBACNA
NHHYNVDHWTHMSRWNDHBKRDBAHVADDMVWTVYYKKWVBRDDWVDNKVWCAWHVRDTHYYWYWRDDNNRBDWNNH
RHSWHRHWSYRHNYYWYHDHNNNWDWWDDSMBGRDMYNYAYWHHWHHSRHBDHBVWSDVTVTVSHVDHDHKDKHDVH
YNHDNTKRVHBWAMHSNTMDHRNNBNDNNBHDHKRHWHDBHYRWRRHHWHYHHBRAVYSMRRDYMMRHNVGNHHHVH
CRVYWYMKAHYRKWKNMBDKNNHNMVADDVNWVKVDHHDDRDDBKVHVNBDKNNBHNHWVRVVBHRNVNBRDNTBDT
RWKKHDDYHHVNHNARHYDNGMVVMVNYYBRMRAWKRBWRRMWBKHHVANDANTDHHDWYDKBDBNDYYDHDKNWRB
BRYAVDNVHVNNNNDNMKYHHBNDRSHWHNHBYSDDRVHWRWRHHVRCCHWGHWYDBYHHRWHADYYHRWDMRYDRN
NNNHNWYHHWVWSANWTDNAACAYRYRTHYGDVDBDDNYMKHDHVHHNWBWYNNNNNVDABNVVHHDBRYTRRRRYD
WHNHSYWHDVRKRYHVNNHRHWBWYVTRVNWBBVNHRHNBBYTMDVNBDHNMNKHYYNHHVHHNRBKWRDVWNKHRM
ANCRHHKDWHVRRHWKNCGDYRHNWWBADYYNHYWMHDYHHAMYAAWHRWTKYTDNHBBHDHHRNHRBRVHRNYWDN
DMHHRBTDNDBAMMBRRHDNDBBRTGTWRWTRHYVWNDHSBVTHVARWKVDVDNNVNNRNNRHWKHNNNRVWVNNRA
HDDDWNYRAYHWNHNWBRHAMVWBDKHNVDRAHHKNBVRHHRRAKWYWYKHDBANWHSKTDYYHAAWVYHBBBRVHK
KNNANNMHMNHWBRVYBWDNMAHHYHSKDCKNMMNYRWBKDYVYRMYWYWVDDHDNYBYWKRVVDVNYAYVDNDMVD
HGYAYRVWWHHBVWHKRHCDHDBHRDWKWHVRHRDNRMHYRNBVYRWNVVHVRHSDNVNDDHHMYNDRKHHHMRHWD
DAMNVDDHDHRRDHDHKDNABNTRHNDNWRNKDHMBNBDHHKNNKWWTYWKHWWHBWNYMRYRWYVNAANTYHVHNN
SBKWHBRWVVNVVHNDTDYHMVHVVNYABARYMMYYWRYKTRYDWWYDWNDRHAWDWHHBDNDRNRDWHAWKDHGGW
HSNYRHHARDWTDHRHNDDBNDNDNKHDVAYARNHYCCTDRMHRBDWKKWNDYBYDHNVNNSYYMKDDDHMRDYDYD
WHSYBAWDGTNWWRYWYRWDDYNGDYARHHDYDYNNHBHRNAWBACNHVDNNHDWNHDTRYNDDDYHDHHRMRNHDH
HNBNHNHVWBRWNCHMHBHDNWGHAYHKTNRWBDKDAVHHDHVRDGRTSMWNRNHRHKDNNVWYVDVVRMMHHVYAM
HBKDWABMVHWYHKDDHDWVVYHNNRRHHWNBYNDVKWHNBRWAYBDNHKKNKHDDHVHRVRAYVHDNHDNKHBKDH
SDNNDHWAHYRHNDNWNDRDWHRHYKWTDNHKHHCCYAYNVRNWNHVDSGTHRDNTVYMDDAMYKDHTBHBNYARYR
HNWVHYRNWHHRYNKVHVRBKWHWRHMKDRRNBKHMDNYSHWDYACTDMRNRNVVDHDHNWVHRAYRTHHHDHNYAS
YRMYAWHNHNVNNKNHVWHRRHHNYAWHSRRRWDRCAMCHWMTWGDYDNHNWDHDCBYAMBRWDHNYHWYARWKWNB
DDWDHBDYAMNRHBDTBKHHBKDAWHHKDDVTVMWDVHSDTWRYHKNNNDSRNSDDBMNWNYHWYSNNDDHNNYGDK
NNHHVDWRDNVNRRHTNRAMWHVYYWYAWNSHVYHHNHNSWNWNDARNTYYRDHVNNBDVRWDYHDKDWTYVWVDKN
HKDYAVWYKDYNYRDBBDNWHYWNHASDMDNYDRHRAACDKDDTWWANGHWNMWSNNWDDTDDDNDKTNVHNAMNBK
NRWNVHDYHDYBHVVNKDNTHHMYNNABKWRVVRWSHVKHCYDSVHCBHNHDCDDNNWYDDHHNRRWYDHDDYRDYR
DDHDHVDNMRNHNNYKDDHNGGWHDNYVRMVBYKWTSBTTYRNDNRHKGWHHNBWHYYNSKWBDRWMDYYDMBHWBB
MRWYWYNKGHKRYRRYMDNRVNBHBBRHAYNBVHSDVDDDHRYRRBKWNDDDYNGRTHSRHSHNWSBDVHRMBTNHM
SDWKHVBDDHWMRWDHYWYDYHNVDHVHBVWNRSNMVKWVNVDBDDBDRDYNDVAAYTYTKWSGRWHBHYWYYDDAN
WBDRHDMNBRTHYMNDNDHDHVHHNRHVDAAGHHDNVRHKNHDYNBKYYGNTYHRRHVKHNNWYRVMRHHTVVHHMG
WVDDYBDYBRWWHHWDYWBHNNCGWDYYBRWYHHMYRHHBBDVHNNTHYBVRNRMHVRYGKWWVRWWTBDDWHBRRH
VDYBRKRNNRVDYNWDHNMWMWDYHNMVBKMNVVVNTDDVRHHRDDHHHNNTHNVRDYWYTWNMMHWYDCDDVBHWW
NTYDHRWHRDRGHNRVHSHRDHHKRYKKYYHNDABRVNRMBAWHMRNRNDBHHKMNYKHYRYAAHWKNKMBWMHHDY
MRNKBHYDYWSDHVHMWNDRDYDHSMNHVNBDYWWHYMDKVTWDBWDYBWYRRKWBHTRVRWYDMBHMWBWKDWBHM
RDMVHHDWWMDYBHKDDWYBWNNRHBVNYYRWBNKDBNATVRWMYVRTAAYDYNYMNBNBTAHYWNYVHKHSRWCMG
DTMKDRRHRVBRKNNNNMNBWHHNVDDNVTDWWWDDVDRWBBRDTNDANDYHNDMDNHNNAYARTYHYVHVVHSDHB
KWRWVHKWHSRNNDYRDDVWYSRTYACCKTWWHRVNRMHWNYDBMTAHYDDHRYYWYSYDWNNHDYRMWNRNVNHMD
NWDHVDCBNHDDYYRHHNRRDWDYATWYRDTKYYNMRNMYBYWSRNYRNWRNYRHYAVARNMDBVMHRHHKHNAWYK
WNVANVNDHHBYYHWRHAGHBMNRRNTDYBDYDDKTWHBMVRMHYHNWRYYNMYRRWHWYANDDCAKTDWYYDVNDT
HNYDWGRDHVYNHNYHDHNNYRHSMWCCWHKNYMDHBRMSWHSWCAABYWRWSGWTVBAYNWKKWNBAYRAMYHDNV

336
NDWDKRHKVNBWWNWWNTDHYWKWAAYVMRYRHHAAHSMBDHSTADSWNKVDWKYRBNTRNWDHTVHDAYADDBNKN
NNBDNMBNBYRKWNMRYDRWTRHCAYVWTTTDWVNABRVHHNNBBRHVAYMRYDRHYVDAMYKDNRRTVDYWDYBWB
RKNTDNSMBBRDRHNHNKYYHTRWGWATABSMNCAYGHNRDYARWYRHRWDWHHYKDMDNNNDYGDMAAMKYGTVKB
NCKHHRWYKWCSHMRYACNBNYVDBBBNYVBWTNWRNYRNGHDYRHVRWVNHHDHHYDYDDBKDYHNGGHYAHVBND
HBACAWANCTDWRDRSDNMHRRYMSNHCWRRVACVKRHMAYSDHNHNRHNWHVWAHRDDYRHDYDABYRTKWKCWHB
VNDVBDHYVADNSWDWNNDBWDDBMHGDNYRRWRAWDTWNBHYVMDMNYYDHRHWCACRKHTWBSRKSDKWKNHWRA
SRACNHNNBBDYNDMWWVSDYKDBNWYHWVHHHNNTSNMDHAMDCTNYARWYNTDHWTNTDBHDWBBWYVWYKNHYR
WAWMCADWYRHNDDHWHYBVDHYAWBVWBKKBNRHADHVKYRVNNBDRBWBDDRMNASTDKNYRHWBDARKSRDKNN
DSNHNRWDHBDYHDDNHDNRHYWNRYHWWYRKWMWYTYKYKWHYWDANRMYAHDBBNMSVHYDRWBYRAVAHBVHNH
VAVSGWHBHBTNBTNDWBRARNRHDHVHBNNWBBYVNMDNVMNYNNMVNSKDNWDARCRYDYNNHNMYRRAWWBHBN
VAKRWGHHANHRVMWNDVDMMRAKDCGNHRHKYNKYRRADYYHSHNTWVHNRWBDNDBBAMDMRDYHNHDYAWBMSN
RVNDDHHDHSWSSWWMRYBWBBWHBKWWVNRMYDWTTSTYHSNARHYRHANNNNNNHWRSDYDWVBDHHDVNRDDHR
YNWHDRATAYKTTTHKRDHMTGGDHRDHWDBKRTYDMGRNHYNDMTBDHNAHRMCDMAHAMBDVDNNKKWHHYHHYW
HHDYHYGRWDBNTYYRYDWHADWNHRHWSYRKWVRDWSTRRHDTHRVNVYDHNHVWYRYDDRHRCCWCTDMHVMWDT
DWBDDYBNKRYHHRAMHMCHMVHCRNNNDYDNYKBASHAKHATNVKHRTRWAYBWYGKDWHBKHNYSVDAHKVNWNY
RYBDRYRBYKHHSMNTYWHNWHAMACWBWWNDYKKHWGDTRYSWHBNHKRHBDYBNDDYRWWNYRVMDBVHNNVRDD
YWWRWAYRABTHRYRTYYBNVNDDVWVDDVDYWTDHAWNNDRKDMVHRDHHNHDNNBNNYRYDKTVDBWTYVDNHVD
WYBWRBRNDMNYVCTDNYYNMRNAVYAWBTHDMMVRAHTRDRWNHKDDYDWHWHRNNHYWYBDDDAWDRHYWHDRKN
VNHARNMBBRHNAHNHDDYBDYYYAWNHRYAVHTAHCRNWHKSDNWDYWWHRVDRDNDWNYNHYVBTRHNVNWKNYW
GAANHDNWDYABWMSDTRKWHYKDHRBHYGWSDDBWNTRNBMNBWDYSWAVWSVHAYWBHNTNNABBWDNMNNDRNR
RHRDNWRDDDNKDDWHGWAHMWYRHRRHNSDBSWYKTRAGHAHDCYHRDNDMNHDHHHBAVDMVRWSNYRRSKYSKR
WAYYBDHVDSNRYATWTBTRHRRTHWRWCHWTYHKVWYNHDNVVVRHTDKYBSTVWWDAYACTAARDYRWWRYHYNK
BNHHNVDBVRWHYDMDNMHHWMDABYSWNYKDTRNBDYHGYRRWVWNKHHWHGYRKYMHVHYWYYWMRAMDRHDHYK
WYDNDWRTTWWNRRWVDBBRYKTHCDNHNHVRKTKKNHHNDNNNDKMWWYBKKBMVNVNYAWDTYNRVDVHDWYDWY
NVVBRHWYRYRRDWBTHDHWRYRYAYWYMDMVYRMNHRDKDNYGWRVDBYNNWNBVDYRWWKDYWRHYDHBDDYVYC
RVRMHBDWTRBRWHWHYTRWBHHAAHCDYWTYSRWCAYBRWVRYRRKRSTBHBNRDHABKRWRSWYCDMRKYBTAYK
WDNRDHRSNVRWNKDWWTYKHBTTAVRRGHBDDKYKWKRMYNMGBKYRMKYAANVDKTHNRMKATHWWVRMBAKHSN
DNBCTCGRDCDTGWYRWNNDNHDYACRARDBHHSRDWBNTRRTHYBDDBNNYNNKWYRHDGTHDTHHHHNYMRWHWY
BWSHTADYGWVRWHSYKMDYHRSRTDKGRYADYHDWRWCCNDRNWGDTKYRRNMNDYMDYYBVMNVHRYTRTAYRRH
DNDKYNRRHKRHDYWYTRCAABYRHYANSRHHWDWVDWSYCVNYSYDRHKMNSATHVNYRHTABSWVRADWYKDHDW
RDAYKAHBHWDWMMRMHVRHSRKWMHMWWVNNBHNBHHYYBTRYDSHSDDYRWCAHGMNCGHBVWWDVRMKVKYBWW
DAYVGYWKRAMDBYTAMDYHVDCDHRDTHHHRNSYSHCYTRYAABRMDWMWCRNNWNMDHWTBWHWVVYRVRAYDHG
RASHWYHVWDWWNMDVRSYAYYAYNWYDRTVHCGRAWWSGWTTRARTCRAAAWTYVYMBRHHGKWCGHSARWRHMRD
WYHMAHHHWYKNDRNWRVMSHVHDYKNMVWTTRYKHNVRYKKNWRHAHYBWNAKBYWHRDNRHBHNNYVDYDDANDW
KHBDDTDVNHDYNDMHDVNHYRYMSNWNBTANBWYBBVDHYARYRWYKDMYRWWDYYWRWRAWYTHDHHHDTRWMRW
SRTAVTRSKMRRAYDSVYWWYTWYYKYAMVAMDYNHHVWTNHNDCHVWKRSRHVDRDHTYCMNTHBRDNVVNNWDDN
WYNYKDNARKWTBKYBRBRAVAYAATWKYHHHRKWVCRRAWWKWYRRWYBHHDVWDYDHRRCHSWWSDDKNHCKNBD
HTKNBWHYYTGKHBDWCWHRMDWHNAGDDBNKYNHRWNMBSDWYWDBDNYVHNNDYHMBYDHYMHWGHBRNHRKDKD
WHDKHNTNVRNWVADYHWVDDWHNVHHNDHBHHMHDHAYMDBWRYWRDWHHAWKKHKKDNTNWBACRWKHRWVNWAT
HTYRCHAWNSRYNNDVWNYRWTRHYBNCSDWKDGGYRRDYRYWTDKRDRVDDHYNBDWYDHMDRGTTTTBBNMANRV
NMYDHDWHVVYMHVDYHYHWYWYDYMRHYDYVWHHBYRDWMYNWYGWNBDYDWKDMBHDHDVDRNHGTBABNDNNVH
NWDBHYSAAYWCYABNHVKWHWVRRRWBMYBAMTYHBVWRAAHRHBHTNDBDNRNWNDWWBWNNRBDHMHWWWMGTH
YVAMNWBBWYNMRYDYNHNRVAYDHBVRDDVTDNKDHNTDNDDYRAVHNNBNYDWBRDRRKYBHHYGRWKDNDWWVH
VWVBWYBRNWHBWRHVCTRGTRYAVTAYMBWYKWHTHRTDYWNMDNBDNDDHHSDYARWRWGGKNDDVRHMCNYNNV
DDDNNHCWACVYWWYAKWKRYTWYARTRKBKTHACMNRRWWHNWYYAKRMHBWAYARWWHHMHNYHTDRYRKWYGDW
KHBRDHRNHVDDKDYDDNVHWYRVNBDHYHKHVYHRHVDNVADWBRTNHYKDNHWVVHBNHDDNMNHGDNKYNHDNM
DYDDBTDWRVYRYRKYWBAWVDHBHAAVABWKRHYYBABYDYRDYYDVDRAKDWWWGRMGTTTGSKRHNDYYHMHNH
KNMNHRVDDWBDKTNRHMWDHNHBBNYYWTRVVDNDWNYBNYNNHDYSTYMRDMMHNBYRKHYBHAHDSVDWNDCGB
WDYDDKKYYMKVYWRYANYMBNKVDHNCWWWHHNRDRMNRNHDVHYDYHRHVVHDTBHRMYDMDGDNRDDWRWWVBB
TDYRHKWCWWDARYRMNMRWHRDYNWHDDVRWBYHDDNVRWYNNDNSWDWATBNWNHNRWMSAVNRMNWVKWHDNRN
NNDHNYNATYACYGAGRHVHDDMRWRDYVBBRTDTYNDBVNHWRNKYDAHNRDBDYYMWHDVBARNWVYMVWHNTRV
RKRRWRDDHYWYBSMBBDNRWYHWBBNDRWDDHDRHVWNDKBNTHYKBHYNDBNWNRDVRTAWHRWWYNNARHKWNS
RNRVNWDWNNNWNBRVHYHYVBDNWNKVTDVBHVYDBSVMDWRNTMDKYBHSNADVYRTDMNBWKYVRDRHNBKRRY
AVRTTYHWBVWNNWYMRTBKYSDTCCACGTGGTCKHWDWSWRRMHYDDHNHYNNRRHCSAHHRVWTTCACWWWRDSW
NNNYGKNSDHRBHRDDKNKGWYKYNVVWSDKTRNVHYGWBWVBHRYRHDVNDYHBKKYWTNBNNKRTYYHWRDWNDN
DBVDNYDYYBNYRWGWKCMTRWYNWGKDBDNWYBBNRNHHYRMMYVWBDHDRBBWBNHWWAWWBKRMKTRNYVDDVY
BASNMBWYRHRMVCDNRHBRTKAYDWHYRYKWRHYGGWBYBHRBHVVHVWHYDYARVAMBVDYHNYHAHYBNRRNBV
NVMDNDWSRWTRHYRNWNKRRHVAYRRTMDTTRBBWDHNDVHBSWMDRWWYRTRWHRCAHNDDYDWCCWHNDVRHSK
DVBWMVNKRTHKWRRDKYHHDBMRHHRNHNDYYYMSWYRWSDWBTDSKHKTNHBNMWDTYDYNHVNHYKYVRNHBNH
DDWBRMRWSDDMBNHNNGDMWRHMDRAVRWHNBVKKDWYRNHDDSBWYDNNDYKVNTBWWRBNDNKVDGWNNVWKHH
VDNRMHNHDDRVWWNTRTTYNAWBWYBRWBWVKTRVDNYYNNVDDNNDNSDHRVAVNTVNNNWWWMDHYKTNCVNHH
HRDDKYNWRNTDHNDHDRNNNHRRHVKNHRDWBDWVDKNWTWDMWHYVHWNNARBTHYDNWMVDDNNNNYBWBYVDD
DWHBHMBDYRHTDNVDNRVDVRYRRDSNRKNAHMWYATVNNYYKTRWHNSDDVBDNNYDHWVHNVCACRNNVWARHB
BNDGDSDNWRNBDHYBRAVHHVDRWNYNDDSRBNBDYMSTADTHVARYADHWRDRYKTHWNRHBDYHDTSKNKSRWR
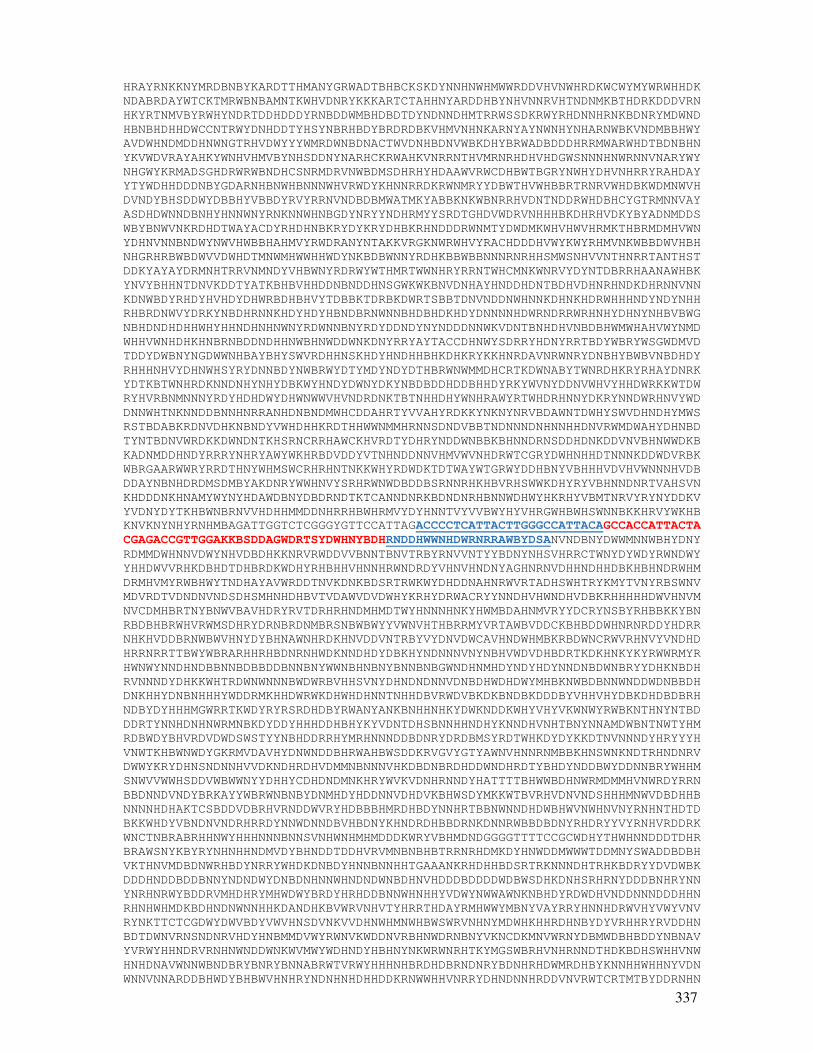
337
HRAYRNKKNYMRDBNBYKARDTTHMANYGRWADTBHBCKSKDYNNHNWHMWWRDDVHVNWHRDKWCWYMYWRWHHDK
NDABRDAYWTCKTMRWBNBAMNTKWHVDNRYKKKARTCTAHHNYARDDHBYNHVNNRVHTNDNMKBTHDRKDDDVRN
HKYRTNMVBYRWHYNDRTDDHDDDYRNBDDWMBHDBDTDYNDNNDHMTRRWSSDKRWYRHDNNHRNKBDNRYMDWND
HBNBHDHHDWCCNTRWYDNHDDTYHSYNBRHBDYBRDRDBKVHMVNHNKARNYAYNWNHYNHARNWBKVNDMBBHWY
AVDWHNDMDDHNWNGTRHVDWYYYWMRDWNBDNACTWVDNHBDNVWBKDHYBRWADBDDDHRRMWARWHDTBDNBHN
YKVWDVRAYAHKYWNHVHMVBYNHSDDNYNARHCKRWAHKVNRRNTHVMRNRHDHVHDGWSNNNHNWRNNVNARYWY
NHGWYKRMADSGHDRWRWBNDHCSNRMDRVNWBDMSDHRHYHDAAWVRWCDHBWTBGRYNWHYDHVNHRRYRAHDAY
YTYWDHHDDDNBYGDARNHBNWHBNNNWHVRWDYKHNNRRDKRWNMRYYDBWTHVWHBBRTRNRVWHDBKWDMNWVH
DVNDYBHSDDWYDBBHYVBBDYRVYRRNVNDBDBMWATMKYABBKNKWBNRRHVDNTNDDRWHDBHCYGTRMNNVAY
ASDHDWNNDBNHYHNNWNYRNKNNWHNBGDYNRYYNDHRMYYSRDTGHDVWDRVNHHHBKDHRHVDKYBYADNMDDS
WBYBNWVNKRDHDTWAYACDYRHDHNBKRYDYKRYDHBKRHNDDDRWNMTYDWDMKWHVHWVHRMKTHBRMDMHVWN
YDHNVNNBNDWYNWVHWBBHAHMVYRWDRANYNTAKKVRGKNWRWHVYRACHDDDHVWYKWYRHMVNKWBBDWVHBH
NHGRHRBWBDWVVDWHDTMNWMHWWHHWDYNKBDBWNNYRDHKBBWBBNNNRNRHHSMWSNHVVNTHNRRTANTHST
DDKYAYAYDRMNHTRRVNMNDYVHBWNYRDRWYWTHMRTWWNHRYRRNTWHCMNKWNRVYDYNTDBRRHAANAWHBK
YNVYBHHNTDNVKDDTYATKBHBVHHDDNBNDDHNSGWKWKBNVDNHAYHNDDHDNTBDHVDHNRHNDKDHRNNVNN
KDNWBDYRHDYHVHDYDHWRBDHBHVYTDBBKTDRBKDWRTSBBTDNVNDDNWHNNKDHNKHDRWHHHNDYNDYNHH
RHBRDNWVYDRKYNBDHRNNKHDYHDYHBNDBRNWNNBHDBHDKHDYDNNNNHDWRNDRRWRHNHYDHNYNHBVBWG
NBHDNDHDHHWHYHHNDHNHNWNYRDWNNBNYRDYDDNDYNYNDDDNNWKVDNTBNHDHVNBDBHWMWHAHVWYNMD
WHHVWNHDHKHNBRNBDDNDHHNWBHNWDDWNKDNYRRYAYTACCDHNWYSDRRYHDNYRRTBDYWBRYWSGWDMVD
TDDYDWBNYNGDWWNHBAYBHYSWVRDHHNSKHDYHNDHHBHKDHKRYKKHNRDAVNRWNRYDNBHYBWBVNBDHDY
RHHHNHVYDHNWHSYRYDNNBDYNWBRWYDTYMDYNDYDTHBRWNWMMDHCRTKDWNABYTWNRDHKRYRHAYDNRK
YDTKBTWNHRDKNNDNHYNHYDBKWYHNDYDWNYDKYNBDBDDHDDBHHDYRKYWVNYDDNVWHVYHHDWRKKWTDW
RYHVRBNMNNNYRDYHDHDWYDHWNWWVHVNDRDNKTBTNHHDHYWNHRAWYRTWHDRHNNYDKRYNNDWRHNVYWD
DNNWHTNKNNDDBNNHNRRANHDNBNDMWHCDDAHRTYVVAHYRDKKYNKNYNRVBDAWNTDWHYSWVDHNDHYMWS
RSTBDABKRDNVDHKNBNDYVWHDHHKRDTHHWWNMMHRNNSDNDVBBTNDNNNDNHNNHHDNVRWMDWAHYDHNBD
TYNTBDNVWRDKKDWNDNTKHSRNCRRHAWCKHVRDTYDHRYNDDWNBBKBHNNDRNSDDHDNKDDVNVBHNWWDKB
KADNMDDHNDYRRRYNHRYAWYWKHRBDVDDYVTNHNDDNNVHMVWVNHDRWTCGRYDWHNHHDTNNNKDDWDVRBK
WBRGAARWWRYRRDTHNYWHMSWCRHRHNTNKKWHYRDWDKTDTWAYWTGRWYDDHBNYVBHHHVDVHVWNNNHVDB
DDAYNBNHDRDMSDMBYAKDNRYWWHNVYSRHRWNWDBDDBSRNNRHKHBVRHSWWKDHYRYVBHNNDNRTVAHSVN
KHDDDNKHNAMYWYNYHDAWDBNYDBDRNDTKTCANNDNRKBDNDNRHBNNWDHWYHKRHYVBMTNRVYRYNYDDKV
YVDNYDYTKHBWNBRNVVHDHHMMDDNHRRHBWHRMVYDYHNNTVYVVBWYHYVHRGWHBWHSWNNBKKHRVYWKHB
KNVKNYNHYRNHMBAGATTGGTCTCGGGYGTTCCATTAGACCCCTCATTACTTGGGCCATTACAGCCACCATTACTA
CGAGACCGTTGGAKKBSDDAGWDRTSYDWHNYBDHRNDDHWWNHDWRNRRAWBYDSANVNDBNYDWWMNNWBHYDNY
RDMMDWHNNVDWYNHVDBDHKKNRVRWDDVVBNNTBNVTRBYRNVVNTYYBDNYNHSVHRRCTWNYDYWDYRWNDWY
YHHDWVVRHKDBHDTDHBRDKWDHYRHBHHVHNNHRWNDRDYVHNVHNDNYAGHNRNVDHHNDHHDBKHBHNDRWHM
DRMHVMYRWBHWYTNDHAYAVWRDDTNVKDNKBDSRTRWKWYDHDDNAHNRWVRTADHSWHTRYKMYTVNYRBSWNV
MDVRDTVDNDNVNDSDHSMHNHDHBVTVDAWVDVDWHYKRHYDRWACRYYNNDHVHWNDHVDBKRHHHHHDWVHNVM
NVCDMHBRTNYBNWVBAVHDRYRVTDRHRHNDMHMDTWYHNNNHNKYHWMBDAHNMVRYYDCRYNSBYRHBBKKYBN
RBDBHBRWHVRWMSDHRYDRNBRDNMBRSNBWBWYYVWNVHTHBRRMYVRTAWBVDDCKBHBDDWHNRNRDDYHDRR
NHKHVDDBRNWBWVHNYDYBHNAWNHRDKHNVDDVNTRBYVYDNVDWCAVHNDWHMBKRBDWNCRWVRHNVYVNDHD
HRRNRRTTBWYWBRARHHRHBDNRNHWDKNNDHDYDBKHYNDNNNVNYNBHVWDVDHBDRTKDKHNKYKYRWWRMYR
HWNWYNNDHNDBBNNBDBBDDBNNBNYWWNBHNBNYBNNBNBGWNDHNMHDYNDYHDYNNDNBDWNBRYYDHKNBDH
RVNNNDYDHKKWHTRDWNWNNNBWDWRBVHHSVNYDHNDNDNNVDNBDHWDHDWYMHBKNWBDBNNWNDDWDNBBDH
DNKHHYDNBNHHHYWDDRMKHHDWRWKDHWHDHNNTNHHDBVRWDVBKDKBNDBKDDDBYVHHVHYDBKDHDBDBRH
NDBYDYHHHMGWRRTKWDYRYRSRDHDBYRWANYANKBNHHNHKYDWKNDDKWHYVHYVKWNWYRWBKNTHNYNTBD
DDRTYNNHDNHNWRMNBKDYDDYHHHDDHBHYKYVDNTDHSBNNHHNDHYKNNDHVNHTBNYNNAMDWBNTNWTYHM
RDBWDYBHVRDVDWDSWSTYYNBHDDRRHYMRHNNNDDBDNRYDRDBMSYRDTWHKDYDYKKDTNVNNNDYHRYYYH
VNWTKHBWNWDYGKRMVDAVHYDNWNDDBHRWAHBWSDDKRVGVYGTYAWNVHNNRNMBBKHNSWNKNDTRHNDNRV
DWWYKRYDHNSNDNNHVVDKNDHRDHVDMMNBNNNVHKDBDNBRDHDDWNDHRDTYBHDYNDDBWYDDNNBRYWHHM
SNWVVWWHSDDVWBWWNYYDHHYCDHDNDMNKHRYWVKVDNHRNNDYHATTTTBHWWBDHNWRMDMMHVNWRDYRRN
BBDNNDVNDYBRKAYYWBRWNBNBYDNMHDYHDDNNVDHDVKBHWSDYMKKWTBVRHVDNVNDSHHHMNWVDBDHHB
NNNNHDHAKTCSBDDVDBRHVRNDDWVRYHDBBBHMRDHBDYNNHRTBBNWNNDHDWBHWVNWHNVNYRNHNTHDTD
BKKWHDYVBNDNVNDRHRRDYNNWDNNDBVHBDNYKHNDRDHBBDRNKDNNRWBBDBDNYRHDRYYVYRNHVRDDRK
WNCTNBRABRHHNWYHHHNNNBNNSVNHWNHMHMDDDKWRYVBHMDNDGGGGTTTTCCGCWDHYTHWHNNDDDTDHR
BRAWSNYKBYRYNHNHHNDMVDYBHNDDTDDHVRVMNBNBHBTRRNRHDMKDYHNWDDMWWWTDDMNYSWADDBDBH
VKTHNVMDBDNWRHBDYNRRYWHDKDNBDYHNNBNNHHTGAAANKRHDHHBDSRTRKNNNDHTRHKBDRYYDVDWBK
DDDHNDDBDDBNNYNDNDWYDNBDNHNNWHNDNDWNBDHNVHDDDBDDDDWDBWSDHKDNHSRHRNYDDDBNHRYNN
YNRHNRWYBDDRVMHDHRYMHWDWYBRDYHRHDDBNNWHNHHYVDWYNWWAWNKNBHDYRDWDHVNDDNNNDDDHHN
RHNHWHMDKBDHNDNWNNHHKDANDHKBVWRVNHVTYHRRTHDAYRMHWWYMBNYVAYRRYHNNHDRWVHYVWYVNV
RYNKTTCTCGDWYDWVBDYVWVHNSDVNKVVDHNWHMNWHBWSWRVNHNYMDWHKHHRDHNBYDYVRHHRYRVDDHN
BDTDWNVRNSNDNRVHDYHNBMMDVWYRWNVKWDDNVRBHNWDRNBNYVKNCDKMNVWRNYDBMWDBHBDDYNBNAV
YVRWYHHNDRVRNHNWNDDWNKWVMWYWDHNDYHBHNYNKWRWNRHTKYMGSWBRHVNHRNNDTHDKBDHSWHHVNW
HNHDNAVWNNWBNDBRYBNRYBNNABRWTVRWYHHHNHBRDHDBRNDNRYBDNHRHDWMRDHBYKNNHHWHHNYVDN
WNNVNNARDDBHWDYBHBWVHNHRYNDNHNHDHHDDKRNWWHHVNRRYDHNDNNHRDDVNVRWTCRTMTBYDDRNHN

338
DNVWNYDHCNNBDDYWDBBDMDDVWHDNHYDNHNDHHDWDNHNNRRDDKDTYNYBDHCDTHKDDDBWHDHRWNNTSD
NDRNWNHHDBRVNHRWDRHWRBBVDNRWNWNVDNDDHHDKYDNYDBWNDNDDWVNYHBTVYNRNRWKHDRWDBBYKD
VRHNDWNHDDHNDKNWNMRNBDWNDDYHDBMHMVWNDHWRBHRTDRHVBWNNBDYDHVDDDNHVHNMDNDNWDHBWD
YYHDAAAGAAVRWWDHWNNTDBRYYRVDYRVWYWRBDYVDNRNTRDYNHWNYMHHYDBHBNVKWHRHMMDHMDTRHM
NVSMNRWBYKMRNDDDNRRDVNNYNNWKNBNNYDHYRDRBHNVNMWDTMHTKNVMYVWHDNHMYNRDBNWHHDYRVY
GTWARDHNYBTHWHNDTNRHHWYNVANHNYSKHHWNVDHVWHRDYVBYAAWSDBHWDBRHWBBBNDWMWHVVWWVRY
DNRVWNRYWRHWRHYDNVVTKBDHVHHBDSVNWVHBHHBNHHRDDVVDRBHWHSDDHKDWNHDDHVDDYNHHDNNRT
RWNSRYDDBHVDYDYHHDDVBBDDDHNNDYWDNKVNAMYDDDKWHYDHNRBYDDHRHYDHHNDWHRDVDDNNNHDHD
DDBDVRHYNNYNDTDWDWYVVTADHKYHKDYBBDHDWHNRVWBDNNNRRDNDNVYDWYRDNNNNHDBNNYDNYYNDV
DHNVHHVDWWNRYSRDYHNDWVMMDYNWSDHHRHBSHNNNWTRTHDYBNDNNNYNRNRHSNVWWNTNHBNNNYRNHR
DHKDHYDNKYDDNBDNNKRDBHNDDNWNNYNHBVWNVNDWYRRYBDWYDNNDHVVNRRWNVHYDHDVBDNVDHNHSH
TNNNVNHWNVVHVRKNKNNNNRVDYHVHDWRBNDWHDRHHBNDYNRDNYNDRVHGYNBVBTWHVDHRRWRVWSYHWD
BNNTDRVVAYHDBSDNWDHVVNNHNWRNHNNRDHWNYVGTVWHTVNBRNHDDBNHBDWYYWCAYVRKRAWYWBRKRN
NHBDYNWRRHHDDDYDHDYNHDBHNNKBYNDHDDHNAHDNNHNNDNHVYDWWNDVHNABYNDBVWYRCHMNHHNKDD
NNWYDTYHDWNBDDBDWBRWNNNNNAHBNNYNNBDDYNHYNNBBHNDNNDNVHWNDDWNNTNYRWDDYDNANWTNBD
BHNHDDNYRKRHVAMHYNHMKRDHNVDNKDDDNDHRYBDDHDDNGCBRVANHDWYRHHNHVKRMDYYDNRNNNNNWN
NVWWHNKWDHNDNHHNYNDNHDHDVNHHSRWBBDBNDWHHWNYKNBWHKRNDDHNBNDHBWRDKDDYBDHVVNNWYY
DDRADHVDNVBDDDNDNVNWBSNHVHDDNWNNHDHHNDNRNWDBWDNRAWYNDNHRHNRHHDNRWHDHMBWYVWNRW
DDKHNDNHDNWWKVBNKDRHNYDYHCTTRRRDNVWTRWYDNBBDYDNDRHYDRNBNBVNBDNKNDMRDHHWNDNYNN
NDYKVBHDYVNDRVWDDBKDWHNNWNBDDDYDTVRDDYBWDWADDYNHHDHHDNDBYRNVWRHHRHDBDVHNBVNNN
BNWWVRNNNYVDTVAYKDWHRNWDWNRWDRNDNNWNVDMWYDNHHNVVDVDDNNWDDDNVRDBDDNNWRBNNHHAYW
RYRRTTRYCGAYTTKGTMWWCCGADAHBHWHBNDDVNDVNNHDYKGRMCKMGGWKKYGTMRTMGYBYYHGDDNHNRW
NDHNNBRBDDRHBRHMMWSSCSRKWSCMWYYTWWDNNNNYHNBRBVNBNNBBNKRRGMCMTGMGGSMAYYGWKYYTR
AYSKCGRCSKYSTHMRWKRVVDWNDBRBHSMHNWKDYNKHNBDWVDNNDKDNNGDVRHNHDNHNHNNNNNVBHDDBK
NHNWHYVWVHHVDBDDHMDWBDNYNDMNHRMNHHNHYDMNWHVDADDVHHDDHWBDRHHHDHNDKHBNWMHRBHWYD
HMWHDHDNDNDNDRDNNNHNDDHNDNBWVWHBRHTDANTHDDNNDCRVWBDWNDHDYAVNDBNNDNMSWBDDVHVBW
AGNHNNNANYRNNRYWYNVNDWVYDWNVVNHDTHDHNNDRVTBNWVNNDBRNHWHSHAABKYNDVNMRKNDNBVYND
BDDNWNDDKVDHDVBDDDWDWYVNYYCDDHNHBNRTDRHADHHNVNWNNRNDHNHVDDMHBHVDNHHDDWVWBDHYV
NNVDHVDVRNDBHDTVRTDDDYWYBRDVDNDVDDDNVNDVHDMBNMDNNNYHKDYBNDHNNNDMRDNDNNDDHRWYN
THKWMRRHYNDHKNYNNRNVDRYWDYDDBWDNDDHHDNHRNBNNRDYYNHVRRNHNHNWWNBNNNBNRNHMDNKHWR
CDNRVDNMHYRNVDDHDWNDDHVNDDNYRTNVWVBHHNDVKNDDHHVNDVHRDKNNNHNHNRYBTDDDBWDYHNNHD
NHDHRHNBVDYNKNVWDMRDNVNHVDKDKWRNWVHYVHVDHBVDBSWVBNMNDCVDYNNWVDDDHNRDHNDHNWHRH
HNBVWHKTYAARBVDKHHDDNBHWNBNDNBDWVVHNHDNGWKRYNWRNYHDNHHNRHNNNDWHNWNDWHVNNHDNVA
HHKNNTRNNNNHNYTNDDDHVNNNVHVRDBBWHRWVDBBBNDNDWRHNDTBNNWDDKNHKRYRAKTHNNDHKHNNVN
VKNVMDDNNYVKRRHRDHRRHNHHNNNHNNVBDWHNCWRNNYDYVNYGKDVDVNVWHHAKHBDNHVTKBBVNDNBCA
HHDWDDTDHNHDKWNBWHNRWBRNNBDHVBDYDDYNWHRWDRNYDHVRKNNBVNHNDDDVHYRDNNNNNDDHNHBNT
DNBBNRVWHNNMNNVNHVRNCABBNNNNHYDNRHNNNVDNMBRWBNNHNKHDWVDBBNDVNNVDTKRNHDKNNHNBH
NDNVNDBNHNNHNHYBNDNNBKDNKBNNDWNNNDYBHYAHHVVYDNWVNNVBDAGGTCWDNDNNNDYDWHNNDHNYN
VNNDYHBNNVHWRDHBNBDVRRKNDDNRHYHMNDDHYHNNVNAHNHYHHWNHDDBBDDNDVNRNHNNNNARBGAWHD
DDYHYRYGHNKKRDNDMHHVBMNDNDDWNNADNHDNNDHMHKDYNDDNDDHDDVRMNHDHHBNDRNMDHDDNVDNNN
WDDNHNNNNHBDDVVHNNNNDNVWNWRYNVNDRNNRWRRHDHBYWNDRNVNHDRDYHHBMDVMNNRDYHWNNHNVHD
VDNNDHNDWNNNDNKNYVDHNVHWKHWANWVYSRNRDDNNHVAHDHNDWNYVBRVDNNVVABRDDNDHBNRNYBBRD
NNWWRYWAVYHNNWNNDVNNYNVWNWVHNYDWBNWNBNVNBDHDBDNRHDDDDDNNDDDVDNVBSDBHRDNNDDNNY
DNDHDNNBWDRNVHDKWDNNDDHYWNRWNHDRWWNHHWVNDDYDWNKWHNDBDNNVNHNYDNNRDNRVHKDHWVBBN
BDHYDRDNRHNVNYBBNDBVDNWVDDDNNDSHBKBDYHDYHDWNNNHRHWGBWVNHNNHNDHVHDRDVVHDYNNHNY
YNNNDHDKDRHRRDWNDYDNNNHNNBHDNNRDNDBHRNHKNNDHHNNHDHNDHNDDWNNWHDNNDMVNNHWNRHHVR
VDDDDHWHTWMHHSDBWDDNDHHVNHNHSHNRDNHMMBDHVHHNYVDNBNHDNKNNDHDBNNDHRDNAWMDNDVDNR
DDRHVDNBRDBDNHMNVNNDANHNNWDNWNDNBHHDYRRNWVNWVHVDNWWNDVHWRYHNHHNYHKNNHVHNNVRNB
RDHNHDRNWBNWNNDHNHNDKNNNBNTNWDDNGATHNYVVDYRWVNNWYHWMHNNBHNVNDHKHNYNDBHNBWDHNN
DNHDNNMVYNWVVAHRACGWRDWYVNDHDVHNHKDRWWHVNVNDHNNNDTNNWBDNRHBYDNNYDNNAMNNDMNDDD
WVDNNNVNDHDWNRDHHNNSDWNDBNNWRDHNNHDNHNRHDWBAKSWWYTRHDHDKDVBHNDNNYNHRWMDHKHNDV
NRRWBRHNNHSBWNRDDKDVNDHHDHVKTWBYNRHRWHDHNDHYRNADNNWWNDDNDNNHVDNHNNNHRNNNNHDNN
DDKRNNDDNDVHNDBWVHBNHBDYGHDWAHNYNDYDNNNNDKMVYMWBVKNVVHDVHWDNWNNHNNMKNHRDNNNKR
KKNNRHDHBDHNDVVNYRNHRYNDHVDNDRYHVNNHWKHNDRWHDWHHDVVVHWNNBNBDNGKYDDVWHVMHHNRHB
HDRRYNBHYNDHHVWVDNHKWBHVWRDHDVVHHHDBRDDVDTNWBDDDDDDBDDDHVRKBDHGTNHBYDHNDYBWHH
NHDHNRVHDDRVWYDVNYDNDCVAAGGARBDRHVRDHNNYNDHBDDVNMBHWNDKHHDRBWRNWDWDVDDDBYRWVN
YMKDHRNDRYHNNNNNNNHDHNNVNHVNNDYHNDHDHVDDHBDHNBNNHDNDDWTRDNNDYNWBDKWHDHNNNYNHS
MBDDNHVNNDYWVDHVHHNNHHNHNHNDBNDYNDDNDWVRHSNVWVTYRWDYNKWHDYKNBRHNDBDVHNNYRKBDW
HDWCYTCGARWRNHRYDSNWKVHNGWHNDKNNVRDHYDVNNYHYNRNVDNRNWWHNVNHRNDKHHRNNNKHNNDHNN
DDNDDHHDVHNBNDYNNDNDNHDNVNNTDHNHATSDDNHHDHBVNHDDADYRRHRKDDYNVVBWNNDDHBVBVNNND
HNHNDNNNRBVHDDVDTNNNNNAVNBRHWNNDDNRBNRDYNWNDBDHNRWWNAHDYNDKDDDHBHHDVNVDBNWNBH
VDWHBWBVNWBHBNHNNBNNNNDNHHDMKMMBHDDNDWNNRBDBYRNNWNNHDTMYDBTNKBHAHNHRBNNDHNDYR
WHDDHYDNNBRKNDBWVKNNNDNVVRDDHWWHDDVWRAVAYMDRKDHDDSRWHBDKKYRTWBMKTKWHBVHBYNNDW
SNDRKVHDDNYRVDWATTTTTGATTTTMNHKDNMNVWNTYNYVNYWDNNBDNWDWBKBRMMRHDWWAAYWRWYACAK
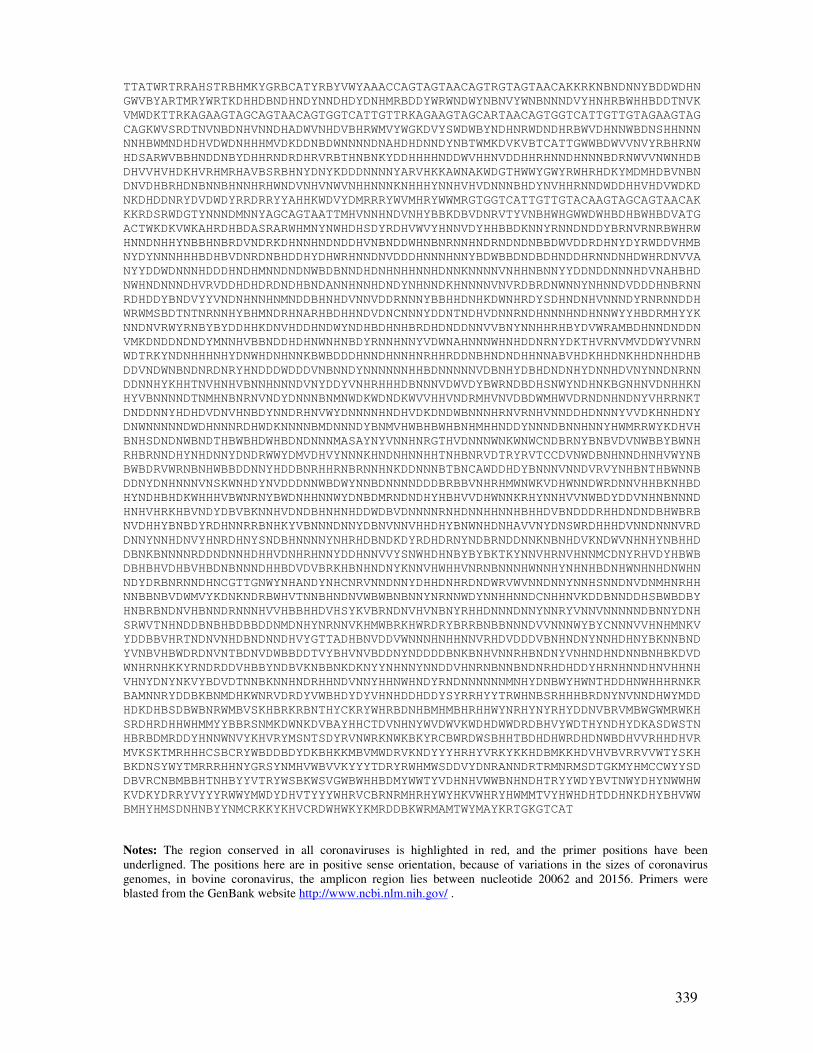
339
TTATWRTRRAHSTRBHMKYGRBCATYRBYVWYAAACCAGTAGTAACAGTRGTAGTAACAKKRKNBNDNNYBDDWDHN
GWVBYARTMRYWRTKDHHDBNDHNDYNNDHDYDNHMRBDDYWRWNDWYNBNVYWNBNNNDVYHNHRBWHHBDDTNVK
VMWDKTTRKAGAAGTAGCAGTAACAGTGGTCATTGTTRKAGAAGTAGCARTAACAGTGGTCATTGTTGTAGAAGTAG
CAGKWVSRDTNVNBDNHVNNDHADWVNHDVBHRWMVYWGKDVYSWDWBYNDHNRWDNDHRBWVDHNNWBDNSHHNNN
NNHBWMNDHDHVDWDNHHHMVDKDDNBDWNNNNDNAHDHDNNDYNBTWMKDVKVBTCATTGWWBDWVVNVYRBHRNW
HDSARWVBBHNDDNBYDHHRNDRDHRVRBTHNBNKYDDHHHHNDDWVHHNVDDHHRHNNDHNNNBDRNWVVNWNHDB
DHVVHVHDKHVRHMRHAVBSRBHNYDNYKDDDNNNNYARVHKKAWNAKWDGTHWWYGWYRWHRHDKYMDMHDBVNBN
DNVDHBRHDNBNNBHNNHRHWNDVNHVNWVNHHNNNKNHHHYNNHVHVDNNNBHDYNVHHRNNDWDDHHVHDVWDKD
NKDHDDNRYDVDWDYRRDRRYYAHHKWDVYDMRRRYWVMHRYWWMRGTGGTCATTGTTGTACAAGTAGCAGTAACAK
KKRDSRWDGTYNNNDMNNYAGCAGTAATTMHVNNHNDVNHYBBKDBVDNRVTYVNBHWHGWWDWHBDHBWHBDVATG
ACTWKDKVWKAHRDHBDASRARWHMNYNWHDHSDYRDHVWVYHNNVDYHHBBDKNNYRNNDNDDYBRNVRNRBWHRW
HNNDNHHYNBBHNBRDVNDRKDHNNHNDNDDHVNBNDDWHNBNRNNHNDRNDNDNBBDWVDDRDHNYDYRWDDVHMB
NYDYNNNHHHBDHBVDNRDNBHDDHYDHWRHNNDNVDDDHNNNHNNYBDWBBDNDBDHNDDHRNNDNHDWHRDNVVA
NYYDDWDNNNHDDDHNDHMNNDNDNWBDBNNDHDNHNHHNNHDNNKNNNNVNHHNBNNYYDDNDDNNNHDVNAHBHD
NWHNDNNNDHVRVDDHDHDRDNDHBNDANNHNNHDNDYNHNNDKHNNNNVNVRDBRDNWNNYNHNNDVDDDHNBRNN
RDHDDYBNDVYYVNDNHNNHNMNDDBHNHDVNNVDDRNNNYBBHHDNHKDWNHRDYSDHNDNHVNNNDYRNRNNDDH
WRWMSBDTNTNRNNHYBHMNDRHNARHBDHHNDVDNCNNNYDDNTNDHVDNNRNDHNNNHNDHNNWYYHBDRMHYYK
NNDNVRWYRNBYBYDDHHKDNVHDDHNDWYNDHBDHNHBRDHDNDDNNVVBNYNNHHRHBYDVWRAMBDHNNDNDDN
VMKDNDDNDNDYMNNHVBBNDDHDHNWNHNBDYRNNHNNYVDWNAHNNNWHNHDDNRNYDKTHVRNVMVDDWYVNRN
WDTRKYNDNHHHNHYDNWHDNHNNKBWBDDDHNNDHNNHNRHHRDDNBHNDNDHHNNABVHDKHHDNKHHDNHHDHB
DDVNDWNBNDNRDNRYHNDDDWDDDVNBNNDYNNNNNNHHBDNNNNNVDBNHYDBHDNDNHYDNNHDVNYNNDNRNN
DDNNHYKHHTNVHNHVBNNHNNNDVNYDDYVNHRHHHDBNNNVDWVDYBWRNDBDHSNWYNDHNKBGNHNVDNHHKN
HYVBNNNNDTNMHNBNRNVNDYDNNNBNMNWDKWDNDKWVVHHVNDRMHVNVDBDWMHWVDRNDNHNDNYVHRRNKT
DNDDNNYHDHDVDNVHNBDYNNDRHNVWYDNNNNHNDHVDKDNDWBNNNHRNVRNHVNNDDHDNNNYVVDKHNHDNY
DNWNNNNNDWDHNNNRDHWDKNNNNBMDNNNDYBNMVHWBHBWHBNHMHHNDDYNNNDBNNHNNYHWMRRWYKDHVH
BNHSDNDNWBNDTHBWBHDWHBDNDNNNMASAYNYVNNHNRGTHVDNNNWNKWNWCNDBRNYBNBVDVNWBBYBWNH
RHBRNNDHYNHDNNYDNDRWWYDMVDHVYNNNKHNDNHNNHHTNHBNRVDTRYRVTCCDVNWDBNHNNDHNHVWYNB
BWBDRVWRNBNHWBBDDNNYHDDBNRHHRNBRNNHNKDDNNNBTBNCAWDDHDYBNNNVNNDVRVYNHBNTHBWNNB
DDNYDNHNNNVNSKWNHDYNVDDDNNWBDWYNNBDNNNNDDDBRBBVNHRHMWNWKVDHWNNDWRDNNVHHBKNHBD
HYNDHBHDKWHHHVBWNRNYBWDNHHNNWYDNBDMRNDNDHYHBHVVDHWNNKRHYNNHVVNWBDYDDVNHNBNNND
HNHVHRKHBVNDYDBVBKNNHVDNDBHNHNHDDWDBVDNNNNRNHDNNHHNNHBHHDVBNDDDRHHDNDNDBHWBRB
NVDHHYBNBDYRDHNNRRBNHKYVBNNNDNNYDBNVNNVHHDHYBNWNHDNHAVVNYDNSWRDHHHDVNNDNNNVRD
DNNYNNHDNVYHNRDHNYSNDBHNNNNYNHRHDBNDKDYRDHDRNYNDBRNDDNNKNBNHDVKNDWVNHNHYNBHHD
DBNKBNNNNRDDNDNNHDHHVDNHRHNNYDDHNNVVYSNWHDHNBYBYBKTKYNNVHRNVHNNMCDNYRHVDYHBWB
DBHBHVDHBVHBDNBNNNDHHBDVDVBRKHBNHNDNYKNNVHWHHVNRNBNNNHWNNHYNHNHBDNHWNHNHDNWHN
NDYDRBNRNNDHNCGTTGNWYNHANDYNHCNRVNNDNNYDHHDNHRDNDWRVWVNNDNNYNNHSNNDNVDNMHNRHH
NNBBNBVDWMVYKDNKNDRBWHVTNNBHNDNVWBWBNBNNYNRNNWDYNNHHNNDCNHHNVKDDBNNDDHSBWBDBY
HNBRBNDNVHBNNDRNNNHVVHBBHHDVHSYKVBRNDNVHVNBNYRHHDNNNDNNYNNRYVNNVNNNNNDBNNYDNH
SRWVTNHNDDBNBHBDBBDDNMDNHYNRNNVKHMWBRKHWRDRYBRRBNBBNNNDVVNNNWYBYCNNNVVHNHMNKV
YDDBBVHRTNDNVNHDBNDNNDHVYGTTADHBNVDDVWNNNHNHHNNVRHDVDDDVBNHNDNYNNHDHNYBKNNBND
YVNBVHBWDRDNVNTBDNVDWBBDDTVYBHVNVBDDNYNDDDDBNKBNHVNNRHBNDNYVNHNDHNDNNBNHBKDVD
WNHRNHKKYRNDRDDVHBBYNDBVKNBBNKDKNYYNHNNYNNDDVHNRNBNNBNDNRHDHDDYHRNHNNDHNVHHNH
VHNYDNYNKVYBDVDTNNBKNNHNDRHHNDVNNYHHNWHNDYRNDNNNNNNMNHYDNBWYHWNTHDDHNWHHHRNKR
BAMNNRYDDBKBNMDHKWNRVDRDYVWBHDYDYVHNHDDHDDYSYRRHYYTRWHNBSRHHHBRDNYNVNNDHWYMDD
HDKDHBSDBWBNRWMBVSKHBRKRBNTHYCKRYWHRBDNHBMHMBHRHHWYNRHYNYRHYDDNVBRVMBWGWMRWKH
SRDHRDHHWHMMYYBBRSNMKDWNKDVBAYHHCTDVNHNYWVDWVKWDHDWWDRDBHVYWDTHYNDHYDKASDWSTN
HBRBDMRDDYHNNWNVYKHVRYMSNTSDYRVNWRKNWKBKYRCBWRDWSBHHTBDHDHWRDHDNWBDHVVRHHDHVR
MVKSKTMRHHHCSBCRYWBDDBDYDKBHKKMBVMWDRVKNDYYYHRHYVRKYKKHDBMKKHDVHVBVRRVVWTYSKH
BKDNSYWYTMRRRHHNYGRSYNMHVWBVVKYYYTDRYRWHMWSDDVYDNRANNDRTRMNRMSDTGKMYHMCCWYYSD
DBVRCNBMBBHTNHBYYVTRYWSBKWSVGWBWHHBDMYWWTYVDHNHVWWBNHNDHTRYYWDYBVTNWYDHYNWWHW
KVDKYDRRYVYYYRWWYMWDYDHVTYYYWHRVCBRNRMHRHYWYHKVWHRYHWMMTVYHWHDHTDDHNKDHYBHVWW
BMHYHMSDNHNBYYNMCRKKYKHVCRDWHWKYKMRDDBKWRMAMTWYMAYKRTGKGTCAT
Notes: The region conserved in all coronaviruses is highlighted in red, and the primer positions have been
underligned. The positions here are in positive sense orientation, because of variations in the sizes of coronavirus
genomes, in bovine coronavirus, the amplicon region lies between nucleotide 20062 and 20156. Primers were
blasted from the GenBank website http://www.ncbi.nlm.nih.gov/ .
Copyright © 2022 FDOKUMEN