
Influence of the preparation method on the hydrotreating activity of MoS2/Al2O3 extrudates: A Raman...
11
Journal of Catalysis 243 (2006) 292–302 www.elsevier.com/locate/jcat Influence of the preparation method on the hydrotreating activity of MoS 2 /Al 2 O 3 extrudates: A Raman microspectroscopy study on the genesis of the active phase Jaap A. Bergwerff a , Marcel Jansen b , Bob (R.) G. Leliveld b , Tom Visser a , Krijn P. de Jong a , Bert M. Weckhuysen a,∗ a Inorganic Chemistry and Catalysis, Department of Chemistry, Utrecht University, Sorbonnelaan 16, 3508 TB Utrecht, The Netherlands b Albemarle Catalysts BV, Nieuwendammerkade 1-3, 1022 AB Amsterdam, The Netherlands Received 8 May 2006; revised 7 July 2006; accepted 21 July 2006 Available online 14 September 2006 Abstract Raman microspectroscopy was used to study the preparation of industrial MoS 2 /Al 2 O 3 extrudates. Using this technique, the influence of the impregnation solution composition on the nature and macrodistribution of Mo complexes inside these catalyst bodies was evaluated during their preparation process (impregnation, drying, and calcination). It was found that poor dispersion of the MoO x phase in the calcined samples can be brought about by the formation of bulk (NH 4 ) 3 [Al(OH) 6 Mo 6 O 18 ] during impregnation or redistribution of Mo complexes during drying. The formation of crystalline MoO 3 and Al 2 (MoO 4 ) 3 in the oxidic precursors leads to a poorly dispersed MoS 2 phase in the final catalyst and significantly lower hydrodesulfurization activity. The spatially resolved information that can be obtained, and its inherent sensitivity for the detection of crystalline phases make Raman microspectroscopy a powerful characterization technique for studying the preparation of industrial supported metal oxide catalysts. © 2006 Elsevier Inc. All rights reserved. Keywords: Hydrodesulfurization; Raman spectroscopy; Microspectroscopy; MO/Al 2 O 3 ; Extrudates; Catalyst preparation 1. Introduction To obtain transportation fuels, crude oil fractions are ex- posed to several hydrotreating steps to remove S-, N-, and metal-containing compounds in refineries [1]. Due to increas- ingly strict regulations, research has been dedicated to the preparation of more active catalytic systems for this process. Despite the development of alternatives, such as noble-metal catalysts [2], unsupported bulk MoS 2 catalysts [3,4] and sup- ported metal–phosphide systems [5,6], supported (Co/Ni)MoS 2 catalysts are still predominantly used in most refineries, and their preparation remains an important industrial process. Throughout the years, numerous studies have been carried out to determine the influence of different preparation parameters * Corresponding author. Fax: +31 302511027. E-mail address: [email protected] (B.M. Weckhuysen). on the structure and activity of these important catalysts [7–13]. However, the translation from recipes for the laboratory-scale preparation of the optimal supported catalyst to industrial-scale catalyst preparation is less well documented in the open litera- ture. Specific problems can arise when the support is changed from powders to extrudates [14–16], whereas temperature and concentration profiles across catalyst beds often make large- scale preparation difficult to control. For decades, Raman spectroscopy has been an important technique for characterizing supported oxide catalysts [17–19]. More recently, Raman microscopy has also found its way into heterogeneous catalysis research. The spatial resolution ob- tained in this way has, for instance, been exploited to follow the spreading of MoO 3 on an Al 2 O 3 surface [20,21], monitor re- gions of different crystallinity in MoVW mixed-oxide catalysts [22], and study the reaction of molecules on catalytic surfaces [23] or even individual metal particles [24]. In recent years, Ra- man microspectroscopy [25] and other spatially resolved spec- 0021-9517/$ – see front matter © 2006 Elsevier Inc. All rights reserved. doi:10.1016/j.jcat.2006.07.022
Transcript of Influence of the preparation method on the hydrotreating activity of MoS2/Al2O3 extrudates: A Raman...

Journal of Catalysis 243 (2006) 292–302
www.elsevier.com/locate/jcat
Influence of the preparation method on the hydrotreating activity ofMoS2/Al2O3 extrudates: A Raman microspectroscopy study on the genesis
of the active phase
Jaap A. Bergwerff a, Marcel Jansen b, Bob (R.) G. Leliveld b, Tom Visser a, Krijn P. de Jong a,Bert M. Weckhuysen a,∗
a Inorganic Chemistry and Catalysis, Department of Chemistry, Utrecht University, Sorbonnelaan 16, 3508 TB Utrecht, The Netherlandsb Albemarle Catalysts BV, Nieuwendammerkade 1-3, 1022 AB Amsterdam, The Netherlands
Received 8 May 2006; revised 7 July 2006; accepted 21 July 2006
Available online 14 September 2006
Abstract
Raman microspectroscopy was used to study the preparation of industrial MoS2/Al2O3 extrudates. Using this technique, the influence of theimpregnation solution composition on the nature and macrodistribution of Mo complexes inside these catalyst bodies was evaluated during theirpreparation process (impregnation, drying, and calcination). It was found that poor dispersion of the MoOx phase in the calcined samples canbe brought about by the formation of bulk (NH4)3[Al(OH)6Mo6O18] during impregnation or redistribution of Mo complexes during drying.The formation of crystalline MoO3 and Al2(MoO4)3 in the oxidic precursors leads to a poorly dispersed MoS2 phase in the final catalyst andsignificantly lower hydrodesulfurization activity. The spatially resolved information that can be obtained, and its inherent sensitivity for thedetection of crystalline phases make Raman microspectroscopy a powerful characterization technique for studying the preparation of industrialsupported metal oxide catalysts.© 2006 Elsevier Inc. All rights reserved.
Keywords: Hydrodesulfurization; Raman spectroscopy; Microspectroscopy; MO/Al2O3; Extrudates; Catalyst preparation
1. Introduction
To obtain transportation fuels, crude oil fractions are ex-posed to several hydrotreating steps to remove S-, N-, andmetal-containing compounds in refineries [1]. Due to increas-ingly strict regulations, research has been dedicated to thepreparation of more active catalytic systems for this process.Despite the development of alternatives, such as noble-metalcatalysts [2], unsupported bulk MoS2 catalysts [3,4] and sup-ported metal–phosphide systems [5,6], supported (Co/Ni)MoS2
catalysts are still predominantly used in most refineries, andtheir preparation remains an important industrial process.Throughout the years, numerous studies have been carried outto determine the influence of different preparation parameters
* Corresponding author. Fax: +31 302511027.E-mail address: [email protected] (B.M. Weckhuysen).
0021-9517/$ – see front matter © 2006 Elsevier Inc. All rights reserved.doi:10.1016/j.jcat.2006.07.022
on the structure and activity of these important catalysts [7–13].However, the translation from recipes for the laboratory-scalepreparation of the optimal supported catalyst to industrial-scalecatalyst preparation is less well documented in the open litera-ture. Specific problems can arise when the support is changedfrom powders to extrudates [14–16], whereas temperature andconcentration profiles across catalyst beds often make large-scale preparation difficult to control.
For decades, Raman spectroscopy has been an importanttechnique for characterizing supported oxide catalysts [17–19].More recently, Raman microscopy has also found its way intoheterogeneous catalysis research. The spatial resolution ob-tained in this way has, for instance, been exploited to follow thespreading of MoO3 on an Al2O3 surface [20,21], monitor re-gions of different crystallinity in MoVW mixed-oxide catalysts[22], and study the reaction of molecules on catalytic surfaces[23] or even individual metal particles [24]. In recent years, Ra-man microspectroscopy [25] and other spatially resolved spec-

J.A. Bergwerff et al. / Journal of Catalysis 243 (2006) 292–302 293
troscopic techniques, such as UV–vis microspectroscopy [26]and magnetic resonance imaging [27], have been applied tomonitor the phenomena occurring during the preparation ofmm-scale supported catalyst bodies. The application of thesetools provides new opportunities to study the physicochemicalprocesses occurring during the preparation of supported cata-lyst bodies and allow for better control of the dispersion anddistribution of the active phase.
A previous study showed how Raman microspectroscopycan be applied to study the impregnation of Mo6+ solutionsonto 3-mm Al2O3 pellets [25]. A strong interaction betweenMo complexes and the Al2O3 support was found to lead to theformation of a [Al(OH)6Mo6O18] precipitate or the occurrenceof Mo concentration gradients inside the impregnated pellets.In the current study, the technique is applied to monitor thenature and macrodistribution of the MoOx phase in 1.5-mmMo/Al2O3 extrudates during preparation. In this way, the im-plications of the processes described above on the nature andactivity of the final MoS2 phase can be evaluated. At the sametime, the applicability of Raman microspectroscopy in studyingthe preparation of smaller catalyst extrudates can be put to thetest.
A series of catalysts was prepared using (NH4)6Mo7O24-(AHM) as the Mo precursor salt. The influence of pH of theimpregnation solution and the addition of citric acid as a com-plexing agent on Mo speciation in the extrudates after impreg-nation, drying, and calcination was evaluated. The formationof crystalline phases can result from either the formation ofbulk (NH4)3[Al(OH)6Mo6O18] during impregnation or redistri-bution of the Mo phase during drying. Both phenomena can beprevented by the addition of citric acid to the impregnation so-lution. Subsequently, the activity of the different samples in thehydrotreatment of a light gas–oil (LGO) feed was tested. A cor-relation is found between the dispersion of the MoOx phase inthe calcined catalysts, the dispersion of the MoS2 phase underreaction conditions, and the hydrodesulfurization (HDS) activ-ity of the different catalyst samples.
2. Experimental
Pore volume impregnation was carried out on 20-g batchesof cylindrical γ -Al2O3 extrudates (1.5 mm diameter and 10–15 mm long). A 5% excess of solution was used in all cases toensure complete wetting of all extrudates. The pore volume ofthis support was 0.86 ml/g, and its surface area was 245 m2/g.After impregnation, the wet samples were left for 1 h in a closedcontainer before drying, which was done by passing hot airover the catalyst bodies. Drying was considered complete whenthe temperature of the catalyst bed reached a temperature of120 ◦C. During aging and drying, the extrudates were kept inconstant motion by rotation of the impregnation vessel. Thedried extrudates were heated to 500 ◦C at a rate of 5 ◦C/minand calcined at this temperature for 1 h in stagnant air.
Two series of Mo/Al2O3 catalysts were prepared using Mosolutions with concentrations of 1.3 M and 1.8 M Mo, yieldingtheoretical MoO3 loadings in the calcined catalyst of 14.5 wt%and 19.0 wt%, respectively. Within each series, impregnation
Table 1Preparation parameters and MoO3 loading of the different samples used in thisstudy
Sample code Mo conc.(M)
Citrate conc.(M)
pH Ageingtime (h)
MoO3 loading(wt%)
1.3Mo-pH 6 1.3 0 6 1 13.51.3Mo-pH 9 1.3 0 9 1 14.51.3Mo–citrate-l 1.3 1.3 0.5 1 14.51.3Mo–citrate-s 1.3 1.3 0.5 − 14.61.8Mo-pH 6 1.8 0 6 1 18.71.8Mo-pH 9 1.8 0 9 1 19.11.8Mo–citrate-l 1.8 1.8 0.5 1 19.01.8Mo–citrate-s 1.8 1.8 0.5 − 19.1
was carried out with three AHM (Acros, p.a.) solutions of vary-ing compositions. Besides AHM solutions at their natural pHof 6, basic AHM-solutions (pH 9) were prepared by adding 25aqueous wt% NH4OH solution (Baker, p.a.). A solution con-taining Mo–citrate complexes was prepared by adding citricacid (Merck, p.a.) in a Mo:citric acid ratio of 1:1. The effectof aging was studied in the case of the Mo–citrate solutions,where the aging step was omitted in an additional experimentand drying began immediately after impregnation. The codesfor the different catalysts and procedures used for their prepa-ration are summarized in Table 1.
For Raman microspectroscopy measurements, Mo/Al2O3extrudates were bisected and spectra recorded on the result-ing cross-section, with no additional treatment. The roughnessof the thus-created surface means that the total intensity of theinelastically scattered light varies when measurements are car-ried out at different positions on the sample. For presentationpurposes, all spectra are therefore scaled to the fluorescencebackground. A Kaiser RXN spectrometer equipped with a 785-nm diode laser was used in combination with a Hololab 5000Raman microscope. A 10× objective was used for beam fo-cusing and collection of scattered radiation, resulting in a spotsize on the sample of approximately 50 µm. The Raman laserpower on the sample was approximately 10 mW. Care wastaken to prevent beam damage by comparing the spectra thusobtained to spectra obtained with lower laser power. X-ray flu-orescence (XRF) and X-ray diffraction (XRD) analyses wereperformed on crushed extrudates after calcination. XRD mea-surements were carried out on a Bruker-AXS D8 Advancepowder X-ray diffractometer, equipped with automatic diver-gence slit and a Våntec-1 detector. The radiation source wascobalt Kα1,2 (λ = 1.79026 Å, 30 kV, and 45 mA). To determinethe distribution of Mo over the calcined extrudates, a scanningelectron microscopy (SEM) study was preformed in combina-tion with energy-dispersive analysis of X-rays (EDX). Sampleswere embedded in Castoglas and polished on SiC paper with2-propanol. Samples were then carbon-coated, and line scanswere recorded across the cross-section of bisected extrudateswith a step size of 10 µm at a 20-kV acceleration voltage.
To determine the Mo loading at which the dispersion limitis reached and bulk MoO3 begins to form on the surface of theparticular γ -Al2O3 used in this study, a series of Mo/Al2O3samples with different Mo loadings was prepared. Toward this

294 J.A. Bergwerff et al. / Journal of Catalysis 243 (2006) 292–302
Table 2Properties of the light gas oil used in the hydrotreatment tests
Sulfur (wt%) 1.2Nitrogen (ppm wt) 102
Mono aromatics (wt%) 16.5Di aromatics (wt%) 11.0Di + aromatics (wt%) 0.8Total aromatics (wt%) 28.3
Distillation (◦C)
Initial boiling point 178.4
10 vol% 224.030 vol% 261.450 vol% 283.870 vol% 309.390 vol% 347.8
Final boiling point 372.0
end, impregnation was carried out on a 150–500 µm sieve frac-tion of crushed extrudates, using AHM and equimolar Mo (exAHM):citric acid solutions with Mo concentrations of 1.2, 1.4,1.6, 1.8, and 2.0 M. These samples were dried at 120 ◦C andcalcined at 500 ◦C for 6 h. Raman spectra were recorded on thecalcined samples.
The catalytic activity of the different extrudates was evalu-ated in the hydrotreatment of a light gas–oil fraction. Charac-teristics of the feedstock are given in Table 2. A 5.9-g sam-ple of each catalyst was loaded into a multitubular setup inwhich 10 catalyst samples can be tested simultaneously. Reac-tion was carried out at a weight hourly space velocity (WHSV)of 1.7 gfeed g−1
cat h−1, a H2/oil ratio of 200 Nl (H2)/lfeed, anda total pressure of 60 bar. The sulfur content of the oil wasdetermined after reaction at 345, 360, and 375 ◦C using XRFfor samples containing >0.06 wt% S and UV-detection forsamples containing <0.06 wt% S. The relative error in thesemeasurements is <2%. Sulfidation of the catalysts was carriedout at 345 ◦C by adding dimethyldisulfide (DMDS) to the oilstream. After reaction, the catalyst samples were unloaded andstored in oil to prevent reoxidation.
For TEM analysis on the MoS2/Al2O3 extrudates, whole ex-trudates were rinsed with toluene to remove the oil and vacuum-impregnated with the standard mixture Ultra-Low ViscosityKit, hard version (Polaron Instruments). The mixture was trans-ferred into a polyethylene capsule (BEEM) and mixed withfresh embedding medium. The epoxy embedding medium washardened for at least 48 h under N2 (0.2 MPa, 338 K). Sec-tions of about 60 nm thickness were prepared using a LeicaReichert Ultracut-S ultramicrotome. Shortly after preparation,the sections were investigated with a JEOL JEM-2010F-HRTEM, with a 200-keV electron beam (Field Emission Gun,FEG). SEM analyses were performed on bisected embeddedMoS2/Al2O3 extrudates with a Leo Gemini 1550 SEM (FieldEmission Gun), equipped with an Oxford INCA EDX system.EDX analysis was performed at 15 keV. To check for any pos-sible reoxidation, Raman microspectroscopy was carried out onthese samples as well.
Fig. 1. Raman spectra recorded on calcined Mo/Al2O3 powder samples pre-pared from AHM-pH 6 (left) and AHM–citrate (right) solutions of differentconcentration.
3. Results and discussion
3.1. Mo/Al2O3 powder catalysts
Mo/Al2O3 and other supported metal-oxide catalysts are of-ten referred to as monolayer systems, due to the tendency of theactive phase to spread over the support at elevated temperatures[28]. In this way, an overlayer containing an amorphous MoOx
phase is formed on the support surface, and the surface free en-ergy of the system is minimized. Thermodynamics dictate thatbulk MoO3 is only formed when the Al2O3 surface is com-pletely covered. The Raman spectra of powdered Mo/Al2O3samples prepared from AHM-pH 6 and AHM–citrate solutionsof different concentration are shown in Fig. 1. For the AHM-pH 6 samples, an amorphous MoOx phase can be seen in thesamples prepared from 1.2–1.8 M Mo solutions, correspond-ing to 12–19 wt% MoO3 in the final catalyst. A broad band at∼980 cm−1 is observed in the Raman spectra recorded on thesesamples. The sample prepared from a 2.0 M Mo AHM-pH 6 so-lution (21 wt% MoO3) clearly contained bulk MoO3; intensebands at 995, 819, 667, 378, 337, 290, and 242 cm−1 werepresent in the spectrum [19]. Apparently, saturation coveragewas reached at a MoO3 loading of 19–21 wt%, correspondingto a theoretical surface coverage of 4.0–4.4 Mo atoms nm−2, ingood agreement with values reported in the literature [18,19].Note that for preparation of the Mo/Al2O3 extrudates, 1.3 and1.8 M Mo solutions were used, resulting in an overall MoO3loading below the dispersion limit. In other words, the totalAl2O3 surface present in the extrudates should be sufficient toaccommodate all Mo in an amorphous MoOx phase. In con-trast to the AHM-pH 6 samples, no bulk MoO3 was detected inany of the AHM–citrate samples, even when a 2.0 M Mo so-lution was used. The formation of an amorphous MoOx phasewas found in the sample prepared from a 1.6 M Mo solution,judging from the position of the band maximum at 970 cm−1.At higher Mo loadings, a band at 1006 cm−1 was observed thatis generally assigned to Al2(MoO4)3 [29]. But the low intensityand broadness of this band suggest that this is not a crystallinephase.

J.A. Bergwerff et al. / Journal of Catalysis 243 (2006) 292–302 295
Fig. 2. Raman spectra recorded on bisected extrudates, 1 h after impregnation with 1.8 M AHM-pH 6, AHM-pH 9, and AHM–citrate solutions and 5 min afterimpregnation with a 1.8 M AHM–citrate solution. The distance of the measurement spot from the core of the extrudates is indicated on the right.
3.2. Impregnation of Al2O3 extrudates
The speciation of Mo6+-complexes in AHM solutions atmoderate pH is well established and can be easily monitoredusing Raman spectroscopy [19,30]. At the natural pH of AHMsolutions (pH 5–6), Mo7O6−
24 is the predominant species, andthe corresponding Raman spectrum exhibits bands at 940, 901,and 360 cm−1 [19,30]. At higher pH, MoO2−
4 is formed, asreaction (1) proceeds to the right. MoO2−
4 is the only com-plex present in the AHM-pH 9 solutions used in this study. ItsRaman spectrum shows characteristic peaks at 895, 840, and320 cm−1 [19,30]:
Mo7O6−24 + 4H2O ↔ 7MoO2−
4 + 8H+. (1)
Raman spectra recorded on the bisected extrudates after im-pregnation with the different AHM solutions are presented inFig. 2. After impregnation with the AHM-pH 6 solution, peaksat 895 and 940 cm−1 are observed for all positions inside theextrudates, which are superimposed on the fluorescence back-ground, probably caused by impurities in the Al2O3 support.They demonstrate the presence of both MoO2−
4 and Mo7O6−24
anions inside the Al2O3 pores. The formation of MoO2−4 shows
that the pH of the solution inside the Al2O3 was increased com-pared with the impregnation solution. This is caused by theprotonation of basic hydroxyl groups on the Al2O3 surface.In the spectrum recorded on the outer surface, intense peaksat 947, 899, 572, 355, and 218 cm−1 indicate the presence ofAl(OH)6Mo6O3−
18 anions [31,32]. The observation of a whiteprecipitate and the absence of a fluorescence background in theRaman spectrum indicate that an Al(OH)6Mo6O3−
18 compoundis covering the Al2O3 on the outside of the extrudates. The ob-servation of bands at 895 and 316 cm−1 in spectra recordedthroughout the wet extrudates shows that impregnation withthe AHM-pH 9 solution leads to a homogeneous distributionof MoO2−
4 in the extrudates.A whole range of different Mo–citrate complexes can be
present in AHM–citric acid solutions. Stable complexes aredocumented in which the Mo:citrate ratio (2:1, 1:1, and 1:2),the number of Mo atoms (1, 2, and 4), and the protonationstate varies with pH and concentration [33,34]. Formation con-stants, as reported in literature for these different complexes,
have been determined using dilute solutions [34]. From cal-culations using these formation constants, Mo4(citrate)2O4−
11can be expected to be the predominant complex present inthe AHM–citrate solutions used in this study [34]. It must benoted, however, that using these values to determine the con-stitution of the highly concentrated solutions is not withoutrisk. The Raman spectrum of the impregnation solution showsbands at 942, 897, and 860 cm−1. In the case of the AHM–citrate samples, measurements were also carried out directlyafter impregnation. In this way, the distribution of Mo com-plexes before the start of the drying process can be obtainedfor all Mo/Al2O3 samples described in this study. In all cases,peaks are observed exclusively at 942, 897, and 860 cm−1, in-dicating that the Mo4(citrate)2O4−
11 complex remained intactinside the Al2O3 pores after impregnation. Moreover the distri-bution of Mo complexes 5 min after impregnation seems to behomogeneous, judging from the constant intensity of the MoO2tvibrations compared with the Al2O3 fluorescence background.In a previous study, the transport of this complex through theAl2O3 pore system was found to be slow, and a homogeneousdistribution of Mo4(citrate)2O4−
11 was found only 3 h after im-pregnation of 3-mm Al2O3 pellets with a 1 M Mo AHM–citratesolution [25]. This was attributed to the strong Coulomb inter-action between the negatively charged Mo complexes and theAl2O3 surface, which is protonated due to the low pH of theimpregnation solution. In this case, however, the concentrationof the impregnation solution was higher, and the diameter of theextrudates was half that of the pellets used before. Both changeswill favor a uniform distribution of Mo complexes. Apparently,this resulted in a homogeneous distribution of the Mo–citratecomplexes within 5 min after impregnation despite the interac-tion between Mo4(citrate)2O4−
11 and the Al2O3 surface.
3.3. Drying and calcination of Mo/Al2O3 extrudates
Formation of a layer of white powder on the external sur-face was observed by visual inspection of dried and calcinedextrudates prepared from AHM-pH 6 solutions, regardless ofMo loading. In approximately 50% of all calcined AHM-pH 6extrudates, areas of different color were also observed on theinside of these extrudates. Both phenomena are clearly visi-ble in the SEM image in Fig. 3, which shows cross-sections
296 J.A. Bergwerff et al. / Journal of Catalysis 243 (2006) 292–302
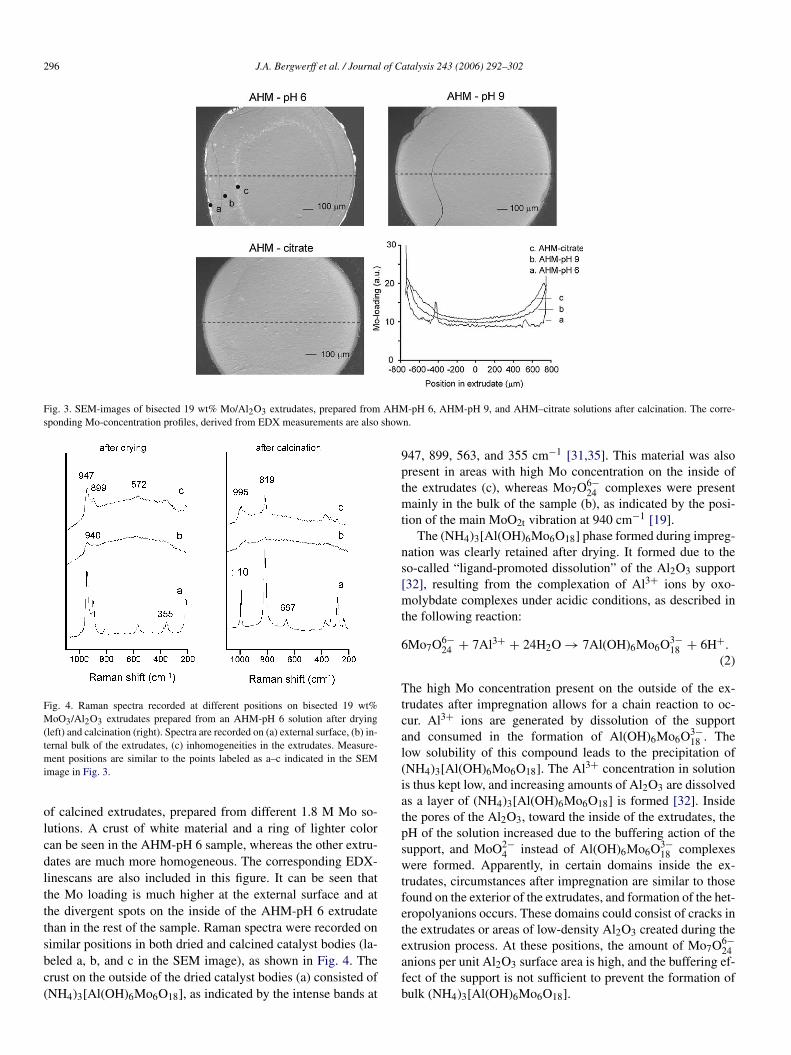
Fig. 3. SEM-images of bisected 19 wt% Mo/Al2O3 extrudates, prepared from AHM-pH 6, AHM-pH 9, and AHM–citrate solutions after calcination. The corre-sponding Mo-concentration profiles, derived from EDX measurements are also shown.
Fig. 4. Raman spectra recorded at different positions on bisected 19 wt%MoO3/Al2O3 extrudates prepared from an AHM-pH 6 solution after drying(left) and calcination (right). Spectra are recorded on (a) external surface, (b) in-ternal bulk of the extrudates, (c) inhomogeneities in the extrudates. Measure-ment positions are similar to the points labeled as a–c indicated in the SEMimage in Fig. 3.
of calcined extrudates, prepared from different 1.8 M Mo so-lutions. A crust of white material and a ring of lighter colorcan be seen in the AHM-pH 6 sample, whereas the other extru-dates are much more homogeneous. The corresponding EDX-linescans are also included in this figure. It can be seen thatthe Mo loading is much higher at the external surface and atthe divergent spots on the inside of the AHM-pH 6 extrudatethan in the rest of the sample. Raman spectra were recorded onsimilar positions in both dried and calcined catalyst bodies (la-beled a, b, and c in the SEM image), as shown in Fig. 4. Thecrust on the outside of the dried catalyst bodies (a) consisted of(NH4)3[Al(OH)6Mo6O18], as indicated by the intense bands at
947, 899, 563, and 355 cm−1 [31,35]. This material was alsopresent in areas with high Mo concentration on the inside ofthe extrudates (c), whereas Mo7O6−
24 complexes were presentmainly in the bulk of the sample (b), as indicated by the posi-tion of the main MoO2t vibration at 940 cm−1 [19].
The (NH4)3[Al(OH)6Mo6O18] phase formed during impreg-nation was clearly retained after drying. It formed due to theso-called “ligand-promoted dissolution” of the Al2O3 support[32], resulting from the complexation of Al3+ ions by oxo-molybdate complexes under acidic conditions, as described inthe following reaction:
6Mo7O6−24 + 7Al3+ + 24H2O → 7Al(OH)6Mo6O3−
18 + 6H+.(2)
The high Mo concentration present on the outside of the ex-trudates after impregnation allows for a chain reaction to oc-cur. Al3+ ions are generated by dissolution of the supportand consumed in the formation of Al(OH)6Mo6O3−
18 . Thelow solubility of this compound leads to the precipitation of(NH4)3[Al(OH)6Mo6O18]. The Al3+ concentration in solutionis thus kept low, and increasing amounts of Al2O3 are dissolvedas a layer of (NH4)3[Al(OH)6Mo6O18] is formed [32]. Insidethe pores of the Al2O3, toward the inside of the extrudates, thepH of the solution increased due to the buffering action of thesupport, and MoO2−
4 instead of Al(OH)6Mo6O3−18 complexes
were formed. Apparently, in certain domains inside the ex-trudates, circumstances after impregnation are similar to thosefound on the exterior of the extrudates, and formation of the het-eropolyanions occurs. These domains could consist of cracks inthe extrudates or areas of low-density Al2O3 created during theextrusion process. At these positions, the amount of Mo7O6−
24anions per unit Al2O3 surface area is high, and the buffering ef-fect of the support is not sufficient to prevent the formation ofbulk (NH4)3[Al(OH)6Mo6O18].

J.A. Bergwerff et al. / Journal of Catalysis 243 (2006) 292–302 297
Fig. 5. XRD patterns recorded on crushed 19 wt% MoO3/Al2O3 extrudatesafter calcination, prepared from different AHM solutions. Reflections corre-sponding to the presence of crystalline γ -Al2O3 (!) (ICDD 48-0367), MoO3(�) (ICDD 5-508), and Al2(MoO4)3 (+) (ICDD 23-764) are indicated.
In general, the nature of Mo complexes present in driedMo/Al2O3 catalysts under ambient conditions is a function ofthe Mo loading and the nature of the support [36]. The samecomplexes can be formed on the hydrated Al2O3 surface andin solution. Just as the pH of a solution determines the speci-ation of Mo complexes in a solution, the point of zero charge(PZC) of the hydrated surface layer determines which Mo com-plexes are present. The value of the PZC of the total surface isa result of the individual PZC values of bulk Al2O3 (∼9) andthe AHM (∼6) deposited on the surface [37]. Hence the PZCof a Mo/Al2O3 system will decrease with increasing Mo load-ing. Consequently, at the high Mo loadings used in this study,the PZC of the system will be close to 6, and Mo7O6−
24 entitiesare present predominantly in the bulk of the dried material. Fur-thermore, drying results in a concentration of Mo complexes onthe surface, also favoring Mo7O6−
24 formation.As shown in Table 1, XRF measurements showed that the
total MoO3 loading in the calcined catalysts was largely unaf-fected by the preparation method. After calcination, sharp peaksat 995, 819, 667, 378, 337, 290, and 242 cm−1 occur in theRaman spectra recorded on calcined AHM-pH 6 samples forpositions showing the presence of (NH4)3[Al(OH)6Mo6O18]after drying. On calcination, the (NH4)3[Al(OH)6Mo6O18] ag-glomerates were converted into bulk MoO3 in accordance withthe literature [35]. The formation of bulk MoO3 is also ob-served in the XRD pattern recorded on crushed 19 wt% MoO3
AHM-pH 6 extrudates, shown in Fig. 5. In this pattern, all maindiffraction lines of orthorhombic MoO3 [2θ = 14.9◦ (6.99 Å),27.2◦ (3.80 Å), 30.0◦ (3.45 Å), 31.8◦ (3.27 Å), 39.4◦ (2.65 Å),58.0◦ (1.85 Å), and 62.2◦ (1.73 Å)] are observed along withthe broad peaks originating from the γ -Al2O3 support [38].In other areas, an amorphous MoOx phase was detected and abroad band observed in the Raman spectra. As discussed earlier,at elevated temperature, bulk MoO3 can be expected to spreadover the Al2O3 support to form an amorphous MoOx over-layer. Although the total Al2O3 surface area in the extrudateswas sufficient to accommodate all Mo present in the system inan amorphous overlayer, the creation of areas with a high Moconcentration led to formation of bulk MoO3. Apparently, inmm-scale catalyst bodies, transport distances are too large for
complete spreading of the MoO3 over the support during cal-cination for 1 h, a calcination period typical for the industrialpreparation of (Ni/Co)Mo/Al2O3 catalysts. Using a quantitativeRaman spectroscopy method on crushed extrudates, the totalamount of crystalline MoO3 formed in the extrudates is esti-mated as 3(±1)% of the total weight for both the 14 wt% andthe 19 wt% MoO3 samples. Details of the procedure used toobtain these values are given in Supplementary material.
On visual inspection, the calcined extrudates prepared fromAHM-pH 9 solutions appear rather homogeneous. This can alsobe seen in the SEM image in Fig. 3. Nonetheless, an eggshelldistribution of Mo can be seen in the corresponding EDX linescan. The Raman spectra recorded on these dried extrudates(shown in Fig. 6) indicate the presence of Mo7O6−
24 complexesthroughout the extrudates, judging from the maximum in thespectra at 940 cm−1 for all positions inside the sample. Dryingof the extrudates led to evaporation of excess ammonia fromthe solution and a decrease in the pH of the solution inside thepores of the Al2O3. Consequently, after drying, the composi-tion on the interior of the extrudates was similar to that of theAHM-pH 6 sample, and Mo7O6−
24 formed, as was already dis-cussed above. The eggshell distribution of Mo seen in the EDXline scan can also be inferred from the Raman measurements,as the intensity of the Mo–O stretch vibrations increases towardthe outside of the extrudates after scaling to the Al2O3 fluo-rescence background. After calcination, an amorphous MoOx
phase was present throughout the 14 wt% MoO3 extrudates pre-pared from the AHM-pH 9 solution. A broad band can be seenat 960–980 cm−1 for all positions. The same phase also waspresent near the core of the extrudates with the high Mo load-ing. However, in the 19-wt% MoO3 sample, crystalline phasescan be detected near the outer surface of the extrudates. A sharppeak at 1006 cm−1 reveals the presence of bulk Al2(MoO4)3 inthe outer 50 µm of the sample; bulk MoO3 (995 and 819 cm−1)was present at the exterior surface. The presence of crystallineAl2(MoO4)3 also can be seen in an XRD pattern recorded onthe corresponding crushed extrudates, with small peaks presentat 2θ values of 25.8◦ (4.01 Å), 27.3◦ (3.78 Å), 30.4◦ (3.41 Å),and 35.8◦ (2.91 Å). An attempt to quantify the amount of crys-talline material in this sample failed, as described in Supple-mentary material.
After impregnation with the AHM-pH 9 solution, the inter-action between MoO2−
4 anions and the Al2O3 surface can beexpected to be relatively weak. Because the pH of the impreg-nation solution is similar to the PZC of the support material, theAl2O3 surface will be neutrally charged, and the Coulomb in-teraction with the MoO2−
4 anions will be negligible. It is wellknown that the drying procedure can drastically influence thedistribution of metal ion complexes in supported catalyst bod-ies, especially when a poor interaction exists between the metalion precursor complexes and the support oxide after impregna-tion [14,15]. Thus, an eggshell distribution of Mo complexes isfound in the AHM-pH 9 extrudates after drying. This particu-lar distribution is often observed when catalyst bodies are driedat low rates. In this case, evaporation of water occurs at the pe-riphery of the extrudates, and liquid is drawn from the center ofthe bodies toward the external surface. This transport can pro-

298 J.A. Bergwerff et al. / Journal of Catalysis 243 (2006) 292–302
Fig. 6. Raman spectra recorded on bisected extrudates after drying (left) and calcination (right) of extrudates impregnated with 1.8 M and 1.3 M AHM-pH 9solutions. The distance of the measurement spot from the core of the extrudates is indicated to the right of the spectra.
ceed via connected liquid elements, as well as through a filmof liquid covering the walls of emptied pores. Dissolved metalion precursor complexes travel with this flow of the liquid andwhen precipitation takes place, the liquid phase is primarily lo-cated in the outer layer of the catalyst bodies. When drying iscomplete, an eggshell distribution of the metal-ion salts remains[39]. A regime of slow drying can be expected to be operativewhen (relatively) large batches of impregnated support bodiesare dried, as is the case in this study.
For the 19-wt% MoO3 samples, due to the eggshell distri-bution, the Mo loading near the external surface of the ex-trudates exceeded the value required for the dispersion limitcoverage. Hence, formation of crystalline Mo phases occurredafter calcination. At low loadings, an eggshell distribution ofMo would be expected to be present as well. However, in thiscase, the macrodistribution of Mo is less crucial, because aslight eggshell distribution does not necessarily lead to load-ings exceeding the dispersion limit coverage near the outside ofthe extrudates. An amorphous MoOx phase is formed through-out the extrudates.
The Raman spectra recorded on the 19-wt% MoO3 AHM–citrate samples after drying and calcination are presented inFig. 7. For the dried sample, the peak positions of the mainMo–O vibrations are similar to those in the spectra recorded onthe wet material. The Mo4(citrate)2O4−
11 complex is preservedon the Al2O3 surface after drying. A slight Mo-concentrationgradient is present, judging from the increased intensity of theMo–O stretch vibration relative to the Al2O3 fluorescence back-ground toward the outside of the extrudates. The Mo profileobtained from the EDX line scan (Fig. 3) supports this observa-tion. The gradient is less pronounced compared with samplesprepared from the AHM-pH 9 solution, because the interac-tion between the Mo4(citrate)2O4−
11 complexes and the Al2O3surface after impregnation is stronger. There was no differencein the spectra of the AHM–citrate-l and AHM–citrate-s sam-ples; these samples already exhibited the same distribution ofMo4(citrate)2O4− before the drying process. After calcination,
11Fig. 7. Raman spectra recorded on bisected 19 wt% MoO3/Al2O3 extrudatesprepared from an AHM–citrate solution after drying (left) and calcination(right). The distance of the measurement spot from the core of the extrudates isindicated to the right of the spectra.
merely amorphous MoOx phases were present in the catalysts,regardless of the MoO3 loading. Relatively broad bands canbe seen observed in the Raman spectra, and only reflectionsdue to the γ -Al2O3 support are present in the XRD patternrecorded on the crushed extrudates (Fig. 5) [38]. The posi-tion of the Raman band shifted to higher frequency as the Moloading increased toward the outside of the pellet. Near theexternal surface in the 19-wt% MoO3 sample, the maximumof the band occurs at 1006 cm−1. This band’s position cor-responds to the formation of an Al2(MoO4)3 phase, whereasits broadness suggests the presence of an amorphous phase.Due to the eggshell distribution, the local Mo concentrationnear the external surface will exceed the value correspondingto the dispersion limit coverage derived from the measurementson AHM-impregnated powdered Al2O3. Nevertheless, as in thecase of the powdered samples prepared from AHM–citrate so-lutions, no crystalline phases are observed. Apparently, moreMo can be accommodated in an amorphous Al2(MoO4)3 phase

J.A. Bergwerff et al. / Journal of Catalysis 243 (2006) 292–302 299
Fig. 8. TEM images recorded on embedded MoS2/Al2O3 extrudate slices, prepared from different 19 wt% MoO3 samples. Low-magnification images (a–c) wererecorded near the external surface of the extrudates. The position where the high-magnification images (d–f) were recorded are indicated in images a–c.
on the Al2O3 surface when the preparation is started from anAHM–citrate solution.
3.4. Characterization of MoS2/Al2O3 extrudates
Raman spectra recorded on the embedded extrudates afterreaction merely showed bands at 226, 384, and 406 cm−1, cor-responding to the presence of MoS2 for all positions in allsamples under investigation [40]. The absence of any Mo–Ostretch vibration bands in the 900–1000 cm−1 region indicatesthat sulfidation was complete and that reoxidation of the sam-ple had not occurred to any significant extent during handlingof the sulfidic catalysts. The Mo distributions obtained fromSEM–EDX measurements on the MoS2/Al2O3 extrudates weresimilar to the profiles recorded on the corresponding oxidicsamples. In other words, sulfidation and reaction conditions hadno noticeable influence on the macroscopic distribution of Moin the extrudates.
TEM images recorded on different 19-wt% MoO3 extrudateslices after reaction are shown in Fig. 8. The most striking dif-ferences in the three samples were found near the outside of theextrudates, as can be seen by comparing images a, b, and c. Forthe AHM-pH 6 sample, a ∼2-µm-thick layer of dense materialcan be seen on the external surface of the catalyst extrudates.The high-magnification micrograph recorded on this layer (im-age d) clearly shows that these particles contain MoS2, becauseslabs are readily visible. In the AHM-pH 9 sample, areas ofhigher density (typically 200 nm) are observed in a 50-µm-thickring on the outside of the extrudates. These areas are indicatedby the arrows in image b. Images at higher magnification (im-age e) show that they consist of agglomerates of MoS2 slabs.
For the AHM–citrate sample, none of these features was ob-served, and the sample appeared to be homogeneous at lowmagnification. Well-distributed MoS2 slabs were observed athigher magnification, as is illustrated in image f. Only a fewdouble slabs and no multistacked slabs are found, indicatingthat the MoS2 phase is in close contact with the support. Nearthe core of the extrudates, all samples show a well-dispersedMoS2 phase, although with lower density due to the lower Moconcentration at these positions.
3.5. Activity of MoS2/Al2O3 extrudates in LGOhydrotreatment
The HDS activities of the different MoS2/Al2O3 extrudatesamples are obtained from the conversion of sulfur-containingcompounds. Values for the HDS weight activities (kWHSV) forthe different catalysts at different reaction temperatures are pre-sented in the Arrhenius plot in Fig. 9. The relative HDS activ-ities of the different samples at 360 ◦C, derived from the lines,are presented in Fig. 10. The HDS conversion was between 0.7for the least active catalyst at 345 ◦C and 0.975 for the most ac-tive catalyst at 375 ◦C. Reaction rate coefficients (kWHSV) weredetermined from the weight hourly space velocity (WHSV)and the total concentration of S-containing compounds in thefeed before (Cfeed) and after reaction (Cproduct), assuming afirst-order reaction, using Eq. (3). Based on the relative errorin the determination of the sulfur content (<2%), the relativeerror in the reaction rate constants was <1%. The LGO-feedhad numerous different S-containing compounds, ranging fromreactive thiophene derivates to substituted dibenzothiophenes,which are notoriously difficult to decompose [41]. Hence, the

300 J.A. Bergwerff et al. / Journal of Catalysis 243 (2006) 292–302
Fig. 9. Arrhenius plot (lnkWHSV/T −1) of the HDS reaction constants for thedifferent catalysts.
Fig. 10. Bar diagram showing the normalized HDS activities of the differentcatalysts, derived from the reaction rate constants (kWHSV) at 360 ◦C.
constitution of the library of S-containing compounds and theiraverage reactivity can change with conversion. However, thetotal S concentration is inevitably used for determining HDSactivity.
Theoretically, this results in a decreasing apparent rate con-stant with increasing conversion and a decreasing observed re-action order from 2 to 1 [42]. Indeed, in the literature, a HDSreaction order between 1 and 2 was found when hydrotreatmentwas carried out on industrial feeds using (Ni/Co)Mo/Al2O3 cat-alysts [43–45]. For the specific catalysts, feeds, and conversionranges used in this study, a reaction order of 1 was found togive the best correlation between ln(kWHSV) and T −1. A similarslope was found in the Arrhenius plots for the different cata-lysts. Apparently, the activity of the different catalysts is merelya function of the number of active sites. The average activationenergy derived from the slopes of the lines in the Arrhenius plotwas 87 kJ mol−1:
(3)kWHSV = WHSV ln
(Cfeed
Cfeed − Cproduct
).
Samples prepared from AHM–citrate solutions showed thehighest activity in all cases. The absence of any crystallineoxidic material after calcination and the presence of a well-dispersed MoS2 phase throughout the extrudates explain thesecatalysts’ superior performance. However, the activity was notcompletely proportional to the MoO3 loading. Apparently, thehigher MoO3 loading caused a slightly lower dispersion of theMoS2 phase. The low activity of the AHM-pH 6 samples canbe explained by the formation of considerable amounts of bulkMoO3 in specific areas of the extrudates, as observed on Ra-man microspectroscopy and XRD measurements. From TEMimages, it is clear that on sulfidation, this phase was trans-formed into large MoS2 clusters, expected to be mainly inactivein catalysis. The amount of crystalline MoO3 formed in theAHM-pH 6 samples (3 ± 1 wt%) can be estimated as 21% forthe 14-wt% MoO3 sample and 15% for the 19-wt% MoO3 sam-ple. The AHM-pH 6 samples were 19% less active than theAHM–citrate samples of the same Mo loading. Considering theidentical activation energy found for all catalysts, a semiquan-titative correlation seemed to exist between the percentage ofeffective MoS2 phase and the HDS activity.
At the low Mo loading, the catalyst prepared from an AHM-pH 9 showed a HDS activity comparable to that of the AHM–citrate sample. No crystalline phases were observed in the ox-idic precursor for this sample. At the high Mo loading, however,the activity of the AHM-pH 9 sample was noticeably (9%)lower than that of the AHM–citrate catalyst. In this case, theformation of bulk MoO3 and Al2(MoO4)3 was observed in theouter shell of the oxidic extrudates, and MoS2 clusters werevisible in the TEM images recorded on the sulfidic material.Apparently, the poor dispersion of the MoS2 phase renderedthese clusters inactive in the HDS reaction.
3.6. Raman microspectroscopy in industrial catalystpreparation
It was found in this study that the speciation of Mo com-plexes in Mo/Al2O3 extrudates can be monitored using Ramanmicrospectroscopy at all stages of catalyst genesis. Particu-larly in impregnated and dried samples, the sharp peaks dueto the presence of individual hydrated Mo6+-complexes pro-vide detailed information about the nature of the Mo phase onthe Al2O3 surface. The physicochemical processes occurringduring the impregnation and drying step thus can be moni-tored in great detail. Transport rates of different Mo complexesthrough the Al2O3 pore system and their reaction with theAl2O3 surface can be envisaged [25,46,47]. The spatially re-solved information obtained using Raman microspectroscopysheds light on detrimental processes occurring during cata-lyst preparation. In this specific study, the formation of MoO3in calcined Mo/Al2O3 extrudates prepared from AHM-pH 6solutions could be linked directly to the formation of bulk(NH4)3[Al(OH)6Mo6O18] during impregnation.
Numerous studies reported in the open literature have beendedicated to the preparation of Mo/Al2O3 catalyst bodies [48–55]. In most cases, the Al2O3 bodies were subjected to anexcess of Mo solution, and the Mo complexes were applied

J.A. Bergwerff et al. / Journal of Catalysis 243 (2006) 292–302 301
to the support by equilibrium adsorption processes [48–50].These methods allow for controlled preparation in which theconcentration of Mo complexes in solution never exceeds satu-ration values. Various Mo distribution profiles can be obtained,and the transport of Mo complexes through the Al2O3 bodiescan even be modeled quantitatively in some cases [48]. How-ever, the dry impregnation of support bodies, as practiced inindustry, is a different process scarcely dealt with in academicstudies. After incipient-wetness impregnation, the solution isforced into the pores by the capillary forces, and a highly in-creased concentration of metal complexes can exist near theexternal surface of the support bodies. The formation of the(NH4)3[Al(OH)6Mo6O18] precipitate is probably the result ofthese extreme conditions and thus likely was not observed inthe studies mentioned above.
Using a staining method, a sharp Mo eggshell distributionwas visually observed in Al2O3 pellets after dry impregna-tion with an AHM solution by Srinivasan et al. [55]. This mayhave been due to the formation of a (NH4)3[Al(OH)6Mo6O18]phase during impregnation, although characterization was notsufficient to support this assumption. A series of publicationsby Okamoto and co-workers dealt with the influence of alarge number of preparation parameters, on the properties ofMo/Al2O3 extrudates [51–54]. A number of samples in thisstudy were prepared by pore-volume impregnation with AHMsolution of pH 5. In some of these samples, crystalline MoO3was observed by XRD and Raman spectroscopy performed oncrushed extrudates, in agreement with the present study. How-ever, electron probe microanalysis showed no clear accumula-tion of Mo on the external surface in these samples.
From the observation of bulk phases exclusively near the ex-terior of extrudates prepared from the highly concentrated basicAHM solution, it was concluded that their formation was theresult of an eggshell distribution of Mo over the extrudates.Unfortunately, in the studies mentioned above, characteriza-tion was done only on dried material, making it difficult todiscriminate between processes taking place during impreg-nation and those occurring during drying. The application ofRaman microspectroscopy during the entire preparation processof Mo/Al2O3 extrudates allows us to monitor not only the dis-tribution, but also the nature of Mo complexes in the extrudatesand to envisage the processes that occur. Spectroscopy studieson crushed extrudates fail to provide this kind of information.In this way, many pitfalls related to the preparation of supportedmetal(oxide) catalyst bodies can be avoided.
After calcination, the amorphous nature of the supportedMoOx phase means that broad bands are generally present inthe corresponding Raman spectra. In contrast, the presence ofbulk material can be readily detected, because the formationof these phases yields intense and sharp peaks. This inherentsensitivity is clearly illustrated by comparing the Raman spec-tra recorded on calcined 19 wt% MoO3 AHM-pH 9 extrudates(Fig. 6) with the XRD pattern recorded on the same sample(Fig. 5). Particularly when the respective accumulation timesfor the Raman (2 min) and XRD (14 h) measurements are takeninto account, the difference in sensitivity between these tech-niques is striking. Because the formation of crystalline mater-
ial generally should be avoided in supported catalysts, Raman(micro)spectroscopy could be an interesting technique for thedevelopment of a quality control expert system for industrialcatalyst preparation processes. Although quantitative Ramanspectroscopy is difficult for these inherently inhomogeneoussamples, the amount of crystalline MoO3 can be estimated, us-ing physical mixtures as references.
4. Conclusion
Several physicochemical processes operating at differentstages of the preparation process can result in poor dispersion ofthe Mo oxide phase in oxidic Mo/Al2O3 extrudates. Formationof a layer of (NH4)3[Al(OH)6Mo6O18] on the outer surface ofthe extrudates during impregnation with acidic AHM solutionsoccurs due to ligand-promoted dissolution of the support ox-ide. This leads to the formation of bulk MoO3 after calcination.When impregnation is carried out with basic AHM solutions, aredistribution of Mo complexes during drying can lead to aneggshell distribution of Mo complexes inside the extrudates.As a result, at high Mo loadings, the Mo concentration on theoutside of the extrudates exceeds the dispersion limit of thesupport, and MoO3 and Al2(MoO4)3 crystals are formed dur-ing calcination. Both phenomena are restricted to preparationof catalyst bodies and would have been overlooked in cata-lyst preparation studies on powdered samples. The formationof crystalline oxidic phases after calcination leads to a poorlydispersed MoS2 phase in the active catalysts. A correlation isfound between the hydrotreating activity and the dispersion ofthe Mo phase. Samples prepared from AHM–citrate solutionsshow good Mo dispersion throughout the preparation processand increased HDS activity relative to the samples.
Acknowledgments
The authors thank Dimitri Agterveld (Akzo Nobel Chemi-cals Research) for carrying out the SEM and TEM measure-ments on the MoS2/Al2O3 extrudates. They acknowledge valu-able discussions with Jan Nieman, EelcoVogt (Albemarle Cat-alysts BV), and Brenda Rossenaar (Akzo Nobel Chemicals Re-search). B.M.W. acknowledges financial support by the DutchNational Science Foundation (NWO-CW-van der Leeuw andVICI grants) and NRSC-Catalysis. Part of this research wassponsored by Albemarle Catalysts BV.
Supplementary material
The online version of this article contains additional support-ing information.
Please visit DOI:10.1016/j.jcat.2006.07.022.
References
[1] H. Topsoe, B.S. Clausen, F.E. Massoth (Eds.), Hydrotreating Catalysis,Springer-Verlag, Berlin, 1996.
[2] A. Ishihara, F. Dumeignil, J. Lee, K. Mitsuhashi, E.W. Qian, T. Kabe,Appl. Catal. A Gen. 289 (2005) 163.
[3] D. Genuit, P. Afanasiev, M. Vrinat, J. Catal. 235 (2005) 302.

302 J.A. Bergwerff et al. / Journal of Catalysis 243 (2006) 292–302
[4] H. Farag, K. Sakanishi, J. Catal. 225 (2004) 531.[5] S.T. Oyama, J. Catal. 216 (2003) 343.[6] S.F. Yang, R. Prins, Chem. Commun. (2005) 4178.[7] E.J.M. Hensen, P.J. Kooyman, Y. van der Meer, A.M. van der Kraan,
V.H.J. de Beer, J.A.R. van Veen, R.A. van Santen, J. Catal. 199 (2001)224.
[8] J. Grimblot, Catal. Today 41 (1998) 111.[9] R. Prins, Adv. Catal. 46 (2002) 399.
[10] L. Medici, R. Prins, J. Catal. 163 (1996) 38.[11] A. Griboval, P. Blanchard, E. Payen, M. Fournier, J.L. Dubois, Catal. To-
day 45 (1998) 277.[12] G. Kishan, L. Coulier, V.H.J. de Beer, J.A.R. van Veen, J.W. Niemantsver-
driet, Chem. Commun. (2000) 1103.[13] M.Y. Sun, D. Nicosia, R. Prins, Catal. Today 86 (2003) 173.[14] S.Y. Lee, R. Aris, Catal. Rev. Sci. Eng. 27 (1985) 207.[15] A.V. Neimark, L.I. Kheifez, V.B. Fenelonov, Ind. Eng. Chem. Prod. Res.
Dev. 20 (1981) 439.[16] G. Ertl, H. Knozinger, J. Weitkamp (Eds.), Preparation of Solid Catalysts,
Wiley–VCH, Weinheim, 1999.[17] H. Jeziorowski, H. Knözinger, J. Phys. Chem. 83 (1979) 1166.[18] I.E. Wachs, Catal. Today 27 (1996) 437.[19] G. Mestl, T.K.K. Srinivasan, Catal. Rev. Sci. Eng. 40 (1998) 451.[20] J. Leyrer, D. Mey, H. Knozinger, J. Catal. 124 (1990) 349.[21] E. Taglauer, H. Knozinger, S. Gunther, Nucl. Instrum. Methods Phys. Res.
Sect. B Beam Interact. Mater. Atoms 158 (1999) 638.[22] G. Mestl, C. Linsmeier, R. Gottschall, M. Dieterle, J. Find, D. Herein, J.
Jager, Y. Uchida, R. Schlogl, J. Mol. Catal. A Chem. 162 (2000) 455.[23] B. Pettinger, B. Ren, G. Picardi, R. Schuster, G. Ertl, Phys. Rev. Lett. 92
(2004).[24] C. Fokas, V. Deckert, Appl. Spectrosc. 56 (2002) 192.[25] J.A. Bergwerff, T. Visser, R.G. Leliveld, B.A. Rossenaar, K.P. de Jong,
B.M. Weckhuysen, J. Am. Chem. Soc. 126 (2004) 14548.[26] L.G. van de Water, J.A. Bergwerff, T.A. Nijhuis, K.P. de Jong, B.M. Weck-
huysen, J. Am. Chem. Soc. 127 (2005) 5024.[27] A.A. Lysova, I.V. Koptyug, R.Z. Sagdeev, V.N. Parmon, J.A. Bergwerff,
B.M. Weckhuysen, J. Am. Chem. Soc. 127 (2005) 11916.[28] H. Knözinger, E. Taglauer, in: G. Ertl, H. Knözinger, J. Weitkamp (Eds.),
Preparation of Solid Catalysts, Wiley–VCH, Weinheim, 1999, p. 501.[29] H.J. Tian, I.E. Wachs, L.E. Briand, J. Phys. Chem. B 109 (2005) 23491.[30] T. Ozeki, H. Kihara, S. Ikeda, Anal. Chem. 60 (1988) 2055.[31] L. Le Bihan, P. Blanchard, M. Fournier, J. Grimblot, E. Payen, J. Chem.
Soc. Faraday Trans. 94 (1998) 937.[32] X. Carrier, J.F. Lambert, M. Che, J. Am. Chem. Soc. 119 (1997) 10137.[33] Z.H. Zhou, H.L. Wan, K.R. Tsai, Inorg. Chem. 39 (2000) 59.
[34] J.J. Cruywagen, E.A. Rohwer, G.F.S. Wessels, Polyhedron 14 (1995)3481.
[35] X. Carrier, J.F. Lambert, S. Kuba, H. Knozinger, M. Che, J. Mol.Struct. 656 (2003) 231.
[36] G. Deo, I.E. Wachs, J. Phys. Chem. 95 (1991) 5889.[37] H.C. Hu, I.E. Wachs, S.R. Bare, J. Phys. Chem. 99 (1995) 10897.[38] S. Braun, L.G. Appel, V.L. Camorim, M. Schmal, J. Phys. Chem. B 104
(2000) 6584.[39] L.M. Knijff, Ph.D. thesis, Utrecht University, 1993.[40] A. Muller, T. Weber, Appl. Catal. 77 (1991) 243.[41] R. Prins, A. Egorova, A. Rothlisberger, Y. Zhao, N. Sivasankar, P. Kukula,
Catal. Today 111 (2006) 84.[42] K.P. De Jong, Ind. Eng. Chem. Res. 33 (1994) 3141.[43] S.K. Bej, A.K. Dalai, J. Adjaye, Pet. Sci. Technol. 20 (2002) 867.[44] D. Ferdous, A.K. Dalai, J. Adjaye, Ind. Eng. Chem. Res. 45 (2006) 544.[45] R.A. Diazreal, R.S. Mann, I.S. Sambi, Ind. Eng. Chem. Res. 32 (1993)
1354.[46] L.G.A. van de Water, J.A. Bergwerff, B.R.G. Leliveld, B.M. Weckhuysen,
K.P. de Jong, J. Phys. Chem. B 109 (2005) 14513.[47] J.A. Bergwerff, L.G.A. van de Water, T. Visser, P. de Peinder, B.R.G. Le-
liveld, K.P. de Jong, B.M. Weckhuysen, Chem. Eur. J. 11 (2005) 4592.[48] M.A. Goula, C. Kordulis, A. Lycourghiotis, J. Catal. 133 (1992) 486.[49] M.A. Goula, C. Kordulis, A. Lycourghiotis, J.L.G. Fierro, J. Catal. 137
(1992) 285.[50] L. Kaluza, M. Zdrazil, Catal. Lett. 78 (2002) 313.[51] Y. Okamoto, Y. Arima, K. Nakai, S. Umeno, N. Katada, H. Yoshida, T.
Tanaka, M. Yamada, Y. Akai, K. Segawa, A. Nishijima, H. Matsumoto,M. Niwa, T. Uchijima, Appl. Catal. A Gen. 170 (1998) 315.
[52] Y. Okamoto, Y. Arima, M. Hagio, K. Nakai, S. Umeno, Y. Akai, K.Uchikawa, K. Inamura, T. Ushikubo, N. Katada, S. Hasegawa, H. Yoshida,T. Tanaka, T. Isoda, I. Mochida, K. Segawa, A. Nishijima, M. Yamada, H.Matsumoto, M. Niwa, T. Uchijima, Appl. Catal. A Gen. 170 (1998) 329.
[53] Y. Okamoto, S. Umeno, Y. Arima, K. Nakai, T. Takahashi, K. Uchikawa,K. Inamura, Y. Akai, O. Chiyoda, N. Katada, T. Shishido, H. Hattori, S.Hasegawa, H. Yoshida, K. Segawa, N. Koizumi, M. Yamada, A. Nishijima,T. Kabe, A. Ishihara, T. Isoda, I. Mochida, H. Matsumoto, M. Niwa, T.Uchijima, Appl. Catal. A Gen. 170 (1998) 343.
[54] Y. Okamoto, S. Umeno, Y. Shiraki, Y. Arima, K. Nakai, O. Chiyoda, H.Yoshida, K. Uchikawa, K. Inamura, Y. Akai, S. Hasegawa, T. Shishido,H. Hattori, N. Katada, K. Segawa, N. Koizumi, M. Yamada, I. Mochida,A. Ishihara, T. Kabe, A. Nishijima, H. Matsumoto, M. Niwa, T. Uchijima,Appl. Catal. A Gen. 170 (1998) 359.
[55] R. Srinivasan, H.C. Liu, S.W. Weller, J. Catal. 57 (1979) 87.


![Observation of [Al(OH) n (H 2 O) 6- n ] n (MoO 4 ) in hydrotreating catalyst precursors by solid-state 27 Al NMR](https://static.fdokumen.com/doc/165x107/6315130285333559270cfb60/observation-of-aloh-n-h-2-o-6-n-n-moo-4-in-hydrotreating-catalyst-precursors.jpg)

