The Catalão I niobium deposit, central Brazil: Resources, geology and pyrochlore chemistry
Upload
independentCategory
view
0download
0
First-Principles Study of the Nature of Niobium Sulfide Catalyst forHydrodesulfurization in Hydrotreating ConditionsYosslen Aray,*,†,∥,⊥ Dick Zambrano,‡ Mauricio H. Cornejo,§,⊥ Eduardo V. Ludena,†,§ Peter Iza,‡
Alba B. Vidal,∥ David S. Coll,∥ Doris M. Jímenez,∥ Francisco Henriquez,∥ and Cecilia Paredes⊥
†Investigador Prometeo, SENESCYT, Quito, Ecuador‡Facultad de Ciencias Naturales y Matematica, Departamento de Fisica, ESPOL, Km 30.5 via Perimetral, Campus Gustavo Galindo,Guayaquil Ecuador§Center of Nanotechnology Research and Development (CIDNA), ESPOL, Km 30.5 via Perimetral, Campus Gustavo Galindo,Guayaquil, Ecuador∥Laboratorio de Físíco-Química Teorica de Materiales, IVIC, Caracas, Venezuela⊥Faculty of Mechanical Engineering and Production Science, ESPOL, Km 30.5 via Perimetral, Campus Gustavo Galindo, Guayaquil,Ecuador
*S Supporting Information
ABSTRACT: For the metal-edge of pure NbS2 catalyst mixedwith Mo and promoted with V, Fe, Co, and Ni, densityfunctional theory and first-principles surface thermodynamicscalculations at hydrodesulfurization conditions have beenperformed. It was found that V, Co, and Ni promoters impartstabilization to the catalyst surfaces whereas Fe produces anopposite effect and renders the catalysts less stable. Catalyststructures corresponding to the fully Ni-promoted edge of themixed Mo−Nb sulfide with a Mo3Nb2S10 composition and tothe NbS2 V-promoted with 50% sulfur coverage forming Sdimers are by far the most stable structures. The nature of thehydrodesulfurization active sites of both most stable mono-layers were studied using reactivity predictors such as theelectrostatic potential, the electronic localization function, and the Laplacian of the electronic density.
■ INTRODUCTION
There is a huge and urgent demand for ultralow-sulfur fuels toimprove air quality.1−3 To attain this goal, transition-metalsulfides (TMS) are used as catalyst in the hydroprocessing forpetroleum-based feedstock. TMS catalysts play an increasinglyimportant role in fuel processing. The major reactions catalyzedby TMS are hydrogenation of olefins, ketones, and aromatics;hydrodesulfurization (HDS); hydrodenitrogenation (HDN);hydrodemetalation (HDM); and hydrocraking (dealkylationand ring opening of aromatics). It is also used in many otherreactions including reforming, isomerization of paraffins,dehydrogenation of alcohols, Fischer−Tropsch and alcoholsynthesis, hydration of olefins, amination, mercaptan andthiophene synthesis, etc.3
Nickel and cobalt promoted molybdenum sulfide catalysts,NiMoS and CoMoS, have for many years been ranked among themost important catalysts in refinery service. However, theseprocesses and their associated catalysts, allowing the removal ofsulfur, must be more and more efficient. Hence, optimization ofconventional catalysts or the development of new ones isrequired.4,5
Niobium sulfide has been reported as an interesting andaffordable active phase for HDS.6−9 When prepared withappropriate morphology, niobium sulfides have shown promis-ing catalytic properties. In the bulk state, they present activitieshigher than those of bulk MoS2 in several model reactions,9−11
particularly in the thiophene HDS reaction.10 Supportedtogether with Ni on carbon, it exhibits a high HDS activity.12
Niobium sulfide was also used as a dopant phase to the traditionalNiMoS hydrotreating catalyst and caused an enhancement in theHDS and HDN activity.13 In this case, niobium sulfide ispresented as NbS2 layers that are well dispersed on the supportand in close contact with the other active components. Thus,NbS2 plays the role of an additional active phase.On the other hand, two-dimensional atom-thick layers
(monolayers) have attracted much attention because of theirunique applications in microscopic physics and nanoscaleelectronic devices.13 Despite their structural similarity, metaldichalcogenides present a wide variety of electronic behavior,
Received: June 14, 2014Revised: October 28, 2014Published: November 7, 2014
Article
pubs.acs.org/JPCC
© 2014 American Chemical Society 27823 dx.doi.org/10.1021/jp5059269 | J. Phys. Chem. C 2014, 118, 27823−27832
going from insulators (HfS2) to semiconductors (MoS2) and realmetals (NbS2).
14,15 In the case ofMoS2, it is widely used both as acatalyst in HDS and in tribological applications.3,16,17 In the caseof NbS2, it has attracted attention because of its optical, magnetic,and superconductivity properties.15,18 Additionally, variousmixed materials have been recently synthesized,14,19,20 such asNbxMo1−xS2,
19 which are more stable than the correspondingpure materials.21
To examine the nature and stability of the monolayer of pureNbS2, exposing the so-called metal-edge, supporting MoS2sulfide and promoted by V, Fe, Co, and Ni atoms at HDSconditions, we have carried out density functional theory (DFT)calculations combined with first-principles surface thermody-namics studies. Several surfacemodels with varying compositionshave been studied.
■ METHODSThermodynamical Calculations. The variation of the
surface coverage in a reactive atmosphere involving the presenceof H2 and H2S in the gas−liquid phase in chemical equilibriumwith the surface, as that present in industrial workingconditions,22−31 would occur according to the reaction
+ → □ +n nSurface H Surface H Sn2 2 (1)
where □n denotes n sulfur vacancies per unit cell. The surfacestability in this environment can be determined by calculating thecanonical potential Ωi(T, pi), at temperature T and partialpressure pi of the gas phase components. The generalthermodynamic formula for Ω(T, pi) is
∑ μΩ = −T p G N T p( , ) [ ( , )]ii
i i i(2)
where, G stands for the Gibbs free energy of the solid with asurface of area A. The solid surface is modeled by a piece ofmaterial (slab) in a grand canonical ensemble at constanttemperature (T) and total pressure (P). The material slab isinfinite (periodic) within the surface plane with a vacuum of 1 nmseparating it from its next periodically repeated image parallel tothe surface. μ(T, pi) is the chemical potential of the variousspecies i present in the system, andNi gives the number of atomsof the ith component contained in the solid slab model. For theNbS2 surfaces, eq 2 can be written as
μ μΩ = − −T p G N T p N T p( , ) [ ( , ) ( , )]i NbSslab
Nb Nb S S2 (3)
where GNbS2slab stands for the total Gibbs free energy of the slab and
μNb and μS are the chemical potentials of a Nb atom and a S atom,respectively. Under chemical equilibrium, μS is the same in allphases that are in contact and contain sulfur. Hence, thefollowing relationships between bulk NbS2 and its componentsare satisfied:
μ μ μ+ =2 (bulk)Nb S NbS2 (4)
If there is enough bulk material to act as a thermodynamicreservoir, the potentials are related by the Gibbs free energy ofthe bulk sulfide
μ μ+ = G2 (bulk)Nb S NbS2 (5)
Hence, the chemical potential of Nb in the surface energyexpression Ω(T, pi) is equal to the corresponding chemicalpotential of Nb in the bulk phase
μ μ= −G (bulk) 2Nb NbS S2 (6)
Combining eqs 3 and 6, the temperature dependence of thesurface Gibbs free energy enters only through the chemicalpotentials of the gases in contact with the surface
⇔ +αH S S H2 2 (7)
μ μ μ= −S H S H2 2 (8)
μΩ = − − Γ
Γ = −
T p G N G T p
AN N
( , ) [ (bulk)]12
( , )
1( 2 )S
NbSslab
Nb NbS S S
S Nb
2 2
(9)
ΓS is the surface sulfur excess with respect to a stoichiometricsurface termination. Equation 9 has been generalized by Finnis32
for polar interfaces (e.g., grain boundary or solid surface) inmulticomponent systems and has been used by numerousauthors in the literature to calculate and compare the surfaceenergy for different terminations for polar oxide and fortransition-metal sulfide surfaces.22−25
The Gibbs free energy is associated with the Helmholtz freeenergy, F, via33
= +G T p N N F T p N N pV T p N N( , , , ) ( , , , ) ( , , , )Nb S Nb S Nb S(10)
In general, the Helmholtz free energy can be written as
= +F T V N N E V N N F T V N N( , , , ) ( , , ) ( , , , )Nb S DFTtotal
Nb Svib
Nb S(11)
with
=
−
F T V N N E T V N N
TS T V N N
( , , , ) ( , , , )
( , , , )
vibNb S
vibNb S
vibNb S (12)
comprising all contributions, which depend on vibrational modesin the system. Here, Evib and Svib are the vibrational energy(including the zero-point energy) and entropy, respectively. ThepV term is negligible32−34 (∼10−3 meV/Å2) compared to the Ffree energy, which is of the order of tenths of millielectronvoltsper square angstrom. Thus, the only additional contributions toG apart from the DFT total energy are the vibrational terms
∑=−
− −E
Rk
hv hv kThv kT
12
( ) exp( / )[1 exp( / )]i
i i
i
vib
(13)
∑
∑
=− −
− −
− − −
S Rhv kT hv kT
hv kT
R hv kT
( / ) exp( / )[1 exp( / )]
ln[1 exp( / )]
i
i i
i
ii
vib
(14)
Typically, vibrational contributions to differences in the Gibbsfree energies of extended systems exhibit some cancellation.32−34
If Fvib were completely negligible, leaving only the DFT energy asthe G predominant term, eq 9 would be written as
μΩ = − − ΓT p E N E T p( , ) [ (bulk)]12
( , )SNbSslab
Nb NbS S2 2
(15)
which contains exclusively terms directly obtainable from a DFTcalculation. For RuO2,
33 PdO,35 and Cu2O36 surfaces, rough
estimation of the vibrational contribution showed that this stays
The Journal of Physical Chemistry C Article
dx.doi.org/10.1021/jp5059269 | J. Phys. Chem. C 2014, 118, 27823−2783227824
below 10, 20, and 5 meV/Å2 in the whole temperature rangeconsidered, respectively. Such a 10 meV/Å2 contribution iscertainly not a completely negligible factor; however, it wasconsidered that this uncertainty does not affect any of thephysical conclusions drawn with respect to the applicationsstudied. In the same way, MoS2 surface studies have alsoneglected this factor.22−26,34 Recently, reduction pathways ofMoS2 edges by hydrogen including entropic and enthalpycorrections to electronic energies deduced from the sets ofvibrational frequencies for the gas phase and catalytic edges havebeen reported.37 Significant corrections on the activation freeenergies and on the stabilities of the intermediates states werefound. In the present work, we include the vibrationalcontribution for all studied surface models, bulk models, andH2S and H2 molecules needed at eqs 12 to 17 and perform a fullvibrational calculation using the standard methodologyimplemented in the program Dmol3.38−40
In practical calculations, the chemical potential of the gas-phase mixture (H2 + H2S) is evaluated using the generalthermodynamic formula assuming ideal gas behavior
μ = Δ + Δ + Δ − Δ +⎛⎝⎜⎜
⎞⎠⎟⎟T E H T T S T RT
S( ) ZPE ( ) ( ) ln
pH
pHS el2
2
(16)
where ΔH(T) and ΔS(T) stand for enthalpy and entropydifferences, respectively, at T for H2S and H2 and ΔEel for thedifference of their internal energies (Eel(H2S) − Eel(H2)), whichare approximated by their zero-temperature DFT total energies.ΔZPE represents the zero-point vibrational energy termHH2S(0)
− Eel(H2S) − (HH(0) − Eel(H2)) calculated through evaluationof the Hessian matrix elements using the normal modes analysismodule implemented in the program Dmol3.38−40
Large values of μS correspond to sulfur-rich conditions,whereas small values of μS relate to strongly reducing conditionsin which hydrogen is more abundant than H2S in the gas phase.For surface promoted with Me atoms (V, Fe, Ni, Co) and with
composition NbxMeySz the canonical potential is given by
μ
Ω = − −
− Γ
Γ = − −⎜ ⎟
⎡⎣⎢
⎤⎦⎥
⎛⎝
⎞⎠
T p G xGyb
G
T p
z xa ycb
( , ) (bulk) (bulk)
( , )
Nb Me Sslab
NbS MebSc
S S
S
x y z 2
(17)
where MebSc is the promoter reference bulk-phase stable (VS,FeS2, Ni3S2, Co9S8) in reaction conditions.For example, for Co atom as promoter, Ω is given by
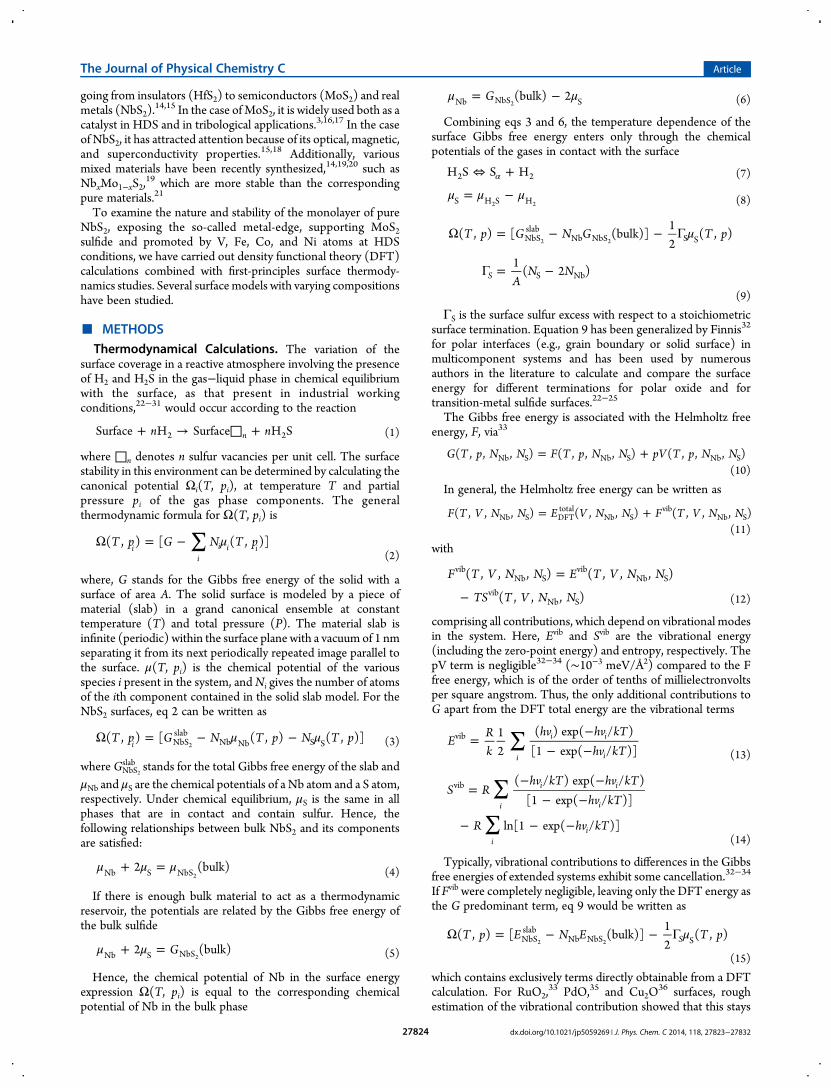
Figure 1. (a) Ball and stick model of the unit cells (white lines) of the NbS2 bulk. (b) Expansion of three periodic cells showing two NbS2 monolayers.(c) Unit cell of the monolayer model showing the Nb-edge (highlighted by a white circle) and the S-edge (highlighted by a red circle). Yellow and bluespheres denote the S and Nb atoms, respectively. Cleaving perpendicular to the layers produces the (100) surface models show in panel c.
The Journal of Physical Chemistry C Article
dx.doi.org/10.1021/jp5059269 | J. Phys. Chem. C 2014, 118, 27823−2783227825

μ
Ω = − −
− Γ
Γ = − −⎜ ⎟
⎡⎣⎢
⎤⎦⎥
⎛⎝
⎞⎠
T p G xGy
G
T p
z x y
( , ) (bulk)9
(bulk)
12
( , )
289
CoMoSslab
NbS Co S
S S
S
2 9 8
(18)
Surfaces Models. NbS2 has a lamellar structure similar tothat of MoS2 bulk (see Figure 1).41 In the unit cell, locally sixsulfur atoms are coordinated to one Nb atom to form a trigonalprismatic arrangement.41 Each Nb atom is surrounded by sixfirst-nearest sulfur atoms at a distance of 2.843 Å forming a NbS2sheet (a monolayer), while each S atom is surrounded by threefirst-nearest Nb atoms on the sheet and by three second-nearestS atoms located on a neighbor NbS2 monolayer. Cleavage of thebulk structure parallel to the {100} plane produces the edgesurface models exposing coordinatively unsaturated molybde-num or sulfur atoms (see Figure 1c). Such a model of a singlelayer exposes simultaneously the two well-known kinds of MoS2-like catalysts edges: the M-edge at the top of Figure 1c(highlighted by a white circle) and the S-edge at the bottom(highlighted by a red circle). We have just studied the so-calledmetallic M-edge. Figure 2 shows the sulfur coverage for theperiodic models of the Nb-edges used in the present work. Ourmonolayer model exhibits five NbS2 rows (similar to thehighlighted rows in Figure 1c) in the z direction perpendicular tothe surface. The periodicity in the x direction along the edges ofthe sheets in four Nb−Nb distances (4× 1 supercell) so that fournonequivalent Nb surfaces sites are present. The Nb-edges arefully saturated (100% coverage) when the outermost four Nb
atoms are bonded to eight outermost sulfur atoms, i.e., two byNbatoms (left of Figure 2). The coverage is decreased by removingatoms from the edge. When four S atoms are removed, we havethe edge with 50% of coverage (right of Figure 2). In this case, theNb edges contain two S atoms per cell located in the bridgingposition in-plane with the Nb atoms forming S monomers; whilethe model with 0% coverage contains four nude coordinatedmetallic atoms.Promotion by means of substitution of Nb atoms at the edge
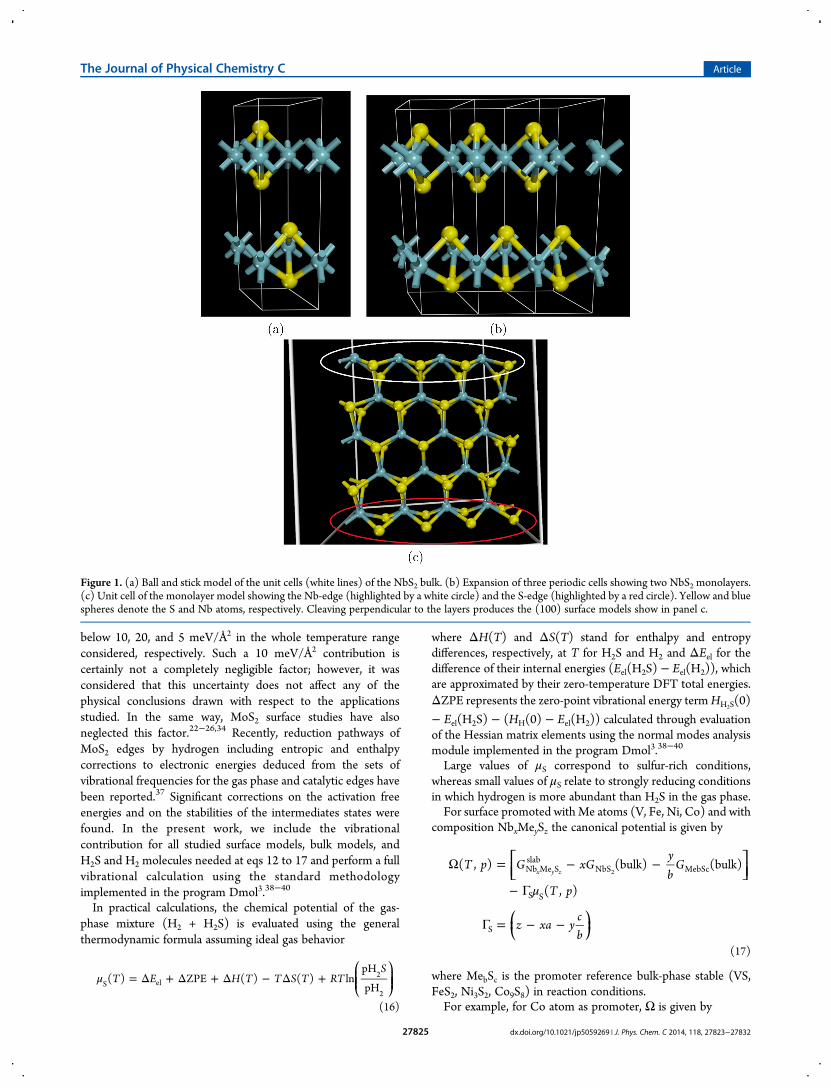
by V, Fe, Co, and Ni was also studied. A very large number oflocal configurations, sulfur coverage, and distribution ofpromoters can be studied. However, we have just investigatedthe most stable models (see Figure 3) as reported by previousDFT calculations (Schweiger et al.23) for the MoS2 monolayerpromoted with Ni and Co atoms: 100% promoted, with 0% Scoverage (Figure 3a); with 50% S coverage in bridgeconfiguration (Figure 3b); with 50% S coverage forming S−Sdimers (Figure 3c); and 50% promotion in alternatedconfiguration with 25% S coverage (Figure 3d).
DFT Calculations. All total energy calculations wereperformed by means of the DMol3 38−40 program using theKohn−Sham Hamiltonian with the gradient-corrected Perdew−Becke−Ermzerhof (PBE) exchange-correlation functional.42
DMol3 calculates variational self-consistent solutions to theDFT equations, expressing numerically the atomic orbital basisfunctions in an accurate spherical-polar mesh. The solutions tothese equations provide the molecular electron densities, whichcan be used to evaluate the total electrostatic potential of thesystem. The numerical double-ζ plus polarization basis setDNP38 was used in all calculations. DMol3 uses a numerical basisset within DFT to obtain high accuracy while maintaining acomputational cost that is relatively low compared to that of
Figure 2. Ball and stick model of a single-layer NbS2 nanoparticle (center). A white circle highlights one edge of the particle. Yellow and blue spheresdenote the S and Nb atoms, respectively. (Left-hand panels) Atomic structure of the fully sulfide Nb-edge with 100% of sulfur coverage. Note thepresence of exposed S2-dimer. (Right-hand panels) Atomic structure of theNb-edge with 50% of S coverage with outermost S atoms in bridgingNb−Nbposition. (Bottom panels) Atomic structure of theNb-edge with 0% sulfur coverage. For each case, top and bottom panels show side- and top-view of themodel.
The Journal of Physical Chemistry C Article
dx.doi.org/10.1021/jp5059269 | J. Phys. Chem. C 2014, 118, 27823−2783227826
other ab initio methods. We have modeled all surfaces usingperiodic slabs with atoms initially located at their ab initio bulkpositions. Vacuum layers thicker than 15 Å were used to ensurethat there were no interactions between adjacent slabs. Thegeometry of those models was optimized using algorithmsincluded in the DMol3 program.
■ RESULTS AND DISCUSSION
Thermodynamic Stability for Nonpromoted Nb andMo Sulfide Monolayers. To determine the stability of thestudied surfaces at HDS conditions, their canonical potentials,Ω,were calculated using 9, 15, 17, and 18. In Figure 4, plots ofΩ as afunction of the pH2S/pH2 ratios at 650 K are presented for theNbS2 monolayer models. At a given pressure ratio, the lower thesurface energy, the more stable the corresponding surface model.Except for the stoichiometric surface (0% coverage), the other
surface terminations are more stable (negative slope) as thepH2S/pH2 ratio (and pH2S) increases. The monolayer with 50%sulfur coverage is the most stable one over the whole pressurerange. For very strong sulfiding conditions (pH2S/pH2 > 500),100% and 50% coverage are relevant and compete in stability. AtHDS conditions (0.01≥ pH2S/pH2≤ 0.05) theNbS2monolayerwith 50% S coverage is by far more stable than surfaces with100% coverage. This follows the same trend reported for MoS2multilayers case.21 Nevertheless, a few differences at strongsulfiding conditions were observed. Therefore, we haveperformed a similar study for similar MoS2 monolayers, andthe results are shown in Figure 5. For MoS2, there is anintersection point between the stability lines of 50% and 100% Scoverage at pH2S/pH2 = 1000. Above this value, correspondingto high H2S pressure, the 100% coverage is the most stable state.For NbS2, the monolayer with 50% coverage is the most stableconfiguration in the whole pH2S/pH2 range studied. These
Figure 3. Geometries of the MNbS metal edge (M = V, Fe, Co, Ni) for (a) 100% promotion and 0% sulfur coverage, (b) 100% promotion and 50% Scoverage forming bridges, (c) 100% promotion and 50% forming dimers, and (d) 50% promotion and 25 S coverage. Gray, light blue, and yellow spheresdenote M, Nb, and S atoms, respectively.
The Journal of Physical Chemistry C Article
dx.doi.org/10.1021/jp5059269 | J. Phys. Chem. C 2014, 118, 27823−2783227827

results suggest that at 600 K the affinity of the S-dimers on top ofthe Nb-edge is smaller than those on the top of Mo-edge.However, for both catalysts, in order for the metal-edge with100% S coverage to compete in stability with the 50% S coveragea very strong sulfiding environment is required. Interestingly, inFigure 5 it can be seen that the NbS2 monolayers aresystematically more stable than the corresponding surfaces ofMoS2. Similar results have been reported21 for the Mo → Nbsubstitution on MoS2 nanotubes using the density functionaltight-binding method. It was found that composite Mo1−xNbxS2nanotubes (with Nb contents of 5, 10, and 25%) are more stablethan the corresponding pure Mo tubes. In the same way, ab initiostudies of mixed molybdenum−niobium disulfides have shownthat for Nb doping of MoS2 up to 25% the substitutional processis exothermic.14 For these materials, Nb doping causes atransition from semiconductor behavior in MoS2 to metallicperformance in the mixed sulfide. In the present paper, we have
constructed a mixed Mo−Nb monolayer with Mo3Nb2S10composition by substitution of the three upper rows of Nbatoms in the Nb_50S model with Mo atoms (see Figure 6). This
mixed monolayer can be considered to be a simple model ofmolybdenum sulfide supported on niobium sulfide. Thegeometry of this model was optimized, and the canonicalpotential was calculated and also plotted in Figure 5. TheMo_50S surface is appreciably stabilized for the effect of the Nbatoms, and it is more stable than all pure MoS2 surface modelsover the entire range of pressure ratios and very close to theNb_50S surface. This result agrees with the reports about the useof niobium sulfide as a dopant phase in the traditional NiMohydrotreating catalysis12 where it is indicated that niobium ispresent as NbS2 layers, well-dispersed on the support, and inclose contact with the other active components. Nb2Mo3S10
7,19
was prepared and studied, and formation of mixed lamellarsulfide was proven, but it is not clear whether the intralayer or theinterlayer mixed phase was obtained. In any case, the presentresult suggests that the presence of niobium in molybdenumsulfide stabilizes the catalysts. At this point, it is interesting tocheck the thermal and entropic impacts on the stability diagrams
Figure 4. Variation of the canonical potential, Ω(T, pH2S/pH2), as afunction of the pH2S/pH2 ratio at 650 K for the studied NbS2 surfaces.Each line is labeled by the corresponding sulfur coverage. In the plot, apressure range of 10−4 < pH2S/pH2 < 104 is used, corresponding to thestability of the NbS2 phases.
Figure 5. Variation of the canonical potential, Ω(T, pH2S/pH2), as afunction of the pH2S/pH2 ratio at 650 K for the MoS2, NbS2 and mixedstudied surfaces. Each line is labeled by the corresponding sulfur-coverage. In the plot, a pressure range 10−4 < pH2S/pH2 < 104 is used,corresponding to the stability of the NbS2 phases. Green and blue linesdenote the most stable monolayers among pure phases and Mo−Nbmixed monolayers, respectively.
Figure 6. Ball and stick model of mixed MoNb 50S exposing 50% Scoverage at the Mo-edge. Yellow, pink, and blue spheres denote S, Mo,and Nb atoms, respectively.
The Journal of Physical Chemistry C Article
dx.doi.org/10.1021/jp5059269 | J. Phys. Chem. C 2014, 118, 27823−2783227828
of Figures 4 and 5. Therefore, the values of Ω without andincluding the Fvib term for the NbS2, MoS2, andmixed monolayermodels used in those figures were reported in Table S1 ofSupporting Information. These values were calculated forreducing conditions (pH2S/pH2 < 1.0) comprising the typicalHDS conditions (pH2S/pH2 = 0.05) and high H2 pressure. It canbe deduced that vibrational corrections 650 K decrease thecanonical potential for 2.199, 2.023, 1.055, 1.230, 1.061, 1.027,and 0.891 eV for NbS2_100S, NbS2_50S, NbS2_0S,MoS2_100S, MoS2_50S, MoS2_0S, and MoNb_50S mono-layers, respectively. These values mean differences at pH2S/pH2= 0.05 ranging from 23−18% for 100% S coverage to 6−9% for0% S coverage. However, we have observed that the tendency ofthe thermodynamic stability of the models studied generallyremains very similar. A similar conclusion was reported for RuO2surfaces;33 nevertheless, it was stressed that is not a general resultand there might be applications in which the inclusion of thevibrational contribution can be critical.33
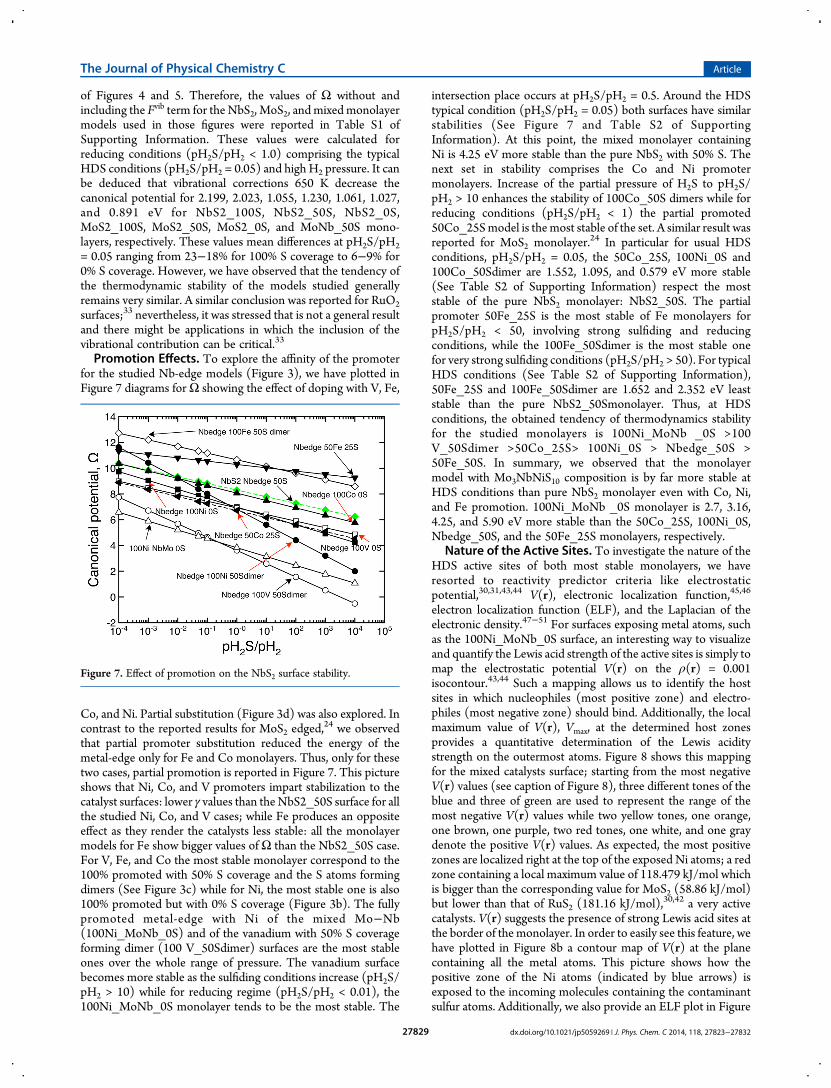
Promotion Effects. To explore the affinity of the promoterfor the studied Nb-edge models (Figure 3), we have plotted inFigure 7 diagrams forΩ showing the effect of doping with V, Fe,
Co, and Ni. Partial substitution (Figure 3d) was also explored. Incontrast to the reported results for MoS2 edged,
24 we observedthat partial promoter substitution reduced the energy of themetal-edge only for Fe and Co monolayers. Thus, only for thesetwo cases, partial promotion is reported in Figure 7. This pictureshows that Ni, Co, and V promoters impart stabilization to thecatalyst surfaces: lower γ values than theNbS2_50S surface for allthe studied Ni, Co, and V cases; while Fe produces an oppositeeffect as they render the catalysts less stable: all the monolayermodels for Fe show bigger values ofΩ than the NbS2_50S case.For V, Fe, and Co the most stable monolayer correspond to the100% promoted with 50% S coverage and the S atoms formingdimers (See Figure 3c) while for Ni, the most stable one is also100% promoted but with 0% S coverage (Figure 3b). The fullypromoted metal-edge with Ni of the mixed Mo−Nb(100Ni_MoNb_0S) and of the vanadium with 50% S coverageforming dimer (100 V_50Sdimer) surfaces are the most stableones over the whole range of pressure. The vanadium surfacebecomes more stable as the sulfiding conditions increase (pH2S/pH2 > 10) while for reducing regime (pH2S/pH2 < 0.01), the100Ni_MoNb_0S monolayer tends to be the most stable. The
intersection place occurs at pH2S/pH2 = 0.5. Around the HDStypical condition (pH2S/pH2 = 0.05) both surfaces have similarstabilities (See Figure 7 and Table S2 of SupportingInformation). At this point, the mixed monolayer containingNi is 4.25 eV more stable than the pure NbS2 with 50% S. Thenext set in stability comprises the Co and Ni promotermonolayers. Increase of the partial pressure of H2S to pH2S/pH2 > 10 enhances the stability of 100Co_50S dimers while forreducing conditions (pH2S/pH2 < 1) the partial promoted50Co_25Smodel is themost stable of the set. A similar result wasreported for MoS2 monolayer.24 In particular for usual HDSconditions, pH2S/pH2 = 0.05, the 50Co_25S, 100Ni_0S and100Co_50Sdimer are 1.552, 1.095, and 0.579 eV more stable(See Table S2 of Supporting Information) respect the moststable of the pure NbS2 monolayer: NbS2_50S. The partialpromoter 50Fe_25S is the most stable of Fe monolayers forpH2S/pH2 < 50, involving strong sulfiding and reducingconditions, while the 100Fe_50Sdimer is the most stable onefor very strong sulfiding conditions (pH2S/pH2 > 50). For typicalHDS conditions (See Table S2 of Supporting Information),50Fe_25S and 100Fe_50Sdimer are 1.652 and 2.352 eV leaststable than the pure NbS2_50Smonolayer. Thus, at HDSconditions, the obtained tendency of thermodynamics stabilityfor the studied monolayers is 100Ni_MoNb _0S >100V_50Sdimer >50Co_25S> 100Ni_0S > Nbedge_50S >50Fe_50S. In summary, we observed that the monolayermodel with Mo3NbNiS10 composition is by far more stable atHDS conditions than pure NbS2 monolayer even with Co, Ni,and Fe promotion. 100Ni_MoNb _0S monolayer is 2.7, 3.16,4.25, and 5.90 eV more stable than the 50Co_25S, 100Ni_0S,Nbedge_50S, and the 50Fe_25S monolayers, respectively.
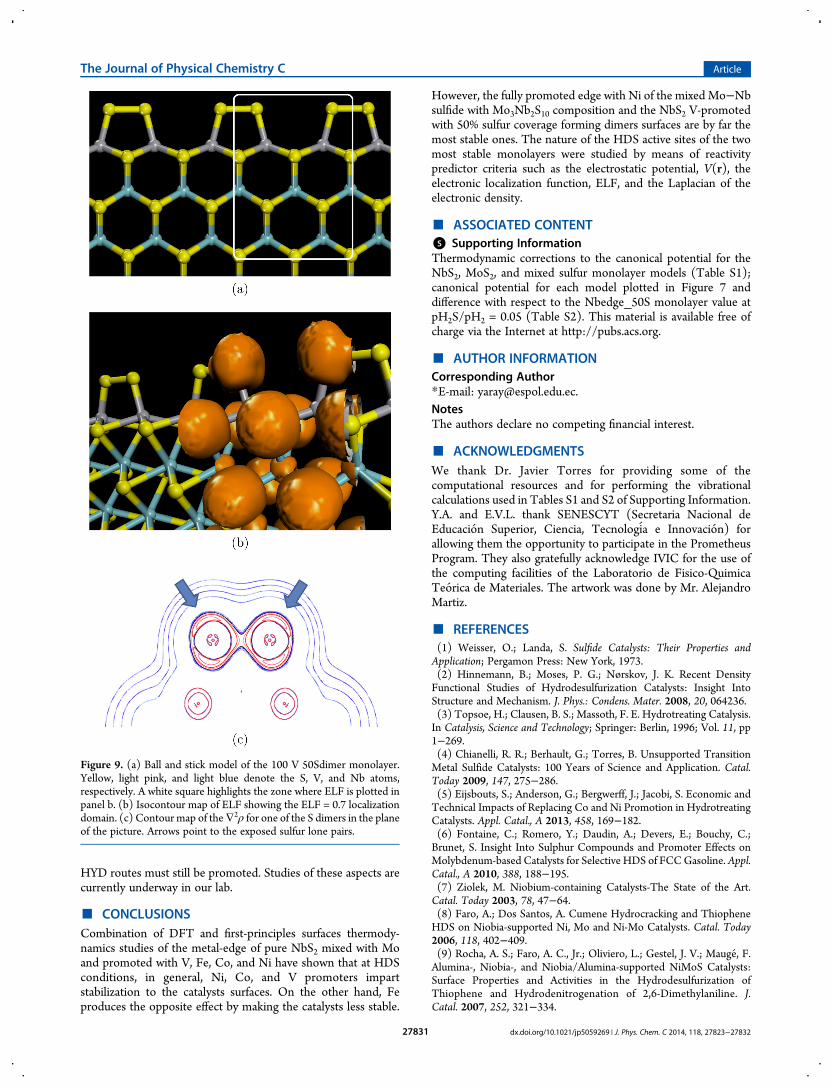
Nature of the Active Sites. To investigate the nature of theHDS active sites of both most stable monolayers, we haveresorted to reactivity predictor criteria like electrostaticpotential,30,31,43,44 V(r), electronic localization function,45,46
electron localization function (ELF), and the Laplacian of theelectronic density.47−51 For surfaces exposing metal atoms, suchas the 100Ni_MoNb_0S surface, an interesting way to visualizeand quantify the Lewis acid strength of the active sites is simply tomap the electrostatic potential V(r) on the ρ(r) = 0.001isocontour.43,44 Such a mapping allows us to identify the hostsites in which nucleophiles (most positive zone) and electro-philes (most negative zone) should bind. Additionally, the localmaximum value of V(r), Vmax, at the determined host zonesprovides a quantitative determination of the Lewis aciditystrength on the outermost atoms. Figure 8 shows this mappingfor the mixed catalysts surface; starting from the most negativeV(r) values (see caption of Figure 8), three different tones of theblue and three of green are used to represent the range of themost negative V(r) values while two yellow tones, one orange,one brown, one purple, two red tones, one white, and one graydenote the positive V(r) values. As expected, the most positivezones are localized right at the top of the exposed Ni atoms; a redzone containing a local maximum value of 118.479 kJ/mol whichis bigger than the corresponding value for MoS2 (58.86 kJ/mol)but lower than that of RuS2 (181.16 kJ/mol),30,42 a very activecatalysts. V(r) suggests the presence of strong Lewis acid sites atthe border of the monolayer. In order to easily see this feature, wehave plotted in Figure 8b a contour map of V(r) at the planecontaining all the metal atoms. This picture shows how thepositive zone of the Ni atoms (indicated by blue arrows) isexposed to the incoming molecules containing the contaminantsulfur atoms. Additionally, we also provide an ELF plot in Figure
Figure 7. Effect of promotion on the NbS2 surface stability.
The Journal of Physical Chemistry C Article
dx.doi.org/10.1021/jp5059269 | J. Phys. Chem. C 2014, 118, 27823−2783227829

8c. ELF associates the localization of an electron with theprobability density for finding a second like-spin electron nearthe reference point.45 ELF gives an idea of where the electronsare localized. In agreement with the electrostatic potentialanalysis, it can be seen that for the Nb-edge of the100Ni_MoNb_0S monolayer, the electrons are localized aroundthe S atoms that are coordinated to the Ni atoms. Finally, aLaplacian of the ρ(r) map for one of those S atoms is shown inFigure 8d. Note the presence of a local charge concentration suchas the well-known “banana” type, which is characteristic of theLewis lone pair.47,49,50 The Laplacian determines the regions ofspace in which the electronic charge is locally concentrated ordepleted.47−51 Wherever the Laplacian of ρ is negative (redcontour in Figure 8d), there is a local concentration of charge,that is, the electronic density is greater than the average density inthe immediate neighborhood.Wherever the Laplacian is positive,there is an analogous local depletion of charge. The localizedconcentrations of charge mimic the pairs of electrons assumed in
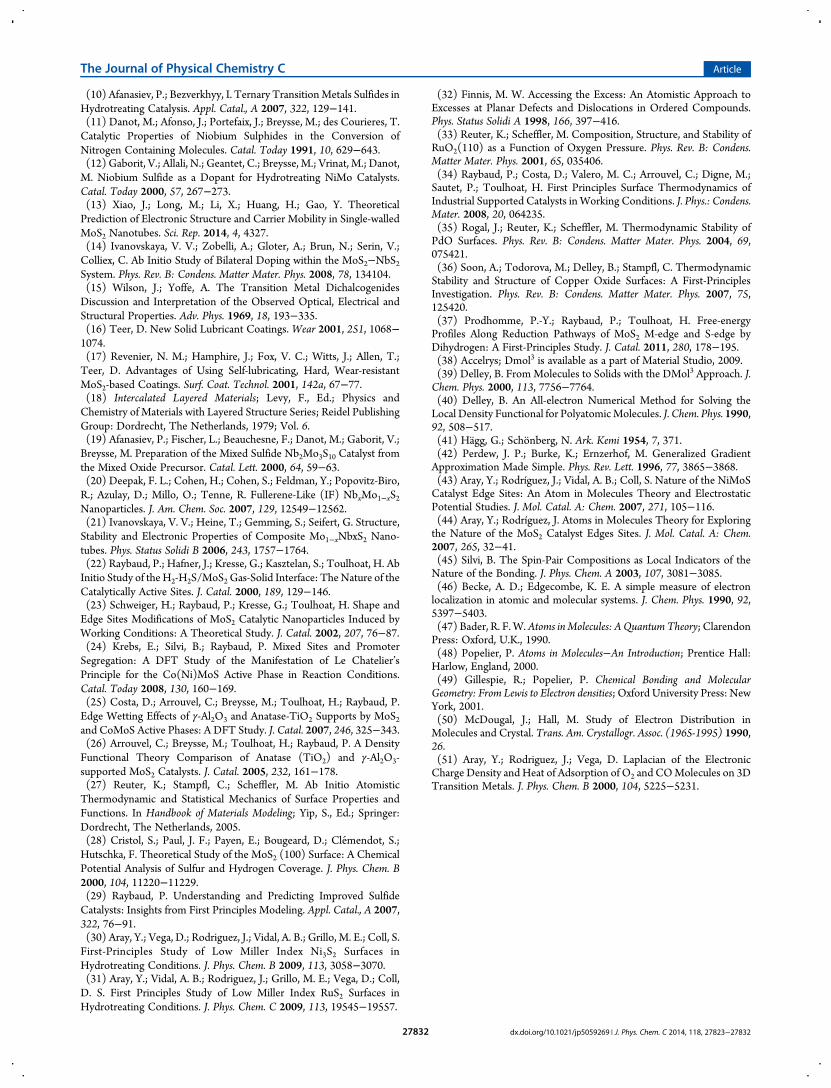
the Lewis model in number, relative position, and size.49 Thelocal charge concentration shown in Figure 9c is located outsidethe monolayer and corresponds to the site where electrons areavailable for attaching with atoms such as hydrogen and formingS−H groups.For the 100 V_50Sdimer monolayer, panels a and b of Figure 9
present its geometry and an isocontour map of ELF showing theELF = 0.7 localization domain, respectively. Note that theelectrons are localized around the S atoms, hindering the accessto the metal atoms. Additionally, Figure 9c displays the Laplaciancontour map just for the S2 dimer located on the Nb-edge. Thismap shows the presence of local charge concentration exposedoutside the surface. These local concentrations are available tolink hydrogen atoms and form SH groups.At this point we stress that very important kinetic aspects are
not considered in this reactivity predictor approach and a morein-depth study of the pathways, transition states, and activationenergies of the elementary reaction involved in the DDS and
Figure 8. (a) Electrostatic potentialV(r) color mapped on the cap of the ρ(r) = 0.001 contour for themixedMoNb 0Smonolayer. The tab at the bottomis blue jay (−157.530 to 78.765 kJ/mol), blue heaven (−78.765 to 42.008 kJ/mol), light blue (−42.008 to −31.506 kJ/mol), dark green (−31.506 to−21.004 kJ/mol), green (−21.004 to −10.502 kJ/mol), light green (−10.502 to 0.000 kJ/mol), light yellow (0.000 to 26.255 kJ/mol), yellow cream(26.255 to 52.510 kJ/mol), orange (52.510 to 65.638 kJ/mol), brown (65.638 to 78.765 kJ/mol), purple (78.765 to 91.893 kJ/mol), light red (91.893 to105.020 kJ/mol), red (105.020 to 144.403 kJ/mol), white (144.403 to 183.75 kJ/mol), and gray (185.75 to 236.295 kJ/mol). (b) Contour mapV(r) justat the plane containing all the metal atoms. Blue and red contours denote the negative and positive value of the electrostatic potential. Arrows point tothe Ni active sites. (c) Isocontour map of ELF showing the ELF = 0.7 localization domain. (d) Contour map of the∇2ρ for one of the S atoms shown inpanel c and in a plane perpendicular to the picture in panel c. A blue arrow points to the exposed S lone pair.
The Journal of Physical Chemistry C Article
dx.doi.org/10.1021/jp5059269 | J. Phys. Chem. C 2014, 118, 27823−2783227830
HYD routes must still be promoted. Studies of these aspects arecurrently underway in our lab.
■ CONCLUSIONSCombination of DFT and first-principles surfaces thermody-namics studies of the metal-edge of pure NbS2 mixed with Moand promoted with V, Fe, Co, and Ni have shown that at HDSconditions, in general, Ni, Co, and V promoters impartstabilization to the catalysts surfaces. On the other hand, Feproduces the opposite effect by making the catalysts less stable.
However, the fully promoted edge with Ni of the mixed Mo−Nbsulfide with Mo3Nb2S10 composition and the NbS2 V-promotedwith 50% sulfur coverage forming dimers surfaces are by far themost stable ones. The nature of the HDS active sites of the twomost stable monolayers were studied by means of reactivitypredictor criteria such as the electrostatic potential, V(r), theelectronic localization function, ELF, and the Laplacian of theelectronic density.
■ ASSOCIATED CONTENT*S Supporting InformationThermodynamic corrections to the canonical potential for theNbS2, MoS2, and mixed sulfur monolayer models (Table S1);canonical potential for each model plotted in Figure 7 anddifference with respect to the Nbedge_50S monolayer value atpH2S/pH2 = 0.05 (Table S2). This material is available free ofcharge via the Internet at http://pubs.acs.org.
■ AUTHOR INFORMATIONCorresponding Author*E-mail: [email protected] authors declare no competing financial interest.
■ ACKNOWLEDGMENTSWe thank Dr. Javier Torres for providing some of thecomputational resources and for performing the vibrationalcalculations used in Tables S1 and S2 of Supporting Information.Y.A. and E.V.L. thank SENESCYT (Secretaria Nacional deEducacion Superior, Ciencia, Tecnologia e Innovacion) forallowing them the opportunity to participate in the PrometheusProgram. They also gratefully acknowledge IVIC for the use ofthe computing facilities of the Laboratorio de Fisico-QuimicaTeorica de Materiales. The artwork was done by Mr. AlejandroMartiz.
■ REFERENCES(1) Weisser, O.; Landa, S. Sulfide Catalysts: Their Properties andApplication; Pergamon Press: New York, 1973.(2) Hinnemann, B.; Moses, P. G.; Nørskov, J. K. Recent DensityFunctional Studies of Hydrodesulfurization Catalysts: Insight IntoStructure and Mechanism. J. Phys.: Condens. Mater. 2008, 20, 064236.(3) Topsoe, H.; Clausen, B. S.; Massoth, F. E. Hydrotreating Catalysis.In Catalysis, Science and Technology; Springer: Berlin, 1996; Vol. 11, pp1−269.(4) Chianelli, R. R.; Berhault, G.; Torres, B. Unsupported TransitionMetal Sulfide Catalysts: 100 Years of Science and Application. Catal.Today 2009, 147, 275−286.(5) Eijsbouts, S.; Anderson, G.; Bergwerff, J.; Jacobi, S. Economic andTechnical Impacts of Replacing Co and Ni Promotion in HydrotreatingCatalysts. Appl. Catal., A 2013, 458, 169−182.(6) Fontaine, C.; Romero, Y.; Daudin, A.; Devers, E.; Bouchy, C.;Brunet, S. Insight Into Sulphur Compounds and Promoter Effects onMolybdenum-based Catalysts for Selective HDS of FCCGasoline. Appl.Catal., A 2010, 388, 188−195.(7) Ziolek, M. Niobium-containing Catalysts-The State of the Art.Catal. Today 2003, 78, 47−64.(8) Faro, A.; Dos Santos, A. Cumene Hydrocracking and ThiopheneHDS on Niobia-supported Ni, Mo and Ni-Mo Catalysts. Catal. Today2006, 118, 402−409.(9) Rocha, A. S.; Faro, A. C., Jr.; Oliviero, L.; Gestel, J. V.; Mauge, F.Alumina-, Niobia-, and Niobia/Alumina-supported NiMoS Catalysts:Surface Properties and Activities in the Hydrodesulfurization ofThiophene and Hydrodenitrogenation of 2,6-Dimethylaniline. J.Catal. 2007, 252, 321−334.
Figure 9. (a) Ball and stick model of the 100 V 50Sdimer monolayer.Yellow, light pink, and light blue denote the S, V, and Nb atoms,respectively. A white square highlights the zone where ELF is plotted inpanel b. (b) Isocontour map of ELF showing the ELF = 0.7 localizationdomain. (c) Contour map of the∇2ρ for one of the S dimers in the planeof the picture. Arrows point to the exposed sulfur lone pairs.
The Journal of Physical Chemistry C Article
dx.doi.org/10.1021/jp5059269 | J. Phys. Chem. C 2014, 118, 27823−2783227831
(10) Afanasiev, P.; Bezverkhyy, I. Ternary TransitionMetals Sulfides inHydrotreating Catalysis. Appl. Catal., A 2007, 322, 129−141.(11) Danot, M.; Afonso, J.; Portefaix, J.; Breysse, M.; des Courieres, T.Catalytic Properties of Niobium Sulphides in the Conversion ofNitrogen Containing Molecules. Catal. Today 1991, 10, 629−643.(12) Gaborit, V.; Allali, N.; Geantet, C.; Breysse, M.; Vrinat, M.; Danot,M. Niobium Sulfide as a Dopant for Hydrotreating NiMo Catalysts.Catal. Today 2000, 57, 267−273.(13) Xiao, J.; Long, M.; Li, X.; Huang, H.; Gao, Y. TheoreticalPrediction of Electronic Structure and Carrier Mobility in Single-walledMoS2 Nanotubes. Sci. Rep. 2014, 4, 4327.(14) Ivanovskaya, V. V.; Zobelli, A.; Gloter, A.; Brun, N.; Serin, V.;Colliex, C. Ab Initio Study of Bilateral Doping within the MoS2−NbS2System. Phys. Rev. B: Condens. Matter Mater. Phys. 2008, 78, 134104.(15) Wilson, J.; Yoffe, A. The Transition Metal DichalcogenidesDiscussion and Interpretation of the Observed Optical, Electrical andStructural Properties. Adv. Phys. 1969, 18, 193−335.(16) Teer, D. New Solid Lubricant Coatings. Wear 2001, 251, 1068−1074.(17) Revenier, N. M.; Hamphire, J.; Fox, V. C.; Witts, J.; Allen, T.;Teer, D. Advantages of Using Self-lubricating, Hard, Wear-resistantMoS2-based Coatings. Surf. Coat. Technol. 2001, 142a, 67−77.(18) Intercalated Layered Materials; Levy, F., Ed.; Physics andChemistry of Materials with Layered Structure Series; Reidel PublishingGroup: Dordrecht, The Netherlands, 1979; Vol. 6.(19) Afanasiev, P.; Fischer, L.; Beauchesne, F.; Danot, M.; Gaborit, V.;Breysse, M. Preparation of the Mixed Sulfide Nb2Mo3S10 Catalyst fromthe Mixed Oxide Precursor. Catal. Lett. 2000, 64, 59−63.(20) Deepak, F. L.; Cohen, H.; Cohen, S.; Feldman, Y.; Popovitz-Biro,R.; Azulay, D.; Millo, O.; Tenne, R. Fullerene-Like (IF) NbxMo1−xS2Nanoparticles. J. Am. Chem. Soc. 2007, 129, 12549−12562.(21) Ivanovskaya, V. V.; Heine, T.; Gemming, S.; Seifert, G. Structure,Stability and Electronic Properties of Composite Mo1−xNbxS2 Nano-tubes. Phys. Status Solidi B 2006, 243, 1757−1764.(22) Raybaud, P.; Hafner, J.; Kresse, G.; Kasztelan, S.; Toulhoat, H. AbInitio Study of theH2-H2S/MoS2 Gas-Solid Interface: TheNature of theCatalytically Active Sites. J. Catal. 2000, 189, 129−146.(23) Schweiger, H.; Raybaud, P.; Kresse, G.; Toulhoat, H. Shape andEdge Sites Modifications of MoS2 Catalytic Nanoparticles Induced byWorking Conditions: A Theoretical Study. J. Catal. 2002, 207, 76−87.(24) Krebs, E.; Silvi, B.; Raybaud, P. Mixed Sites and PromoterSegregation: A DFT Study of the Manifestation of Le Chatelier’sPrinciple for the Co(Ni)MoS Active Phase in Reaction Conditions.Catal. Today 2008, 130, 160−169.(25) Costa, D.; Arrouvel, C.; Breysse, M.; Toulhoat, H.; Raybaud, P.Edge Wetting Effects of γ-Al2O3 and Anatase-TiO2 Supports by MoS2and CoMoS Active Phases: A DFT Study. J. Catal. 2007, 246, 325−343.(26) Arrouvel, C.; Breysse, M.; Toulhoat, H.; Raybaud, P. A DensityFunctional Theory Comparison of Anatase (TiO2) and γ-Al2O3-supported MoS2 Catalysts. J. Catal. 2005, 232, 161−178.(27) Reuter, K.; Stampfl, C.; Scheffler, M. Ab Initio AtomisticThermodynamic and Statistical Mechanics of Surface Properties andFunctions. In Handbook of Materials Modeling; Yip, S., Ed.; Springer:Dordrecht, The Netherlands, 2005.(28) Cristol, S.; Paul, J. F.; Payen, E.; Bougeard, D.; Clemendot, S.;Hutschka, F. Theoretical Study of the MoS2 (100) Surface: A ChemicalPotential Analysis of Sulfur and Hydrogen Coverage. J. Phys. Chem. B2000, 104, 11220−11229.(29) Raybaud, P. Understanding and Predicting Improved SulfideCatalysts: Insights from First Principles Modeling. Appl. Catal., A 2007,322, 76−91.(30) Aray, Y.; Vega, D.; Rodriguez, J.; Vidal, A. B.; Grillo, M. E.; Coll, S.First-Principles Study of Low Miller Index Ni3S2 Surfaces inHydrotreating Conditions. J. Phys. Chem. B 2009, 113, 3058−3070.(31) Aray, Y.; Vidal, A. B.; Rodriguez, J.; Grillo, M. E.; Vega, D.; Coll,D. S. First Principles Study of Low Miller Index RuS2 Surfaces inHydrotreating Conditions. J. Phys. Chem. C 2009, 113, 19545−19557.
(32) Finnis, M. W. Accessing the Excess: An Atomistic Approach toExcesses at Planar Defects and Dislocations in Ordered Compounds.Phys. Status Solidi A 1998, 166, 397−416.(33) Reuter, K.; Scheffler, M. Composition, Structure, and Stability ofRuO2(110) as a Function of Oxygen Pressure. Phys. Rev. B: Condens.Matter Mater. Phys. 2001, 65, 035406.(34) Raybaud, P.; Costa, D.; Valero, M. C.; Arrouvel, C.; Digne, M.;Sautet, P.; Toulhoat, H. First Principles Surface Thermodynamics ofIndustrial Supported Catalysts inWorking Conditions. J. Phys.: Condens.Mater. 2008, 20, 064235.(35) Rogal, J.; Reuter, K.; Scheffler, M. Thermodynamic Stability ofPdO Surfaces. Phys. Rev. B: Condens. Matter Mater. Phys. 2004, 69,075421.(36) Soon, A.; Todorova, M.; Delley, B.; Stampfl, C. ThermodynamicStability and Structure of Copper Oxide Surfaces: A First-PrinciplesInvestigation. Phys. Rev. B: Condens. Matter Mater. Phys. 2007, 75,125420.(37) Prodhomme, P.-Y.; Raybaud, P.; Toulhoat, H. Free-energyProfiles Along Reduction Pathways of MoS2 M-edge and S-edge byDihydrogen: A First-Principles Study. J. Catal. 2011, 280, 178−195.(38) Accelrys; Dmol3 is available as a part of Material Studio, 2009.(39) Delley, B. FromMolecules to Solids with the DMol3 Approach. J.Chem. Phys. 2000, 113, 7756−7764.(40) Delley, B. An All-electron Numerical Method for Solving theLocal Density Functional for PolyatomicMolecules. J. Chem. Phys. 1990,92, 508−517.(41) Hagg, G.; Schonberg, N. Ark. Kemi 1954, 7, 371.(42) Perdew, J. P.; Burke, K.; Ernzerhof, M. Generalized GradientApproximation Made Simple. Phys. Rev. Lett. 1996, 77, 3865−3868.(43) Aray, Y.; Rodríguez, J.; Vidal, A. B.; Coll, S. Nature of the NiMoSCatalyst Edge Sites: An Atom in Molecules Theory and ElectrostaticPotential Studies. J. Mol. Catal. A: Chem. 2007, 271, 105−116.(44) Aray, Y.; Rodríguez, J. Atoms in Molecules Theory for Exploringthe Nature of the MoS2 Catalyst Edges Sites. J. Mol. Catal. A: Chem.2007, 265, 32−41.(45) Silvi, B. The Spin-Pair Compositions as Local Indicators of theNature of the Bonding. J. Phys. Chem. A 2003, 107, 3081−3085.(46) Becke, A. D.; Edgecombe, K. E. A simple measure of electronlocalization in atomic and molecular systems. J. Chem. Phys. 1990, 92,5397−5403.(47) Bader, R. F. W.Atoms inMolecules: A Quantum Theory; ClarendonPress: Oxford, U.K., 1990.(48) Popelier, P. Atoms in Molecules−An Introduction; Prentice Hall:Harlow, England, 2000.(49) Gillespie, R.; Popelier, P. Chemical Bonding and MolecularGeometry: From Lewis to Electron densities; Oxford University Press: NewYork, 2001.(50) McDougal, J.; Hall, M. Study of Electron Distribution inMolecules and Crystal. Trans. Am. Crystallogr. Assoc. (1965-1995) 1990,26.(51) Aray, Y.; Rodriguez, J.; Vega, D. Laplacian of the ElectronicCharge Density and Heat of Adsorption of O2 and COMolecules on 3DTransition Metals. J. Phys. Chem. B 2000, 104, 5225−5231.
The Journal of Physical Chemistry C Article
dx.doi.org/10.1021/jp5059269 | J. Phys. Chem. C 2014, 118, 27823−2783227832
Copyright © 2022 FDOKUMEN


![Observation of [Al(OH) n (H 2 O) 6- n ] n (MoO 4 ) in hydrotreating catalyst precursors by solid-state 27 Al NMR](https://static.fdokumen.com/doc/165x107/6315130285333559270cfb60/observation-of-aloh-n-h-2-o-6-n-n-moo-4-in-hydrotreating-catalyst-precursors.jpg)

![ChemInform Abstract: Fast and Efficient Synthesis of Pyrano[3,2-c]quinolines Catalyzed by Niobium(V) Chloride](https://static.fdokumen.com/doc/165x107/6337c73165077fe2dd044088/cheminform-abstract-fast-and-efficient-synthesis-of-pyrano32-cquinolines-catalyzed.jpg)


![Fast and Efficient Synthesis of Pyrano[3,2- c ]quinolines Catalyzed by Niobium(V) Chloride](https://static.fdokumen.com/doc/165x107/6337c72f65077fe2dd044087/fast-and-efficient-synthesis-of-pyrano32-c-quinolines-catalyzed-by-niobiumv.jpg)