
Influence of the charges deposition on the spatio-temporal self-organization of streamers in a DBD
10
IOP PUBLISHING JOURNAL OF PHYSICS D: APPLIED PHYSICS J. Phys. D: Appl. Phys. 41 (2008) 205214 (10pp) doi:10.1088/0022-3727/41/20/205214 Influence of the charges deposition on the spatio-temporal self-organization of streamers in a DBD S Celestin 1,2 , G Canes-Boussard 1 , O Guaitella 1 , A Bourdon 2 and A Rousseau 1 1 Ecole Polytechnique LPTP, CNRS UMR 7648, 91 128 Palaiseau, France 2 Ecole Centrale Paris EM2C, CNRS UPR 288, 92 295 Chˆ atenay-Malabry, France Received 10 July 2008, in final form 1 September 2008 Published 1 October 2008 Online at stacks.iop.org/JPhysD/41/205214 Abstract At atmospheric pressure, dielectric barrier discharges (DBDs) are mainly constituted of unstably triggered non-equilibrium transient plasma filaments, also called microdischarges. A self-organization of plasma filaments and their interaction with the deposited charges upon the dielectric material has been studied previously for frequencies on the order of a few kilohertz (for example see Guikema et al (2000 Phys. Rev. Lett. 85 3817) and Chirokov et al (2004 Plasma Sources Sci. Technol. 13 623–35)). In this paper we realized a DBD in the configuration cylinder-tip to dielectric plate biased by a low frequency power supply (50 Hz) in synthetic air. Using a CCD camera coupled with electrical diagnostics we observed collective behaviour of plasma filaments in the gas gap, as already observed for asymmetric surface dielectric barrier discharges (ASDBD) in Allegraud et al (2007 J. Phys. D: Appl. Phys. 40 7698–706) and predicted in Guaitella et al (2006 J. Phys. D: Appl. Phys. 39 2964–72). We also show how the surface charge deposited upon the dielectric plate modifies the spatial organization of microdischarges in this experimental device. In parallel, we made an electrostatic model of the experimental device which gave results consistent with the experimental measurements and with the assumption we made on the role of the deposited charges for their impact on the subsequent discharges during a positive half-cycle. (Some figures in this article are in colour only in the electronic version) 1. Introduction Dielectric barrier discharges (DBDs), also known as barrier discharges (BDs) or silent discharges, have been studied since the invention of the ozonizer by Siemens in 1857. Nowadays DBDs are widely used for industrial applications [1, 2], such as gas depollution, surface treatment, excimer lamps, ozone generation and flat plasma displays. At atmospheric pressure (for gaseous gaps on the order of a few millimetres), DBDs are mainly constituted of unstably triggered non-equilibrium transient plasma filaments (also called microdischarges) [2]. The short duration (a few tens of nanoseconds) and unpredictable triggering of these filaments make them difficult to study experimentally. During the last decade, a few authors have succeeded in following the propagation of a single filament (the streamer phase) with high resolution in time and space in a double dielectric barrier configuration, and thus have determined the electron density and electric field inside using spectroscopic diagnostics [3]. In [4] Guikema et al observed self-organized patterns in a one-dimensional symmetric DBD system with He/Ar mixtures and associated the patterns with characteristics for charge transfer during one cycle of the applied voltage (for frequencies on the order of a few kilohertz). They concluded that the patterns resulted from the presence of surface charge deposits; that is, related to the intrinsic so-called memory effect of DBDs (e.g. see [2, 5]). Klein et al [6] progressed further in this study by improving the time resolution of the imaging technique and observed that the patterns obtained in [4] were in fact constituted of several filaments ignited at different times, which were spatially and temporally controlled by the residual surface charges on the dielectric. It is also interesting to note that Chirokov et al also demonstrated in [7] behaviour of 0022-3727/08/205214+10$30.00 1 © 2008 IOP Publishing Ltd Printed in the UK
-
Upload
polytechnique -
Category
Documents
-
view
0 -
download
0
Transcript of Influence of the charges deposition on the spatio-temporal self-organization of streamers in a DBD

IOP PUBLISHING JOURNAL OF PHYSICS D: APPLIED PHYSICS
J. Phys. D: Appl. Phys. 41 (2008) 205214 (10pp) doi:10.1088/0022-3727/41/20/205214
Influence of the charges deposition onthe spatio-temporal self-organizationof streamers in a DBDS Celestin1,2, G Canes-Boussard1, O Guaitella1, A Bourdon2 andA Rousseau1
1 Ecole Polytechnique LPTP, CNRS UMR 7648, 91 128 Palaiseau, France2 Ecole Centrale Paris EM2C, CNRS UPR 288, 92 295 Chatenay-Malabry, France
Received 10 July 2008, in final form 1 September 2008Published 1 October 2008Online at stacks.iop.org/JPhysD/41/205214
AbstractAt atmospheric pressure, dielectric barrier discharges (DBDs) are mainly constituted ofunstably triggered non-equilibrium transient plasma filaments, also called microdischarges.A self-organization of plasma filaments and their interaction with the deposited charges uponthe dielectric material has been studied previously for frequencies on the order of a fewkilohertz (for example see Guikema et al (2000 Phys. Rev. Lett. 85 3817) and Chirokov et al(2004 Plasma Sources Sci. Technol. 13 623–35)). In this paper we realized a DBD in theconfiguration cylinder-tip to dielectric plate biased by a low frequency power supply (50 Hz)in synthetic air. Using a CCD camera coupled with electrical diagnostics we observedcollective behaviour of plasma filaments in the gas gap, as already observed for asymmetricsurface dielectric barrier discharges (ASDBD) in Allegraud et al (2007 J. Phys. D: Appl.Phys. 40 7698–706) and predicted in Guaitella et al (2006 J. Phys. D: Appl. Phys. 392964–72). We also show how the surface charge deposited upon the dielectric plate modifiesthe spatial organization of microdischarges in this experimental device. In parallel, we madean electrostatic model of the experimental device which gave results consistent with theexperimental measurements and with the assumption we made on the role of the depositedcharges for their impact on the subsequent discharges during a positive half-cycle.
(Some figures in this article are in colour only in the electronic version)
1. Introduction
Dielectric barrier discharges (DBDs), also known as barrierdischarges (BDs) or silent discharges, have been studiedsince the invention of the ozonizer by Siemens in 1857.Nowadays DBDs are widely used for industrial applications [1,2], such as gas depollution, surface treatment, excimerlamps, ozone generation and flat plasma displays. Atatmospheric pressure (for gaseous gaps on the order of afew millimetres), DBDs are mainly constituted of unstablytriggered non-equilibrium transient plasma filaments (alsocalled microdischarges) [2]. The short duration (a fewtens of nanoseconds) and unpredictable triggering of thesefilaments make them difficult to study experimentally.During the last decade, a few authors have succeeded infollowing the propagation of a single filament (the streamerphase) with high resolution in time and space in a double
dielectric barrier configuration, and thus have determined theelectron density and electric field inside using spectroscopicdiagnostics [3].
In [4] Guikema et al observed self-organized patternsin a one-dimensional symmetric DBD system with He/Armixtures and associated the patterns with characteristics forcharge transfer during one cycle of the applied voltage (forfrequencies on the order of a few kilohertz). They concludedthat the patterns resulted from the presence of surface chargedeposits; that is, related to the intrinsic so-called memory effectof DBDs (e.g. see [2, 5]). Klein et al [6] progressed furtherin this study by improving the time resolution of the imagingtechnique and observed that the patterns obtained in [4] were infact constituted of several filaments ignited at different times,which were spatially and temporally controlled by the residualsurface charges on the dielectric. It is also interesting to notethat Chirokov et al also demonstrated in [7] behaviour of
0022-3727/08/205214+10$30.00 1 © 2008 IOP Publishing Ltd Printed in the UK

J. Phys. D: Appl. Phys. 41 (2008) 205214 S Celestin et al
Figure 1. Scheme of the reactor.
self-organization in a plane-to-plane DBD in air at atmosphericpressure driven by high-frequency sinusoidal voltage (kHz)through a comparison of experimental results with a numericalmodel.
Recently, Guaitella et al [8] described the bimodalbehaviour of the statistical distribution of current peaksin a cylindrical DBD, and they concluded that the high-current group was due to the self-triggering of severalfilaments, presumably correlated by a radiative effect calledthe ‘collective effect’. They also studied the impact ofthis collective effect on the injected energy in the discharge,which directly controls the chemistry. Collective behaviour ofmicrodischarges has also been recently observed by imagingwith a CCD camera on asymmetric surface dielectric barrierdischarges (ASDBD) in [9].
This paper seeks to demonstrate such a collective effectalong with the presence of patterns of microdischarges for avolume DBD in air at atmospheric pressure at low frequency(50 Hz) using a new experimental device coupled with animaging method.
Firstly, we describe the experimental setup and thediagnostics in section 2. In section 3 we show the characteristicregimes of the DBD by a statistical study. To show aclear correlation between discharges corresponding to differentpeaks and the collective behaviour of the microdischarges wepresent CCD imaging results of individual current peaks duringthe positive half-cycle in section 4. Then we support theargument that the deposited charges on the dielectric plate areresponsible for the spatial and temporal organization of thedischarges in sections 5 and 6.
2. Experimental setup
2.1. DBD reactor
The discharges are produced in a Pyrex cell (figure 1). Theupper electrode is a cylinder in tungsten (diameter 2 mm)coated with a 1 mm layer of dielectric except on its tip, andit is linked to a 50 Hz sine wave high-voltage power supply.The lower electrode is salt water to allow for imaging. The
Figure 2. Experimental set-up scheme.
discharge was not influenced by the salt concentration or theresulting change in the resistance of the water. In the followingthe conductivity of the water is ∼800 µS cm−1.
The dielectric is a cylindrical Pyrex plate of 2.2 cmdiameter and 2 mm thickness (figures 1 and 2) and placed abovethe water. Dry synthetic air flows at 500 sccm (standard cubiccentimetre) through the 5 mm gap at atmospheric pressure. Agauge controls the pressure downstream of the reactor.
2.2. Electrical diagnostic
At atmospheric pressure in air, breakdown occurs at about13 kV in this reactor. This study was performed for threeapplied voltage amplitudes Va of 15, 18 and 20 kV.
CCD imaging is performed by an Andor iStar 734 camera,via a B7838-UV Pentax objective which is efficient in thespectral range 230–800 nm. The Lecroy LT584M 1 GHz4Gs/s oscilloscope, which can output an electric signal upondetecting a rising front, is used to trigger the camera. Thecamera can be positioned either ‘underneath’ the reactor (assketched in figure 2) to image the plasma zone through thewater or beside the reactor to image the gap. Current peaksare measured with a Fischer F33-5 Rogowski coil with abandwidth from 1 to 100 MHz. A capacitor Cm = 1.11 nFis connected in series with the reactor to measure injectedenergy and charge transfer. Both Va and Vm are measuredwith Lecroy PPE20kV probes (figure 2). The DBD generatesa small number of very short current peaks, measured asvoltage steps across the capacitor as shown in figure 3, dueto the ignition of microdischarges between the electrodes thatare extinguished by the screening from the charge depositedon the dielectric plate (this process occurs over a few tensof nanoseconds) [1, 2]. The first and second current peakscorrespond to the first and second voltage steps, respectively.Although DBDs generally exhibit a great number of currentpeaks, in this configuration only a few current peaks areobserved (up to 4).
Note that in such an experimental configuration, theelectrical signal of the capacitor voltage possesses a jitter ofabout 1 ms because of the usual unpredictability of AC DBDsat atmospheric pressure and low frequency without specificpreparation of the high-field electrode [10]. Moreover, oneor several current peaks occur during the positive half-cycle.
2

J. Phys. D: Appl. Phys. 41 (2008) 205214 S Celestin et al
Figure 3. Screenshot of the oscilloscope. Sinusoidal curve: power supply voltage, 3.75 kV div−1. Measurement capacitor voltage:50 V div−1. Output gate signal of the CCD: arbitrary units. Timebase: 2 ms div−1.
Figure 4. Current peak measured by the Rogowski coil.
The total number of current peaks in one positive half-cycledepends on the applied voltage.
Figure 4 shows an example of a characteristic current peakas a single-shot record, corresponding to the first step on themeasurement capacitor voltage, measured with the Rogowskicoil. We can see that its total duration is about 100 ns andits maximum is about 2 A. After ∼100 ns the current becomesslightly negative (∼− 0.1 A), we assumed that this was due toperturbations in the electrical circuit.
Figure 3 also shows the output gate signal of the CCDcamera. The CCD array is opened when the signal is non-zero.When the power supply changes polarity, the CCD switcheson for 2 ms in order to overlap with the first positive step of themeasured capacitor voltage. The aim of this work is to detectan event corresponding to an individual current peak (one stepin the capacitor voltage) and to record the current peak andthe corresponding image. Given that few current peaks occurduring the positive half-cycle, a CCD gate of 2 ms results inthe detection of only a single current peak. Sometimes, twocurrent peaks can appear during the opening of the CCD, butsuch images are then discarded.
20 30 40 50 60 70 80 90 100 11020
30
40
50
60
70
80
90
100
110
Sta
ir on
cap
acito
r V
olta
ge x
Cm (
nC)
Integral of the current peak (nC)
Figure 5. Closed squares: measured integration of current peakversus the capacitor charge. Dashed line: the linear regression.Solid line: representation of the function y = x.
2.3. Current measurement and charge transfer
The transferred charge is estimated in two ways:
(a) The voltage increase at the measurement capacitor, usingQ = Cm · �Um,
(b) The integration of the current peak, using Q = ∫i(t) · dt
from t = 0 to t (i = 0), for a current peak recorded insingle-shot.
Figure 5 shows that the two measurement methods giveclose results.
We can see that the charge measured using the integralof the current peak is generally less than the charge measuredwith the capacitor. This is due to the sampling of the currentpeak (recorded in single-shot) by the oscilloscope; the integralof the current peak (b) is then slightly underestimated.
2.4. Injected power
We measured the mean power injected in the gas by thedischarge for a given applied voltage amplitude using the
3
J. Phys. D: Appl. Phys. 41 (2008) 205214 S Celestin et al
13 14 15 16 17 18 19 20 2120
40
60
80
100
120
140
160
Inje
cted
pow
er (
mW
)
Va (kV)
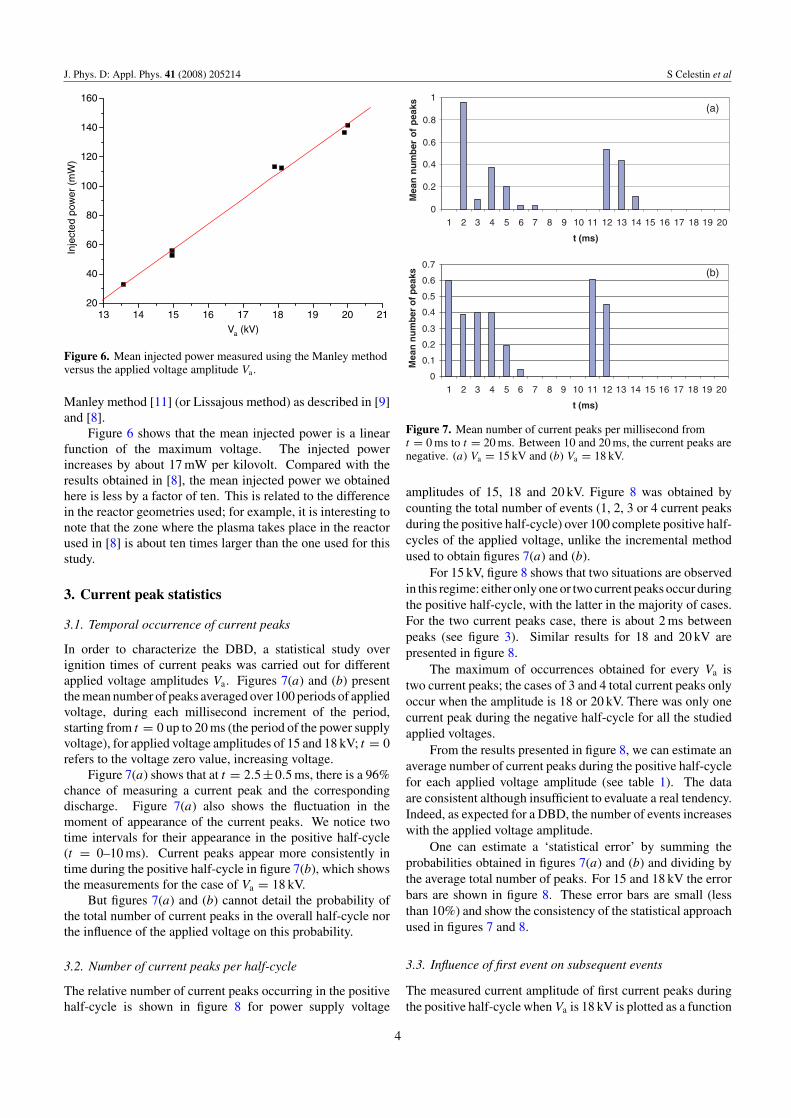
Figure 6. Mean injected power measured using the Manley methodversus the applied voltage amplitude Va.
Manley method [11] (or Lissajous method) as described in [9]and [8].
Figure 6 shows that the mean injected power is a linearfunction of the maximum voltage. The injected powerincreases by about 17 mW per kilovolt. Compared with theresults obtained in [8], the mean injected power we obtainedhere is less by a factor of ten. This is related to the differencein the reactor geometries used; for example, it is interesting tonote that the zone where the plasma takes place in the reactorused in [8] is about ten times larger than the one used for thisstudy.
3. Current peak statistics
3.1. Temporal occurrence of current peaks
In order to characterize the DBD, a statistical study overignition times of current peaks was carried out for differentapplied voltage amplitudes Va. Figures 7(a) and (b) presentthe mean number of peaks averaged over 100 periods of appliedvoltage, during each millisecond increment of the period,starting from t = 0 up to 20 ms (the period of the power supplyvoltage), for applied voltage amplitudes of 15 and 18 kV; t = 0refers to the voltage zero value, increasing voltage.
Figure 7(a) shows that at t = 2.5 ± 0.5 ms, there is a 96%chance of measuring a current peak and the correspondingdischarge. Figure 7(a) also shows the fluctuation in themoment of appearance of the current peaks. We notice twotime intervals for their appearance in the positive half-cycle(t = 0–10 ms). Current peaks appear more consistently intime during the positive half-cycle in figure 7(b), which showsthe measurements for the case of Va = 18 kV.
But figures 7(a) and (b) cannot detail the probability ofthe total number of current peaks in the overall half-cycle northe influence of the applied voltage on this probability.
3.2. Number of current peaks per half-cycle
The relative number of current peaks occurring in the positivehalf-cycle is shown in figure 8 for power supply voltage
0
0.2
0.4
0.6
0.8
1
1 2 3 4 5 6 7 8 9 10 11 12 13 14 15 16 17 18 19 20
t (ms)
Mea
n n
um
ber
of
pea
ks
0
0.1
0.2
0.3
0.4
0.5
0.6
0.7
1 2 3 4 5 6 7 8 9 10 11 12 13 14 15 16 17 18 19 20
t (ms)M
ean
nu
mb
er o
f pea
ks
(a)
(b)
Figure 7. Mean number of current peaks per millisecond fromt = 0 ms to t = 20 ms. Between 10 and 20 ms, the current peaks arenegative. (a) Va = 15 kV and (b) Va = 18 kV.
amplitudes of 15, 18 and 20 kV. Figure 8 was obtained bycounting the total number of events (1, 2, 3 or 4 current peaksduring the positive half-cycle) over 100 complete positive half-cycles of the applied voltage, unlike the incremental methodused to obtain figures 7(a) and (b).
For 15 kV, figure 8 shows that two situations are observedin this regime: either only one or two current peaks occur duringthe positive half-cycle, with the latter in the majority of cases.For the two current peaks case, there is about 2 ms betweenpeaks (see figure 3). Similar results for 18 and 20 kV arepresented in figure 8.
The maximum of occurrences obtained for every Va istwo current peaks; the cases of 3 and 4 total current peaks onlyoccur when the amplitude is 18 or 20 kV. There was only onecurrent peak during the negative half-cycle for all the studiedapplied voltages.
From the results presented in figure 8, we can estimate anaverage number of current peaks during the positive half-cyclefor each applied voltage amplitude (see table 1). The dataare consistent although insufficient to evaluate a real tendency.Indeed, as expected for a DBD, the number of events increaseswith the applied voltage amplitude.
One can estimate a ‘statistical error’ by summing theprobabilities obtained in figures 7(a) and (b) and dividing bythe average total number of peaks. For 15 and 18 kV the errorbars are shown in figure 8. These error bars are small (lessthan 10%) and show the consistency of the statistical approachused in figures 7 and 8.
3.3. Influence of first event on subsequent events
The measured current amplitude of first current peaks duringthe positive half-cycle when Va is 18 kV is plotted as a function
4

J. Phys. D: Appl. Phys. 41 (2008) 205214 S Celestin et al
Va = 15 kV
1 peak
2 peaks
Proportion of occurences (%)
Va = 18 kV
0 20 40 60 80 100
0 20 40 60 80 100
2 peaks
3 peaks
Proportion of occurences (%)
Va = 20 kV
0 5040402010 60
0 peak
1 peak
2 peaks
3 peaks
4 peaks
Proportion of occurences (%)
Figure 8. Number of observed total current peaks by percentage during the positive half-cycle for power supply voltage amplitudes of 15,18 and 20 kV.
Table 1. Average total number of current peaks during the positivehalf-cycle.
Va (kV) 15 18 20〈N〉 1.6 2.2 2.4
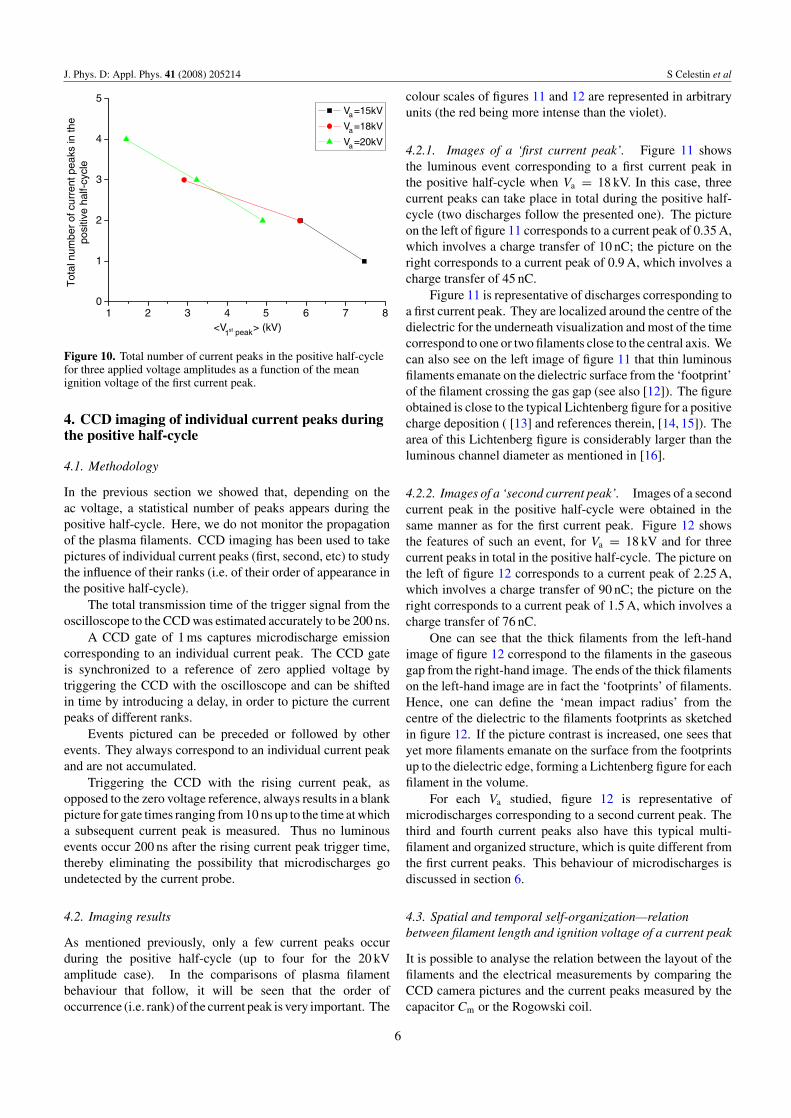
of Vpeak, the ignition voltage of a first current peak, in figure 9.The accuracy of the maximum of a current peak depends onthe sampling rate of the current peak by the oscilloscope. Errorbars are then evaluated according to the sampling rate. Highersampling rates result in smaller error, but lower sampling ratespermit a larger time range.
One can clearly see from figure 9 that the maximum offirst current peak increases with ignition voltage, and the sametrend is observed for the transferred charge corresponding tothe first current peaks. This is not clearly observed for thesubsequent peaks. This is explained further in section 6.
To exhibit the influence of the first current peak on thesubsequent ones for each positive half period we plot infigure 10 the number of peaks per positive half period as afunction of the ignition voltage of the first one.
Figure 10 shows that the subsequent peaks (second, thirdand fourth) are strongly influenced by the first. On average, ifthe first current peak is ignited at small applied voltages, thesubsequent events can be numerous; it becomes possible tohave two, three or four peaks in total. Furthermore, accordingto figure 9, the total number of current peaks is inverselyrelated to the intensity of the first. Figures 9 and 10 showthat the higher the ignition voltage of the first peak, the higher
2.5 3.0 3.5 4.0 4.5 5.0 5.5 6.00.0
0.5
1.0
1.5
2.0
2.5
3.0
3.5
I max
(A
)
Vpeak
(kV)
Figure 9. Measured current amplitude of first current peaks as afunction of the applied voltage at which they occur (Vpeak). Appliedvoltage amplitude: Va = 18 kV.
its corresponding maximum current and charges transferredand the smaller the number of following peaks during thispositive half-cycle. This result is explained further insection 6.
The spatial behaviour of the microdischarges is describedin the following section using CCD images corresponding toindividual current peaks (first, second, etc).
5
J. Phys. D: Appl. Phys. 41 (2008) 205214 S Celestin et al
1 2 3 4 5 6 7 80
1
2
3
4
5
Tot
al n
umbe
r of
cur
rent
pea
ks in
the
posi
tive
half-
cycl
e
<V1st peak> (kV)
Va=15kV
Va=18kV
Va=20kV
Figure 10. Total number of current peaks in the positive half-cyclefor three applied voltage amplitudes as a function of the meanignition voltage of the first current peak.
4. CCD imaging of individual current peaks duringthe positive half-cycle
4.1. Methodology
In the previous section we showed that, depending on theac voltage, a statistical number of peaks appears during thepositive half-cycle. Here, we do not monitor the propagationof the plasma filaments. CCD imaging has been used to takepictures of individual current peaks (first, second, etc) to studythe influence of their ranks (i.e. of their order of appearance inthe positive half-cycle).
The total transmission time of the trigger signal from theoscilloscope to the CCD was estimated accurately to be 200 ns.
A CCD gate of 1 ms captures microdischarge emissioncorresponding to an individual current peak. The CCD gateis synchronized to a reference of zero applied voltage bytriggering the CCD with the oscilloscope and can be shiftedin time by introducing a delay, in order to picture the currentpeaks of different ranks.
Events pictured can be preceded or followed by otherevents. They always correspond to an individual current peakand are not accumulated.
Triggering the CCD with the rising current peak, asopposed to the zero voltage reference, always results in a blankpicture for gate times ranging from 10 ns up to the time at whicha subsequent current peak is measured. Thus no luminousevents occur 200 ns after the rising current peak trigger time,thereby eliminating the possibility that microdischarges goundetected by the current probe.
4.2. Imaging results
As mentioned previously, only a few current peaks occurduring the positive half-cycle (up to four for the 20 kVamplitude case). In the comparisons of plasma filamentbehaviour that follow, it will be seen that the order ofoccurrence (i.e. rank) of the current peak is very important. The
colour scales of figures 11 and 12 are represented in arbitraryunits (the red being more intense than the violet).
4.2.1. Images of a ‘first current peak’. Figure 11 showsthe luminous event corresponding to a first current peak inthe positive half-cycle when Va = 18 kV. In this case, threecurrent peaks can take place in total during the positive half-cycle (two discharges follow the presented one). The pictureon the left of figure 11 corresponds to a current peak of 0.35 A,which involves a charge transfer of 10 nC; the picture on theright corresponds to a current peak of 0.9 A, which involves acharge transfer of 45 nC.
Figure 11 is representative of discharges corresponding toa first current peak. They are localized around the centre of thedielectric for the underneath visualization and most of the timecorrespond to one or two filaments close to the central axis. Wecan also see on the left image of figure 11 that thin luminousfilaments emanate on the dielectric surface from the ‘footprint’of the filament crossing the gas gap (see also [12]). The figureobtained is close to the typical Lichtenberg figure for a positivecharge deposition ( [13] and references therein, [14, 15]). Thearea of this Lichtenberg figure is considerably larger than theluminous channel diameter as mentioned in [16].
4.2.2. Images of a ‘second current peak’. Images of a secondcurrent peak in the positive half-cycle were obtained in thesame manner as for the first current peak. Figure 12 showsthe features of such an event, for Va = 18 kV and for threecurrent peaks in total in the positive half-cycle. The picture onthe left of figure 12 corresponds to a current peak of 2.25 A,which involves a charge transfer of 90 nC; the picture on theright corresponds to a current peak of 1.5 A, which involves acharge transfer of 76 nC.
One can see that the thick filaments from the left-handimage of figure 12 correspond to the filaments in the gaseousgap from the right-hand image. The ends of the thick filamentson the left-hand image are in fact the ‘footprints’ of filaments.Hence, one can define the ‘mean impact radius’ from thecentre of the dielectric to the filaments footprints as sketchedin figure 12. If the picture contrast is increased, one sees thatyet more filaments emanate on the surface from the footprintsup to the dielectric edge, forming a Lichtenberg figure for eachfilament in the volume.
For each Va studied, figure 12 is representative ofmicrodischarges corresponding to a second current peak. Thethird and fourth current peaks also have this typical multi-filament and organized structure, which is quite different fromthe first current peaks. This behaviour of microdischarges isdiscussed in section 6.
4.3. Spatial and temporal self-organization—relationbetween filament length and ignition voltage of a current peak
It is possible to analyse the relation between the layout of thefilaments and the electrical measurements by comparing theCCD camera pictures and the current peaks measured by thecapacitor Cm or the Rogowski coil.
6

J. Phys. D: Appl. Phys. 41 (2008) 205214 S Celestin et al
Dielectric plate
Anode
Figure 11. CCD images of the event corresponding to a first current peak when the camera is set up underneath the reactor (left image) andin perspective from an angle (right image). (Colour online.)
Anode Mean impact radius
Figure 12. CCD images of the event corresponding to a second current peak when the camera is set up underneath the reactor (left image)and in perspective from an angle (right image). (Colour online.)
Mean impact radii were calculated for several currentpeaks and were related to the applied voltage at which thecurrent peaks occur (Vpeak). We realized these measurementfor three applied voltage amplitudes: Va = 15, 18 and 20 kV.
Increasing the applied voltage amplitude Va, reduces theaverage time of the first peak appearance. This is a well-knowneffect in DBDs, which is due to the fact that the total amountof transferred charge in cycles of the applied voltage increaseswith applied voltage. This results in greater residual surfacecharge on the dielectric surface, causing the first peak to ignitesooner. To avoid this shift and make an overall comparison fordifferent Va, 〈V1st peak〉, the average voltage at which the firstpeak occurs for one Va, was estimated and subtracted fromeach Vpeak [9].
The graph in figure 13 clearly shows an increasing linearrelation of the envelope of the points. It must be noticed aswell that data for the three applied voltage amplitudes 15, 18and 20 kV match. Finally, one can see that filaments corre-sponding to peaks of different ranks are in different voltageranges of Vpeak and different length ranges of the mean impactradius. Beyond the fourth peak, we observed that the dielectricplate is not large enough for continuing the tendency shownin figure 13. Filaments which cannot reach the dielectric plateanymore may reach the side of the reactor (also made of Pyrex).
-5 0 5 10 15 200
10
20
30
40
50
60
Fourth current peaks
Third current peaks
Second current peaks
Mea
n Im
pact
Rad
ius
(% o
f the
die
lect
ric r
adiu
s)
Vpeak
- <V1st peak
> (kV)
First current peaks
Figure 13. Mean impact radius length versus the corrected voltage.
The increase in the mean impact radius in one positivehalf-cycle with the rank of the current peak is due to thedeposition of charges by the previous discharges in the samepositive half-cycle; this is confirmed by a simple electrostaticmodel in section 5 and also discussed in section 6.
7

J. Phys. D: Appl. Phys. 41 (2008) 205214 S Celestin et al
Metallic cylinder(anode 13 kV)
Water
Grounded cathode
Dielectric(Pyrex)
z (cm)
r (cm)
Figure 14. Electric field (V m−1) given by the electrostatic model without surface charge on the dielectric plate. Red dashed line: line alongwhich we take the norm of the electric field in figure 15.
5. Electrostatic modelling
A numerical 2D-axisymmetric electrostatic model simulationof the reactor has been performed using COMSOLMultiphysics® to validate the measured transferred charge bya microdischarge and to understand the physical impact ofthe charges deposited on the dielectric plate on the transientfilamentary discharges (figure 14).
Breakdown occurs when the metallic electrode is at about13 kV. As seen previously, the breakdown voltage decreasesfor the subsequent microdischarges due to the depositionof charges on the dielectric. Assuming a quasi-uniformdistribution of the negative charge over the dielectric duringthe negative cycle, the potential difference between the metallicelectrode and the water electrode then has to be on the order of13 kV for a first current peak. Under this assumption, we fixedthe metallic electrode at 13 kV and placed no charge upon thedielectric surface. Having defined the boundary conditions forthe simulation domain, we can obtain the Laplacian electricfield in the gaseous gap (figure 14), and we can also define apositive surface charge density upon the dielectric to model thescreening of the electrostatic field by the transferred positivecharges of a first current peak. This surface charge density isnot homogeneous [3, 17] and is assumed to be Gaussian:
σs(r) = Q
2πσ 2e−r2/2σ 2
, (1)
whereσ is the characteristic length of the charge deposit (whichcan be chosen according to the experimental results) and Q isthe total amount of charge (integration of (1) from r = 0 toinfinity). From the measured mean impact radius of the first
peaks from figure 13, we can take σ = 2×10⁻³ m and look forthe results with different Q. By running this simulation, wefound that Q must be ∼10–100 nC to obtain an electric fieldcomparable to the electric field applied. This corresponds wellto the values we obtained experimentally. In figure 15 we plotthe results of the simulation for the electric field along the reddashed line of figure 14 (called arc-length) from the place of themaximum Laplacian electric field (at the edge of the metalliccylinder electrode) to the dielectric plate, for different Q.
We can see in figure 15 that the value of Q for which themaximum field (at the metallic edge) is the most shielded is40 nC. The electric field increases at this point for lower orhigher Q, with the latter case corresponding to an inversion ofthe field. This fits well with the experimental results, as indeedQ = 40 nC is the average charge transferred by a first currentpeak.
One also can see in figure 15 that the electric field on thedielectric surface increases significantly with Q and can exceedthe breakdown voltage. The physics is then no longer staticand involves the triggering of surface discharges. Of course, adynamic simulation would be necessary to completely modelthis behaviour.
6. Discussion
From this study, it follows that for discharges generated inair at atmospheric pressure using this particular reactor drivenby a 50 Hz sine wave power supply, only a few currentpeaks appear in the positive half-cycle of the applied voltage(similar to the results of [4] for another DBD configuration).The electrical measurements combined with the imaging
8

J. Phys. D: Appl. Phys. 41 (2008) 205214 S Celestin et al
Figure 15. Norm of the electric field for several total amounts of charge upon the dielectric. Arc-length = 3 mm corresponds to the edgeof the metallic electrode and Arc-length = 8 mm corresponds to the dielectric plate with a Gaussian surface charge distribution (1), withσ = 2 × 10⁻³ m.
diagnostics revealed that the first current peak correspondsmostly to a single centred filament in the gaseous gap (section4, figure 11). All of the subsequent peaks always correspond toa bunch of filaments in the gaseous gap (section 4, figure 12).This reveals the generation of several transient discharges in atime window smaller than 50 ns, according to the current peakmeasurements (i.e. figure 4), which is a time scale effectivelyinstantaneous compared with the characteristic rising time ofthe applied voltage (∼1 ms for the results presented herein).Photon radiation coupling may explain the correlation betweenso many filaments over such a time scale. Guaitella et al[8] explained that an initial filament triggers the others byirradiating the dielectric plate, but we can also imagine thatadditional radiative processes by a first streamer play a role,such as photoionization in the high-field region.
Furthermore, we see in figure 12 that the subsequentdischarges following a first peak do not reach the centre ofthe dielectric anymore. More precisely, the mean impactradius was measured as an increasing function of Vpeak (seefigure 13). This effect on the layout of the plasma filamentsis due to the charges deposited on the dielectric. It mustbe noted that the behaviour of the transient filaments andthe measurements of the charge transferred by a first currentpeak are in good agreement with a simple electrostatic modeldiscussed in section 5. This model also confirms that thescreening mechanism of a DBD, that is the deposition ofcharges on a dielectric, changes the entire field configurationin the gaseous gap as well as the propagation of subsequentstreamers. As stated in [16], in a typical discharge situationthere is a competition between individual microdischarges forthe available surface area. In the situation we encounteredin this paper, this competition is dominated by the residualcharges already deposited on the dielectric by the previous
discharges, and this effect makes the filaments of successivecurrent peaks extend farther and farther from the centre ofthe dielectric to deposit their charge. It has to be noted thatin this study we did not observe a single sequence of currentpeaks in the same positive half-cycle of the applied voltage.It was impossible because the readout time of the CCD wastoo long.
Moreover, figure 9 shows that, for the first peak inthe positive half-cycle, the maximum current increases withVpeak, the applied voltage at which the current peak appears.Therefore, because the charge transferred is related to thescreened field, in this experimental configuration, the dischargedoes not occur for a constant voltage in the gaseous gap(meaning the gap above the deposits of charge). Equivalently,the discharge does not occur at a constant field, presumably thebreakdown field, in the high-field region near the metal cylinderedge. Indeed, if the microdischarge occurred at a constantvoltage in the gaseous gap (presumably the breakdown voltagein the considered geometry), it would always generate thesame current necessary to transfer sufficient charge to screenthe electric field. We propose that the ignition time of thefirst current peak (the current–voltage relationship of whichis shown in figure 9) corresponds to the efficiency and thestochasticity of the initiation of the ‘pre-breakdown phase’described in [3, 17] or the ‘Townsend phase’ described in [18].In the configuration used in this paper, the pre-breakdownphase activity occurs at the edge of the metallic cylinderelectrode, where the radius of curvature is smallest and hencewhere the electric field is strongest. The moment of thebeginning of the Townsend phase is suspected here to beinfluenced by the charge deposited on the dielectric, as surfacecharge can affect the secondary emission from the dielectric.The current of this microdischarge is then determined by the
9

J. Phys. D: Appl. Phys. 41 (2008) 205214 S Celestin et al
electric field at the metallic electrode when the microdischargefinally occurs.
The impact of the amount of charge deposited on thedielectric plate on (1) the multi-filament behaviour and (2) theintensity of the discharges cannot be resolved solely by using astatic model; a dynamic model of streamer propagation towarda charged dielectric plate is required.
7. Conclusion
• The electrical measurements combined with the imagingdiagnostics revealed that the first current peak in thepositive half-cycle corresponds mostly to a single centredfilament in the gaseous gap but all of the subsequentpeaks always correspond to organized multi-filamentarydischarges in the gaseous gap. Both kinds of dischargesare strongly branching over the dielectric material.
• The spatial organization of plasma filaments is stronglyaffected by the deposited charges on the dielectricmaterial. A first discharge in the positive half-cycledeposits charges close to the centre of the dielectricplate. Subsequent discharges are affected by these surfacecharges and plasma filaments then impact the dielectricfarther and farther from the centre of the dielectric plate.
• The first current peak ignition time corresponds to theefficiency and the stochasticity of the initiation of the‘pre-breakdown phase’ and consequently the amount oftransferred charges in the positive half-cycle is correlatedwith the voltage at the metallic electrode when a firstcurrent peak occurs. This has an impact on the temporalorganization of discharges in one positive half-cycle.
• A model of the streamers dynamics in such anexperimental configuration is required to fully understandthe transition between the volume streamers and thesurface streamers and to obtain a time resolved model ofthe deposition of charges over the dielectric plate.
Acknowledgment
The authors would like to thank Dr David Pai (EM2C, EcoleCentrale Paris) for his help to improve the quality of this paper.
References
[1] Kogelschatz U, Eliasson B and Egli W 1997 J. Physique IV C4 47–66
[2] Eliasson B and Kogelschatz U 1991 IEEE Trans. Plasma Sci.19 309–23
[3] Kozlov K V, Wagner H-E, Brandenburg R and Michel P 2001J. Phys. D: Appl. Phys. 34 3164–76
[4] Guikema J, Miller N, Niehof J, Klein M and Walhout M 2000Phys. Rev. Lett. 85 3817
[5] Golubovskii Yu B, Maiorov V A, Behnke J and Behnke J F2002 J. Phys. D: Appl. Phys. 35 751–61
[6] Klein M, Miller N and Walhout M 2001 Phys. Rev. E64 026402
[7] Chirokov A, Gutsol A, Fridman A, Sieber K D, Grace J M andRobinson K S 2004 Plasma Sources Sci. Technol.13 623–35
[8] Guaitella O, Thevenet F, Guillard C and Rousseau A 2006J. Phys. D: Appl. Phys. 39 2964–72
[9] Allegraud K, Guaitella O and Rousseau A 2007 J. Phys. D:Appl. Phys. 40 7698–706
[10] Eliasson B and Kogelschatz U 1991 IEEE Trans. Plasma Sci.19 1063–77
[11] Manley T C 1943 Trans. Electrochem. Soc. 84 83–96[12] Celestin S, Allegraud K, Canes-Boussard G, Leick N,
Guaitella O and Rousseau A 2008 IEEE Trans. Plasma. Sci36 1326–7
[13] Murooka Y, Takada T and Hidaka K 2001 IEEE Electr. Insul.Magn. 17 6–16
[14] Bertein H 1973 J. Phys. D: Appl. Phys. 6 1910–9[15] Zhu Y, Takada T, Sakai K and Tu D 1996 J. Phys. D: Appl.
Phys. 29 2892–900[16] Kogelschatz U 2002 IEEE Trans. Plasma Sci. 30 1400–8[17] Yurgelenas Yu V and Wagner H-E 2006 J. Phys. D: Appl.
Phys. 39 4031–43[18] Braun D, Gibalov V and Pietsch G 1992 Plasma Sources Sci.
Technol. 1 166–74
10