Influence of temporal fluctuations in seed abundance on the diet of harvester ants ( Pogonomyrmex...
12
Influence of temporal fluctuations in seed abundance on the diet of harvester ants (Pogonomyrmex spp.) in the central Monte desert, ArgentinaGABRIELA I. PIRK, 1,2 * JAVIER LOPEZ DE CASENAVE, 2 RODRIGO G. POL, 3 LUIS MARONE 3,4 AND FERNANDO A. MILESI 2 1 Laboratorio Ecotono, INIBIOMA, CONICET-Universidad Nacional del Comahue, Pasaje Gutiérrez 1125, 8400 San Carlos de Bariloche, Río Negro (Email: [email protected]), 2 Grupo de Investigación en Ecología de Comunidades de Desierto (ECODES). Departamento de Ecología, Genética y Evolución, FCEyN, Universidad de Buenos Aires, Buenos Aires, 3 Grupo de Investigación en Ecología de Comunidades de Desierto (ECODES), IADIZA-CONICET, Mendoza,Argentina; and 4 Centro de Estudios Avanzados en Ecología y Biodiversidad, P. Universidad Católica de Chile, Santiago, Chile Abstract Harvester ants usually go through temporal fluctuations in environmental seed abundance and com- position which could influence their behaviour and ecology. The aim of this study was to evaluate how these fluctuations influence the diet of Pogonomyrmex rastratus, P.pronotalis and P. inermis (Hymenoptera, Formicidae) in the central Monte desert during three consecutive growing seasons. Although seeds were the main item in the diet, these ants turned more generalist when seed abundance of the most consumed species (grasses Aristida spp., Trichloris crinita, Pappophorum spp., Digitaria californica and Stipa ichu) was low. Accordingly, diversity of items in the diet decreased with seed abundance in a logarithmical fashion, showing higher foraging efficiency for seeds at higher seed abundance. Seed diversity, however, was not related to seed abundance as ants always included several species in their diet, with alternating prevalence. The proportion of the most consumed species increased logarith- mically in the diet of P. rastratus and P. pronotalis along with their abundance in the environment probably as a consequence of diet switching (from forb and shrub seeds to grass seeds) and by an increase in foraging efficiency at higher seed densities. In contrast, foraging activity of P. inermis was very low at low seed abundance and its diet included only the five grasses. Among the most consumed species, proportion in the diet was not associated with relative abundance in the environment. Aristida spp., Pappophorum spp. and D. californica were overall highly selected. However, the flexibility in the diet of P.pronotalis and P. rastratus and the low foraging activity of P. inermis during periods of low resource abundance could attenuate potential top-down effects in the central Monte desert. This study shows that bottom-up effects are important in ant-seed interactions and should be considered when predicting and evaluating ants’ effects on seed resources. Key words: bottom-up effect, desert community, granivory, harvester ant, seed abundance. INTRODUCTION In arid environments, rains are discontinuous and unpredictable, producing a large spatial and temporal heterogeneity in primary production (Noy-Meir 1973). This great variability determines the existence of only few reliable food resources on which consum- ers can specialize (Reichman 1979). Seeds are one of them, as they are abundant in desert soils, they can survive through long droughts, they are rich in energy and nutrients, and they can be collected and stored for later consumption (Brown et al. 1979; Kemp 1989). But although granivory confers on animals some independency from productivity patterns, species- specific plant phenology and rainfall levels often lead to temporal fluctuations in seed abundance and com- position (Kemp 1989; Marone et al. 1998a) which still affect them. For example, fluctuations in seed resources alter migration patterns of granivores (Pulliam & Parker 1979; Marone 1992; Moncroft et al. 2002), modify their abundance (Grant 1986; Schluter & Repasky 1991; Schnurr et al. 2002) and change their behaviour and ecology (Mehlhop & Scott 1983; Crist & MacMahon 1992; Wilby & Shachak 2000; Hulme & Benkman 2002), at several temporal and spatial scales. Conversely, selective seed consumption by granivores may affect the abundance, composition and *Corresponding author. Accepted for publication November 2008. Austral Ecology (2009) 34, 908–919 © 2009 The Authors doi:10.1111/j.1442-9993.2009.01999.x Journal compilation © 2009 Ecological Society of Australia
-
Upload
independent -
Category
Documents
-
view
0 -
download
0
Transcript of Influence of temporal fluctuations in seed abundance on the diet of harvester ants ( Pogonomyrmex...

Influence of temporal fluctuations in seed abundance onthe diet of harvester ants (Pogonomyrmex spp.) in thecentral Monte desert, Argentinaaec_1999 908..919
GABRIELA I. PIRK,1,2* JAVIER LOPEZ DE CASENAVE,2 RODRIGO G. POL,3
LUIS MARONE3,4 AND FERNANDO A. MILESI2
1Laboratorio Ecotono, INIBIOMA, CONICET-Universidad Nacional del Comahue, Pasaje Gutiérrez1125, 8400 San Carlos de Bariloche, Río Negro (Email: [email protected]), 2Grupo deInvestigación en Ecología de Comunidades de Desierto (ECODES). Departamento de Ecología,Genética y Evolución, FCEyN, Universidad de Buenos Aires, Buenos Aires, 3Grupo de Investigación enEcología de Comunidades de Desierto (ECODES), IADIZA-CONICET, Mendoza, Argentina; and4Centro de Estudios Avanzados en Ecología y Biodiversidad, P. Universidad Católica de Chile, Santiago,Chile
Abstract Harvester ants usually go through temporal fluctuations in environmental seed abundance and com-position which could influence their behaviour and ecology. The aim of this study was to evaluate how thesefluctuations influence the diet of Pogonomyrmex rastratus, P. pronotalis and P. inermis (Hymenoptera, Formicidae) inthe central Monte desert during three consecutive growing seasons. Although seeds were the main item in the diet,these ants turned more generalist when seed abundance of the most consumed species (grasses Aristida spp.,Trichloris crinita, Pappophorum spp., Digitaria californica and Stipa ichu) was low. Accordingly, diversity of items inthe diet decreased with seed abundance in a logarithmical fashion, showing higher foraging efficiency for seeds athigher seed abundance. Seed diversity, however, was not related to seed abundance as ants always included severalspecies in their diet, with alternating prevalence.The proportion of the most consumed species increased logarith-mically in the diet of P. rastratus and P. pronotalis along with their abundance in the environment probably as aconsequence of diet switching (from forb and shrub seeds to grass seeds) and by an increase in foraging efficiencyat higher seed densities. In contrast, foraging activity of P. inermis was very low at low seed abundance and its dietincluded only the five grasses. Among the most consumed species, proportion in the diet was not associated withrelative abundance in the environment. Aristida spp., Pappophorum spp. and D. californica were overall highlyselected. However, the flexibility in the diet of P. pronotalis and P. rastratus and the low foraging activity of P. inermisduring periods of low resource abundance could attenuate potential top-down effects in the central Monte desert.This study shows that bottom-up effects are important in ant-seed interactions and should be considered whenpredicting and evaluating ants’ effects on seed resources.
Key words: bottom-up effect, desert community, granivory, harvester ant, seed abundance.
INTRODUCTION
In arid environments, rains are discontinuous andunpredictable, producing a large spatial and temporalheterogeneity in primary production (Noy-Meir1973). This great variability determines the existenceof only few reliable food resources on which consum-ers can specialize (Reichman 1979). Seeds are one ofthem, as they are abundant in desert soils, they cansurvive through long droughts, they are rich in energyand nutrients, and they can be collected and stored forlater consumption (Brown et al. 1979; Kemp 1989).
But although granivory confers on animals someindependency from productivity patterns, species-specific plant phenology and rainfall levels often leadto temporal fluctuations in seed abundance and com-position (Kemp 1989; Marone et al. 1998a) whichstill affect them. For example, fluctuations in seedresources alter migration patterns of granivores(Pulliam & Parker 1979; Marone 1992; Moncroft et al.2002), modify their abundance (Grant 1986; Schluter& Repasky 1991; Schnurr et al. 2002) and change theirbehaviour and ecology (Mehlhop & Scott 1983; Crist& MacMahon 1992; Wilby & Shachak 2000; Hulme &Benkman 2002), at several temporal and spatialscales. Conversely, selective seed consumption bygranivores may affect the abundance, composition and
*Corresponding author.Accepted for publication November 2008.
Austral Ecology (2009) 34, 908–919
© 2009 The Authors doi:10.1111/j.1442-9993.2009.01999.xJournal compilation © 2009 Ecological Society of Australia
distribution of seeds (Whitford 1978; Brown et al.1979; Crist & MacMahon 1992; Mull & MacMahon1996; Marone et al. 1998b) which can ultimatelyproduce changes in plant composition and abundance(Brown et al. 1979; Inouye et al. 1980; Samson et al.1992; Heske et al. 1993; Guo et al. 1995). As seedsand granivores are reciprocally affected, it is importantto study how seed abundance, distribution and com-position affect the abundance, ecology and behaviourof their consumers (i.e. bottom-up effects) in order topredict more accurately the effects of granivores onseed resources (i.e. top-down effects), and therefore, tothoroughly understand seed-granivore interactions.
Harvester ants are highly specialized in seed collect-ing, but occasionally also collect a variety of non-seeditems, such as flowers, plant parts, insects and verte-brate faeces (Whitford 1978; Mehlhop & Scott 1983;Hölldobler & Wilson 1990; MacMahon et al. 2000;Pirk & Lopez de Casenave 2006). Several studies haveshown important temporal variations in harvester antdiet associated with fluctuations in seed abundance(Whitford 1978; Mehlhop & Scott 1983; Rissing1988). In the Chihuahuan desert, Pogonomyrmex deser-torum takes seeds in relation to their availability butconcentrates on grass seeds late in the growing season,when they become more abundant (Whitford 1978).Studies on harvester ants of the genus Messor alsoshowed that ants switch their diet towards less pre-ferred seeds when the most preferred ones are scarce(Tevis 1958; Hölldobler & Wilson 1990; Wilby &Shachak 2000), the basic qualitative prediction of theclassic ‘diet’ model of foraging theory (MacArthur &Pianka 1966; Schoener 1971; Pulliam 1985; Stephens& Krebs 1986). This illustrates how changes in seedabundance can promote functional responses in har-vester ant populations: diet breadth should increase inlean periods through the incorporation of various less-preferred items.
Pogonomyrmex rastratus Mayr, P. pronotalis Santschiand P. inermis Forel (Hymenoptera: Formicidae) arethree sympatric harvester ant species in the centralMonte desert, Argentina (Claver & Fowler 1993; Pirket al. 2004). Their diet is highly granivorous, with aprevalence of grass seeds (Pirk et al. 2004; Pirk &Lopez de Casenave 2006). They have diurnal activitywhich spans from spring to autumn (Pol & Lopez deCasenave 2004). Pogonomyrmex rastratus and P.pronotalis colonies have relatively high seed removalrates throughout their activity season (6 ¥ 104 and5 ¥ 104 seeds colony-1, respectively), suggesting poten-tial top-down effects, especially on preferred grasses(Pirk & Lopez de Casenave 2006). During their activ-ity season, seeds of different species are produced atdifferent times: grasses set seed by the end of thesummer (Marone & Horno 1997), even during dryyears (R. Pol, G. Pirk & L. Marone, unpubl. data);most forbs germinate in spring with the first rains of
the wet season, with their seed production decreasingstrongly during dry periods; and shrubs generallyproduce seeds before grasses and are even less sensi-tive to rainfall levels (Marone et al. 1998a). As Pogono-myrmex species in the central Monte desert appear toconcentrate their foraging on newly produced seeds(Pirk 2007), like other harvester ant species (Price &Joyner 1997), these temporal variations in resourceabundance should influence their diet composition,and consequently, their potential effects on plants.This study focused on bottom-up effects, evaluatinghow the fluctuations in seed abundance and composi-tion over three consecutive growing seasons influencethe diet of the three harvester ants of the centralMonte desert.We studied the association between dietdiversity and abundance of the most consumed seedsin the environment, expecting a more diverse diet atlow abundance. We also analysed the relationshipbetween the proportion in the diet and abundance inthe environment of the most consumed seeds, expect-ing it to be positive. Finally, we studied whether theproportion in the environment influences the propor-tion in the diet of each of the most consumed species,and whether ants select them.
METHODS
Study area
The study was carried out in the Biosphere Reserve ofÑacuñán (34°03′S, 67°54′W), in the central portion ofthe Monte desert, Mendoza Province, Argentina. Themain habitat of the reserve is the algarrobal, an openwoodland where Prosopis flexuosa, and Geoffroea deco-rticans trees are scattered within a matrix of perennialtall shrubs (mostly Larrea divaricata, but also Condaliamicrophylla, Capparis atamisquea, Atriplex lampa and L.cuneifolia), low shrubs (Lycium spp., Junellia aspera andAcantholippia seriphioides), and perennial C3 (Stipaichu) and C4 (e.g. Trichloris crinita, Pappophorum spp.,Sporobolus cryptandrus, Aristida spp., Digitaria califor-nica, Setaria leucopila) grasses. Forb cover (e.g. Che-nopodium papulosum, Phacelia artemisioides, Partheniumhysterophorus) is highly variable from year to year.Ñacuñán’s climate is dry and highly seasonal. Meanannual temperature is 15.9°C (1972–2004) and meanannual rainfall is 342 mm with high inter annual varia-tion (range: 91–585 mm; 1972–2004). A total of 75%of the rainfall occurs in spring and summer (October–March).
Seed abundance
Seed abundance of the grasses Aristida spp., T. crinita,Pappophorum spp., D.californica and S. ichu, the species
SEED ABUNDANCE FLUCTUATIONS AND ANT DIET 909
© 2009 The Authors doi:10.1111/j.1442-9993.2009.01999.xJournal compilation © 2009 Ecological Society of Australia

most consumed by P. rastratus, P. pronotalis and P.inermis (Pirk et al. 2004; Pirk & Lopez de Casenave2006) was estimated on four occasions (October,December, February and April) over each of threegrowing seasons (2001–2002, 2002–2003 and 2003–2004). These ants mainly forage recently producedseeds from the soil, in overall good conditions (i.e. withno signs of fungal attack or any external damage; Pirk2007; Pol 2008). We estimated the standing crop ofthese species, which generally disperse their seedsshortly after they mature (Marone et al. 1998a),assuming it as a surrogate of the temporal variation inseed abundance available to these ants (as assumed inprevious studies, e.g. Whitford 1978). Abundance ofrecently produced, undamaged seeds of each speciesper hectare was calculated as the average number ofseeds per individual on every sampling occasion mul-tiplied by the average number of individual plants perhectare, which we assumed constant during the studyperiod. Plant density of each species was estimated inDecember 2003 by counting the number of reproduc-tive plants in 400 quadrats of 1 ¥ 1 m deployed every10 m on a 40 ¥ 10 grid (= 4 ha) in the open woodland.The average number of seeds per individual was esti-mated by removing all the spikes from 10 reproductiveindividuals of each species randomly chosen on everyoccasion from the same area. Seeds were removedfrom the spikes in the laboratory, checked under astereoscopic microscope for good condition (i.e.undamaged mature seeds that did not crumble whenprobed with forceps; Mull and MacMahon (1996))and counted. Seed abundance of the five species wasadded to obtain the total seed abundance of the mostconsumed species.
Diet
The diet of the three species was evaluated using threetechniques: (i) hand collection of items brought backto the nest by foragers; (ii) collection of items with asemiautomated device with pitfall traps; and (iii) col-lection of middens. The hand collection techniqueconsisted in picking up at least 20 returning foragerswith their loads at each nest entrance with the help offorceps and a teaspoon. The semi-automated collect-ing device was a circular plastic enclosure placedaround the nest entrance, with four pairs of openings(an ‘entrance’ and an ‘exit’ per pair) with soil rampsallowing ant access on the corresponding side of theenclosure. Pitfall traps were set into the ground insidethe enclosure, below the entrances, so that incomingants were captured and their forage could be collected.For the midden collection, a teaspoon-full sample(approximately 3 cm3) was taken of dense areas ofP. inermis’ middens (the only species which presentconspicuous external middens). For a more detailed
description of these techniques, see Pirk et al. (2007).As the three techniques were overall effective and con-sistent in the estimation of the diet of these species(Pirk et al. 2007), we used 1–3 techniques per nest oneach sampling occasion, depending on particular fieldconditions (e.g. middens can only be collected by theend of the summer, when they become accumulated).
Samples were taken during activity seasons 2001–2002, 2002–2003 and 2003–2004, on the same fouroccasions (except for October 2002, when no sam-pling was performed) and in the same area as seedabundance estimation (see above). On every occasion,1–6 colonies of each species were sampled (dependingon the abundance of colonies with foraging activity).Only estimations based on at least 10 items were con-sidered to represent the diet of a colony on any sam-pling occasion.The absence or extremely low levels offoraging activity of P. inermis in December 2002 and ofP. rastratus and P. inermis in October 2003 preventedthe collection of the minimum number of items
0
5
10
106se
eds/
ha
2001-02a
0
5
10
106
seed
s/ha
2002-03b
0
10
20
Oct Dec Feb Apr
106
seed
s/ha
2003-04c
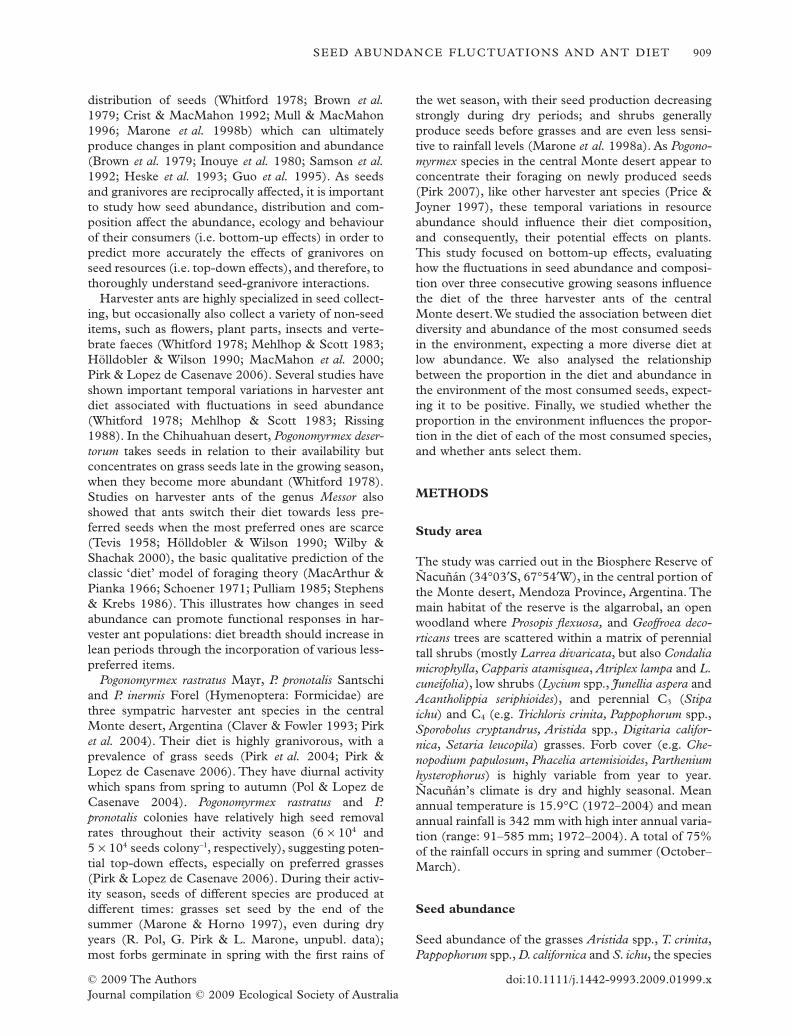
Fig. 1. Seed abundance of Aristida spp. (white), Trichloriscrinita (oblique lines), Pappophorum spp. (dark grey), Digi-taria californica (black) and Stipa ichu (spotted) in the centralMonte desert in October, December, February and April (a)2001–2002, (b) 2002–2003 and (c) 2003–2004.
910 G. I . PIRK ET AL.
© 2009 The Authorsdoi:10.1111/j.1442-9993.2009.01999.xJournal compilation © 2009 Ecological Society of Australia

required. Thus, the diet of P. pronotalis, P. rastratus andP. inermis was estimated on 11, 10 and 9 occasions,respectively.
Items collected with the three techniques were iden-tified and counted in the laboratory. Each item wasassigned to one of the following categories: (i) seeds;(ii) flowers; (iii) fruits (excluding grass caryopses, con-sidered as seeds; see Whitford (1978)); (iv) vegetativeplant parts (non-reproductive structures of plants suchas leaves or stem pieces); (v) invertebrates (eitherpartial or complete); and (vi) other items (e.g. verte-brate feces, soil fragments). Seeds were identified to atleast genus level. The percentage of each type of item(over total number of items) and species of seed (overtotal number of seeds) per colony was averaged acrosscolonies of each ant species per sampling occasion.When more than one technique was employed, datawere pooled.
Diversity of items and of seed species in the dietwere calculated with the Shannon–Wiener index. Astotal number of items and of seeds obtained differedamong colonies, index values were standardized to bebased on the same number of items or seeds (i.e.rarefied to the minimum number of 10 items or 10seeds), using EcoSim Version 7.0 (Gotelli &Entsminger 2001). Kruskal–Wallis tests were used tocompare diversity of items and of seeds betweenspecies, using colonies as replicates. Dunn’s contrastswere performed after significant differences wereobtained (Zar 1996).
Total seed abundance-diet association
The association between seed abundance of the fivemost consumed species and (i) diversity of items; (ii)
2001-02 2002-03 2003-04
0
50
100
a b c
d e f
g h i
%
0
50
100
0
50
100
0
50
100
%
0
50
100
0
50
100
0
50
100
Oct Dec Feb Apr
%
0
50
100
Dic Feb Apr0
50
100
Oct Dec Feb Apr
Fig. 2. Mean percentage of seeds (white), vegetative plant structures (oblique lines), invertebrates (vertical lines), fruits (lightgrey), flowers (dark grey) and other items (black) in the diet of (a–c) Pogonomyrmex rastratus, (d–f) P. pronotalis and (g–i) P. inermisin October, December, February and April (a,d,g) 2001–2002, (b,e,h) 2002–2003 and (c,f,i) 2003–2004 in the central Montedesert. Number of colonies sampled is indicated in Tables 1–3.
SEED ABUNDANCE FLUCTUATIONS AND ANT DIET 911
© 2009 The Authors doi:10.1111/j.1442-9993.2009.01999.xJournal compilation © 2009 Ecological Society of Australia

diversity of seed species; and (iii) percentage of seedsof the most consumed species in the diet were analysedwith linear regressions. Residuals of these analyseswere plotted against fitted values to check if they fittedwell into a linear model (Gotelli & Ellison 2004). Inmost cases in which the regression was significant, abetter fit was achieved by log-transforming seedabundance.
Relative seed abundance-diet association
The association between percentage in the diet and inthe environment of each of the most consumed species(over total number of seeds of the five most consumedspecies) was analysed using the 95% confidence inter-val for the concordance correlation coefficient (Zar1996). Intervals approaching one indicate that seedsare taken in proportion to their availability, whereasintervals which lie far from one indicate selection,either positive (i.e. proportion of seeds in the diet is
higher than in the environment) or negative (i.e. pro-portion of seeds in the diet is lower than in theenvironment).
RESULTS
Seed abundance of Aristida spp., T. crinita, Pappopho-rum spp., D. californica and S. ichu varied greatly allthrough each growing season (Fig. 1). It was generallylower in October and December than in February andApril, for all species except S. ichu, whose productionstarted earlier in the first two studied years (in
Oct Dec Feb Apr
2001-02
0
0.5
1
1.5
H
a
2002-03
0
0.5
1
1.5
H
b
2003-04
0
0.5
1
1.5
H
c
Fig. 3. Mean (+standard error) diversity (H: Shannon–Wiener diversity index) of items (seeds, vegetative plantstructures, fruits, flowers and other items) in the diet of P.rastratus (white), P. pronotalis (grey) and P. inermis (black) inOctober, December, February and April (a) 2001–2002,(b) 2002–2003 and (c) 2003–2004 in the central Montedesert. Number of colonies sampled is indicated inTables 1–3.
0
0.5
1
1.5
2
H
2001-02
a
b ab
a
ns ns
0
0.5
1
1.5
2
H
2003-04c
nsnsns
0
0.5
1
1.5
2
H
2002-03b ns ns
Oct Dec Feb Apr
Fig. 4. Mean (+standard error) diversity of seeds species(H: Shannon–Wiener diversity index) in the diet of P. rastratus(white), P. pronotalis (grey) and P. inermis (black) in October,December, February and April (a) 2001–2002, (b) 2002–2003 and (c) 2003–2004 in the central Monte desert. ‘ns’indicates non-significant differences among ant species(Kruskal–Wallis test; P > 0.05), different letters stand forsignificant differences between species (Dunn’s contrasts;P < 0.05) and absence of letters indicate occasions on whichno statistical tests were performed due to the low number ofcolonies. Number of colonies as in Tables 1–3, minus thosein which fewer than 10 seeds were collected (3 and 2 coloniesof P. rastratus in October 2001 and December 2002, respec-tively; 1 colony of P. pronotalis in February 2002, October2003 and December 2003; and 1 colony of P. inermis inDecember 2003).
912 G. I . PIRK ET AL.
© 2009 The Authorsdoi:10.1111/j.1442-9993.2009.01999.xJournal compilation © 2009 Ecological Society of Australia

December 2001 and in October 2002, respectively).Seeds of T. crinita and S. ichu were the most abundant(Fig. 1).
Most items carried by P. rastratus, P. pronotalis and P.inermis were seeds (Fig. 2). Although seeds always pre-vailed over other types of items, their percentageshowed parallel temporal variations in the three antspecies. The lowest percentages appeared in Octoberand December, whereas in February and April the dietwas almost completely made up of seeds. Vegetativeplant parts, invertebrates and other items (e.g. verte-brate feces, soil fragments) increased in importance inOctober and December, though they never exceeded30% of collected items. Fruits and flowers were, ingeneral, poorly represented. Diversity of items in thediet decreased gradually throughout each season anddid not differ among species on any occasion(Kruskal–Wallis test, P > 0.05, Fig. 3).
Among seeds, T. crinita, Pappophorum spp., Aristidaspp. and S. ichu were prevalent in the diet of P. rastratus(Table 1), Aristida spp., Pappophorum spp. and T.crinita in the diet of P. pronotalis (Table 2) and Pappo-phorum spp., D. californica, T. crinita and S. ichu in thediet of P. inermis diet (Table 3). Other seeds with lowaverage values were occasionally abundant in the diet(S. cryptandrus, D. californica, A. lampa and P. hystero-phorus were important for P. rastratus; S. cryptandrus,
S. ichu, D. californica, Cryptandra mendocina, A. lampaand Larrea spp. for P. pronotalis; only Aristida spp. for P.inermis; Tables 1–3). While P. rastratus and P. pronotaliseventually foraged relatively high proportions of forband shrub seeds (e.g. December 2002 and December2003), P. inermis kept an almost exclusively grass seedsdiet on every occasion.
As regards temporal variations, forb and shrub seedspresented higher percentages in the diet of P. rastratusand P. pronotalis at the beginning of each season(Tables 1 and 2). Percentages of the most consumedspecies varied among sampling occasions, but no clearpattern was detected except for S. ichu, which washighly represented in the diet of the three species at thebeginning of each season (but not later), and T. crinitaand D. californica, which tended to increase towardsthe end of each season in the diet of P. rastratus andP. inermis, respectively (Tables 1–3).
Diversity of seeds in the diet showed variationsamong sampling occasions but no consistent patternwas observed among seasons (Fig. 4). Although thediet of P. pronotalis tended to be the most diverse, itwas only statistically different from any of those ofthe other two species in December 2001, when it dif-fered significantly from the diet of P. rastratus(Kruskal–Wallis test, P < 0.05; Dunn’s contrasts,P < 0.05; Fig. 4). On that occasion, P. rastratus
Table 1. Mean percentage of seeds of different species in the diet of Pogonomyrmex rastratus in October (O), December (D),February (F) and April (A) 2001–2002, 2002–2003 and 2003–2004 in the central Monte desert
Pogonomyrmex rastratus
2001–2002 2002–2003 2003–2004
O D F A D F A D F A
Grasses 100 96.45 89.87 100 40.60 94.74 90.00 22.34 100 100Aristida spp. 43.06 4.13 45.58 24.5 16.67 23.03 5.00 1.67 17.75 4.76Trichloris crinita 12.50 7.22 15.34 52.4 – 49.08 80.00 – 3.11 10.71Pappophorum spp. 11.11 1.50 13.40 6.4 10.68 – – 20.67 37.24 77.38Digitaria californica – 0.05 4.63 4.2 – 2.50 – – 40.0 0 5.95Stipa ichu 11.11 83.36 9.05 6.3 13.25 20.13 5.00 – – –Setaria leucopila – 0.05 0.34 – – – – – 1.90 1.19Sporobolus cryptandrus 22.22 – – – – – – – – –Chloris castilloana – 0.05 1.52 4.2 – – – – – –Diplachne dubia – – – 2.1 – – – – – –Neobouteloua lophostachya – 0.05 – – – – – – – –
Forbs – 3.37 9.95 – 46.15 5.26 5.00 – – –Chenopodium papulosum – – 0.18 – – – – – – –Conyza spp. – 0.29 0.71 – – – – – – –Lactuca serriola – 0.05 0.65 – – – – – – –Parthenium hysterophorus – 3.03 8.41 – 46.15 5.26 5.00 – – –
Shrubs – 0.08 – – 13.25 – 5.00 77.66 – –Atriplex lampa – – – – 2.56 – – 77.66 – –Junellia aspera – – – – 8.12 – 5.00 – – –Larrea spp. – 0.08 – – 2.56 – – – – –
Unidentified – 0.11 0.18 – – – – – – –Number of colonies 3 5 5 4 3 2 1 3 3 3Total number of seeds 17 804 550 158 25 39 20 64 97 84
Bold numbers are total percentages of each seed type.
SEED ABUNDANCE FLUCTUATIONS AND ANT DIET 913
© 2009 The Authors doi:10.1111/j.1442-9993.2009.01999.xJournal compilation © 2009 Ecological Society of Australia

included exclusively S. ichu seeds in the diet but P.pronotalis included high proportions of other speciesas well (Tables 1 and 2).
Diversity of all items in harvester ant diet decreasedlogarithmically with increasing seed abundance with amarked decline in diversity when seed abundanceexceeded 1–6 ¥ 106 seeds ha-1 (Fig. 5a,c,e). Linearregressions of diversity against log(seed abundance)were significant for each species (P. rastratus: H = 3.26–0.44 log10(seeds ha-1), R2 = 0.64, P = 0.005; P. pronota-lis: H = 2.38–0.31 log10(seeds ha-1), R2 = 0.67, P =0.002; P. inermis: H = 2.13–0.28 log10(seeds ha-1), R2 =0.94, P < 0.001). Diversity of seeds of different speciesin the diet, in contrast, was not associated with seedabundance for any ant species (P > 0.05; Fig. 5b,d,f).
Percentage of the five most consumed seeds in P.rastratus’ diet increased logarithmically with their abun-dance in the field (% in the diet = -96.33 + 26.52log10(seeds ha-1), R2 = 0.54, P = 0.015; Fig. 6a). Asimilar pattern was observed for P. pronotalis, althoughwith a marginally significant regression (% in the
diet = -101.08 + 26.43 log10(seeds ha-1), R2 = 0.35,P = 0.053; Fig. 6b).There seemed to be a threshold ofseed abundance (again, between 1–6 ¥ 106 seeds ha-1)above which these two ant species collected almostexclusively the seeds of these five grasses. In contrast,the percentage of these seeds in the diet of P. inermiswas always above 90%, showing no increasing trend(Fig. 6c).
Percentage in the diet of each of the most consumedspecies was not associated with relative abundance inthe environment (most 95% confidence intervals forthe concordance correlation coefficient did notapproach 1; Fig. 7). The only exception was Aristidaspp. for P. inermis, which was taken in proportion to itsavailability (confidence interval: (-0.196, 0.934);Fig. 7). Aristida spp. was highly and positively selectedby P. rastratus and P.pronotalis, Pappophorum spp. by thethree species and D.californica by P.inermis, whereas thepercentage of T. crinita and S. ichu in the diet of P.pronotalis and P. inermis was lower than that in theenvironment.There was also a positive selection for D.
Table 2. Mean percentage of seeds of different species in the diet of Pogonomyrmex pronotalis in October (O), December (D),February (F) and April (A) 2001–2002, 2002–2003 and 2003–2004 in the central Monte desert
Pogonomyrmex pronotalis
2001–2002 2002–2003 2003–2004
O D F A D F A O D F A
Grasses 90.48 92.75 92.67 100 20.13 80.03 98.00 85.22 12.79 96.57 100Aristida spp. 85.71 27.72 50.01 42.11 1.39 25.90 12.00 11.67 – 7.40 32.13Trichloris crinita – 9.03 19.12 34.21 – 9.23 25.00 11.90 – 9.17 20.63Pappophorum spp. – 10.25 8.78 2.63 9.93 26.84 57.00 19.82 9.43 70.84 20.36Digitaria californica – 1.04 10.22 21.05 – 5.90 – – 1.52 8.08 20.63Stipa ichu 4.76 41.60 0.63 – 3.82 6.08 2.00 4.17 – – –Setaria leucopila – 0.94 1.50 – 2.50 6.08 2.00 3.59 – 1.08 1.79Sporobolus cryptandrus – – – – – – – 26.66 – – 4.46Chloris castilloana – – 1.98 – 2.50 – – 7.42 1.85 – –Schismus barbatus – 1.53 – – – – – – – – –Neobouteloua lophostachya – – 0.44 – – – – – – – –Bromus sp. – 0.64 – – – – – – – – –
Forbs 4.76 3.01 6.54 – 36.59 13.12 – 5.51 1.85 1.08 –Chenopodium papulosum – 0.19 – – – – – 1.67 – – –Asteraceae 1 – – – – – – – 1.92 – – –Conyza spp. – 0.27 0.96 – – – – – – – –Cryptandra mendocina – – – – 20.20 – – – – – –Glandularia mendocina – – – – – 11.45 – – – – –Lactuca serriola – – 0.25 – – – – – – – –Lappula redowski 4.76 0.19 0.22 – – – – – – – –Parthenium hysterophorus – 1.80 5.11 – 13.89 – – – 1.85 – –Phacelia artemisioides – – – – – – – – – 1.08 –Sphaeralcea miniata – 0.57 – – 2.50 1.67 – 1.92 – – –
Shrubs 4.76 2.78 0.79 – 43.27 6.85 2.00 9.26 85.35 2.36 –Atriplex lampa – – – – 35.16 – – – 41.08 – –Junellia aspera 4.76 – – – 4.17 5.19 2.00 – 9.85 – –Larrea spp. – – – – 3.95 – – 9.26 34.43 2.36 –Lycium spp. – 2.78 0.79 – – 1.67 – – – – –
Unidentified – 1.46 – – – – – – – – –Number of colonies 1 5 4 1 4 3 2 4 3 3 4Total number of seeds 21 486 382 38 62 51 45 47 44 90 103
914 G. I . PIRK ET AL.
© 2009 The Authorsdoi:10.1111/j.1442-9993.2009.01999.xJournal compilation © 2009 Ecological Society of Australia

Table 3. Mean percentage of seeds of different species in the diet of Pogonomyrmex inermis in October (O), December (D),February (F) and April (A) 2001–2002, 2002–2003 and 2003–2004 in the central Monte desert
Pogonomyrmex inermis
2001–2002 2002–2003 2003–2004
O D F A F A D F A
Grasses 100 100 97.41 98.76 99.94 99.85 100 99.89 100Aristida spp. – 1.26 22.27 10.21 16.02 3.54 – 3.26 0.86Trichloris crinita 7.14 36.79 12.20 17.19 30.72 15.10 3.33 16.61 3.45Pappophorum spp. 42.86 8.65 17.73 1.92 14.98 70.48 88.33 44.84 –Digitaria californica 50.00 0.32 38.43 67.87 17.57 2.57 – 30.95 86.07Stipa ichu – 49.80 2.58 0.44 20.60 8.10 8.33 0.88 –Setaria leucopila – 1.28 0.51 – 0.06 – – – –Sporobolus cryptandrus – – 0.91 – – – – – –Chloris castilloana – – 2.78 1.14 – 0.05 – – –Schismus barbatus – 1.89 – – – – – – –Neobouteloua lophostachya – – – – – – – 3.34 9.62
Forbs – – 2.47 0.88 0.06 0.15 – 0.11 –Asteraceae 1 – – 0.08 – – – – – –Conyza spp. – – 2.20 0.88 0.06 – – – –Cryptandra mendocina – – 0.06 – – – – 0.11 –Lappula redowski – – 0.13 – – – – – –Sphaeralcea miniata – – – – – 0.10 – – –Parthenium hysterophorus – – – – – 0.05 – – –
Unidentified – – 0.13 0.37 – – – – –Number of colonies 1 2 5 5 3 3 3 6 4Total number of seeds 14 209 735 512 1889 1307 37 1484 104
0
0.4
0.8
1.2
H
a
0
0.8
1.6
0 10 20 30 0 10 20 30
b
0
0.4
0.8
1.2
H
c
0 10 20 30 0 10 20 300
0.8
1.6 d
0
0.4
0.8
1.2
106 seeds/ha
H
e
0 10 20 30 0 10 20 300
0.8
1.6
106 seeds/ha
f
Fig. 5. Mean diversity (H: Shannon–Wiener diversity index) of items (black) and seed species (white), in the diet of (a,b) P.rastratus, (c,d) P. pronotalis and (e,f) P. inermis on each sampling occasion as a function of total seed abundance of the five mostconsumed species. Significant logarithmic regression curves are shown as full (P < 0.05).
SEED ABUNDANCE FLUCTUATIONS AND ANT DIET 915
© 2009 The Authors doi:10.1111/j.1442-9993.2009.01999.xJournal compilation © 2009 Ecological Society of Australia

californica by P. rastratus and P. pronotalis and a negativeselection for S. ichu by P. inermis although less markedthan in the other cases (Fig. 7). Trichloris crinita waspositively, negatively or not selected by P. rastratus ondifferent occasions.
DISCUSSION
Although P. rastratus, P. pronotalis and P. inermis arehighly specialized in seed collection, their diet wasmore generalist (including a higher percentage ofinvertebrates, vegetative plant parts and other items)when seed abundance of the most consumed specieswas low, as predicted by the classic ‘diet’ model offoraging theory (Schoener 1971; Stephens & Krebs1986). Messor pergandei showed a similar trend in theSonoran desert, carrying a higher proportion of insectsand a lower proportion of seeds during a drought than
in a wetter period with higher seed abundance (Tevis1958). The diversity of items in the diet decreasedlogarithmically with increasing seed abundance for thethree studied species, suggesting that the foraging effi-ciency of the ants allows them to rely on seeds exclu-sively above certain levels of seed abundance. A highersearch time and a corresponding decrease in their for-aging efficiency may force them to switch to less-preferred items at low seed abundance (Davidson1977; Traniello 1989). However, diversity of seeds ofdifferent species in the diet was not related to grassseed abundance in spite of the important temporalchanges in seed composition in the environment. Antsalways included several species in their diet, with alter-nating prevalence, resulting in no detectable trend inseed diversity in the diet.
Seeds of the most consumed species, Aristida spp.,Pappophorum spp., T. crinita, D. californica and S. ichu,increased their proportion in the diet of P. rastratus andP. pronotalis as their abundance increased in the field.This association was logarithmic, implying that smallchanges in seed abundance at low levels caused propor-tionally greater changes in the proportion in the dietthan at higher levels. Although foraging rates were notmeasured directly, the response of these ants to grassseeds can still be interpreted as Type 3 functionalresponses (Holling 1959), as at low seed abundance theforaging activity is also lower, resulting in very lowconsumption rates and leading to a sigmoidal ratherthan to an hyperbolic function of a Type 2 functionalresponse (Holling 1959). Also, in a Type 3 functionalresponse the proportion of food types in the diet isexpected to increase with their abundance in the envi-ronment, as was found for P. rastratus and P. pronotalis,whereas in a Type 2 response this proportion shoulddecrease (Juliano 2001). Type 3 responses in thecontext of a real community can be generated byswitching on the part of the consumer (i.e. they forageon alternative food types when the main type is scarce),by an increase in searching efficiency or a decrease in itshandling time with increasing food density (Begon et al.1996). In fact, these ants forage on alternative seedtypes when grass seeds are scarce (i.e. forbs and shrubseeds) and their foraging efficiency probably increasesat higher seed abundance by promoting recruitment offoragers to seed patches (increasing searching efficiencyby decreasing search time; Davidson 1977; Traniello1989). Under a Type 3 functional response, the poten-tial for predators to deplete a resource is reduced con-siderably compared with a Type 2 response where theproportion of prey consumed is still high at low levels ofprey availability (Hassell 1978). Thus, the expectedtop-down effects of P. rastratus and P.pronotalis on grassseed abundance would be attenuated as a result of thisparticular functional response.
In contrast to what was observed for P. rastratus andP. pronotalis, the proportion of seeds of the five grass
0
50
100
0 10 20 30
%a
0 10 20 300
50
100
%
b
0 10 20 300
50
100
106seeds/ha
%
c
Fig. 6. Mean percentage of the five most consumed seeds(the grasses Aristida spp., Trichloris crinita, Pappophorum spp.,Digitaria californica and Stipa ichu) in the diet of (a) P. ras-tratus, (b) P. pronotalis and (c) P. inermis on each samplingoccasion as a function of their abundance in the field. Sig-nificant (P < 0.05) or marginally significant regression curvesare shown.
916 G. I . PIRK ET AL.
© 2009 The Authorsdoi:10.1111/j.1442-9993.2009.01999.xJournal compilation © 2009 Ecological Society of Australia

0255075100
025
5075
100
%diet
Aristid
asp
p.
a[-
0.09
9,0.
191]
0255075100
025
5075
100
%diet
f[-
0.06
1,0.
143]
0255075100
025
5075
%en
viro
nmen
t
%diet
k[-
0.19
6,0.
934]
100
0255075100
025
5075
100
Trich
loris
crin
ita
b[-
0.61
3,0.
638]
0255075100
025
5075
100
g[-
0.22
6,0.
332]
0255075100
025
5075
100
%en
viro
nmen
t
l[-
0.16
2,0.
462]
0255075100
025
5075
100
Pa
pp
op
ho
rum
spp.
c[-
0.17
0,0.
208]
0255075100
025
5075
100
h[-
0.22
6,0.
332]
0255075100
025
5075
100
%en
viro
nmen
t
m[-
0.16
8,0.
176]
0255075100
025
5075
100
Dig
ita
ria
ca
lifo
rnic
a
d[-
0.11
2,0.
601]
0255075100
025
5075
100
i[-
0.08
0,0.
678]
0255075100
025
5075
100
%en
viro
nmen
t
n[-
0.04
5,0.
135]
0255075100
025
5075
100
Stip
aic
hu
e[0
.007
,0.7
66]
0255075100
025
5075
100
j[0
.004
,0.4
22]
0255075100
025
5075
100
%en
viro
nmen
t
o[-
0.09
2,0.
464]
Fig
.7.
Mea
npe
rcen
tage
ofth
em
ost
cons
umed
seed
sin
the
diet
of(a
–e)
P.ra
stra
tus,
(f–j
)P.
pron
otal
isan
d(k
–o)
P.in
erm
isas
afu
ncti
onth
eir
perc
enta
gein
the
envi
ronm
ent
onea
chsa
mpl
ing
occa
sion
.D
isco
ntin
uous
lines
repr
esen
tlin
ear
curv
esof
slop
eb
=1.
Lim
its
of95
%co
nfide
nce
inte
rval
for
the
conc
orda
nce
corr
elat
ion
coef
ficie
ntar
esh
own.
SEED ABUNDANCE FLUCTUATIONS AND ANT DIET 917
© 2009 The Authors doi:10.1111/j.1442-9993.2009.01999.xJournal compilation © 2009 Ecological Society of Australia

species in the diet of P. inermis was always very high,independent of seed abundance in the environment.Colonies of P. inermis displayed very low external activ-ity during sampling occasions when these seeds werescarce. Although in this habitat soil temperature istemporally correlated both with low seed abundanceand low ant activity at the beginning of the season, P.inermis also showed low activity levels on those mid-season occasions when soil temperature was highenough but abundance of grass seeds was still low dueto scarce rain (e.g. December 2002, when P. rastratusand P. pronotalis were already foraging actively). Themore restricted diet of P. inermis could lead to a lowerreturn rate of loaded foragers when grass seeds arescarce in their search area, resulting in a negative feed-back that decreases the general foraging activity of thecolony (as experimentally demonstrated for P.barbatus;Gordon 1991). A large decrease in ant activity associ-ated with scarcity of preferred food items has also beenobserved in the harvester ants P. rugosus and M. per-gandei in Arizona (Mehlhop & Scott 1983). Althoughthe response of P. inermis at low levels of seed abun-dance differs from that of P. rastratus and P. pronotalis,its predicted effect on resources was similar: an attenu-ation of top-down effects.
Among grasses, relative abundance of the most con-sumed seeds did not influence their proportion in thediet. Overall, Pappophorum spp., D.californica and Aris-tida spp. were positively selected and thus, they wouldbe the most affected species by ant predation.However, as already mentioned, the flexibility in thediet of P. pronotalis and P. rastratus and the low foragingactivity of P. inermis during periods of low resourceabundance could attenuate this effect. Detailed studiesof total seeds harvested in relation to total seed abun-dance need to be performed throughout the activityseason of the ants to estimate the proportion of totalseeds removed and to determine the most vulnerableperiods.
In summary, the diet and foraging activity of thethree Pogonomyrmex species varied with resourceabundance. Although the three species mainly con-sumed grass seeds, which are produced even duringdroughts (Kemp 1989; R. Pol, G. Pirk & L. Marone,unpubl. data), ant activity season also included periodsof low grass seed abundance. Pogonomyrmex pronotalisand P. rastratus diets were flexible enough to maintaintheir external foraging activity levels during theseperiods. Seeds stored in granaries could act as ‘buffers’(Reyes-López & Fernández-Haeger 2002) to sustainthe internal activities of the colonies (e.g. reproduc-tion, maintenance and brood feeding) while seed col-lecting is scarce. Seed storage could especially benefitspecies with more selective diets, such as P. inermis, thatrestricted its foraging activity to high resource periods.It is important to note that because of its more con-stant diet and higher dependence on grass seeds, P.
inermis could actually be the species displaying thegreatest response to low resource levels, not throughchanging its diet but by minimizing its levels of forag-ing activity.
The simultaneous study of the temporal dynamics ofthe diet together with that of resource abundance andcomposition allowed us to assess the importance ofresource levels on consumers. An inflexible pattern ofconsumption in a system where resources are tempo-rally scarce would result in greater potential for top-down effects of ants on seeds (Crist & MacMahon1992). However, our results indicate the relevance ofbottom-up effects and the attenuation of the expectedtop-down effects at low seed abundance through antsremaining relatively flexible in their diet and foragingactivity patterns. Thus, bottom-up effects should betaken into account when predicting and evaluating theeffects of ants on seed resources.
ACKNOWLEDGEMENTS
We thank Mario Díaz, Víctor Cueto and two anony-mous reviewers for critical comments which helpedto improve the manuscript. Financial support wassupplied by CONICET, ANPCyT of Argentina,ultimately through PICT 01-12199, Universidad deBuenos Aires (UBACyT X/144) and a Grant-in-aid ofResearch awarded to GP by Sigma Xi. This is contri-bution number 62 of the Desert Community EcologyResearch Team (Ecodes) of IADIZA Institute(CONICET) and FCEyN (Universidad de BuenosAires).
REFERENCES
Begon M., Harper J. L. & Townsend C. R. (1996) Ecology:Individuals, Populations and Communities, 3rd edn. BlackwellScience Ltd., Oxford.
Brown J. H., Reichman O. J. & Davidson D.W. (1979) Granivoryin desert ecosystems. Annu. Rev. Ecol. Syst. 10, 201–27.
Claver S. & Fowler H. G. (1993) The ant fauna (Hymenoptera,Formicidae) of the Ñacuñán Biosphere Reserve. Naturalia18, 189–93.
Crist T. O. & MacMahon J. A. (1992) Harvester ant foraging andshrub-steppe seeds: interactions of seed resources and seeduse. Ecology 73, 1768–79.
Davidson D. W. (1977) Foraging ecology and community orga-nization in desert seed-eating ants. Ecology 58, 725–37.
Gordon D. M. (1991) Behavioral flexibility and the foragingecology of seed-eating ants. Am. Nat. 138, 379–411.
Gotelli N. J. & Ellison A. M. (2004) A Primer of EcologicalStatistics. Sinauer Associates, Inc., Sunderland.
Gotelli N. J. & Entsminger G. L. (2001) EcoSim: Null ModelsSoftware for Ecology, version 7.0. Acquired Intelligence Inc.& Kesey-Bear, Burlington.
Grant P. R. (1986) Ecology and Evolution of Darwin’s Finches.Princeton University Press, Princeton.
918 G. I . PIRK ET AL.
© 2009 The Authorsdoi:10.1111/j.1442-9993.2009.01999.xJournal compilation © 2009 Ecological Society of Australia

Guo Q., Thompson D. B., Valone T. J. & Brown J. H. (1995) Theeffects of vertebrate granivores and folivores on plant com-munity structure in the Chihuahuan desert. Oikos 73,251–9.
Hassell M. (1978) The Dynamics of Arthropod Predator–PreySystems. Princeton University Press, Princeton.
Heske E. J., Brown J. H. & Guo Q. (1993) Effects of kangaroo ratexclusion on vegetation structure and plant species diversityin the Chihuahuan desert. Oecologia 95, 520–4.
Hölldobler B. & Wilson E. O. (1990) The Ants. Harvard Univer-sity Press, Cambridge.
Holling C. S. (1959) The components of predation as revealedby a study of small-mammal predation of the European pinesawfly. Can. Entomol. 91, 293–320.
Hulme P. E. & Benkman C. W. (2002) Granivory. In: Plant–Animal Interactions: An Evolutionary Approach (eds C. M.Herrera & O. Pellmyr) pp. 132–54. Blackwells, Oxford.
Inouye R. S., Byers G. & Brown J. H. (1980) Effects of predationand competition on survivorship, fecundity, and communitystructure of desert annuals. Ecology 61, 1344–51.
Juliano S. A. (2001) Non-linear curve fitting: predation andfunctional response curves. In: Design and Analysis of Eco-logical Experiments, 2nd edn. (eds S. M. Scheiner & J. Gure-vitch) pp. 178–96. Chapman and Hall, New York.
Kemp P. R. (1989) Seed bank and vegetation processes indeserts. In: Ecology of Soil Seed Banks (eds M. Allessio Leck,V.T. Parker & R. L. Simpson) pp. 257–81. Academic Press,San Diego.
MacArthur R. H. & Pianka E. R. (1966) On optimal use ofpatchy environment. Am. Nat. 100, 903–9.
MacMahon J. A., Mull J. F. & Crist T. O. (2000) Harvester ants(Pogonomyrmex spp.): their community and ecosysteminfluences. Annu. Rev. Ecol. Syst. 31, 265–91.
Marone L. (1992) Seasonal and year-to-year fluctuations of birdpopulations and guilds in the Monte desert, Argentina. J.Field Ornithol. 63, 294–308.
Marone L. & Horno M. E. (1997) Seed reserves in the centralMonte desert, Argentina: implications for granivory. J. AridEnviron. 36, 661–70.
Marone L., Rossi B. E. & Horno M. E. (1998a) Timing andspatial patterning of seed dispersal and redistribution in aSouth America warm desert. Plant Ecol. 137, 143–50.
Marone L., Rossi B. E. & Lopez de Casenave J. (1998b) Grani-vore impact on soil-seed reserves in the Monte desert,Argentina. Funct. Ecol. 12, 640–5.
Mehlhop P. & Scott N. J. (1983) Temporal patterns of seed useand availability in a guild of desert ants. Ecol. Entomol. 8,69–85.
Moncroft D., Whittingham M. J., Bradbury R. B. & Wilson J. D.(2002) The selection of stubble fields by wintering granivo-rous birds reflects vegetation cover and food abundance. J.Appl. Ecol. 39, 535–47.
Mull J. F. & MacMahon J. A. (1996) Factors determining thespatial variability of seed densities in a shrub-steppe ecosys-tem: the role of harvester ants. J. Arid Environ. 32, 181–92.
Noy-Meir I. (1973) Desert ecosystems: environment andproducers. Annu. Rev. Ecol. Syst. 4, 25–52.
Pirk G. I. (2007) Seed harvesting by ants of the genus Pogono-myrmex in the central Monte desert: seed consumption andimpact on the soil seed bank. Doctoral Thesis, Universidadde Buenos Aires, Buenos Aires, Argentina.
Pirk G. I., Lopez de Casenave J. & Pol R. (2004) Asociación delas hormigas granívoras Pogonomyrmex pronotalis, P. rastratusy P. inermis con caminos en el Monte central. Ecol.Austral 14,65–76.
Pirk G. I. & Lopez de Casenave J. (2006) Diet and seed removalrates by the harvester ants Pogonomyrmex rastratus andPogonomyrmex pronotalis in the central Monte desert,Argentina. Insect. Soc. 53, 119–25.
Pirk G. I., Lopez de Casenave J. & Marone L. (2007) Evaluationof three techniques for the study of harvester ant (Pogono-myrmex spp.) diet. Environ. Entomol. 36, 1092–9.
Pol R. & Lopez de Casenave J. (2004) Activity patterns of har-vester ants Pogonomyrmex pronotalis and Pogonomyrmex ras-tratus in the central Monte desert, Argentina. J. Insect Behav.17, 647–61.
Pol R. G. (2008) Seed harvesting by ants of the genus Pogono-myrmex in the central Monte desert: seed consumption andimpact on the soil seed bank. Doctoral Thesis, Universidadde Buenos Aires, Buenos Aires, Argentina.
Price M.V. & Joyner J.W. (1997) What resources are available todesert granivores: seed rain or soil seed bank? Ecology 78,764–73.
Pulliam H. R. (1985) Foraging efficiency, resource partitioning,and the coexistence of sparrow species. Ecology 66, 1829–36.
Pulliam H. R. & Parker T. A. III (1979) Population regulation ofsparrows. Forts. Zool. 25, 137–47.
Reichman O. J. (1979) Desert granivore foraging and its impacton seed densities and distributions. Ecology 60, 1085–92.
Reyes-López J. L. & Fernández-Haeger J. (2002) Food storage inthe nest and seed selectivity in the harvester ant Messorbarbarus (Hymenoptera: Formicidae). Sociobiology 39,123–8.
Rissing S.W. (1988) Dietary similarity and foraging range of twoseed-harvester ants during resource fluctuations. Oecologia75, 362–6.
Samson D. A., Philippi T. E. & Davidson D.W. (1992) Granivoryand competition as determinants of annual plant diversity inthe Chihuahuan desert. Oikos 64, 61–80.
Schluter D. & Repasky R. R. (1991) Worldwide limitation offinch densities by food and other factors. Ecology 72, 1763–74.
Schnurr J. L., Ostfeld R. S. & Canham C. D. (2002) Direct andindirect effects of masting on rodent populations and treeseed survival. Oikos 96, 402–10.
Schoener T. W. (1971) Theory of feeding strategies. Annu. Rev.Ecol. Syst. 2, 369–404.
Stephens D. W. & Krebs J. R. (1986) Foraging Theory. PrincetonUniversity Press, Princeton.
Tevis L. Jr (1958) Interrelations between the harvester ant Ver-omessor pergandei (Mayr) and some desert ephemerals.Ecology 39, 695–704.
Traniello J. F. A. (1989) Foraging strategies of ants. Annu. Rev.Ecol. Syst. 34, 191–210.
Whitford W. G. (1978) Foraging in seed harvester ants Pogono-myrmex spp. Ecology 59, 185–9.
Wilby A. & Shachak M. (2000) Harvester ant response to spatialand temporal heterogeneity in seed availability: pattern inthe process of granivory. Oecologia 125, 495–503.
Zar J. H. (1996) Biostatistical Analysis, 3rd edn. Prentice Hall,Upper Saddle River.
SEED ABUNDANCE FLUCTUATIONS AND ANT DIET 919
© 2009 The Authors doi:10.1111/j.1442-9993.2009.01999.xJournal compilation © 2009 Ecological Society of Australia