Influence of temperature and salinity on Ostreopsis cf. ovata growth and evaluation of toxin content...
11
Influence of temperature and salinity on Ostreopsis cf. ovata growth and evaluation of toxin content through HR LC-MS and biological assays Laura Pezzolesi a , Franca Guerrini a , Patrizia Ciminiello b , Carmela Dell’Aversano b , Emma Dello Iacovo b , Ernesto Fattorusso b , Martino Forino b , Luciana Tartaglione b , Rossella Pistocchi a, * a Centro Interdipartimentale di Ricerca per le Scienze Ambientali, Universita ` di Bologna, Via S’Alberto 163, 48123 Ravenna, Italy b Dipartimento di Chimica delle Sostanze Naturali, Universita ` degli Studi di Napoli “Federico II”, Via D. Montesano 49, 80131 Napoli, Italy article info Article history: Received 9 March 2011 Received in revised form 4 October 2011 Accepted 16 October 2011 Available online 25 October 2011 Keywords: Ostreopsis cf. ovata Temperature Salinity Toxicity Ovatoxins Haemolysis assay abstract In the Mediterranean Sea, blooms of Ostreopsis cf. ovata and Ostreopsis siamensis have become increasingly frequent in the last decade and O. cf. ovata was found to produce palytoxin-like compounds (putative palytoxin, ovatoxin-a, -b, -c, -d and -e), a class of highly potent toxins. The environmental conditions seem to play a key role in influencing the abundance of Ostreopsis spp. High cell densities are generally recorded in concomitance with relatively high temperature and salinity and low hydrodynamics conditions. In this study the effects of temperature and salinity on the growth and toxicity of an Adriatic O. cf. ovata isolate were investigated. The highest growth rates of the Adriatic strain were recorded for cultures grown at 20 C and at salinity values of 36 and 40, in accordance with natural bloom surveys. Toxicity was affected by growth conditions, with the highest toxin content on a per cell basis being measured at 25 C and salinity 32. However, the highest total toxin content on a per litre basis was recorded at 20 C and salinity 36, since under such conditions the growth yield was the highest. O. cf. ovata had lethal effects on Artemia nauplii and juvenile sea basses, and produced haemolysis of sheep erythrocytes. A comparison between haemolysis neutralization assay and HR LC-MS results showed a good correlation between haemolytic effect and total toxin content measured through HR LC-MS. Considering the increasing need for rapid and sensitive methods to detect palytoxin in natural samples, the haemolytic assay appears a useful method for preliminary quantification of the whole of palytoxin-like compounds in algal extracts. ª 2011 Elsevier Ltd. All rights reserved. 1. Introduction Massive blooms of the benthic dinoflagellates Ostreopsis spp. are reported worldwide in many tropical and temperate regions (Faust et al., 1996; Vila et al., 2001; Aligizaki and Nikolaidis, 2006; Chang et al., 2000; Ciminiello et al., 2008; Mangialajo et al., 2011; Rhodes et al., 2011). In the Mediter- ranean Sea, blooms of O. cf. ovata and Ostreopsis siamensis have been reported since the late ‘70s (Taylor, 1979; Abboud- Abi Saab, 1989) but, in the last decade, they have become * Corresponding author. Tel.: þ39 (0) 544 937376; fax: þ39 (0) 544 937411. E-mail address: [email protected] (R. Pistocchi). Available online at www.sciencedirect.com journal homepage: www.elsevier.com/locate/watres water research 46 (2012) 82 e92 0043-1354/$ e see front matter ª 2011 Elsevier Ltd. All rights reserved. doi:10.1016/j.watres.2011.10.029
Transcript of Influence of temperature and salinity on Ostreopsis cf. ovata growth and evaluation of toxin content...

ww.sciencedirect.com
wat e r r e s e a r c h 4 6 ( 2 0 1 2 ) 8 2e9 2
Available online at w
journal homepage: www.elsevier .com/locate /watres
Influence of temperature and salinity on Ostreopsis cf. ovatagrowth and evaluation of toxin content through HR LC-MS andbiological assays
Laura Pezzolesi a, Franca Guerrini a, Patrizia Ciminiello b, Carmela Dell’Aversano b,Emma Dello Iacovo b, Ernesto Fattorusso b, Martino Forino b, Luciana Tartaglione b,Rossella Pistocchi a,*aCentro Interdipartimentale di Ricerca per le Scienze Ambientali, Universita di Bologna, Via S’Alberto 163, 48123 Ravenna, ItalybDipartimento di Chimica delle Sostanze Naturali, Universita degli Studi di Napoli “Federico II”, Via D. Montesano 49, 80131 Napoli, Italy
a r t i c l e i n f o
Article history:
Received 9 March 2011
Received in revised form
4 October 2011
Accepted 16 October 2011
Available online 25 October 2011
Keywords:
Ostreopsis cf. ovata
Temperature
Salinity
Toxicity
Ovatoxins
Haemolysis assay
* Corresponding author. Tel.: þ39 (0) 544 937E-mail address: rossella.pistocchi@unibo.
0043-1354/$ e see front matter ª 2011 Elsevdoi:10.1016/j.watres.2011.10.029
a b s t r a c t
In the Mediterranean Sea, blooms of Ostreopsis cf. ovata and Ostreopsis siamensis have
become increasingly frequent in the last decade and O. cf. ovata was found to produce
palytoxin-like compounds (putative palytoxin, ovatoxin-a, -b, -c, -d and -e), a class of
highly potent toxins. The environmental conditions seem to play a key role in influencing
the abundance of Ostreopsis spp. High cell densities are generally recorded in concomitance
with relatively high temperature and salinity and low hydrodynamics conditions. In this
study the effects of temperature and salinity on the growth and toxicity of an Adriatic O. cf.
ovata isolate were investigated. The highest growth rates of the Adriatic strain were
recorded for cultures grown at 20 �C and at salinity values of 36 and 40, in accordance with
natural bloom surveys. Toxicity was affected by growth conditions, with the highest toxin
content on a per cell basis being measured at 25 �C and salinity 32.
However, the highest total toxin content on a per litre basis was recorded at 20 �C and
salinity 36, since under such conditions the growth yield was the highest.
O. cf. ovata had lethal effects on Artemia nauplii and juvenile sea basses, and produced
haemolysis of sheep erythrocytes. A comparison between haemolysis neutralization assay
and HR LC-MS results showed a good correlation between haemolytic effect and total toxin
content measured through HR LC-MS. Considering the increasing need for rapid and
sensitive methods to detect palytoxin in natural samples, the haemolytic assay appears
a useful method for preliminary quantification of the whole of palytoxin-like compounds
in algal extracts.
ª 2011 Elsevier Ltd. All rights reserved.
1. Introduction Nikolaidis, 2006; Chang et al., 2000; Ciminiello et al., 2008;
Massive blooms of the benthic dinoflagellates Ostreopsis spp.
are reported worldwide in many tropical and temperate
regions (Faust et al., 1996; Vila et al., 2001; Aligizaki and
376; fax: þ39 (0) 544 9374it (R. Pistocchi).ier Ltd. All rights reserve
Mangialajo et al., 2011; Rhodes et al., 2011). In the Mediter-
ranean Sea, blooms of O. cf. ovata and Ostreopsis siamensis
have been reported since the late ‘70s (Taylor, 1979; Abboud-
Abi Saab, 1989) but, in the last decade, they have become
11.
d.
wat e r r e s e a r c h 4 6 ( 2 0 1 2 ) 8 2e9 2 83
increasingly frequent and resulted in benthic biocenosis
sufferings and human health problems.
Ostreopsis spp., typically, proliferate in shallow and shel-
tered waters, with low hydrodynamism; they form a rusty-
brown coloured mucilaginous film, which covers reefs,
rocks (Bottalico et al., 2002), and soft sediments (Vila et al.,
2001) as well as seaweeds (Vila et al., 2001; Bottalico et al.,
2002; Aligizaki and Nikolaidis, 2006; Totti et al., 2010),
marine angiosperms, and invertebrates (Bianco et al., 2007;
Totti et al., 2007). The presence of Ostreopsis spp. in coastal
waters may pose a real threat to coastal food web and fishery
(Aligizaki et al., 2008). Several marine organisms, in partic-
ular sea urchins, have lost their spines and died during
blooms of O. cf. ovata or O. siamensis (Graneli et al., 2008;
Sansoni et al., 2003; Shears and Ross, 2009); however, the
effects on marine organisms and on ecosystem dynamics are
still unknown.
Ostreopsis spp. are thought to produce palytoxin (or its
analogues) (Taniyama et al., 2003), one of the most potential
toxic marine compounds, which acts on the Naþ/Kþ pump
converting it into an ionic channel and causing the subse-
quent depletion of the Kþ ions (Habermann, 1989). This
hypothesis was later supported by identification of putative
palytoxin as the causative toxin of human poisonings which
occurred during O. siamensis blooms (Onuma et al., 1999) and,
most importantly, by identification of some palytoxin-like
compounds from various Ostreopsis spp. Particularly,
ostreocin-D was isolated from O. siamensis and structurally
elucidated by NMR (Usami et al., 1995; Ukena et al., 2001) while
mascarenotoxinswere identified, basing only onMS evidence,
as palytoxin-like compounds from Ostreopsis mascarenensis
(Lenoir et al., 2004). Putative palytoxin and ovatoxin-a were
detected in field and cultured samples of O. cf. ovata, collected
along the Ligurian coasts (Italy) (Ciminiello et al., 2006; 2008) as
well as in O. cf. ovata cultures from the Adriatic and Tyr-
rhenian Sea (Guerrini et al., 2010) by liquid chromatography-
mass spectrometry (LC-MS). Recently, several new ovatox-
ins, namely ovatoxin-b, -c, -d, and -e, were also detected in an
Adriatic O. cf. ovata culture through an in-depth high resolu-
tion (HR) LC-MS investigation (Ciminiello et al., 2010).
Currently, O. cf. ovata blooms occur each year from June to
late October at several sites on the Italian coastline, charac-
terized by different environmental conditions, such as
seawater temperature in the range 18e30 �C and salinity in the
range 30e39 (Pistocchi et al., 2011). However, O. cf. ovata has
never been detected in the Northwestern Adriatic sea, at sites
located close to the Po river delta, where low salinity values
occur and a coast-offshore salinity gradient affecting micro-
phytobenthos distribution in the northern Adriatic Sea was
observed (Totti, 2003); this suggests that some environmental
conditions play a key role in influencing O. cf. ovata growth
and/or its geographical dispersal.
Several authors indicated seawater temperature is an
important factor affecting cell proliferation (Tognetto et al.,
1995; Sansoni et al., 2003; Simoni et al., 2004; Aligizaki and
Nikolaidis, 2006; Mangialajo et al., 2008). In most studies (as
reviewed by Pistocchi et al., 2011), high temperature values
(24e29 �C) were associated with increases of Ostreopsis cell
number in seawater; however, in the Adriatic (Totti et al.,
2010) and Catalan seas (Vila et al., 2001) such positive
correlation has not been observed. Recently, the influence of
temperature on O. cf. ovata growth and toxicity has been also
reported by Graneli et al. (2011) using a Tyrrhenian isolate
from the Ligurian coast: the highest toxicity was found in
cultures grown at 20 �C, whereas the highest algal biomass
was recorded at 30 �C.In the present study, we report on in-depth investigation
on the effect of some environmental parameters on the
growth and toxicity of O. cf. ovata. An Adriatic O. cf. ovata
isolate, whose growth and toxin profile had been previously
characterized at 20 �C and salinity 36 during the exponential
and stationary phases (Guerrini et al., 2010), was used.
Cultures were grown at different temperature (20, 25 and
30 �C) and salinity values (26, 32, 36 and 40); HR LC-MS
analyses were carried out to determine their toxin profile,
including the recently found ovatoxins (Ciminiello et al.,
2010), and to evaluate the total toxin amount released in
the extracellular medium during the stationary growth
phase.
A further object of the present study was to compare the
total toxin content of algal extracts measured by HR LC-MS
with the results obtained through the haemolysis assay
(Riobo et al., 2008), with the aim of gaining information on the
accuracy of the haemolytic test, a rapid and very sensitive
biological assay widely employed for palytoxins detection
(Riobo et al., 2011). Finally, the toxicity of O. cf. ovata cultures
on crustaceans and fish was also investigated using Artemia
sp. assay and the ichthyotoxicity test with juvenile sea basses
(Dicentrarchus labrax) (IRSA-CNR, 2003) to evaluate the poten-
tial O. cf. ovata impact on the other marine organisms.
2. Materials and methods
2.1. Cultures of Ostreopsis cf. ovata
O. cf. ovata was isolated using the capillary pipette method
(Hoshaw and Rosowski, 1973) from water samples collected
along the Adriatic coast of Italy (Marche region, Numana
sampling site, strain OOAN0601) in October 2006, in proximity
to the seaweeds Cystoseira sp. andAlcidium corallinum. After an
initial growth in microplates, cells were cultured at 20 �Cunder a 16:8 h L:D cycle from cool white lamp in natural
seawater, at salinity 36, adding macronutrients at a five-fold
diluted f/2 concentration (Guillard, 1975) and selenium. In
order to evaluate the effect of environmental parameters on
growth and toxicity of O. cf. ovata, temperature and salinity
experiments were carried out. In the salinity experiment,
cultures (at 20 �C) were established at salinity 26, 32, 36 and 40
in a thermostatic room, maintaining light irradiance at
100e110 mmol m�2 s�1. Salinity levels 26, 32 and 36 were ob-
tained by diluting seawater (salinity 38) with deionized water,
while salinity 40 was obtained by evaporation of the seawater.
In the temperature experiment, cultures (salinity 36) were
established at 20, 25 and 30 �C in water baths kept in the same
thermostatic room, thus light irradiance slightly decreased to
90 mmol m�2 s�1. Phaeodactylum tricornutum (strain PTN0301
from the North Sea, Holland) was cultured using f/2 medium
under the same conditions and used in the experiments either
for comparisons or control.
wat e r r e s e a r c h 4 6 ( 2 0 1 2 ) 8 2e9 284
Both temperature and salinity experiments were carried
out by using, for each condition, 2 series of batch cultures. One
was used to evaluate the growth profile and the other the
toxin content.
2.1.1. Evaluation of growth profileSince the evaluation of the growth profile of O. cf. ovata in
batch cultures was complicated by the presence of mucous
aggregates, the sampling method developed by Guerrini et al.
(2010) was used for counting. For each temperature/salinity
level, 15 Erlenmeyer flasks containing 200 ml of culture were
grown in parallel; every other day, two out of the initial flasks
were treated with HCl to a final concentration of 4 mM. Acid
addition dissolved mucous aggregates and homogenous
sampling could be performed. After counting, the two acidi-
fied flasks were discarded.
Cell counts were made following Utermohl method (Hasle,
1978) and specific growth rate (m, day�1) was calculated using
the following equation:
m ¼ ln N1 � ln N0
t1 � t0
where N0 and N1 are cell density values at time t0 and t1.
Calculation of cell volume was made with the assumption
of ellipsoid shape using the following equation (Sun and Liu,
2003):
V ¼ ðp=6Þ�a�b�c
where a¼ dorsoventral diameter (length), b¼width, c¼mean
anteriorposterior diameter (height).
2.1.2. Evaluation of toxin contentFor each temperature and salinity level, a set of four culturing
flasks was set up. Due to limitations in the availability of the
equipment, the salinity experiment was carried out in a ther-
mostatic room using 1500 mL flasks, while the temperature
experiment was carried out by placing the 800 mL flasks in
water baths. Cell counting was carried out on one out of the
four flasks as described above. Five replicate counts were
collected from one of the four flasks for each treatment and
used to determine the cell density and to express toxin
content on a per cell basis. Culture collection was carried out
during the late stationary growth phase by gravity filtration
through GF/FWhatman (0.7 mm) filters at day 21st and 25th for
the salinity and temperature experiment, respectively. Cell
pellets and growth media for each temperature/salinity level
were provided for chemical analysis.
Table 1 e Molecular formulae (M) of ovatoxins, elemental comabundant peaks of [M D 2HeH2O]2D and [M D 2H D K]3D ion c
Toxin Rt (min) M A moiety
Palytoxin 10.78 C129H223N3O54 C16H28N2O6
Ovatoxin-a 11.45 C129H223N3O52 C16H28N2O6
Ovatoxin-b 11.28 C131H227N3O53 C18H32N2O7
Ovatoxin-c 10.90 C131H227N3O54 C18H32N2O7
Ovatoxin-d 11.07 C129H223N3O53 C16H28N2O6
Ovatoxin-e 11.07 C129H223N3O53 C16H28N2O7
2.2. Chemical analysis
2.2.1. ChemicalsAll organic solvents were of distilled-in-glass grade (Carlo
Erba, Milan, Italy). Water was distilled and passed through
aMilliQwater purification system (Millipore Ltd., Bedford,MA,
USA). Acetic acid (Laboratory grade)was purchased fromCarlo
Erba. Analytical standard of palytoxin was purchased from
Wako Chemicals GmbH (Neuss, Germany).
2.2.2. ExtractionCell pellets and growth media for each temperature/salinity
level were extracted separately. For each pellet sample 9mL of
a methanol/water (1:1, v/v) solution was added and the solu-
tion sonicated for 30 min in pulse mode, while cooling in ice
bath. The mixture was centrifuged at 3000� g for 30 min, the
supernatant was decanted and the pellet was washed twice
with 9 mL of methanol/water (1:1, v/v). The extracts were
combined and the volume was adjusted to 30 mL with
extracting solvent. The obtained mixture was analyzed
directly by HR LC-MS (5_ml injected). Each growthmediumwas
extracted five times with an equal volume of butanol. The
butanol layer was evaporated to dryness, dissolved in 5 mL of
methanol/water (1:1, v/v) and analyzed directly by HR LC-MS
(5 ml injected). Recovery percentage of the above extraction
procedures were estimated to be 98% and 75% for the pellet
and growth medium extracts, respectively (Ciminiello et al.,
2006).
2.2.3. High resolution liquid chromatography-massspectrometry (HR LC-MS)High resolution (HR) LC-MS experiments were carried out on
an Agilent 1100 LC binary system (Palo Alto, CA, USA) coupled
to a hybrid linear ion trap LTQOrbitrap XL� Fourier Transform
MS (FTMS) equipped with an ESI ION MAX� source (Thermo-
Fisher, San Jose, CA, USA). Chromatographic separation was
accomplished by using a 3 mm gemini C18 (150 � 2.00 mm)
column (Phenomenex, Torrance, CA, USA) maintained at
room temperature and eluted at 0.2 mL min�1 with water
(eluent A) and 95% acetonitrile/water (eluent B), both con-
taining 30 mM acetic acid. A slow gradient elution was used:
20e50% B over 20 min, 50e80% B over 10 min, 80e100% B in
1 min, and hold 5 min. This gradient system allowed a suffi-
cient chromatographic separation of most palytoxin-like
compounds (Table 1).
HR full MS experiments (positive ions) were acquired in the
range m/z 800e1400 at a resolving power of 15,000. The
position of their relevant A and B moieties and mostlusters for each compound.
B moiety [M þ 2HeH2O]2þ [M þ 2H þ K]3þ
C113H195NO48 1331.7436 906.8167
C113H195NO46 1315.7498 896.1572
C113H195NO46 1337.7623 910.8318
C113H195NO47 1345.7584 916.1628
C113H195NO47 1323.7456 901.4884
C113H195NO46 1323.7456 901.4884
wat e r r e s e a r c h 4 6 ( 2 0 1 2 ) 8 2e9 2 85
following source settings were used in all HR LC-MS experi-
ments: a spray voltage of 4 kV, a capillary temperature of
290 �C, a capillary voltage of 22 V, a sheath gas and an auxiliary
gas flow of 35 and 1 (arbitrary units). The tube lens voltagewas
set at 110 V.
Due to commercial availability of the only palytoxin stan-
dard, quantitative determination of putative palytoxin, ova-
toxin-a, -b, -c, -d, and -e in the extracts was carried out by
using a calibration curve (triplicate injection) of palytoxin
standards at four levels of concentration (25, 12.5, 6.25, and
3.13 ng mL�1) and assuming that their molar responses were
similar to that of palytoxin. Extracted ion chromatograms
(XIC) for palytoxin and each ovatoxins were obtained by
selecting the most abundant ion peaks of both [Mþ2HeH2O]2þ
and [Mþ2H þ K]3þ ion clusters (Table 1). A mass tolerance of
5 ppm was used.
2.3. Toxicity assays
2.3.1. Artemia sp. assayThe assay was carried out according to the short-term test of
the IRSA-CNR (2003) method, consisting in a 24 h exposure of
Artemia sp. to the potentially toxic sample. 10 nauplii were
incubated in 1 mL of sample in a glass tube for 24 h. Firstly,
aliquots of a culture grown at 20 �C and salinity 36, containing
five increasing concentrations of live cells, lysed cells, algal
extracts and growth media, were tested in triplicate. Live cell
aliquots were sampled during the stationary phase of the
culture. Lysed cell aliquots were obtained by sonicating 10 mL
of the culture for 3 min. Algal extracts were obtained as re-
ported above and diluted (1:100 to 1:10,000) with seawater. A
palytoxin stock solution (12.5 mgmL�1) inmethanol/water (1:1,
v/v) was dilutedwith seawater and tested in the concentration
range 500e10,000 pg mL�1. Growth medium aliquots were
obtained by filtering 50 mL of the culture through GF/F
Whatman (0.7 mm) filters.
The toxicity of O. cf. ovata cultures grown at different
temperature/salinity conditions was evaluated by Artemia sp.
assay, using only live cells. Five different concentration levels
of each sample were obtained through dilution with seawater,
and were tested in triplicate. The effects on Artemia sp. of
sample exposure were evaluated after 24 h by counting the
number of dead organisms. Seawater samples, methanol/
water (1:1, v/v) solution (diluted 1:100, v/v with seawater) and
f/2 medium at the investigated salinity levels (diluted 1:5 with
seawater) were used as control. EC50 values were calculated
(see below Section 2.4).
2.3.2. Haemolytic assayHaemolytic assay was carried out following the procedure
proposed by Bignami (1993) andmodified by Riobo et al. (2008).
The test is based on photometrical determination of haemo-
globin released from sheep erythrocytes following exposure to
haemolytic compounds. Sheep blood was kindly provided by
the Department of Veterinary Public Health and Animal
Pathology (University of Bologna). Erythrocytes were sepa-
rated from plasma by centrifugation (400 � g at 10 �C for
10 min) and washed twice with a solution containing phos-
phate buffered saline (PBS) 0.01 M, pH 7.4, bovine serum
albumin (BSA), calcium chloride (CaCl2 2H2O) 1 mM and boric
acid (H3BO3) 1 mM. Finally, the erythrocytes solution was
diluted with PBS at a final concentration of 1.7 � 108 red cells
mL�1.
According to the reported method (Riobo et al., 2008), two
blood solutions, one added of ouabain (2.5 mM) and one
ouabain-free, were prepared to a final concentration of
1.7 � 107 erythrocytes. 1 mL of each blood solution was mixed
with 1 mL of the sample diluted in PBS (either pellet extract or
palytoxin standard previously dissolved in methanol/water
(1:1, v/v)) and incubated at 25 �C for 20 h. After the incubation,
samples were centrifuged at 400 � g for 10 min and the
supernatant absorptions were measured at 405 nm. Two
replicates of algal extract at different concentration levels,
control solutions for blanks (PBS buffer and methanol/water
(1:1, v/v) in PBS) and total haemolysis sample were prepared
for each experiment. Palytoxin standard at seven concentra-
tion levels (4e196 pg mL�1) were used for generating the
calibration curve. Stock solutions of the algal extracts and
palytoxin standard used in the haemolytic assay were quan-
tified by HR LC-MS. The haemolytic effects of the algal extracts
were expressed either on cell basis (cell mL�1) or on toxin
content basis (pg mL�1). EC50 values obtained by testing the
palytoxin standard and the algal extracts were calculated (see
below Section 2.4).
2.3.3. Fish bioassaySea basses (D. labrax) employed in the assay were collected
from the hatchery Valle Ca’ Zuliani (Pila di Porto Tolle, Rovigo,
Italy). After the transfer, they were kept in a 60-70 L aquarium,
aerated by a small dispenser (Hailea) and kept at room
temperature and salinity 36 for one month. For the experi-
ments, 2 L aerated tanks containing algal culture were used.
Three juveniles (5.0 � 1.0 g) were put into each tank, kept at
20 �C, during a 16:8 h lightedark period and observed for 4
days. Two replicates of O. cf. ovata culture grown for 4e6 days
at 20 �C and salinity 36 were tested at three concentration
levels. An equal volume of P. tricornutum culture was used as
control. Fish were considered dead when gill opercular
movements ceased.
2.4. Data analysis
The 50% effect concentration (EC50) of each sample for the
Artemia sp. and haemolytic assayswas estimated by fitting the
experimental concentration-response curves to a logistic
model:
y ¼ a
1þ� xEC50
�b
Where: y ¼ endpoint value; x ¼ substance concentration;
a ¼ expected endpoint value in absence of toxic effect;
b ¼ slope parameter. The parameters of the equation,
including the EC50, were estimated using the non-linear
regression procedures implemented in Statistica (Statsoft,
Tulsa, OK, USA). An independent estimate of EC50 was ob-
tained for each of the experiments.
Differences in cell biovolume, EC50 value, and toxins
concentration among the samples were tested by using the
multivariate analysis-of-variance (ANOVA) test, using
wat e r r e s e a r c h 4 6 ( 2 0 1 2 ) 8 2e9 286
Statistica (StatSoft, Tulsa, OK, USA) software. Whenever
a significant difference for the main effect was observed
(P < 0.05), a NewmaneKeuls test was also performed.
3. Results
Batch cultures of an Adriatic strain of O. cf. ovata, collected
along the Marche coasts of Italy (Numana sampling site) in
October 2006, were established in order to evaluate the effect
of salinity and temperature on algal growth and toxin profile.
Particularly, in the temperature experiment, cultures were set
at 20, 25 and 30 �C by maintaining salinity at 36 and light
irradiance at 90 mmolm�2 s�1, while in the salinity experiment
cultures were established at salinity 26, 32, 36 and 40, by
maintaining temperature at 20 �C and light irradiance at
100e110 mmol m�2 s�1.
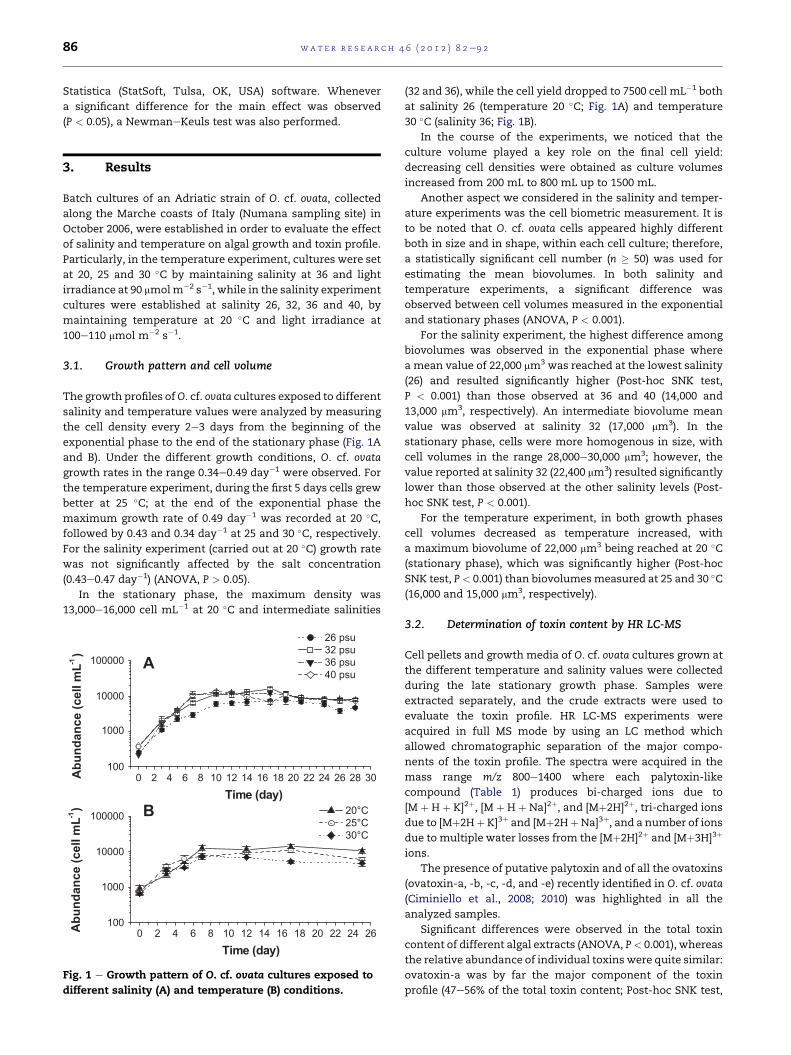
3.1. Growth pattern and cell volume
The growth profiles ofO. cf. ovata cultures exposed to different
salinity and temperature values were analyzed by measuring
the cell density every 2e3 days from the beginning of the
exponential phase to the end of the stationary phase (Fig. 1A
and B). Under the different growth conditions, O. cf. ovata
growth rates in the range 0.34e0.49 day�1 were observed. For
the temperature experiment, during the first 5 days cells grew
better at 25 �C; at the end of the exponential phase the
maximum growth rate of 0.49 day�1 was recorded at 20 �C,followed by 0.43 and 0.34 day�1 at 25 and 30 �C, respectively.For the salinity experiment (carried out at 20 �C) growth rate
was not significantly affected by the salt concentration
(0.43e0.47 day�1) (ANOVA, P > 0.05).
In the stationary phase, the maximum density was
13,000e16,000 cell mL�1 at 20 �C and intermediate salinities
0 2 4 6 8 10 12 14 16 18 20 22 24 26100
1000
10000
100000
0 2 4 6 8 10 12 14 16 18 20 22 24 26 28 30100
1000
10000
100000A
B
26 psu 32 psu 36 psu 40 psu
Ab
un
da
nc
e (c
ell m
L-1
)
Time (day)
20°C 25°C 30°C
Time (day)
Ab
un
da
nc
e (c
ell m
L-1
)
Fig. 1 e Growth pattern of O. cf. ovata cultures exposed to
different salinity (A) and temperature (B) conditions.
(32 and 36), while the cell yield dropped to 7500 cell mL�1 both
at salinity 26 (temperature 20 �C; Fig. 1A) and temperature
30 �C (salinity 36; Fig. 1B).
In the course of the experiments, we noticed that the
culture volume played a key role on the final cell yield:
decreasing cell densities were obtained as culture volumes
increased from 200 mL to 800 mL up to 1500 mL.
Another aspect we considered in the salinity and temper-
ature experiments was the cell biometric measurement. It is
to be noted that O. cf. ovata cells appeared highly different
both in size and in shape, within each cell culture; therefore,
a statistically significant cell number (n � 50) was used for
estimating the mean biovolumes. In both salinity and
temperature experiments, a significant difference was
observed between cell volumes measured in the exponential
and stationary phases (ANOVA, P < 0.001).
For the salinity experiment, the highest difference among
biovolumes was observed in the exponential phase where
a mean value of 22,000 mm3 was reached at the lowest salinity
(26) and resulted significantly higher (Post-hoc SNK test,
P < 0.001) than those observed at 36 and 40 (14,000 and
13,000 mm3, respectively). An intermediate biovolume mean
value was observed at salinity 32 (17,000 mm3). In the
stationary phase, cells were more homogenous in size, with
cell volumes in the range 28,000e30,000 mm3; however, the
value reported at salinity 32 (22,400 mm3) resulted significantly
lower than those observed at the other salinity levels (Post-
hoc SNK test, P < 0.001).
For the temperature experiment, in both growth phases
cell volumes decreased as temperature increased, with
a maximum biovolume of 22,000 mm3 being reached at 20 �C(stationary phase), which was significantly higher (Post-hoc
SNK test, P< 0.001) than biovolumesmeasured at 25 and 30 �C(16,000 and 15,000 mm3, respectively).
3.2. Determination of toxin content by HR LC-MS
Cell pellets and growth media of O. cf. ovata cultures grown at
the different temperature and salinity values were collected
during the late stationary growth phase. Samples were
extracted separately, and the crude extracts were used to
evaluate the toxin profile. HR LC-MS experiments were
acquired in full MS mode by using an LC method which
allowed chromatographic separation of the major compo-
nents of the toxin profile. The spectra were acquired in the
mass range m/z 800e1400 where each palytoxin-like
compound (Table 1) produces bi-charged ions due to
[M þ H þ K]2þ, [M þ H þ Na]2þ, and [Mþ2H]2þ, tri-charged ions
due to [Mþ2HþK]3þ and [Mþ2HþNa]3þ, and a number of ions
due to multiple water losses from the [Mþ2H]2þ and [Mþ3H]3þ
ions.
The presence of putative palytoxin and of all the ovatoxins
(ovatoxin-a, -b, -c, -d, and -e) recently identified in O. cf. ovata
(Ciminiello et al., 2008; 2010) was highlighted in all the
analyzed samples.
Significant differences were observed in the total toxin
content of different algal extracts (ANOVA, P< 0.001), whereas
the relative abundance of individual toxins were quite similar:
ovatoxin-a was by far the major component of the toxin
profile (47e56% of the total toxin content; Post-hoc SNK test,
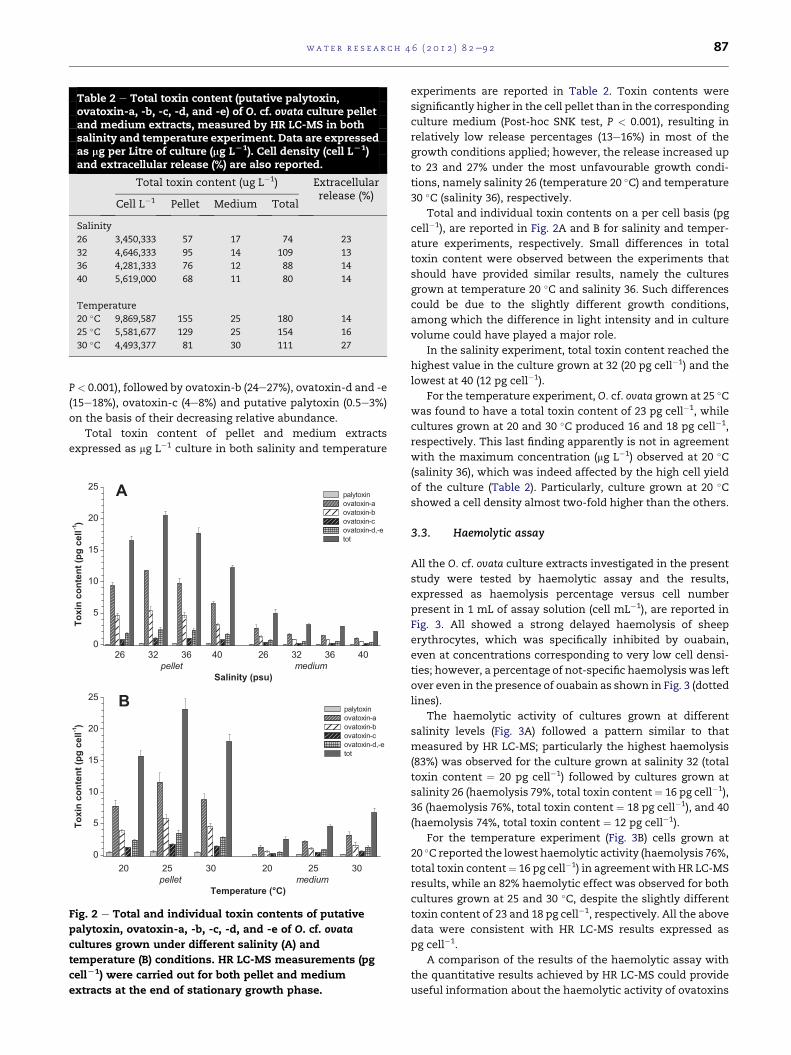
Table 2 e Total toxin content (putative palytoxin,ovatoxin-a, -b, -c, -d, and -e) of O. cf. ovata culture pelletand medium extracts, measured by HR LC-MS in bothsalinity and temperature experiment. Data are expressedas mg per Litre of culture (mg LL1). Cell density (cell LL1)and extracellular release (%) are also reported.
Total toxin content (ug L�1) Extracellularrelease (%)
Cell L�1 Pellet Medium Total
Salinity
26 3,450,333 57 17 74 23
32 4,646,333 95 14 109 13
36 4,281,333 76 12 88 14
40 5,619,000 68 11 80 14
Temperature
20 �C 9,869,587 155 25 180 14
25 �C 5,581,677 129 25 154 16
30 �C 4,493,377 81 30 111 27
wat e r r e s e a r c h 4 6 ( 2 0 1 2 ) 8 2e9 2 87
P < 0.001), followed by ovatoxin-b (24e27%), ovatoxin-d and -e
(15e18%), ovatoxin-c (4e8%) and putative palytoxin (0.5e3%)
on the basis of their decreasing relative abundance.
Total toxin content of pellet and medium extracts
expressed as mg L�1 culture in both salinity and temperature
0
5
10
15
20
25
palytoxin ovatoxin-a ovatoxin-b ovatoxin-c ovatoxin-d,-e tot
palytoxin ovatoxin-a ovatoxin-b ovatoxin-c ovatoxin-d,-e tot
26 32 36 40 26 32 36 40pellet medium
Salinity (psu)
20 25 30 20 25 30pellet medium
Temperature (°C)
To
xin
c
on
te
nt (p
g c
ell-1
)
0
5
10
15
20
25A
B
T
ox
in
c
on
te
nt (p
g c
ell
-1
)
Fig. 2 e Total and individual toxin contents of putative
palytoxin, ovatoxin-a, -b, -c, -d, and -e of O. cf. ovata
cultures grown under different salinity (A) and
temperature (B) conditions. HR LC-MS measurements (pg
cellL1) were carried out for both pellet and medium
extracts at the end of stationary growth phase.
experiments are reported in Table 2. Toxin contents were
significantly higher in the cell pellet than in the corresponding
culture medium (Post-hoc SNK test, P < 0.001), resulting in
relatively low release percentages (13e16%) in most of the
growth conditions applied; however, the release increased up
to 23 and 27% under the most unfavourable growth condi-
tions, namely salinity 26 (temperature 20 �C) and temperature
30 �C (salinity 36), respectively.
Total and individual toxin contents on a per cell basis (pg
cell�1), are reported in Fig. 2A and B for salinity and temper-
ature experiments, respectively. Small differences in total
toxin content were observed between the experiments that
should have provided similar results, namely the cultures
grown at temperature 20 �C and salinity 36. Such differences
could be due to the slightly different growth conditions,
among which the difference in light intensity and in culture
volume could have played a major role.
In the salinity experiment, total toxin content reached the
highest value in the culture grown at 32 (20 pg cell�1) and the
lowest at 40 (12 pg cell�1).
For the temperature experiment, O. cf. ovata grown at 25 �Cwas found to have a total toxin content of 23 pg cell�1, while
cultures grown at 20 and 30 �C produced 16 and 18 pg cell�1,
respectively. This last finding apparently is not in agreement
with the maximum concentration (mg L�1) observed at 20 �C(salinity 36), which was indeed affected by the high cell yield
of the culture (Table 2). Particularly, culture grown at 20 �Cshowed a cell density almost two-fold higher than the others.
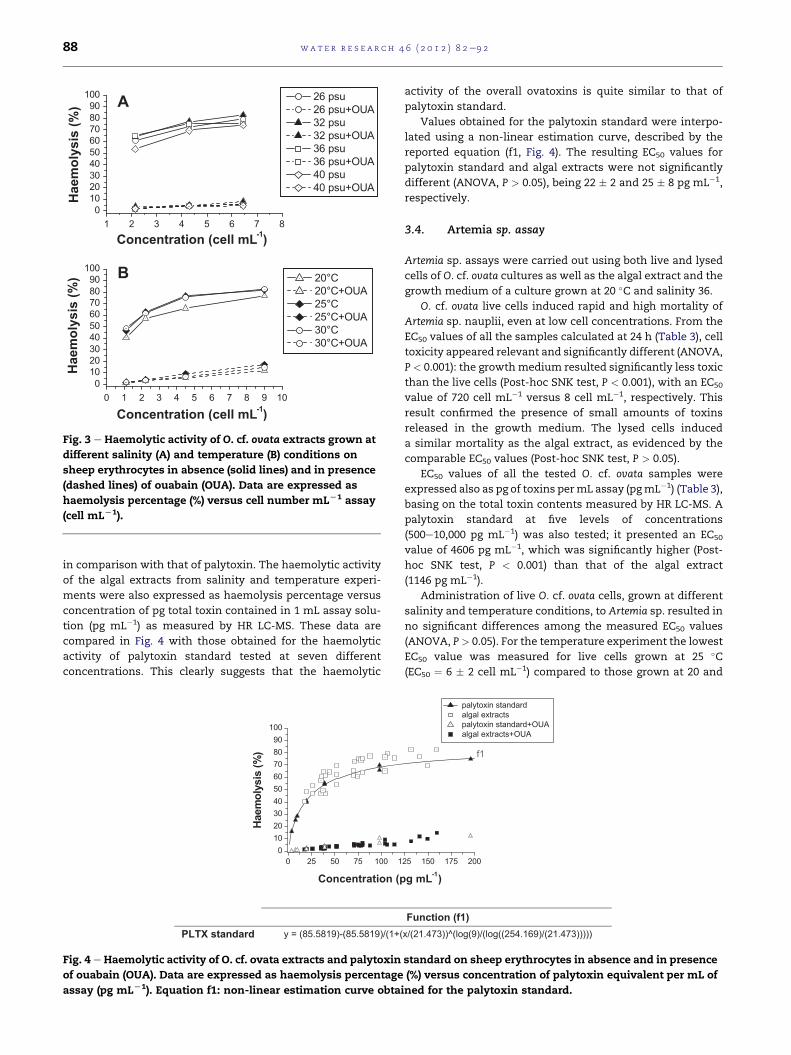
3.3. Haemolytic assay
All the O. cf. ovata culture extracts investigated in the present
study were tested by haemolytic assay and the results,
expressed as haemolysis percentage versus cell number
present in 1 mL of assay solution (cell mL�1), are reported in
Fig. 3. All showed a strong delayed haemolysis of sheep
erythrocytes, which was specifically inhibited by ouabain,
even at concentrations corresponding to very low cell densi-
ties; however, a percentage of not-specific haemolysis was left
over even in the presence of ouabain as shown in Fig. 3 (dotted
lines).
The haemolytic activity of cultures grown at different
salinity levels (Fig. 3A) followed a pattern similar to that
measured by HR LC-MS; particularly the highest haemolysis
(83%) was observed for the culture grown at salinity 32 (total
toxin content ¼ 20 pg cell�1) followed by cultures grown at
salinity 26 (haemolysis 79%, total toxin content¼ 16 pg cell�1),
36 (haemolysis 76%, total toxin content ¼ 18 pg cell�1), and 40
(haemolysis 74%, total toxin content ¼ 12 pg cell�1).
For the temperature experiment (Fig. 3B) cells grown at
20 �C reported the lowest haemolytic activity (haemolysis 76%,
total toxin content¼ 16 pg cell�1) in agreement with HR LC-MS
results, while an 82% haemolytic effect was observed for both
cultures grown at 25 and 30 �C, despite the slightly different
toxin content of 23 and 18 pg cell�1, respectively. All the above
data were consistent with HR LC-MS results expressed as
pg cell�1.
A comparison of the results of the haemolytic assay with
the quantitative results achieved by HR LC-MS could provide
useful information about the haemolytic activity of ovatoxins
0 1 2 3 4 5 6 7 8 9 100
102030405060708090
100
1 2 3 4 5 6 7 80
102030405060708090
100A
B
Concentration (cell mL-1
)
26 psu 26 psu+OUA 32 psu 32 psu+OUA 36 psu 36 psu+OUA 40 psu 40 psu+OUA
Haem
olysis (%
) 20°C 20°C+OUA 25°C 25°C+OUA 30°C 30°C+OUA
Concentration (cell mL-1
)
Haem
olysis (%
)
Fig. 3 e Haemolytic activity of O. cf. ovata extracts grown at
different salinity (A) and temperature (B) conditions on
sheep erythrocytes in absence (solid lines) and in presence
(dashed lines) of ouabain (OUA). Data are expressed as
haemolysis percentage (%) versus cell number mLL1 assay
(cell mLL1).
wat e r r e s e a r c h 4 6 ( 2 0 1 2 ) 8 2e9 288
in comparison with that of palytoxin. The haemolytic activity
of the algal extracts from salinity and temperature experi-
ments were also expressed as haemolysis percentage versus
concentration of pg total toxin contained in 1 mL assay solu-
tion (pg mL�1) as measured by HR LC-MS. These data are
compared in Fig. 4 with those obtained for the haemolytic
activity of palytoxin standard tested at seven different
concentrations. This clearly suggests that the haemolytic
0 25 50 75 100 10
102030405060708090
100
Haem
oly
sis
(%
)
Concentration (p
PLTX standard y = (85.5819)-(85.5819)/(1+(
Fig. 4 e Haemolytic activity of O. cf. ovata extracts and palytoxin
of ouabain (OUA). Data are expressed as haemolysis percentage
assay (pg mLL1). Equation f1: non-linear estimation curve obta
activity of the overall ovatoxins is quite similar to that of
palytoxin standard.
Values obtained for the palytoxin standard were interpo-
lated using a non-linear estimation curve, described by the
reported equation (f1, Fig. 4). The resulting EC50 values for
palytoxin standard and algal extracts were not significantly
different (ANOVA, P > 0.05), being 22 � 2 and 25 � 8 pg mL�1,
respectively.
3.4. Artemia sp. assay
Artemia sp. assays were carried out using both live and lysed
cells of O. cf. ovata cultures as well as the algal extract and the
growth medium of a culture grown at 20 �C and salinity 36.
O. cf. ovata live cells induced rapid and high mortality of
Artemia sp. nauplii, even at low cell concentrations. From the
EC50 values of all the samples calculated at 24 h (Table 3), cell
toxicity appeared relevant and significantly different (ANOVA,
P < 0.001): the growthmedium resulted significantly less toxic
than the live cells (Post-hoc SNK test, P < 0.001), with an EC50
value of 720 cell mL�1 versus 8 cell mL�1, respectively. This
result confirmed the presence of small amounts of toxins
released in the growth medium. The lysed cells induced
a similar mortality as the algal extract, as evidenced by the
comparable EC50 values (Post-hoc SNK test, P > 0.05).
EC50 values of all the tested O. cf. ovata samples were
expressed also as pg of toxins permL assay (pgmL�1) (Table 3),
basing on the total toxin contents measured by HR LC-MS. A
palytoxin standard at five levels of concentrations
(500e10,000 pg mL�1) was also tested; it presented an EC50
value of 4606 pg mL�1, which was significantly higher (Post-
hoc SNK test, P < 0.001) than that of the algal extract
(1146 pg mL�1).
Administration of live O. cf. ovata cells, grown at different
salinity and temperature conditions, to Artemia sp. resulted in
no significant differences among the measured EC50 values
(ANOVA, P> 0.05). For the temperature experiment the lowest
EC50 value was measured for live cells grown at 25 �C(EC50 ¼ 6 � 2 cell mL�1) compared to those grown at 20 and
25 150 175 200
palytoxin standard algal extracts palytoxin standard+OUA algal extracts+OUA
f1
g mL-1
)
Function (f1)
x/(21.473))^(log(9)/(log((254.169)/(21.473)))))
standard on sheep erythrocytes in absence and in presence
(%) versus concentration of palytoxin equivalent per mL of
ined for the palytoxin standard.
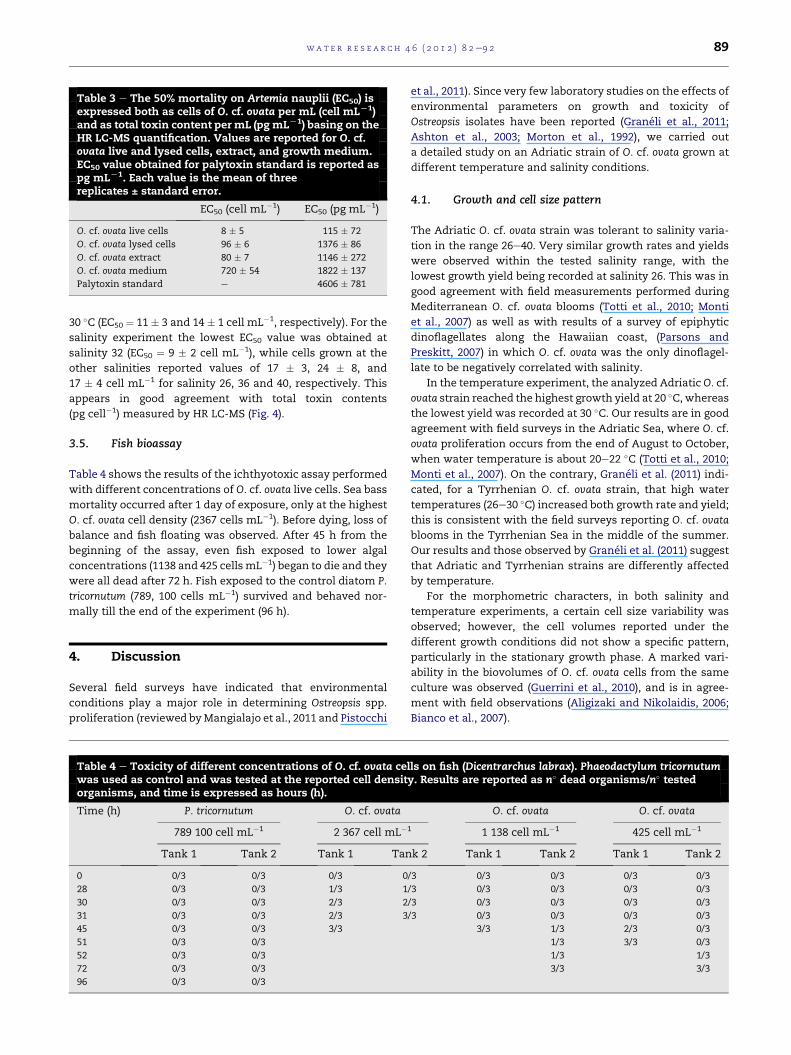
Table 3 e The 50% mortality on Artemia nauplii (EC50) isexpressed both as cells of O. cf. ovata per mL (cell mLL1)and as total toxin content per mL (pgmLL1) basing on theHR LC-MS quantification. Values are reported for O. cf.ovata live and lysed cells, extract, and growth medium.EC50 value obtained for palytoxin standard is reported aspg mLL1. Each value is the mean of threereplicates ± standard error.
EC50 (cell mL�1) EC50 (pg mL�1)
O. cf. ovata live cells 8 � 5 115 � 72
O. cf. ovata lysed cells 96 � 6 1376 � 86
O. cf. ovata extract 80 � 7 1146 � 272
O. cf. ovata medium 720 � 54 1822 � 137
Palytoxin standard e 4606 � 781
wat e r r e s e a r c h 4 6 ( 2 0 1 2 ) 8 2e9 2 89
30 �C (EC50 ¼ 11 � 3 and 14 � 1 cell mL�1, respectively). For the
salinity experiment the lowest EC50 value was obtained at
salinity 32 (EC50 ¼ 9 � 2 cell mL�1), while cells grown at the
other salinities reported values of 17 � 3, 24 � 8, and
17 � 4 cell mL�1 for salinity 26, 36 and 40, respectively. This
appears in good agreement with total toxin contents
(pg cell�1) measured by HR LC-MS (Fig. 4).
3.5. Fish bioassay
Table 4 shows the results of the ichthyotoxic assay performed
with different concentrations of O. cf. ovata live cells. Sea bass
mortality occurred after 1 day of exposure, only at the highest
O. cf. ovata cell density (2367 cells mL�1). Before dying, loss of
balance and fish floating was observed. After 45 h from the
beginning of the assay, even fish exposed to lower algal
concentrations (1138 and 425 cellsmL�1) began to die and they
were all dead after 72 h. Fish exposed to the control diatom P.
tricornutum (789, 100 cells mL�1) survived and behaved nor-
mally till the end of the experiment (96 h).
4. Discussion
Several field surveys have indicated that environmental
conditions play a major role in determining Ostreopsis spp.
proliferation (reviewed byMangialajo et al., 2011 and Pistocchi
Table 4 e Toxicity of different concentrations of O. cf. ovata celwas used as control and was tested at the reported cell densitorganisms, and time is expressed as hours (h).
Time (h) P. tricornutum O. cf. ovata
789 100 cell mL�1 2 367 cell mL�
Tank 1 Tank 2 Tank 1 Tan
0 0/3 0/3 0/3 0
28 0/3 0/3 1/3 1
30 0/3 0/3 2/3 2
31 0/3 0/3 2/3 3
45 0/3 0/3 3/3
51 0/3 0/3
52 0/3 0/3
72 0/3 0/3
96 0/3 0/3
et al., 2011). Since very few laboratory studies on the effects of
environmental parameters on growth and toxicity of
Ostreopsis isolates have been reported (Graneli et al., 2011;
Ashton et al., 2003; Morton et al., 1992), we carried out
a detailed study on an Adriatic strain of O. cf. ovata grown at
different temperature and salinity conditions.
4.1. Growth and cell size pattern
The Adriatic O. cf. ovata strain was tolerant to salinity varia-
tion in the range 26e40. Very similar growth rates and yields
were observed within the tested salinity range, with the
lowest growth yield being recorded at salinity 26. This was in
good agreement with field measurements performed during
Mediterranean O. cf. ovata blooms (Totti et al., 2010; Monti
et al., 2007) as well as with results of a survey of epiphytic
dinoflagellates along the Hawaiian coast, (Parsons and
Preskitt, 2007) in which O. cf. ovata was the only dinoflagel-
late to be negatively correlated with salinity.
In the temperature experiment, the analyzed AdriaticO. cf.
ovata strain reached the highest growth yield at 20 �C, whereas
the lowest yield was recorded at 30 �C. Our results are in good
agreement with field surveys in the Adriatic Sea, where O. cf.
ovata proliferation occurs from the end of August to October,
when water temperature is about 20e22 �C (Totti et al., 2010;
Monti et al., 2007). On the contrary, Graneli et al. (2011) indi-
cated, for a Tyrrhenian O. cf. ovata strain, that high water
temperatures (26e30 �C) increased both growth rate and yield;
this is consistent with the field surveys reporting O. cf. ovata
blooms in the Tyrrhenian Sea in the middle of the summer.
Our results and those observed by Graneli et al. (2011) suggest
that Adriatic and Tyrrhenian strains are differently affected
by temperature.
For the morphometric characters, in both salinity and
temperature experiments, a certain cell size variability was
observed; however, the cell volumes reported under the
different growth conditions did not show a specific pattern,
particularly in the stationary growth phase. A marked vari-
ability in the biovolumes of O. cf. ovata cells from the same
culture was observed (Guerrini et al., 2010), and is in agree-
ment with field observations (Aligizaki and Nikolaidis, 2006;
Bianco et al., 2007).
ls on fish (Dicentrarchus labrax). Phaeodactylum tricornutumy. Results are reported as n� dead organisms/n� tested
O. cf. ovata O. cf. ovata
1 1 138 cell mL�1 425 cell mL�1
k 2 Tank 1 Tank 2 Tank 1 Tank 2
/3 0/3 0/3 0/3 0/3
/3 0/3 0/3 0/3 0/3
/3 0/3 0/3 0/3 0/3
/3 0/3 0/3 0/3 0/3
3/3 1/3 2/3 0/3
1/3 3/3 0/3
1/3 1/3
3/3 3/3

wat e r r e s e a r c h 4 6 ( 2 0 1 2 ) 8 2e9 290
4.2. Toxin profile
Putative palytoxin and all the ovatoxins so far known
(Ciminiello et al., 2010) were detected inO. cf. ovata extracts. In
the cultures grown under different conditions the relative
abundance of individual toxins was similar, with ovatoxin-
a and putative palytoxin being the major and the minor
component of the toxin profile, respectively.
The highest total toxin content on a per cell basis (pg cell�1)
was recorded in cultures grown at 25 �C, while the highest
total toxin concentration on a per litre basis was recorded at
20 �C, namely under conditions that induced the highest
growth yield. A reverse correlation between growth and toxin
production has been reported also by Graneli et al. (2011), as
found also for other dinoflagellates (Etheridge and Roesler,
2005; Errera et al., 2010). As for the salinity experiment the
highest total toxin content (pg cell�1) wasmeasured at salinity
32, while it decreased at lower and higher salinity values.
However, no clear correlation between growth and toxin
content was observed in the salinity experiment.
The extracellular release increased as the temperature
increased, with the maximum 27% value being observed at
30 �C, the most unfavourable growth condition in the
temperature experiment. This suggests that high tempera-
tures favour cell lysis, leading to toxins being released in the
growth medium. Similarly, in the salinity experiment, the
highest release was also measured at the most unfavourable
growth condition (26 �C). Comparable results were obtained
for Protoceratium reticulatum (Guerrini et al., 2007) and this
could represent a response of the cells to the osmotic stress.
4.3. Haemolysis results in comparison with HR LC-MSdata
Palytoxin converts Naþ/Kþ pump into a non-selective cation
channel, causing cell lysis; ouabain and other cardiac glyco-
sides are used as indicators for the site of action since these
compounds are specific ligands for the Naþ/Kþ-ATPase. Thehaemolytic assay proposed by Riobo et al. (2008) is a rapid and
sensitive method to determine palytoxin content. In our
study, it was successfully applied to the analyses ofO. cf. ovata
extracts in order to gain information about the haemolytic
activity of ovatoxins. The haemolytic assay resulted highly
reproducible even among separate set of experiments and
using different blood samples.
The haemolytic activity was tested by using O. cf. ovata
extracts obtained from cultures set up at different growth
conditions. The obtained data showed a good correlation
between haemolysis percentage and the total toxin content
measured through HR LC-MS. Although comparison of LC-MS
and haemolysis assay results has already been done (Rhodes
et al., 2010), in this work a detailed and quantitative cross
check between biological assay and chemical analysis was
applied to palytoxin-like compounds for the first time. Useful
information was obtained from haemolytic tests after
pretreatment with ouabain. They showed that ovatoxins
behave similarly to palytoxin, suggesting a common mecha-
nism of action, which involves a binding to the Naþ/Kþ pump.
The haemolytic activity of all the O. cf. ovata extracts was
found to be very similar to that of palytoxin, as confirmed also
by the similar EC50 values. These data suggested that ova-
toxins, which represent the major components of the O. cf.
ovata extracts (99.5e97%), have a similar haemolytic effect as
palytoxin standard. It has to be noted that, in our analyses, the
total activity of ovatoxins was measured and it has still to be
ascertained whether individual components of the ovatoxin
profile present different haemolytic activity. This will be
possible when each ovatoxin will be isolated as a pure
compound and used to evaluate its haemolytic activity.
So far, the haemolytic assay appears to be a good method
for preliminary quantification of the whole of palytoxin-like
compounds in algal extracts: equation (f1, Fig. 4) obtained
from the haemolysis curve, indicating the total haemolysis,
can be a powerful tool to evaluate total toxin concentration of
algal extracts, especially in laboratories where LC-MS is not
available. However, some drawbacks of this assay are repre-
sented by the interference of other possibly co-occurring
haemolytic compounds and its inability to define toxin profile.
4.4. Toxicity for crustacean and fish
The toxicological assays revealed a marked toxicity of
compounds produced by O. cf. ovata on Artemia nauplii and
juvenile sea basses. For Artemia sp., the assay performed with
the live O. cf. ovata cells reported mortality of nauplii even at
very low cell densities and the EC50 value was significantly
lower than those obtained for O. cf. ovata lysed cells, algal
extract, and growth medium (Table 3). The difference in EC50
values of O. cf. ovata live cells versus both O. cf. ovata lysed
cells and algal extract can be related to a different toxin
uptake by the Artemia sp. nauplii: live cells were actually
ingested by nauplii whereas either lysed cells or algal extract
were taken up through filtration. Thus, this latter mechanism
of toxin uptake seems to be less powerful than ingestion. This
suggests that herbivorous fish, feed on seaweeds where the
benthic dinoflagellates proliferates, is the most vulnerable to
O. cf. ovata toxicity.
The high EC50 value of the O. cf. ovata growth medium also
deserves consideration. This can be related to the low toxin
extracellular release emerging by HR LC-MS data (Table 2).
Despite the apparently low toxicity of O. cf. ovata growth
medium on Artemia nauplii, a long lasting bloom could be
anyway hazardous to marine crustaceans, particularly
considering that cell lyses and toxin extracellular release
increase at the end of the stationary phase reached at the end
of the bloom.
Unlike the haemolytic assay, the Artemia sp. assay was not
able to detect differences in the toxin contents of O. cf. ovata
cultures grown at different salinity and temperature condi-
tions. This could be due to the extreme sensitivity of Artemia
sp. nauplii to O. cf. ovata live cells (EC50 values ranging from 6
to 24 cell mL�1), which has not been observed for any other
harmful algae so far (Pezzolesi et al., 2010). Thus, Artemia sp.
assay is not able to catch relatively small differences among
different samples and, therefore, it cannot be used for quan-
titative purposes.
In the ichthyotoxic assay, sea basses exposed to O. cf. ovata
live cells died within a few days despite they are known not to
feedonmicroalgal cells. Thismortality could be attributed to an
haemolytic effect of palytoxin-like compounds on the gills,
wat e r r e s e a r c h 4 6 ( 2 0 1 2 ) 8 2e9 2 91
whereNaþ/KþATPase activity ishigh in the juvenile stageof sea
basses (Varsamos et al., 2004). However, we cannot exclude an
effect due to accidental ingestion of algal cells, which were
contained in the surrounding water at high density.
Acknowledgements
This research was supported by MURST PRIN, Rome, Italy.
We thank Prof. Poglayen of the Department of Veterinary
Public Health and Animal Pathology (University of Bologna)
for kindly proving us the sheep blood, and the hatchery of
Valle Ca’ Zuliani (Pila di Porto Tolle, Rovigo, Italy) for the
juvenile sea basses. We thank Dr. Andrea Pasteris for the
advice on the statistical analysis. We are grateful to Dr. Beth
Strain for English revision of the manuscript.
r e f e r e n c e s
Abboud-Abi Saab, M., 1989. Les dinoflagelles des eaux cotiereslibanaises-especes rares ou nouvelles du phytoplanctonmarin. Lebanese Science Bulletin 5, 5e16.
Aligizaki, K., Nikolaidis, G., 2006. The presence of the potentiallytoxic genera Ostreopsis and Coolia (Dinophyceae) in the NorthAegean Sea, Greece. Harmful Algae 5, 717e730.
Aligizaki, K., Katikou, P., Nikolaidis, G., Panoub, A., 2008. Firstepisode of shellfish contamination by palytoxin-likecompounds from Ostreopsis species (Aegean Sea, Greece).Toxicon 51, 418e427.
Ashton, M., Tosteson, T., Tosteson, C., 2003. The effect of elevatedtemperature on the toxicity of the laboratory cultureddinoflagellate Ostreopsis lenticularis (Dinophyceae). Revista deBiologıa Tropical 51, 1e6.
Bianco, I., Sangiorgi, V., Penna, A., Guerrini, F., Pistocchi, R.,Zaottini, E., Congestri, R., 2007. Ostreopsis ovata in benthicaggregates along the Latium Coast (middle Tyrrhenian Sea).International Symposium on Algal Toxins, SITOX, p. 29.
Bignami, G.S., 1993. A rapid and sensitive hemolysisneutralization assay for palytoxin. Toxicon 31, 817e820.
Bottalico, A., Micella, P., Feliciti, G.P., 2002. Fioritura di Ostreopsissp. (Dinophyta) nel porto di Otranto. In: Gruppo di Lavoro perl’Algologia. Societa Botanica Italiana, Chioggia 8e9 November2002.
Chang, F.H., Shimizu, Y., Hay, B., Stewart, R., Mackay, G.,Tasker, R., 2000. Three recently recorded Ostreopsis spp.(Dinophyceae) in New Zealand: temporal and regionaldistribution in the upper North Island from 1995 to 1997. NewZealand Journal of Marine & Freshwater Research 34, 29e39.
Ciminiello, P., Dell’Aversano, C., Fattorusso, E., Forino, M.,Magno, G.S., Tartaglione, L., Grillo, C., Melchiorre, N., 2006. TheGenoa 2005 outbreak. Determination of putative palytoxin inMediterranean Ostreopsis ovata by a new liquidchromatography tandem mass spectrometry method.Analytical Chemistry 78, 6153e6159.
Ciminiello, P., Dell’Aversano, C., Fattorusso, E., Forino, M.,Tartaglione, L., Grillo, C., Melchiorre, N., 2008. Putativepalytoxin and its new analogue, ovatoxin-a, in Ostreopsis ovatacollected along the Ligurian coasts during the 2006 toxicoutbreak. Journal of the American Society for MassSpectrometry 19, 111e120.
Ciminiello, P., Dell’Aversano, C., Dello Iacovo, E., Fattorusso, E.,Forino, M., Grauso, L., Tartaglione, L., Guerrini, F., Pistocchi, R.,2010. Complex palytoxin-like profile of Ostreopsis ovata.
Identification of four new ovatoxins by high-resolution liquidchromatography/mass spectrometry. Rapid Communicationsin Mass Spectrometry 24, 2735e2744.
Errera, R.M., Bourdelais, A., Drennan, M.A., Dodd, E.B.,Henrichs, D.W., Campbell, L., 2010. Variation in brevetoxinand brevenal content among clonal cultures of Karenia brevismay influence bloom toxicity. Toxicon 55, 195e203.
Etheridge, S.M., Roesler, C.S., 2005. Effects of temperature,irradiance, and salinity on photosynthesis, growth rates, totaltoxicity, and toxin composition for Alexandrium fundyenseisolates from the Gulf of Maine and Bay of Fundy. Deep-SeaResearch II 52, 2491e2500.
Faust, M.A., Morton, S.L., Quod, J.P., 1996. Further SEM study ofthe marine dinoflagellates: the genus Ostreopsis(Dinophyceae). Journal of Phycology 32, 1053e1065.
Graneli, E., Vidyarathna, N.K., Funari, E., Cumaranatunga, R.,2008. Climate change and benthic Dinoflagellates - theOstreopsis ovata case. In: Proceedings of the 13th InternationalConference on Harmful Algae, p. 42. Hong Kong, 3e7November, 2008.
Graneli, E., Vidyarathna, N.K., Funari, E., Cumaranatunga, P.R.T.,Scenati, R., 2011. Can increases in temperature stimulateblooms of the toxic benthic dinoflagellate Ostreopsis ovata?Harmful Algae 10, 165e172.
Guerrini, F., Ciminiello, P., Dell’Aversano, C., Tartaglione, L.,Fattorusso, E., Boni, L., Pistocchi, R., 2007. Influence oftemperature, salinity and nutrient limitation on yessotoxinproduction and release by the dinoflagellate Protoceratiumreticulatum in batch-cultures. Harmful Algae 6, 707e717.
Guerrini, F., Pezzolesi, L., Feller, A., Riccardi, M., Ciminiello, P.,Dell’Aversano, C., Tartaglione, L., Dello Iacovo, E.,Fattorusso, E., Forino, M., Pistocchi, R., 2010. Comparativegrowth and toxin profile of cultured Ostreopsis ovata from theTyrrhenian and Adriatic Seas. Toxicon 55, 211e220.
Guillard, R.R.L., 1975. Culture of phytoplankton for feedingmarine invertebrates. In: Smith, W.L., Chanley, M.H. (Eds.),Culture of Marine Invertebrates Animals. Plenum Press, NewYork, pp. 26e60.
Habermann, E., 1989. Palytoxin acts through Naþ, Kþ-ATPase.Toxicon 27, 1171e1187.
Hasle, G.R., 1978. The inverted microscope method. In: Sournia, A.(Ed.), Phytoplankton Manual. Monographs on OceanographicMethodology, vol. 6. UNESCO, Paris, pp. 88e96.
Hoshaw, R.W., Rosowski, J.R., 1973. Methods for microscopicalgae. In: Stein, J.R. (Ed.), Handbook of Phycological Methods.Cambridge University Press, New York, pp. 53e67.
IRSA-CNR, 2003. Metodi analitici per le acque, APAT Manuali eLinee Guida 29/2003. In: 8060-Metodo di valutazione dellatossicita acuta con Artemia sp., vol. 3 1043e1050.
Lenoir, S., Ten-Hage, L., Turquet, J., Quod, J.P., Bernard, C.,Hennion, M.C., 2004. First evidence of palytoxin analogues froman Ostreopsis mascarenensis (Dinophyceae) benthic bloom inSouthwestern IndianOcean. Journal of Phycology 40, 1042e1051.
Mangialajo, L., Bertolotto, R., Cattaneo-Vietti, R., Chiantore, M.,Grillo, C., Lemee, R., Melchiorre, N., Moretto, P., Povero, P.,Ruggirei, N., 2008. The toxic benthic dinoflagellate Ostreopsisovata: quantification of proliferation along the coastline ofGenoa, Italy. Marine Pollution Bulletin 56, 1209e1214.
Mangialajo, L., Ganzin, N., Accoroni, S., Asnaghi, V., Blanfune, A.,Cabrini, M., Cattaneo-Vietti, R., Chavanon, F., Chiantore, M.,Cohu, S., Costa, E., Fornasaro, D., Grossel, H., Marco-Miralles, F., Maso, M., Rene, A., Rossi, A.M., Montserrat, S.,Thibaut, T., Totti, C., Vila, M., Lemee, R., 2011. Trends inOstreopsis proliferation along the Northern Mediterraneancoasts. Toxicon 57, 408e420.
Monti, M., Minocci, M., Beran, A., Ivesa, L., 2007. First record ofOstreopsis cfr. ovata on macroalgae in the Northern AdriaticSea. Marine Pollution Bulletin 54, 598e601.

wat e r r e s e a r c h 4 6 ( 2 0 1 2 ) 8 2e9 292
Morton, S.L., Norris, D.R., Bomber, J.W., 1992. Effect of temperature,salinity and light-intensity on the growth and seasonality oftoxic dinoflagellates associated with ciguatera. Journal ofExperimental Marine Biology and Ecology 157, 79e90.
Onuma, Y., Satake, M., Ukena, T., Roux, J., Chanteau, S.,Rasolofonirina, N., Ratsimaloto, M., Naoki, H., Yasumoto, T.,1999. Identification of putative palytoxin as the cause ofclupeotoxism. Toxicon 37, 55e65.
Parsons, M.L., Preskitt, L.B., 2007. A survey of epiphyticdinoflagellates from the coastal waters of the island ofHawai‘i. Harmful Algae 6, 658e669.
Pezzolesi, L., Cucchiari, E., Guerrini, F., Pasteris, A., Totti, C.,Pistocchi, R., 2010. Toxicity evaluation of Fibrocapsa japonicafrom the Northern Adriatic Sea through a chemical andtoxicological approach. Harmful Algae 8, 504e514.
Pistocchi, R., Pezzolesi, L., Guerrini, F., Vanucci, S.,Dell’Aversano, C., Fattorusso, E., 2011. A review on the effectsof environmental conditions on growth and toxin productionof Ostreopsis ovata. Toxicon 57, 421e428.
Riobo, P., Paz, B., Franco, J.M., Vazquez, J.A., Murado, M.A., 2008.Proposal for a simple and sensitive haemolytic assay forpalytoxin: toxicological dynamics, kinetics, ouabain inhibitionand thermal stability. Harmful Algae 7, 415e429.
Riobo, P., Franco, J.M., 2011. Palytoxins: biological and chemicaldetermination. Toxicon 57, 368e375.
Rhodes, L., Smith, K., Munday, R., Briggs, L., Selwood, A., 2010.Ostreopsis ovata isolated from Rarotonga, Cook Islands, 14thInternational Conference of Harmful Algae, Hersonissos-Crete(Greece), 1e5 November. Conference abstract book, p. 229.
Rhodes, L., 2011. World-wide occurrence of the toxicdinoflagellate genus Ostreopsis Schmidt. Toxicon 57, 400e407.
Sansoni, G., Borghini, B., Camici, G., Casotti, M., Righini, P.,Fustighi, C., 2003. Fioriture algali di Ostreopsis ovata(Gonyaulacales: Dinophyceae): un problema emergente. Biol.Amb 17, 17e23.
Shears, N.T., Ross, P.M., 2009. Blooms of benthic dinoflagellates ofthe genus Ostreopsis; an increasing and ecologically importantphenomenon on temperate reefs in New Zealand andworldwide. Harmful Algae 8, 916e925.
Simoni, F., Gori, L., Di Paolo, C., Lepri, L., Mancino, A., 2004.Fioriture d’Ostreopsis ovata, Coolia monotis, Prorocentrum limanelle macroalghe del mar Tirreno settentrionale,Mediterraneo (seconda fase di studio). Biol. Ital. 10, 68e73.
Sun, J., Liu, D., 2003. Geometric models for calculating cellbiovolume and surface area for phytoplankton. Journal ofPlankton Research 25, 1331e1346.
Taniyama, S., Osamu, A., Masamitsu, T., Sachio, N., Tomohiro, T.,Yahia, M., Tamao, N., 2003. Ostreopsis sp., a possible origin ofpalytoxin (PLTX) in parrotfish Scarus ovifrons. Toxicon 42,29e33.
Taylor, F.J.R., 1979. A description of the benthic dinoflagellateassociated with maitotoxin and ciguatoxin, includingobservations on Hawaiian material. In: Taylor, D.L., Seliger, H.H. (Eds.), Toxic Dinoflagellate Blooms. Elsevier/North-Holland,New York, pp. 71e76.
Tognetto, L., Bellato, S., Moro, I., Andreoli, C., 1995. Occurrence ofOstreopsis ovata (Dinophyceae) in the Tyrrhenian Sea duringsummer 1994. Botanica Marina 38, 291e295.
Totti, C., 2003. Influence of the plume of the river Po on thedistribution of subtidal microphytobenthos in the NorthernAdriatic Sea. Botanica Marina 46, 161e178.
Totti, C., Cucchiari, E., Romagnoli, T., Penna, A., 2007. Bloom ofOstreopsis ovata on the Conero riviera (NW Adriatic Sea).Harmful Algae News 33, 12e13.
Totti, C., Accoroni, S., Cerino, F., Cucchiari, E., Romagnoli, T.,2010. Ostreopsis ovata bloom along the Conero Riviera(northern Adriatic Sea): relationships with environmentalconditions and substrata. Harmful Algae 9, 233e239.
Usami, M., Satake, M., Ishida, S., Inoue, A., Kan, Y., Yasumoto, T.,1995. Palytoxin analogs from the dinoflagellate Ostreopsissiamensis. Journal of the American Chemical Society 117,5389e5390.
Ukena, T., Satake, M., Usami, M., Oshima, Y., Naoki, H., Fujita, T.,Kan, Y., Yasumoto, T., 2001. Structure elucidation of ostreocinD, a palytoxin analog isolated from the dinoflagellateOstreopsis siamensis. Bioscience, Biotechnology, andBiochemistry 65, 2585e2588.
Varsamos, S., Wendelaar Bonga, S.E., Charmantier, G., Flik, G.,2004. Drinking and Naþ/Kþ ATPase activity during earlydevelopment of European sea bass, Dicentrarchus labrax:Ontogeny and short-term regulation following acute salinitychanges. Journal of Experimental Marine Biology and Ecology311, 189e200.
Vila, M., Garces, E., Maso, M., 2001. Potentially toxic epiphyticdinoflagellate assemblages on macroalgae in the NWMediterranean. Aquatic Microbial Ecology 26, 51e60.