Influence Of Products, Promotion And Distribution Of ...
14
p-ISSN : 2442-4099 IJBAM, Vol 2, No. 02, 2019: 117 - 130 e-ISSN : 2549-8711 Sekolah Tinggi Ilmu Ekonomi Indonesia Jakarta https://ejournal.stei.ac.id/index.php/IJBAM 117 Influence Of Products, Promotion And Distribution Of Purchasing Decisions On Fighting Brand Products (S-Tee) Pt. Sinar Sosro Yuli Purwati 1 ,Hosni Suradji 2 1,2 ,Sekolah Tinggi Ilmu Ekonomi Indonesia Jakarta Jalan Kayu Jati Raya No. 11A, Rawamangun, Jakarta Timur Email: [email protected] Abstract— The purpose of this research is to find out the significant influence of marketing factors which consists of product, promotion, and good distribution simultaneously or partially toward fighting brand product (S-tee) for buying decision at PT. Sinar Sosro. The description of the population which is management students in Sekolah Tinggi Ilmu Ekonomi Indonesia (STEI) examined the entire customers who buy Fighting brand product (S-tee) at PT. Sinar Sosro with as much as 320 samples of people are taken as respondent. The multiple regression analysis is used as analysis technique in this research in addition to find out the amount of regression coefficient as well as to show the strength influence of a product, promotion, and good distribution simultaneously or partially toward fighting brand product (S-tee) buying decision at PT. Sinar Sosro. The statistic test which is conducted can also be concluded that variable which has dominant influence toward customers’ decision in buying fighting brand product (S-tee) at PT. Sinar Sosro is a good distribution variable since its partial determination coefficient is the highest that is 33.1% compare to other variables. Keywords—:Marketing, Fighting brand Product, Customers Buying Decision, Simultaneous Test, Partial Test, Determination Coefficient. INTRODUCTION Drinking tea has been a habit of the Indonesian people since time immemorial, it is because the State of Indonesia is one of the best tea producers in the world, this tea drinking habits include almost all age groups, from adolescence, adulthood, even seniors, tea drinking habits are not know the time, both morning, afternoon, evening and night, this habit is often done by the people of Indonesia. This provides a great opportunity for producers to compete in making and offering instant tea drinks in packs, with the presence of instant tea drinks in packaging today, consumers do not bother making tea drinks because there are many instant tea drinks in various packages available appetite on the market. The tight competition will position the tea producers in packaging to always develop and capture market share. One to achieve market share is the brand. Brand or brand is the name, term, symbol, design, or combination that identifies a product or service produced by the company. Consumer purchasing decisions are to buy the most preferred brand, but two factors can arise between the intention to buy and the purchase decision, namely the attitude factor of others and the unexpected situation factor [5,6](Kotler, 2002). The marketing strategy consists of integrated marketing elements (4P, namely product, price, promotion, place) which always develops in line with the company's movement and changes in the marketing environment and changes in consumer behavior. Consumer behavior has very broad implications for the formulation of marketing strategies. This is because the marketing strategy involves two main activities which include the selection of markets that will be targeted for marketing, and formulating and composing an appropriate combination of marketing mixes so that consumer needs can be satisfactorily met. PT. Sinar Sosro produces ready-to-drink packaged tea (RTDT) that triggers the presence of various similar products offered by other companies. Like Coca Cola Company which produces Frestea,
-
Upload
khangminh22 -
Category
Documents
-
view
1 -
download
0
Transcript of Influence Of Products, Promotion And Distribution Of ...
p-ISSN : 2442-4099 IJBAM, Vol 2, No. 02, 2019: 117 - 130
e-ISSN : 2549-8711 Sekolah Tinggi Ilmu Ekonomi Indonesia Jakarta
https://ejournal.stei.ac.id/index.php/IJBAM
117
Influence Of Products, Promotion And
Distribution Of Purchasing Decisions On
Fighting Brand Products (S-Tee) Pt. Sinar
Sosro
Yuli Purwati1,Hosni Suradji
2
1,2,Sekolah Tinggi Ilmu Ekonomi Indonesia Jakarta
Jalan Kayu Jati Raya No. 11A, Rawamangun, Jakarta Timur
Email: [email protected]
Abstract— The purpose of this research is to find out the
significant influence of marketing factors which consists
of product, promotion, and good distribution
simultaneously or partially toward fighting brand product
(S-tee) for buying decision at PT. Sinar Sosro. The
description of the population which is management
students in Sekolah Tinggi Ilmu Ekonomi Indonesia
(STEI) examined the entire customers who buy Fighting
brand product (S-tee) at PT. Sinar Sosro with as much as
320 samples of people are taken as respondent. The
multiple regression analysis is used as analysis technique
in this research in addition to find out the amount of
regression coefficient as well as to show the strength
influence of a product, promotion, and good distribution
simultaneously or partially toward fighting brand product
(S-tee) buying decision at PT. Sinar Sosro. The statistic
test which is conducted can also be concluded that
variable which has dominant influence toward customers’
decision in buying fighting brand product (S-tee) at PT.
Sinar Sosro is a good distribution variable since its partial
determination coefficient is the highest that is 33.1%
compare to other variables.
Keywords—:Marketing, Fighting brand Product,
Customers Buying Decision, Simultaneous Test, Partial
Test, Determination Coefficient.
INTRODUCTION
Drinking tea has been a habit of the Indonesian people since time immemorial, it is because the State of Indonesia is one of the best tea producers in the world, this tea drinking habits include almost all age groups, from adolescence, adulthood, even seniors, tea drinking habits are not know the time, both morning, afternoon, evening and night, this habit is often done by the people of Indonesia. This provides
a great opportunity for producers to compete in making and offering instant tea drinks in packs, with the presence of instant tea drinks in packaging today, consumers do not bother making tea drinks because there are many instant tea drinks in various packages available appetite on the market.
The tight competition will position the tea producers in packaging to always develop and capture market share. One to achieve market share is the brand. Brand or brand is the name, term, symbol, design, or combination that identifies a product or service produced by the company. Consumer purchasing decisions are to buy the most preferred brand, but two factors can arise between the intention to buy and the purchase decision, namely the attitude factor of others and the unexpected situation factor [5,6](Kotler, 2002).
The marketing strategy consists of integrated marketing elements (4P, namely product, price, promotion, place) which always develops in line with the company's movement and changes in the marketing environment and changes in consumer behavior. Consumer behavior has very broad implications for the formulation of marketing strategies. This is because the marketing strategy involves two main activities which include the selection of markets that will be targeted for marketing, and formulating and composing an appropriate combination of marketing mixes so that consumer needs can be satisfactorily met.
PT. Sinar Sosro produces ready-to-drink packaged tea (RTDT) that triggers the presence of various similar products offered by other companies. Like Coca Cola Company which produces Frestea,
https://doi.org/10.36406/ijbam.v1i1.xxx
118
and Pepsi which produces Tekita, although these two products are now rarely seen on the market, Mayora, which produces Teh Pucuk Harum, Wings produces Javana Tea, ABC produces NU-Green Tea, Two Pliers produces Zestee and others -other. The newcomer company not only entered the market that had previously been controlled by Sosro, but also carried out various innovations in their products. So that the sales of various bottled tea products climbed very fast through various innovations such as giving a more diverse flavor, more attractive packaging and various other innovations.
PT. Sinar Sosro anticipates this situation by carrying out the marketing strategies that are usually carried out by other market leader companies, namely by issuing new S-Tee products as a fighting brand. A fighting brand launched is intended to beat competitors' new products out so that the main product can be protected. The main purpose of fighting brands is to compete with similar products. So that the competitor's products are expected to be busy to compete and beat each other with the fighting brand, while the company's main products can calmly control the market alone [1,2](Kartajaya, 2000).
The main characteristic of fighting brands is having product attributes that are similar to competing products [1,2](Kartajaya, 2000). S-Tee offers a variety of product attributes that are almost similar to Sosro's competitors, namely FresTea from the Coca Cola Company, TeKita from Pepsi, Teh Pucuk Harum from Mayora and others. S-Tee also sells its tea products in various packaging. Like glass bottles, plastic bottles and others. This was also spearheaded by Sosro's competing products This resemblance is very clear. Fighting brands are intended not to dominate the market, but to trouble competitors. So that the product attributes possessed by a fighting brand must be adjusted to the product attributes owned by competitors. And the product attributes as far as possible do not interfere with the main product [1,2](Kartajaya, 2000).
The interesting thing about fighting brands is the risk that might arise from the use of this strategy. Sometimes the positioning made by the company against the fighting brand is too strong so that this product could also compete with the main product. This risk is referred to as predatory risk [7](Kunto, 2003). Predatory occurs if it turns out that the sales level of the main products is decreasing along with the rising level of sales of brand fighting products.
Formulation of the problem
From the background and data obtained shows a problem that is a decrease in the level of sales of fighting brand (S-tee) products of PT. Sinar Sosro in the past two years. This picture shows a decrease in consumer purchasing decisions on Sosro products.
Based on the description above, the following research questions are raised:
1. How Products affect the purchasing decision of a fighting brand (S-tee) product from PT. Sinar Sosro?
2. How does promotion affect the decision to purchase fighting brand (S-tee) products from PT. Sinar Sosro?
3. How Distribution affects the decision to purchase fighting brand (S-tee) products from PT. Sinar Sosro?
Research Objectives
In accordance with the proposed problem formulation, the purpose of this study is to find out and examine:
1. To test and analyze how the product influences the purchase decision of a fighting brand (S-tee) product from PT. Sinar Sosro.
2. To test and analyze how the influence of promotion on the decision to purchase fighting brand (S-tee) products from PT. Sinar Sosro.
3. To test and analyze how the influence of distribution on the decision to purchase fighting brand (S-tee) products from PT. Sinar Sosro.
4. To find out and analyze the most dominant factors that influence purchasing decisions
Research Use / Benefits
1. Use of Academics
It is expected to be a reference reference material that is useful for studies and similar research so that it is useful for science in the field of marketing, especially regarding product quality, promotion and distribution of Fighting Brand Products (S-tee) with the consumer purchasing decision process.
2. Practical Uses
Can add insight and knowledge by comparing theories that have been accepted in lectures with the real facts that occur in the company.
a. Get information about the company's activities in running its business.
b. For consideration of PT. Sinar Sosro in order to determine the decision-making strategies regarding products and to further increase the level of sales and find out which factors most influence consumers in making decisions to purchase fighting brand (S-tee) products from PT. Sinar Sosro.
Yuli Purwati,Hosni Suradji. Influence Of Products, Promotion
119
THEORETICAL BASIS
Marketing strategy
Marketing strategy is a plan that describes the company's expectations of the impact of various marketing activities or programs on the demand for products or product lines in a particular target market. Companies can use two or more marketing programs simultaneously, because each type of program (such as advertising, sales promotion, personal selling, customer service, or product development) has different influences on demand [10](Tjiptono, 2008).
Buying decision
According to [5,6]Kotler and Armstrong (2002) purchasing decisions are stages in the buyer's decision-making process where consumers actually buy. Decision making is an individual activity that is directly involved in obtaining and using the goods offered.
Purchasing decision according to Schiffman Kanuk (2004, p. 547) is the selection of two or more alternative purchasing decision choices, meaning that someone can make a decision, there must be several alternative choices. The decision to buy can lead to how the decision-making process is carried out.
Consumer behavior is actions carried out by individuals, groups or organizations that are related to the decision making process in obtaining, using economic goods or services that can be influenced by the environment (Swastha, 2003). There are 2 important aspects of the meaning of consumer behavior.
1. Decision making process.
2. Physical activities which all involve individuals in assessing obtaining and using economic goods and services.
Fighting Brand
Fighting brand is one strategy that is run by the market leader company when facing new competitors. The strategy to issue fighting brands is intended to protect products from competitors without having to deal directly with competing products [1,2](Kartajaya, 2001).
Understanding fighting brands according to several sources, including:
Fighting brands according to Machfud (2005):
Products created to fight substitution products. Fighting brands are also used to reach secondary segments outside the company's main segment as long as the segment is considered profitable.
According to [1,2]Kartajaya (2001):
Brands are intentionally made to withstand attacks from 'bottom', and are usually used by market leaders.
According to [1,2]Kartajaya (2001) a market leader company needs to have a fighting brand because market leaders usually always become the focus of interest. When a company becomes a market leader there are three possibilities that can occur from its competitors. Become a target of shooting, imitated, or avoided. And these three things are very unfavorable for the market leader company. Product
Products according to [10]Tjiptono (2008) are all things that can be offered by producers to be considered, requested, sought, purchased, used or consumed by the market as meeting the needs or desires of the market concerned.
According to [8]Stanton, (2001), it means that a product is a collection of tangible and unreal attributes, including packaging, color, price, quality and brand plus service and sales reputation.
Customers who feel satisfied will return to buy, and they will tell others about their good experience with the product. Smart companies intend to satisfy customers by only promising what they can give, then giving more than they promised.
Promotion
Promotion is information flow or one-way persuasion that is made to direct a person or organization to actions that create exchanges in marketing (Swastha and Irawan, 2008: 349). Meanwhile, according to [5,6]Kotler (2008: 266), promotion is the process of communicating a company with parties who have an interest in the present and the future and the community. Promotion is one of the variables in the marketing mix that is very important to be carried out by the company in marketing service products. Promotional activities not only serve as a communication tool between companies and consumers, but also as a tool to influence consumers in purchasing activities or use of services in accordance with their wants and needs. The purpose of promotion according to Swastha and Irawan (2008: 353) is modification of behavior, providing information, persuading, reminding.
Definition of sale proposed by Philip [5,6]Kotler (2008: 266) is a campaign that includes all of the tools in combination marketing role is key to communicating the nature of persuading the campaign is a communication process of the delivery of the mandate or news about products / goods or services from seller to potential buyers (consumers). Promotion is concerned with communication methods aimed at markets that are targeted about the

https://doi.org/10.36406/ijbam.v1i1.xxx
120
right products that are sold in the right place at the right price.
Distribution
According to Warren J [4]Keegan (2003), the distribution channel is the channel used by producers to distribute the goods from producers to consumers or industrial users.
From the viewpoint of these experts we can conclude that one of the branches of the marketing channel is related to the problem of distributing goods from producers to consumers or industrial consumers. So that in this case the distribution channel has the duty to deliver products or services produced by companies or producers to consumers or industrial consumers.
Distribution can also be interpreted as a marketing activity that seeks to facilitate and facilitate the delivery of goods and services from producers to consumers, so that their use is in accordance with what is needed (type, amount, price, place and when needed). In other words, the distribution process is a marketing activity that is able to: [10](Tjiptono, 2008)
Creating product added value through marketing functions that can realize the utility / utility of form, place, time and ownership.
Streamlining the flow of marketing channels (marketing channel flow) physically and non-physically. What is meant by the flow of marketing is the flow of activities that occur between marketing institutions involved in the marketing process. The marketing channels include physical goods flow, ownership flow, information flow , promotion flow, flow of negotiations, payment flows, funding flows, risk coverage flows
Retailing
Retailing is all the activities of selling goods and services directly to end consumers for personal and household use not for business purposes. If a Manufacturing Institution, wholesale or retail store sells something to the end consumer for Non-Business use, then they have made retail sales [10](Tjiptono, 2008).
2.1. Framework
Based on the formulation of the problem and the literature review that has been described in advance about product variables, promotion and distribution as well as their influence on purchasing decisions, the theoretical framework proposed in this study is described as follows
Figure 2.1
Theoretical Thought Framework Source: Primary data processed (2016)
Hypothesis
The hypothesis is a temporary answer to the formulation of research problems that aim at directing and providing guidance in the subject matter and research objectives. Then from the description of the existing problems, a research hypothesis can be raised as follows:
H1: Products have a positive effect on purchasing decisions. This means that the higher the quality of the product, the higher the likelihood of consumers buying products.
H2: Promotion has a positive effect on purchasing decisions. This means that the better the product is known, the higher the level of possibility of consumers in buying products.
H3: Distributed has a positive effect on purchasing decisions. This means that the broader the range of distribution so that the product is easily obtained, the higher the level of possible consumers in buying products.
H4: Products, Promotion and Distribution simultaneously have a positive effect on purchasing decisions.
RESEARCH METHOD
The study was conducted at the Indonesian College of Economics starting from June 2016 to October 2016.
Population
The population is the generality area which consists of: objects / subjects that have certain qualities and characteristics set by researchers to be studied and then drawn conclusions [9](Sugiyono, 2011). In this case the population is that of all students majoring in Management of the Indonesian Economic College in Jakarta, totaling 1,593 students who had consumed S-tee, so the sample was taken for this study.
Sample
The sampling technique used is probability sampling, which is a sampling technique that provides equal opportunities for each population

Yuli Purwati,Hosni Suradji. Influence Of Products, Promotion
121
(member) to be selected as a sample member [9](Sugiyono, 2011). Whereas the determination of the number of respondents (samples) was taken through simple random sampling technique. Simple random sampling technique is a technique that is said to be simple because the taking of sample members from the population is done randomly without regard to the existing strata in the population [9](Sugiyono 2011), then asks whether prospective respondents are willing to answer questionnaire questions. If you are willing, immediately the interview process is conducted. In other words, the sample consists of people who are willing and easy for the researcher to start the interview (Ferdinand, 2006).
In order for the sample we take to truly represent the population, we need a standard or method in determining the sample. There are many ways and formulas to determine the number of samples, one of which is to use the Slovin formula which is simple and easy to calculate.
Slovin formula
Mathematically, the Slovin formula that we use to determine the number of samples is as follows:
n = N / (1 + N. (e) 2)
Information :
n = Number of Samples
N = Total Population
e = Tolerance Error Error
By using the formula above, the following calculation is obtained:
From the results of the calculation of the formula above can be obtained the number of samples to be studied is 320 respondents.
Research Instruments
The types and sources of data used in this research variable are explained as follows:
Primary data Primary data is data obtained directly from the original source (without intermediaries). The primary data contained in this study are the results of questionnaires on a predetermined sample (Students of the Department of Management in the Indonesian College of Economics Jakarta) in the form of raw data with a Likert scale to find out the responses of respondents regarding
product influence, promotion and distribution of purchasing decisions. fighting brand (S-tee) products.
Secondary data
Secondary data is research data obtained indirectly through intermediary media (obtained and recorded by other parties). Secondary data used in this study came from previous research journals, www.sosro.com, information directly from the Management of PT. Sinar Sosro, the Registration Section of the Indonesian College of Economics to find out accurate data on S1 Management students.
Data analysis method
So that data collected can be useful, it must be processed and analyzed first so that it can be used as a basis for decision making. The purpose of the data analysis method is to interpret and draw conclusions from the amount of data collected.
Validity test
Validity test is used to measure the validity or validity of a questionnaire. A questionnaire is said to be valid if the statement on the questionnaire is able to reveal something that will be measured by the questionnaire [1](Ghozali 2012). Significant test is done by comparing the r count with r table for degree of freedom (df) = n-2, in this case n is the number of samples and alpha = 0.05. If r count is greater than r table and positive value, then the item or statement or indicator is said to be valid [1](Ghozali, 2012).
Reliability Test
Reliability test is a tool to measure a questionnaire which is an indicator of variables. A questionnaire is said to be reliable or reliable if someone's answer to the statement is consistent or stable over time [1](Ghozali, 2012).
Reliability measurement is done by one shot or measurement once, then the results are compared with other questions or measure the correlation between answer statements. SPS provides facilities to measure reliability with Cronbach Alpha (α) statistical tests [1](Ghozali, 2012). A construct or variable is said to be reliable if it gives a Cronbach Alpha value> 0.5 [1](Ghozali, 2012)
Regression Analysis
The data analysis method used in this study is a quantitative analysis method. Where to achieve the first goal is to analyze the influence of products, promotion and distribution of consumer decisions in making purchases is to use multiple regression analysis (Multiple regression analysis). Useful regression is carried out on models of more than one independent variable, to determine its effect on the dependent variable (Santoso, 2000). In this study using SPSS for Windows statistical program tools to
https://doi.org/10.36406/ijbam.v1i1.xxx
122
facilitate the processing of research data from the program will be obtained output in the form of processing results from data that has been collected, then the output of the data processing results are interpreted to be analyzed. After doing the analysis, then a conclusion is taken as a result of the research. Multiple regression is done to determine the extent to which the independent variables affect the dependent variable. In multiple regression there is one dependent variable and more than one independent variable. In this study the dependent variable is the purchase decision on S-tee, while the independent variable is product, promotion and distribution. The model of the purchase decision relationship with these variables can be arranged in the following functions or equations:
Y = a + b1 X 1 + b2 X 2 + b3 X 3 Which: Y: Purchase decision a: Constants b: coefficient X1: Products X2: Promotion X3: Distribution
Classic Assumption Test
Classical assumption test aims to determine the condition of the data used in the study. This is done in order to obtain the right analysis model. This research regression analysis model requires assumption testing of data which includes:
1. Multicollinearity Test
Multicollinearity test aims to examine whether the regression model found a correlation between independent variables [1](Ghozali, 2012). A good regression model should not have a correlation between the independent variables [1](Ghozali, 2012). To detect the presence or absence of multicollinearity in regression, it can be seen from the tolerance value and variance inflation factor (VIF). Low tolerance value equals high VIF value (because VIF) = 1 / Tolerance). The common cut-off value used to indicate the level of multicollinearity is the tolerance value ≤ 0, 10 or equal to the value ≥ 10.
2. Heteroscedasticity test
Heteroscedasticity test aims to test whether in a regression model there is a variance inequality from residuals from one observation to another [1] (Ghozali, 2012). If the variance of the residue or from one observation to another remains constant, it is called homokedasticity. And if variance is different then it is called heteroscedasticity. A good regression model is that Homoskesdatisitas or does not occur heteroscedasticity [1](Ghozali, 2012)). One way to detect heteroscedasticity is to look at the plot graph
between the predicted value of the dependent variable, ZPRED and the residual value of SRESID.
3. Normality Test
Data normality test aims to test whether in the regression model, residual variables have normal distribution (Gozali, 2012). To test whether the data collected is normally distributed or cannot be done by the following methods:
a. Graph Method
A reliable graphical method is to look normally at a normal probability plot that compares the cumulative distribution of the normal distribution (Gozali, 2006). The normal distribution will form a diagonal straight line, and the residual data plot will be compared to the diagonal line. If the data spread around the diagonal line, the regression model meets the assumption of normality. If data spreads far from diagonal or follows a diagonal line, the regression model does not meet the assumption of normality.
b. Statistical Method
Simple statistical tests that are often used to test the assumption of normality are by using the normality test from Kolmogorov Smirnov. The normal test method for data distribution is done by looking at the variable significance value, if it is significantly greater than alpha 5% then it shows the normal data distribution.
In this study the author uses normal probability plot normality test.
4. Autocorrelation Test
Autocorrelation test is a correlation on the place in an adjacent place the data is cross sectional. Autocorrelation is a time series correlation (emphasizing two research data in the form of time series data). How to detect the presence or absence of symptoms of autocorrelation is to use the value of DW (Durbin Watson) with the criteria for retrieval if DW is equal to 2, then there is no perfect autocorrelation as a rule of tumb (concise rule), if the DW value is between 1.5 -2.5 did not experience autocorrelation symptoms [1](Ghozali, 2012).
5. Hypothesis Test
a. T test
The t test is used to test the significance of the variation of the relationship between variables X and Y, whether the variables X1, X2, X3 really have a partial effect on variable Y (purchasing decision). In conducting the t test, the preparation of the hypothesis to be tested is used in the form of a null hypothesis (H0) and an alternative hypothesis (Hi):
b. Test F
Yuli Purwati,Hosni Suradji. Influence Of Products, Promotion
123
In this study to determine the level of significance of the influence of independent variables together (simultaneous) on the dependent variable is done by using the F test that is by comparing the F count with F table.
c. Determination Coefficient (R²)
The determinant coefficient (R²) is intended to determine the best level of accuracy in regression analysis, where it is indicated by the magnitude of the determination coefficient (R²) between 0 (zero) and 1 (one). The coefficient of determination (R2) zero independent variable has absolutely no effect on the dependent variable. If the coefficient of determination is getting closer to one, it can be said that the independent variable influences the dependent variable. In addition the coefficient of determination is used to determine the percentage change in the dependent variable (Y) caused by the independent variable (X).
Statistical Hypothesis
The statistical hypothesis in this study was formulated as follows:
- Ho ≤ 0 Product variables do not have a positive effect on consumers' decisions to purchase S-tee products.
- Ha ≥ 0 Product variables have a positive effect on consumers' decisions to purchase S-tee products- Ho ≤ 0 Promotion variables do not have a positive effect on consumers' decisions to make purchases on S-tee products.
- Ha ≥ 0 Promotional variables have a positive effect on consumers' decisions to purchase S-tee products.
- Ho ≤ 0 Distribution variables do not have a positive effect on consumers' decisions to make purchases on S-tee products.
- Ha ≥ 0 Distribution variables have a positive effect on consumer decisions to purchase S-tee products.
- Ho ≤ 0 Product variables, promotion and distribution simultaneously do not have a positive effect on consumer decisions to make purchases on S-tee products.
- Hi ≥ 0 Product variables, promotion and distribution simultaneously have a positive effect on consumer decisions to make purchases on S-tee products.
RESEARCH RESULTS AND INTERPRETATION
The Sosrodjojo family started its business in 1940 in the city of Slawi, Central Java by producing and marketing the branded tea "Teh Cap Botol". In 1965,
the Sosrodjojo Family began to expand its business by venturing into Jakarta by conducting a product sampling strategy in several markets in Jakarta.
Basic or Philosophy of PT. Sinar Sosro is a Good Intent which is described in 3K and RL, namely: Caring for Quality, Safety, Health, and Environmentally Friendly.
Tea raw materials for PT. Sinar Sosro is supplied by PT. Mount Slamat, while the tea raw material is managed by PT. Agro Pangan as a Sister company. Tea raw materials for PT. Sinar Sosro comes from:
1. Gunung Rosa Tea Plantation in Cianjur
2. Gunung Manik Tea Plantation in Cianjur
3. Gunung Cempaka Tea Plantation in Cianjur
4. Gunung Satria Tea Plantation in Garut
5. Neglasari District Tea Plantation in Garut
6. Cukul District Tea Plantation in Pangalengan
7. Regional Tea Plantation Sambawa in Tasikmalaya
Research Site
The study was carried out in the Indonesian College of Economics to Management Students who had consumed S-tee, the amount in accordance with the sample calculation.
Research time
The time of the research was carried out in June 2016 until October 2016
Characteristics of Respondents
Characteristics of respondents in this study were differentiated according to gender and age. The characteristics of respondents can be seen from the following explanation:
1. Gender of Respondents
Characteristics of respondents based on the results of questionnaires seen from the gender as follows:
Source: 2016 data processing results
Based on the results of the respondents' profile questionnaire regarding the sex of 320, the data obtained were respondents who were 194 women
https://doi.org/10.36406/ijbam.v1i1.xxx
124
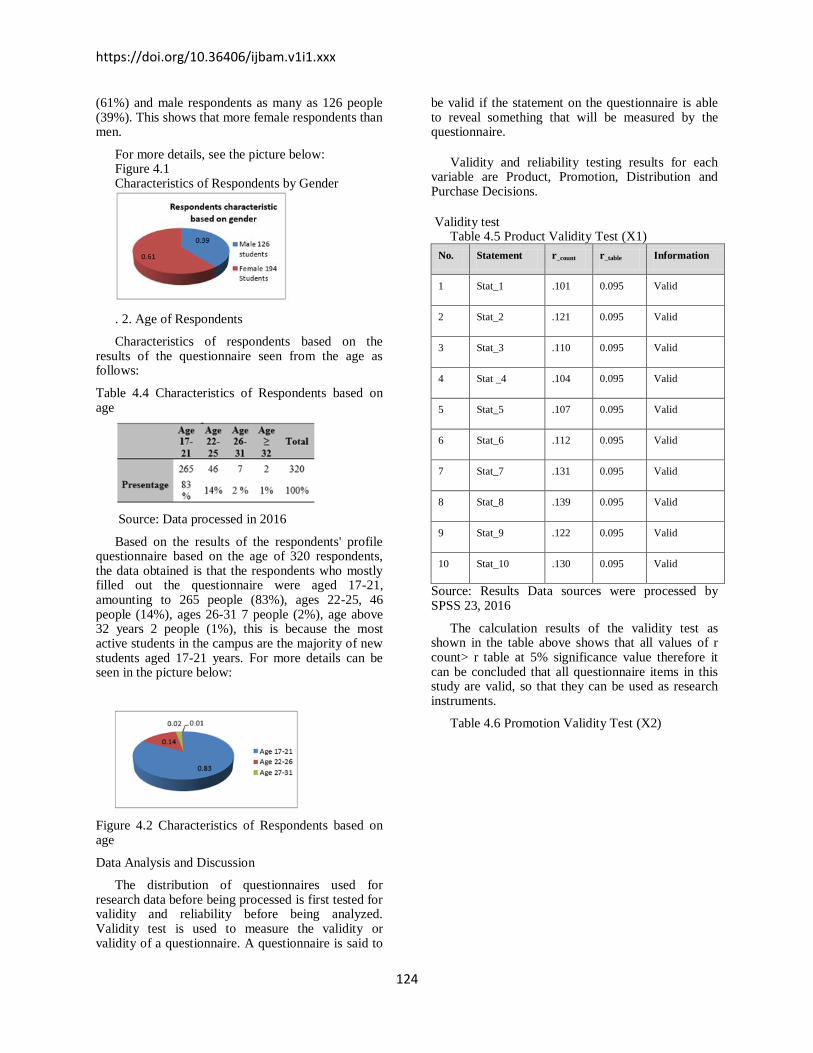
(61%) and male respondents as many as 126 people (39%). This shows that more female respondents than men.
For more details, see the picture below: Figure 4.1 Characteristics of Respondents by Gender
. 2. Age of Respondents
Characteristics of respondents based on the results of the questionnaire seen from the age as follows:
Table 4.4 Characteristics of Respondents based on age
Source: Data processed in 2016
Based on the results of the respondents' profile questionnaire based on the age of 320 respondents, the data obtained is that the respondents who mostly filled out the questionnaire were aged 17-21, amounting to 265 people (83%), ages 22-25, 46 people (14%), ages 26-31 7 people (2%), age above 32 years 2 people (1%), this is because the most active students in the campus are the majority of new students aged 17-21 years. For more details can be seen in the picture below:
Figure 4.2 Characteristics of Respondents based on age
Data Analysis and Discussion
The distribution of questionnaires used for research data before being processed is first tested for validity and reliability before being analyzed. Validity test is used to measure the validity or validity of a questionnaire. A questionnaire is said to
be valid if the statement on the questionnaire is able to reveal something that will be measured by the questionnaire.
Validity and reliability testing results for each variable are Product, Promotion, Distribution and Purchase Decisions.
Validity test Table 4.5 Product Validity Test (X1)
No. Statement r_count r_table Information
1 Stat_1 .101 0.095 Valid
2 Stat_2 .121 0.095 Valid
3 Stat_3 .110 0.095 Valid
4 Stat _4 .104 0.095 Valid
5 Stat_5 .107 0.095 Valid
6 Stat_6 .112 0.095 Valid
7 Stat_7 .131 0.095 Valid
8 Stat_8 .139 0.095 Valid
9 Stat_9 .122 0.095 Valid
10 Stat_10 .130 0.095 Valid
Source: Results Data sources were processed by SPSS 23, 2016
The calculation results of the validity test as shown in the table above shows that all values of r count> r table at 5% significance value therefore it can be concluded that all questionnaire items in this study are valid, so that they can be used as research instruments.
Table 4.6 Promotion Validity Test (X2)

Yuli Purwati,Hosni Suradji. Influence Of Products, Promotion
125
Source: Results Data sources were processed by SPSS 23, 2016.
The calculation results of the validity test as shown in the table above shows that all values of r count> r table at 5% significance value therefore it can be concluded that all questionnaire items in this study are valid, so that they can be used as research instruments.
Table 4.7 Distribution Validity Test (X3)
The calculation results of the validity test as shown in the table above shows that all values of r count> r table at a significance value of 5% therefore it can be concluded that all questionnaire items in this study are valid, so that they can be used as research instruments.
Table 4.8 Test Validity Test (Y)
Source: Results Data sources were processed by SPSS 23, 2016
The results of the calculation of the validity test as shown in the table above, that all values of r count> r table at a significance value of 5%. therefore it can be concluded that all questionnaire items in this purchase decision variable are valid, so that they can be used as research instruments
Reliability Test
Reliability test is a tool to measure a questionnaire which is an indicator of variables. A questionnaire is said to be reliable or reliable if someone's answer to the statement is consistent or stable over time
Table 4.9 Reliability Test
No. Statement r_count r_table Information
1 Stat_14 .163 0.095 Valid
2 Stat_15 .138 0.095 Valid
3 Stat_16 .160 0.095 Valid
4 Stat_17 .123 0.095 Valid
5 Stat_18 .216 0.095 Valid
6 Stat_19 .114 0.095 Valid
No. Statement r_count r_table Information
1 Stat_23 .134 0.095 Valid
2 Stat _24 .098 0.095 Valid
3 Stat_25 .148 0.095 Valid
4 Stat _26 .133 0.095 Valid
5 Stat _27 .126 0.095 Valid
6 Stat_28 .192 0.095 Valid
No. Statement r_count r_table Information
1 Stat_30 .293 0.095 Valid
2 Stat_31 .190 0.095 Valid
3 Stat_32 .218 0.095 Valid
4 Stat_33 .198 0.095 Valid
5 Stat_35 .203 0.095 Valid
6 Stat_36 .118 0.095 Valid
Variable r_count r_table Information
X1 .828 0.095 Reliable
X2 .771 0.095 Reliable
X3 .805 0.095 Reliable
Y .795 0.095 Reliable

https://doi.org/10.36406/ijbam.v1i1.xxx
126
Source: Results Data sources were processed by SPSS 23, 2016
Reliability is done by alpha formula. Significance test was carried out at level a = 0.05. Instruments can be said to be reliable if the alpha value> r table (0.095).
Reliability test results obtained the value of the reliability coefficient questionnaire X1 of 0.828 questionnaire X2 of 0.771, questionnaire X3 of 0.805 and questionnaire Y of 0.795, based on the reliability coefficient can be concluded that all the questionnaires were reliable or consistent, so that they can be used as research instruments.
Classic assumption test
1. Normality Test Figure 4.3 P Plot
Source: Results Data sources were processed by SPSS 23, 2016
The figure shows that the Normal P-P graph Plot of Regression Stadardized Residual illustrates the distribution of data around the diagonal line and the spread following the diagonal line of the graph, the regression model used in this study meets the assumption of Normality.
2. Multicollinearity Test Table 4.10 Multicollinearity Test Results
Measured
Variable Tolerance VIF Criteria
X1 .612 1.633 Non- Multicollinearity
X2 .534 1.872 Non- Multicollinearity
X3 .588 1.700 Non- Multicollinearity
Source: Results Data sources were processed by SPSS 23, 2016
Multicollinearity aims to test whether the regression model found a correlation between independent variables. A good regression model should not have a correlation between independent variables. If the independent variables are mutually correlated, then these variables are not Orthogonal, are independent variables whose correlation values between independent variables are zero. Tables show
outputspss said there are no symptoms of multicollinearity if the value is Tolerance. 0.10 does not occur Multicollinearity and vice versa if the VIF value is <10 then there is no Multicollinearity. The calculation results produce the VIF value for multiple regression under the number 10, it can be concluded that there are no multicollinearity symptoms in the regression model.
3. Heteroscedasticity test Figure 4.4 Heterocoscedasticity Test Results
Source: Results Data sources were processed by SPSS 23, 2016
The figure shows the Scatterplot graph shown for the Heterokesdasticity Test for not occurring heteroscedasticity in the regression model, so that the model shows points that spread randomly and no clear patterns are formed and in the spread of the points spread below and above the number 0 on the Y axis. This identifies a feasible regression to predict.
4. Uji Autokorelasi Tabel 4.11 Hasil Uji Autakorelasi
a. Predictors: (Constant), Distribution, Product, Promotion
b. Dependent Variable: Buying Decision.
Source: Results Data sources were processed by SPSS 23, 2016
How to detect the presence or absence of symptoms of autocorrelation is to use the value of DW (Durbin Watson) with the criteria for retrieval if DW is equal to 2, then there is no perfect autocorrelation as a rule of tumb (concise rule), if the DW value is between 1.5 -2.5 do not experience autocorrelation symptoms
From the above table, it is obtained the value of Durbin-Watson (DW count) of 1.693 or 2. Based on the criteria that have been determined DW, the data is not autocorrelated.

Yuli Purwati,Hosni Suradji. Influence Of Products, Promotion
127
5. Multiple Regression Test
R2 test Table 4.12 R2 Test Results
a. Predictors: (Constant), Distribution, Product, Promotion
b. Dependent Variable: Buying Decision.
Source: Results Data sources were processed by SPSS 23, 2016
While the R test determinant reaches the value of R Square of 41.7 percent this shows that research on the purchase decision of Fighting Brand Products is influenced by Product Variables, Promotion and Distribution by 41.7 percent and the remaining 58.3 percent influenced by other variables outside the researched.
T test Table 4.13 t Test Results
a. Dependent Variable: Buying Decision.
Source: Results Data sources were processed by SPSS 23, 2016
Table 4.13 shows the multiple linear regression equation as follows:
Y = 5.696 + 0.037 X1 + 0.291 X2 + 0.331 X3
The equation Y = 5.696 + 0.037 X1 + 0.291 X2 + 0.331 X3 illustrates that the independent (product) variables (X1), Promotion (X2), and Distribution (X3), in the regression model can be expressed if one independent variable changes by 1 ( one) and the other is constant, then the change in the dependent variable (dependent) The purchase decision (Y) is equal to the coefficient value (b) of the value of the
understanding that if the Product (X1), Promotion (X2), and Distribution (X3) simultaneously or together does not change or equal zero (0) then the amount of the Purchase Decision (Y) is 5.696 unit.
I. If the value of b1 which is the regression coefficient of the product (X1) is 0.037 which means that it has a positive influence on the dependent
variable (Y) means that if the Product variable (X1) increases by 1 unit, then the purchase decision (Y) will also increase amounting to 0.037 units assuming other variables remain or constant.
II. If the value of b2 which is the regression coefficient of Promotion (X2) is 0.291 which means having a positive influence on the dependent variable (Y) means that if the Promotion variable (X2) increases by 1 unit, then the purchase decision (Y) will increase by 0.291 units assuming other variables remain or constant. III. If the b3 value is the regression coefficient of Distribution (X3) of 0.331, which means having a positive influence on the dependent variable (Y) means that if the Distribution variable (X3) increases by 1 unit, then the purchase decision (Y) will increase by 0.331 units assuming other variables remain or constant.
To find out the effect is significant or not, then the regression coefficient value is tested for its significance. The steps to test the significance of the regression coefficient or t test are as follows:
First hypothesis
Ho1 = b1 = 0 = (X1 has no effect on Y)
Ha1 = b1 # 0 = (X1 affects Y)
95% confidence level, α = 0.05
Testing criteria:
Ho1 is accepted if -t (α / 2: n-k-1) ≤ t ≤ t (a / 2: n-k-1) or significant> 0.05
Ho1 is rejected If -t (a / 2: n-k-1) ≥ t ≥ t (a / 2: n-k-1) or significant <0.05
Calculation:
Based on the analysis using SPSS version 23, the t count value is 1,217 with a significant 0, 224
Test Decision:
Ho1 is accepted and Ha1 is rejected because t count> t table is 1, 217> 0.095 and significant 0.224> 0.005
Conclusion: X1 has no significant effect on Y.
Second hypothesis
Ho2 = b2 = 0 = (X2 has no effect on Y)
Ha2 = b2 # 0 = (X2 affects Y)
95% confidence level, α = 0.05
Testing criteria:
Ho2 is accepted if -t (α / 2: n-k-1) ≤ t ≤ t (a / 2: n-k-1) or significant> 0.05
Ho2 is rejected If -t (a / 2: n-k-1) ≥ t ≥ t (a / 2: n-k-1) or significant <0.05
https://doi.org/10.36406/ijbam.v1i1.xxx
128
Calculation:
Based on the analysis using SPSS version 23, the t count value is 6.370 with a significant 0.000
Test Decision:
Ho2 is rejected and Ha2 is rejected because t count> t table is 6.370> 0.095 and significant 0.000> 0.005
Conclusion: X2 has a significant effect on Y.
Third Hypothesis
Ho3 = b3 = 0 = (X3 has no effect on Y)
Ha3 = b3 # 0 = (X3 affects Y) 95% confidence level, α = 0.05
Testing criteria:
Ho3 is accepted if -t (α / 2: n-k-1) ≤ t ≤ t (a / 2: n-k-1) or significant> 0.05
Ho3 is rejected If -t (a / 2: n-k-1) ≥ t ≥ t (a / 2: n-k-1) or significant <0.05
Calculation:
Based on the analysis using the SPSS version 23 tool, the t count value is 5.280 with a significant 0.000
Test Decision:
Ho3 is rejected and Ha3 is rejected because t count> t table is 5.280> 0.095 and significant 0.000> 0.005
Conclusion: X3 has a significant effect on Y.
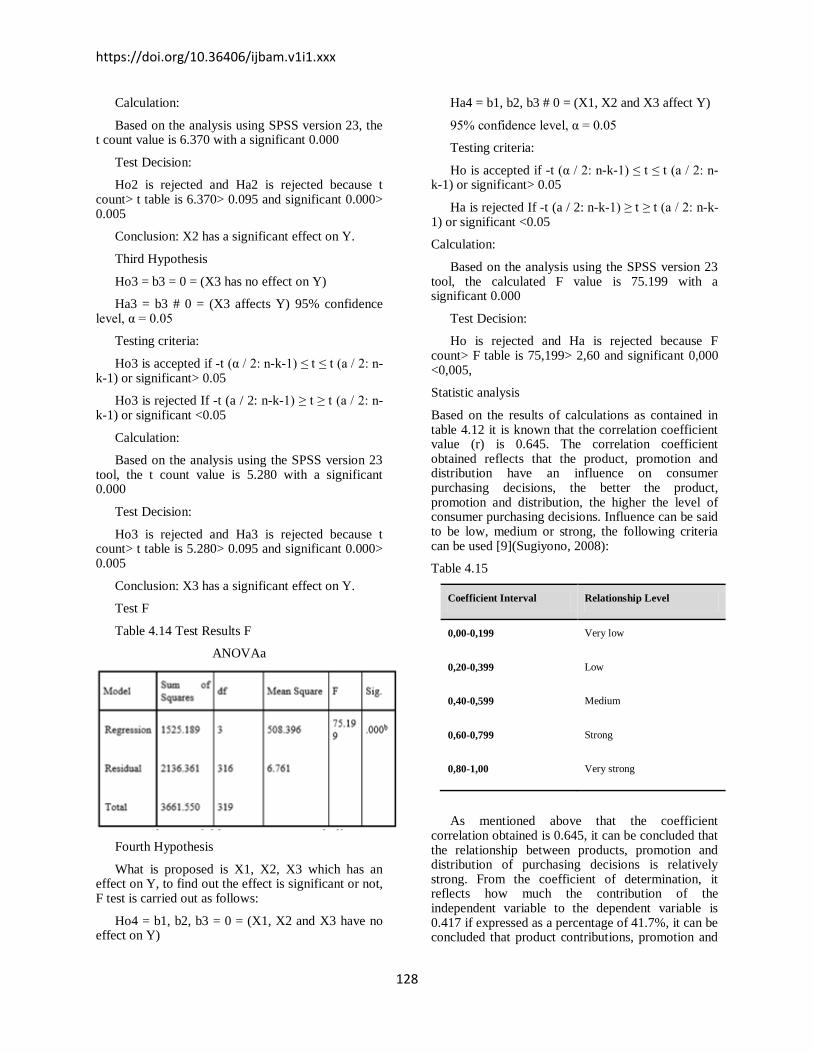
Test F
Table 4.14 Test Results F
ANOVAa
Fourth Hypothesis
What is proposed is X1, X2, X3 which has an effect on Y, to find out the effect is significant or not, F test is carried out as follows:
Ho4 = b1, b2, b3 = 0 = (X1, X2 and X3 have no effect on Y)
Ha4 = b1, b2, b3 # 0 = (X1, X2 and X3 affect Y)
95% confidence level, α = 0.05
Testing criteria:
Ho is accepted if -t (α / 2: n-k-1) ≤ t ≤ t (a / 2: n-k-1) or significant> 0.05
Ha is rejected If -t (a / 2: n-k-1) ≥ t ≥ t (a / 2: n-k-1) or significant <0.05
Calculation:
Based on the analysis using the SPSS version 23 tool, the calculated F value is 75.199 with a significant 0.000
Test Decision:
Ho is rejected and Ha is rejected because F count> F table is 75,199> 2,60 and significant 0,000 <0,005,
Statistic analysis
Based on the results of calculations as contained in table 4.12 it is known that the correlation coefficient value (r) is 0.645. The correlation coefficient obtained reflects that the product, promotion and distribution have an influence on consumer purchasing decisions, the better the product, promotion and distribution, the higher the level of consumer purchasing decisions. Influence can be said to be low, medium or strong, the following criteria can be used [9](Sugiyono, 2008):
Table 4.15
Coefficient Interval Relationship Level
0,00-0,199 Very low
0,20-0,399 Low
0,40-0,599 Medium
0,60-0,799 Strong
0,80-1,00 Very strong
As mentioned above that the coefficient correlation obtained is 0.645, it can be concluded that the relationship between products, promotion and distribution of purchasing decisions is relatively strong. From the coefficient of determination, it reflects how much the contribution of the independent variable to the dependent variable is 0.417 if expressed as a percentage of 41.7%, it can be concluded that product contributions, promotion and
Yuli Purwati,Hosni Suradji. Influence Of Products, Promotion
129
distribution of purchasing decisions simultaneously affect 41.7% and the remaining 58. 3% is influenced by other variables.
Discussion of Research Results
The results of statistical analysis in this study prove that variables, promotions and distributions have a strong and significant influence on purchasing decisions unless product variables are partially insignificant to the purchase decision of Fighting Brand (S-tee) products of PT. Sinar Sosro. But simultaneously products, promotion and distribution have a strong and significant effect on purchasing decisions. This gives meaning that products, promotions and distributions contribute to consumer purchasing decisions. These results indicate that the ups and downs of consumers' decisions to buy fighting brand (S-tee) products at PT. Sinar Sosro is determined by how well the quality of the product, the implementation strategy of the promotion carried out by the company, and the existence of the product distribution place. The number of 58% influences other variables on purchasing decisions can be from environmental conditions, from the consumers themselves
CONCLUSION
The conclusions obtained from the results of this study are as follows:
1. Partially that the product has a significant effect on the purchase decision of the PT Fighting Brand product. Sinar Sosro is S-tee for t count> t table, 1,217> 0.095
2. Partially that promotion has a significant effect on purchasing decisions of PT Fighting Brand products. Sinar Sosro is S-tee for t count> t table, 6.370> 0, 95
3. Partially that distribution has a significant effect on the purchase decision of PT Fighting Brand products. Sinar Sosro is S-tee for t count> t table, 5.280> 0, 095
Simultaneously, products, promotions and distributions have a strong and significant influence on the decision to purchase fighting brand products (S-tee) with the correlation coefficients of each variable described above, t count> t table described through the regression equation. The equation Y = 5.696 + 0.037 X1 + 0.291 X2 + 0.331 X3 illustrates that the independent (product) variables (X1), Promotion (X2), and Distribution (X3), in the regression model can be expressed if one independent variable changes by 1 ( one) and the other is constant, then the change in the dependent variable (dependent) The purchase decision (Y) is equal to the coefficient value (b) of the value of the independent variable. Constant (Y) of 5.696 gives the
understanding that if the Product (X1), Promotion (X2), and Distribution (X3) simultaneously or together does not change or equal zero (0) then the amount of the Purchase Decision (Y) is 5.696 unit. The strong influence gives the meaning of the better the product, promotion and distribution from PT. Sinar Sosro towards S-tee, the higher the level of consumer purchasing decisions on S-tee. Conversely, the lower the value of the product, promotion and distribution, the lower the level of purchasing decisions for S-tee products.
Suggestion
Based on the conclusions of the research results as described above based on the highest score of each variable, the following recommendations are recommended:
1. The results of descriptive analysis show that the product variable gives a good picture as for the lowest score in the Product questionnaire is the uneven availability of shops / retailers who sell S-tee products, preferably PT. Sinar Sosro further expands the distribution of S-tee products to make it easier for consumers to get S-tee products.
2. The results of descriptive analysis show that the promotion variable provides a good picture as for the lowest score results in the Promotion questionnaire is that consumers get less information about S-tee products, so many consumers do not know that S-tee is a product of PT. Sinar Sosro.
3. Descriptive analysis results show that the distribution variable gives a good picture, while the lowest score in the distribution questionnaire is that consumers give a statement that the S-tee product, not evenly distributed in the location, should PT. Sinar Sosro be able to increase the S-tee marketing expansion in more eating locations.
4. The need for further research with similar research designs on products, promotion and distribution in different locations and a larger number of samples and taking other independent variables such as price, environmental conditions, and customer satisfaction to optimize the fighting brand (S-tee) products from PT. Sinar Sosro
References [1] Ghozali, Imam, 2012 Aplikasi Analisis Multivariate Dengan
Program IBM SPSS 20, Semarang, Undip
[2] Kartajaya, H, 2000 Marketing Plus 2000 Siasat Memenangkan Persaingan Global, PT. Gramedia Pustaka Utama, Jakarta
[3] _______, H, dkk, 2005 MarkPlus On Strategy, PT. Gramedia Pustaka Utama Jakarta
[4] Keegan, Warren J, 2003, Manajemen Pemasaran Global, Jakarta PT. Indeks Gramedia
[5] Kotler, Philip, dan Gary Amstrong,2002, Manajemen Pemasaran Edisi Milenium Jakarta PT. Prenhalindo

https://doi.org/10.36406/ijbam.v1i1.xxx
130
[6] _______, Philip, dan Gary Amstrong,2008, Prinsip-prinsip Pemasaran Edisi 12 Jilid 1, Penerbit Erlangga
[7] Kunto, Ari, Suharsimi, 2003, Manajemen Penelitian Edisi Baru Rineka CiptaMachfoedz, 2005 Pengantar Pemasaran Modern, Cetakan Pertama, Penerbit Unit Penerbit & Percetakan Akademi Manajemen Perusahaan YPKN, Yogyakarta
[8] Stanton, William J, 2001, Prinsip-Prinsip Pemasaran Jilid Ketujuh, Jakarta Erlangga
[9] Sugiyono, 2011, Metode Penelitian Kuantitatif, Kualitatif, R & D.Cetakan Ketigabelas Mei 2011 ,Bandung, Penerbit Alfabeta
[10] Tjiptono, Fandy,2008, Strategi Pemasaran Edisi Ketiga,Yogyakarta,Penerbit ANDI