EFFECT OF EAF AND ESR TECHNOLOGIES ON THE YIELD OF ALLOYING ELEMENTS IN TOOL STEELS

Journal of Catalysis 278 (2011) 59–70
Contents lists available at ScienceDirect
Journal of Catalysis
journal homepage: www.elsevier .com/locate / jcat
Influence of particles alloying on the performances of Pt–Ru/CNT catalystsfor selective hydrogenation
Jacques Teddy a, Andrea Falqui b, Anna Corrias c, Daniela Carta c, Pierre Lecante d, Iann Gerber e,Philippe Serp a,⇑a Laboratoire de Chimie de Coordination, UPR CNRS 8241, Composante ENSIACET, Université de Toulouse UPS-INP-LCC, 4 allée Emile Monso, BP 44362, 31432 Toulouse Cedex 4, Franceb Istituto Italiano di Tecnologia, Via Morego 30, 16163 Genova, Italyc Dipartimento di Scienze Chimiche, Universita‘ di Cagliari, Cittadella Universitaria di Monserrato S.S. 554 Bivio per Sestu, 09042 Monserrato, Cagliari, Italyd Centre d’Elaboration des Matériaux et d’Etudes Structurales du, CNRS, 29 rue Jeanne Marvig, BP 4347, 31055 Toulouse Cedex, Francee Université de Toulouse INSA, UPS, LPCNO, IRSAMC, 135 avenue de Rangueil, 31077 Toulouse, France
a r t i c l e i n f o
Article history:Received 6 September 2010Revised 19 November 2010Accepted 20 November 2010Available online 7 January 2011
Keywords:Carbon nanotubesBimetallic catalystsSelective hydrogenationPlatinum–ruthenium
0021-9517/$ - see front matter � 2010 Elsevier Inc. Adoi:10.1016/j.jcat.2010.11.016
⇑ Corresponding author.E-mail address: [email protected] (P. Serp)
a b s t r a c t
The influence of PtRu bimetallic particle size and composition on cinnamaldehyde selective hydrogena-tion has been investigated for the first time using well-defined catalysts based on carbon nanotubes sup-port. Very high selectivity towards cinnamyl alcohol together with high activity have been obtainedprovided a high temperature treatment of the catalyst is performed. HRTEM, WAXS and EXAFS analysespermit us to conclude that the remarkable influence of this high temperature treatment on both activityand selectivity arises from different phenomena. First, a particle size and a structural effect have been evi-dence that permits to increase the selectivity. WAXS and EXAFS point the formation of alloyed PtRu nano-particles. Second, the heat treatment allows the removal of oxygenated groups from CNT surface. Thismay increase the cinnamaldehyde adsorption capacity and decrease the activation barrier for diffusionof substrate and product on the CNT surface, thus contributing to an increase in the activity.
� 2010 Elsevier Inc. All rights reserved.
1. Introduction
If, during most of the 20th century, the main motivation incatalysis was productivity, at the beginning of the 21st centurythe concepts of sustainable growth and Green Chemistry are atthe center of the chemical activity and the research of a high selec-tivity is the driving force for the conception of all new catalyticprocesses. Thus, today a catalyst must associate three characteris-tics: high activity and selectivity as well as stability (separation,recovery, recycling). From now on, the idea of the new-generationcatalysts should include these three aspects. It is now long knownthat specific sites are responsible for different molecular reactionstaking place on the surface of a supported catalyst. By understand-ing the molecular interrelations, one may be in a position tomanipulate the catalyst’s selectivity on an atomic basis. Thus, inorder to enhance the reaction selectivity, the nature of the surfacesites must be carefully defined and controlled. The catalytic prop-erties of those sites are completely determined by the local elec-tronic structure, and it is therefore a goal by itself to be able tounderstand and ‘‘design’’ the local electronic structure of the activesites by changing structure and composition of the catalytic
ll rights reserved.
.
materials [1]. One way of modifying the electronic structure of ametallic active site is by adding a second metal, leading, for exam-ple, to alloy formation. In this context, nanotechnologies constitutean invaluable tool in the hands of a chemist in order to achieve amultidimensional structural control in the preparation of catalyticsystems [2,3]. Whereas some progresses have been accomplished[4–9], in particular in the conception and the modeling of activesites and in the control of the surrounding of these sites, manychallenges, which deal with the control of the active site localiza-tion and environment at the atomic scale, still exist. Additionally,relatively little investigation has been undertaken in the case ofbimetallic catalysts that can present different nanostructures(core–shell, alloy, isolated particles) and for which the control atthe atomic scale is even more challenging.
The selective hydrogenation of a, b-unsaturated aldehydes tounsaturated alcohols, which dates back to 1925 [10], has been ofgrowing interest because unsaturated alcohols are important inter-mediates in the production of fine chemicals and pharmaceuticalprecursors. This chemoselective hydrogenation is a difficult task,since thermodynamics favor the hydrogenation of the C@C overthe C@O bond by ca. 35 kJ/mol and because for kinetic reasons,the reactivity of the C@C bond is higher than that of the C@O bond.Both experimental and theoretical works have been devoted to thistopic and comprehensive reviews of the subject have been pub-lished [11–14]. In principle, these compounds can be selectively

60 J. Teddy et al. / Journal of Catalysis 278 (2011) 59–70
hydrogenated by using homogeneous catalysts [15], and promisingresults have been obtained with colloids [7,8]. However, since suchprocesses required separation steps to recover the target com-pound, heterogeneous catalysts should be advantageous, beingenvironmentally more friendly and easier to separate and re-use.This is a key aspect for many hydrogenations widely employed infine chemistry, and developing intrinsically chimio- and regio-selective hydrogenation catalysts by tuning the particle morphol-ogy and metal-support interaction and by the development ofbimetallic formulations is a challenging research field. Forsupported catalysts, both metal and support influence activityand selectivity of the final catalyst towards the formation of unsat-urated alcohols. Metals have different electronic properties, for in-stance due to their different origin’s, exhibiting various properties.It should be pointed out that the final catalyst properties are also aresult of specific catalyst pretreatment and that the desired cata-lyst can be obtained by fine-tuning the catalyst pretreatment pro-cedures [12]. The selectivity to unsaturated alcohols can in generalbe increased via increasing the number of active sites activatingthe carbonyl group. Furthermore, several metals or some metal al-loys can be used as active components and electronic propertiescan be tuned by adding promoters [11]. The characteristics of thesupport material, such as porosity, pore size distribution andreducibility, are also important parameters in catalyst preparation.Besides conventional oxide and activated carbon supports, moreadvanced support materials, such as carbon nanotubes (CNTs) ornanofibers (CNFs), have been investigated [16–18].
We recently reported high selectivity for the hydrogenation ofcinnamaldehyde (CAL) to cinnamyl alcohol (COL) starting from Pt[19,20] and Ir [20] systems supported on CNTs. We also discoveredthat the use of bimetallic PtRu catalysts deposited on [21] or inside[22] multi-walled carbon nanotubes (MWCNTs) can permit reach-ing even higher selectivity. For PtRu nanoparticles deposited insideCNTs, confinement effects makes it possible to reach high COLselectivity. When the active phase is deposited on the external sur-face of MWCNTs, the key step of catalyst design consists in a hightemperature treatment under an inert atmosphere. Thus, formonometallic Pt systems, a significant increase in the selectivityis noticed after this treatment, both on CNTs and on CNFs [23],from 10–15% to 60–70%, depending on the support. For the bime-tallic PtRu catalysts supported on MWCNTs, the selectivity shiftedfrom 55% to 95% upon thermal activation and this with high con-version levels (80%), placing these catalysts among the best everreported for this reaction.
To study the effect of this high temperature treatment on thecatalytic performances of a bimetallic PtRu catalyst on an inertsupport material, we made use of MWCNTs, pure and nanostruc-tured materials presenting large pore volume and surface area.Herein, we present a comprehensive study of the preparationand catalytic performance of a series of bimetallic catalysts. Char-acterization was performed by XPS, WAXS, IR, HTEM, XANES andEXAFS in order to rationalize the structure–properties relationshipof these nanocatalysts.
Table 1Chemical and textural characterizations of the catalyst systems prepared for hydrogenatio
Catalysts Catalyst residue
Pt (%) Ru (%) Fe (%) Al (ppm) davera
CNT - - 0.15 <100 -PtRu/CNT623 1.84 2.12 0.13 <100 2.7PtRu/CNT973 1.77 2.22 0.46 310 2.9PtRu/CNT1123 2.88 3.14 0.68 640 6.1PtRu/CNT1273 2.48 2.91 0.20 160 12.9PtRu/Al2O3 1.94 2.04 2.7PtRu/SiO2 1.46 1.68 6.2
2. Experimental and modeling methods
2.1. Catalysts preparation and characterization
The carbon nanotubes used were prepared from ethylene bycatalytic chemical vapor deposition on Fe/Al2O3 catalysts [24].They were purified with an H2SO4 treatment and functionalizedwith an HNO3 treatment according to a published procedure[25]. Their textural characteristics are given in Table 1. The c-alu-mina support, activated, neutral, Brockmann I (particles size: 100–120 lm, BET specific surface area = 155 m2/g, d = 3.97 g/cm3 meanpore diameter = 5.8 nm) was purchased from Aldrich. The silicaEP10X, BET specific surface area = 310 m2/g, was provided byCrossfield Limited. The bimetallic PtRu catalysts were preparedfrom [Pt(COD)Me2] (1,5-cyclooctadiene)(dimethyl)platinum(II)[26] and [Ru(COD)(COT)] (1,5-cyclooctadiene)(1,3,5-cyclooctatri-ene)ruthenium(0); the ruthenium precursor was purchased fromNanoMePS� (www.nanomeps.fr). In a 250-mL flask, N2 was bub-bled into 60 mL of hexane for 10 min. Under N2, 2 g of the support-ing material was added and well dispersed by 15 min of sonication.Magnetic stirring was allowed and 0.13 g (0.413 mmol) of [Ru(-COD)(COT)] and 0.071 g (0.213 mmol) of [Pt(COD)Me2] were addedsimultaneously. The mixture was kept at 318 K overnight. Finally,the solid catalytic material (PtRu/CNT623) was obtained by filtra-tion, vacuum drying and reduction in a fixed bed at 623 K under15 sccm (standard cubic centimeters per minute) of hydrogenand 160 sccm of argon. Further heat treatments were performedunder argon on this catalyst at 923, 1123 and 1273 K for 1 h, yield-ing PtRu/CNT973, PtRu/CNT1123 and PtRu/CNT1273, respectively.
The metal loading of supported metal catalysts was determinedby plasma chemical ionization coupled to mass spectroscopy (ICP-MS) after a dissolution step according to sample matrix. The sup-port and catalyst textural characterization was based on the N2
adsorption isotherms, determined at 77 K with a Coulter Omnisorp100 CX apparatus. The surface chemistry of the CNT support wascharacterized by temperature programmed desorption (TPD). TPDexperiments were carried out by heating the samples to 1273 Kin He flow (60 sccm) at a heating rate of 50 K/min. The amountof evolved gases was recorded as a function of temperature usinga quadrupole mass spectrometer (Balzers, model Thermocube).The oxygen content was calculated from the amounts of CO andCO2 released during the TPD experiments. The hydrogen consump-tion of the samples was determined by temperature programmedreduction (TPR) performed on 50 mg of sample, in a flow of3.85% of hydrogen in argon (total flow of 52 sccm). The tempera-ture was increased at the rate of 15 K/min from room temperatureto 1173 K.
2.2. Hydrogenation of cinnamaldehyde
A desired amount of catalyst (typically 100 mg) was introducedin a 100-mL autoclave (Top Industrie), and 20 mL of dioxane wasadded. The autoclave was closed; the stirring was fixed at
n reaction
ge (nm) DM (%) BET (m2/g) Vpores (cm3/g) dpore (nm)
- 214 2.16 5447 224 1.6 2944 246 2.38 39.3321 - - -10 - - -47 147 0.2 621 245 1.7 28

J. Teddy et al. / Journal of Catalysis 278 (2011) 59–70 61
900 rpm and the reactor was purged five consecutive times withH2 at 0.3 MPa. The reactor was heated to 373 K and kept 2 h under2 MPa of H2. Later, it was quickly cooled to 283 K, depressurizedand the stirring cut off. The autoclave was opened, the referredamount of CAL was quickly added, and the reactor was closed.The total liquid volume in the autoclave was 40 mL. The autoclavewas purged again with H2 under 900 rpm and heated to the desiredtemperature. A desired pressure of hydrogen was imposed, and itsevolution was followed by a Log 100 program. After the desiredtime, the autoclave was quickly cooled to room temperature,depressurized, the stirring cut off and the solution recovered. Therecovered solution was injected in a gas chromatography appara-tus with anisole as internal standard. The catalytic activity was cal-culated by means of the turnover frequency (TOF) expressed eitherin moles of cinnamaldehyde transformed per moles of total metalused per second or in moles of cinnamaldehyde transformed permoles of surface metal used per second. The surface dispersion ofthe PtRu particles was calculated using Eq. (1) ponderated fromthe metal loadings and assuming an equal distribution of bothmetals in the particles:
DM ¼ ð6nsMÞ=ðrNdpÞ ð1Þ
where ns is the number of atoms at the surface per unit area(1.12 � 1019/m2 for Pt and 1.63 � 1019/m2 for Ru), M is the molarmass of the metals (195.084 g/mol for Pt and 101.07 g/mol forRu), r is the density of the metals (21.45 � 106 g/m3 for Pt and12.1 � 106 g/m3 for Ru), N is the Avogadro number (6.023 �1023 at/mol) and dp is the average particle size (determined byHRTEM, assuming that particles are spherical). The selectivitytowards cinnamyl alcohol was calculated relative to the mainhydrogenation products, i.e. hydrocinnamyl alcohol and hydro-cinnamaldehyde.
2.3. High resolution transmission electron microscopy
The HRTEM results were obtained using a 200 kV JEOL JEM-2100F microscope, equipped with a field emission gun. The micro-scope can also operate in STEM mode, when the electron beamforms a 1-nm-diameter probe, and this mode was used with scan-ning of the probe to collect EDX spectra. For EDX spectra, the typ-ical probe current was approximately 2 nA, and the typicalcollection time was 30 s. The EDX detector was a Princeton Gam-matech LS30135 Si(Li) detector with ultrathin window, and had auniform response in the range 3–20 keV and a resolution of135 eV at 5.9 keV.
2.4. Wide angle X-ray scattering study of PtRu samples
Data were collected on an X-ray powder diffractometer dedi-cated to the study of less ordered materials, characterized by a rel-atively high energy source (Molybdenum anode, 0.071069 nmwavelength) and low background. A small amount of powderedsample was sealed in Lindemann glass capillaries of 1.5 mm diam-eter (samples PtRu/CNT623, PtRu/CNT973, PtRu/CNT1123 andPtRu/CNT1273); pure carbon nanotubes were also similarly pre-pared and measured under the same conditions to allow for matrixsubtraction. All data sets included 457 points equally spaced in k-space (k = 4 � pi � sin(h)/k); the 2h range was 0–129�; measure-ment time was 150 s per point for all samples.
Classic polarization and absorption corrections were applied.After subtraction of the contribution of pure nanotubes, the datawere normalized and then Fourier transformed in order to obtainthe radial distribution function (RDF, also called pair distributionfunction). The RDF displays a series of peaks pointing to distancesbetween pair of atoms, up to the coherence length. The complete
damping of the function is related, for well-ordered objects, tothe size of the particles. However, because of the limited resolutionof the instrument, the function is terminated for distances between4 and 5 nm. Peaks amplitude depends on many factors: multiplic-ity of the distance, which is itself related to the average number ofatoms, size of the particles, and static disorder in the structure.
A critical step in data reduction was the accurate determinationof the matrix amount (pure CNTs) to be subtracted: very smallchanges in capillary diameter or sample density have a stronginfluence, thus excluding a priori correction. A simple criterionwas used: the cancellation, in reciprocal space, of peaks character-istic of CNTs (e.g. peak at 2h = 10�); an additional criterion was thecancellation, in real space, of the characteristic CAC distance. Non-corrected diffractograms are shown in Supporting information.
2.5. X-ray absorption spectroscopy data collection (EXAFS and XANES)
EXAFS and XANES data were collected in transmission mode atbeamline 11.1 (XAFS) at the ELETTRA synchrotron, Trieste (Italy).Spectra at the Ru K-edge (22117 eV) and Pt LIII-edge (11564 eV)were acquired at room temperature using a Si(3 1 1) monochroma-tor. Data were collected on samples PtRu/CNT623 and PtRu/CNT973 and on Ru and Pt reference samples (RuO2, Ru, Na2Pt(OH)6,Pt). Samples with a suitable and highly uniform optical thicknesswere prepared from powders, apart from the Pt metal referencewhich was in the form of a foil. In the case of RuO2 and Na2PtOH6,the powders were dispersed in ethanol and then filtered onto poly-ethylene supports. The samples and the Ru metal reference wereprepared as pellets by diluting the powder in PVP; pellets weremade inside a glove-bag to reduce contact with air.
2.5.1. EXAFS and XANES data analysisThe EXAFS data were analyzed using the program Viper to sum
the data, identify the beginning of the absorption edge, Eo, fit pre-and post-edge backgrounds, and hence to obtain the normalizedabsorbance v as a function of the modulus of the photoelectronwavevector k3 [27]. The modular package DL_EXCURV [28], basedon the EXCURV98 code, was used in the final stage of data process-ing to model the experimental v(k) in order to extract structuralinformation. This code uses fast curved wave theory [29] and cal-culates ab initio the effective curved wave backscattering ampli-tude of the scatterer, the phase shift due to the absorbing atompotential, the phase shift due to the scatterer, and the inelasticmean free path of the photoelectron [30,31]. The structural param-eters were obtained by nonlinear least squares fitting in k-spacewith a k3 weighting to emphasize the high-energy part of the spec-trum. The fitting was carried out using the k range 2.5–16 Å�1. Fou-rier transform (FT) of EXAFS data corrected for phase-shift showspeaks that correspond to local atom correlations. The positions ofthe peaks (R) correspond to bond distances between the centraland the backscatterer atoms.
The errors in the fit parameters were obtained from the 95%confidence level, as calculated in EXCURV98. The number of fittedparameters was always less than the number of statistically inde-pendent data points, as estimated in the standard way [32]. Thequality of the fit was judged from the normalized sum of residuals:
R-factor ¼X
n
k3n vexptðknÞ � vfitðknÞ��� ��� X
n
,k3
njvexptðknÞj � 100 ð2Þ
Reasonable EXAFS fits of single shells typically have values of R-factor around 20%; however, when the fit is performed on the totalEXAFS spectra, higher values of R-factor can still correspond togood fits especially if the fit is not extended to peaks at high R.
The XANES spectra were processed in the usual way to obtainnormalized absorbance [33]. XANES at the K-edge involves the

62 J. Teddy et al. / Journal of Catalysis 278 (2011) 59–70
excitation of a 1s photoelectron into low-lying empty states at thecentral atom with p-type symmetry. XANES at the LIII-edge repre-sents p3/2 ? d3/2 and d5/2 transitions.
The XANES spectra have been analyzed qualitatively using the‘‘fingerprint’’ method, by comparing spectra from samples withthose from reference compounds.
2.6. Computational details
In the present work, we carried out Density Functional Theory(DFT) calculations using the Vienna ab initio simulation package(VASP) [34]. The code uses the full-potential Projector AugmentedWaves (PAW) framework [35]. Exchange–correlation effects havebeen approximated using the PBE [36] functional and applied inspin-polarized calculations. A kinetic energy cutoff of 400 eV wasfound to be sufficient to achieve a total energy convergence withinseveral meV considering k-point sampling. All atoms were fully re-laxed to forces on individual atoms smaller than 0.02 eV/Å. Consid-ering the smearing issue, during the geometry’s optimization runs,a Gaussian smearing was applied with a width of 0.2 eV, while thetetrahedron method with Blöchl corrections [37] was used foraccurate energy calculations. Diffusion barriers were estimatedby the climbing image nudge elastic band (CI-NEB) method [38],with a force tolerance of 0.02 eV/Å and five intermediate geome-tries for the transition state search.
To model the nanotube’s sidewall with large diameters, we usedone single flat graphene layer (98 C atoms in total) in a slab super-cell calculation with 18.3 Å of vacuum in the c direction. It ensuresno reciprocal interaction between periodic images in this particu-lar direction. Moreover, to study the effect of curvature on adsorp-tion’s energies, we used a (6, 6) tube, modeled by five primitivecells, for a total of 120 C atoms, with a vacuum of around 14 Å be-tween repeated images of the CNT.
Fig. 1. Low-magnification HRTEM images of the PtRu/CNT samples (left scalebar = 10 nm, and right scale bar = 5 nm).
3. Results
3.1. Hydrogenation catalysts
Catalysts of 2–2 wt.% Pt–Ru/support were elaborated from the[Pt(COD)Me2] and [Ru(COD)(COT)] organometallic precursors inhexane at 318 K under Ar, and reduced at 623 K under a 10%H2/Ar mass flow. Before impregnation, the purified CNT supportwas activated by oxidative nitric acid oxidation to create signifi-cant amounts of surface oxygenated groups, acting as nucleationcenters for precursor anchoring [19]. The concentration of surfaceACOOH groups was 0.011 mmol/g, as determined by chemicaltitration. Porous alumina and silica supports were also used forcomparison purposes. The PtRu/CNT623 sample was then heattreated under argon at 973, 1123, or 1273 K, in order to eliminatethe oxygenated surface groups of the support [19], and to inducesintering. Indeed, it is known that large particle size favors thehydrogenation of the C@O bond [11]. The catalysts thus producedwere named PtRu/CNT973, PtRu/CNT1123 and PtRu/CNT1273,respectively. Chemical and textural characterizations of the cata-lysts are presented in Table 1.
The metal loading measured was relatively close to the ex-pected value for CNT and alumina, and slightly lower for the silicasupport, presumably because of the lower amount of oxygenatedgroups (silanol) on this latter support. Indeed, typical values foroxygenated groups range between 10 and 15 –OH/nm2 for alu-mina, 2 and 6 –OH/nm2 for silica [39], and a value of 7.2 O/nm2
has been extracted from TPD data for the activated CNT support.TEM indicates that the particle–size distribution is rather narrowfor PtRu/CNT623 and PtRu/Al2O3, while some large (20–50 nm)particles coexist with small (2–5 nm) ones for PtRu/SiO2. For the
heat-treated samples (Fig. 1), no significant variation in the meanparticle size is noticed up to 973 K, pointing out the high thermalstability of this catalyst. Then, a significant sintering occurs be-tween 973 and 1273 K, with the appearance of a bimodal particlesize distribution (see Supporting information SI1).
3.2. Hydrogenation of cinnamaldehyde over PtRu/CNT
The hydrogenation of cinnamaldehyde may proceed via differ-ent reaction pathways. The 1,2-addition of hydrogen gives theunsaturated alcohol (COL). The 3,4-addition gives the saturatedaldehyde (HCAL). The hydrogenation of the C@O and C@C bondsgives the saturated alcohol (HCOL). This reaction scheme can befurther complicated considering side reactions such as decarbony-lation, isomerization, and hydrogenolysis reactions leading to by-product formation. The use of alcoholic solvents and the presenceof acid/basic sites on the catalyst’s surface favors the formation ofby-products. The present study was performed in dioxane in orderto avoid by-product formation. The catalytic performances of thedifferent systems are presented in Table 2.

Table 2Performances of the catalytic systems for the hydrogenation of cinnamaldehyde.
Catalysts Conversion (%) TOF a (s�1) TOF b (s�1) Selectivity (%)
COL HCOL HCAL
CNT 9 – – 69 19 12PtRu/CNT623 72 0.21 0.099 53 18 29PtRu/CNT973 67 0.21 0.091 78 11 11PtRu/CNT1123 82 0.36 0.075 86 9 4PtRu/CNT1273 78 0.79 0.079 94 3 3PtRu/Al2O3 24 0.07 0.033 52 12 36PtRu/SiO2 24 0.20 0.042 65 4 31
a Expressed in moles of cinnamaldehyde transformed per moles of surface metal used per second.b Expressed in moles of cinnamaldehyde transformed per moles of total metal used per second.
0102030405060708090
100
Particle size (nm)Se
lect
ivity
[CO
L]
Structural effectSize effect
623K
973K
1123K 1273K
00,10,20,30,40,50,60,70,80,9
1
0 2 4 6 8 10 12 14
0 2 4 6 8 10 12 14Particle size (nm)
TOF
(s-1
)
623K973K
1123K
1273K
(a)
(b)
Fig. 2. Effect of the particle size on (a) the selectivity towards COL and (b) theturnover frequency.
J. Teddy et al. / Journal of Catalysis 278 (2011) 59–70 63
First, the selectivity to cinnamyl alcohol was affected by thenature of the support. At a first glance and not taken into accountthe heat-treated samples, we can say that the best selectivity to-wards COL was achieved with the silica supports, SiO2 > A-l2O3 � CNTs. However, as it has been reported that the selectivityto cinnamyl alcohol increases as the particle size increases [40],the higher selectivity achieved with the PtRu/SiO2 catalyst shouldbe attributed to the larger particle size observed for this system(daverage = 6.2 nm) compared to the alumina (daverage = 2.7 nm)and CNT supports (daverage = 2.7 nm). This is attributed to a stericeffect whereby the planar cinnamaldehyde molecule cannot ad-sorb parallel to a flat metal surface because of the steric repulsionof the aromatic ring. Indeed, theoretical calculations showed thataromatic rings that are chemisorbed on a metal surface must lieat a distance exceeding 0.3 nm because there is an energy barrierpreventing a closer approach to the surface [40]. Because of thisenergy barrier, the C@C bond cannot approach the surface as clo-sely as the C@O bond does, the latter being then hydrogenatedpreferentially. This steric effect does not operate on small particles,where both the C@C and the C@O bonds can approach the surface.In addition, SiO2 presents surface groups that act as electron-donorsites modifying the electronic properties of the nanoparticles andincreasing selectivity. Considering now the different catalysts onMWCNTs, the selectivity towards cinnamyl alcohol increased line-arly with the activation temperature to reach 94% for PtRu/CNT1273. This impressive increase in selectivity cannot be the re-sult of the increase in particle size only. Indeed, Fig. 2a, which pre-sents the influence of nanoparticle size on the selectivity for thePt–Ru/CNT catalysts, shows that two effects should coexist: first,a pronounced structural effect that may result from the heat treat-ment and secondly the size effect. If we are now considering the ef-fect of the heat treatment on the catalytic activity of the Pt–Ru/CNTcatalysts, surprisingly we noticed a significant increase in the TOFwith the metal particle size (Fig. 2b).
3.3. Catalyst characterization
3.3.1. High resolution transmission electron microscopy3.3.1.1. Sample PtRu/CNT623. The high resolution transmissionelectron microscopy (HRTEM) analysis of the sample PtRu/CNT623 shows the coexistence of two separate crystalline phases.The first one has a face-centered cubic (fcc) structure typical of Pt,while the second one has a hexagonal close packed (hcp) structurecharacteristic of Ru. In Fig. 3 an HRTEM image of PtRu/CNT623sample is reported. Two distinct particles are here clearly visible,labeled (a) and (b), both oriented to show a structural projection.The insets show the numerical diffractogram of the two particles,obtained on the base of the two-dimensional fast Fourier transform(2D-FFT) calculated over the square zones reported in the HRTEMimage. The particle labeled (a) shows a structural projection thatcan be ascribed to an fcc lattice oriented along its [0 0 1] zone axis.The interplanar distances measured for the two perpendicular sets
of lattice planes are both equal to 1.89 Å. It is likely that these dis-tances were originally those corresponding to two mutually per-pendicular (2 0 0) lattice set of planes for pure platinum thatshould measure 1.96 Å. Therefore, the measured distance indicatesa compressive strain (i.e., a contraction of the original lattice) forthe platinum fcc structure, due to a certain number of Ru atomsdiffusing into the Pt lattice. In particular, the observed cubic latticeappears contracted of �3.7% with respect to that of the pure bulkplatinum. The particle labeled (b) shows a different structure. Itseems not too far from that expected for a hcp lattice orientedalong its [1 0 0] zone axis, with some differences in the interplanardistances with respect to those of the pure hcp Ru.
More specifically, if one compares the measured structure withthat of the pure hcp ruthenium, it is possible to observe that:
(a) all the interplanar distances are larger than those expectedfor pure ruthenium, indicating a tensile strain (i.e., a dilata-tion of the original lattice) of the original pure Ru lattice; and
(b) the tensile strain is not the same for the different crystallineaxis. In fact, the original Ru (002) distance of 2.14 Å slightlyincreases to 2.16 Å. On the contrary, the two other pairs of
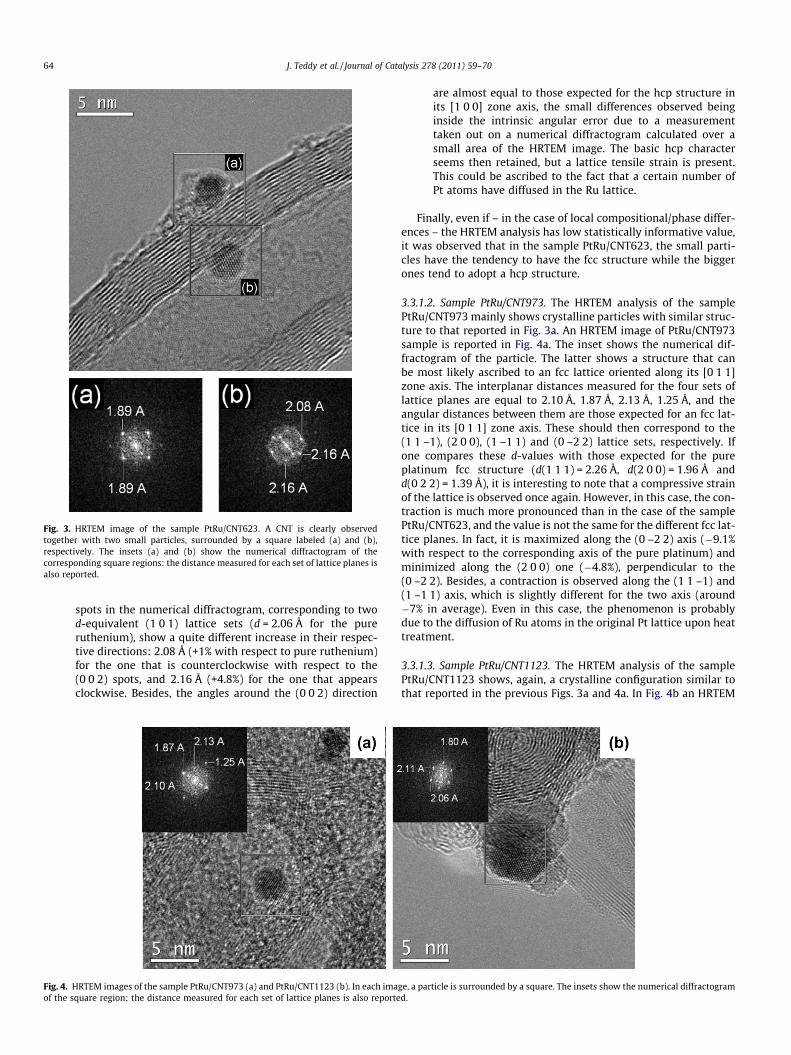
Fig. 3. HRTEM image of the sample PtRu/CNT623. A CNT is clearly observedtogether with two small particles, surrounded by a square labeled (a) and (b),respectively. The insets (a) and (b) show the numerical diffractogram of thecorresponding square regions: the distance measured for each set of lattice planes isalso reported.
64 J. Teddy et al. / Journal of Catalysis 278 (2011) 59–70
spots in the numerical diffractogram, corresponding to twod-equivalent (1 0 1) lattice sets (d = 2.06 Å for the pureruthenium), show a quite different increase in their respec-tive directions: 2.08 Å (+1% with respect to pure ruthenium)for the one that is counterclockwise with respect to the(0 0 2) spots, and 2.16 Å (+4.8%) for the one that appearsclockwise. Besides, the angles around the (0 0 2) direction
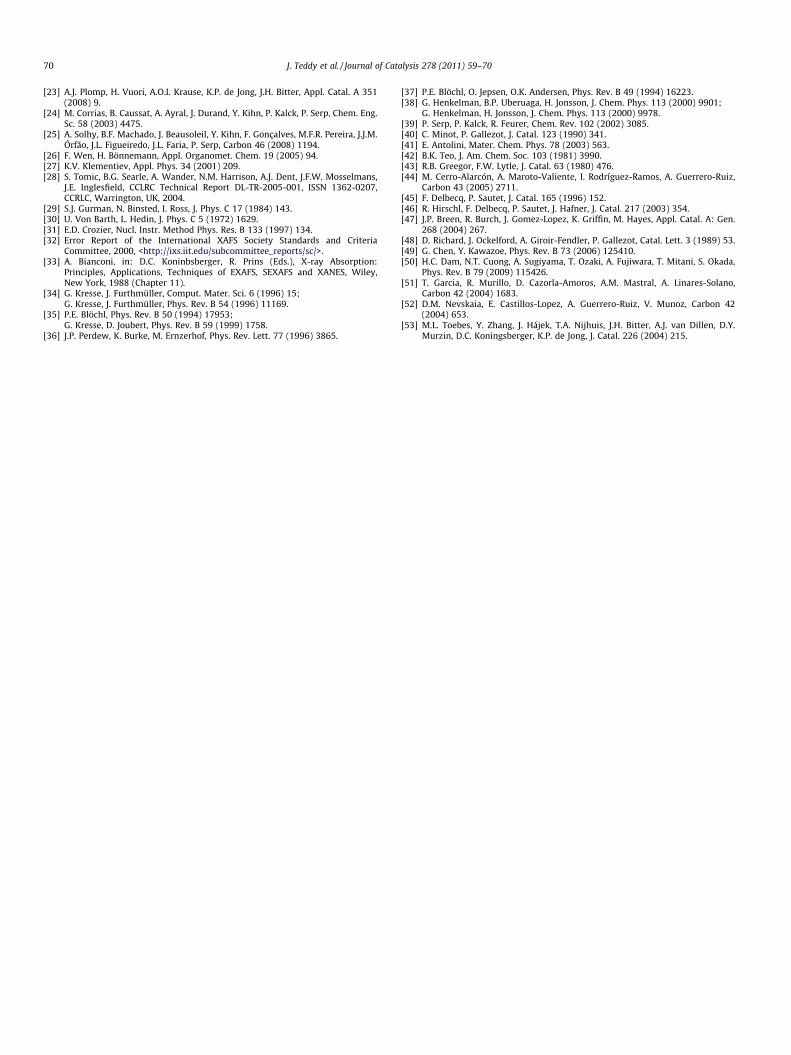
Fig. 4. HRTEM images of the sample PtRu/CNT973 (a) and PtRu/CNT1123 (b). In each imaof the square region; the distance measured for each set of lattice planes is also reporte
are almost equal to those expected for the hcp structure inits [1 0 0] zone axis, the small differences observed beinginside the intrinsic angular error due to a measurementtaken out on a numerical diffractogram calculated over asmall area of the HRTEM image. The basic hcp characterseems then retained, but a lattice tensile strain is present.This could be ascribed to the fact that a certain number ofPt atoms have diffused in the Ru lattice.
Finally, even if – in the case of local compositional/phase differ-ences – the HRTEM analysis has low statistically informative value,it was observed that in the sample PtRu/CNT623, the small parti-cles have the tendency to have the fcc structure while the biggerones tend to adopt a hcp structure.
3.3.1.2. Sample PtRu/CNT973. The HRTEM analysis of the samplePtRu/CNT973 mainly shows crystalline particles with similar struc-ture to that reported in Fig. 3a. An HRTEM image of PtRu/CNT973sample is reported in Fig. 4a. The inset shows the numerical dif-fractogram of the particle. The latter shows a structure that canbe most likely ascribed to an fcc lattice oriented along its [0 1 1]zone axis. The interplanar distances measured for the four sets oflattice planes are equal to 2.10 Å, 1.87 Å, 2.13 Å, 1.25 Å, and theangular distances between them are those expected for an fcc lat-tice in its [0 1 1] zone axis. These should then correspond to the(1 1 –1), (2 0 0), (1 –1 1) and (0 –2 2) lattice sets, respectively. Ifone compares these d-values with those expected for the pureplatinum fcc structure (d(1 1 1) = 2.26 Å, d(2 0 0) = 1.96 Å andd(0 2 2) = 1.39 Å), it is interesting to note that a compressive strainof the lattice is observed once again. However, in this case, the con-traction is much more pronounced than in the case of the samplePtRu/CNT623, and the value is not the same for the different fcc lat-tice planes. In fact, it is maximized along the (0 –2 2) axis (�9.1%with respect to the corresponding axis of the pure platinum) andminimized along the (2 0 0) one (�4.8%), perpendicular to the(0 –2 2). Besides, a contraction is observed along the (1 1 –1) and(1 –1 1) axis, which is slightly different for the two axis (around�7% in average). Even in this case, the phenomenon is probablydue to the diffusion of Ru atoms in the original Pt lattice upon heattreatment.
3.3.1.3. Sample PtRu/CNT1123. The HRTEM analysis of the samplePtRu/CNT1123 shows, again, a crystalline configuration similar tothat reported in the previous Figs. 3a and 4a. In Fig. 4b an HRTEM
ge, a particle is surrounded by a square. The insets show the numerical diffractogramd.

J. Teddy et al. / Journal of Catalysis 278 (2011) 59–70 65
image of PtRu/CNT1123 sample is reported. The inset shows thenumerical diffractogram of the particle. It shows a structure thatmost likely can be, again, ascribed to an fcc lattice oriented alongits [0 1 1] zone axis. The interplanar distances that are measuredfor the three sets of lattice planes are respectively equal to2.11 Å, 1.80 Å, and 2.06 Å, and the angular distances between themare those expected for an fcc lattice in its [0 1 1] zone axis. Theseshould then correspond to the (1 1 –1), (2 0 0), and (1 –1 1) latticesets, respectively.
If one compares these d-values with those expected for the pureplatinum fcc structure, a compressive strain of the lattice is againobserved. However, in this latter case, the contraction furtherevolved with respect to the sample PtRu/CNT973. Here, the com-pressive strain is �8.8% with respect to the corresponding axis ofthe pure platinum along the (2 0 0) axis. Besides, a contraction isobserved even along the (1 1 –1) and (1 –1 1) axis, which is slightlydifferent for the two axes (�8.3% in average). Also, in this case, theobserved changes on the lattice are likely due to the diffusion of Ruatoms in the original Pt lattice.
An EDS quantification was also performed for samples PtRu/CNT623, PtRu/CNT973 and PtRu/CNT1123. The quantification wasdone using the Cliff–Lorimer method. The atomic fraction of eachelement CA and CB can be related to the measured intensities bythe so-called Cliff–Lorimer equation
CA
CB¼ kAB
IA
IB
where A is Pt and B is Ru. IA and IB are the heights of the correspond-ing Gaussians for the peaks used in the fit. The background wasapproximated with an exponential function. The variable kAB isthe calculated Cliff–Lorimer factor (=0.631 at 200 kV). For each sam-ple, a total spectrum was calculated by summing all the single par-ticle spectra (this approximates an average for particles with similarsize). The corresponding data are reported in Supporting informa-tion (SI2). As shown in Table 3, there is a clear trend in the Pt/Ru ra-tio with increasing temperature (Pt decreases).
3.3.2. Wide angle X-ray scatteringThe diffractograms of the four samples PtRu/CNT623–1273 are
shown in Fig. 5a after correction for self-absorption and contribu-tion from nanotubes. Several observations can be made from thisfigure, in particular focusing on the range including the peaks char-acteristic of the fcc and hcp structures:
– before heat treatment (PtRu/CNT623), small and broad peaksindicating small objects; in good agreement with an fcc pattern(18.3�, 21.1� in 2h); for a good agreement, the pattern must,however, be adjusted according to a cell parameter 1.5% smallerthan in pure Pt;
– after heat treatment at 973 K, the pattern also includes hcp fea-tures (19.6�, 25.7� in 2h);
– both fcc and hcp peaks are also observed in PtRu/CNT1123, butpeaks are much sharper, indicating much larger and/or less dis-ordered particles;
– for PtRu/CNT1273, a pattern similar to PtRu/CNT1123 isobtained, with however a reduction – however, with a reduc-tion in sharpness.
Table 3Ru and Pt concentration as a function of temperature obtainedfrom the fits of the EDX spectra.
T (K) Pt at.% Ru at.%
623 62 (±3) 38 (±2)973 44 (±2) 56 (±2)
1123 39 (±1) 61 (±1)
Similar observations can be made in real space (Fig. 5b). RDFamplitudes are similar for PtRu/CNT623 and PtRu/CNT973, indi-cating similar sizes, while a dramatic increase occurs for PtRu/CNT1123, followed by a small reduction for PtRu/CNT1273.Coherence length can be evaluated to be 2.5 nm for PtRu/CNT623, and 3.0 nm for PtRu/CNT973; however, a similar estima-tion cannot be made for PtRu/CNT1123 and PtRu/CNT1123 be-cause of the limited resolution of the instrument: the extinctionof the functions above 4 nm only indicates that their size is atleast equal to 4 nm. These data fit perfectly with the TEM analy-ses (Table 1).
To identify the fcc or hcp characters, it is interesting to focus onthe 0.8–1.0 nm range (Fig. 5b inset), which is very different for thetwo structures: PtRu/CNT623 is nearly purely fcc, whereas bothcharacters appear for the three heat-treated samples.
Because PtRu/CNT623 is very close to the perfect fcc structure(SI4), an accurate comparison with an adjusted fcc model is possi-ble: a good agreement is obtained for a 2.4-nm particle, applying a1.5% shrinking factor to the pure Pt parameter. The resulting aparameter for the cubic cell is 0.3865 nm, which points to a Ru con-tent slightly smaller than 50% [41].
To investigate the effect of oxidation, the glass capillaries wereopened and the four samples were re-measured after short (1 h)and long (approximately 1 month) exposure to air. The main resultis that samples PtRu/CNT973, PtRu/CNT1123 and PtRu/CNT1273displayed nearly no evolution from the diffraction point of view,even after being exposed to air for 1 month. Quite differently, sam-ple PtRu/CNT623 presents clear indications of oxidation just afterone hour and a very strong alteration after one month (SI5). Sinceoxidation affects Ru atoms much more than Pt ones, this result isconsistent with a very different exposition of Ru atoms in PtRu/CNT623 compared to the three other samples where they are likelymuch more protected.
3.3.3. XANES and EXAFS resultsIn Fig. 6, the XANES spectra of PtRu/CNT623 and PtRu/CNT973
samples are compared with those of the reference samples. Thespectra at the Pt LIII-edge indicate that Pt is mostly present as Pt0
in both samples, with just a hint of the presence of Pt in a higheroxidation state in PtRu/CNT623, while the Ru K-edge spectra sug-gest a much higher content of oxidized Ru in both samples. Finally,the Ru is less oxidized in PtRu/CNT973 sample compared to PtRu/CNT623, which is coherent with the WAXS results.
The EXAFS interference functions k3v(k) at the Ru K-edge and PtLIII-edge of samples PtRu/CNT623 and PtRu/CNT973 along with thereference samples are shown in Fig. 7. The corresponding FTs areshown in Fig. 8.
At the Ru K-edge, the EXAFS interference functions k3v(k) ofPtRu/CNT623 and PtRu/CNT973 show significant differences. Inparticular, the k3v(k) of PtRu/CNT623 shows very weak oscillationsat high k, indicating a very disordered and/or poorly symmetricstructure; because of the weak oscillations, the noise is quitenoticeable. The differences between the two samples are also evi-dent in the corresponding FTs; in particular, the peak around 2.5–3 Å, which is due to Ru bonded to either Ru or Pt, is increasing sig-nificantly going from PtRu/CNT623 to PtRu/CNT973. In both sam-ples, evidence of a contribution of Ru bonded to a light element(either O or C) at about 2 Å is also present. No peak beyond 3 Åis evident.
At the Pt LIII-edge the EXAFS interference functions k3v(k) ofPtRu/CNT623 and PtRu/CNT973 are much more similar, showingoscillations with similar amplitudes. The comparison of the FTsof the samples with those of the reference compounds suggestsalso, in this case, the presence of a contribution of Pt bonded to alight element (O or C) together with a contribution from Pt bonded

Fig. 6. XANES Spectra at Ru K-edge and Pt LIII-edge for PtRu/CNT623 and PtRu/CNT973 compared with reference compounds.
Fig. 7. EXAFS interference functions k3v(k) at the Ru K-edge and Pt LIII-edge forPtRu/CNT623 and PtRu/CNT973 samples, and for reference compounds.
20 30 40 50 60 70
I (cp
s)
2theta (°)
PtRu/CNT623
PtRu/CNT973
PtRu/CNT1123
PtRu/CNT1273
0 1 2 3 4 5
RD
F
r (nm)
0.8 0.9 1 1.1 1.2
(a) (b)
Fig. 5. (a) Corrected diffractograms of all four samples, with hcp Ru (dotted line) and fcc Pt (solid line, adjusted for 1.5% shorter cell parameter) references, (b) related RDFs insame order (for easier comparison, amplitudes have been divided by three for PtRu/CNT1123 and two for PtRu/CNT1273); inset: close-up of RDFs, with references in dottedline (top: Ru structure, bottom: Pt structure contracted by 1.5%).
66 J. Teddy et al. / Journal of Catalysis 278 (2011) 59–70
to a heavy element (Ru or Pt). In PtRu/CNT973, a peak beyond 3 Å isalso evident.
The qualitative analysis of the EXAFS interference functions andcorresponding FTs indicates that fitting requires at least one shellinvolving a light element and one involving a heavy element.Due to the stronger backscattering of heavy elements, it is moredifficult to distinguish between O or C neighbors than to distin-guish between Ru or Pt neighbors. Even if some contributions fromRu–C interactions cannot be ruled out, the fitting of the two
samples at the Ru K-edge was performed considering only O inthe first shell, since it is well known that Ru is easily oxidized.Moreover, XANES data indicate that Ru is partly oxidized in bothsamples and that PtRu/CNT623 sample is more oxidized thanPtRu/CNT973. At the Pt LIII-edge, the presence of Pt–O interactionsis more questionable and in fact XANES data indicate very littleoxidation in both samples, with PtRu/CNT623 sample slightly more

Fig. 8. FTs at the Ru K-edge and Pt LIII-edge for PtRu/CNT623 and PtRu/CNT973samples, and for reference compounds.
J. Teddy et al. / Journal of Catalysis 278 (2011) 59–70 67
oxidized than PtRu/CNT973. In this case, the fitting of the first shellwas done considering either Pt–O interactions or Pt–C interactions,obtaining quite similar results. For the sake of simplicity, only theresults obtained considering Pt–O interactions will be presented.
The ab initio phase shifts and amplitudes calculated in DL_EX-CURV were first used to fit the data of the reference samples. Goodfits (shown in Figs. 7 and 8, best-fit parameters reported in Tables 4and 5 for the Ru K-edge and Pt LIII-edge respectively) were ob-tained considering only single scattering contributions for Ru,RuO2 and Na2PtOH6 reference samples, while multiple scatteringcontributions were also taken into account for Pt foil, since somemultiple scattering path are expected to be strong due to a for-ward-scattering (also called the focusing or shadowing effect) con-sisting of collinear arrangements of neighboring atoms [42].Coordination numbers were kept fixed to the values of the knowncrystal structures, while distances and Debye–Waller factors werefitted, together with EF which is a correction to the beginning ofthe absorption edge, Eo.
In the fitting of the samples, coordination numbers were alsofree to vary, in addition to distances, Debye–Waller factors andEF. Best fits for PtRu/CNT623 at the Ru K-edge (shown in Figs. 7and 8, best-fit parameters reported in Table 4) were performedwith one Ru–O shell and one Ru–Ru shell. The fit did not improvewith the addition of another Ru–Pt shell. The R-factor is high, dueto very noisy data.
Table 4Interatomic distances (R), coordination numbers (N) and Debye–Waller factors (r) obtaine
Ru K-edge
Ru Foil RuO2 PtRu
R (Å) N 2r 2 R (Å) N 2r 2
Ru–Ru 2.67(1) 12 0.011(1) Ru–O 1.97(1) 6 0.015(1) Ru–Ru–Ru 3.78(1) 6 0.011(1) Ru–Ru 3.07(1) 2 0.011(3) Ru–Ru–Ru 4.27(1) 2 0.014(2) Ru–O 3.42(3) 4 0.018(2)Ru–Ru 4.67(1) 18 0.014(1) Ru–Ru 3.54(1) 8 0.014(1)Ru–Ru 5.33(1) 12 0.015(1) Ru–O 3.85(1) 12 0.020(5)
R-factor = 33 R-factor = 35 R-fa
A good fit was obtained for the same sample at the Pt LIII-edgewith a first shell of either Pt–O (fit shown in Figs. 7 and 8, best-fitparameters reported in Table 5) or Pt–C, as already discussed, and asecond shell involving both Pt–Ru and Pt–Pt interactions. Shellsinvolving both heavy atoms had to be introduced in order to geta good fit, suggesting the formation of an alloy.
The best fit of PtRu/CNT973 at the Ru K-edge (shown in Figs. 7and 8, best-fit parameters reported in Table 4) was obtained withone Ru–O shell and an additional shell with both Ru–Ru and Ru–Pt, to take into account the second peak in the FT. In this case,the presence of additional Ru–Pt interactions improved the fit sig-nificantly enough to justify the use of additional free parameters.
The best fit of PtRu/CNT973 at the Pt LIII-edge, similarly to PtRu/CNT623, was obtained with a first shell of either Pt–O (fit shown inFigs. 7 and 8, best-fit parameters reported in Table 5) or Pt–C, a sec-ond shell involving both Pt–Ru and Pt–Pt interactions and an addi-tional shell involving only Pt–Ru. Since there is a clear evidence ofthe formation of an alloy, also this latter shell should include bothRu–Ru and Ru–Pt interactions. However, only one contribution wasconsidered in order to limit the number of free parameters.
The results of the fitting clearly indicate that the structural evo-lution of the Ru environment with the temperature of the thermaltreatment is slower than that of the Pt environment, since the Ruenvironment of PtRu/CNT623 is significantly different from thatof PtRu/CNT973 while the Pt environment is quite similar inPtRu/CNT623 and PtRu/CNT973. The results also indicate that thealloying process is progressing with the temperature of the ther-mal treatment.
The coordination number for Ru–Ru(Pt) and Pt–Pt(Ru) in thesamples are significantly smaller than the value of 12 found inthe pure metals. The reduction in coordination number is due totwo concomitant effects; the fact that some Ru, and in a much min-or extent some Pt, is bonded to O (or C) and to the dimension of thenanoparticles. A reduction of coordination numbers is expected fornanocrystals smaller than 5 nm [43], and the reduction becomesprogressively more significant for outer shells as the crystallite sizedecreases. The effect of the reduced nanocrystal size is also detect-able from the absence of shells beyond 3 Å in PtRu/CNT623 and 4 Åin PtRu/CNT973.
4. Discussion
The bimetallic PtRu catalysts have been prepared from twoorganometallic precursors, [Pt(COD)Me2] and [Ru(COD)(COT)],the reductive decomposition of which leads to pure metal at mod-erate temperatures [22]. We noticed that although it is possible todeposit the ruthenium precursor at 318 K on CNTs, no surface reac-tion occurs at this temperature when starting from [Pt(COD)Me2].Therefore, the deposition of [Ru(COD)(COT)] on surface oxidizedCNTs occurs at lower temperature than that of [Pt(COD)Me2]. Theeffective co-deposition of platinum and ruthenium at 318 K thusinvolves that ruthenium deposits first and that the grafted
d from fitting data of samples and of reference compounds at the Ru K-edge.
/CNT623 PtRu/CNT973
R (Å) N 2r 2 R (Å) N 2 r 2
O 2.00(1) 4.3(3) 0.033(3) Ru–O 1.97(2) 2.5(2) 0.025(3)Ru 2.65(1) 3.0(7) 0.036(5) Ru–Ru 2.65(1) 3.5(3) 0.017(1)
Ru–Pt 2.67(1) 1.5(6) 0.018(4)
ctor = 45 R-factor = 29

Table 5Interatomic distances (R), coordination numbers (N) and Debye–Waller factors (r) obtained from fitting data of samples and of reference compounds at the Pt LIII-edge.
Pt LIII-edge
Pt foil Na2PtOH6 PtRu/CNT623 PtRu/CNT973
R (Å) N 2 r 2 R (Å) N 2 r 2 R (Å) N 2 r 2 R (Å) N 2 r 2
Pt–Pt 2.77(1) 12 0.016(1) Pt–O 2.01(1) 6 0.005(1) Pt–O 2.00(1) 1.4(1) 0.015(2) Pt–O 2.00(1) 1.2(1) 0.024(4)Pt–Pt 3.91(1) 6 0.016(1) Pt–Ru 2.69(1) 1.2(3) 0.018(2) Pt–Ru 2.69(1) 1.8(2) 0.016(1)Pt–Pt 4.81(1) 24 0.018(1) Pt–Pt 2.74(1) 4.3(3) 0.018(1) Pt–Pt 2.70(1) 4.3(3) 0.019(1)Pt–Pt 5.56(1) 12 0.019(1) Pt–Ru 4.33(1) 2.1(2) 0.019(3)
R-factor = 33 R-factor = 33 R-factor = 32 R-factor = 29
68 J. Teddy et al. / Journal of Catalysis 278 (2011) 59–70
ruthenium species assist platinum deposition. This may result in alayered deposition, followed by the reductive decomposition at623 K. Temperature programmed reduction profiles of PtRu/CNT623 (SI 6) show a sharp H2 consumption peak at 369 K attrib-uted to ruthenium reduction, and a broad consumption region cen-tered at 793 K that could be attributed to the gasification of surfacecarbon atoms of the support located at the vicinity of the PtRu par-ticles [44]. Considering the fact that, contrary to samples PtRu/CNT973–1273, the sample PtRu/CNT623 presents a clear tendencytowards the oxidation of Ru atoms (TPR, WAXS, XANES and EXAFSdata), the ruthenium atoms should present a very differentarrangement in this latter catalyst. The presence of surface oxygen-ated groups on the CNT surface may also contribute to rutheniumoxidation.
As mentioned in the previous section, the higher selectivity to-wards COL obtained with the PtRu/CNT973–1273 may result onthe one hand from the larger particle size and on the other handfrom a structural effect. The Ru enrichment of the nanoparticleshould enhance the selectivity of the catalyst, and this promotingrole of Ru can be explained via two mechanisms. (i) the Ru canact as an electropositive metal that increases the electron densityon the Pt, thus decreasing the binding energies, particularly thatof the C@C bond (inhibiting the adsorption via the C@C), and favorsthe hydrogenation of the C@O with respect to the C@C bond. Thiseffect has been studied in detail by Delbecq and Sautet [45,46] bytheoretical calculations. (ii) The electropositive Ru atoms, on thesurface of Pt, act as electrophilic or Lewis acid sites for the adsorp-tion and activation of the C@O bond via the lone electron pair ofthe oxygen atoms. This second mechanism, referred to as the ‘‘elec-trophilic C@O activation’’, was the most frequently invoked to ac-count for the promoting effect of electropositive species [47,48].Thus, since it is the presence of Ru surface atoms that should per-mit to increase the selectivity towards COL, a significant part of theruthenium in sample PtRu/CNT623 could be present as an easilyoxidized raft-like structure, not in association with Pt (strongRu–O contribution in EXAFS), resulting from the high reactivityof the [Ru(COD)(COT)] precursor.
To support this hypothesis, the mobility of Pt and Ru adatomson the CNT surface has been studied by means of DFT calculationsin order to understand its impact on the nucleation of the nanopar-ticles. To obtain diffusion barriers associated with the hopping pro-cess of metallic atoms on the graphenic surface, it is mandatory todetermine the lowest energy states, i.e. the most stable configura-tions (geometries) of the adsorbed species. With complete geome-try relaxation of the planar graphenic model, it appears that in thecase of Pt adatom, the most stable configuration is a bridging posi-tion above a CAC bond. This adsorption site is more stable by0.2 eV (4.6 kcal/mol) over the hollow (in the middle of a hexagon)and on-top positions. Calculations performed on the small-diame-ter tube show that curvature’s effect, on the one hand, tends toreduce energy differences between the different adsorption sites(on-top and bridge sites have almost the same energy) and, onthe other hand, enhances globally the adsorption energy (by
0.4 eV), which results from a stronger binding. These results arein good agreement with previous studies [49,50]. The same generaltrends are obtained for Ru adatoms, with only one main difference:the hollow site is now more favored. The identification of the moststable sites done, we can estimate the diffusion barriers on the pla-nar model more representative of the experimental conditions. Inthe case of Pt adatom, with a minimum energy path from onebridge to the nearest bridge position, the diffusion barrier is about0.16 eV (3.7 kcal/mol). For the Ru adsorbed, the path is evidentlyfrom one hollow to the nearest hollow site, the diffusion barrieris now 0.65 eV. From those two estimates, it is clear that the hop-ping process controlling the diffusion of Pt or Ru adatoms is mucheasier in the case of Pt than Ru. In other words, Pt adatoms aremore mobile than Ru ones.
Thus, we propose that the reductive decomposition of thegrafted species at 623 K results in the formation of particles an-chored on the support via a raft-like ruthenium rich base. At thispoint, well dispersed nanoparticles are produced on CNT support.A mean particle size of 2.7 nm has been measured from HRTEM,and a close one of 2.5 nm from WAXS. TEM and WAXS analysesshow that these particles are small, strongly fcc, with a parameterpointing to the existence of a PtRu alloy. The strain of the lattice ismeasured isotropic and of around 4% from HRTEM diffractogramswith respect to the pure Pt lattice, and of 1.5% from WAXS data.These crystalline particles contain between 40% (EDX spectra onsingle particles) and less than 50% (WAXS data) atomic fractionof Ru. Considering the theoretical atomic fraction of ruthenium(close to 66%) and the small contribution of the hcp character(WAXS), this is consistent with the existence at 623 K of a poorlyordered, easily oxidized ruthenium phase, as confirmed by EXAFSwhere the interference function at the Ru K-edge is characteristicof a very disordered structure with a significant contribution ofthe Ru–O bond in the first shell. Fig. 9 shows a representation ofthe sample PtRu/CNT623, which contains particles anchored onthe support via a raft-like ruthenium rich base onto which alloyedplatinum-rich particles are formed. These nanoparticles thatshould contain some PtRu alloy surface show higher selectivity to-wards the formation of COL (53%) than their monometallic coun-terparts (30–35%) [21].
The heat treatment under an inert atmosphere at 973 K of thesample PtRu/CNT623 does not affect significantly the mean parti-cle size (2.9 nm from HRTEM and 3 nm from WAXS), pointing tothe high stability of this catalyst, presumably due to the poormobility of Ru on the CNT surface. Thus, the significant increasein selectivity towards COL should be correlated to a modificationof the structure of the nanoparticles. From HRTEM, most of the par-ticles of sample PtRu/CNT973 show an fcc structure with a non-iso-tropic compressive strain, around �9% along the (0 2 2) directionand �5% along the (2 0 0) one. These crystalline particles containa higher amount of Ru atoms as determined from the fits of theEDX spectra (56% Ru at.%). From WAXS data, both fcc and hcpcharacters are observed. EXAFS and XANES clearly show that theheat treatment at 973 K induces the formation of an alloy with a

Pt-Ru (Pt rich) Pt-Ru (Ru rich)Ru disordered
Ru oxydable Ru not oxydable
623K
fcc2.5 nm
973K
hcp dominant6.1 nm
1) [Ru(COD)(COT)]
2) [Pt(COD)Me2]
62%Pt / 38 %Ru 44%Pt / 56%Ru
318K
O O O O O
1123K
39%Pt / 61%Ru
3 nm
CO2Ru
migration
Pt-Ru (Pt rich) Pt-Ru (Ru rich)Ru disordered Pt-Ru (Pt rich) Pt-Ru (Ru rich)Ru disordered Pt-Ru (Pt rich)Pt-Ru (Pt rich) Pt-Ru (Ru rich)Pt-Ru (Ru rich)Ru disorderedRu disordered
Ru oxydable Ru not oxydable
623K
fcc2.5 nm
973K
hcp dominant6.1 nm
1) [Ru(COD)(COT)]
2) [Pt(COD)Me2]
62%Pt / 38 %Ru 44%Pt / 56%Ru
318K
O O O O O
1123K
39%Pt / 61%Ru
3 nm
CO2Ru
migration
Ru oxydable Ru not oxydable
623K
fcc2.5 nm
973K
hcp dominant6.1 nm
1) [Ru(COD)(COT)]
2) [Pt(COD)Me2]
1) [Ru(COD)(COT)]
2) [Pt(COD)Me2]
62%Pt / 38 %Ru 44%Pt / 56%Ru
318K
O O O O OO O O O O
1123K
39%Pt / 61%Ru
3 nm
CO2CO2Ru
migration
Fig. 9. Schematic representation of the evolution of the PtRu/CNT catalyst.
J. Teddy et al. / Journal of Catalysis 278 (2011) 59–70 69
significant increase in Pt–Ru interactions. The results also indicatethat the structural evolution of the Ru environment with thetemperature of the thermal treatment is slower than that of thePt environment, since the Ru environment of PtRu/CNT623 issignificantly different from that of PtRu/CNT973 while the Pt envi-ronment is quite similar in PtRu/CNT623 and PtRu/CNT973. Thus,the higher number of Pt–Ru contacts on the alloy overlayer ofthe PtRu/CNT973 sample should be at the origin of the higherselectivity towards COL displayed by this catalyst. This structuralmodification does not alter the activity of the catalyst.
HRTEM and WAXS show that a further increase in the activationtemperature at 1123 and 1273 K amplifies the phenomenon ofstructural ordering of the nanoparticles. Thus, from HRTEM sam-ple, PtRu/CNT1123 shows a situation further evolved with respectto PtRu/CNT973: an fcc lattice with non-isotropic compressivestrain of around �9% along the (2 0 0) lattice and of �8% in averageon the two (1 1 1) axis. The final consideration being that the par-ticles mainly tend to retain the original fcc structure of the plati-num, with a compressive strain that increases with the treatmenttemperature, i.e. with the amount of Ru atoms in the lattice. Con-sidering now the nanoparticle size, a clear increase in their meandiameter is noticed in this temperature range. This sintering canbe correlated to the loss of the oxygen surface groups acting asanchoring sites for the nanoparticles, in this temperature rangeas shown from TPD profiles (SI 7) performed on PtRu/CNT623. Inparticular at 1273 K, the surface is almost free of oxygenatedgroups. The metal loading increases also as a function of the tem-perature of activation, indicating a loss of carbon during the heattreatment. Thus, for catalysts PtRu/CNT1123 and PtRu/CNT1273,both the ordering of the nanoparticles with an enrichment of thealloy in ruthenium and the increase of the nanoparticle size willcontribute to the increase in the selectivity. Interestingly, whereasthe mean particle size is significantly higher for these two lattercatalysts than for the former ones, their catalytic activity is signif-icantly higher. We believe that the greater conversion rates ob-tained after thermal treatment may be due to an effect of CNTsurface chemistry on CAL adsorption or COL desorption that im-pacts the catalytic activity. The role of carbon material surfacechemistry on the adsorption of different aromatic compoundshas been discussed previously [51,52], and we propose that onheat-treated CNT samples, a p–p interaction between the CAL pelectron ring and the basic p sites of the CNT surface may increasethe CAL adsorption capacity, the CNT surface thus acting as reser-voir of substrate where a high local concentration of CAL is readilyaccessible for the catalyst. Noteworthy and in the case of Pt on car-bon nanofibers catalysts, it has been already suggested that hydro-genation is assisted by the adsorption of cinnamaldehyde on the
carbon support after removal of the oxygen-containing surfacegroups [53]. Additionally, the removal of oxygenated groups mightdecrease the activation barrier for diffusion of CAL or COL on theCNT surface due to the absence of hydrogen bonds between thesupport and the substrate.
Acknowledgements
Dr. Fernando Pereira (Porto, Portugal) and Prof. Alain Kienne-mann (Strasbourg, France) are greatly acknowledged for the TPDand TPR measurements, respectively. I. Gerber thanks the CALculen MIdi-Pyrénées (CALMIP-p0812 project) for generous allocationsof computer time. Part of this work was also performed using HPCresources from GENCI-[CINES] (Grant 2010-6005).
Appendix A. Supplementary material
Supplementary data associated with this article can be found, inthe online version, at doi:10.1016/j.jcat.2010.11.016.
References
[1] T. Bligaard, Angew. Chem. Int. Ed. 48 (2009) 9782.[2] R. Schlögl, S.B. Abd Hamid, Angew. Chem. Int. Ed. 43 (2004) 1628.[3] A. Zecchina, E. Groppo, S. Bordiga, Chem. Eur. J. 13 (2007) 2440.[4] J. Meurig Thomas, B.F.G. Johnson, R. Raja, G. Sankar, P.A. Midgley, Acc. Chem.
Res. 36 (2003) 20.[5] X. Pan, Z. Fan, W. Chen, Y. Ding, H. Luo, X. Bao, Nat. Mater. 6 (2007) 507.[6] M.A. Mahmoud, C.E. Tabor, M.A. El-Sayed, Y. Ding, Z.L. Wang, J. Am. Chem. Soc.
130 (2008) 4590.[7] S.C. Tsang, N. Cailuo, W. Oduro, A.T.S. Kong, L. Clifton, K.M. Kerry Yu, B.
Thiebaud, J. Cookson, P. Bishop, ACS Nano 2 (2008) 2547.[8] Y. Zhu, H. Qian, B.A. Drake, R. Jin, Angew. Chem. Int. Ed. 49 (2010) 1295.[9] H. Falsig, B. Hvolbœk, I.S. Kristensen, T. Jiang, T. Bligaard, C.H. Christensen, J.K.
Nørskov, Angew. Chem. Int. Ed. 47 (2008) 4835.[10] W.F. Tuley, R.J. Adams, J. Am. Chem. Soc. 45 (1925) 3061.[11] P. Gallezot, D. Richard, Catal. Rev. Sci. Eng. 40 (1998) 81.[12] P. Maki-Arvela, J. Hajek, T. Salmi, D.Y. Murzin, Appl. Catal. A 292 (2005) 1.[13] V. Ponec, Appl. Catal. A 149 (1997) 27.[14] P. Claus, Top. Catal. 5 (1998) 51.[15] J.M. Grosselin, C. Mercier, G.F. Allmang, Grass Organometall. 10 (1991) 2126.[16] P. Serp, in: P. Serp, J.L. Figueiredo (Eds.), Carbon Materials for Catalysis, J.
Wiley & Sons, Hoboken, NJ, 2009, p. 309.[17] A. Jung, A. Jess, T. Schubert, W. Schütz, Appl. Catal. A 362 (2009) 95.[18] Z. Guo, Y. Chen, L. Li, X. Wang, G.L. Haller, Y. Yang, J. Catal. (2010), doi:10.1016/
j.jcat.2010.09.021.[19] A. Solhy, B.F. Machado, J. Beausoleil, Y. Kihn, F. Gonçalves, M.F.R. Pereira, J.M.
Órfão, J.L. Figueiredo, J.L. Faria, P. Serp, Carbon 46 (2008) 1194.[20] B.F. Machado, H.T. Gomes, P. Serp, P. Kalck, J.L. Faria, Chem. Cat. Chem. 2 (2010)
190.[21] H. Vu, F. Gonçalves, R. Philippe, E. Lamouroux, M. Corrias, Y. Kihn, D. Plee, P.
Kalck, P. Serp, J. Catal. 240 (2006) 18.[22] E. Castillejos, P.J. Debouttière, L. Roiban, A. Solhy, V. Martinez, Y. Kihn, O. Ersen,
K. Philippot, B. Chaudret, P. Serp, Angew. Chem. 48 (2009) 2529.
70 J. Teddy et al. / Journal of Catalysis 278 (2011) 59–70
[23] A.J. Plomp, H. Vuori, A.O.I. Krause, K.P. de Jong, J.H. Bitter, Appl. Catal. A 351(2008) 9.
[24] M. Corrias, B. Caussat, A. Ayral, J. Durand, Y. Kihn, P. Kalck, P. Serp, Chem. Eng.Sc. 58 (2003) 4475.
[25] A. Solhy, B.F. Machado, J. Beausoleil, Y. Kihn, F. Gonçalves, M.F.R. Pereira, J.J.M.Órfão, J.L. Figueiredo, J.L. Faria, P. Serp, Carbon 46 (2008) 1194.
[26] F. Wen, H. Bönnemann, Appl. Organomet. Chem. 19 (2005) 94.[27] K.V. Klementiev, Appl. Phys. 34 (2001) 209.[28] S. Tomic, B.G. Searle, A. Wander, N.M. Harrison, A.J. Dent, J.F.W. Mosselmans,
J.E. Inglesfield, CCLRC Technical Report DL-TR-2005-001, ISSN 1362-0207,CCRLC, Warrington, UK, 2004.
[29] S.J. Gurman, N. Binsted, I. Ross, J. Phys. C 17 (1984) 143.[30] U. Von Barth, L. Hedin, J. Phys. C 5 (1972) 1629.[31] E.D. Crozier, Nucl. Instr. Method Phys. Res. B 133 (1997) 134.[32] Error Report of the International XAFS Society Standards and Criteria
Committee, 2000, <http://ixs.iit.edu/subcommittee_reports/sc/>.[33] A. Bianconi, in: D.C. Koninbsberger, R. Prins (Eds.), X-ray Absorption:
Principles, Applications, Techniques of EXAFS, SEXAFS and XANES, Wiley,New York, 1988 (Chapter 11).
[34] G. Kresse, J. Furthmüller, Comput. Mater. Sci. 6 (1996) 15;G. Kresse, J. Furthmüller, Phys. Rev. B 54 (1996) 11169.
[35] P.E. Blöchl, Phys. Rev. B 50 (1994) 17953;G. Kresse, D. Joubert, Phys. Rev. B 59 (1999) 1758.
[36] J.P. Perdew, K. Burke, M. Ernzerhof, Phys. Rev. Lett. 77 (1996) 3865.
[37] P.E. Blöchl, O. Jepsen, O.K. Andersen, Phys. Rev. B 49 (1994) 16223.[38] G. Henkelman, B.P. Uberuaga, H. Jonsson, J. Chem. Phys. 113 (2000) 9901;
G. Henkelman, H. Jonsson, J. Chem. Phys. 113 (2000) 9978.[39] P. Serp, P. Kalck, R. Feurer, Chem. Rev. 102 (2002) 3085.[40] C. Minot, P. Gallezot, J. Catal. 123 (1990) 341.[41] E. Antolini, Mater. Chem. Phys. 78 (2003) 563.[42] B.K. Teo, J. Am. Chem. Soc. 103 (1981) 3990.[43] R.B. Greegor, F.W. Lytle, J. Catal. 63 (1980) 476.[44] M. Cerro-Alarcón, A. Maroto-Valiente, I. Rodríguez-Ramos, A. Guerrero-Ruiz,
Carbon 43 (2005) 2711.[45] F. Delbecq, P. Sautet, J. Catal. 165 (1996) 152.[46] R. Hirschl, F. Delbecq, P. Sautet, J. Hafner, J. Catal. 217 (2003) 354.[47] J.P. Breen, R. Burch, J. Gomez-Lopez, K. Griffin, M. Hayes, Appl. Catal. A: Gen.
268 (2004) 267.[48] D. Richard, J. Ockelford, A. Giroir-Fendler, P. Gallezot, Catal. Lett. 3 (1989) 53.[49] G. Chen, Y. Kawazoe, Phys. Rev. B 73 (2006) 125410.[50] H.C. Dam, N.T. Cuong, A. Sugiyama, T. Ozaki, A. Fujiwara, T. Mitani, S. Okada,
Phys. Rev. B 79 (2009) 115426.[51] T. Garcia, R. Murillo, D. Cazorla-Amoros, A.M. Mastral, A. Linares-Solano,
Carbon 42 (2004) 1683.[52] D.M. Nevskaia, E. Castillos-Lopez, A. Guerrero-Ruiz, V. Munoz, Carbon 42
(2004) 653.[53] M.L. Toebes, Y. Zhang, J. Hájek, T.A. Nijhuis, J.H. Bitter, A.J. van Dillen, D.Y.
Murzin, D.C. Koningsberger, K.P. de Jong, J. Catal. 226 (2004) 215.
Copyright © 2022 FDOKUMEN