influence of mixture composition on washout resistance, fresh ...
15
244 Journal of Engineering Sciences Assiut University Faculty of Engineering Vol. 44 No. 3 May 2016 PP. 244 – 258 * Corresponding author. Email address: [email protected] INFLUENCE OF MIXTURE COMPOSITION ON WASHOUT RESISTANCE, FRESH PROPERTIES AND RELATIVE STRENGTH OF SELF COMPACTING UNDERWATER CONCRETE Abd Elrahman Megahed 1 , Ihab Adam 2 , Omar Farghal 3 , Mohamed Omar Sayed 4, * 1, 3 Civil Eng. Dept., Assuit University 2, 4 Construction Research Institute, National Water Research Center, Egypt Received 13 March 2016; Accepted 14 May 2016 ABSTRACT Successful design of underwater concrete mixtures must fulfill two basic requirements: adequate flow ability to spread into the placing forms without consolidation, and viscosity in order to resist the washing out. In this paper an investigation was carried out to determine the effect of the dosage of anti washout admixture (AWA), water cementitious materials ratio (w/cm),sand to total aggregate ratio(s/a), and the supplementary cementitious materials on the washout resistance, fresh properties and the relative compressive strength of self-compacting underwater concrete (SCUWC). Therefore five groups were prepared for this study. First group studied the effect of the supplementary cementitious materials, second group dealt with the effect of the AWA ratios, third group is concerning with the effect of w/cm ratio, fourth group take into account the effect of s/a ratio and finally fifth group included the effect of cementitious materials. Test results indicate that the concentrations of antiwashout admixture (AWA) have direct effect on washout resistance and relative compressive strength. The washout mass loss can be reduced by using 10% silica fume replacement. Also it can be reduced by decreasing the w/cm and increasing the cement content and that result in greater relative strength. Keywords: Underwater concrete; Self compacting concrete; Antiwashout admixture (AWA); Washout resistance; Silica fume 1. Introduction Until recently, underwater concrete was defined as tremie concrete only, but now, due to recent researches in the field of using admixtures, new procedures have been developed, so freshly mixed concrete can now be placed by dropping it through water without the use of a tremie [1]. Research has improved techniques for placing concrete under water without the use of a pump, tremie, or any conventional methods, and innovative antiwashout chemical admixtures (AWA) have been developed that permit freshly mixed concrete to be placed through water without segregation or separation.
-
Upload
khangminh22 -
Category
Documents
-
view
4 -
download
0
Transcript of influence of mixture composition on washout resistance, fresh ...
244
Journal of Engineering Sciences
Assiut University
Faculty of Engineering
Vol. 44
No. 3
May 2016
PP. 244 – 258
* Corresponding author.
Email address: [email protected]
INFLUENCE OF MIXTURE COMPOSITION ON WASHOUT
RESISTANCE, FRESH PROPERTIES AND RELATIVE STRENGTH
OF SELF COMPACTING UNDERWATER CONCRETE
Abd Elrahman Megahed 1, Ihab Adam 2, Omar Farghal
3, Mohamed Omar Sayed
4, *
1, 3 Civil Eng. Dept., Assuit University
2, 4 Construction Research Institute, National Water Research Center, Egypt
Received 13 March 2016; Accepted 14 May 2016
ABSTRACT
Successful design of underwater concrete mixtures must fulfill two basic requirements: adequate flow
ability to spread into the placing forms without consolidation, and viscosity in order to resist the washing
out. In this paper an investigation was carried out to determine the effect of the dosage of anti washout
admixture (AWA), water cementitious materials ratio (w/cm),sand to total aggregate ratio(s/a), and the
supplementary cementitious materials on the washout resistance, fresh properties and the relative
compressive strength of self-compacting underwater concrete (SCUWC). Therefore five groups were
prepared for this study. First group studied the effect of the supplementary cementitious materials, second
group dealt with the effect of the AWA ratios, third group is concerning with the effect of w/cm ratio,
fourth group take into account the effect of s/a ratio and finally fifth group included the effect of
cementitious materials. Test results indicate that the concentrations of antiwashout admixture (AWA)
have direct effect on washout resistance and relative compressive strength. The washout mass loss can be
reduced by using 10% silica fume replacement. Also it can be reduced by decreasing the w/cm and
increasing the cement content and that result in greater relative strength.
Keywords: Underwater concrete; Self compacting concrete; Antiwashout admixture (AWA);
Washout resistance; Silica fume
1. Introduction
Until recently, underwater concrete was defined as tremie concrete only, but now, due
to recent researches in the field of using admixtures, new procedures have been developed,
so freshly mixed concrete can now be placed by dropping it through water without the use
of a tremie [1]. Research has improved techniques for placing concrete under water
without the use of a pump, tremie, or any conventional methods, and innovative
antiwashout chemical admixtures (AWA) have been developed that permit freshly mixed
concrete to be placed through water without segregation or separation.
245
Mohamed Omar Sayed et al., Influence of mixture composition on washout resistance, fresh ………..
The underwater concrete should be designed to achieve good balance between the
rheological and mechanical properties that have a direct effect on its performance. The
resistance of concrete to water dilution and segregation is dictated by its composition and
rheological properties. Among effective measures to minimize washout and segregation is
incorporation of an antiwashout admixture (AWA). With combined addition of AWA and
a high-range water reducing agent (HRWR), flowable, yet viscous, concrete can be
obtained to secure high stability of the fresh mixture [2]. For example, the Japan Society of
Civil Engineers (JSCE) recommends limiting the w/cm to 0.50 and 0.55 when casting
reinforced concrete in seawater and fresh water, respectively. These values can be 0.60 and
0.65, respectively, for nonreinforced concrete [3] [4]. Furthermore, it was recognized that
the substitution of cement mass by 8% silica fume or 20% fly ash can enhance the
resistance to washout, segregation, and surface settlement compared with concrete made
without any supplementary cementitious materials [5].
The concrete for underwater placement requires optimum proportion of various
combinations of parameters including supplementary cementitious material, water
cementitious materials ratio, sand to total aggregates ratio and chemical admixtures.
The objective of this study is to investigate the effect of the AWA, w/cm, s/a, cement
content, supplementary cementitious materials on the washout resistance, fresh properties
and relative strength of self-compacting underwater concrete.
2. Used materials
All materials used throughout this research program were selected carefully from
among the commercially available materials in Egypt, taking into consideration the general
rules for selecting constituent materials for underwater concrete production.
2.1. Cement
Ordinary Portland cement (CEM I 42.5 N), was used in all concrete mixtures involved
in this study. It is produced according to the Egyptian standards E.S 4756-1/2009 [6].
2.2. Silica fume
Silica Fume, with specific gravity of 2.2 and surface area of 22,880 m2/kg, was the only
supplementary cementitious material added to self-compacting underwater concrete
(SCUWC) mixtures. Silica fume was added in the form of a dry powder as a percentage of
the total cementitious materials (cement + silica fume) content. The density is about (1.5-
2.0)g/cm3 and the pH value is from (6-8).
2.3. Fine aggregate
Local available natural siliceous sand was used in this study with specific gravity 2.61.
2.4. Coarse aggregate
The coarse aggregate used in this study was natural siliceous gravel with a nominal
maximum size of 20.00 mm and specific gravity 2.60.
246
JES, Assiut University, Faculty of Engineering, Vol. 44, No. 3, May 2016, pp. 244 – 258
2.5. Anti washout admixture (AWA)
Sika UCS Pak is a powdered underwater/antiwashout admixture used to produce
underwater concrete. It is formulated to increase the cohesion of concrete to enable
significant reductions in washout. The density is about 0.50 kg/lit and the total Chloride
Ion content is less than 0.1% [7].
2.6. Visco crete (VA)
Sika ViscoCrete-5930L (High Performance Superplasticizer Concrete Admixture) was
used in producing tested mixtures for SCUWC.it is aqueous solution of modified
Polycarboxylate of density 1.1kg/lit. It facilitates extreme water reduction, excellent
flowability at the same time optimal cohesion and highest self-compacting behavior [7].
3. Mix proportioning
Self-compacting underwater concrete (SCUWC) mix proportioning is a more critical
process than the design of self-compacting concrete (SCC). The mix proportion of (SCUWC)
shall be determined by tests such that the concrete has the required antiwashout properties,
strength, flowability, and durability. The procedure for self-compacting underwater concrete is
firstly to select the quantity of antiwashout admixture and high-range water-reducing agent
according to the required antiwashout properties and flowability. The experimental program
consists of five groups. Group one is devoted to study the effect of use of supplementary
cementitious materials by 10% silica fume. Four different AWA ratio values of 0.10%, 0.15%,
0.21% and 0.23% (ratio of cementitious materials) were adopted in group two to study and
determine the optimum ratio of AWA and its effect on washout resistance, fresh properties and
relative strength. Group three is devoted to investigate the effect of w/cm ratio. The water
cementitious materials ratios were set at 0.45, 0.40 and 0.37 corresponding to high quality of
self-compacting underwater concrete. Group four is devoted to investigate the effect of s/a
ratio. Three different s/ratios of 0.40, 0.50, and 0.60, were used for mixtures. Two different
cementitious materials content (CM) of 460, and 520 kg/m3, were used to investigate the effect
of cementitious materials content (CM). More details of mix proportions are given in Table 1.
The slump flow of all mixtures of (SCUWC) were intended to be kept constant;
(570±20) that can considered as self-compacting concrete (SCC) mixtures for underwater
application as Khayat and Assaad mentioned [4] therefore, many trials were carried out to
adjust the (VA content. The Self-Compacting Concrete mixtures, admixture type and
combined type (SCC-A and SCC-C) were made to be control mixture. Therefore their
slump flow was higher than that in SCUWC (600±50).
4. Mixing procedure
All mixtures were prepared in the laboratory using a rotating drum mixer 100 liter
capacity. Buttering of the mixer (disposal of the first mix) was always carried out before the
first intended mix was prepared on the day of casting. The following mixing procedure was
used for all SCC mixtures involved in this study. First, the total content of cement, sand, and
coarse aggregate were dry mixed all together in the mixer for 1 minute. Second, water was
added and the mixing was continued for a further 2 minutes. VA was then added and the
mixing process was continued for further 2 minutes. Once the mix was determined to have
sufficient visual attributes of SCC, the rheological tests were performed in quick succession.
247
Mohamed Omar Sayed et al., Influence of mixture composition on washout resistance, fresh ………..
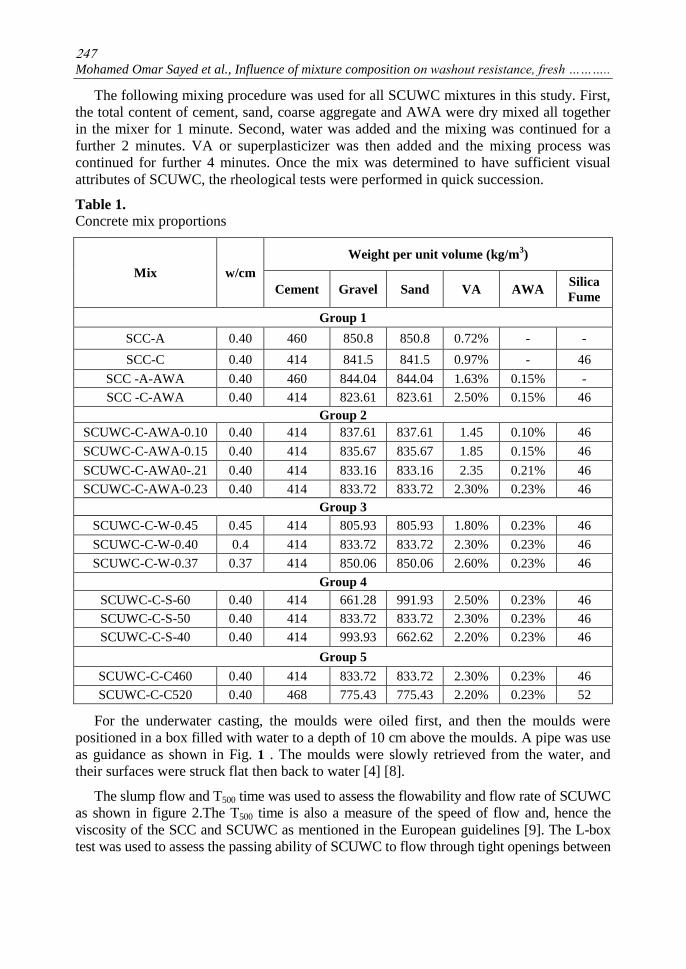
The following mixing procedure was used for all SCUWC mixtures in this study. First,
the total content of cement, sand, coarse aggregate and AWA were dry mixed all together
in the mixer for 1 minute. Second, water was added and the mixing was continued for a
further 2 minutes. VA or superplasticizer was then added and the mixing process was
continued for further 4 minutes. Once the mix was determined to have sufficient visual
attributes of SCUWC, the rheological tests were performed in quick succession.
Table 1.
Concrete mix proportions
Mix w/cm
Weight per unit volume (kg/m3)
Cement Gravel Sand VA AWA Silica
Fume
Group 1
SCC-A 0.40 460 850.8 850.8 0.72% - -
SCC-C 0.40 414 841.5 841.5 0.97% - 46
SCC -A-AWA 0.40 460 844.04 844.04 1.63% 0.15% -
SCC -C-AWA 0.40 414 823.61 823.61 2.50% 0.15% 46
Group 2
SCUWC-C-AWA-0.10 0.40 414 837.61 837.61 1.45 0.10% 46
SCUWC-C-AWA-0.15 0.40 414 835.67 835.67 1.85 0.15% 46
SCUWC-C-AWA0-.21 0.40 414 833.16 833.16 2.35 0.21% 46
SCUWC-C-AWA-0.23 0.40 414 833.72 833.72 2.30% 0.23% 46
Group 3
SCUWC-C-W-0.45 0.45 414 805.93 805.93 1.80% 0.23% 46
SCUWC-C-W-0.40 0.4 414 833.72 833.72 2.30% 0.23% 46
SCUWC-C-W-0.37 0.37 414 850.06 850.06 2.60% 0.23% 46
Group 4
SCUWC-C-S-60 0.40 414 661.28 991.93 2.50% 0.23% 46
SCUWC-C-S-50 0.40 414 833.72 833.72 2.30% 0.23% 46
SCUWC-C-S-40 0.40 414 993.93 662.62 2.20% 0.23% 46
Group 5
SCUWC-C-C460 0.40 414 833.72 833.72 2.30% 0.23% 46
SCUWC-C-C520 0.40 468 775.43 775.43 2.20% 0.23% 52
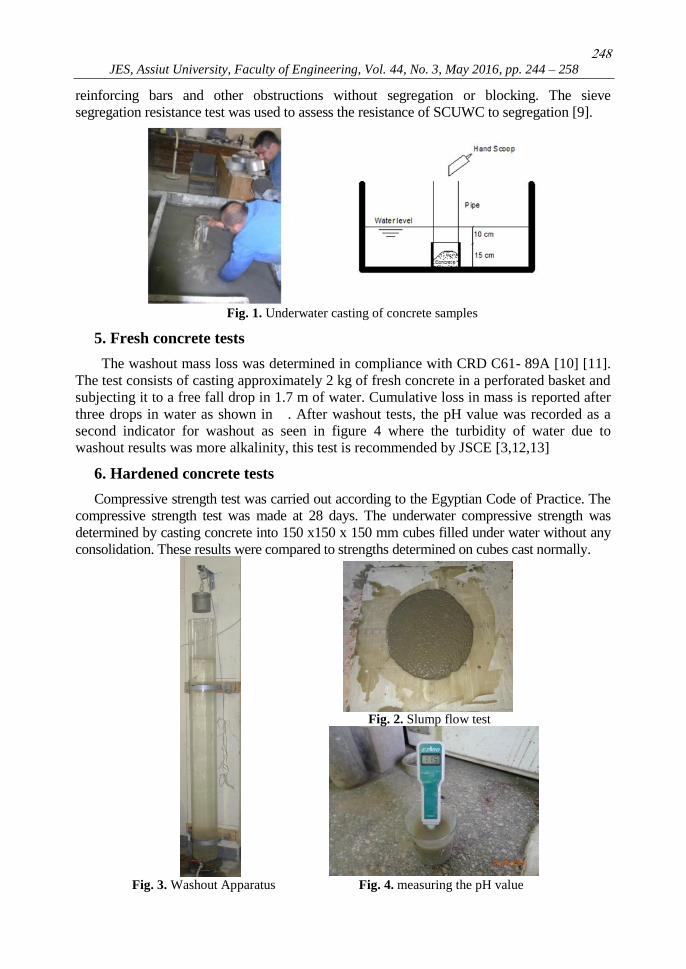
For the underwater casting, the moulds were oiled first, and then the moulds were
positioned in a box filled with water to a depth of 10 cm above the moulds. A pipe was use
as guidance as shown in Fig. 1 . The moulds were slowly retrieved from the water, and
their surfaces were struck flat then back to water [4] [8].
The slump flow and T500 time was used to assess the flowability and flow rate of SCUWC
as shown in figure 2.The T500 time is also a measure of the speed of flow and, hence the
viscosity of the SCC and SCUWC as mentioned in the European guidelines [9]. The L-box
test was used to assess the passing ability of SCUWC to flow through tight openings between
248
JES, Assiut University, Faculty of Engineering, Vol. 44, No. 3, May 2016, pp. 244 – 258
reinforcing bars and other obstructions without segregation or blocking. The sieve
segregation resistance test was used to assess the resistance of SCUWC to segregation [9].
Fig. 1. Underwater casting of concrete samples
5. Fresh concrete tests
The washout mass loss was determined in compliance with CRD C61- 89A [10] [11].
The test consists of casting approximately 2 kg of fresh concrete in a perforated basket and
subjecting it to a free fall drop in 1.7 m of water. Cumulative loss in mass is reported after
three drops in water as shown in . After washout tests, the pH value was recorded as a
second indicator for washout as seen in figure 4 where the turbidity of water due to
washout results was more alkalinity, this test is recommended by JSCE [3,12,13]
6. Hardened concrete tests
Compressive strength test was carried out according to the Egyptian Code of Practice. The
compressive strength test was made at 28 days. The underwater compressive strength was
determined by casting concrete into 150 x150 x 150 mm cubes filled under water without any
consolidation. These results were compared to strengths determined on cubes cast normally.
Fig. 2. Slump flow test
Fig. 3. Washout Apparatus Fig. 4. measuring the pH value
249
Mohamed Omar Sayed et al., Influence of mixture composition on washout resistance, fresh ………..
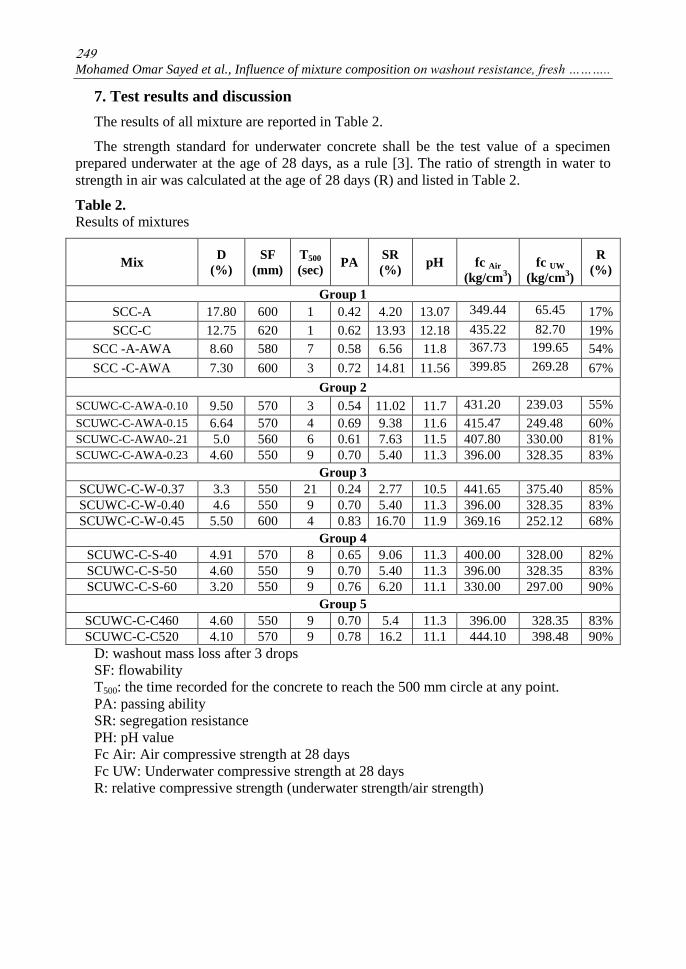
7. Test results and discussion
The results of all mixture are reported in Table 2.
The strength standard for underwater concrete shall be the test value of a specimen
prepared underwater at the age of 28 days, as a rule [3]. The ratio of strength in water to
strength in air was calculated at the age of 28 days (R) and listed in Table 2.
Table 2.
Results of mixtures
Mix
D
(%)
SF
(mm)
T500
(sec)
PA
SR
(%) pH
fc Air
(kg/cm3)
fc UW
(kg/cm3)
R
(%)
Group 1
SCC-A 17.80 600 1 0.42 4.20 13.07 349.44 65.45 17%
SCC-C 12.75 620 1 0.62 13.93 12.18 435.22 82.70 19%
SCC -A-AWA 8.60 580 7 0.58 6.56 11.8 367.73 199.65 54%
SCC -C-AWA 7.30 600 3 0.72 14.81 11.56 399.85 269.28 67%
Group 2
SCUWC-C-AWA-0.10 9.50 570 3 0.54 11.02 11.7 431.20 239.03 55%
SCUWC-C-AWA-0.15 6.64 570 4 0.69 9.38 11.6 415.47 249.48 60%
SCUWC-C-AWA0-.21 5.0 560 6 0.61 7.63 11.5 407.80 330.00 81%
SCUWC-C-AWA-0.23 4.60 550 9 0.70 5.40 11.3 396.00 328.35 83%
Group 3
SCUWC-C-W-0.37 3.3 550 21 0.24 2.77 10.5 441.65 375.40 85%
SCUWC-C-W-0.40 4.6 550 9 0.70 5.40 11.3 396.00 328.35 83%
SCUWC-C-W-0.45 5.50 600 4 0.83 16.70 11.9 369.16 252.12 68%
Group 4
SCUWC-C-S-40 4.91 570 8 0.65 9.06 11.3 400.00 328.00 82%
SCUWC-C-S-50 4.60 550 9 0.70 5.40 11.3 396.00 328.35 83%
SCUWC-C-S-60 3.20 550 9 0.76 6.20 11.1 330.00 297.00 90%
Group 5
SCUWC-C-C460 4.60 550 9 0.70 5.4 11.3 396.00 328.35 83%
SCUWC-C-C520 4.10 570 9 0.78 16.2 11.1 444.10 398.48 90%
D: washout mass loss after 3 drops
SF: flowability
T500: the time recorded for the concrete to reach the 500 mm circle at any point.
PA: passing ability
SR: segregation resistance
PH: pH value
Fc Air: Air compressive strength at 28 days
Fc UW: Underwater compressive strength at 28 days
R: relative compressive strength (underwater strength/air strength)
250
JES, Assiut University, Faculty of Engineering, Vol. 44, No. 3, May 2016, pp. 244 – 258
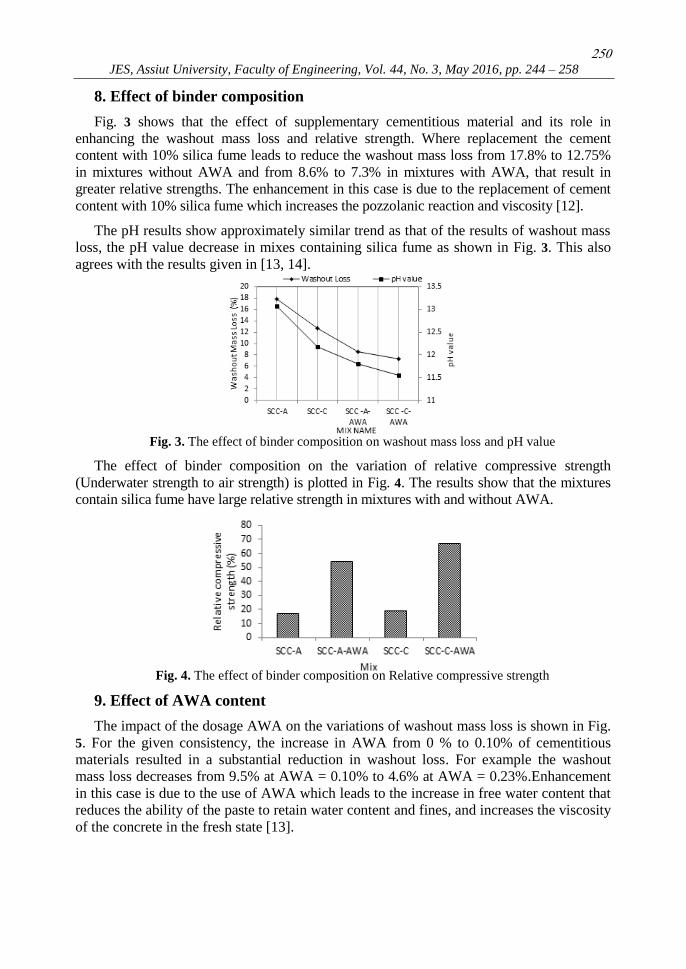
8. Effect of binder composition
Fig. 3 shows that the effect of supplementary cementitious material and its role in
enhancing the washout mass loss and relative strength. Where replacement the cement
content with 10% silica fume leads to reduce the washout mass loss from 17.8% to 12.75%
in mixtures without AWA and from 8.6% to 7.3% in mixtures with AWA, that result in
greater relative strengths. The enhancement in this case is due to the replacement of cement
content with 10% silica fume which increases the pozzolanic reaction and viscosity [12].
The pH results show approximately similar trend as that of the results of washout mass
loss, the pH value decrease in mixes containing silica fume as shown in Fig. 3. This also
agrees with the results given in [13, 14].
Fig. 3. The effect of binder composition on washout mass loss and pH value
The effect of binder composition on the variation of relative compressive strength
(Underwater strength to air strength) is plotted in Fig. 4. The results show that the mixtures
contain silica fume have large relative strength in mixtures with and without AWA.
Fig. 4. The effect of binder composition on Relative compressive strength
9. Effect of AWA content
The impact of the dosage AWA on the variations of washout mass loss is shown in Fig.
5. For the given consistency, the increase in AWA from 0 % to 0.10% of cementitious
materials resulted in a substantial reduction in washout loss. For example the washout
mass loss decreases from 9.5% at AWA = 0.10% to 4.6% at AWA = 0.23%.Enhancement
in this case is due to the use of AWA which leads to the increase in free water content that
reduces the ability of the paste to retain water content and fines, and increases the viscosity
of the concrete in the fresh state [13].
251
Mohamed Omar Sayed et al., Influence of mixture composition on washout resistance, fresh ………..
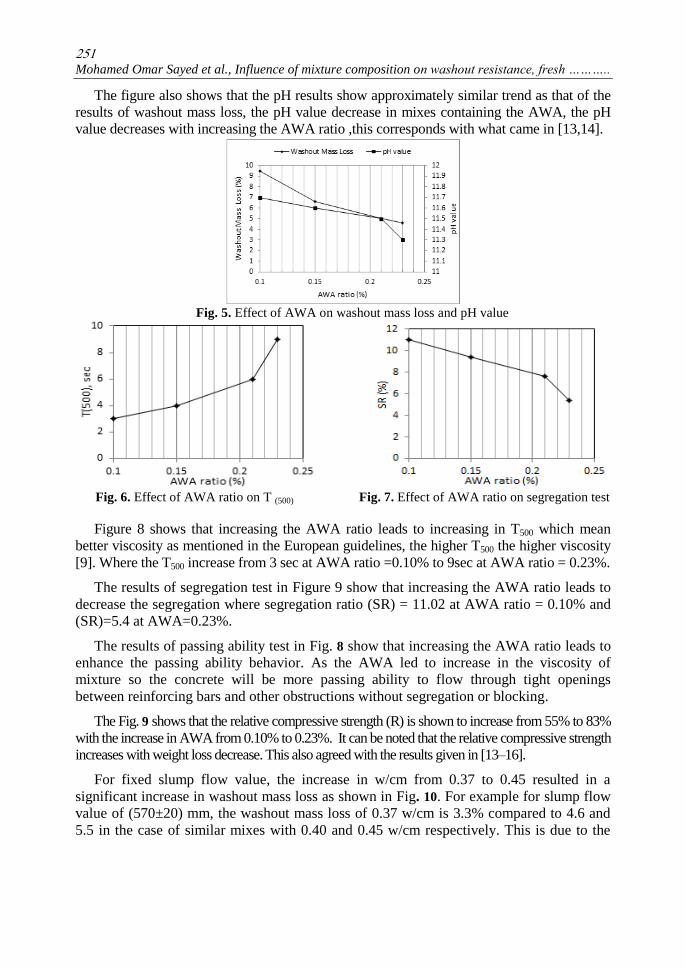
The figure also shows that the pH results show approximately similar trend as that of the
results of washout mass loss, the pH value decrease in mixes containing the AWA, the pH
value decreases with increasing the AWA ratio ,this corresponds with what came in [13,14].
Fig. 5. Effect of AWA on washout mass loss and pH value
Fig. 6. Effect of AWA ratio on T (500) Fig. 7. Effect of AWA ratio on segregation test
Figure 8 shows that increasing the AWA ratio leads to increasing in T500 which mean
better viscosity as mentioned in the European guidelines, the higher T500 the higher viscosity
[9]. Where the T500 increase from 3 sec at AWA ratio =0.10% to 9sec at AWA ratio = 0.23%.
The results of segregation test in Figure 9 show that increasing the AWA ratio leads to
decrease the segregation where segregation ratio (SR) = 11.02 at AWA ratio = 0.10% and
(SR)=5.4 at AWA=0.23%.
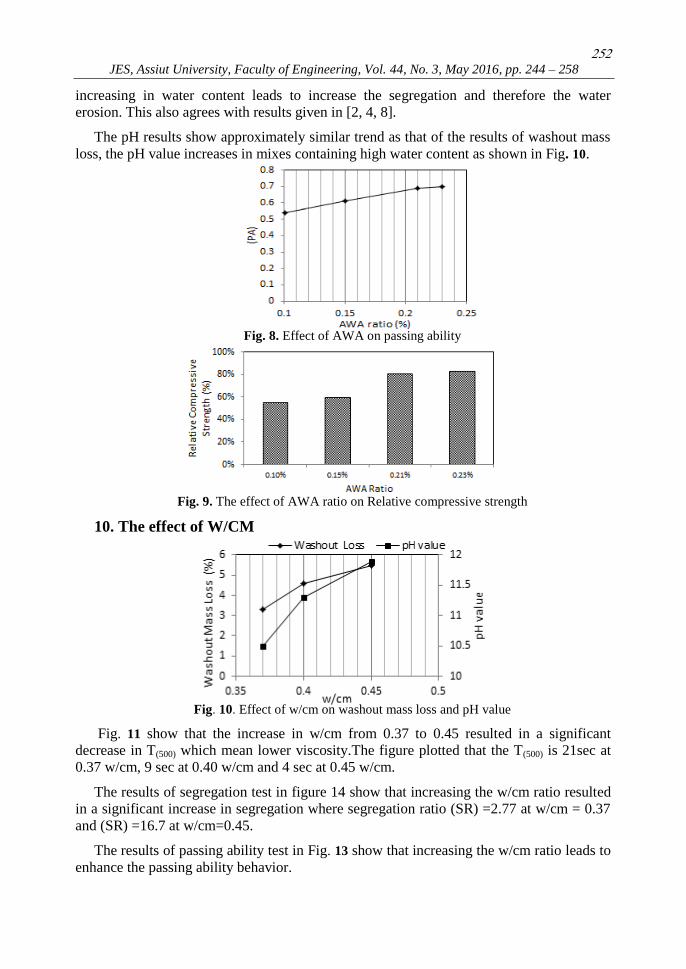
The results of passing ability test in Fig. 8 show that increasing the AWA ratio leads to
enhance the passing ability behavior. As the AWA led to increase in the viscosity of
mixture so the concrete will be more passing ability to flow through tight openings
between reinforcing bars and other obstructions without segregation or blocking.
The Fig. 9 shows that the relative compressive strength (R) is shown to increase from 55% to 83%
with the increase in AWA from 0.10% to 0.23%. It can be noted that the relative compressive strength
increases with weight loss decrease. This also agreed with the results given in [13–16].
For fixed slump flow value, the increase in w/cm from 0.37 to 0.45 resulted in a
significant increase in washout mass loss as shown in Fig. 10. For example for slump flow
value of (570±20) mm, the washout mass loss of 0.37 w/cm is 3.3% compared to 4.6 and
5.5 in the case of similar mixes with 0.40 and 0.45 w/cm respectively. This is due to the
252
JES, Assiut University, Faculty of Engineering, Vol. 44, No. 3, May 2016, pp. 244 – 258
increasing in water content leads to increase the segregation and therefore the water
erosion. This also agrees with results given in [2, 4, 8].
The pH results show approximately similar trend as that of the results of washout mass
loss, the pH value increases in mixes containing high water content as shown in Fig. 10.
Fig. 8. Effect of AWA on passing ability
Fig. 9. The effect of AWA ratio on Relative compressive strength
10. The effect of W/CM
Fig. 10. Effect of w/cm on washout mass loss and pH value
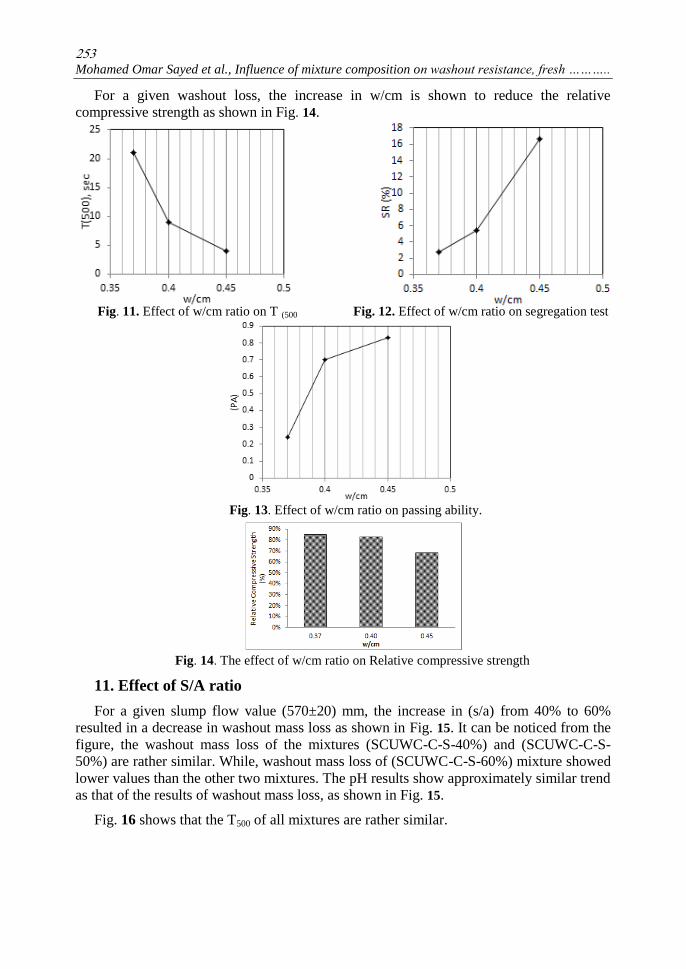
Fig. 11 show that the increase in w/cm from 0.37 to 0.45 resulted in a significant
decrease in T(500) which mean lower viscosity.The figure plotted that the T(500) is 21sec at
0.37 w/cm, 9 sec at 0.40 w/cm and 4 sec at 0.45 w/cm.
The results of segregation test in figure 14 show that increasing the w/cm ratio resulted
in a significant increase in segregation where segregation ratio (SR) =2.77 at w/cm = 0.37
and (SR) =16.7 at w/cm=0.45.
The results of passing ability test in Fig. 13 show that increasing the w/cm ratio leads to
enhance the passing ability behavior.
253
Mohamed Omar Sayed et al., Influence of mixture composition on washout resistance, fresh ………..
For a given washout loss, the increase in w/cm is shown to reduce the relative
compressive strength as shown in Fig. 14.
Fig. 11. Effect of w/cm ratio on T (500 Fig. 12. Effect of w/cm ratio on segregation test
Fig. 13. Effect of w/cm ratio on passing ability.
Fig. 14. The effect of w/cm ratio on Relative compressive strength
11. Effect of S/A ratio
For a given slump flow value (570±20) mm, the increase in (s/a) from 40% to 60%
resulted in a decrease in washout mass loss as shown in Fig. 15. It can be noticed from the
figure, the washout mass loss of the mixtures (SCUWC-C-S-40%) and (SCUWC-C-S-
50%) are rather similar. While, washout mass loss of (SCUWC-C-S-60%) mixture showed
lower values than the other two mixtures. The pH results show approximately similar trend
as that of the results of washout mass loss, as shown in Fig. 15.
Fig. 16 shows that the T500 of all mixtures are rather similar.
254
JES, Assiut University, Faculty of Engineering, Vol. 44, No. 3, May 2016, pp. 244 – 258
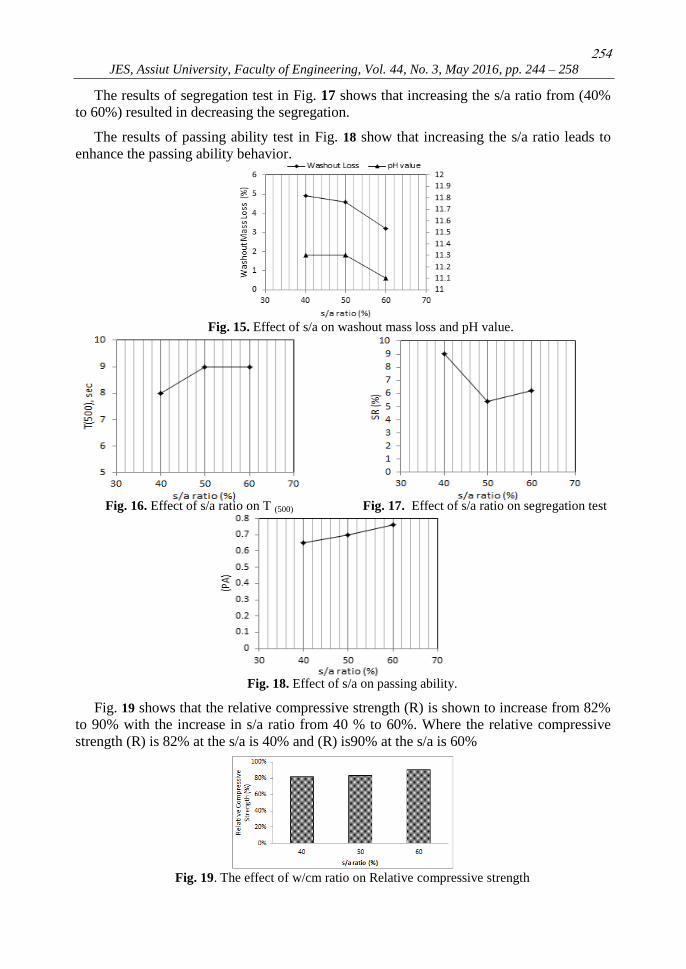
The results of segregation test in Fig. 17 shows that increasing the s/a ratio from (40%
to 60%) resulted in decreasing the segregation.
The results of passing ability test in Fig. 18 show that increasing the s/a ratio leads to
enhance the passing ability behavior.
Fig. 15. Effect of s/a on washout mass loss and pH value.
Fig. 16. Effect of s/a ratio on T (500) Fig. 17. Effect of s/a ratio on segregation test
Fig. 18. Effect of s/a on passing ability.
Fig. 19 shows that the relative compressive strength (R) is shown to increase from 82%
to 90% with the increase in s/a ratio from 40 % to 60%. Where the relative compressive
strength (R) is 82% at the s/a is 40% and (R) is90% at the s/a is 60%
Fig. 19. The effect of w/cm ratio on Relative compressive strength
255
Mohamed Omar Sayed et al., Influence of mixture composition on washout resistance, fresh ………..
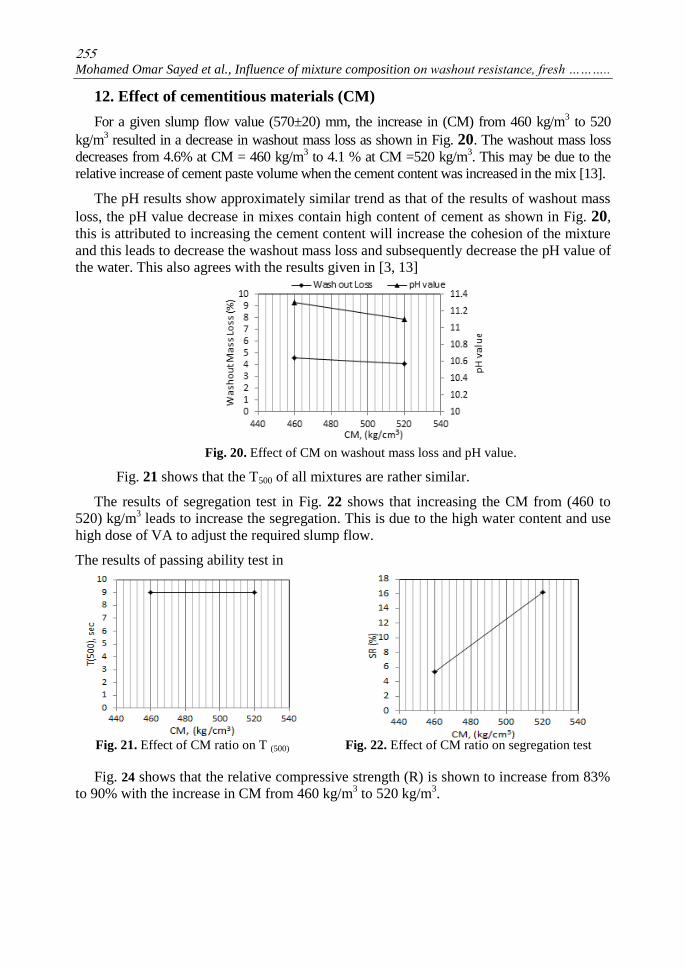
12. Effect of cementitious materials (CM)
For a given slump flow value (570±20) mm, the increase in (CM) from 460 kg/m3 to 520
kg/m3 resulted in a decrease in washout mass loss as shown in Fig. 20. The washout mass loss
decreases from 4.6% at CM = 460 kg/m3 to 4.1 % at CM =520 kg/m
3. This may be due to the
relative increase of cement paste volume when the cement content was increased in the mix [13].
The pH results show approximately similar trend as that of the results of washout mass
loss, the pH value decrease in mixes contain high content of cement as shown in Fig. 20,
this is attributed to increasing the cement content will increase the cohesion of the mixture
and this leads to decrease the washout mass loss and subsequently decrease the pH value of
the water. This also agrees with the results given in [3, 13]
Fig. 20. Effect of CM on washout mass loss and pH value.
Fig. 21 shows that the T500 of all mixtures are rather similar.
The results of segregation test in Fig. 22 shows that increasing the CM from (460 to
520) kg/m3 leads to increase the segregation. This is due to the high water content and use
high dose of VA to adjust the required slump flow.
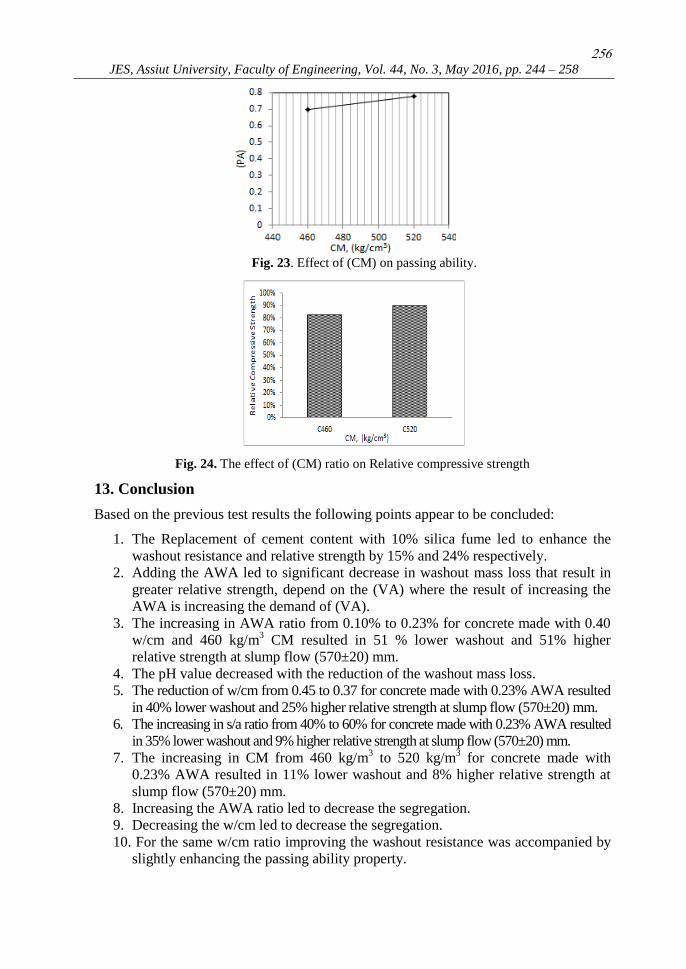
The results of passing ability test in
Fig. 21. Effect of CM ratio on T (500) Fig. 22. Effect of CM ratio on segregation test
Fig. 24 shows that the relative compressive strength (R) is shown to increase from 83%
to 90% with the increase in CM from 460 kg/m3 to 520 kg/m
3.
256
JES, Assiut University, Faculty of Engineering, Vol. 44, No. 3, May 2016, pp. 244 – 258
Fig. 23. Effect of (CM) on passing ability.
Fig. 24. The effect of (CM) ratio on Relative compressive strength
13. Conclusion
Based on the previous test results the following points appear to be concluded:
1. The Replacement of cement content with 10% silica fume led to enhance the
washout resistance and relative strength by 15% and 24% respectively.
2. Adding the AWA led to significant decrease in washout mass loss that result in
greater relative strength, depend on the (VA) where the result of increasing the
AWA is increasing the demand of (VA).
3. The increasing in AWA ratio from 0.10% to 0.23% for concrete made with 0.40
w/cm and 460 kg/m3 CM resulted in 51 % lower washout and 51% higher
relative strength at slump flow (570±20) mm.
4. The pH value decreased with the reduction of the washout mass loss.
5. The reduction of w/cm from 0.45 to 0.37 for concrete made with 0.23% AWA resulted
in 40% lower washout and 25% higher relative strength at slump flow (570±20) mm.
6. The increasing in s/a ratio from 40% to 60% for concrete made with 0.23% AWA resulted
in 35% lower washout and 9% higher relative strength at slump flow (570±20) mm.
7. The increasing in CM from 460 kg/m3 to 520 kg/m
3 for concrete made with
0.23% AWA resulted in 11% lower washout and 8% higher relative strength at
slump flow (570±20) mm.
8. Increasing the AWA ratio led to decrease the segregation.
9. Decreasing the w/cm led to decrease the segregation.
10. For the same w/cm ratio improving the washout resistance was accompanied by
slightly enhancing the passing ability property.
257
Mohamed Omar Sayed et al., Influence of mixture composition on washout resistance, fresh ………..
REFERENCES
[1] H. S. Najm, Concrete Construction Engineering Handbook, New Jersey: Taylor & Francis
Group, LLC, 2008.
[2] K. Khayat, A. Yahia and M. Sonebi, “Applications of Statistical Models for Proportioning
Underwater Concrete,” ACI Materials Journal, vol. 96, no. 6, pp. 634-641, 1999.
[3] “RECOMMENDATIONS FOR DESIGN AND CONSTRUCTION OF ANTIWASHOUT
UNDERWATER CONCRETE,” Japan Society of Civil Engineers (JSCE), JAPAN, 1991.
[4] K. H. Khayat and J. Assaad, “Relationship between Washout Resistance and Rheological
Properties of High-Performance Underwater Concrete,” ACI MATERIALS JOURNAL, vol.
100, no. 3, pp. 185-193, 2003.
[5] M. Sonebi and K. khayat, “Effect of Free-Fall Height in Water on Performance of Highly
Flowable Concrete,” ACI Materials Journal, 2001.
[6] The Egyption Standard Specification, “ES 4756-1 (2009) Cement Part:(1) Composition,
Specifications And Conformity Criteria For Common Cements,” Egyptian Organization for
Standardization and Quality (EOS), Egypt, 2009.
[7] Sika Egypt for construction chemicals, Egypt, [Online]. Available: http://www.sika.com.eg..
[8] k. Khayat and M. Sonebi, “Effect of Mixture Composition on Relative Strength of Highly
Flowable Underwater Concrete,” Aci Materials Journal, vol. 98, no. 3, pp. 233-239, 2001.
[9] “The European Guidelines for Self-Compacting Concrete Specification, Production and Use,”
May 2005. [Online]. Available: www.efca.info or www.efnarc.org.
[10] CRD C61-89A," Test Method For Determining The Resistance Of Freshly-Mixed Concrete To
Washing Out In Water", U.S.Army Experiment station,Vicksburg,Miss, 1989.
[11] D. E. B. B. C. G. Sam X. Yao, “Assessment of Underwater Concrete Technologies for In-the-
Wet Construction of Navigation Structures,” US Army Corps of Engineers,Engineer Research
and Development Center, San Francisco, September 1999.
[12] M. Benaicha, X. Roguiez, O. Jalbaud, Y. Burtschell and A. H. Alaoui, “Influence of silica
fume and viscosity modifying agent on the mechanical and rheological behavior of self
compacting concrete,” Construction and Building Materials, vol. 84, pp. 103-110, 2015.
[13] A. M. H. Alsaeed Abd El Salam Maaty and Ibrahim Saad Agwa, Simulation of the behavior of
pressurized underwater concrete, Alexandria: Alexandria Engineering Journal (2015) 54, 183–
195, April 2015.
[14] A. M. Heniegal, “Behaviour Of Underwater Self Compacting Concrete,” Journal of
Engineering Sciences,Assiut University, vol. 40, no. 4, pp. 1005-1023, July 2012.
[15] M. Imam, “The use of anti-washout admixtures in underwater,” in Egyptian Engineers
Association of the 2nd Conference, Riyad, 15–17 May, 2010..
[16] E. Ali and E. Kattab, “Self-flowing under-water concrete mixtures with and without anti-
washout admixture J. Eng.,” J. Eng.Res. Azhar University Egypt., 2013.
258
JES, Assiut University, Faculty of Engineering, Vol. 44, No. 3, May 2016, pp. 244 – 258
تأثير نسب الخلط على مقاومة الغسيل والخواص الطازجة
المصبوبة تحت الماء كوالمقاومة النسبية للخرسانة ذاتية الدم
الملخص العربي
عند صب الخرسانة تحت الماء يعمل الماء على إجتراف األسمنت من الخرسانة وينتج عن ذلك نقص في
هناك طرق خاصة لصب الخرسانة تحت الماء وتعمل تمقاومتها وتعكر في المياه المحيطة بها. ولذا كان
في مجال استخدام االضافات أمكن جميع هذه الطرق على تقليل تالمس الماء مع الخرسانة. ونظراً للتطور
بدون الحاجة الى استخدام انتاج اضافة تعمل على صب الخرسانة في الماء عن طريق صبها مباشرة
(tremie )أ( وpump). ( وتعمل هذه االضافاتAWA على تكوين جل في الماء المحيط بحبيبات األسمنت )
بين جزيئات الخرسانة وتحسن من فتحميه من اإلجتراف بفعل الماء كما تعمل على زيادة اللزوجة و التماسك
نتاج هذا النوع من الخرسانة يتطلب األمر بأن تكون الخرسانة متماسكة و ذاتية الدمك مقاومتها لالنفصال. وأل
مكن الدمك تحت الماء.حيث أنه ال ي
في هذا البحث تم عمل دراسة النتاج خرسانة ذاتية الدمك مصبوبة تحت الماء ودراسة تأثير التغير في
المقاومة لعينات )يوم 28بعد عمر على مقاومة الغسيل )اإلجتراف( والمقاومة النسبية لمكونتها نسب الخلط
وذلك بغرض الحصول على افضل النسب للخرسانة ذاتية مصبوبة تحت الماء / عينات مصبوبة في الهواء(
ختبا ا رت الخاصة بالصب تحت الماء.ق المتطلبات القياسية لأليالدمك لتحق
( ونسبة AWAو نسبة االضافة ) ثير نسبة المواد الرابطةأتم عمل خمس مجموعات وذلك لدراسة ت
مقاومة الغسيل )اإلجتراف( ونسبة الركام الناعم الى الركام الشامل ونسبة المواد االسمنتية على الماءمحتوى
بطريقتين الفقد في الوزن و . وتم قياس الغسيل المائى للخرسانة تحت الماءيوم 28والمقاومة النسبية بعد عمر
لتى صبت تحت الماء ايوم 28بعد قيمة االس الهيدروجينى. كما تم قياس مقاومة الضغط لجميع الخلطات
وكذلك التى صبت في الظروف العادية )في الهواء( بغرض تحديد قيمة المقاومة النسبية وتم ايضاً عمل
. (L-boxواختبار) اختبار هبوط االنسياب واختبار مقاومة االنفصال الحبيبي
اتية الدمك تم تخفيضه بنسبة حتىهرت النتائج أن الفقد فى الوزن بفعل الصب تحت الماء للخرسانة ذظوأ
(AWA) % بفعل اضافة مادة مقاومة الغسيل المائى 90اومه النسبية التى وصلت حتى قوتحسين الم 64%
% بغبار السليكا يؤدي الى تقليل الفقد فى الوزن بفعل الصب تحت الماء 10حالل األسمنت بنسبة إوأن
هرت الدراسة ايضا أن تقليل محتوى الماء وزيادة نسبة الركام ظكما أ وبالتالي زيادة نسبة المقاومة النسبية
الناعم الى الركام الشامل وزيادة نسبة المواد األسمنتية تعمل على تقليل الفقد فى الوزن بفعل الصب تحت
طبقا تصب تحت الماءالدمك ذاتية خرسانةيمكن الحصول على وبذلكوبالتالي زيادة المقاومة النسبية الماء
المقاومة قلت واال نالوز فى كفقد% 8 عن المائى يزيد الغسيل اال على نصت التى القياسية للمواصفات
مواصفات االمريكية واليابانية .النصت كما % 80 عن النسبية


![[FRESH (FOR ADMISSION) - CIVIL CASES]](https://static.fdokumen.com/doc/165x107/6327cffe5c2c3bbfa8045c6c/fresh-for-admission-civil-cases.jpg)