Ethiopia - GIBE III - Hydroelectric Project - ESIA-Additional Study
Upload
hydroquebecCategory
view
1download
0
Structural Safety 50 (2014) 1–8
Contents lists available at ScienceDirect
Structural Safety
journal homepage: www.elsevier .com/locate /s t rusafe
Influence of load spectrum assumptions on the expected reliabilityof hydroelectric turbines: A case study
http://dx.doi.org/10.1016/j.strusafe.2014.03.0080167-4730/� 2014 Elsevier Ltd. All rights reserved.
⇑ Corresponding author at: Institut de recherche d’Hydro-Québec (IREQ),Varennes, Québec J3X 1S1, Canada. Tel.: +1 450 652 8359.
E-mail address: [email protected] (M. Gagnon).
Martin Gagnon a,b,⇑, Antoine Tahan a, Philippe Bocher a, Denis Thibault b
a École de technologie supérieure (ÉTS), Montréal, Québec H3C 1K3, Canadab Institut de recherche d’Hydro-Québec (IREQ), Varennes, Québec J3X 1S1, Canada
a r t i c l e i n f o a b s t r a c t
Article history:Received 26 March 2013Received in revised form 7 February 2014Accepted 29 March 2014
Keywords:Load spectrumReliabilityHydroelectric turbineHigh Cycle Fatigue (HCF)
A lack of observed data can lead to significant discrepancy between estimated and actual fatigue reliabil-ity. In this study, the load spectrum derived from the strain measurements and operation history of ahydroelectric turbine are used to identify the information necessary to avoid major bias in the estimatedfatigue reliability of such structure. Our results demonstrate that a limited number of parameters need tobe considered. Any further simplifications may lead to major reliability estimate discrepancies. Further-more, we observe that the parameters which influence initial reliability hide the influence of otherparameters on the reliability failure rate associated with the structure’s life expectancy. We conclude thata typical sensitivity analysis made on parameter values needs to be complemented with a sensitivitystudy on the chosen assumptions in order to properly evaluate the risks associated with the operationof hydroelectric turbines.
� 2014 Elsevier Ltd. All rights reserved.
1. Introduction
Using oversimplified loading spectra can generate significantbias in fatigue analysis because of neglected features when com-pared to the actual load sustained by the structure. However,observed data are often lacking during the design of a structureor before measured values are available. In such cases, both thedesigner and the analyst have to rely on simplified loadingassumptions. The lack in the literature of either standardized loadspectra or observed data from existing hydroelectric turbine run-ners make it difficult for the construction of such a priori assump-tions. For large Francis hydroelectric turbine runners, every runneris considered a prototype. Generally speaking, the loading patternsused during the design phase simply cannot be based only on pre-viously observed data from similar designs. This often leads to adifference between estimated reliability and actual reliability. Sucherrors, if unacknowledged, might influence design choices leadingto a risk of higher maintenance costs or warranty issues. The nat-ure, consequences and probability of these errors are often notconsidered in reliability assessments. We believe that the possibil-ity of such errors generates uncertainties which should beacknowledged in a attempt to minimize the risks associated with
the operation of these large rotating structures. This is in line withthe risk description proposed by Aven [1] in which the probabilityand the consequences of an event are not sufficient to describe risk.Uncertainties which include assumption credibility also need to beaddressed. In many cases, the acknowledgement of such uncertain-ties may justify the loading spectrum experimental validation incases where life expectancy is considered an important risk factor.Such observations would be an important step toward the safeoperation and standardization of load spectra [2]. In this study,our objective is to define the main damaging features observedon an existing hydroelectric turbine runner and to quantify theireffect on the reliability assessment of such structures.
Structures like large hydroelectric turbine runners often havelimited inspection possibilities combined with high downtimecosts. For these structures, we consider that cracks only need tobe repaired after the onset of High Cycle Fatigue (HCF). This state-ment relies on two basic assumptions:
1. Significant crack growth will be induced after HCF onset andcrack growth will then be proportional to operation time ratherthan the number of low cycle fatigue (LCF) events.
2. A crack needs to be repaired as soon as possible in order to min-imize costs only if significant growth is expected.
A typical design assumption is that the stress experienced bythe runner blades goes from zero to a given operating condition

Fig. 2. Measured loading sequence.
Fig. 3. LCF vs. LCF + HCF crack propagation results.
2 M. Gagnon et al. / Structural Safety 50 (2014) 1–8
stress level to zero during a typical load cycle [3]. This simple load-ing pattern, shown in Fig. 1, is similar to the representation of com-bined HCF/LCF loading commonly used in the literature [4,5].
This loading pattern loosely matches the strains observed dur-ing a typical loading cycle on hydroelectric turbine runner blades.However, when compared with the measured loading shown inFig. 2, this load pattern lacks transient events like turbine’s start-ups and shutdowns. Given their amplitudes, these transients havea non-negligible influence which might generate significant bias onlife expectancy [6,7]. In the industry, the study of such phenomenais recent and is not mentioned in the hydroelectric turbine runnerlife expectancy literature review compiled by Sabourin et al. [8].
The influence of the LCF and HCF part of Fig. 2 loading sequencecan be observed on crack growth simulation from [6] shown inFig. 3. In this figure, the crack propagation results obtained usingthe measured strains from Fig. 2 are presented. We observed aslow crack propagation if a minimal time is spent at maximumopening (LCF only). However, during normal operation, we couldexpect almost 24 h of operation at maximum opening for eachloading block (HCF). The loading HCF component which as anamplitude lower than the onset threshold do not contribute tothe crack growth initially. However, the crack will reach a point,identified as the HCF onset, after which crack growth speedincreases rapidly due to the loading HCF component contribution[4]. This contribution will growth exponentially if we considerthe strain amplitude constant as shown in Fig. 2.
Life expectancy cannot be defined by the loading pattern alone.It must be combined with other information to generate a repre-sentative loading spectrum suitable for life assessment. The infor-mation needed to derive a loading spectrum for a hydroelectricturbine runner is typically:
1. The list of all the allowed steady-state conditions.2. The list and expected number of transient events (startups,
shutdowns . . .).3. The location of every critical area on the runner blades.4. The stresses (static and dynamic contents) for each allowed
steady-state and transient operating conditions at each criticalarea.
5. The residual stress levels at each critical area.
Using these, the loading spectrum is generated and combinedwith both material fatigue properties and expected defect size toobtain a reliability estimate. Our objective in this study is to high-light the results discrepancy between the a prioriloading assump-tions and observed data. For this purpose the data from anexisting structure for which we have both measured strains at acritical location and an operation history are used to derive simpli-fied load spectra. The reliability results obtained with these spectraare then used to establish guidelines regarding the essential
Fig. 1. Schematic example of combined LCF + HCF loading.
features needed in the loading spectrum to minimize bias due tosimplifications while keeping the number of parameters to a min-imum. Such guidelines should help limit the number of assump-tions needed and facilitate the analysis when observed data areunavailable.
The paper is structured as follows: first, the turbine runner reli-ability model and the methodology are defined. Next, a case studyis proposed based on observed data. Finally, reliability results arepresented followed by a discussion on the importance of eachparameter in the design, maintenance and operation of largehydroelectric Francis turbine runners.
2. Reliability model
To assess the reliability of a structure, we must first define aproper limit state for our application. In this study, Linear ElasticFracture Mechanics (LEFM) theory will be applied since it is com-monly used for the crack propagation of hydroelectric turbine run-ner blades [8]. According to LEFM, crack growth can be modeled asfollows:
dadN¼ CDKm; DK > DKth ð1Þ
in which a is the crack length, N the number of stress cycles, C amaterial constant, DK the stress intensity variation, and the expo-nent m also a material constant. In LEFM, no propagation occursbelow a defined stress intensity variation level DKth. The stressintensity factor variation DK is defined using the following:

Fig. 5. Kitagawa representation of the probabilistic HCF threshold.
M. Gagnon et al. / Structural Safety 50 (2014) 1–8 3
DK ¼ Drffiffiffiffiffiffipap
YðaÞ ð2Þ
where Dr is the stress cycle range and YðaÞ a factor associated togiven crack geometry. The threshold in term of stress cycle rangeDrth can be obtained simply by replacing DK by DKth and rewritingEq. (2) to obtain:
Drth ¼DKthffiffiffiffiffiffipap
YðaÞð3Þ
A representation of the limit described by Eq. (3) is presented inFig. 4. In this figure, sigma is the HCF stress range and a the defectsize at a given time. In this case, failure will occur if the combinedextremes of both variable is greater than our limit state. The Gum-ble distribution family was chosen for its simplicity and because ithas been previously used in the literature to model the extremes ofload spectra [9] and the defect size [10,11]. Notice that the arrowrepresents the crack propagation generated by the LCF loadingwhich has stress ranges greater than the defined threshold.
LEFM is only one part of the limit state for the reliability assess-ment of hydroelectric turbine runner blades as proposed by Gag-non et al. [12]. Such limit state was initially proposed byKitagawa and Takahashi [13] and corrected by El Haddad et al.[14] to accounts for short crack growth. This limit state is illus-trated in Fig. 5. Notice that in Fig. 5, compared to Fig. 4, both axesare in logarithmic scale.
The main difference between the limit state in Fig. 4 and the onein Fig. 5 is the El Haddad correction which accounts for short crackgrowth by asymptotically joining the fatigue limit for crack initia-tion Dr0 and LEFM crack growth threshold DKth. Furthermore, theLEFM threshold DKth has been replaced by DKonset because theonset of HCF crack growth can be influenced by the LCF loadingpart, leading to a potentially different threshold value [5].However, in this study such interactions between the LCF andHCF loading have been neglected. By accounting for the El Haddadcorrection Eq. (3) is rewritten as:
Dronset ¼DKonsetffiffiffiffiffiffiffiffiffiffiffiffiffiffiffiffiffiffiffiffiffiffiffiffiffiffiffiffi
pðaþ a0ðNÞÞp
Yðaþ a0ðNÞÞð4Þ
where a0ðNÞ is the intersection between the LEFM limit and the ini-tiation fatigue limit Dr0ðNÞ which decreases until the endurancelimit is reached. The criterion for failure in this case is the probabil-ity of the HCF stress range Dr to be greater than the thresholdDronset and start contributing to crack growth. Such failure criteriaare typically expressed as follows:
gðxÞ 6 0 ð5Þ
Then, using the limit defined in Eq. (4), gðxÞ becomes:
0
Fig. 4. Probabilistic representation of the limit state.
gðxÞ ¼ DKonsetffiffiffiffiffiffiffiffiffiffiffiffiffiffiffiffiffiffiffiffiffiffiffiffiffiffiffiffipðaþ a0ðNÞÞ
pYðaþ a0ðNÞÞ
� Dr ð6Þ
with a failure probability of:
Pf ¼Z
gðxÞ60fXðxÞdx ð7Þ
In this study, First-Order Reliability Method (FORM) will be used forits simplicity. Using FORM, the problem expressed in Eq. (7) can besolved using approximations without having to resort to simulationbased methods such as Monte Carlo (MC) simulations since thishave a drawback common to all simulation methods: possiblyrequiring a prohibitive number of simulations in order to providereliable results for low probability estimates.
The FORM approximation relies on the assumption that a trans-formation in the form U ¼ TðXÞwhich maps the physical space to astandard space exists. Using this transformation, the problem inEq. (5) can be expressed as follows:
Pf ¼Z
gðxÞ60fXðxÞdx ¼
ZgðTðXÞÞ60
/ðuÞdu ð8Þ
where /ðuÞ is an n-dimensional standard normal density with inde-pendent components. We have chosen the Rosenblatt transformbecause it enables the analyst to impose dependency structuresbetween random variables using copula theory [15,16]. In thisway, the Rosenblatt transform offers greater flexibility comparedto other transformation methods like the Nataf transform. Pleasenote that for independent random variables the Rosenblatt trans-form becomes:
U ¼
/�1 F1 X1ð Þð Þ/�1 F2 X2ð Þð Þ
..
.
/�1 Fn Xnð Þð Þ
2666664
3777775
ð9Þ
A schematic representation of the standard space is presented inFig. 6. In the standard space U, the probability of failure Pf can beobtained using either linear approximation (FORM) or quadraticapproximation (SORM). Notice that the Most Probable Point(MMP), also named design point u�, is located at the shortest dis-tance between the origin and the limit state gðUÞ ¼ 0. The distanceto the MPP in the standard space U is called the Hasofer–Lindreliability index bHL which is used as a metric to express thereliability level in our application.
Using the FORM approach, the probability of failure can beapproximated directly from the Hasofer–Lind reliability index bHL
as follows:
Pf ¼ 1� /ðbHLÞ ¼ /ð�bHLÞ ð10Þ

Fig. 6. Schematic representation of FORM/SORM approximations in the standardspace.
4 M. Gagnon et al. / Structural Safety 50 (2014) 1–8
where bHL ¼ ku�k;/ð�Þ is the standard normal cumulative functionand u� ¼ minku�k for gðUÞ 6 0. The Hasofer–Lind reliability indexbHL will be used to evaluate reliability in this study both for simplic-ity and to avoid working directly with approximated probability.
In the FORM methodology, two metrics are typically used tomeasure the influence of input variables on the reliability model.The first one is the importance factor which is calculated asfollows:
a2i ¼ðu�i Þ
2
b2HL
ð11Þ
where a2i is the importance factor of the parameter Xi withP
a2i ¼ 1. The importance factor is an indicator of the impact of
modeling a given variable as random rather than deterministic.The second metric is the sensitivity factor w which is the derivativeof the Hasofer–Lind reliability index bHL with respect to the param-eters H of the joint distribution X:
w ¼ @bHL
@Hð12Þ
We refer the reader to the work of Rackwitz [17] and the work ofDitlevsen and Madsen [18] for a thorough overview of the use ofFORM/SORM approximations in reliability analysis.
Fig. 7. Francis runner diagram.
3. Case study
Our case study is based on the data observed on a low headFrancis hydroelectric turbine runner from a power plant locatedin Quebec, Canada. This facility was chosen because strain mea-surements combined with an operation history over a five-yearperiod were simultaneously available for one of the facility turbinerunners. These a posteriori data are used to build realistic load pat-terns and spectra using different levels of simplifications. Such datacan also be used for the validation of expected design values whichare usually based on a priori assumptions.
In our case study, the following parameters are consideredrandom:
1. Initial defect size, a.2. HCF stress range, DrHCF .3. Startup transient amplitude, Drstartup.4. Shutdown transient amplitude, DrShutdown.5. Number of startups, NStartup.
Each of these random parameters has to be characterized bydistribution type, location and scale. Furthermore, if correlationsare expected between parameters, the dependency structures
must be characterized in the form of a copula. However, since nosignificant dependencies are expected between the chosen randomparameters, they are considered independent in this study.
During the strain measurements, two blades were instru-mented with strain gauges. The instrumented critical area is acut-out located on the blade trailing edge near the runner crownon each blade as shown in Fig. 7. Observed strains for this locationare presented in Fig. 2.
Typically, critical flaws are expected to be either surfaces flawsor near surface embedded flaws. However, in this area, the criticallocation is near the corner of the cut-out region. Hence, the worstflaw type for reliability would be a corner flaw as shown in Fig. 8[19]. This choice of flaw type is based on the assumption thatany undetected embedded flaws near the surface in this regionwould be instantly re-characterized as a corner flaw right afterthe first load cycles. These first cycles can therefore be neglected.Notice that a semi-circular corner flaw has only one parameter,i.e. the size a, eliminating the need to assess possible correlationsbetween flaw parameters.
The strains measured at this location, shown in Fig. 2, are usedto identify the loading pattern characteristics needed to generatethe simplified loading pattern presented in Fig. 9. This loading pat-tern is more representative of the observed data than the typicallyassumed loading pattern shown in Fig. 1 where the startup andshutdown transients are neglected. Furthermore, this loading pat-tern includes periodic excursions from normal operation (i.e. max-imum opening in our simplified pattern) to spin no-load (SNL)which have been observed in the operation history of this runner.Those large load fluctuations generate stress fluctuations DrSNL
which contribute significantly to crack propagation due to theiramplitude. Notice that if the loading pattern in Fig. 1 is to be used,both the startup and the SNL excursions would have the same LCFsignature hence identical expected damage. Furthermore, if anyother major strain fluctuations are observed they should also beconsidered.
The load spectrum is generated by combining the above loadingpattern with the turbine operation history. In this case study, theoperation history is based on a five-year period. Within this five-year history, the runner operation was categorised into threestates: Production, Spin no-load and Stopped. From these state, asemi-Markov simulation method was used to extrapolate the his-tory over a 100-year period [20]. The simulations giving the max-imum and minimum number of startups (i.e. transitions fromstopped state to Spin on load) from 400 simulations are presentedin Fig. 10. The probability distribution for the number of startups Nestimated from these simulations is presented in Fig. 11. Noticethat the number of startups obtained is significantly lower thanthe typical design specifications of one startup per day and thatthe results are approximately linear over time.
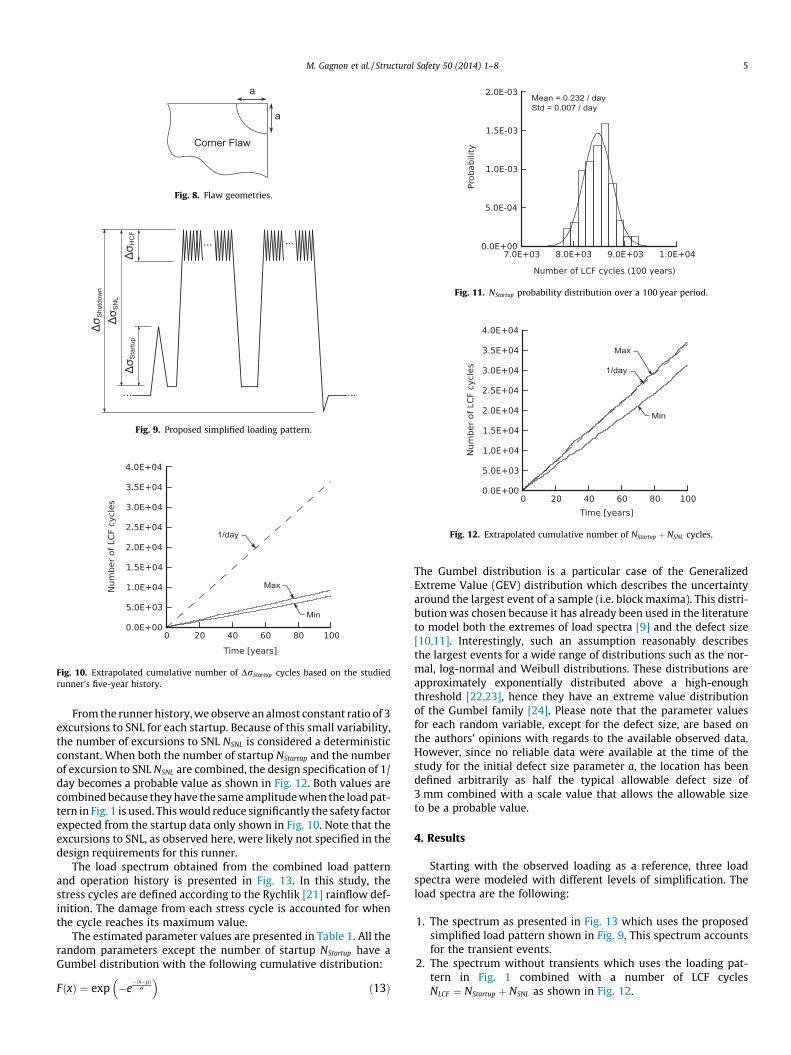
Fig. 11. NStartup probability distribution over a 100 year period.
Fig. 12. Extrapolated cumulative number of NStartup þ NSNL cycles.
Fig. 10. Extrapolated cumulative number of DrStartup cycles based on the studiedrunner’s five-year history.
Fig. 9. Proposed simplified loading pattern.
Fig. 8. Flaw geometries.
M. Gagnon et al. / Structural Safety 50 (2014) 1–8 5
From the runner history, we observe an almost constant ratio of 3excursions to SNL for each startup. Because of this small variability,the number of excursions to SNL NSNL is considered a deterministicconstant. When both the number of startup NStartup and the numberof excursion to SNL NSNL are combined, the design specification of 1/day becomes a probable value as shown in Fig. 12. Both values arecombined because they have the same amplitude when the load pat-tern in Fig. 1 is used. This would reduce significantly the safety factorexpected from the startup data only shown in Fig. 10. Note that theexcursions to SNL, as observed here, were likely not specified in thedesign requirements for this runner.
The load spectrum obtained from the combined load patternand operation history is presented in Fig. 13. In this study, thestress cycles are defined according to the Rychlik [21] rainflow def-inition. The damage from each stress cycle is accounted for whenthe cycle reaches its maximum value.
The estimated parameter values are presented in Table 1. All therandom parameters except the number of startup NStartup have aGumbel distribution with the following cumulative distribution:
FðxÞ ¼ exp �e�ðx�lÞ
r
� �ð13Þ
The Gumbel distribution is a particular case of the GeneralizedExtreme Value (GEV) distribution which describes the uncertaintyaround the largest event of a sample (i.e. block maxima). This distri-bution was chosen because it has already been used in the literatureto model both the extremes of load spectra [9] and the defect size[10,11]. Interestingly, such an assumption reasonably describesthe largest events for a wide range of distributions such as the nor-mal, log-normal and Weibull distributions. These distributions areapproximately exponentially distributed above a high-enoughthreshold [22,23], hence they have an extreme value distributionof the Gumbel family [24]. Please note that the parameter valuesfor each random variable, except for the defect size, are based onthe authors’ opinions with regards to the available observed data.However, since no reliable data were available at the time of thestudy for the initial defect size parameter a, the location has beendefined arbitrarily as half the typical allowable defect size of3 mm combined with a scale value that allows the allowable sizeto be a probable value.
4. Results
Starting with the observed loading as a reference, three loadspectra were modeled with different levels of simplification. Theload spectra are the following:
1. The spectrum as presented in Fig. 13 which uses the proposedsimplified load pattern shown in Fig. 9. This spectrum accountsfor the transient events.
2. The spectrum without transients which uses the loading pat-tern in Fig. 1 combined with a number of LCF cyclesNLCF ¼ NStartup þ NSNL as shown in Fig. 12.

Fig. 14. Deterministic crack propagation results.
Fig. 15. Reliability index as a function of time.
Fig. 16. Importance factors for the load pattern with transients (1) at 60 years witha = Gumbel (1.5,0.25).
Fig. 17. Reliability index sensitivity for load pattern with transients (1) at 60 yearswith a = Gumbel (1.5,0.25).
Table 1Study case parameters.
Location Scale Distribution Units
Kth 2.0 – – MPa m1/2
a 1.5 0.5 Gumbel mmDrHCF 26.0 1.0 Gumbel MPaDrStartup 70.0 1.0 Gumbel MPaDrShutdown 120.0 2.0 Gumbel MPaDrSNL 100.0 2.0 Gumbel MPaNStartup 0.232 0.007 Normal day�1
NSNL 3 – – Startup�1
Fig. 13. Proposed load spectrum.
6 M. Gagnon et al. / Structural Safety 50 (2014) 1–8
3. The spectrum without transients which uses the loading pat-tern in Fig. 1 combined with a number of LCF cyclesNLCF ¼ NStartup as shown in Fig. 10.
These three simplified loading spectra are compared both interms of expected crack propagation and estimated reliability.The deterministic crack propagation results for the three simplifiedloading spectra and the observed loading spectrum generatedusing the measured loading (Fig. 2) are compared in Fig. 14. Wenotice that the results are closer to the observed loading for loadspectrum which include transient events. The discrepancybecomes significantly larger as more features are neglected. Notethat the loading pattern which accounts for only the number ofstartups without transient (3) is the typically specified in designrequirements for this type of runner. We observe, in our case study,that such assumptions could lead to significant bias betweenexpected and actual reliability.
The reliability results for the three simplified loading spectraobtained using the parameter values in Table 1 are shown inFig. 15. These results are also compared to the results obtainedwhen the defect size distribution scale value is divided by a factorof 2. By lowering the scale parameter, the defect size dispersion isreduced. This in turn, lowers the probability of large defects. Wenotice that lowering the probability of having large defects has
significantly more influence on the reliability results than a changein loading pattern assumptions.
The influence of the defect size a compared to the other param-eters is even more obvious when looking at the importance factorat 60 years for the simplified load spectrum which includes tran-sients on a pie chart as shown in Fig. 16. In this figure, we observethat only the uncertainty around defect size a and the HCF stressrange DrHCF contributes to the reliability index results. All theother parameters in this case could be considered deterministic.Note that these results completely conceal the influence of thethe other parameters which are linked to the load spectra assump-tions and LCF events.
Furthermore, if we look at the sensitivity results for each of theparameters, shown in Fig. 17, we still observe that the defect size aand HCF stress range DrHCF have a significant influence on the reli-ability index and again hide the influence of the other parameters

Fig. 18. Example of a measured loading sequence from a different runner design.
M. Gagnon et al. / Structural Safety 50 (2014) 1–8 7
which are mostly linked to load spectrum assumptions and LCFevents.
The observed lack of sensitivity to the parameters related to theLCF loading is mainly due to the slow rate at which the reliabilitydecreases with time. To significantly influence the reliability, evenafter 60 years, the load pattern assumptions have to be changed;not just their parameter values. The influence of these assumptionchanges cannot be highlighted by either sensitivity metrics.
5. Discussion
From the results presented in the previous section, if majortransient events are neglected and only the number of startupsare assumed, one could conclude that reliability is almost insensi-tive to the parameters related to the LCF part of the loading spec-trum and that reliability does not change significantly with time.Our results show that not only some load spectrum assumptionscan have significant influence on the expected reliability but thatthis influence is completely hidden by parameters like defect sizea and HCF stress range DrHCF . In this case study, typical metrics likeimportance factors and reliability index sensitivity factors were notable to highlight the influence of assumption changes. With bothmetrics, the influence of some significant parameters in our studyis overlooked. Such results are in line with the work of Aven andGuikema [25] which concludes that, for risk assessment, sensitivityanalysis should also include the effect of assumptions choices as arule.
However, our case study was conducted on only one specificrunner design. Hence, care must be taken before generalizing theresults from this study because the loads can vary significantlyamong different runner designs. We have observed that operationhistories can differ significantly even for runners with identicaldesigns emanating from the same hydroelectric facility. Further-more, we note that the critical area investigated is a stress reliefcut-out near the crown of the runner which is not a common fea-ture found on hydroelectric turbine runners. Since the observedstress variations depend as much on operating conditions thanon deform shape changes from one condition to another, such datamight be difficult to standardize as they are design specific. Forexample, the maximum stress amplitude is observed in Fig. 18 atthe spin no-load condition, rather than the maximum opening con-dition found in our case study. Additionally, we observe for thisrunner design that the critical permanent regime is not at the max-imum wicket gate opening but at the spin-no-load condition.Unfortunately, in Fig. 18, the transition between operating condi-tions and the shutdown transient were not available. Hence theycannot be shown.
Such differences, if not correctly acknowledged during the run-ner design, may, lead to large discrepancies between predicted reli-ability and actual reliability.
6. Conclusions
The absence of observed data renders the reliability assessmentof structures such as hydroelectric runners difficult. To alleviatethis problem, some simplifications have to be made in order tominimize the number of parameters needed to generate the loadspectrum used to assess the reliability of these large rotating struc-tures. Our results show that the loading spectrum for such struc-tures can be significantly simplified. In our case study, weobserve that if the HCF onset is used as a failure criterion, the loadspectrum can be limited to the following parameters withoutmajor reliability bias:
1. The maximum stress range of the startup transient.2. The maximum stress range of the shutdown transient.3. The frequency of startup/shutdown.4. The maximum stress ranges generated by each major load
change.5. The frequency of each major load change.6. The maximum stress range of the critical steady state regime.
Results obtained using deterministic crack growth show thatsuch simplifications have limited impact on calculated life expec-tancy. Note that further simplifications have resulted in significantdiscrepancies in terms of deterministic crack growth and reliabilityestimates. Within these parameters, we observed that parameters1–5 mainly influence the rate at which reliability decreases withtime. On the other hand, the defect size and parameter 1 of the loadspectrum influence initial reliability. Moreover, in our study, thesetwo parameters tend to hide the influence of the other parameterswhen typical sensitivity analysis metrics are used. As a result, webelieve that in the absence of observed data, fatigue reliabilityanalysis should include an assessment of the influence of loadspectrum assumptions. Currently, the lack of either standardizedload spectrum or observed data from existing hydroelectric turbinerunners in the literature make it difficult to construct such a prioriassumptions. We hope that the data, results and methodology pre-sented in this study will stimulate further research into the riskassociated with such large rotating structures.
Acknowledgments
The authors would like to thank the Institut de recherched’Hydro-Québec (IREQ), Andritz Hydro Ltd and the École de technol-ogie supérieure (ÉTS) for their collaboration and financialcontribution.
References
[1] Aven T. The risk concept – historical and recent development trends. ReliabEng Syst Safety 2012;99(0):33–44.
[2] Heuler P, Klatschke H. Generation and use of standardised load spectra andload-time histories. Int J Fatigue 2005;27(8):974–90.
[3] Lanteigne J, Sabourin M, Bui-Quoc T, Julien D. The characteristics of the steelsused in hydraulic turbine runners. In: IAHR 24th Symposium on HydraulicMachinery and Systems, October 27–31, Foz do Iguassu, 2008.
[4] Powell B, Duggan T, Jeal R. The influence of minor cycles on low cycle fatiguecrack propagation. Int J Fatigue 1982;4(1):4–14.
[5] Byrne J, Hall RF, Powell BE. Influence of LCF overloads on combined HCF/LCFcrack growth. Int J Fatigue 2003;25(9–11):827–34.
[6] Gagnon M, Tahan SA, Bocher P, Thibault D. Impact of startup scheme on francisrunner life expectancy. IOP Conf Ser: Earth Environ Sci 2010;12(1):012107.
[7] Gagnon M, Tahan A, Bocher P, Thibault D. On the stochastic simulation ofhydroelectric turbine blades transient response. Mech Syst Signal Process2012;32:178–87.

8 M. Gagnon et al. / Structural Safety 50 (2014) 1–8
[8] Sabourin M, Thibault D, Bouffard D-A, Levesque M. Hydraulic runner designmethod for lifetime. Int J Fluid Mach Syst 2010;3(4):301–8.
[9] Johannesson P. Extrapolation of load histories and spectra. Fatigue Fract EngMater Struct 2006;29(3):209–17.
[10] Murakami Y. Metal fatigue: effects of small defects and nonmetallicinclusions. Oxford, UK: Elsevier; 2002.
[11] Beretta S, Anderson C, Murakami Y. Extreme value models for the assessmentof steels containing multiple types of inclusion. Acta Mater2006;54(8):2277–89.
[12] Gagnon M, Tahan A, Bocher P, Thibault D. A probabilistic model for the onset ofhigh cycle fatigue (hcf) crack propagation: Application to hydroelectric turbinerunner. Int J Fatigue 2013;47(0):300–7.
[13] Kitagawa H, Takahashi S. Applicability of fracture mechanics to very smallcracks. In: ASM Proceedings of 2nd International Conference on MechanicalBehaviour of Materials, Metalspark, Ohio, 1976. p. 627–31.
[14] Haddad ME, Topper T, Smith K. Prediction of non propagating cracks. Eng FractMech 1979;11(3):573–84.
[15] Lebrun R, Dutfoy A. An innovating analysis of the nataf transformation fromthe copula viewpoint. Prob Eng Mech 2009;24(3):312–20.
[16] Lebrun R, Dutfoy A. Do Rosenblatt and Nataf isoprobabilistic transformationsreally differ? Prob Eng Mech 2009;24(4):577–84.
[17] Rackwitz R. Reliability analysis – a review and some perspectives. Struct Safety2001;23(4):365–95.
[18] Ditlevsen O, Madsen H. Struct Reliab Methods 2007.[19] Gagnon M, Tahan SA, Bocher P, Thibault D. The role of high cycle fatigue (HCF)
onset in Francis runner reliability. IOP Conf Ser: Earth Environ Sci2012;15(2):022005.
[20] Szczota M, Gagnon M, Tahan A, Marcouiller L, Thibault D. Modeling operationhistory of hydroelectric turbines. In: HydroVision International, July 19–22,Sacramento, California, USA, 2011.
[21] Rychlik I. A new definition of the rainflow cycle counting method. Int J Fatigue1987;9(2):119–21.
[22] Pickands III J. Statistical inference using extreme order statistics. Ann Stat1975;3(1):119–31.
[23] Davison AC, Smith RL. Models for exceedances over high thresholds. J Roy StatSoc: Ser B (Methodol) 1990;52(3):393–442.
[24] Coles S. An introduction to statistical modeling of extreme values. SpringerSeries in Statistics. Springer; 2001.
[25] Aven T, Guikema S. Whose uncertainty assessments (probability distributions)does a risk assessment report: the analysts’ or the experts’? Reliab Eng SystSafety 2011;96(10):1257–62.
Copyright © 2022 FDOKUMEN