Influence of land‐use intensity on the spatial distribution of N‐cycling microorganisms in...
12
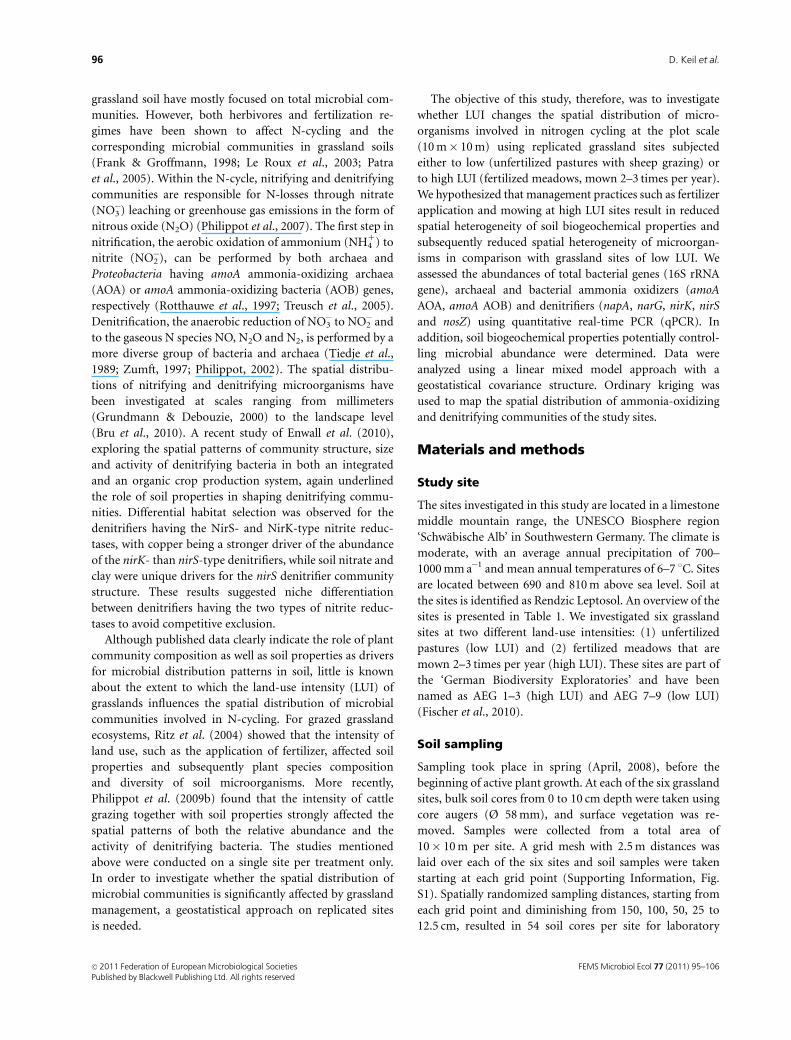
RESEARCH ARTICLE In£uence of land-use intensity on the spatial distribution of N-cycling microorganisms in grassland soils Daniel Keil 1 , Annabel Meyer 2 , Doreen Berner 1 , Christian Poll 1 , Andr ´ e Sch ¨ utzenmeister 3 , Hans-Peter Piepho 3 , Anna Vlasenko 4 , Laurent Philippot 5,6 , Michael Schloter 2,7 , Ellen Kandeler 1 & Sven Marhan 1 1 Institute of Soil Science and Land Evaluation, Soil Biology Section, University of Hohenheim, Stuttgart, Germany; 2 Technical University of Munich, Neuherberg, Germany; 3 Institute of Crop Science, Bioinformatics Unit, University of Hohenheim, Stuttgart, Germany; 4 Faculty of Soil Science, Lomonosov Moscow State University, Leninskie Gory, Moscow, Russia; 5 INRA, UMR 1229, Soil and Environmental Microbiology, Dijon, France; 6 University of Burgundy, UMR 1229, Dijon, France; and 7 Terrestrial Ecogenetics Department, Institute of Terrestrial Ecogenetics, Helmholtz Zentrum M¨ unchen, Neuherberg, Germany Correspondence: Sven Marhan, Institute of Soil Science and Land Evaluation, Soil Biology Section, University of Hohenheim, Emil- Wolff-Strasse 27, 70599 Stuttgart, Germany. Tel.: 149 711 459 22614; fax: 149 711 459 23117; e-mail: [email protected] Received 24 November 2010; revised 28 February 2011; accepted 5 March 2011. Final version published online 15 April 2011. DOI:10.1111/j.1574-6941.2011.01091.x Editor: Riks Laanbroek Keywords grassland; land-use intensity; ammonia oxidizers; denitrifiers; geostatistics. Abstract A geostatistical approach using replicated grassland sites (10 m 10 m) was applied to investigate the influence of grassland management, i.e. unfertilized pastures and fertilized mown meadows representing low and high land-use intensity (LUI), on soil biogeochemical properties and spatial distributions of ammonia-oxidizing and denitrifying microorganisms in soil. Spatial autocorrela- tions of the different N-cycling communities ranged between 1.4 and 7.6 m for ammonia oxidizers and from 0.3 m for nosZ-type denitrifiers to scales 4 14 m for nirK-type denitrifiers. The spatial heterogeneity of ammonia oxidizers and nirS-type denitrifiers increased in high LUI, but decreased for biogeochemical properties, suggesting that biotic and/or abiotic factors other than those measured are driving the spatial distribution of these microorganisms at the plot scale. Furthermore, ammonia oxidizers (amoA ammonia-oxidizing archaea and amoA ammonia-oxidizing bacteria) and nitrate reducers (napA and narG) showed spatial coexistence, whereas niche partitioning was found between nirK- and nirS-type denitrifiers. Together, our results indicate that spatial analysis is a useful tool to characterize the distribution of different functional microbial guilds with respect to soil biogeochemical properties and land-use management. In addition, spatial analyses allowed us to identify distinct distribution ranges indicating the coexistence or niche partitioning of N-cycling communities in grassland soil. Introduction The characterization of spatial patterns of microorganisms in terrestrial ecosystems is important in order to understand the underlying factors and soil properties controlling their distribution and hence their importance in ecosystem func- tions (Ettema & Wardle, 2002). Accordingly, the spatial distribution of microorganisms has been investigated in an increasing number of studies in recent years (e.g. Franklin & Mills, 2003; Becker et al., 2006; Miller et al., 2009; Philippot et al., 2009a, b; Bru et al., 2010; Enwall et al., 2010). The published data are contradictory and depend mainly on the investigated scale. For example Franklin & Mills (2003) postulated that bacterial distribution patterns can be highly structured, even within a habitat that appears to be relatively homogeneous at the plot and field scale. At larger scales, however, Fierer & Jackson (2006) reported microbial biogeography as spatially independent at continental scales. Grassland soils are of special interest in studying the spatial distribution of microbial communities because of the strong relationships between plants and microorganisms (Niklaus et al., 2006; Bremer et al., 2007) and the hetero- geneous influence of grazers on soil properties (Bardgett & Wardle, 2003). Indeed, Ritz et al. (2004) reported that the spatial distribution of microbial communities was influ- enced by soil nutrient status. Similarly, the spatial distribu- tion of several bacterial phyla in a pasture was correlated to soil properties such as pH, soil moisture or ammonium and nitrate concentration (Philippot et al., 2009a). These studies investigating the spatial distribution of microorganisms in FEMS Microbiol Ecol 77 (2011) 95–106 c 2011 Federation of European Microbiological Societies Published by Blackwell Publishing Ltd. All rights reserved MICROBIOLOGY ECOLOGY
-
Upload
nationalagriculturalresearchinra -
Category
Documents
-
view
5 -
download
0
Transcript of Influence of land‐use intensity on the spatial distribution of N‐cycling microorganisms in...
R E S E A R C H A R T I C L E
In£uenceof land-use intensityon the spatial distributionofN-cyclingmicroorganisms ingrassland soilsDaniel Keil1, Annabel Meyer2, Doreen Berner1, Christian Poll1, Andre Schutzenmeister3, Hans-PeterPiepho3, Anna Vlasenko4, Laurent Philippot5,6, Michael Schloter2,7, Ellen Kandeler1 & Sven Marhan1
1Institute of Soil Science and Land Evaluation, Soil Biology Section, University of Hohenheim, Stuttgart, Germany; 2Technical University of Munich,
Neuherberg, Germany; 3Institute of Crop Science, Bioinformatics Unit, University of Hohenheim, Stuttgart, Germany; 4Faculty of Soil Science,
Lomonosov Moscow State University, Leninskie Gory, Moscow, Russia; 5INRA, UMR 1229, Soil and Environmental Microbiology, Dijon, France;6University of Burgundy, UMR 1229, Dijon, France; and 7Terrestrial Ecogenetics Department, Institute of Terrestrial Ecogenetics, Helmholtz Zentrum
Munchen, Neuherberg, Germany
Correspondence: Sven Marhan, Institute of
Soil Science and Land Evaluation, Soil Biology
Section, University of Hohenheim, Emil-
Wolff-Strasse 27, 70599 Stuttgart, Germany.
Tel.: 149 711 459 22614;
fax: 149 711 459 23117;
e-mail: [email protected]
Received 24 November 2010; revised 28
February 2011; accepted 5 March 2011.
Final version published online 15 April 2011.
DOI:10.1111/j.1574-6941.2011.01091.x
Editor: Riks Laanbroek
Keywords
grassland; land-use intensity; ammonia
oxidizers; denitrifiers; geostatistics.
Abstract
A geostatistical approach using replicated grassland sites (10 m� 10 m) was
applied to investigate the influence of grassland management, i.e. unfertilized
pastures and fertilized mown meadows representing low and high land-use
intensity (LUI), on soil biogeochemical properties and spatial distributions of
ammonia-oxidizing and denitrifying microorganisms in soil. Spatial autocorrela-
tions of the different N-cycling communities ranged between 1.4 and 7.6 m for
ammonia oxidizers and from 0.3 m for nosZ-type denitrifiers to scales 4 14 m
for nirK-type denitrifiers. The spatial heterogeneity of ammonia oxidizers and
nirS-type denitrifiers increased in high LUI, but decreased for biogeochemical
properties, suggesting that biotic and/or abiotic factors other than those measured
are driving the spatial distribution of these microorganisms at the plot scale.
Furthermore, ammonia oxidizers (amoA ammonia-oxidizing archaea and amoA
ammonia-oxidizing bacteria) and nitrate reducers (napA and narG) showed spatial
coexistence, whereas niche partitioning was found between nirK- and nirS-type
denitrifiers. Together, our results indicate that spatial analysis is a useful tool to
characterize the distribution of different functional microbial guilds with respect
to soil biogeochemical properties and land-use management. In addition,
spatial analyses allowed us to identify distinct distribution ranges indicating the
coexistence or niche partitioning of N-cycling communities in grassland soil.
Introduction
The characterization of spatial patterns of microorganisms
in terrestrial ecosystems is important in order to understand
the underlying factors and soil properties controlling their
distribution and hence their importance in ecosystem func-
tions (Ettema & Wardle, 2002). Accordingly, the spatial
distribution of microorganisms has been investigated in an
increasing number of studies in recent years (e.g. Franklin &
Mills, 2003; Becker et al., 2006; Miller et al., 2009; Philippot
et al., 2009a, b; Bru et al., 2010; Enwall et al., 2010).
The published data are contradictory and depend mainly
on the investigated scale. For example Franklin & Mills
(2003) postulated that bacterial distribution patterns can be
highly structured, even within a habitat that appears to be
relatively homogeneous at the plot and field scale. At larger
scales, however, Fierer & Jackson (2006) reported microbial
biogeography as spatially independent at continental scales.
Grassland soils are of special interest in studying the
spatial distribution of microbial communities because of
the strong relationships between plants and microorganisms
(Niklaus et al., 2006; Bremer et al., 2007) and the hetero-
geneous influence of grazers on soil properties (Bardgett &
Wardle, 2003). Indeed, Ritz et al. (2004) reported that the
spatial distribution of microbial communities was influ-
enced by soil nutrient status. Similarly, the spatial distribu-
tion of several bacterial phyla in a pasture was correlated to
soil properties such as pH, soil moisture or ammonium and
nitrate concentration (Philippot et al., 2009a). These studies
investigating the spatial distribution of microorganisms in
FEMS Microbiol Ecol 77 (2011) 95–106 c� 2011 Federation of European Microbiological SocietiesPublished by Blackwell Publishing Ltd. All rights reserved
MIC
ROBI
OLO
GY
EC
OLO
GY
grassland soil have mostly focused on total microbial com-
munities. However, both herbivores and fertilization re-
gimes have been shown to affect N-cycling and the
corresponding microbial communities in grassland soils
(Frank & Groffmann, 1998; Le Roux et al., 2003; Patra
et al., 2005). Within the N-cycle, nitrifying and denitrifying
communities are responsible for N-losses through nitrate
(NO3�) leaching or greenhouse gas emissions in the form of
nitrous oxide (N2O) (Philippot et al., 2007). The first step in
nitrification, the aerobic oxidation of ammonium (NH41) to
nitrite (NO2�), can be performed by both archaea and
Proteobacteria having amoA ammonia-oxidizing archaea
(AOA) or amoA ammonia-oxidizing bacteria (AOB) genes,
respectively (Rotthauwe et al., 1997; Treusch et al., 2005).
Denitrification, the anaerobic reduction of NO3� to NO2
� and
to the gaseous N species NO, N2O and N2, is performed by a
more diverse group of bacteria and archaea (Tiedje et al.,
1989; Zumft, 1997; Philippot, 2002). The spatial distribu-
tions of nitrifying and denitrifying microorganisms have
been investigated at scales ranging from millimeters
(Grundmann & Debouzie, 2000) to the landscape level
(Bru et al., 2010). A recent study of Enwall et al. (2010),
exploring the spatial patterns of community structure, size
and activity of denitrifying bacteria in both an integrated
and an organic crop production system, again underlined
the role of soil properties in shaping denitrifying commu-
nities. Differential habitat selection was observed for the
denitrifiers having the NirS- and NirK-type nitrite reduc-
tases, with copper being a stronger driver of the abundance
of the nirK- than nirS-type denitrifiers, while soil nitrate and
clay were unique drivers for the nirS denitrifier community
structure. These results suggested niche differentiation
between denitrifiers having the two types of nitrite reduc-
tases to avoid competitive exclusion.
Although published data clearly indicate the role of plant
community composition as well as soil properties as drivers
for microbial distribution patterns in soil, little is known
about the extent to which the land-use intensity (LUI) of
grasslands influences the spatial distribution of microbial
communities involved in N-cycling. For grazed grassland
ecosystems, Ritz et al. (2004) showed that the intensity of
land use, such as the application of fertilizer, affected soil
properties and subsequently plant species composition
and diversity of soil microorganisms. More recently,
Philippot et al. (2009b) found that the intensity of cattle
grazing together with soil properties strongly affected the
spatial patterns of both the relative abundance and the
activity of denitrifying bacteria. The studies mentioned
above were conducted on a single site per treatment only.
In order to investigate whether the spatial distribution of
microbial communities is significantly affected by grassland
management, a geostatistical approach on replicated sites
is needed.
The objective of this study, therefore, was to investigate
whether LUI changes the spatial distribution of micro-
organisms involved in nitrogen cycling at the plot scale
(10 m� 10 m) using replicated grassland sites subjected
either to low (unfertilized pastures with sheep grazing) or
to high LUI (fertilized meadows, mown 2–3 times per year).
We hypothesized that management practices such as fertilizer
application and mowing at high LUI sites result in reduced
spatial heterogeneity of soil biogeochemical properties and
subsequently reduced spatial heterogeneity of microorgan-
isms in comparison with grassland sites of low LUI. We
assessed the abundances of total bacterial genes (16S rRNA
gene), archaeal and bacterial ammonia oxidizers (amoA
AOA, amoA AOB) and denitrifiers (napA, narG, nirK, nirS
and nosZ) using quantitative real-time PCR (qPCR). In
addition, soil biogeochemical properties potentially control-
ling microbial abundance were determined. Data were
analyzed using a linear mixed model approach with a
geostatistical covariance structure. Ordinary kriging was
used to map the spatial distribution of ammonia-oxidizing
and denitrifying communities of the study sites.
Materials and methods
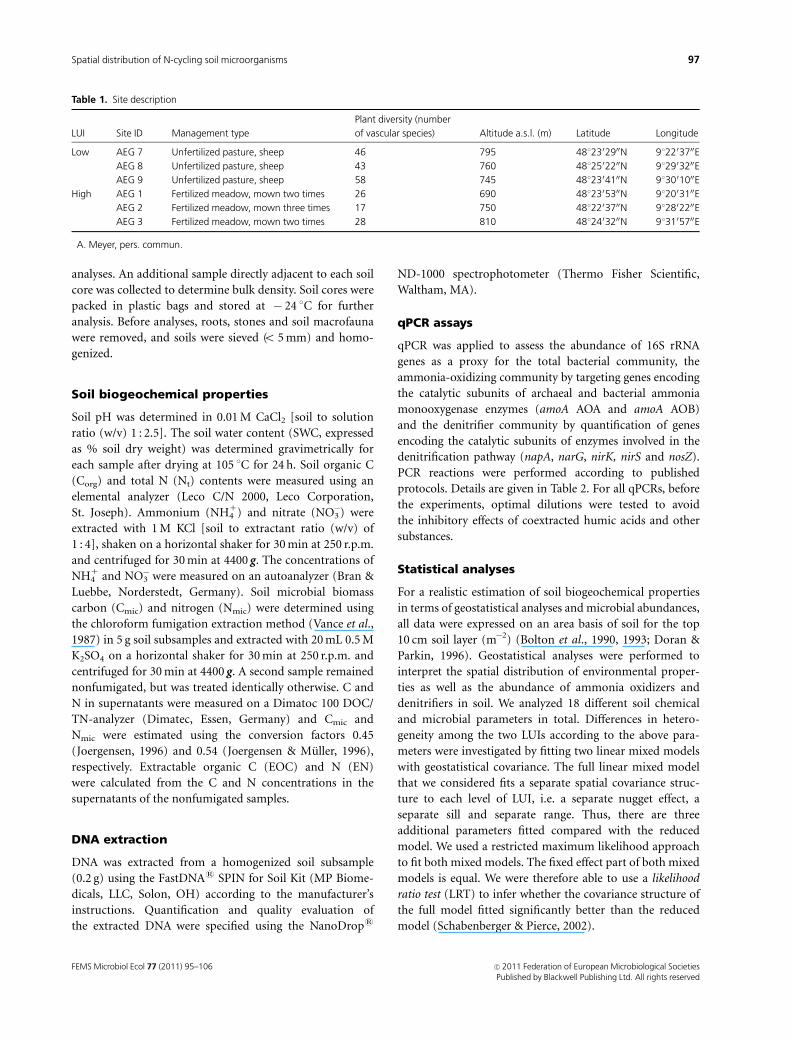
Study site
The sites investigated in this study are located in a limestone
middle mountain range, the UNESCO Biosphere region
‘Schwabische Alb’ in Southwestern Germany. The climate is
moderate, with an average annual precipitation of 700–
1000 mm a�1 and mean annual temperatures of 6–7 1C. Sites
are located between 690 and 810 m above sea level. Soil at
the sites is identified as Rendzic Leptosol. An overview of the
sites is presented in Table 1. We investigated six grassland
sites at two different land-use intensities: (1) unfertilized
pastures (low LUI) and (2) fertilized meadows that are
mown 2–3 times per year (high LUI). These sites are part of
the ‘German Biodiversity Exploratories’ and have been
named as AEG 1–3 (high LUI) and AEG 7–9 (low LUI)
(Fischer et al., 2010).
Soil sampling
Sampling took place in spring (April, 2008), before the
beginning of active plant growth. At each of the six grassland
sites, bulk soil cores from 0 to 10 cm depth were taken using
core augers (Ø 58 mm), and surface vegetation was re-
moved. Samples were collected from a total area of
10� 10 m per site. A grid mesh with 2.5 m distances was
laid over each of the six sites and soil samples were taken
starting at each grid point (Supporting Information, Fig.
S1). Spatially randomized sampling distances, starting from
each grid point and diminishing from 150, 100, 50, 25 to
12.5 cm, resulted in 54 soil cores per site for laboratory
FEMS Microbiol Ecol 77 (2011) 95–106c� 2011 Federation of European Microbiological SocietiesPublished by Blackwell Publishing Ltd. All rights reserved
96 D. Keil et al.
analyses. An additional sample directly adjacent to each soil
core was collected to determine bulk density. Soil cores were
packed in plastic bags and stored at � 24 1C for further
analysis. Before analyses, roots, stones and soil macrofauna
were removed, and soils were sieved (o 5 mm) and homo-
genized.
Soil biogeochemical properties
Soil pH was determined in 0.01 M CaCl2 [soil to solution
ratio (w/v) 1 : 2.5]. The soil water content (SWC, expressed
as % soil dry weight) was determined gravimetrically for
each sample after drying at 105 1C for 24 h. Soil organic C
(Corg) and total N (Nt) contents were measured using an
elemental analyzer (Leco C/N 2000, Leco Corporation,
St. Joseph). Ammonium (NH41) and nitrate (NO3
�) were
extracted with 1 M KCl [soil to extractant ratio (w/v) of
1 : 4], shaken on a horizontal shaker for 30 min at 250 r.p.m.
and centrifuged for 30 min at 4400 g. The concentrations of
NH41 and NO3
� were measured on an autoanalyzer (Bran &
Luebbe, Norderstedt, Germany). Soil microbial biomass
carbon (Cmic) and nitrogen (Nmic) were determined using
the chloroform fumigation extraction method (Vance et al.,
1987) in 5 g soil subsamples and extracted with 20 mL 0.5 M
K2SO4 on a horizontal shaker for 30 min at 250 r.p.m. and
centrifuged for 30 min at 4400 g. A second sample remained
nonfumigated, but was treated identically otherwise. C and
N in supernatants were measured on a Dimatoc 100 DOC/
TN-analyzer (Dimatec, Essen, Germany) and Cmic and
Nmic were estimated using the conversion factors 0.45
(Joergensen, 1996) and 0.54 (Joergensen & Muller, 1996),
respectively. Extractable organic C (EOC) and N (EN)
were calculated from the C and N concentrations in the
supernatants of the nonfumigated samples.
DNA extraction
DNA was extracted from a homogenized soil subsample
(0.2 g) using the FastDNAs SPIN for Soil Kit (MP Biome-
dicals, LLC, Solon, OH) according to the manufacturer’s
instructions. Quantification and quality evaluation of
the extracted DNA were specified using the NanoDrops
ND-1000 spectrophotometer (Thermo Fisher Scientific,
Waltham, MA).
qPCR assays
qPCR was applied to assess the abundance of 16S rRNA
genes as a proxy for the total bacterial community, the
ammonia-oxidizing community by targeting genes encoding
the catalytic subunits of archaeal and bacterial ammonia
monooxygenase enzymes (amoA AOA and amoA AOB)
and the denitrifier community by quantification of genes
encoding the catalytic subunits of enzymes involved in the
denitrification pathway (napA, narG, nirK, nirS and nosZ).
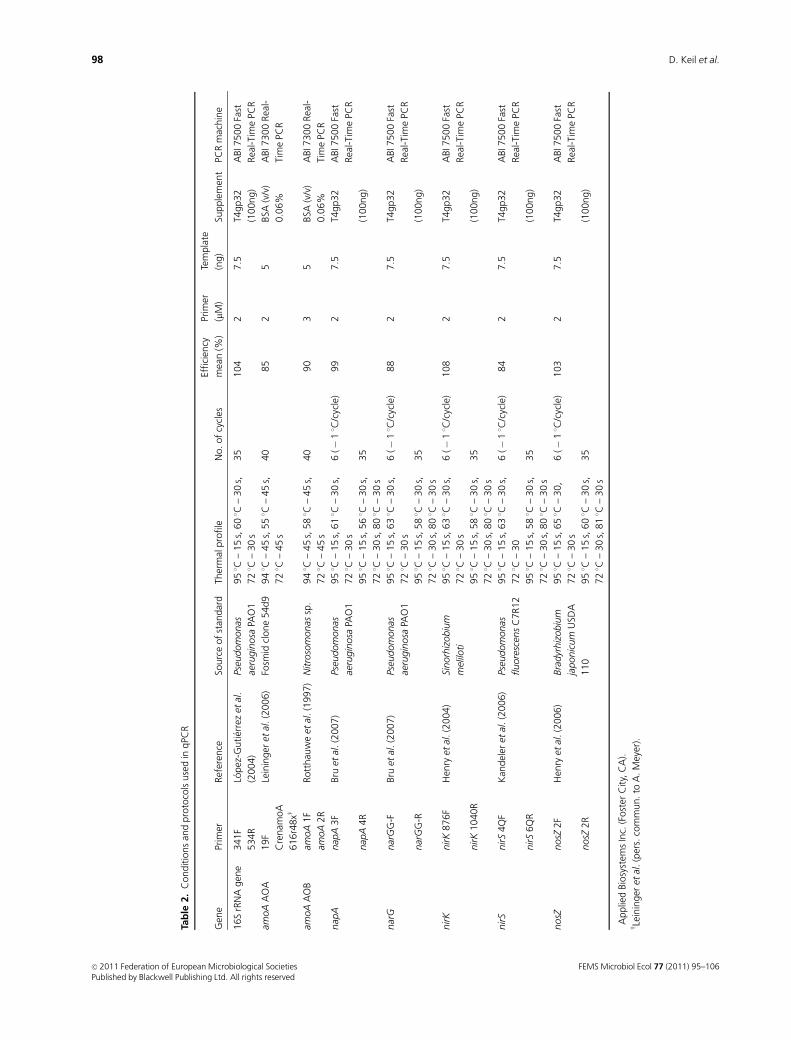
PCR reactions were performed according to published
protocols. Details are given in Table 2. For all qPCRs, before
the experiments, optimal dilutions were tested to avoid
the inhibitory effects of coextracted humic acids and other
substances.
Statistical analyses
For a realistic estimation of soil biogeochemical properties
in terms of geostatistical analyses and microbial abundances,
all data were expressed on an area basis of soil for the top
10 cm soil layer (m�2) (Bolton et al., 1990, 1993; Doran &
Parkin, 1996). Geostatistical analyses were performed to
interpret the spatial distribution of environmental proper-
ties as well as the abundance of ammonia oxidizers and
denitrifiers in soil. We analyzed 18 different soil chemical
and microbial parameters in total. Differences in hetero-
geneity among the two LUIs according to the above para-
meters were investigated by fitting two linear mixed models
with geostatistical covariance. The full linear mixed model
that we considered fits a separate spatial covariance struc-
ture to each level of LUI, i.e. a separate nugget effect, a
separate sill and separate range. Thus, there are three
additional parameters fitted compared with the reduced
model. We used a restricted maximum likelihood approach
to fit both mixed models. The fixed effect part of both mixed
models is equal. We were therefore able to use a likelihood
ratio test (LRT) to infer whether the covariance structure of
the full model fitted significantly better than the reduced
model (Schabenberger & Pierce, 2002).
Table 1. Site description
LUI Site ID Management type
Plant diversity (number
of vascular species)� Altitude a.s.l. (m) Latitude Longitude
Low AEG 7 Unfertilized pasture, sheep 46 795 4812302900N 912203700E
AEG 8 Unfertilized pasture, sheep 43 760 4812502200N 912903200E
AEG 9 Unfertilized pasture, sheep 58 745 4812304100N 913001000E
High AEG 1 Fertilized meadow, mown two times 26 690 4812305300N 912003100E
AEG 2 Fertilized meadow, mown three times 17 750 4812203700N 912802200E
AEG 3 Fertilized meadow, mown two times 28 810 4812403200N 913105700E
�A. Meyer, pers. commun.
FEMS Microbiol Ecol 77 (2011) 95–106 c� 2011 Federation of European Microbiological SocietiesPublished by Blackwell Publishing Ltd. All rights reserved
97Spatial distribution of N-cycling soil microorganisms
Tab
le2.
Conditio
ns
and
pro
toco
lsuse
din
qPC
R
Gen
ePr
imer
Ref
eren
ceSo
urc
eof
stan
dar
dTh
erm
alpro
file
No.of
cycl
es
Effici
ency
mea
n(%
)
Prim
er
(mM
)
Tem
pla
te
(ng)
Supple
men
tPC
Rm
achin
e�
16S
rRN
Agen
e341F
Lopez
-Gutier
rez
etal
.
(2004)
Pseu
dom
onas
951C
–15
s,601C
–30
s,
721C
–30
s
35
104
27.5
T4gp32
ABI7
500
Fast
Rea
l-Tim
ePC
R534R
aeru
gin
osa
PAO
1(1
00ng)
amoA
AO
A19F
Lein
inger
etal
.(2
006)
Fosm
idcl
one
54d9
941C
–45
s,551C
–45
s,
721C
–45
s
40
85
25
BSA
(v/v
)A
BI7
300
Rea
l-
Tim
ePC
RC
renam
oA
0.0
6%
616r4
8xw
amoA
AO
Bam
oA
1F
Rott
hau
we
etal
.(1
997)
Nitro
som
onas
sp.
941C
–45
s,581C
–45
s,
721C
–45
s
40
90
35
BSA
(v/v
)A
BI7
300
Rea
l-
Tim
ePC
Ram
oA
2R
0.0
6%
nap
Anap
A3F
Bru
etal
.(2
007)
Pseu
dom
onas
aeru
gin
osa
PAO
1
951C
–15
s,611C
–30
s,
721C
–30
s
6(�
11C
/cyc
le)
99
27.5
T4gp32
ABI7
500
Fast
Rea
l-Tim
ePC
R
nap
A4R
951C
–15
s,561C
–30
s,
721C
–30
s,801C
–30
s
35
(100ng)
nar
Gnar
GG
-FBru
etal
.(2
007)
Pseu
dom
onas
aeru
gin
osa
PAO
1
951C
–15
s,631C
–30
s,
721C
–30
s
6(�
11C
/cyc
le)
88
27.5
T4gp32
ABI7
500
Fast
Rea
l-Tim
ePC
R
nar
GG
-R951C
–15
s,581C
–30
s,
721C
–30
s,801C
–30
s
35
(100ng)
nirK
nirK
876F
Hen
ryet
al.(2
004)
Sinorh
izobiu
m
mel
iloti
951C
–15
s,631C
–30
s,
721C
–30
s
6( �
11C
/cyc
le)
108
27.5
T4gp32
ABI7
500
Fast
Rea
l-Tim
ePC
R
nirK
1040R
951C
–15
s,581C
–30
s,
721C
–30
s,801C
–30
s
35
(100ng)
nirS
nirS
4Q
FK
andel
eret
al.(2
006)
Pseu
dom
onas
fluore
scen
sC
7R12
951C
–15
s,631C
–30
s,
721C
–30
6(�
11C
/cyc
le)
84
27.5
T4gp32
ABI7
500
Fast
Rea
l-Tim
ePC
R
nirS
6Q
R951C
–15
s,581C
–30
s,
721C
–30
s,801C
–30
s
35
(100ng)
nosZ
nosZ
2F
Hen
ryet
al.(2
006)
Bra
dyr
hiz
obiu
m
japonic
um
USD
A
110
951C
–15
s,651C
–30,
721C
–30
s
6(�
11C
/cyc
le)
103
27.5
T4gp32
ABI7
500
Fast
Rea
l-Tim
ePC
R
nosZ
2R
951C
–15
s,601C
–30
s,
721C
–30
s,811C
–30
s
35
(100ng)
� Applie
dBio
syst
ems
Inc.
(Fost
erC
ity,
CA
).w Le
inin
ger
etal
.(p
ers.
com
mun.to
A.M
eyer
).
FEMS Microbiol Ecol 77 (2011) 95–106c� 2011 Federation of European Microbiological SocietiesPublished by Blackwell Publishing Ltd. All rights reserved
98 D. Keil et al.
The linear mixed model for one specific variable can be
written as:
yijk ¼ di þ pij þ tijk þ eijk; ð1Þ
where yijk represents the kth measurement of a soil sample
coming from the jth grassland site, which was managed at
the ith intensity class. The term di references the ith fixed
effect for treatment (LUI), pij represents the ijth random plot
effect, which is distributed as pij � Nð0; s2pÞ, tijk is the spatial
trend effect, and the residual errors terms eijk are distributed
as eijk � Nð0; s2RÞ. In spatial modeling, the error variance dR
2
is usually denoted as a nugget effect. The spatial trend effect
tijk is used to model the covariance of each pair of observa-
tions (m, n) with locations (xm, ym) and (xn, yn) depending
on their separation distance
h ¼ffiffiffiffiffiffiffiffiffiffiffiffiffiffiffiffiffiffiffiffiffiffiffiffiffiffiffiffiffiffiffiffiffiffiffiffiffiffiffiffiffiffiffiffiffiffiffiðxm � xnÞ2 þ ðym � ynÞ2
q: ð2Þ
The covariance function can be written as
CðhÞ ¼ s2V � rðhÞ; ð3Þ
where sV2 denotes the variance parameter, which is usually
called the sill or the scale parameter, and r(h) corresponds
to the correlation function, which determines the spatial
dependency among observations as a function of distance h.
We considered the Gaussian, exponential and spherical
models (Schabenberger & Pierce, 2002) and confined the
analysis to that spatial model for which we obtained the
best-fitting full model.
We used the statistical software SAS version 9.2, specifically
the MIXED procedure, to fit both models for each variable.
The resulting P-values for the LRT were adjusted for multi-
ple testing using the Bonferroni-correction method, which
controls the family-wise error rate. It is rather conservative,
i.e. differences have to be greater in order to be declared
significant (SAS Institute Inc., 1999).
The sampling locations were randomly chosen and revealed
a rather coarse picture of the existing conditions regarding a
specific variable. In order to smooth the data, we used the
covariance parameter estimates obtained from fitting the
linear mixed models, and used them as parameters for an
ordinary kriging (OK) procedure (PROC KRIGE2D of the SAS
system), which yielded estimates of yijk� eijk.
This procedure is equivalent to the best linear unbiased
prediction of the same quantity based on mixed model (1)
(Robinson, 1991). We used KRIGE2D instead of the MIXED
procedure for kriging because of computational speed. The
spatial covariance model determines the way in which
optimal weights are calculated for kriging (Isaaks & Srivas-
tava, 1989). Spatial dependence and autocorrelation were
described by a distinct set of spatial parameters that were
estimated for each LUI when the model was able to separate
between the two LUI. The ratio of partial sill to total sill
(p-Sill/Sill) was expressed as percentage and used to classify
spatial dependence. A ratio of o 25% indicated weak spatial
dependence, 25–75% indicated moderate spatial depen-
dence and 4 75% indicated strong spatial dependence
(Cambardella et al., 1994). The practical range (p-Range) is
expressed in meters and was used as an indicator for the
scale of spatial autocorrelation, i.e. high spatial autocorrela-
tions indicate reduced spatial heterogeneity of a certain
property at the investigated scale.
Spearman correlations were calculated including both
LUIs and separately for low and high LUI to determine
pairwise relationships between the parameters. The resulting
P-values were adjusted for multiple testing using the
Bonferroni-correction method as described for the LRT.
Both correlation analysis and plotting of kriged maps were
performed using the software R (R Development Core Team,
2008), version 2.9.1. To test differences between the two LUI,
one-way ANOVA were performed for soil biogeochemical
properties and gene abundances with the fixed factor ‘LUI’
using STATISTICA 6.0 (StatSoft Inc., Tulsa, OK). Transforma-
tion of data has been carried out with appropriate means to
meet the requirements of a normal distribution and homo-
geneity of variance if required.
Results
Soil biogeochemical properties
The average values of soil biogeochemical properties for
each plot are given in Table S1. Bulk densities ranged from
0.64 to 0.83 g soil dry weight cm�3, with both minimum and
maximum values found in low LUI sites, and soil pH values
ranged from 6.4 to 7.1. SWC did not significantly differ
between low and high LUI (P = 0.878). Neither bulk density
nor pH differed significantly between the two LUI. In high
LUI, total nitrogen tended to be higher (P = 0.088) and NO3�
amounts were significantly higher (P = 0.023), while Cmic
was significantly higher (P = 0.029) and Nmic tended to be
higher (P = 0.081) in the high LUI sites.
Abundances of total bacteria, ammoniaoxidizers and denitrifiers
Bacterial 16S rRNA gene copy numbers, which were used
as a proxy for estimating the number of total bacteria,
ranged between 5.8� 1015 and 1.7� 1016 copies m�2 (Fig.
1) (equivalent to 9.5� 109 and 2.1� 1010 copies g�1 dry soil,
Table S2). Comparison of the abundance of total bacteria
between LUIs using the data expressed on an area basis did
not show any significant differences (Fig. 1). In contrast,
AOA had a significantly higher abundance (P = 0.022) in the
high LUI sites (Fig. 1). The same trend was observed for
AOB, but the difference was not significant (P = 0.065).
Among the denitrification genes, LUI had a significant effect
FEMS Microbiol Ecol 77 (2011) 95–106 c� 2011 Federation of European Microbiological SocietiesPublished by Blackwell Publishing Ltd. All rights reserved
99Spatial distribution of N-cycling soil microorganisms
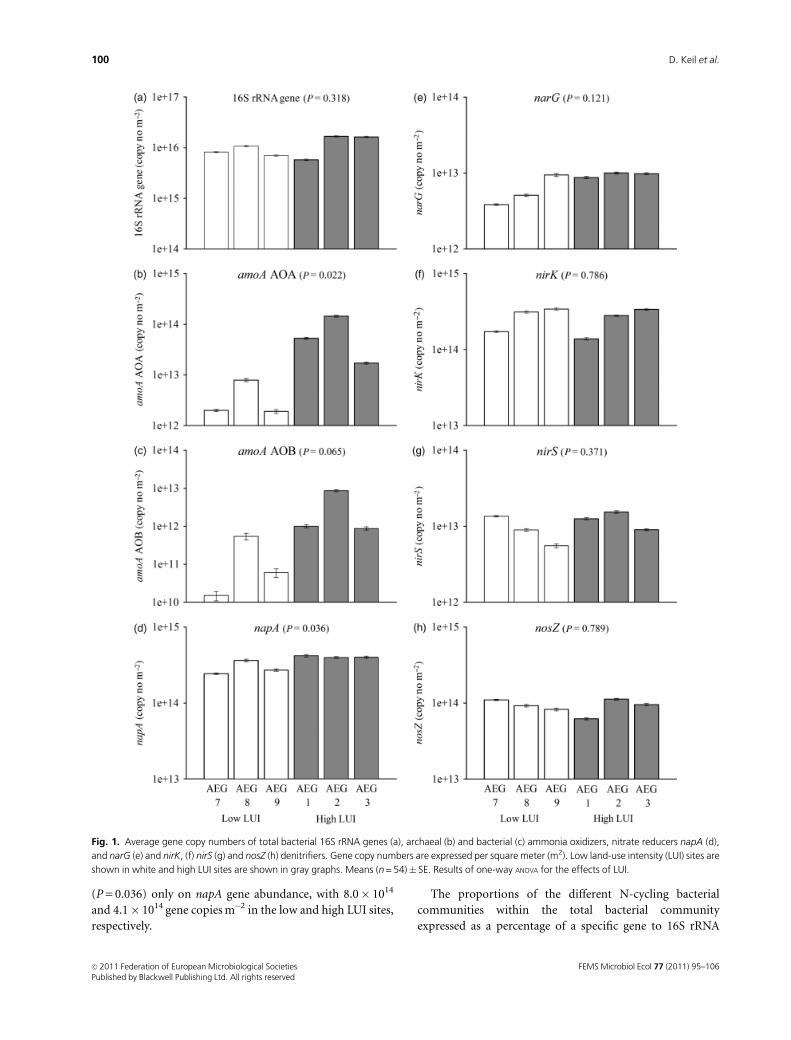
(P = 0.036) only on napA gene abundance, with 8.0� 1014
and 4.1� 1014 gene copies m�2 in the low and high LUI sites,
respectively.
The proportions of the different N-cycling bacterial
communities within the total bacterial community
expressed as a percentage of a specific gene to 16S rRNA
Fig. 1. Average gene copy numbers of total bacterial 16S rRNA genes (a), archaeal (b) and bacterial (c) ammonia oxidizers, nitrate reducers napA (d),
and narG (e) and nirK, (f) nirS (g) and nosZ (h) denitrifiers. Gene copy numbers are expressed per square meter (m2). Low land-use intensity (LUI) sites are
shown in white and high LUI sites are shown in gray graphs. Means (n = 54)� SE. Results of one-way ANOVA for the effects of LUI.
FEMS Microbiol Ecol 77 (2011) 95–106c� 2011 Federation of European Microbiological SocietiesPublished by Blackwell Publishing Ltd. All rights reserved
100 D. Keil et al.
gene copy numbers did not show significant differences
between LUIs (data not shown).
Spatial distribution of biogeochemicalproperties and N-cycling communities
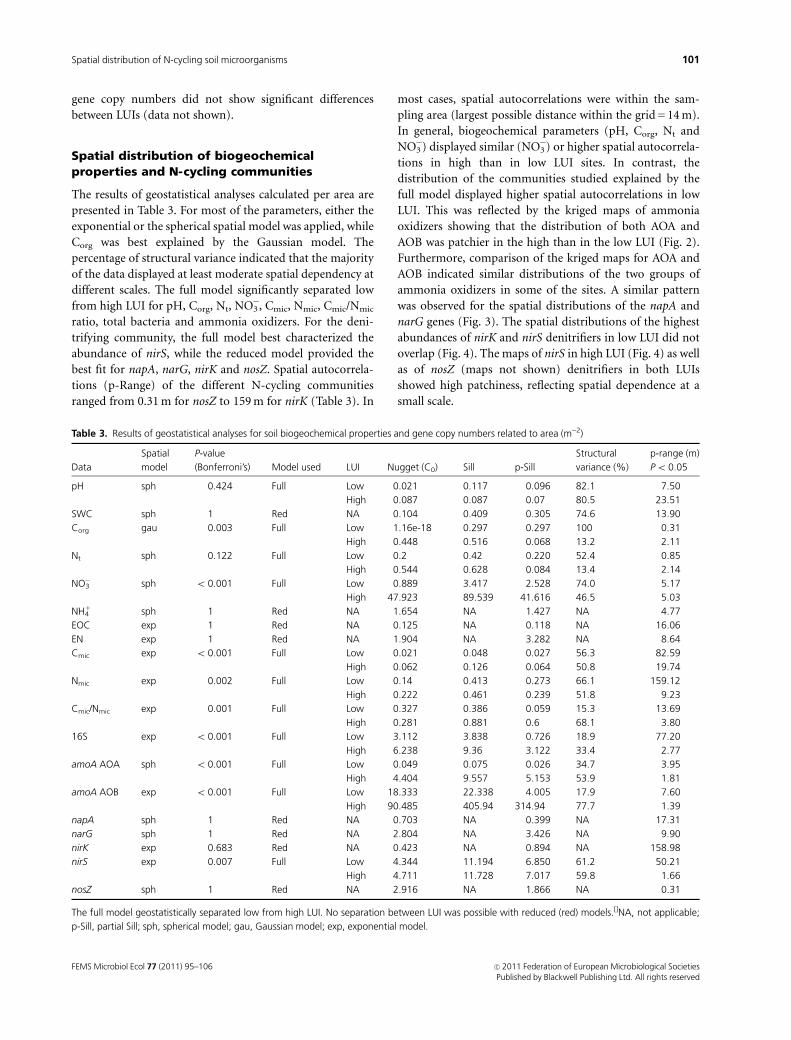
The results of geostatistical analyses calculated per area are
presented in Table 3. For most of the parameters, either the
exponential or the spherical spatial model was applied, while
Corg was best explained by the Gaussian model. The
percentage of structural variance indicated that the majority
of the data displayed at least moderate spatial dependency at
different scales. The full model significantly separated low
from high LUI for pH, Corg, Nt, NO3�, Cmic, Nmic, Cmic/Nmic
ratio, total bacteria and ammonia oxidizers. For the deni-
trifying community, the full model best characterized the
abundance of nirS, while the reduced model provided the
best fit for napA, narG, nirK and nosZ. Spatial autocorrela-
tions (p-Range) of the different N-cycling communities
ranged from 0.31 m for nosZ to 159 m for nirK (Table 3). In
most cases, spatial autocorrelations were within the sam-
pling area (largest possible distance within the grid = 14 m).
In general, biogeochemical parameters (pH, Corg, Nt and
NO3�) displayed similar (NO3
�) or higher spatial autocorrela-
tions in high than in low LUI sites. In contrast, the
distribution of the communities studied explained by the
full model displayed higher spatial autocorrelations in low
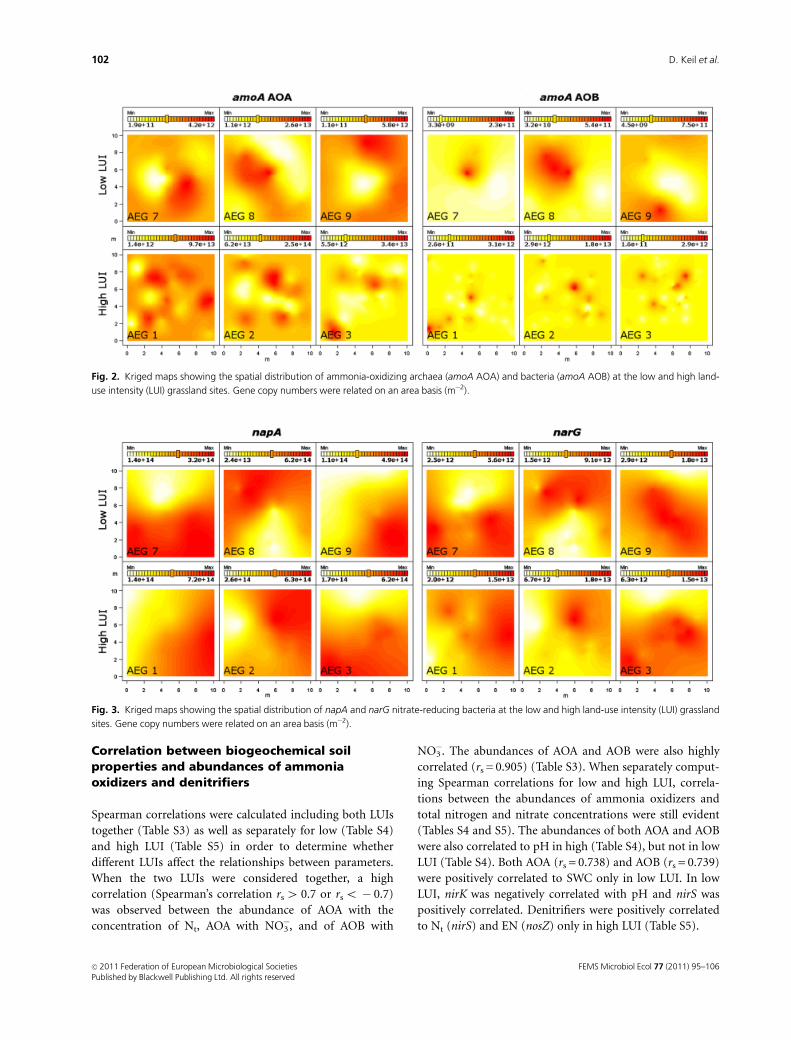
LUI. This was reflected by the kriged maps of ammonia
oxidizers showing that the distribution of both AOA and
AOB was patchier in the high than in the low LUI (Fig. 2).
Furthermore, comparison of the kriged maps for AOA and
AOB indicated similar distributions of the two groups of
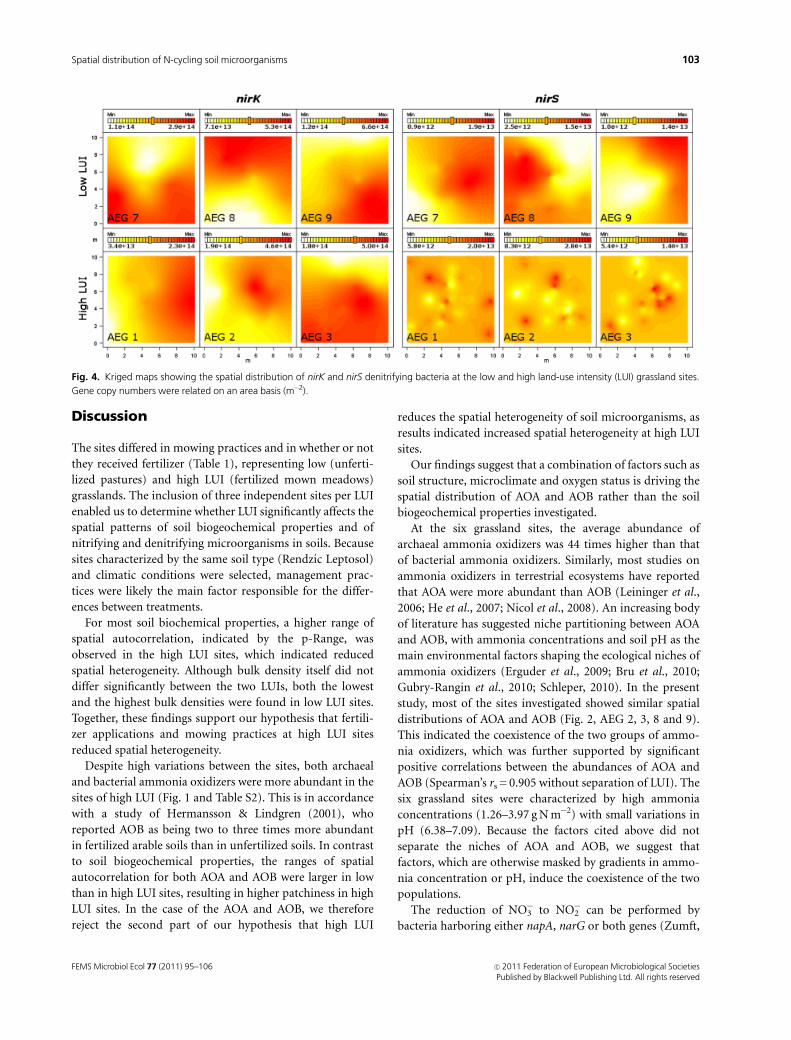
ammonia oxidizers in some of the sites. A similar pattern
was observed for the spatial distributions of the napA and
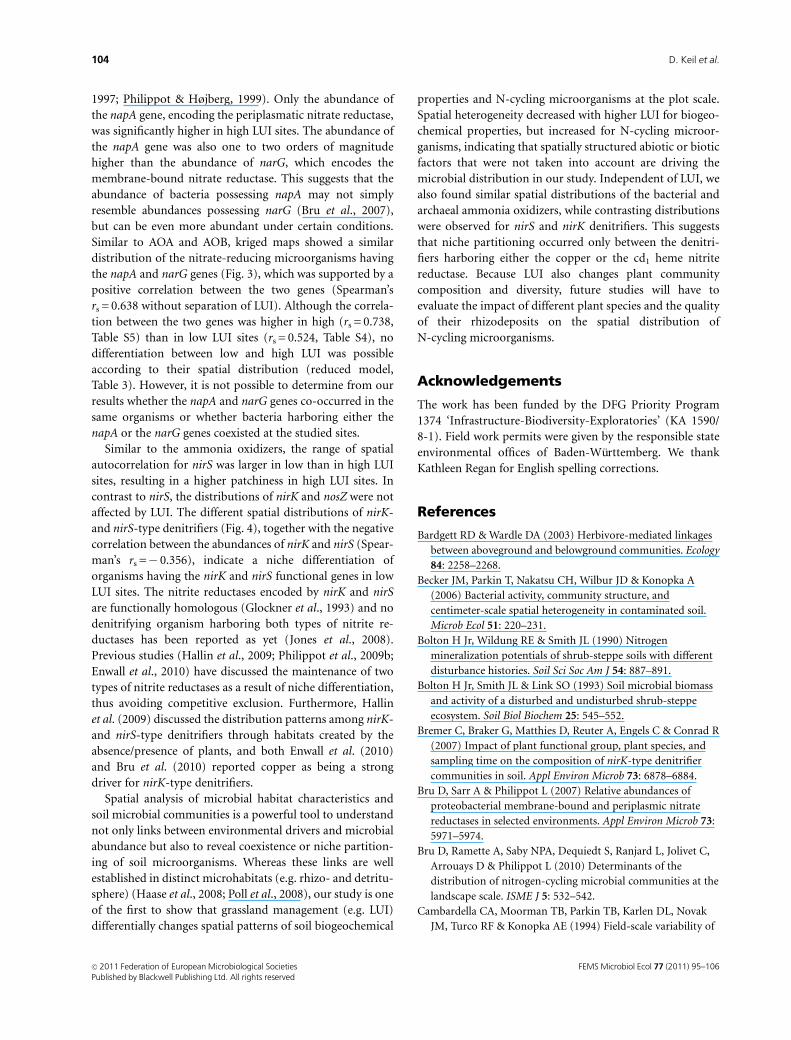
narG genes (Fig. 3). The spatial distributions of the highest
abundances of nirK and nirS denitrifiers in low LUI did not
overlap (Fig. 4). The maps of nirS in high LUI (Fig. 4) as well
as of nosZ (maps not shown) denitrifiers in both LUIs
showed high patchiness, reflecting spatial dependence at a
small scale.
Table 3. Results of geostatistical analyses for soil biogeochemical properties and gene copy numbers related to area (m�2)
Data
Spatial
model
P-value
(Bonferroni’s) Model used LUI Nugget (C0) Sill p-Sill
Structural
variance (%)
p-range (m)
Po 0.05
pH sph 0.424 Full Low 0.021 0.117 0.096 82.1 7.50
High 0.087 0.087 0.07 80.5 23.51
SWC sph 1 Red NA 0.104 0.409 0.305 74.6 13.90
Corg gau 0.003 Full Low 1.16e-18 0.297 0.297 100 0.31
High 0.448 0.516 0.068 13.2 2.11
Nt sph 0.122 Full Low 0.2 0.42 0.220 52.4 0.85
High 0.544 0.628 0.084 13.4 2.14
NO3� sph o 0.001 Full Low 0.889 3.417 2.528 74.0 5.17
High 47.923 89.539 41.616 46.5 5.03
NH41 sph 1 Red NA 1.654 NA 1.427 NA 4.77
EOC exp 1 Red NA 0.125 NA 0.118 NA 16.06
EN exp 1 Red NA 1.904 NA 3.282 NA 8.64
Cmic exp o 0.001 Full Low 0.021 0.048 0.027 56.3 82.59
High 0.062 0.126 0.064 50.8 19.74
Nmic exp 0.002 Full Low 0.14 0.413 0.273 66.1 159.12
High 0.222 0.461 0.239 51.8 9.23
Cmic/Nmic exp 0.001 Full Low 0.327 0.386 0.059 15.3 13.69
High 0.281 0.881 0.6 68.1 3.80
16S exp o 0.001 Full Low 3.112 3.838 0.726 18.9 77.20
High 6.238 9.36 3.122 33.4 2.77
amoA AOA sph o 0.001 Full Low 0.049 0.075 0.026 34.7 3.95
High 4.404 9.557 5.153 53.9 1.81
amoA AOB exp o 0.001 Full Low 18.333 22.338 4.005 17.9 7.60
High 90.485 405.94 314.94 77.7 1.39
napA sph 1 Red NA 0.703 NA 0.399 NA 17.31
narG sph 1 Red NA 2.804 NA 3.426 NA 9.90
nirK exp 0.683 Red NA 0.423 NA 0.894 NA 158.98
nirS exp 0.007 Full Low 4.344 11.194 6.850 61.2 50.21
High 4.711 11.728 7.017 59.8 1.66
nosZ sph 1 Red NA 2.916 NA 1.866 NA 0.31
The full model geostatistically separated low from high LUI. No separation between LUI was possible with reduced (red) models.[]NA, not applicable;
p-Sill, partial Sill; sph, spherical model; gau, Gaussian model; exp, exponential model.
FEMS Microbiol Ecol 77 (2011) 95–106 c� 2011 Federation of European Microbiological SocietiesPublished by Blackwell Publishing Ltd. All rights reserved
101Spatial distribution of N-cycling soil microorganisms
Correlation between biogeochemical soilproperties and abundances of ammoniaoxidizers and denitrifiers
Spearman correlations were calculated including both LUIs
together (Table S3) as well as separately for low (Table S4)
and high LUI (Table S5) in order to determine whether
different LUIs affect the relationships between parameters.
When the two LUIs were considered together, a high
correlation (Spearman’s correlation rs4 0.7 or rso � 0.7)
was observed between the abundance of AOA with the
concentration of Nt, AOA with NO3�, and of AOB with
NO3�. The abundances of AOA and AOB were also highly
correlated (rs = 0.905) (Table S3). When separately comput-
ing Spearman correlations for low and high LUI, correla-
tions between the abundances of ammonia oxidizers and
total nitrogen and nitrate concentrations were still evident
(Tables S4 and S5). The abundances of both AOA and AOB
were also correlated to pH in high (Table S4), but not in low
LUI (Table S4). Both AOA (rs = 0.738) and AOB (rs = 0.739)
were positively correlated to SWC only in low LUI. In low
LUI, nirK was negatively correlated with pH and nirS was
positively correlated. Denitrifiers were positively correlated
to Nt (nirS) and EN (nosZ) only in high LUI (Table S5).
Fig. 3. Kriged maps showing the spatial distribution of napA and narG nitrate-reducing bacteria at the low and high land-use intensity (LUI) grassland
sites. Gene copy numbers were related on an area basis (m�2).
Fig. 2. Kriged maps showing the spatial distribution of ammonia-oxidizing archaea (amoA AOA) and bacteria (amoA AOB) at the low and high land-
use intensity (LUI) grassland sites. Gene copy numbers were related on an area basis (m�2).
FEMS Microbiol Ecol 77 (2011) 95–106c� 2011 Federation of European Microbiological SocietiesPublished by Blackwell Publishing Ltd. All rights reserved
102 D. Keil et al.
Discussion
The sites differed in mowing practices and in whether or not
they received fertilizer (Table 1), representing low (unferti-
lized pastures) and high LUI (fertilized mown meadows)
grasslands. The inclusion of three independent sites per LUI
enabled us to determine whether LUI significantly affects the
spatial patterns of soil biogeochemical properties and of
nitrifying and denitrifying microorganisms in soils. Because
sites characterized by the same soil type (Rendzic Leptosol)
and climatic conditions were selected, management prac-
tices were likely the main factor responsible for the differ-
ences between treatments.
For most soil biochemical properties, a higher range of
spatial autocorrelation, indicated by the p-Range, was
observed in the high LUI sites, which indicated reduced
spatial heterogeneity. Although bulk density itself did not
differ significantly between the two LUIs, both the lowest
and the highest bulk densities were found in low LUI sites.
Together, these findings support our hypothesis that fertili-
zer applications and mowing practices at high LUI sites
reduced spatial heterogeneity.
Despite high variations between the sites, both archaeal
and bacterial ammonia oxidizers were more abundant in the
sites of high LUI (Fig. 1 and Table S2). This is in accordance
with a study of Hermansson & Lindgren (2001), who
reported AOB as being two to three times more abundant
in fertilized arable soils than in unfertilized soils. In contrast
to soil biogeochemical properties, the ranges of spatial
autocorrelation for both AOA and AOB were larger in low
than in high LUI sites, resulting in higher patchiness in high
LUI sites. In the case of the AOA and AOB, we therefore
reject the second part of our hypothesis that high LUI
reduces the spatial heterogeneity of soil microorganisms, as
results indicated increased spatial heterogeneity at high LUI
sites.
Our findings suggest that a combination of factors such as
soil structure, microclimate and oxygen status is driving the
spatial distribution of AOA and AOB rather than the soil
biogeochemical properties investigated.
At the six grassland sites, the average abundance of
archaeal ammonia oxidizers was 44 times higher than that
of bacterial ammonia oxidizers. Similarly, most studies on
ammonia oxidizers in terrestrial ecosystems have reported
that AOA were more abundant than AOB (Leininger et al.,
2006; He et al., 2007; Nicol et al., 2008). An increasing body
of literature has suggested niche partitioning between AOA
and AOB, with ammonia concentrations and soil pH as the
main environmental factors shaping the ecological niches of
ammonia oxidizers (Erguder et al., 2009; Bru et al., 2010;
Gubry-Rangin et al., 2010; Schleper, 2010). In the present
study, most of the sites investigated showed similar spatial
distributions of AOA and AOB (Fig. 2, AEG 2, 3, 8 and 9).
This indicated the coexistence of the two groups of ammo-
nia oxidizers, which was further supported by significant
positive correlations between the abundances of AOA and
AOB (Spearman’s rs = 0.905 without separation of LUI). The
six grassland sites were characterized by high ammonia
concentrations (1.26–3.97 g N m�2) with small variations in
pH (6.38–7.09). Because the factors cited above did not
separate the niches of AOA and AOB, we suggest that
factors, which are otherwise masked by gradients in ammo-
nia concentration or pH, induce the coexistence of the two
populations.
The reduction of NO3� to NO2
� can be performed by
bacteria harboring either napA, narG or both genes (Zumft,
Fig. 4. Kriged maps showing the spatial distribution of nirK and nirS denitrifying bacteria at the low and high land-use intensity (LUI) grassland sites.
Gene copy numbers were related on an area basis (m�2).
FEMS Microbiol Ecol 77 (2011) 95–106 c� 2011 Federation of European Microbiological SocietiesPublished by Blackwell Publishing Ltd. All rights reserved
103Spatial distribution of N-cycling soil microorganisms
1997; Philippot & Højberg, 1999). Only the abundance of
the napA gene, encoding the periplasmatic nitrate reductase,
was significantly higher in high LUI sites. The abundance of
the napA gene was also one to two orders of magnitude
higher than the abundance of narG, which encodes the
membrane-bound nitrate reductase. This suggests that the
abundance of bacteria possessing napA may not simply
resemble abundances possessing narG (Bru et al., 2007),
but can be even more abundant under certain conditions.
Similar to AOA and AOB, kriged maps showed a similar
distribution of the nitrate-reducing microorganisms having
the napA and narG genes (Fig. 3), which was supported by a
positive correlation between the two genes (Spearman’s
rs = 0.638 without separation of LUI). Although the correla-
tion between the two genes was higher in high (rs = 0.738,
Table S5) than in low LUI sites (rs = 0.524, Table S4), no
differentiation between low and high LUI was possible
according to their spatial distribution (reduced model,
Table 3). However, it is not possible to determine from our
results whether the napA and narG genes co-occurred in the
same organisms or whether bacteria harboring either the
napA or the narG genes coexisted at the studied sites.
Similar to the ammonia oxidizers, the range of spatial
autocorrelation for nirS was larger in low than in high LUI
sites, resulting in a higher patchiness in high LUI sites. In
contrast to nirS, the distributions of nirK and nosZ were not
affected by LUI. The different spatial distributions of nirK-
and nirS-type denitrifiers (Fig. 4), together with the negative
correlation between the abundances of nirK and nirS (Spear-
man’s rs =� 0.356), indicate a niche differentiation of
organisms having the nirK and nirS functional genes in low
LUI sites. The nitrite reductases encoded by nirK and nirS
are functionally homologous (Glockner et al., 1993) and no
denitrifying organism harboring both types of nitrite re-
ductases has been reported as yet (Jones et al., 2008).
Previous studies (Hallin et al., 2009; Philippot et al., 2009b;
Enwall et al., 2010) have discussed the maintenance of two
types of nitrite reductases as a result of niche differentiation,
thus avoiding competitive exclusion. Furthermore, Hallin
et al. (2009) discussed the distribution patterns among nirK-
and nirS-type denitrifiers through habitats created by the
absence/presence of plants, and both Enwall et al. (2010)
and Bru et al. (2010) reported copper as being a strong
driver for nirK-type denitrifiers.
Spatial analysis of microbial habitat characteristics and
soil microbial communities is a powerful tool to understand
not only links between environmental drivers and microbial
abundance but also to reveal coexistence or niche partition-
ing of soil microorganisms. Whereas these links are well
established in distinct microhabitats (e.g. rhizo- and detritu-
sphere) (Haase et al., 2008; Poll et al., 2008), our study is one
of the first to show that grassland management (e.g. LUI)
differentially changes spatial patterns of soil biogeochemical
properties and N-cycling microorganisms at the plot scale.
Spatial heterogeneity decreased with higher LUI for biogeo-
chemical properties, but increased for N-cycling microor-
ganisms, indicating that spatially structured abiotic or biotic
factors that were not taken into account are driving the
microbial distribution in our study. Independent of LUI, we
also found similar spatial distributions of the bacterial and
archaeal ammonia oxidizers, while contrasting distributions
were observed for nirS and nirK denitrifiers. This suggests
that niche partitioning occurred only between the denitri-
fiers harboring either the copper or the cd1 heme nitrite
reductase. Because LUI also changes plant community
composition and diversity, future studies will have to
evaluate the impact of different plant species and the quality
of their rhizodeposits on the spatial distribution of
N-cycling microorganisms.
Acknowledgements
The work has been funded by the DFG Priority Program
1374 ‘Infrastructure-Biodiversity-Exploratories’ (KA 1590/
8-1). Field work permits were given by the responsible state
environmental offices of Baden-Wurttemberg. We thank
Kathleen Regan for English spelling corrections.
References
Bardgett RD & Wardle DA (2003) Herbivore-mediated linkages
between aboveground and belowground communities. Ecology
84: 2258–2268.
Becker JM, Parkin T, Nakatsu CH, Wilbur JD & Konopka A
(2006) Bacterial activity, community structure, and
centimeter-scale spatial heterogeneity in contaminated soil.
Microb Ecol 51: 220–231.
Bolton H Jr, Wildung RE & Smith JL (1990) Nitrogen
mineralization potentials of shrub-steppe soils with different
disturbance histories. Soil Sci Soc Am J 54: 887–891.
Bolton H Jr, Smith JL & Link SO (1993) Soil microbial biomass
and activity of a disturbed and undisturbed shrub-steppe
ecosystem. Soil Biol Biochem 25: 545–552.
Bremer C, Braker G, Matthies D, Reuter A, Engels C & Conrad R
(2007) Impact of plant functional group, plant species, and
sampling time on the composition of nirK-type denitrifier
communities in soil. Appl Environ Microb 73: 6878–6884.
Bru D, Sarr A & Philippot L (2007) Relative abundances of
proteobacterial membrane-bound and periplasmic nitrate
reductases in selected environments. Appl Environ Microb 73:
5971–5974.
Bru D, Ramette A, Saby NPA, Dequiedt S, Ranjard L, Jolivet C,
Arrouays D & Philippot L (2010) Determinants of the
distribution of nitrogen-cycling microbial communities at the
landscape scale. ISME J 5: 532–542.
Cambardella CA, Moorman TB, Parkin TB, Karlen DL, Novak
JM, Turco RF & Konopka AE (1994) Field-scale variability of
FEMS Microbiol Ecol 77 (2011) 95–106c� 2011 Federation of European Microbiological SocietiesPublished by Blackwell Publishing Ltd. All rights reserved
104 D. Keil et al.
soil properties in central Iowa soils. Soil Sci Soc Am J 58:
1501–1511.
Doran JW & Parkin TB (1996) Quantitative indicators of soil
quality: a minimum data set. Methods for Assessing Soil
Quality. Soil Science Society American Special Publications
No. 49, pp. 25–37.
Enwall K, Throback IN, Stenberg M, Soderstrom M & Hallin S
(2010) Soil resources influence spatial patterns of denitrifying
communities at scales compatible with land management.
Appl Environ Microb 76: 2243–2250.
Erguder TH, Boon N, Wittebolle L, Marzorati M & Verstraete W
(2009) Environmental factors shaping the ecological niches of
ammonia oxidizing archaea. FEMS Microbiol Rev 33: 855–869.
Ettema CH & Wardle DA (2002) Spatial soil ecology. Trends Ecol
Evol 17: 177–183.
Fierer N & Jackson RB (2006) The diversity and biogeography of
soil bacterial communities. P Natl Acad Sci USA 103: 626–623.
Fischer M, Bossdorf O, Gockel S et al. (2010) Implementing
large-scale and long-term functional biodiversity research: the
Biodiversity Exploratories. Basic Appl Ecol 11: 473–485.
Frank DA & Groffmann PM (1998) Ungulate vs. landscape
control of soil C and N processes in grasslands of Yellowstone
National Park. Ecology 79: 2229–2241.
Franklin RB & Mills AL (2003) Multi-scale variation in spatial
heterogeneity for microbial community structure in an eastern
Virginia agricultural field. FEMS Microbiol Ecol 44: 335–346.
Glockner AB, Jungst A & Zumft WG (1993) Copper-containing
nitrite reductase from Pseudomonas aureofaciens is functional
in a mutationally cytochrome cd1-free background (NirS-) of
Pseudomonas stutzeri. Arch Microbiol 160: 18–26.
Grundmann G & Debouzie D (2000) Geostatistical analysis of the
distribution of NH41 and NO2
�-oxidizing bacteria and
serotypes at the millimeter scale along a soil transect. FEMS
Microbiol Ecol 34: 57–62.
Gubry-Rangin C, Nicol GW & Prosser J (2010) Archaea rather
than bacteria control nitrification in two agricultural acidic
soils. FEMS Microbiol Ecol 74: 566–574.
Haase S, Philippot L, Neumann G, Marhan S & Kandeler E (2008)
Local response of bacterial densities and enzyme activities to
elevated atmospheric CO2 and different N supply in the
rhizosphere of Phaseolus vulgaris L. Soil Biol Biochem 40:
1225–1234.
Hallin S, Jones CM, Schloter M & Philippot L (2009)
Relationship between N-cycling communities and ecosystem
functioning in a 50-year-old fertilization experiment. ISME J
3: 597–605.
He J, Shen J, Zhang L, Zhu Y, Zheng Y, Xu M & Di H (2007)
Quantitative analyses of the abundance and composition of
ammonia-oxidizing bacteria and ammonia-oxidizing archaea
of a Chinese upland red soil under long-term fertilization
practices. Environ Microbiol 9: 2364–2374.
Henry S, Baudoin E, Lopez-Gutierrez JC, Martin-Laurent F,
Brauman A & Philippot L (2004) Quantification of
denitrifying bacteria in soils by nirK gene targeted real-time
PCR. J Microbiol Meth 59: 327–335 Corrigendum in J
Microbiol Meth 6 (2005): 289–290.
Henry S, Bru D, Stres B, Hallet S & Philippot L (2006)
Quantitative detection of the nosZ gene, encoding nitrous
oxide reductase, and comparison of the abundances of 16S
rRNA, narG, nirK, and nosZ genes in soils. Appl Environ
Microb 72: 5181–5189.
Hermansson A & Lindgren P-E (2001) Quantification of
ammonia-oxidizing bacteria in arable soil by real-time PCR.
Appl Environ Microb 67: 972–976.
Isaaks EH & Srivastava RM (1989) An Introduction to Applied
Geostatistics. Oxford University Press, New York.
Joergensen RG (1996) The fumigation-extraction method to
estimate soil microbial biomass: Calibration of the KEC value.
Soil Biol Biochem 28: 25–31.
Joergensen RG & Muller T (1996) The fumigation-extraction
method to estimate soil microbial biomass: Calibration of the
KEN value. Soil Biol Biochem 28: 33–37.
Jones CM, Stres B, Rosenquist M & Hallin S (2008) Phylogenetic
analysis of nitrite, nitric oxide, and nitrous oxide respiratory
enzymes reveal a complex evolutionary history for
denitrification. Mol Biol Evol 25: 1955–1966.
Kandeler E, Deiglmayr K, Tscherko D, Bru D & Philippot L
(2006) Abundance of narG, nirS, nirK, and nosZ genes of
denitrifying bacteria during primary successions of a glacier
foreland. Appl Environ Microb 72: 5957–5962.
Leininger S, Urich T, Schloter M, Schwark L, Qi J, Nicol GW,
Prosser JI, Schuster SC & Schleper C (2006) Archaea
predominate among ammonia-oxidizing prokaryotes in soils.
Nature 442: 806–809.
Le Roux X, Bardy M, Loiseau P & Louault F (2003) Stimulation
of soil nitrification and denitrification by grazing in grasslands:
do changes in plant species composition matter? Oecologia
137: 417–425.
Lopez-Gutierrez JC, Henry S, Hallet S, Martin-Laurent F,
Catroux G & Philippot L (2004) Quantification of a novel
group of nitrate-reducing bacteria in the environment by real-
time PCR. J Microbiol Meth 57: 399–407.
Meyer A, Radl V, Keil D, Welzl G, Schoning I, Boch S, Marhan S,
Kandeler E, Munch JC & Schloter M (2010) Different land use
intensities in grassland ecosystems drive ecology of microbial
communities involved in nitrogen turnover in soil. Environ
Microbiol Rep, under revision.
Miller MN, Zebarth BJ, Dandie CE, Burton DL, Goyer C &
Trevors JT (2009) Denitrifier community dynamics in soil
aggregates under permanent grassland and arable cropping
systems. Soil Sci Soc Am J 73: 1843–1851.
Nicol GW, Leininger S, Schleper C & Prosser JI (2008) The
influence of soil pH on the diversity, abundance and
transcriptional activity of ammonia oxidizing archaea and
bacteria. Environ Microbiol 10: 2966–2978.
Niklaus PA, Wardle DA & Tate KR (2006) Effects of plant species
diversity and composition on nitrogen cycling and the trace
gas balance of soils. Plant Soil 282: 83–98.
FEMS Microbiol Ecol 77 (2011) 95–106 c� 2011 Federation of European Microbiological SocietiesPublished by Blackwell Publishing Ltd. All rights reserved
105Spatial distribution of N-cycling soil microorganisms
Patra AK, Abbadie L, Clays-Josserand A et al. (2005) Effects of
grazing on microbial functional groups involved in soil N
dynamics. Ecol Monogr 75: 65–80.
Philippot L (2002) Denitrifying genes in bacterial and archaeal
genomes. BBA-Gene Struct Expr 1577: 355–376.
Philippot L & Højberg O (1999) Dissimilatory nitrate reductases
in bacteria. Biochim Biophys Acta 1446: 1–23.
Philippot L, Hallin S & Schloter M (2007) Ecology of denitrifying
prokaryotes in agricultural soil. Adv Agron 96: 249–305.
Philippot L, Bru D, Saby NP, Cuhel J, Arrouays D, Simek M &
Hallin S (2009a) Spatial patterns of bacterial taxa in nature
reflect ecological traits of deep branches of the 16S rRNA
bacterial tree. Environ Microbiol 11: 3096–3104.
Philippot L, Cuhel J, Saby NP, Cheneby D, Chronakova A, Bru D,
Arrouays D, Martin-Laurent F & Simek M (2009b) Mapping
field-scale spatial patterns of size and activity of the denitrifier
community. Environ Microbiol 11: 1518–1526.
Poll C, Marhan S, Ingwersen J & Kandeler E (2008) Dynamics of
litter carbon turnover and microbial abundance in a rye
detritusphere. Soil Biol Biochem 40: 1306–1321.
R Development Core Team (2008) R: A language and
environment for statistical computing. R Foundation
for Statistical Computing, Vienna, Austria. Available at
http://www.R-project.org.
Ritz K, McNicol J, Nunan N et al. (2004) Spatial structure in soil
chemical and microbiological properties in an upland
grassland. FEMS Microbiol Ecol 49: 191–205.
Robinson GK (1991) That BLUP is a good thing: the estimation
of random effects. Stat Sci 6: 15–32.
Rotthauwe J, Witzel K & Liesack W (1997) The ammonia
monooxygenase structural gene amoA as a functional marker:
molecular fine-scale analysis of natural ammonia-oxidizing
populations. Appl Environ Microb 63: 4704–4712.
SAS Institute Inc. (1999) SAS/STATs User’s Guide, Version 9.2.
SAS Institute Inc, Cary, NC.
Schabenberger O & Pierce FJ (2002) Contemporary Statistical
Models for the Plant and Soil Sciences. CRC Press, Boca Raton.
Schleper C (2010) Ammonia oxidation: different niches for
archaea and bacteria? ISME J 4: 1092–1094.
Tiedje J, Simkins S & Groffman P (1989) Perspectives on
measurement of denitrification in the field including
recommended protocols for acetylene based methods. Plant
Soil 115: 261–284.
Treusch AH, Leininger S, Kletzin A, Schuster SC, Klenk HP &
Schleper C (2005) Novel genes for nitrite reductase and Amo-
related proteins indicate a role of uncultivated mesophilic
crenarchaeota in nitrogen cycling. Environ Microbiol 7:
1985–1995.
Vance ED, Brookes PC & Jenkinson DS (1987) An extraction
method for measuring soil microbial biomass C. Soil Biol
Biochem 19: 703–707.
Zumft W (1997) Cell biology and molecular basis of
denitrification. Microbiol Mol Biol R 61: 533–616.
Supporting Information
Additional Supporting Information may be found in the
online version of this article:
Fig. S1. Schematic of sampling design.
Table S1. Biogeochemical soil properties.
Table S2. Average gene copy numbers for each grassland site
expressed per gram dry soil.
Table S3. Spearman correlations between soil biogeochem-
ical parameters and gene abundances related to area (m�2)
without separation of LUI.
Table S4. Spearman correlations between soil biogeochem-
ical parameters and gene abundances related to area (m�2)
in low LUI.
Table S5. Spearman correlations between soil biogeochem-
ical parameters and gene abundances related to area (m�2)
in high LUI.
Please note: Wiley-Blackwell is not responsible for the
content or functionality of any supporting materials supplied
by the authors. Any queries (other than missing material)
should be directed to the corresponding author for the article.
FEMS Microbiol Ecol 77 (2011) 95–106c� 2011 Federation of European Microbiological SocietiesPublished by Blackwell Publishing Ltd. All rights reserved
106 D. Keil et al.