
Influence Of Health Information Application System On Service ...
73
INFLUENCE OF HEALTH INFORMATION APPLICATION SYSTEM ON SERVICE DELIVERY TO PATIENTS IN MOI TEACHING &REFERRAL HOSPITAL, UASIN GISHU COUNTY, KENYA JACKSON KINARA A RESEARCH PROJECT REPORT SUBMITTED IN PARTIAL FULFILLMENT OF THE REQUIREMENTS FOR THE AWARD OF THE DEGREE OF MASTER OF ARTS IN PROJECT PLANNING AND MANAGEMENT IN THE DEPARTMENT OF EXTRA- MURAL STUDIES OF UNIVERSITY OF NAIROBI 2016
-
Upload
khangminh22 -
Category
Documents
-
view
2 -
download
0
Transcript of Influence Of Health Information Application System On Service ...
INFLUENCE OF HEALTH INFORMATION APPLICATION
SYSTEM ON SERVICE DELIVERY TO PATIENTS IN MOI
TEACHING &REFERRAL HOSPITAL, UASIN GISHU COUNTY,
KENYA
JACKSON KINARA
A RESEARCH PROJECT REPORT SUBMITTED IN PARTIAL FULFILLMENT OF
THE REQUIREMENTS FOR THE AWARD OF THE DEGREE OF MASTER OF ARTS
IN PROJECT PLANNING AND MANAGEMENT IN THE DEPARTMENT OF EXTRA-
MURAL STUDIES OF UNIVERSITY OF NAIROBI
2016

ii
DECLARATION
This research project report is my own original work and to the best of my knowledge has not
been previously presented for the award of a degree in this and/ or any other university.
REG NO: L50/80396/2015
KINARA JACKSON Signed......................................... Date...........................................
A research project report has been presented for examination with my approval as the supervisor
duly appointed by the university.
MR. Marigat Signed............................................. Date.................................................
Department of Extra-Mural Studies
University of Nairobi.

iii
DEDICATION
This research project is dedicated to my family particularly my father Mr. Ben Kinara, mother
Mrs. Joyce Nyabate kinara, siblings Alex, Joshua, and Martha for their encouragement and
moral support in times of need.

iv
ACKNOWLEDGEMENT
My thanks also go to my supervisor, Mr. Marigat for his consistent guidance in helping me carry
out quality research. I would like to also appreciate the moral support given by my classmates
who regularly kept in touch with phone calls, updating and encouraging me all the time. This
research work would not have been complete without the invaluable assistance that I received
from various people. I would like to thank God who has been with me and energized me during
the challenging academic journey as without his love and strength, achieving knowledge would
be in vain and would not have made it to this point. Lastly, I sincerely thank my family members
for their morally, spiritually and financial support; your love, encouragement, guidance and
understanding will not go unnoticed.
v
TABLE OF CONTENT
DECLARATION............................................................................................................................. ii
DEDICATION ............................................................................................................................... iii
ACKNOWLEDGEMENT ............................................................................................................. iv
TABLE OF CONTENT ...................................................................................................................v
LIST OF TABLES ....................................................................................................................... viii
LIST OF FIGURES ....................................................................................................................... ix
LIST OF ABBREVIATION AND ACRONYMS ............................................................................x
ABSTRACT ................................................................................................................................... xi
CHAPTER ONE: INTRODUCTION ..........................................................................................1
1.1 Background to the Study ............................................................................................................1
1.2 Statement of the Problem ...........................................................................................................6
1.4 Research Objectives ...................................................................................................................7
1.5 Research questions .....................................................................................................................7
1.6 Significance of the Study ...........................................................................................................7
1.7 Delimitation of the Study ...........................................................................................................8
1.9 Assumptions of the Study ..........................................................................................................9
1.10 Definition of significant terms of the study .............................................................................9
CHAPTER TWO ......................................................................................................................... 11
LITERATURE REVIEW ............................................................................................................ 11
2.1 The Concept of Health Information Systems ........................................................................... 11
2.1.1 Implementation of the Health Information Application System in Public health institutions12
2.2 Concept of Health Records Management ................................................................................13
2.3 Data Collection and entry for Health Information Management .............................................15
2.4 Data Analysis ...........................................................................................................................19
2.5 Data Warehousing in Public Health Institutions ......................................................................19
2.6 Data application .......................................................................................................................20
2.7 Theoretical Framework ............................................................................................................21
2.7.1 Kotter‟s Change Management Theory .......................................21
2.8 Conceptual Framework ............................................................................................................24
vi
CHAPTER THREE: RESEARCH METHODOLOGY ..........................................................24
3.1 Introduction ..............................................................................................................................25
3.2 Research Design.......................................................................................................................25
3.3 Target Population .....................................................................................................................25
3.4 Sample Size and Sampling Procedures ....................................................................................25
3.4.2: Sampling Methods .....................................................26
3.5 Data Collection Methods .........................................................................................................26
3.5 1 Questionnaires .....................................................................................................................26
3.6 Pilot Study ................................................................................................................................27
3.6.1 Reliability and Validity ..................................................27
3.7 Data Analysis and Presentation ................................................................................................27
3.8 Ethical Consideration ...............................................................................................................28
CHAPTER FOUR ........................................................................................................................30
DATA ANALYSIS AND PRESENTATION OF FINDINGS ....................................................30
4.1 Introduction ..............................................................................................................................30
4.2 Response rate .............................................................30
4.3 Demographic Characteristics of the respondents .....................................................................30
4.4 Influence of data collection and entry on service delivery to patients .....................................33
4.4.1. Descriptive statistics for influence of data collection and entry on service delivery ...........33
4.5 Influence of data analysis on service delivery to patients........................................................37
4.5.1. Descriptive Statistics for Influence of data Analysis on service delivery ............................37
4.6 Influence of data warehousing on service delivery to patients ................................................41
4.7 Influence of data application on service delivery to patients ...................................................45
4.7.1. Descriptive statistics for influence of data application on service delivery ....... 46
CHAPTER FIVE .........................................................................................................................50
SUMMARY OF FINDINGS, CONCLUSION AND RECOMMENDATIONS .....................50
5.1 Introduction ..............................................................................................................................50
5.2 Summary of the study findings ................................................................................................50
5.2.1 Demographic characteristics of respondents ............................... 50
5.2.2 Influence of data collection on service delivery to patients .................... 50
5.2.3 Influence of data analysis on service delivery to patients ..................... 51
5.2.4 Influence of data warehousing on service delivery to patients ................. 51
5.2.5 Influence of data application on service delivery to patients ................... 52

vii
5.3 Conclusion of the study ...........................................................................................................52
5.4 Recommendation of the study .................................................................................................53
5.5 Suggestions for further studies.................................................................................................53
REFERENCES ..............................................................................................................................54
APPENDIX 1: SAMPLE SIZE DETERMINATION TABLE ......................................................58
viii
LIST OF TABLES
Table 4.1 : Response rate ---------------------------------------------------------------------------------------------------------------------- 30 Table 4.2: Gender of the respondents ------------------------------------------------------------------------------------------------------ 31 Table 4.3: Age of the respondents ----------------------------------------------------------------------------------------------------------- 31 Table 4.4: Religion of the respondents ----------------------------------------------------------------------------------------------------- 32 Table 4.5: Education level of the respondents ------------------------------------------------------------------------------------------- 33 Table 4.6: Descriptive statistics for influence of data collection and entry on service delivery ---------------------------- 34 Table 4.7: Relationship between data collection and service delivery to patients ---------------------------------------------- 37 Table 4.8: Descriptive statistics for influence of data analysis on service delivery -------------------------------------------- 38 Table 4.9: Relationship between data analysis and service delivery to patients ------------------------------------------------ 41 Table 4.10: Descriptive statistics for influence of data warehousing on service delivery ------------------------------------ 42 Table 4.11: Relationship between data warehousing and service delivery to patients ----------------------------------------- 45 Table 4.12: Descriptive statistics for influence of data application on service delivery -------------------------------------- 46 Table 4.13: Relationship between data application and service delivery to patients ------------------------------------------- 49

ix
LIST OF FIGURES
Figure 2.1: Effectiveness of HIMS on Management of Health Records ---- Error! Bookmark not
defined.
x
LIST OF ABBREVIATION AND ACRONYMS
DIAMS : Data Issues and Actions Management System
EPR : Electronic Patient Record
EPI : Expanded Program for Immunization
HIEs : Health Information Exchanges
HIMS : Health Information Management System
ICT : Information Communication Technology
MOH : Ministry Of Health
MTRH : Moi Teaching and Referral Hospital
MTUHA : Mfumo WA taarifa za Uendeleshaji WA Huduma Za Afya
NACP : National AIDS Control Program
SPSS : Statistical Package for Social Sciences
xi
ABSTRACT
Health Information management system is one of the most potent investments a health institution
can effectively improve its ability in the provision of health services to its patients. Service
providers in a health care system require data for interpretation not only at the point of service
but also at the point of decision-making in a format that maximizes the decision-making process.
Despite marked progress in the health sector to use health information application systems over
the past decades, Kenya continues to grapple with stimulating health problems and issues of
health service delivery. This is due to limited data availability and quality within and between the
statistical constituencies despite the emphasis on adoption of a health information application
system which is systematic and of high-quality data collection. However, not all health
institutions have adopted new data management systems in their facilities, thus impeding
management of health records of patients. The study examined the influence of health
information application system on service delivery to patients in Moi Teaching and Referral
Hospital in Uasin Gishu County, Kenya. The following specific objectives guided the study: to
investigate how collection of data can influence record keeping of patients in the study area;
determine how data analysis influences management of health records of patients in MTRH;
establish how data warehousing can facilitate communication on management of patients health
records in MTRH; and how data application influences the management of patients‟ health
records in MTRH, Uasin Gishu County. This study was based on Kotter‟s change management
theory that addresses the adoption of technological innovations in health institutions in his eight-
stage process for transformational change. The study used a descriptive survey research design.
The target population of the study was 773 employees of MTRH consisting of senior
management, health records, audit and ICT. The study used questionnaires as the main method of
data collection. Data was analyzed through quantitative analysis. Findings of the study were;
health information application system through effective data collection, data analysis, data
warehousing and data application influences service delivery to patients. Data application
through clearly determined aim for collecting data, legality of the available data, clarification on
data usage and identification of end-users and continuous patients‟ census improves data
relevancy, consistency, accuracy and precision hence, positively influences service delivery to
patients. The study recommended that effective data collection through adequate training and
education of data entry clerks, adoption of appropriate data collection instruments should be
enhanced; and efficient data warehousing through appropriate technology adoption, edits and
continuous update of systems, tables and database. Further research should be done on the
mediating effects on the relationship between health information system and service delivery to
patients.
1
CHAPTER ONE: INTRODUCTION
1.1 Background to the Study
Although it is typically accepted that the practice and delivery of healthcare are fundamentally an
information-based science (Hersh, 2002), and while the health care profession has a longstanding
tradition of using medical technologies, information technology (IT) adoption and use by
clinicians and care delivery organizations for the storage, management, and exchange of patient
information is still relatively limited (Bower, 2005). According to Nyamtema (2010), a health
management information system is a process whereby health data are recorded, stored and
processed for policy-making, planning, implementation and evaluation of health programs.
In many developed and developing countries, health sector reforms and decentralization have
brought about shifts in functions between the central and peripheral levels and generated new
information needs with changing requirements for data collection, processing, analysis and
dissemination that is known as health information systems (Chaudhry, 2006).
Many European countries, for instance, have moved toward automation hospital information
system since early 1980.This systems developed significantly until now, and it has been an
integrated system and with the inner core that called electronic medical records (EMR) from one
inconsistent system (Aghajani, 2002).
In the developed world there have been two key drivers for investment in health information and
communication technology (ICT). The first is the ever-increasing burden from chronic disease,
often with complex comorbidities, on the health care system with costs increasing significantly
faster than population or gross domestic product growth. The treatment and management of such
chronic disease continues over an extended period of time and is performed by multiple health
care providers in multiple settings. The second key driver is the recognition of the need for
greatly improved quality and safety in the delivery of the health care (Kohn et al 2000). For
instance, in the USA, it was estimated that, in hospitals alone, between 44000 and 98000
Americans die each year from medical error (AIHW, 2003).
Still in the USA, despite broad consensus on the potential benefits of electronic health records
and other forms of health information technology, U.S. health care providers have been slow to
adopt them (Jha 2006; Schoen, 2006). It was found that only 17% of U.S. physicians use either a
minimally functional or a comprehensive electronic records system (DesRoches et al. 2008). On
2
the basis of responses from 63.1% of hospitals surveyed, only 1.5% of U.S. hospitals have a
comprehensive electronic-records system (i.e., present in all clinical units), and an additional
7.6% have a primary system (i.e., present in at least one clinical unit). Computerized provider
order entry for medications has been implemented in only 17% of hospitals. Larger hospitals,
those located in urban areas, and teaching hospitals were more likely to have electronic-records
systems. Respondents cited capital requirements and high maintenance costs as the primary
barriers to implementation, although hospitals with electronic-records systems were less likely to
cite these obstacles than hospitals without such arrangements (Ashish,2009). However, despite
all these, since the passage of the HITECH Act in 2009, state EHR adoption rates have increased.
EHR adoption rates increased from only two states reporting rates higher than 20% to all
countries reporting rates 50% or greater by 2014. Furthermore, only two states currently have
adoption rates below 60%. In addition to growth in EHR adoption overall, hospital adoption of
technology with advanced functionality increased significantly. While fewer hospitals used Basic
EHR systems without clinician notes, considerably more adopted systems with clinician notes.
Additionally, over a third of hospitals were using more advanced EHR functionality. Hospital
adoption of Comprehensive EHR systems has increased more than eleven-fold in the last five
years (Charles, Gabriel & Searcy, 2015).
According to Aghajani (2002), many countries including European countries have moved toward
automation hospital information system since early 1980. In India, Health Information
Management System (HIMS) is one of the major concerns in the country, the second highest
populated country in the world. The libraries of medical colleges and health institutes need an
improvement to attain a certain benchmark level in terms of infrastructure, databases, resources
and services. Steps towards resource sharing and networking of these libraries help in improving
the accessibility of health information (Aghazadeh and Ebrahimnezhad, 2012). Success of such
developments is seen in centrally funded and financially sound research institutes and hospitals
in India. However, similar expansion in health care centers in smaller cities and rural areas seems
to be still far off.
The treatment and management of such chronic disease continues over an extended period of
time and is performed by multiple health care providers in multiple settings. The second key
driver is the recognition of the need for greatly improved quality and safety in the delivery of
health care. This recognition has been driven by such things as the National Institutes of
3
Medicine report To Error Is Human (Kohn, 2000) which estimated that in hospitals alone,
between 44,000 and 98,000 Americans died each from medical error.
In Canada, improving data quality and lessening the burden of data collection on health care
providers has been a twin focus of the country‟s effort to address the system-wide need for better
information management (Iron and Manuel, 2007). The overriding goal is to produce better
information for use in health care planning, performance measurement, decision-making, and
research. In most health institutions in Canada, they utilize the Data Issues and Actions
Management System (DIAMS). This is a new system designed to facilitate the management of
data and the resolution of issues related to data quality. This information can then be used to
prioritize issues and gaps for improvement, coordinate improvement activities and monitor
progress in managing and/or resolving these issues.
Therefore, consequences of low adoption and usage rates of health information application
systems at the point of care include poor quality and inaccessibility of relevant information,
which have frequently been implicated for systemic problems in healthcare organizations. Thus,
there is considerable interest among policy makers who wish to promote efficiency and
standardization to understand the enablers and barriers to adoption and use. Because of their
expertise in examining the introduction and use of Information Technology in many of the
organizational, industrial and institutional settings, Information Systems (IS) researchers are in a
unique position to inform the discourse in health IT (Bower, 2005).
A key enabling technology that facilitates the creation and sharing of better information about
patients among different stakeholders in the healthcare delivery system is electronic health
record (EHR) systems. An electronic health record entails the computerization of health record
content and associated processes. Focusing on Health Information Management System is one of
the most powerful investments a health institution can effectively improve its ability in provision
of services. Over the years, from a global and local context, there has been a growing interest in
comparative performance assessments in health, benchmarking, performance-based
disbursement of funds, performance contracting and provision of health services (Mathers,
2002).
A World Bank Study conducted in 2005 found, for example, that the majority of public sector
ICT applications in developed countries were either partial or total failures (cited in UNAPCICT
4
2010). Furthermore, in his report on electronic government projects for development, Heeks
(2008) states that 35% of such projects are total failures and 50% partial failures, with only 15%
being considered successful. A study by Gheorghiu (2006) found that 70–80% of all information
technology and information systems fail. Similarly, Kaplan and Harris-Salamone (2009) reported
international failure rates of major health information technology projects of between 30% and
70%. Such figures are repeatedly found throughout the academic and industry literature. There is
a far smaller research base on the developing world, but intuitively one would expect the failure
rates to be at least as high as in the developed world.
In sub-Saharan Africa, for example, fewer than ten countries have vital registration systems that
produce usable data (Akacho, 2014). There are still very limited measures of health systems
performance, and major reforms, such as decentralization, and are often done in the absence of
adequate data on either needs or consequences. The Health Management Information Systems in
most developing countries are inefficient and are greatly affected by unreliability of data
resulting from underreporting.
In Tanzania the health information system is called MTUHA, which is an acronym for the
Kiswahili meaning of Health Management Information System (HMIS) –“Mfumo WA Taarifa za
Uendeshaji WA Huduma za Afya.” The system covers all health programmes and health care
services. All health facilities (Government, Private, NGOs and Parastatal organizations) use the
MTUHA system (Ministry of Health Tanzania 2002). Before MTUHA came into existence in
1993, several systems were operating. Most of these systems existed in the public and non-
governmental organization (NGO) health facilities. In addition, programmes such as the
Expanded Program for Immunization (EPI), tuberculosis (TB) and Leprosy and the National
AIDS Control Program (NACP) had their own separate reporting systems (Rubona, 2001).
Studies such as (Rubona 2001; Akacho, 2014; and Iron and Manuel, 2007) show that there are
two basic ways in which to collect data: routinely and periodically (non-routine). Periodic data
collection usually means conducting surveys and these can appear to be expensive at first glance.
However, they involve one-time cost, and which may be less expensive than routine data
collection in the long run (Kahooei and Soleimani, 2007).
Without external financial and technical assistance, most developing countries cannot afford to
rely on periodic data collection methods for generating information (Leppeveld, 2000). Many
5
health information systems in developing countries, for example, Mozambique and Tanzania deal
with routine data collection at the health facility level, which are the main sources of data in
healthcare information systems. The routine data collection involves the various health
programmes: Maternal and Child Health (family planning, antenatal care, deliveries and
immunization), Tuberculosis and Drug programmes.
Despite marked progress in many sectors over the past decades, Kenya continues to grapple with
challenging health problems and issues of health service delivery. The Health Management
Information System in Kenya is the principal responsibility of one directorate within the
Ministry of Health (MoH). This is due to limited data availability and quality within and between
the statistical constituencies despite the emphasis on adoption of a health information system
which is systematic and of high quality data collection (Mathers. 2002). The routine health data
collection in Kenya is conducted through a network of 5,170 peripheral health facilities/ units
and 234 hospitals that are distributed throughout the country in 78 different health sub-counties.
Within each sub-county, there are at least 2 Health Records and Information Officers as well as
one Disease Surveillance Officer whose role is to collect data at the district level (MoH, 2014).
Data collection registers are often improvised at the Public health units and reporting forms are
not always available at all these facilities for monthly reporting of morbidity data and other
health statistics.
From the above studies, it is asserted that effective coordination of health information is lacking,
resulting in duplication and gaps in data collection, reporting, use and management of data.
Consequently, vast amounts of data collected remain mostly incomplete, unreliable and unused.
For instance, as in many developing countries, in Malawi, lack of reliable data and grossly
inadequate appreciation and use of available information in planning and management of health
services were two main weaknesses of the health information management systems. There were
very little improvement has been noted in use of information in rationalizing decisions
Chaulagai, 2005). The conclusion is that, no matter how good the design of an information
application system, there is need for new knowledge to improve on its efficiency. However, not
much research has been done to ascertain how the health information application system affect
patient service delivery in public hospitals. The conception of this study was based on the
concerns about the poor quality data collection; data analysis, data warehousing and inadequate
application and/or integration of the Health Information Application System (HIAS) in public
6
hospitals despite its perceived change since its inception and the need to bridge the gaps in
service delivery in the health sector.
1.2 Statement of the Problem
The slag, breakdown and adverse medical outcomes on patients care of the computerized health
information application system in the past three decades to replace paper records has raised more
anxieties on the efficiency among health stakeholders (Dooling, 2012). In the year 2010, Moi
Teaching and Referral Hospital (MTRH) in Eldoret Kenya adopted Funsoft software for
management of health records. However, over the years, MTRH has faced greatest challenges in
collecting, analyzing, evaluating and interpreting health data to aid patient service delivery
(MoH, 2014). This is because health decision makers have little knowledge on how to improve
the HIAS on patient management. Various studies such as (Horning, 2011; Njeru, 2013; Dooling,
2012; and Akacho, 2014) respectively conducted in health institutions have focused on
implementing an electronic medical record with computerized prescriber order entry at a critical
access hospital; influence of health information system on monitoring and evaluation on
HIV/AIDS programmes. However, despite a consensus that the use of health information
technology should lead to more efficient, safer, and higher quality care, there are few reliable
estimates on the efficiency in many hospitals in Kenya. Besides, while the assumption is made
that the development of information management system has a positive effect in healthcare, the
evidence base supporting its practical use is slender (Wootton, 2009) thus, creates a gap. It is
against this background this study focused on effect of health information application systems on
management of health records of patients, with a particular focus on how data collection,
analysis, warehousing and implementation impact service delivery to patients in MTRH Uasin
Gishu County, Kenya.
1.3 Purpose of the Study
To investigate the influence of health information application systems on service delivery to
patients in MTRH Uasin Gishu County, Kenya.
7
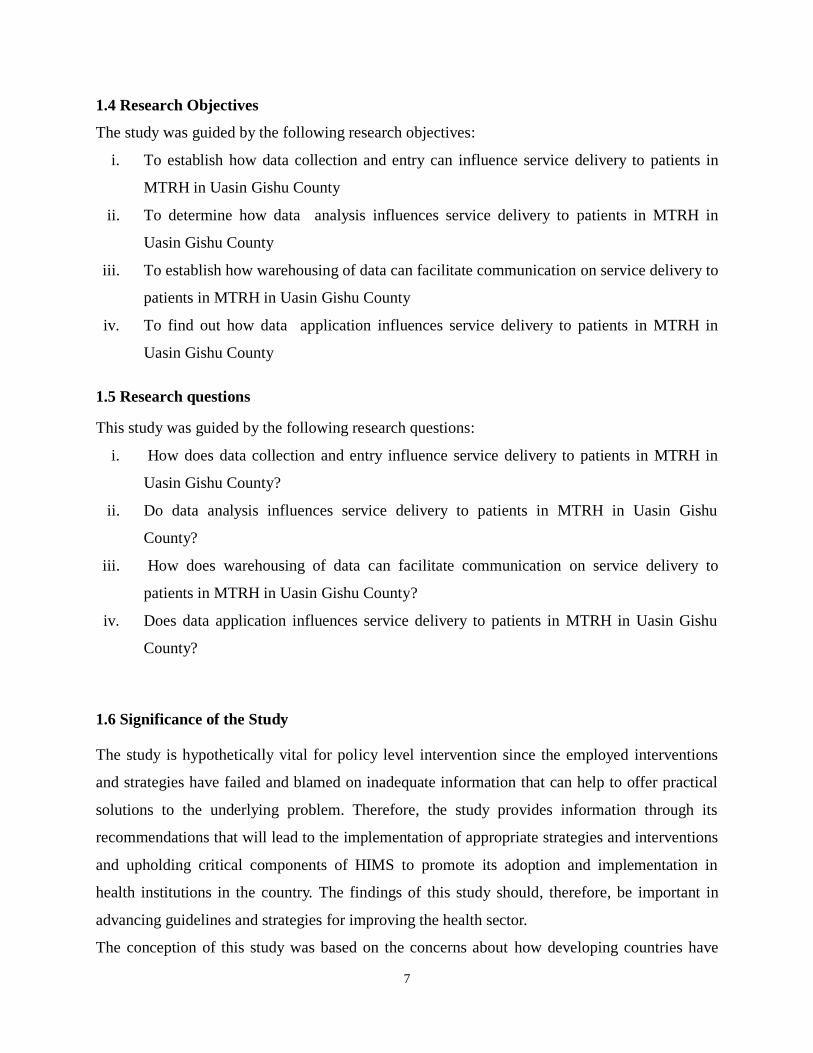
1.4 Research Objectives
The study was guided by the following research objectives:
i. To establish how data collection and entry can influence service delivery to patients in
MTRH in Uasin Gishu County
ii. To determine how data analysis influences service delivery to patients in MTRH in
Uasin Gishu County
iii. To establish how warehousing of data can facilitate communication on service delivery to
patients in MTRH in Uasin Gishu County
iv. To find out how data application influences service delivery to patients in MTRH in
Uasin Gishu County
1.5 Research questions
This study was guided by the following research questions:
i. How does data collection and entry influence service delivery to patients in MTRH in
Uasin Gishu County?
ii. Do data analysis influences service delivery to patients in MTRH in Uasin Gishu
County?
iii. How does warehousing of data can facilitate communication on service delivery to
patients in MTRH in Uasin Gishu County?
iv. Does data application influences service delivery to patients in MTRH in Uasin Gishu
County?
1.6 Significance of the Study
The study is hypothetically vital for policy level intervention since the employed interventions
and strategies have failed and blamed on inadequate information that can help to offer practical
solutions to the underlying problem. Therefore, the study provides information through its
recommendations that will lead to the implementation of appropriate strategies and interventions
and upholding critical components of HIMS to promote its adoption and implementation in
health institutions in the country. The findings of this study should, therefore, be important in
advancing guidelines and strategies for improving the health sector.
The conception of this study was based on the concerns about how developing countries have
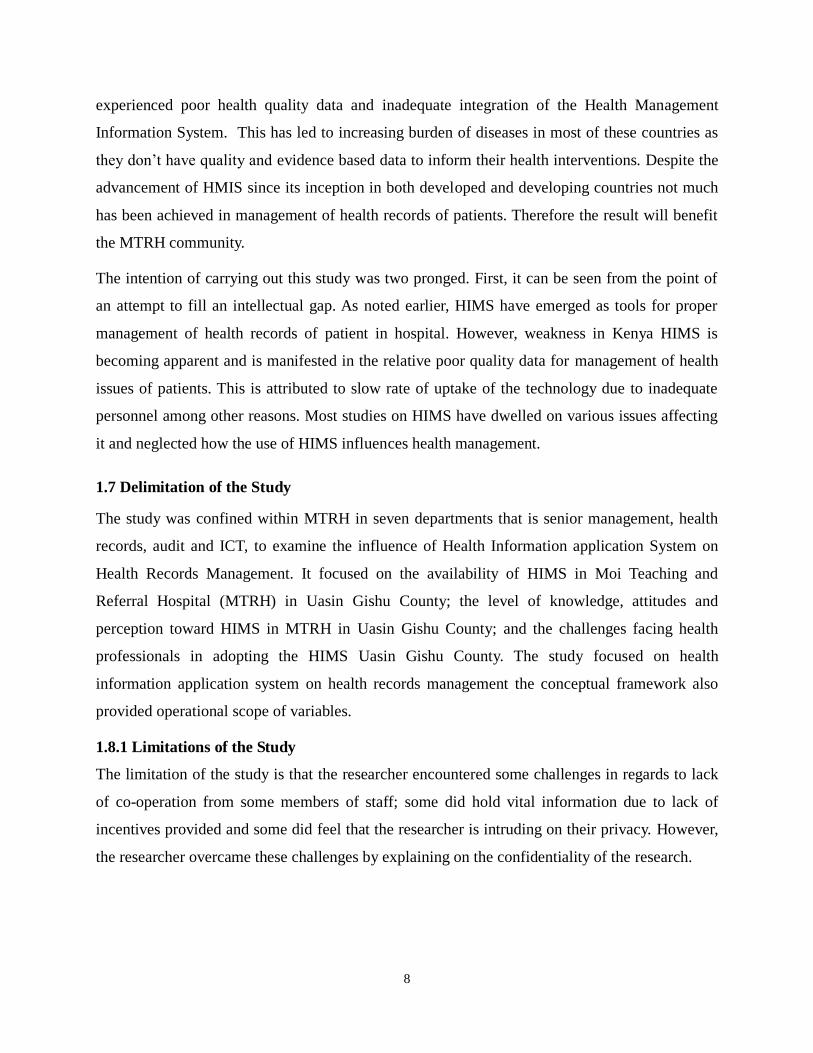
8
experienced poor health quality data and inadequate integration of the Health Management
Information System. This has led to increasing burden of diseases in most of these countries as
they don‟t have quality and evidence based data to inform their health interventions. Despite the
advancement of HMIS since its inception in both developed and developing countries not much
has been achieved in management of health records of patients. Therefore the result will benefit
the MTRH community.
The intention of carrying out this study was two pronged. First, it can be seen from the point of
an attempt to fill an intellectual gap. As noted earlier, HIMS have emerged as tools for proper
management of health records of patient in hospital. However, weakness in Kenya HIMS is
becoming apparent and is manifested in the relative poor quality data for management of health
issues of patients. This is attributed to slow rate of uptake of the technology due to inadequate
personnel among other reasons. Most studies on HIMS have dwelled on various issues affecting
it and neglected how the use of HIMS influences health management.
1.7 Delimitation of the Study
The study was confined within MTRH in seven departments that is senior management, health
records, audit and ICT, to examine the influence of Health Information application System on
Health Records Management. It focused on the availability of HIMS in Moi Teaching and
Referral Hospital (MTRH) in Uasin Gishu County; the level of knowledge, attitudes and
perception toward HIMS in MTRH in Uasin Gishu County; and the challenges facing health
professionals in adopting the HIMS Uasin Gishu County. The study focused on health
information application system on health records management the conceptual framework also
provided operational scope of variables.
1.8.1 Limitations of the Study
The limitation of the study is that the researcher encountered some challenges in regards to lack
of co-operation from some members of staff; some did hold vital information due to lack of
incentives provided and some did feel that the researcher is intruding on their privacy. However,
the researcher overcame these challenges by explaining on the confidentiality of the research.
9
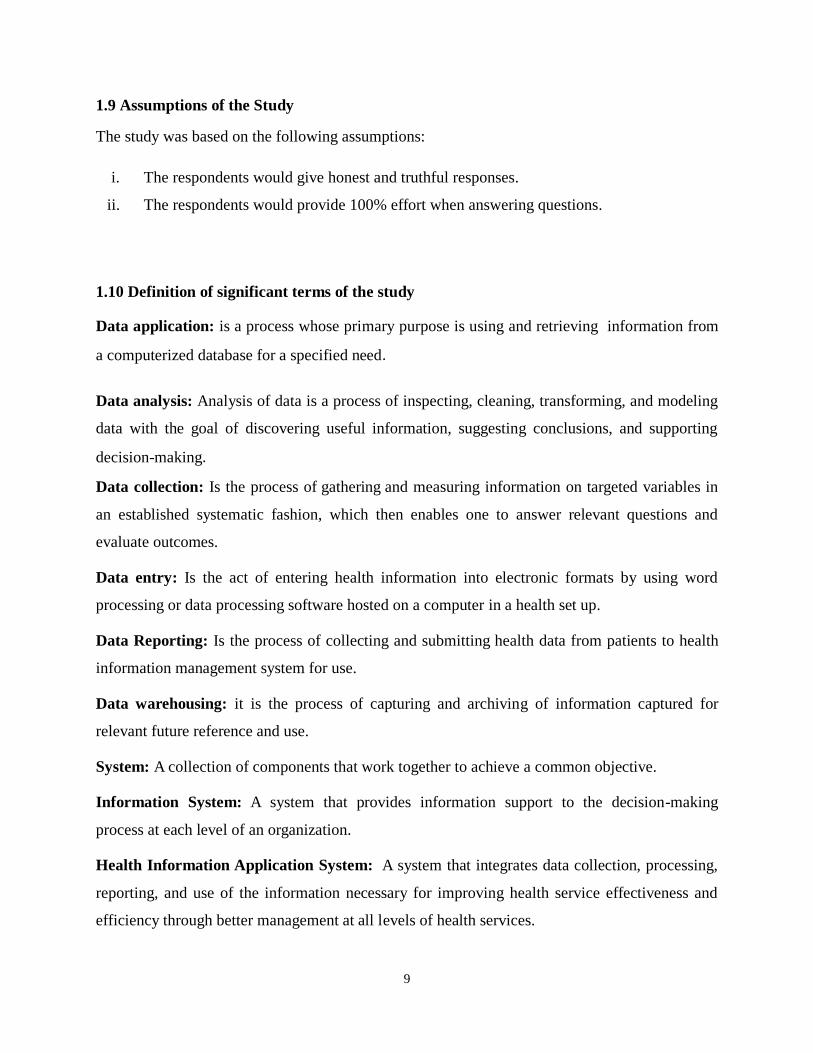
1.9 Assumptions of the Study
The study was based on the following assumptions:
i. The respondents would give honest and truthful responses.
ii. The respondents would provide 100% effort when answering questions.
1.10 Definition of significant terms of the study
Data application: is a process whose primary purpose is using and retrieving information from
a computerized database for a specified need.
Data analysis: Analysis of data is a process of inspecting, cleaning, transforming, and modeling
data with the goal of discovering useful information, suggesting conclusions, and supporting
decision-making.
Data collection: Is the process of gathering and measuring information on targeted variables in
an established systematic fashion, which then enables one to answer relevant questions and
evaluate outcomes.
Data entry: Is the act of entering health information into electronic formats by using word
processing or data processing software hosted on a computer in a health set up.
Data Reporting: Is the process of collecting and submitting health data from patients to health
information management system for use.
Data warehousing: it is the process of capturing and archiving of information captured for
relevant future reference and use.
System: A collection of components that work together to achieve a common objective.
Information System: A system that provides information support to the decision-making
process at each level of an organization.
Health Information Application System: A system that integrates data collection, processing,
reporting, and use of the information necessary for improving health service effectiveness and
efficiency through better management at all levels of health services.
10
Health Management Information System: An information system specially designed to assist
in the management and planning of health programmes, as opposed to delivery of care.
Health Record: A health record is a confidential compilation of pertinent facts of an individual's
health history, including all past and present medical conditions, illnesses and treatments, with
emphasis on the specific events affecting the patient during the current episode of care.
Health Record Management: This refers to the practice of acquiring, analyzing and protecting
digital and traditional medical information vital to providing quality patient care. The
information documented in the health record is created by all healthcare professionals providing
care and is used for continuity of care.
Service delivery: it is defined as accessibility, consistency and accuracy of services offered to
patients
11
CHAPTER TWO
LITERATURE REVIEW
2.1 The Concept of Health Information Systems
A Health Information System (HIS) is a functional entity within the framework of a
comprehensive health system to improve the health of individuals and the population. As such, it
is a management information system. Although many definitions of a management information
system have been proposed, a comprehensive one has been given by Hurtubise (1984) as a
system that provides specific information support to the decision making process at each level of
an organization (Lippeveld, 2001).
The HIS structure should allow generation of necessary information for use in decision-making
at each level of the health system with a given amount of resources. This involves the processes
for collecting, processing and disseminating information in a health system (Shrestha and Bodart,
2000). Electronic Health Record (EHR) is defined as the aggregate electronic record of health-
related information on an individual that is created and gathered cumulatively across more than
one health care organization and is managed and consulted by licensed clinicians and staff
involved in the individual‟s health and care (EHR & EMR, 2010).
Information is the knowledge which gives meaning to its receiver. When a person stores some
information into the computer, it can be referred as data. Data is raw input, after some process
this data gives output and that output is known as information. In today‟s world, the information
is spread over in various forms and it is stored in the different kinds of devices. Getting an access
to the right information on the right time in a very structured manner is an important need
(WHO, 2003).
The demand for good-quality health information is growing–driven in part by the move towards
performance-based resource allocation and by significant increases in the resources for health
mobilized in recent years, for example through the Global Fund for HIV/AIDS, TB and Malaria
(GFATM). In the context of such global initiatives, reporting requirements for countries are being
stepped up, while the frequent monitoring of short-term programme outputs (such as
improvements in service provision and the number of people using such services) is now
required as part of performance-based disbursement systems. At the same time, enhanced
reporting of health outcomes, for example improvements in the quality and length of life which
12
is required to monitor progress towards major international goals such as the Millennium
Development Goals (MDGs). However, demands for data emanating from such international and
disease-specific initiatives tend to focus on particular indicators and do not necessarily translate
into building systems that meet both country-level and international health information needs.
The recent upsurge in demand for health information cannot be adequately met at present
because there has been insufficient investment in building streamlined health information
systems capable of generating data on the full array of health-related issues (blaya, 2010).
Effective data management plays an important role in improving the performance of an
organization‟s health care systems. Collecting, analyzing, interpreting, and acting on data for
specific performance measures allows health care professionals to identify where systems are
falling short, to make corrective adjustments, and to track outcomes. This module is designed to
help users understand the relationship between quality improvement and data management and to
provide information on how to gather, analyze, interpret, and act on data for a specific
performance measurement(duranti,1997).
2.1.1 Implementation of the Health Information Application System in Public health
institutions
Health information application system comprises of a wide range of networking technologies,
clinical databases, electronic /health records, and other specific biomedical, administrative and
financial technologies that generate, transmit and store healthcare information. All information
from healthcare providers including hospitals, clinics, emergency rooms, small offices and
multispecialty groups are entered into an electronic health record. This information is then
networked to regional and national databases through electronic exchange. Data flows from
EHRs and regional registries are then channeled into standards for prevention and treatment,
which can be further processed to yield information for decision-making and decision-support.
The application system if well utilized, then data transmission standards and data definition
standards are equally important.
Shortliffe and Sondik (2006) discuss a practical application of a health information system like
the one above in cancer information surveillance. In this example, information from EHRs are
processed and used in a manner that improves cancer-related decision-making to bring about an
improved quality care for cancer patients. Hence, using health information technology to
monitor, manage and control cancer care. However, Wootton, 2009; and Chan and Kaufman,
13
(2010) have shown that there several barriers to and facilitators of Electronic Records adoption
among hospitals. These include; inadequate capital for purchase, concerns about maintenance
costs, resistance on the part of physicians, unclear return on investment, and lack of availability
of staff with adequate expertise in information technology. Hospitals that had adopted electronic
records systems were less likely to cite four of these five concerns as major barriers to adoption
than were hospitals that had not adopted such systems (Ashash et al. 2009). However, while the
assumption is made that technology can and does have a positive effect in healthcare; the
evidence base supporting its practical use is slender (Wootton, 2009). In reality, many decisions
on the adoption of new health care technologies are made in the absence of information on
implications of its use (Kazanjian & Green, 2002). Decision-makers are often unaware of the
information they lack, and rarely obtain feedback on the consequences of their decisions; be it
feedback on the effectiveness, costs, ethical, legal or social implications of technology (Wootton,
2009).
Aside from the insufficient research on evidence for making informed decisions, available
information on the selection of new technologies is often unstructured and unclear, and further
compounded by the increasing number of technologies, and their increasing complexity (Ruder
et al 2008, Chan and Kaufman 2010). There are a number of specific problems with the use of
ICT that are generally better understood: costs associated with hardware and software,
availability of broadband and mobile networks, the development of user interfaces and
applications in languages other than English, and ongoing maintenance costs, to name a few
(Wootton, 2009). As also noted by Ruder (2008), broader knowledge on the social, political and
economic constraints also referred to as the „soft‟ barriers is often lacking in considerations of
technology innovations in health care (Ruder et al 2008). In response to this evident knowledge
gap, this study investigates how an effective health information application system can increase
health record management.
2.2 Concept of Health Records Management
Despite having a number of benefits for healthcare settings, the successful implementation of
health Information Management Systems (HIMS) continues to be a challenge in many
developing countries (Ravindra et al. 2015). Electronic Health Record Management systems
14
assist health institutions and the society as a whole for instance, hospitals are able to manage
their daily operations.
HIMS professionals are experts in collecting and classifying data to support a variety of needs
such as severity of illness, meaningful use, pay for performance, data registries, and data
mapping. Further, HIM professionals encourage and foster the use of data by ensuring its timely
availability, coordinating its collection, and analyzing and reporting collected data.
As noted by Bansler & Havn (2010), the adaption and implementation of management of health
records of patients prove to be more successful when users are involved in the discussion for its
design and implementation. Developing countries such as India, Kenya and Haiti have benefited
greatly with the intervention of EMR systems which provides accuracy, efficiency and has
overall cost benefits (Blaya,Fraiser&Holt, 2010). However, according to Mohammed-Raj put et
al. (2011) the benefits of an effective management of health record systems lie heavily in its
successful implementation. Therefore, there is need to investigate on what can be improved on
HIMS to make it effective and adaptive.
Studies have shown that HIMS‟s success of new system integration into daily workflow is
dependent on how effectively the workplace culture emphasizes quality and innovation.
Goldzweig et al. (2009) found that cultural barriers to system implementations in hospitals and
confirmed that 77% of practices without an Electronic Health Record are resistant to it. Another
72% of physicians believed that moving towards an electronic system will result in frequent
downtime, 64% believe that the system will increase the physicians‟ work time, and 60% fear
that they do not have sufficient computer skills.
The main outcome of data quality management (DQM) is knowledge regarding the quality of
healthcare data and its fitness for applicable use in all of its intended purposes (Bansler &Havn,
2010). DQM functions involve continuous quality improvement for data quality throughout the
enterprise (all data in all healthcare settings) and include data application, collection, analysis,
and warehousing. DQM skills and roles are not new to HIM professionals. As use of health
information technology becomes widespread, however, data are shared and repurposed in new
and innovative ways, thus making data quality more important than ever (AHIMA, 2012).
Related literature found that data are uniquely sought and collected by each requester. Data
collection, analysis and warehousing are rarely rapid (Bansler & Havn, 2010). For instance, large
15
data sets are typically not accessible; the quality of the data is often poor; the requirements for
centrally cleaning and standardizing the data may delay the beginning of analysis; there is almost
no orderly method for reporting findings back to the data holders; and decision-makers can rarely
obtain or use timely, high-quality information. The quality of collected data can be affected by
software design and the mechanisms for data population. Automated population of data
originates from various sources-systems such as clinical lab machines and vital sign tools like
blood pressure cuffs. All automated sources must be checked regularly to ensure appropriate
calibration. Likewise, any staff entering data manually should be trained to enter the data
correctly and monitored for quality assurance such as registrars entering patient demographic
data at the point of care (Dooling, 2012). In a fragmented health sector, data collection efforts are
slow, costly, cumbersome, and redundant. Traditional methods for aggregating and sharing data
pose many challenges to researchers and data sources alike (Karp, 2008).
2.3 Data Collection and entry for Health Information Management
In healthcare, data are ubiquitous. Data collection is essential for informative decision making.
Data elements will be used within a health institution for continuous quality development efforts
and to strategically advance patient care. Besides, benchmarking population health initiatives
(Horning, 2011). Working with data and information within the health information system
involves filling in forms, tally sheets and registers, collecting data into aggregated reports and
statistics and the reporting of health data from low levels to higher levels of the health
information system. These activities make up important aspects of most health workers‟ jobs.
The health information systems therefore tend to be deeply embedded in social work practices
and are barely separable from social context of which they are part (Braa et al. 1999).
Whether collecting data to be stored in a paper medical/health record or in a computer-based or
electronic patient record or for statistics or specific registries, data must be accurate, reliable and
organized in such a way that they are understood and health information can be retrieved. The
first step should be to determine what data are needed and how they are to be collected. Poor
data collection occurs when data are is collected in a logical sequence, and when the instrument
used to collect the data is deficient (Zlabek et al, 2011).
Investing in the development of effective health information systems would have multiple
benefits and would enable decision-makers at all levels to detect and control emerging and
16
endemic health problems; monitor progress towards health goals; and promote equity, empower
individuals and communities with timely and understandable health-related information; and
drive improvements in quality of services, strengthen the evidence base for effective health
policies; permit evaluation of scale-up efforts; and enable innovation through research, and
improve governance; mobilize new resources; and ensure accountability in their use.
Strengthening national and sub-national health information systems will also require a
collaborative effort at the international level. In Kenya, Health Information is not integrated with
information technology to the extent witnessed in developed countries. The limited availability
of the requisite skills and equipment at the various levels and the high levels of IT illiteracy
remain significant challenges. Thus, while the application of ICT is desirable the framework will
focus on specific modes of generation and use of Health Information that are relevant in the
Kenyan context.
Health care professionals spend a significant proportion of their working time collecting large
amounts of client and patient data that is rarely analyzed and used at the point of collection.
Health workers merely collect aggregate and dutifully pass over this data to the next level
(Dooling, 2011). This information is rarely ever used to guide local action at the level at which
data is collected. Very little information from the collected data ever reaches health system
managers; this is despite the fact that an HIS is mainly designed to facilitate the operations of the
health system managers at various levels. This could possibly be explained by lack of involving
information users in the design of these systems.
While the basic data capture and reporting skills are present, there is little attention to data
quality and staffs lack the self-assessment skills or the “epidemiological thinking” needed for the
analysis, interpretation and use of information for actions. Additionally, even when information
users are involved, they often make data demands that are not cognizant of the limitations or
challenges faced by the providers to produce all the expected information. Lack of a coordinated
data collection strategy is a recurrent problem which leads to duplication of effort and
competition among data collecting units and health care providers.
Other problems relate to poor quality, incompleteness, inconsistency and lack of timeliness of
much of the data being generated by HIS. Medical data should only be used for the purposes for
which it was collected, and for additional purposes authorized by law, or consented to by the data
17
subject. The purposes for which health data is collected needs to be clear. The Health
Information Management (HIM) profession in Kenya has been created because of a need for
accurate, complete data regarding the care and treatment of patients and the production of timely
information for evidence based decision making within the health sector. HIM professionals like
their other colleagues within the health sector need to be regulated in order to ensure that they
operate professionally.
Data is a representation of facts or concepts or instructions in a formalized manner, suitable for
communication, interpretation or processing by manual or electronic means in a health institution
(Abdelhak et al, 1996). In health care, data describes specific characteristics of individual
patients. Whether data is collected on paper or in a computer, the data should be organized in
such a way that we can understand and retrieve them when needed (Davis& LaCour, 2002). The
data collected should include all relevant findings relating to the patient‟s condition, diagnoses,
treatment, if any, and other events as they occur. Whether the data are collected manually or in a
computer, it is important to ensure that the information is correct at the point of entry.
The starting point for any effective health institution is the availability of health care data to help
in health care interventions. The collection of data, whether maintained manually or
electronically at a large teaching hospital, health Centre or outlying clinic is paramount for health
care decision. For patient‟s data to be useful, it has to be entered into a central database for easier
and quick retrieval. Demographic and clinical data stored in a patient‟s medical/health record are
the major source of health information and are of no value to medical science or health care
management if they are not accurate, reliable and accessible (WHO, 2003).
Around the world, countless lives are lost due to insufficient access to quality health information.
The availability of accurate, timely, and analyzed data is directly relevant to the quality of an
individual‟s health and the healthcare system in general, the delivery of individual care, and the
understanding and management of overall health systems (Jody, 2011). According to the United
Nations, strengthening health information systems is emerging as a cornerstone of global health
policy.
Akacho (2014) found that data entry may be hindered by lack of uniformity of data. This implies
that without predetermined standards and uniform data sets, problems relating to the quality of
health care data are difficult to solve. Additionally, poorly designed data collection forms may
18
also affect quality of data in that, if forms are not well designed, the collection of data could
result in poor quality data. The limitations to doctors capacity to communicate is another cause
poor quality data where some doctors find it difficult to record data in a clear and concise
manner, hence poor information. The medics often use non-standard abbreviations and are „too
busy‟ to complete medical records once the patient has been discharged from the facility or does
not require further treatment.
In a nutshell, limited education in documentation requirements of medical staff on data entry is a
major factor in poor data quality. Limitations to information transfer from different parts of the
facility, and sometimes information being transferred from the laboratory to the ward or a clinic
does not contain the correct patient‟s name and medical/health record number. Such errors make
it difficult to ensure that all data pertaining to an individual patient are filed in that patient‟s
medical record. The transfer of information from one department to another or from a hospital to
a clinic or aid post is often slow or information is lost in transmission.
The poor state of health systems in many parts of the developing world is keeping individuals
from accessing essential health care and slowing progress toward health-related UN Millennium
Development Goals. Proper information management starts with data entry into a central
database for later retrieval and use. However, most of the developing countries neither have
Health information management system nor, qualified personnel to carry out data entry tasks.
Until recently, discussions about applying information technologies to health care in the
developing world revolved around replacing ubiquitous paper-based systems with computers.
This study argues that regardless of whether in a hospital, health centre or an outlying clinic, the
quality of health care data and statistical reports has come under intensive scrutiny in recent
years. Thus, all health care service employees, including clerical staff, health professionals,
administrators, and health information managers, need to gain a thorough knowledge and
understanding of the key components of data quality and the requirements for continuous data
entry and improvement.
This is for the reason that inaccurate health information may adversely affect the quality of an
individual‟s healthcare, insurance, and employability. As computerization of health information
continues and the scope of organizational exchange of health information widens into health
information exchanges (HIEs), maintaining the integrity and completeness of health data is
19
paramount. The overarching goal of HIEs is to allow authorized users to quickly and accurately
exchange health information to enhance patient safety and improve efficiency. Achieving this
goal is dependent on the ability to link (match) multiple, disparate records relating to a single
individual.
2.4 Data Analysis
Data analysis and reporting is one of the facets that can promote proper health care to patients.
According to Johns, (2002) limited education of processing staff may hinder the processing of
health records due to lack of understanding the need for accuracy and completeness. If they are
not properly trained, the production of quality data is threatened. Additionally, lack of planning
by administrative staff to ensure data quality control programmes are in place. Finally, data
discrepancies arising when errors occur at the point of collection and plans lead to distorted
information when reporting of data for action.
2.5 Data Warehousing in Public Health Institutions
According to Inmon (2002) a data warehouse is a subject-oriented, integrated, non-volatile, and
time-variant collection of data in support of management‟s decisions. The data warehouse
contains granular corporate data. In terms of subject-oriented, classical operations systems are
organized around the applications of the company. Each type of company has its own unique set
of subjects. In terms of integratedness. Data is fed from multiple disparate sources into the data
warehouse. As the data is fed it is converted, reformatted, resequenced and summarized. The
result is that data once it resides in the data warehouse has a single physical corporate image.
Warehouse data is loaded and accessed, but it is not updated. Instead, when data in the data
warehouse is loaded, it is loaded in a snapshot, static format. When subsequent changes occur, a
new snapshot record is written. In doing so a history of data is kept in the data warehouse. Data
warehousing is being hailed as one of the most strategically significant developments in
information processing in recent times. One of the reasons for this is that it is seen as part of the
answer to information overload (Inmon, 2002).
Data warehousing is a phenomenon that grew from the huge amount of electronic data stored in
recent years and from the urgent need to use that data to accomplish goals that go beyond the
routine tasks linked to daily processing. In a typical scenario, a large hospital institution has
many branches, and senior managers need to quantify and evaluate how each branch contributes
20
to the global business performance. The corporate database stores detailed data on the tasks
performed by departments within it. To meet the managers‟ expectations, tailor-made queries can
be issued to retrieve the required data. In order for this process to work, database administrators
must first formulate the desired query after closely studying database catalogs. Then the query is
processed. This can take a few hours because of the huge amount of data, the query complexity,
and the concurrent effects of other regular workload queries on data. Finally, a report is
generated and passed to senior managers in the form of a spreadsheet. Many years ago, database
designers realized that such an approach is hardly feasible, because it is very demanding in terms
of time and resources, and it does not always achieve the desired results. Moreover, a mix of
analytical queries with transactional routine queries inevitably slows down the system, and this
does not meet the needs of users of either type of query (Lechtenbörger, 2001). However today‟s
advanced data warehousing processes separate online analytical processing from online
transactional processing by creating a new information repository that integrates basic data from
various sources, properly arranges data formats, and then makes data available for analysis and
evaluation aimed at planning and decision-making processes (Lechtenbörger, 2001).
2.6 Data application
According to Zlabek, Wickus, and Mathiason (2012), data application is a term for the use of
data. These data is arranged into data sets which are large and there for complex that traditional
data processing applications. Therefore it is inadequate to deal with them due to the nature of the
institutions, large accumulation of patients data ,hence endure Challenges include analysis,
capture, data curation, search, sharing, storage, transfer, visualization, querying, updating and
information privacy.
An examination of hospitals that recently implemented a comprehensive electronic health record
(EHR) system finds that clinical and administrative leaders built EHR adoption into their
strategic plans to integrate inpatient and outpatient care and provide a continuum of coordinated
services. Successful implementation depended on: strong leadership, full involvement of clinical
staff in design and implementation, mandatory staff training, and strict adherence to timeline and
budget. The EHR systems facilitate patient safety and quality improvement through: use of
checklists, alerts, and predictive tools; embedded clinical guidelines that promote standardized,
evidence-based practices; electronic prescribing and test-ordering that reduces errors and
21
redundancy; and discrete data fields that foster use of performance dashboards and compliance
reports (Jha, and Desroches, 2009).
However more accurate communication and streamlined processes have led to improved patient
flow, fewer duplicative tests, faster responses to patient inquiries, redeployment of transcription
and claims staff, more complete capture of charges, and federal incentive payments. Hospital and
health system leaders used varied approaches to demonstrate that implementing EHRs was a
high priority. All of the hospitals committed significant financial resources toward equipment,
software, IT staff, and training (S. Jones, R. Koppel, M. S. Ridgely, 2011).
In addition to training hospital staff, integrated health systems trained physicians in their owned
and affiliated practices that were adopting the medical office version of the EHR. And most also
offered training to community physicians who had different office medical record systems but
admitting privileges; this enabled them to add to the medical record when treating patients at the
hospital and to access information from the EHR hospital record for their patients.
2.7 Theoretical Framework
Initiating a change is a complicated process, and following a theoretical framework can provide a
basis for making informed decisions that allows for better control over the outcomes of action
(McEwen & Wills, 2007). Two theories on change and innovation that have been used
successfully to facilitate the adoption of technology in health care organizations are Rogers‟
Innovation Diffusion Theory and Kotter‟s Change Management Model (Campbell, 2008; Wolf,
2006). Both of these models provide steps and guidelines for engaging individuals and
organizations to support both willingness and ability, thus helping to improve the likelihood the
EMR would be adopted.
2.7.1 Kotter’s Change Management Theory
There are many different change management models, but one that has been used successfully in
health care (Clark, 2010), and specifically to address the adoption of technological innovations
(Campbell, 2008), is John Kotter‟s eight-stage process for transformational change (Kotter,
1996). This dynamic model is comprised of eight stages that can be organized into three phases.
The first phase is “creating a climate for change” and includes establishing a sense of urgency,
creating a guiding coalition, and developing a vision and strategy. The second phase is
“engaging and enabling the organization” and includes communicating the vision, empowering
22
action, and creating short-term wins. The final phase is “implementing and sustaining the
change” and includes consolidating gains and producing more change, and anchoring new
approaches in the culture.
Creating a Climate for Change
The first stage is establishing a sense of urgency. The biggest mistake in attempting change is to
allow complacency (Kotter, 1996). This is a critical step because without a sense of urgency
people will cling to the status quo and resist change. Creating urgency involves helping people
see and feel first hand why a change needs to occur (Campbell, 2008).
The second stage is creating a guiding coalition. The guiding team members need to have the
knowledge, credibility, influence, and skills required to mobilize change (Kotter, 1996). The
third stage is developing a vision and strategy. In this stage you need to create a clear and
defining vision that is shared by all stakeholders. The result should be a compelling statement
that clearly articulates what you are trying to achieve that can be explained in five minutes or
less (Kotter, 1996). The vision needs to include a collective sense of what a desirable future
looks like, in clear and measurable terms that all stakeholders can stand behind (Clark, 2010).
Engaging and Enabling the Organization
The first stage in this phase is communicating the vision. Once the vision has been created and
agreed upon by members from all stakeholder groups, it is imperative that it be communicated
frequently and convincingly to all groups. This involves communicating the vision in words and
actions by leading through example. Members from all groups need to be hearing the same
message from everyone in order to gain buy-in and guide them from awareness of the change to
a state where they feel empowered to advocate for the change (Campbell, 2008). This involves
engaging in continuous dialogue with stakeholders to build commitment and trust.
The next two stages in this phase are enabling action and creating short-term wins. At this stage
all parties need to work together to remove obstacles and empower all members to participate. It
may involve providing incentives for embracing change, and feedback on how they can use the
changes for their benefit (Campbell, 2008). Changing the culture of a workplace takes time, and
as time goes on urgency drops and complacency rises (Kotter, 1996). Creating short-term wins
can help keep the momentum going. Wins should be celebrated in a highly visible way that is
connected to the vision and then that momentum can be used to set new achievable goals (Clark,
23
2010). After each win it is important to analyze what went right and what needs improvement.
Implementing and Sustaining the Change
The seventh and eighth stages are consolidating gains to produce more change and anchoring
new approaches in the organizational culture. The warning in these stages is not to declare
victory prematurely. Declaring that the change has been successfully implemented means that
people lose all urgency and if the changes have not been firmly anchored into the culture, people
will slip back into the „old‟ way of doing things (Kotter, 1996). In this phase there needs to be a
continued focus on the desired vision and the strategic steps required to achieve it until the
change becomes a permanent part of the organization‟s culture and is reflected in the shared
norms and values (Clark, 2010).
24
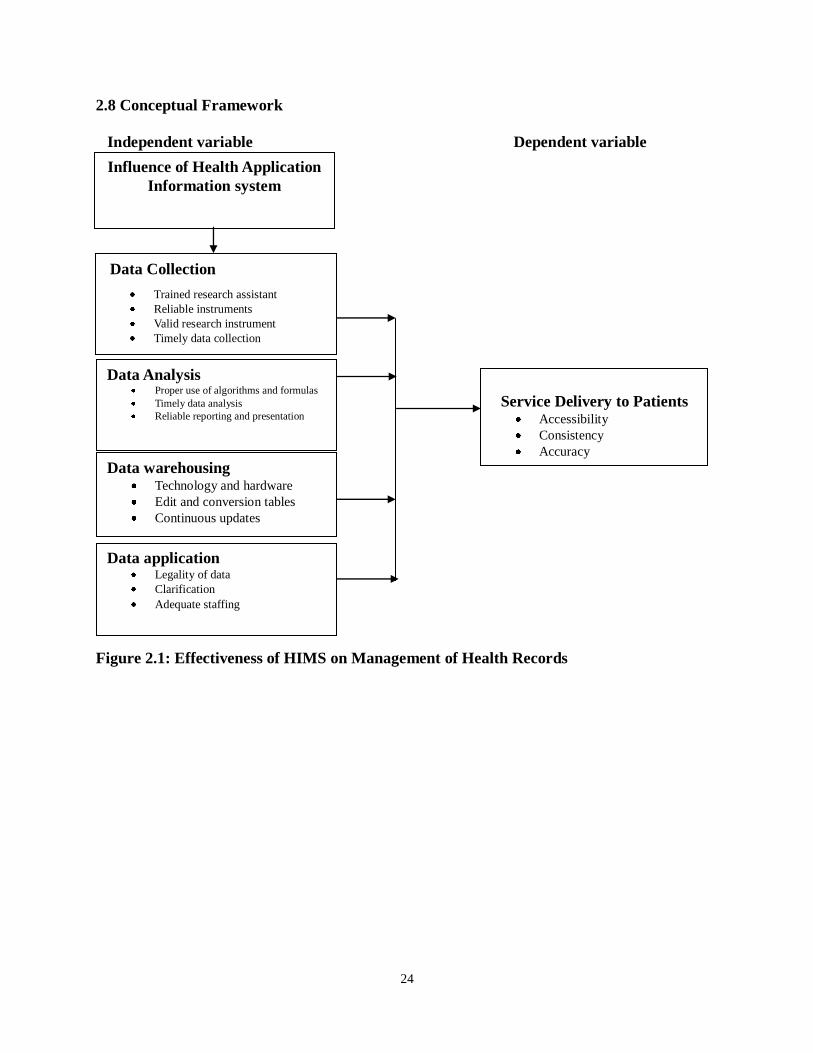
2.8 Conceptual Framework
Figure 2.1: Effectiveness of HIMS on Management of Health Records
Independent variable Dependent variable
Influence of Health Application
Information system
Data Collection
Trained research assistant
Reliable instruments
Valid research instrument
Timely data collection
Data Analysis Proper use of algorithms and formulas
Timely data analysis
Reliable reporting and presentation
Service Delivery to Patients Accessibility
Consistency
Accuracy
Data warehousing Technology and hardware
Edit and conversion tables
Continuous updates
Data application Legality of data
Clarification
Adequate staffing
25
CHAPTER THREE
RESEARCH METHODOLOGY
3.1 Introduction
This chapter looked at the research design, target population, sample size, sampling techniques,
data collection instruments and procedures, validity, reliability of the study and data analysis
components.
3.2 Research Design
The research problem was studied through the use of a descriptive survey research design.
According to Kothari (2004), descriptive research is concerned with specific predictions, with
narration of facts and characters concerning situation. The descriptive design is preferred since it
is carefully structured to ensure complete description of the situation, making sure that there is
minimum bias in the collection of data and to reduce errors in interpreting the data collected.
3.3 Target Population
The target population of the study was 773 employees of Moi Teaching and Referral Hospital
(MTRH). The target population included people from senior management, health records, audit
and accounts and Information and Communication Technology (ICT).
3.4 Sample Size and Sampling Procedures
Sampling is the process of choosing a number of individuals for a study in such a way that the
individuals selected represents the larger group from which they are selected hence representing
the characteristics found in the entire group (Orodho, 2003).
3.4.1 Sample size
The more the sample size approaches the population size, the more representative it is. This
study applied the Krejcie and Morgan formula (attached appendix 1) sample determination to
arrive at the 260 respondents.
26
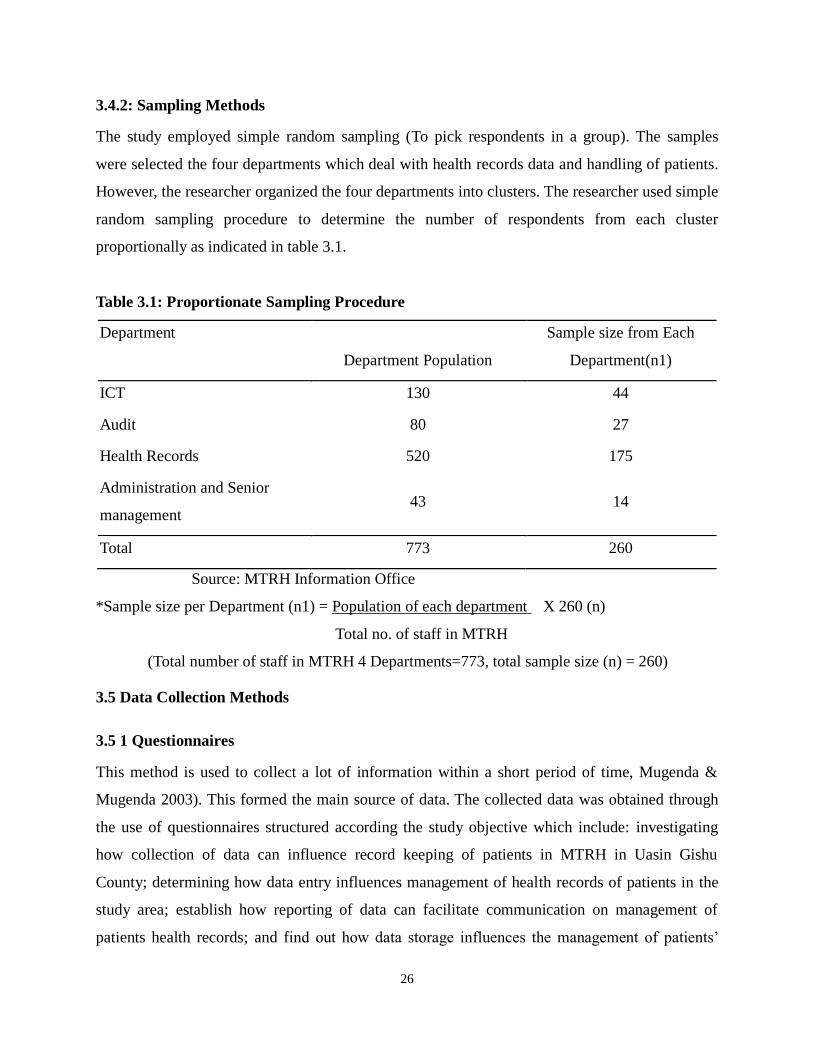
3.4.2: Sampling Methods
The study employed simple random sampling (To pick respondents in a group). The samples
were selected the four departments which deal with health records data and handling of patients.
However, the researcher organized the four departments into clusters. The researcher used simple
random sampling procedure to determine the number of respondents from each cluster
proportionally as indicated in table 3.1.
Table 3.1: Proportionate Sampling Procedure
Department
Department Population
Sample size from Each
Department(n1)
ICT 130 44
Audit 80 27
Health Records 520 175
Administration and Senior
management 43 14
Total 773 260
Source: MTRH Information Office
*Sample size per Department (n1) = Population of each department X 260 (n)
Total no. of staff in MTRH
(Total number of staff in MTRH 4 Departments=773, total sample size (n) = 260)
3.5 Data Collection Methods
3.5 1 Questionnaires
This method is used to collect a lot of information within a short period of time, Mugenda &
Mugenda 2003). This formed the main source of data. The collected data was obtained through
the use of questionnaires structured according the study objective which include: investigating
how collection of data can influence record keeping of patients in MTRH in Uasin Gishu
County; determining how data entry influences management of health records of patients in the
study area; establish how reporting of data can facilitate communication on management of
patients health records; and find out how data storage influences the management of patients‟
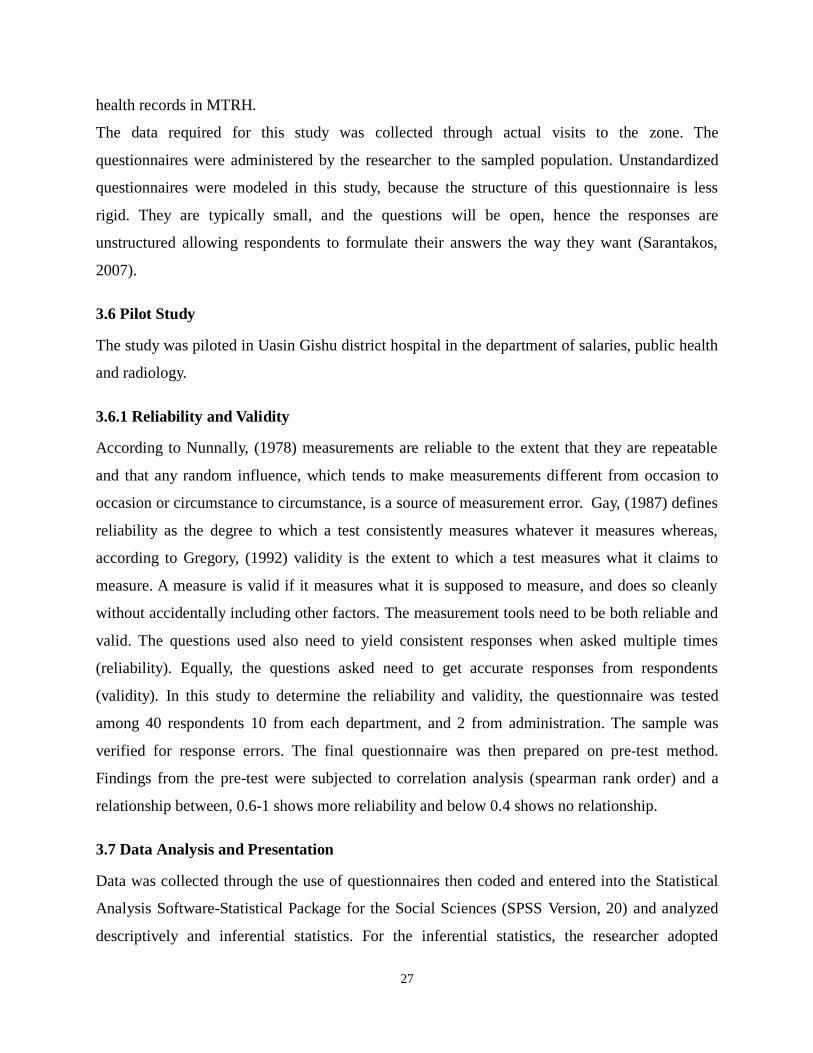
27
health records in MTRH.
The data required for this study was collected through actual visits to the zone. The
questionnaires were administered by the researcher to the sampled population. Unstandardized
questionnaires were modeled in this study, because the structure of this questionnaire is less
rigid. They are typically small, and the questions will be open, hence the responses are
unstructured allowing respondents to formulate their answers the way they want (Sarantakos,
2007).
3.6 Pilot Study
The study was piloted in Uasin Gishu district hospital in the department of salaries, public health
and radiology.
3.6.1 Reliability and Validity
According to Nunnally, (1978) measurements are reliable to the extent that they are repeatable
and that any random influence, which tends to make measurements different from occasion to
occasion or circumstance to circumstance, is a source of measurement error. Gay, (1987) defines
reliability as the degree to which a test consistently measures whatever it measures whereas,
according to Gregory, (1992) validity is the extent to which a test measures what it claims to
measure. A measure is valid if it measures what it is supposed to measure, and does so cleanly
without accidentally including other factors. The measurement tools need to be both reliable and
valid. The questions used also need to yield consistent responses when asked multiple times
(reliability). Equally, the questions asked need to get accurate responses from respondents
(validity). In this study to determine the reliability and validity, the questionnaire was tested
among 40 respondents 10 from each department, and 2 from administration. The sample was
verified for response errors. The final questionnaire was then prepared on pre-test method.
Findings from the pre-test were subjected to correlation analysis (spearman rank order) and a
relationship between, 0.6-1 shows more reliability and below 0.4 shows no relationship.
3.7 Data Analysis and Presentation
Data was collected through the use of questionnaires then coded and entered into the Statistical
Analysis Software-Statistical Package for the Social Sciences (SPSS Version, 20) and analyzed
descriptively and inferential statistics. For the inferential statistics, the researcher adopted

28
spearman‟s rank order correlation (scale of 0 to 1where above 0.5=positive relationship, below
0.4 shows no relationship), while for the descriptive statistics, frequencies, percentages and
means were used as the statistical technique. Kombo and Tromp (2007) further observe that
descriptive approach is designed to obtain information concerning the current phenomenon and
wherever possible to draw valid conclusions from facts discussed.
3.8 Ethical Consideration
Participation in this study was absolutely voluntary. No one was forced to answer questions they
don‟t want to. Informed consent seeks to incorporate the rights of autonomous individuals
through self- determination. It also seeks to prevent assaults on the integrity of the participants
and protect personal liberty and sincerity. Individuals made informed decisions in order to
participate in research voluntarily only if they have information on the possible risks and benefits
of the research. Free and informed consent needs to incorporate an introduction to the study and
its purpose as well as an explanation about the selection of the research subjects and the
procedures that were followed.
The researcher briefed participants to make sure that they do not have any problems or concerns
with the questionnaires. The researcher made sure they answer questions they may have to
ensure that they are completely comfortable with the research experience. The intent of this
interpretation was that no such “constraint or coercion” must be either explicit or implicit on the
part of the investigator. The collective consideration of all three elements of consent has great
impact on the manner in which a study is planned and executed. Each research situation presents
a different set of circumstances, and consent procedures must be adapted accordingly. For
investigators in certain areas, the type of participants frequently studied requires special
consideration and protection. Such participants receive repeated attention in our discussion and
examination of consent issues regarding who and when.
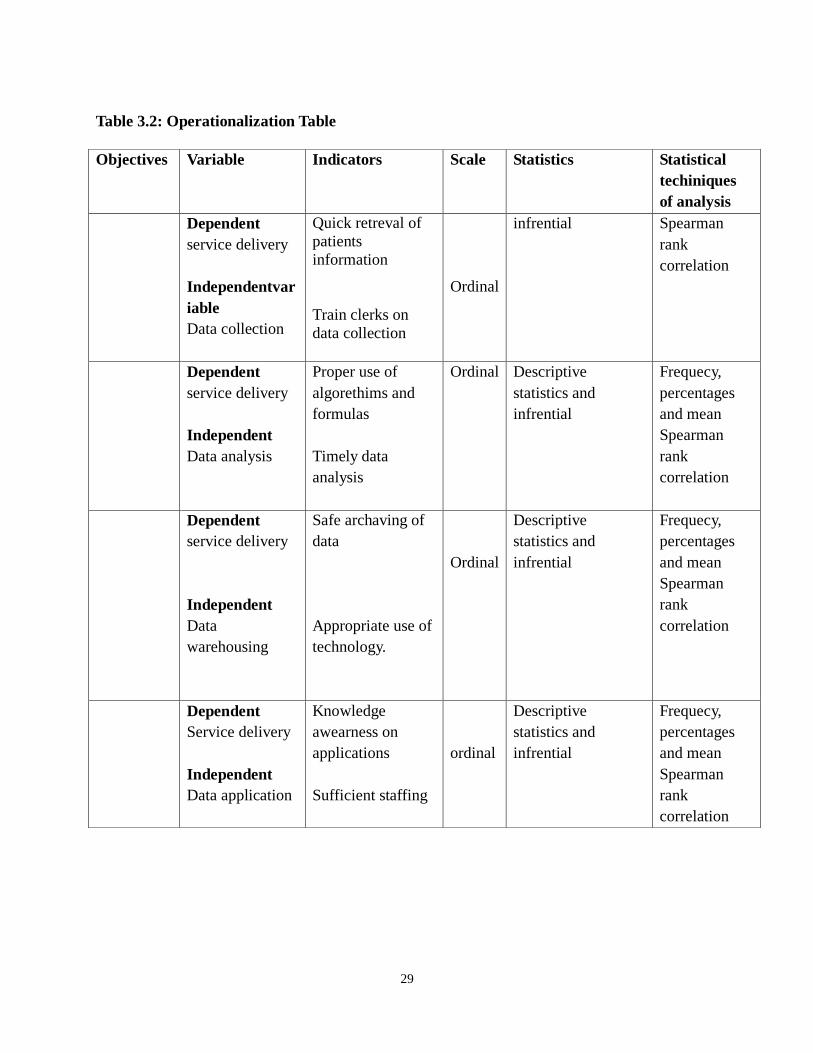
29
Table 3.2: Operationalization Table
Objectives Variable Indicators Scale Statistics Statistical
techiniques
of analysis
Dependent
service delivery
Independentvar
iable
Data collection
Quick retreval of
patients
information
Train clerks on
data collection
Ordinal
infrential Spearman
rank
correlation
Dependent
service delivery
Independent
Data analysis
Proper use of
algorethims and
formulas
Timely data
analysis
Ordinal
Descriptive
statistics and
infrential
Frequecy,
percentages
and mean
Spearman
rank
correlation
Dependent
service delivery
Independent
Data
warehousing
Safe archaving of
data
Appropriate use of
technology.
Ordinal
Descriptive
statistics and
infrential
Frequecy,
percentages
and mean
Spearman
rank
correlation
Dependent
Service delivery
Independent
Data application
Knowledge
awearness on
applications
Sufficient staffing
ordinal
Descriptive
statistics and
infrential
Frequecy,
percentages
and mean
Spearman
rank
correlation
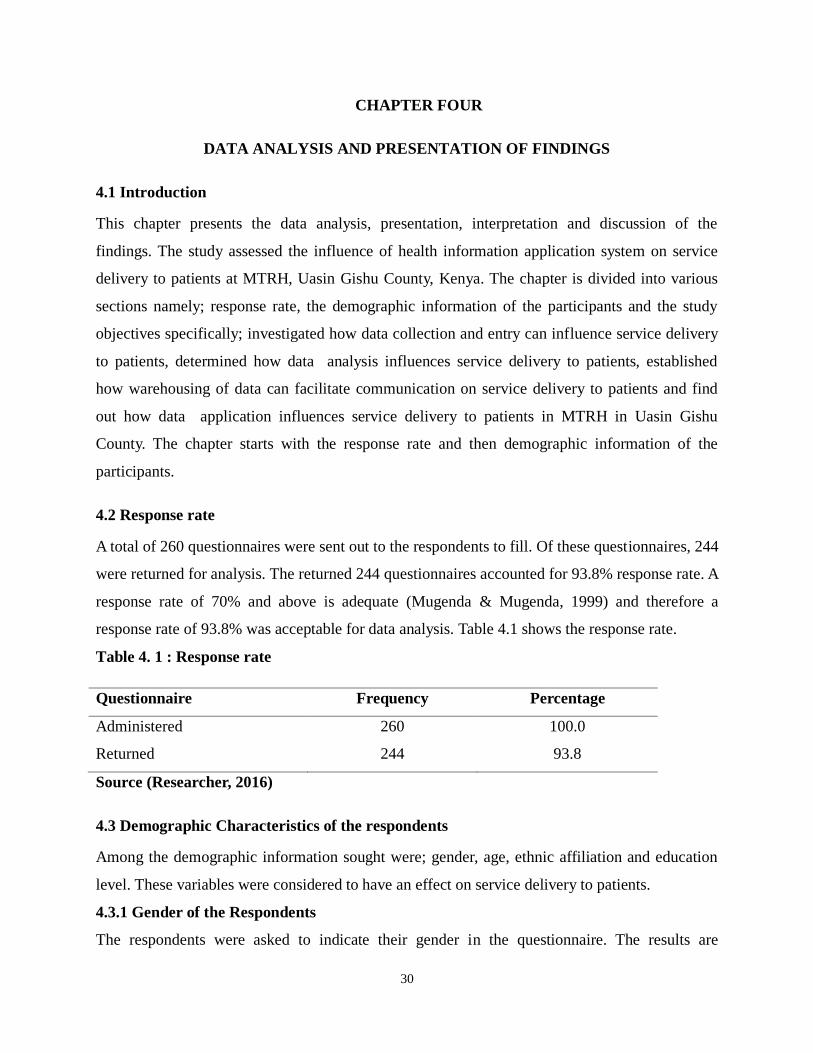
30
CHAPTER FOUR
DATA ANALYSIS AND PRESENTATION OF FINDINGS
4.1 Introduction
This chapter presents the data analysis, presentation, interpretation and discussion of the
findings. The study assessed the influence of health information application system on service
delivery to patients at MTRH, Uasin Gishu County, Kenya. The chapter is divided into various
sections namely; response rate, the demographic information of the participants and the study
objectives specifically; investigated how data collection and entry can influence service delivery
to patients, determined how data analysis influences service delivery to patients, established
how warehousing of data can facilitate communication on service delivery to patients and find
out how data application influences service delivery to patients in MTRH in Uasin Gishu
County. The chapter starts with the response rate and then demographic information of the
participants.
4.2 Response rate
A total of 260 questionnaires were sent out to the respondents to fill. Of these questionnaires, 244
were returned for analysis. The returned 244 questionnaires accounted for 93.8% response rate. A
response rate of 70% and above is adequate (Mugenda & Mugenda, 1999) and therefore a
response rate of 93.8% was acceptable for data analysis. Table 4.1 shows the response rate.
Table 4. 1 : Response rate
Questionnaire Frequency Percentage
Administered 260 100.0
Returned 244 93.8
Source (Researcher, 2016)
4.3 Demographic Characteristics of the respondents
Among the demographic information sought were; gender, age, ethnic affiliation and education
level. These variables were considered to have an effect on service delivery to patients.
4.3.1 Gender of the Respondents
The respondents were asked to indicate their gender in the questionnaire. The results are
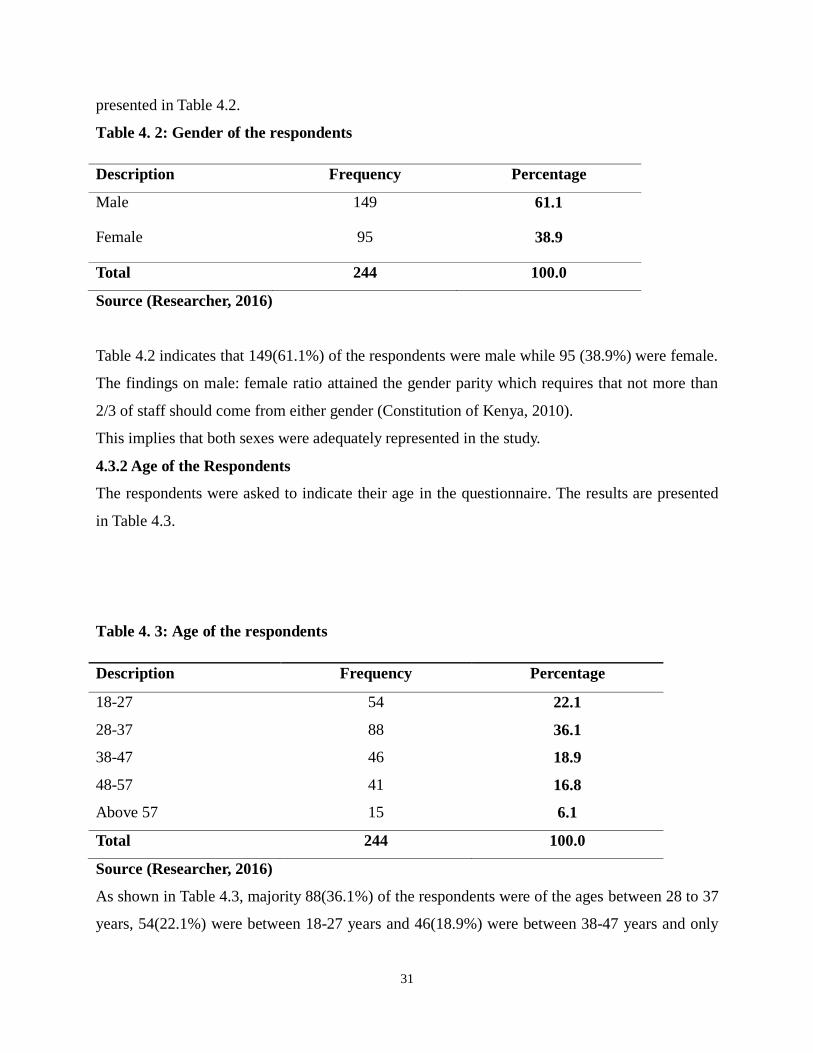
31
presented in Table 4.2.
Table 4. 2: Gender of the respondents
Description Frequency Percentage
Male 149 61.1
Female 95 38.9
Total 244 100.0
Source (Researcher, 2016)
Table 4.2 indicates that 149(61.1%) of the respondents were male while 95 (38.9%) were female.
The findings on male: female ratio attained the gender parity which requires that not more than
2/3 of staff should come from either gender (Constitution of Kenya, 2010).
This implies that both sexes were adequately represented in the study.
4.3.2 Age of the Respondents
The respondents were asked to indicate their age in the questionnaire. The results are presented
in Table 4.3.
Table 4. 3: Age of the respondents
Description Frequency Percentage
18-27 54 22.1
28-37 88 36.1
38-47 46 18.9
48-57 41 16.8
Above 57 15 6.1
Total 244 100.0
Source (Researcher, 2016)
As shown in Table 4.3, majority 88(36.1%) of the respondents were of the ages between 28 to 37
years, 54(22.1%) were between 18-27 years and 46(18.9%) were between 38-47 years and only
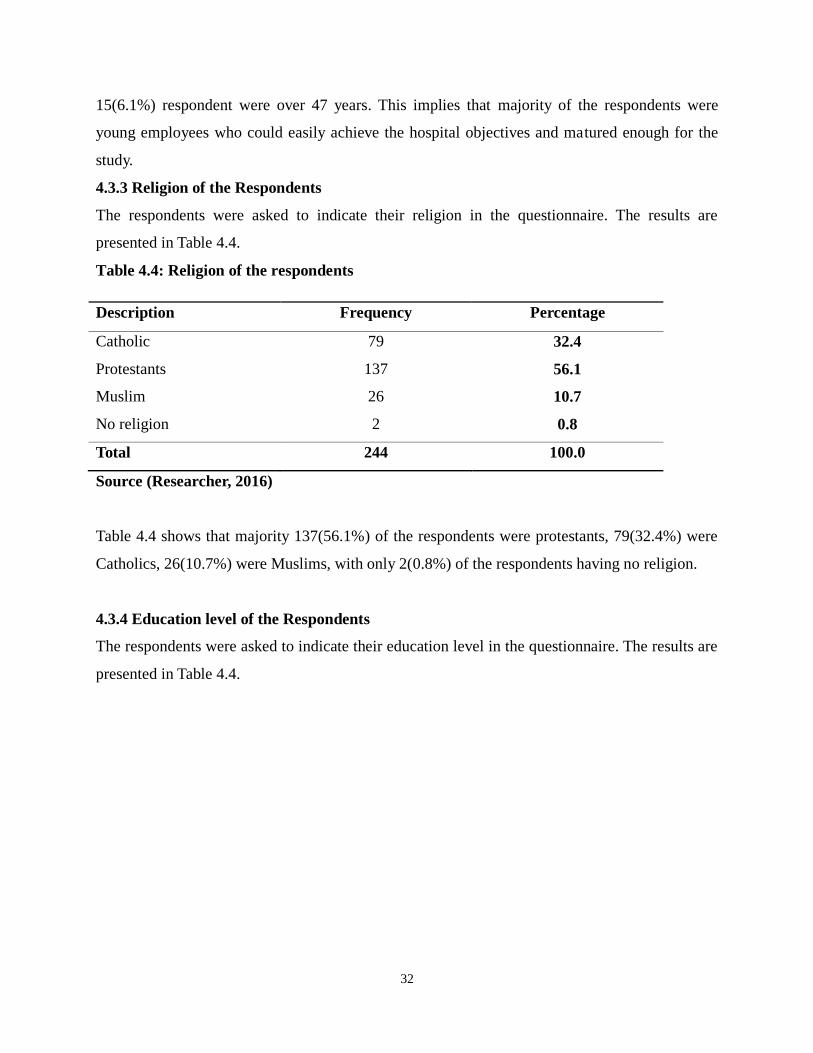
32
15(6.1%) respondent were over 47 years. This implies that majority of the respondents were
young employees who could easily achieve the hospital objectives and matured enough for the
study.
4.3.3 Religion of the Respondents
The respondents were asked to indicate their religion in the questionnaire. The results are
presented in Table 4.4.
Table 4.4: Religion of the respondents
Description Frequency Percentage
Catholic 79 32.4
Protestants 137 56.1
Muslim 26 10.7
No religion 2 0.8
Total 244 100.0
Source (Researcher, 2016)
Table 4.4 shows that majority 137(56.1%) of the respondents were protestants, 79(32.4%) were
Catholics, 26(10.7%) were Muslims, with only 2(0.8%) of the respondents having no religion.
4.3.4 Education level of the Respondents
The respondents were asked to indicate their education level in the questionnaire. The results are
presented in Table 4.4.
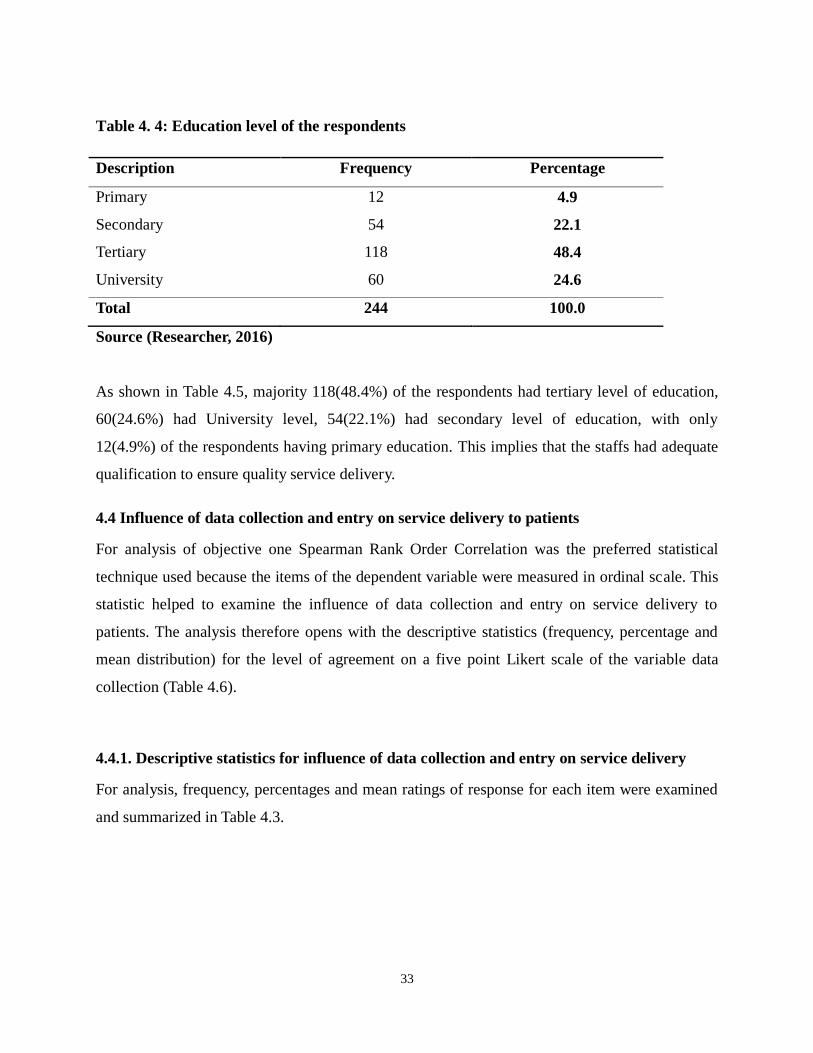
33
Table 4. 4: Education level of the respondents
Description Frequency Percentage
Primary 12 4.9
Secondary 54 22.1
Tertiary 118 48.4
University 60 24.6
Total 244 100.0
Source (Researcher, 2016)
As shown in Table 4.5, majority 118(48.4%) of the respondents had tertiary level of education,
60(24.6%) had University level, 54(22.1%) had secondary level of education, with only
12(4.9%) of the respondents having primary education. This implies that the staffs had adequate
qualification to ensure quality service delivery.
4.4 Influence of data collection and entry on service delivery to patients
For analysis of objective one Spearman Rank Order Correlation was the preferred statistical
technique used because the items of the dependent variable were measured in ordinal scale. This
statistic helped to examine the influence of data collection and entry on service delivery to
patients. The analysis therefore opens with the descriptive statistics (frequency, percentage and
mean distribution) for the level of agreement on a five point Likert scale of the variable data
collection (Table 4.6).
4.4.1. Descriptive statistics for influence of data collection and entry on service delivery
For analysis, frequency, percentages and mean ratings of response for each item were examined
and summarized in Table 4.3.
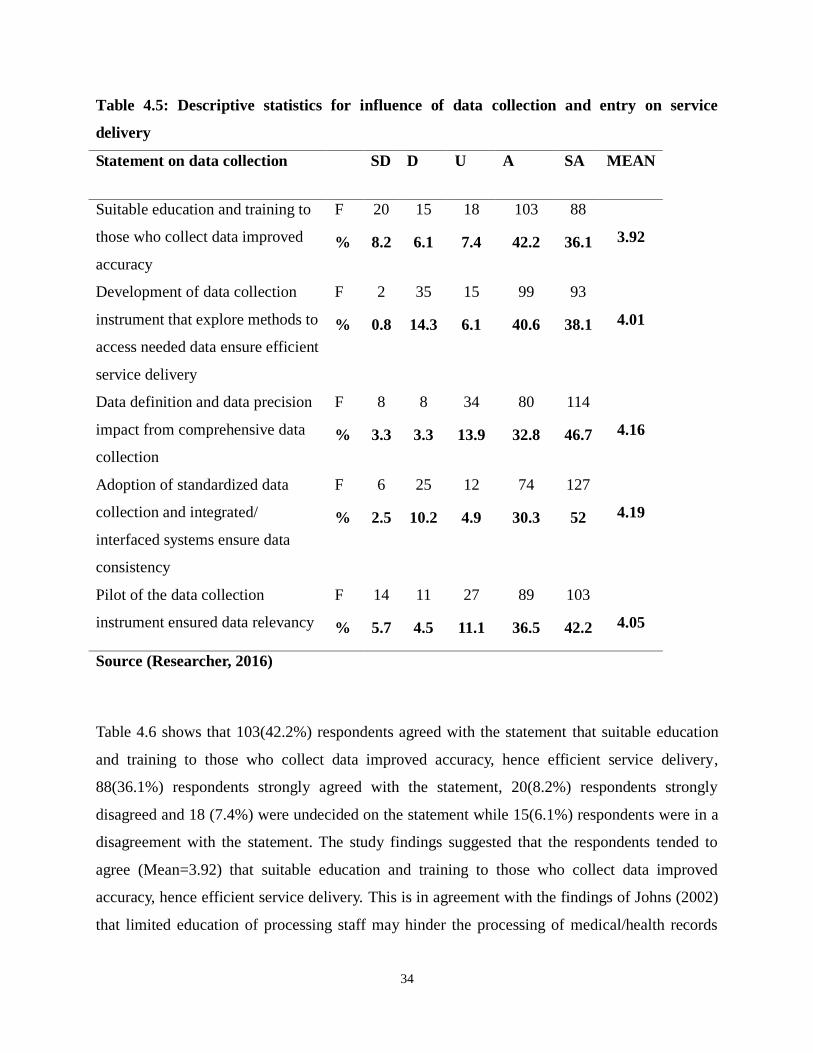
34
Table 4.5: Descriptive statistics for influence of data collection and entry on service
delivery
Statement on data collection SD D U A SA MEAN
Suitable education and training to
those who collect data improved
accuracy
F 20 15 18 103 88
3.92 % 8.2 6.1 7.4 42.2 36.1
Development of data collection
instrument that explore methods to
access needed data ensure efficient
service delivery
F 2 35 15 99 93
4.01 % 0.8 14.3 6.1 40.6 38.1
Data definition and data precision
impact from comprehensive data
collection
F 8 8 34 80 114
4.16 % 3.3 3.3 13.9 32.8 46.7
Adoption of standardized data
collection and integrated/
interfaced systems ensure data
consistency
F 6 25 12 74 127
4.19 % 2.5 10.2 4.9 30.3 52
Pilot of the data collection
instrument ensured data relevancy
F 14 11 27 89 103
4.05 % 5.7 4.5 11.1 36.5 42.2
Source (Researcher, 2016)
Table 4.6 shows that 103(42.2%) respondents agreed with the statement that suitable education
and training to those who collect data improved accuracy, hence efficient service delivery,
88(36.1%) respondents strongly agreed with the statement, 20(8.2%) respondents strongly
disagreed and 18 (7.4%) were undecided on the statement while 15(6.1%) respondents were in a
disagreement with the statement. The study findings suggested that the respondents tended to
agree (Mean=3.92) that suitable education and training to those who collect data improved
accuracy, hence efficient service delivery. This is in agreement with the findings of Johns (2002)
that limited education of processing staff may hinder the processing of medical/health records
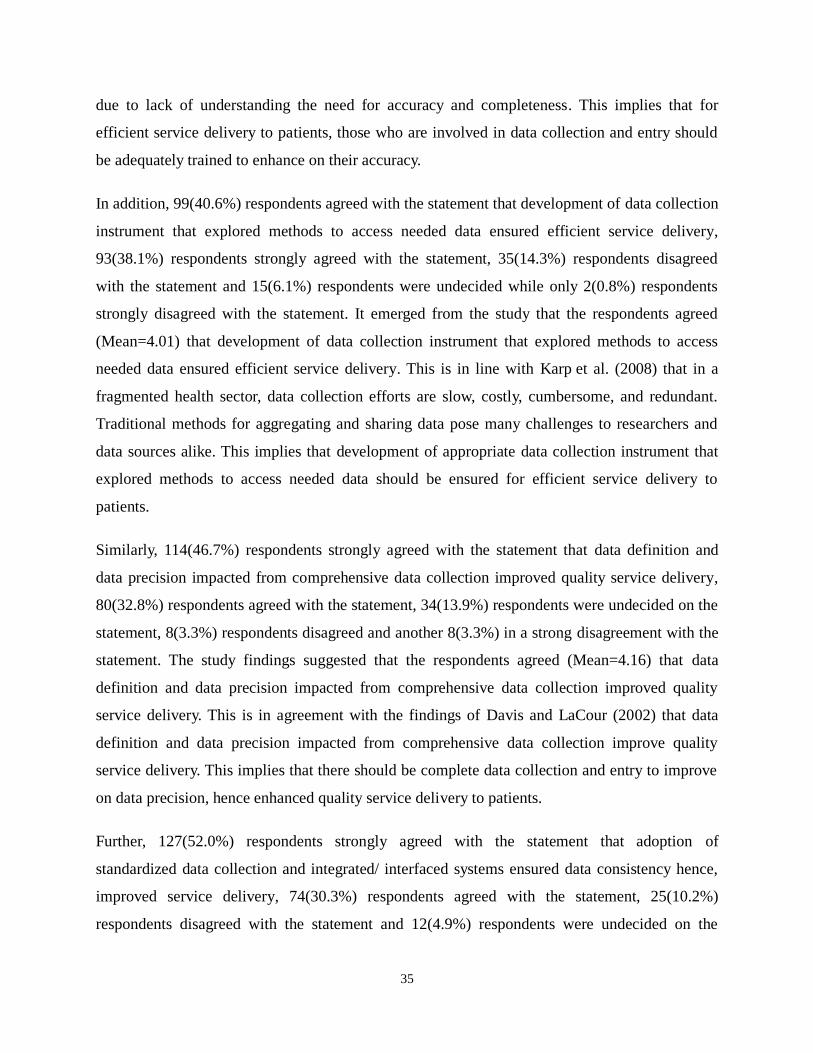
35
due to lack of understanding the need for accuracy and completeness. This implies that for
efficient service delivery to patients, those who are involved in data collection and entry should
be adequately trained to enhance on their accuracy.
In addition, 99(40.6%) respondents agreed with the statement that development of data collection
instrument that explored methods to access needed data ensured efficient service delivery,
93(38.1%) respondents strongly agreed with the statement, 35(14.3%) respondents disagreed
with the statement and 15(6.1%) respondents were undecided while only 2(0.8%) respondents
strongly disagreed with the statement. It emerged from the study that the respondents agreed
(Mean=4.01) that development of data collection instrument that explored methods to access
needed data ensured efficient service delivery. This is in line with Karp et al. (2008) that in a
fragmented health sector, data collection efforts are slow, costly, cumbersome, and redundant.
Traditional methods for aggregating and sharing data pose many challenges to researchers and
data sources alike. This implies that development of appropriate data collection instrument that
explored methods to access needed data should be ensured for efficient service delivery to
patients.
Similarly, 114(46.7%) respondents strongly agreed with the statement that data definition and
data precision impacted from comprehensive data collection improved quality service delivery,
80(32.8%) respondents agreed with the statement, 34(13.9%) respondents were undecided on the
statement, 8(3.3%) respondents disagreed and another 8(3.3%) in a strong disagreement with the
statement. The study findings suggested that the respondents agreed (Mean=4.16) that data
definition and data precision impacted from comprehensive data collection improved quality
service delivery. This is in agreement with the findings of Davis and LaCour (2002) that data
definition and data precision impacted from comprehensive data collection improve quality
service delivery. This implies that there should be complete data collection and entry to improve
on data precision, hence enhanced quality service delivery to patients.
Further, 127(52.0%) respondents strongly agreed with the statement that adoption of
standardized data collection and integrated/ interfaced systems ensured data consistency hence,
improved service delivery, 74(30.3%) respondents agreed with the statement, 25(10.2%)
respondents disagreed with the statement and 12(4.9%) respondents were undecided on the
36
statement while only 6(2.5%) respondents had a strong disagreement with the statement. The
study findings suggested that the respondents agreed (Mean=4.19) that adoption of standardized
data collection and integrated/ interfaced systems ensured data consistency hence, improved
service delivery. This implies that for efficient delivery of data, there should be adoption of
standardized data collection and integrated/ interfaced systems to improve data consistency,
hence enhanced service delivery.
Finally, 103(42.2%) respondents strongly agreed with the statement that pilot of the data
collection instrument ensured data relevancy, thus efficient service delivery, 89(36.5%)
respondents agreed with the statement, 27(11.1%) respondents were undecided on the statement
and 14(5.7%) respondents strongly disagreed while 11(4.5%) respondents disagreed with the
statement. It emerged from the study that the respondents agreed (Mean=4.05) that pilot of the
data collection instrument ensured data relevancy, thus efficient service delivery.
These descriptive statistics of objective one was followed by a Spearman Rank Order Correlation
test to examine the relationship between data collection and entry and service delivery to
patients. This was analyzed under the following sub-section.
4.4.2. Spearman Rank Order Correlation test for relationship between data collection and
service delivery
The Spearman rank Correlation test at p ≤ 0.05 significance relation illustrating statistically
significant relationship between data collection and service delivery in hospitals are as
summarized in Table 4.7. Therefore, Table 4.7 presents the Spearman rank Order Correlation test
that was conducted to examine whether there is a statistically significant relationship between
data collection and service delivery in hospitals.
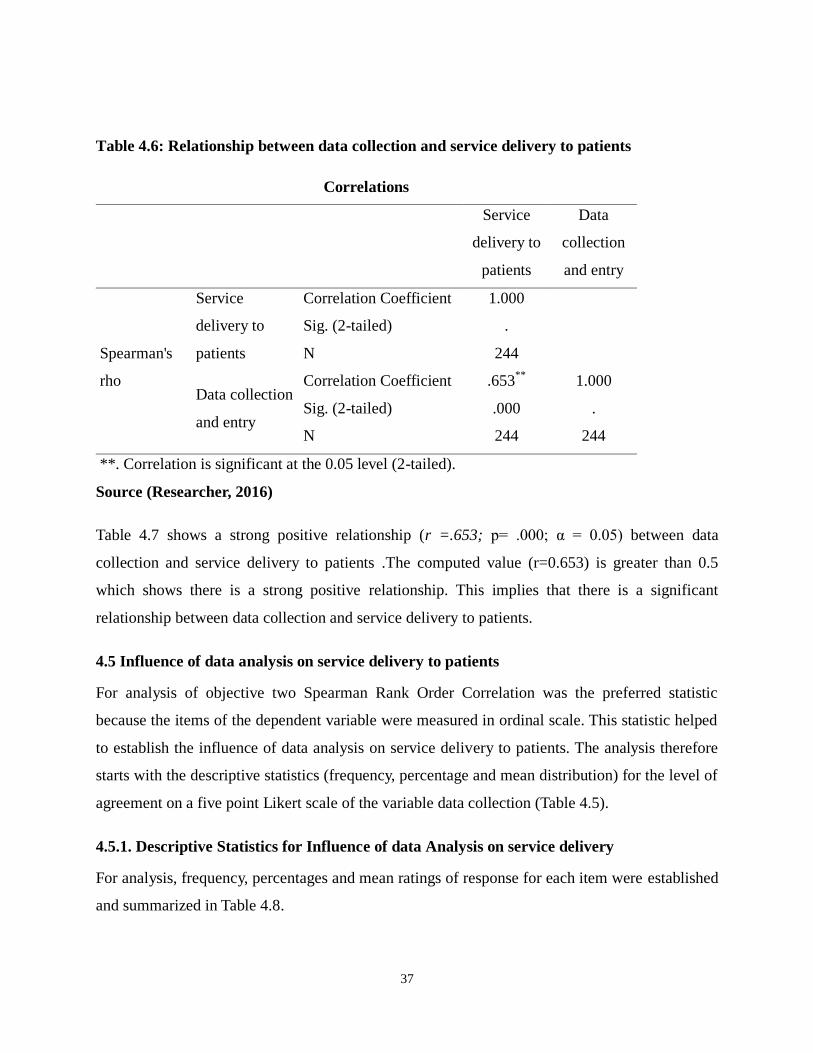
37
Table 4.6: Relationship between data collection and service delivery to patients
Correlations
Service
delivery to
patients
Data
collection
and entry
Spearman's
rho
Service
delivery to
patients
Correlation Coefficient 1.000
Sig. (2-tailed) .
N 244
Data collection
and entry
Correlation Coefficient .653**
1.000
Sig. (2-tailed) .000 .
N 244 244
**. Correlation is significant at the 0.05 level (2-tailed).
Source (Researcher, 2016)
Table 4.7 shows a strong positive relationship (r =.653; p= .000; α = 0.05) between data
collection and service delivery to patients .The computed value (r=0.653) is greater than 0.5
which shows there is a strong positive relationship. This implies that there is a significant
relationship between data collection and service delivery to patients.
4.5 Influence of data analysis on service delivery to patients
For analysis of objective two Spearman Rank Order Correlation was the preferred statistic
because the items of the dependent variable were measured in ordinal scale. This statistic helped
to establish the influence of data analysis on service delivery to patients. The analysis therefore
starts with the descriptive statistics (frequency, percentage and mean distribution) for the level of
agreement on a five point Likert scale of the variable data collection (Table 4.5).
4.5.1. Descriptive Statistics for Influence of data Analysis on service delivery
For analysis, frequency, percentages and mean ratings of response for each item were established
and summarized in Table 4.8.
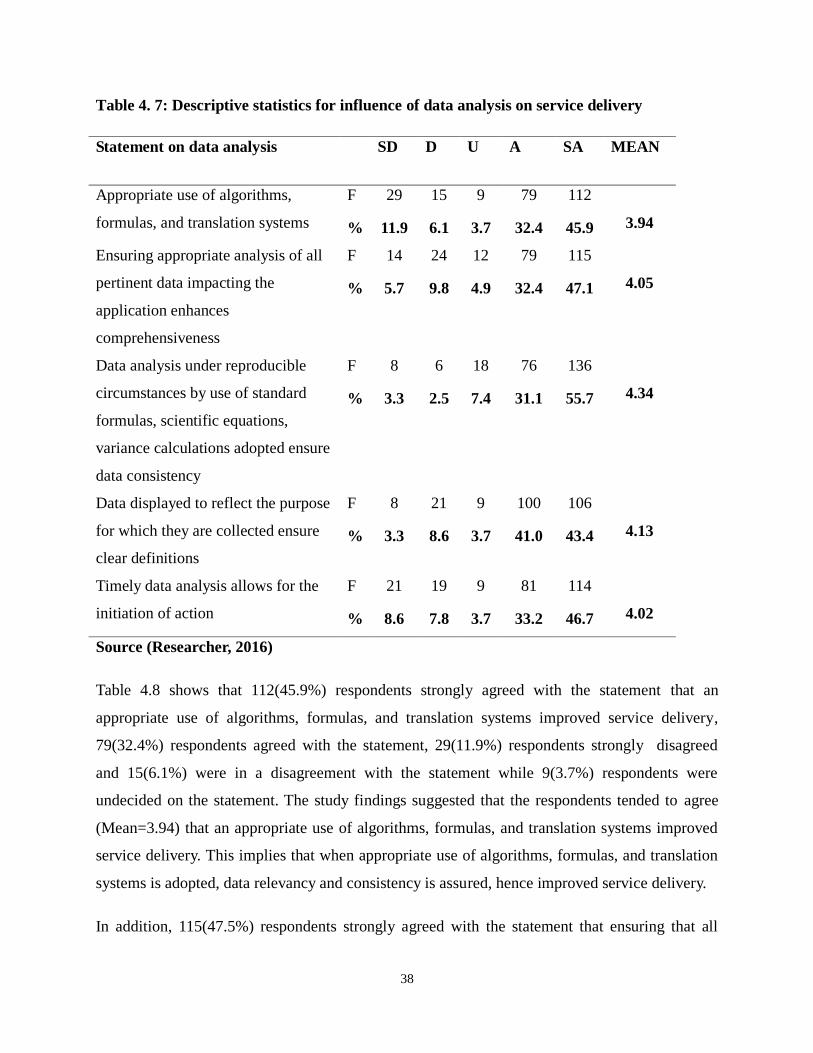
38
Table 4. 7: Descriptive statistics for influence of data analysis on service delivery
Statement on data analysis SD D U A SA MEAN
Appropriate use of algorithms,
formulas, and translation systems
F 29 15 9 79 112
3.94 % 11.9 6.1 3.7 32.4 45.9
Ensuring appropriate analysis of all
pertinent data impacting the
application enhances
comprehensiveness
F 14 24 12 79 115
4.05 % 5.7 9.8 4.9 32.4 47.1
Data analysis under reproducible
circumstances by use of standard
formulas, scientific equations,
variance calculations adopted ensure
data consistency
F 8 6 18 76 136
4.34 % 3.3 2.5 7.4 31.1 55.7
Data displayed to reflect the purpose
for which they are collected ensure
clear definitions
F 8 21 9 100 106
4.13 % 3.3 8.6 3.7 41.0 43.4
Timely data analysis allows for the
initiation of action
F 21 19 9 81 114
4.02 % 8.6 7.8 3.7 33.2 46.7
Source (Researcher, 2016)
Table 4.8 shows that 112(45.9%) respondents strongly agreed with the statement that an
appropriate use of algorithms, formulas, and translation systems improved service delivery,
79(32.4%) respondents agreed with the statement, 29(11.9%) respondents strongly disagreed
and 15(6.1%) were in a disagreement with the statement while 9(3.7%) respondents were
undecided on the statement. The study findings suggested that the respondents tended to agree
(Mean=3.94) that an appropriate use of algorithms, formulas, and translation systems improved
service delivery. This implies that when appropriate use of algorithms, formulas, and translation
systems is adopted, data relevancy and consistency is assured, hence improved service delivery.
In addition, 115(47.5%) respondents strongly agreed with the statement that ensuring that all
39
pertinent data impacting the application were analyzed appropriately improved data
comprehensiveness, hence efficient service delivery, 79(32.4%) respondents agreed with the
statement, 24(9.8%) respondents disagreed with the statement and 14(5.7%) respondents were in
a strong disagreement while 12(4.9%) respondents were undecided on the statement. It emerged
from the study that the respondents agreed (Mean=4.05) that ensuring that all pertinent data
impacting the application were analyzed appropriately improved data comprehensiveness hence
efficient service delivery. This implies that for efficient service delivery, all relevant data
impacting the application should be analyzed appropriately to improve data comprehensiveness,
hence efficient service delivery.
Similarly, 136(55.7%) respondents strongly agreed with the statement that data analysis under
reproducible circumstances by use of standard formulas, scientific equations, variance
calculations adopted ensured data consistency, hence efficient service delivery, 76(31.1%)
respondents agreed with the statement, 18(7.4%) respondents were undecided on the statement,
8(3.3%) respondents strongly disagreed and 6(2.5%) disagreed with the statement. The study
findings suggested that the respondents agreed (Mean=4.34) that data analysis under
reproducible circumstances by use of standard formulas, scientific equations, variance
calculations adopted ensured data consistency, hence efficient service delivery. This implies that
data analysis by use of standard formulas, scientific equations, variance calculations should be
adopted to ensure data consistency, hence efficient service delivery.
Further, 106(43.4%) respondents strongly agreed with the statement that data displayed to reflect
the purpose for which they were collected ensured clear definitions of data, hence quality service
delivery, 100(41.0%) respondents agreed with the statement, 21(8.6%) respondents disagreed
with the statement and 9(3.7%) respondents were undecided on the statement while 8(3.3%)
respondents had a strong disagreement with the statement. The study findings suggested that the
respondents agreed (Mean=4.13) that data displayed to reflect the purpose for which they were
collected ensured clear definitions of data, hence quality service delivery. This implies that for
efficient service delivery, data should be displayed to reflect the purpose for which they were
collected.
Finally, 114(46.7%) respondents strongly agreed with the statement that timely data analysis
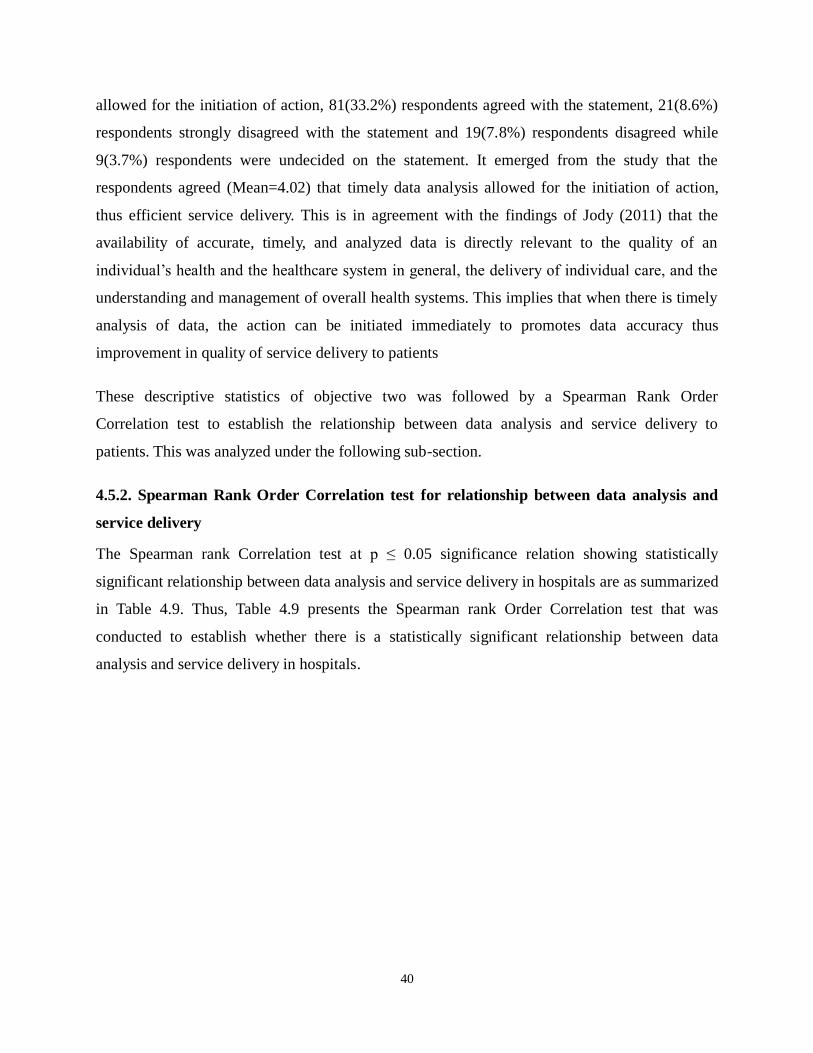
40
allowed for the initiation of action, 81(33.2%) respondents agreed with the statement, 21(8.6%)
respondents strongly disagreed with the statement and 19(7.8%) respondents disagreed while
9(3.7%) respondents were undecided on the statement. It emerged from the study that the
respondents agreed (Mean=4.02) that timely data analysis allowed for the initiation of action,
thus efficient service delivery. This is in agreement with the findings of Jody (2011) that the
availability of accurate, timely, and analyzed data is directly relevant to the quality of an
individual‟s health and the healthcare system in general, the delivery of individual care, and the
understanding and management of overall health systems. This implies that when there is timely
analysis of data, the action can be initiated immediately to promotes data accuracy thus
improvement in quality of service delivery to patients
These descriptive statistics of objective two was followed by a Spearman Rank Order
Correlation test to establish the relationship between data analysis and service delivery to
patients. This was analyzed under the following sub-section.
4.5.2. Spearman Rank Order Correlation test for relationship between data analysis and
service delivery
The Spearman rank Correlation test at p ≤ 0.05 significance relation showing statistically
significant relationship between data analysis and service delivery in hospitals are as summarized
in Table 4.9. Thus, Table 4.9 presents the Spearman rank Order Correlation test that was
conducted to establish whether there is a statistically significant relationship between data
analysis and service delivery in hospitals.
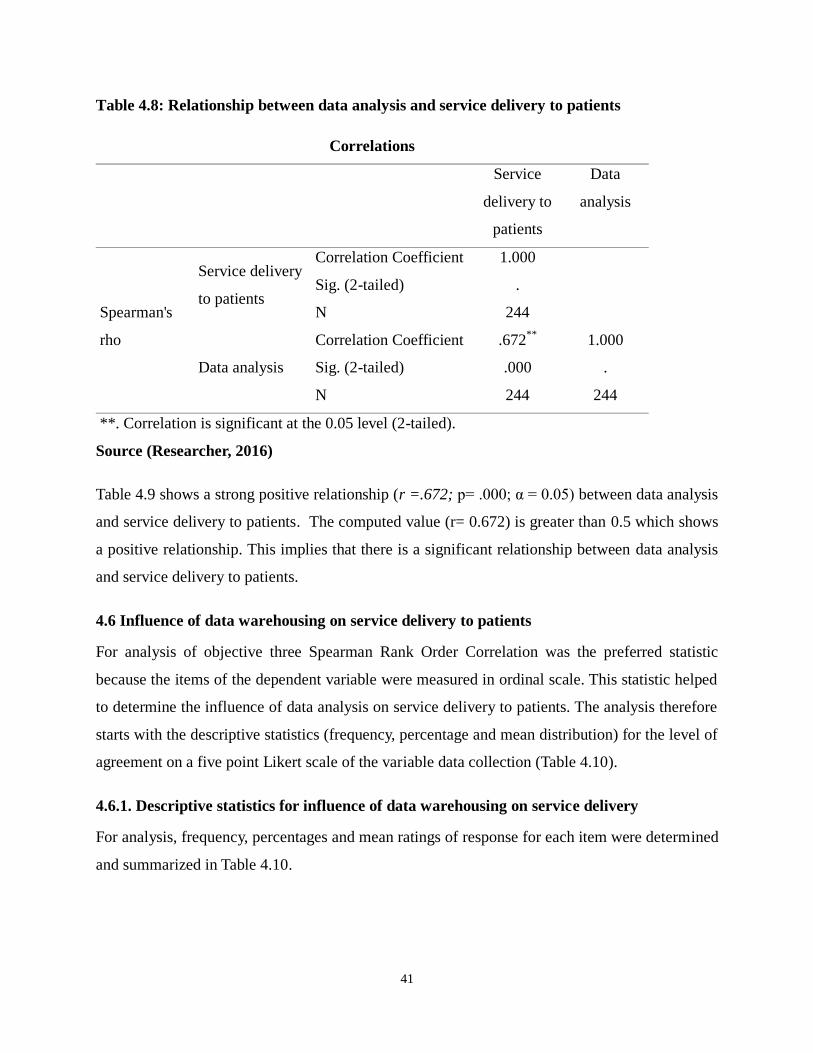
41
Table 4.8: Relationship between data analysis and service delivery to patients
Correlations
Service
delivery to
patients
Data
analysis
Spearman's
rho
Service delivery
to patients
Correlation Coefficient 1.000
Sig. (2-tailed) .
N 244
Data analysis
Correlation Coefficient .672**
1.000
Sig. (2-tailed) .000 .
N 244 244
**. Correlation is significant at the 0.05 level (2-tailed).
Source (Researcher, 2016)
Table 4.9 shows a strong positive relationship (r =.672; p= .000; α = 0.05) between data analysis
and service delivery to patients. The computed value (r= 0.672) is greater than 0.5 which shows
a positive relationship. This implies that there is a significant relationship between data analysis
and service delivery to patients.
4.6 Influence of data warehousing on service delivery to patients
For analysis of objective three Spearman Rank Order Correlation was the preferred statistic
because the items of the dependent variable were measured in ordinal scale. This statistic helped
to determine the influence of data analysis on service delivery to patients. The analysis therefore
starts with the descriptive statistics (frequency, percentage and mean distribution) for the level of
agreement on a five point Likert scale of the variable data collection (Table 4.10).
4.6.1. Descriptive statistics for influence of data warehousing on service delivery
For analysis, frequency, percentages and mean ratings of response for each item were determined
and summarized in Table 4.10.
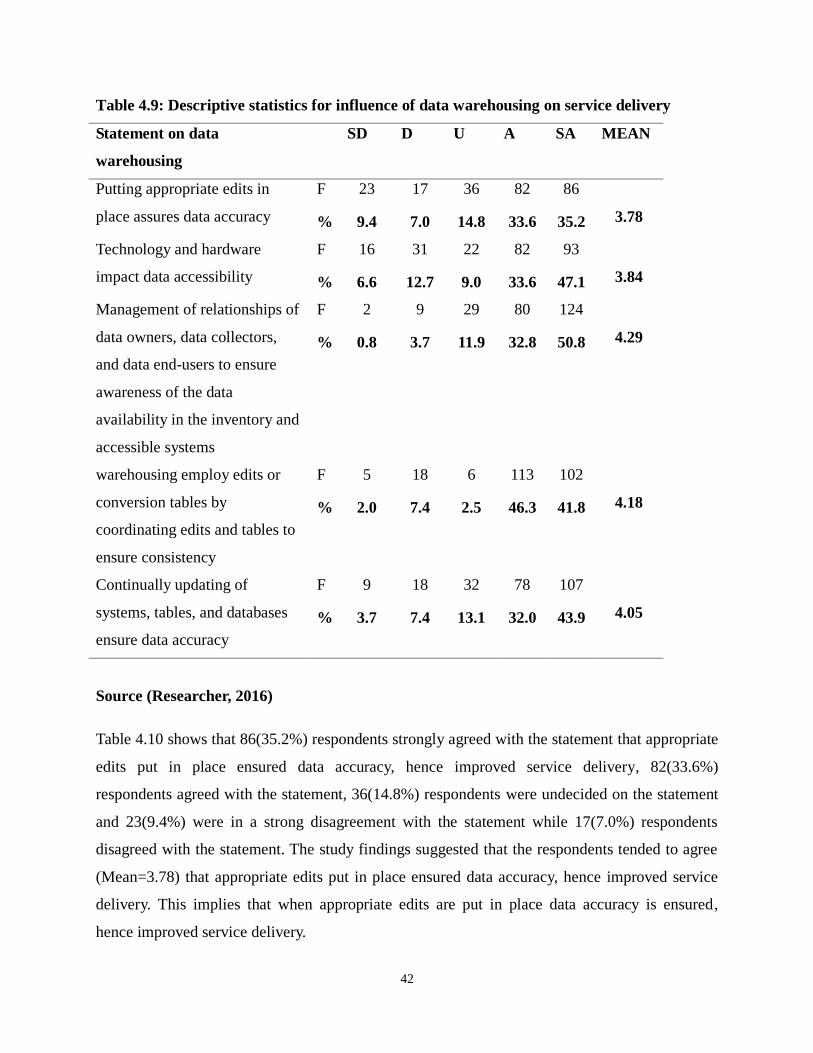
42
Table 4.9: Descriptive statistics for influence of data warehousing on service delivery
Statement on data
warehousing
SD D U A SA MEAN
Putting appropriate edits in
place assures data accuracy
F 23 17 36 82 86
3.78 % 9.4 7.0 14.8 33.6 35.2
Technology and hardware
impact data accessibility
F 16 31 22 82 93
3.84 % 6.6 12.7 9.0 33.6 47.1
Management of relationships of
data owners, data collectors,
and data end-users to ensure
awareness of the data
availability in the inventory and
accessible systems
F 2 9 29 80 124
4.29 % 0.8 3.7 11.9 32.8 50.8
warehousing employ edits or
conversion tables by
coordinating edits and tables to
ensure consistency
F 5 18 6 113 102
4.18 % 2.0 7.4 2.5 46.3 41.8
Continually updating of
systems, tables, and databases
ensure data accuracy
F 9 18 32 78 107
4.05 % 3.7 7.4 13.1 32.0 43.9
Source (Researcher, 2016)
Table 4.10 shows that 86(35.2%) respondents strongly agreed with the statement that appropriate
edits put in place ensured data accuracy, hence improved service delivery, 82(33.6%)
respondents agreed with the statement, 36(14.8%) respondents were undecided on the statement
and 23(9.4%) were in a strong disagreement with the statement while 17(7.0%) respondents
disagreed with the statement. The study findings suggested that the respondents tended to agree
(Mean=3.78) that appropriate edits put in place ensured data accuracy, hence improved service
delivery. This implies that when appropriate edits are put in place data accuracy is ensured,
hence improved service delivery.
43
In addition, 93(47.1%) respondents strongly agreed with the statement that technology and
hardware impacted data accessibility, hence enhanced service delivery, 82(33.6%) respondents
agreed with the statement, 31(12.7%) respondents disagreed with the statement and 22(9.0%)
respondents were undecided on the statement while 16(6.6%) respondents strongly disagreed
with the statement. It emerged from the study that the respondents tended to agreed (Mean=3.84)
that technology and hardware impacted data accessibility, hence enhanced service delivery. This
is in line with the findings of Aghajani (2002), Chaudhry (2006) and Bower, 2005 Hersh (2002)
and Nyamtema (2010) that technology and hardware impacted data accessibility, hence enhanced
service delivery. However, contradicts the findings of Wootton (2009); Ruder et al (2008); Chan
and Kaufman (2010) that, while the assumption is made that technology can and does have a
positive effect in healthcare; the evidence base supporting its practical use is slender.
Similarly, 124(50.8%) respondents strongly agreed with the statement that management of
relationships of data owners, data collectors, and data end-users to ensured awareness of the data
availability in the inventory and accessible systems, 80(32.8%) respondents agreed with the
statement, 29(11.9%) respondents were undecided on the statement, 9(3.7%) respondents
disagreed and 2(0.8%) strongly disagreed with the statement. The study findings suggested that
the respondents agreed (Mean=4.29) that management of relationships of data owners, data
collectors, and data end-users to ensure awareness of the data availability in the inventory and
accessible systems. This is in line with the findings of Aryee (2014) that, most healthcare centers
keep patients‟ medical records in folders that seem to be hard to keep because of limited storage
capacity and poor record-keeping practices. This implies that for quality service delivery,
management of relationships of data owners, data collectors, and data end-users to ensure
awareness of the storage capacity and record-keeping practices should be ensured for data
availability in the inventory and accessible systems.
Further, 113(46.3%) respondents agreed with the statement that warehousing employed edits or
conversion tables by coordinating edits and tables to ensure consistency, hence improved service
delivery, 102(41.8%) respondents strongly agreed with the statement, 18(7.4%) respondents
disagreed with the statement and 6(2.5%) respondents were undecided on the statement while
5(2.0%) respondents had a strong disagreement with the statement. The study findings suggested
that the respondents agreed (Mean=4.18) that warehousing employed edits or conversion tables
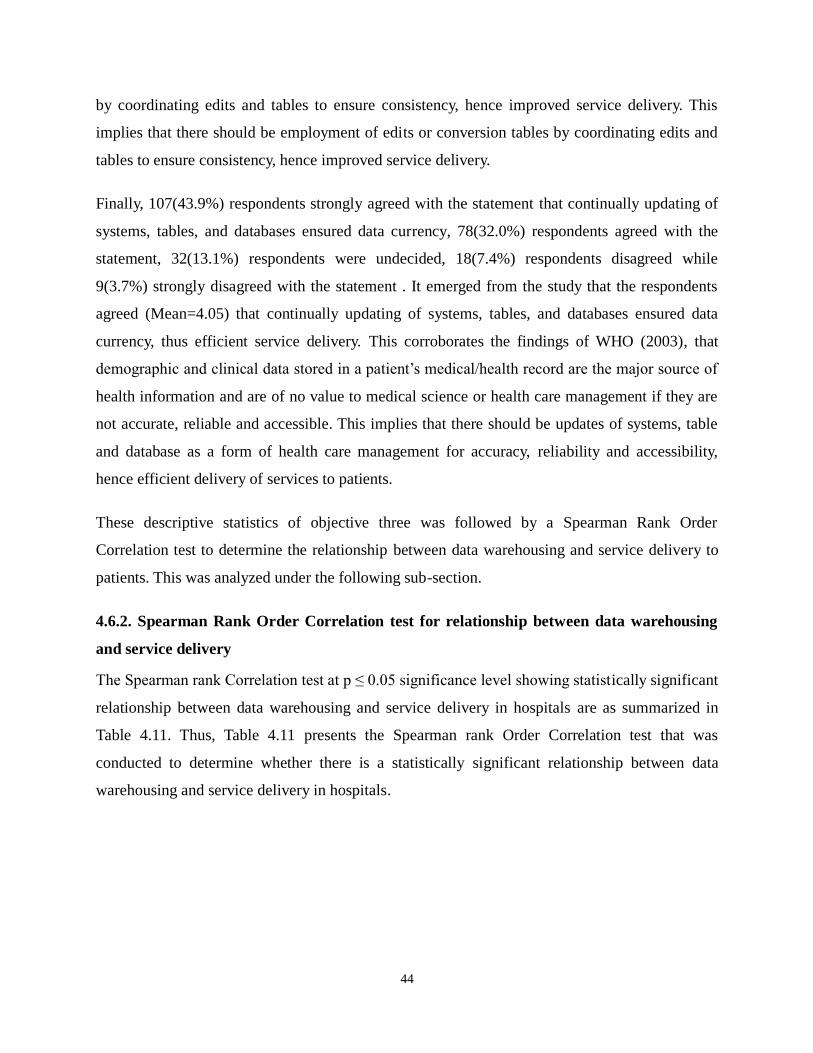
44
by coordinating edits and tables to ensure consistency, hence improved service delivery. This
implies that there should be employment of edits or conversion tables by coordinating edits and
tables to ensure consistency, hence improved service delivery.
Finally, 107(43.9%) respondents strongly agreed with the statement that continually updating of
systems, tables, and databases ensured data currency, 78(32.0%) respondents agreed with the
statement, 32(13.1%) respondents were undecided, 18(7.4%) respondents disagreed while
9(3.7%) strongly disagreed with the statement . It emerged from the study that the respondents
agreed (Mean=4.05) that continually updating of systems, tables, and databases ensured data
currency, thus efficient service delivery. This corroborates the findings of WHO (2003), that
demographic and clinical data stored in a patient‟s medical/health record are the major source of
health information and are of no value to medical science or health care management if they are
not accurate, reliable and accessible. This implies that there should be updates of systems, table
and database as a form of health care management for accuracy, reliability and accessibility,
hence efficient delivery of services to patients.
These descriptive statistics of objective three was followed by a Spearman Rank Order
Correlation test to determine the relationship between data warehousing and service delivery to
patients. This was analyzed under the following sub-section.
4.6.2. Spearman Rank Order Correlation test for relationship between data warehousing
and service delivery
The Spearman rank Correlation test at p ≤ 0.05 significance level showing statistically significant
relationship between data warehousing and service delivery in hospitals are as summarized in
Table 4.11. Thus, Table 4.11 presents the Spearman rank Order Correlation test that was
conducted to determine whether there is a statistically significant relationship between data
warehousing and service delivery in hospitals.
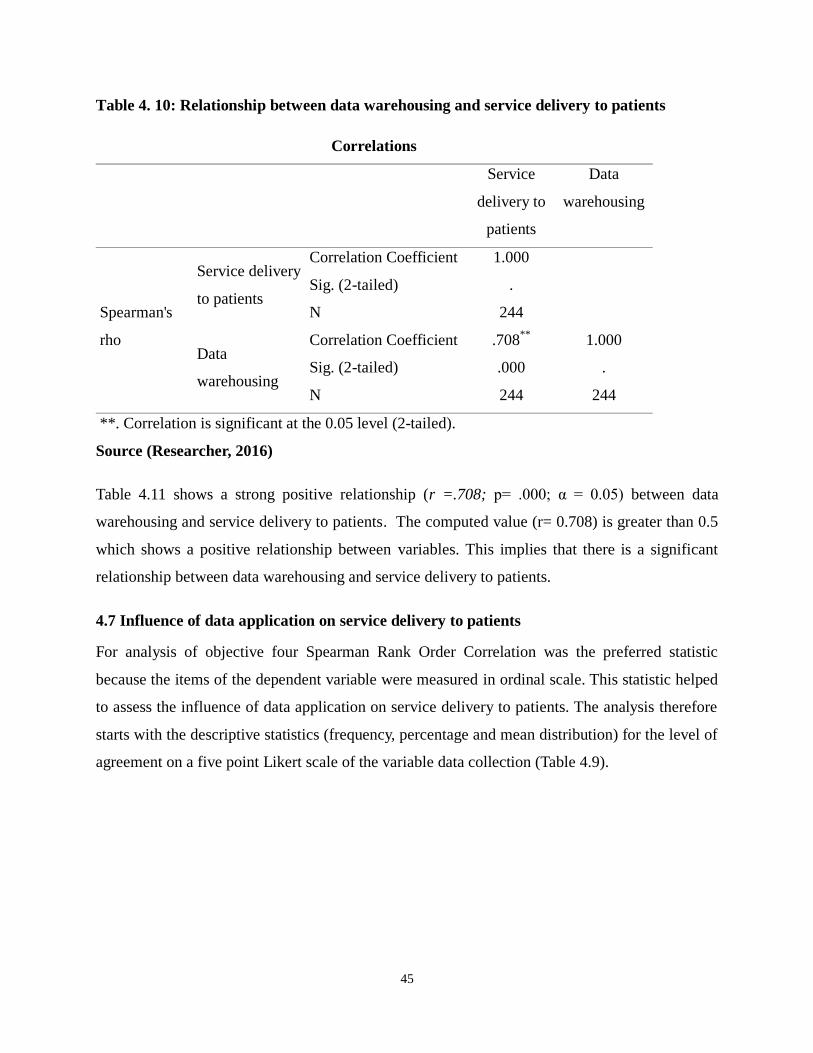
45
Table 4. 10: Relationship between data warehousing and service delivery to patients
Correlations
Service
delivery to
patients
Data
warehousing
Spearman's
rho
Service delivery
to patients
Correlation Coefficient 1.000
Sig. (2-tailed) .
N 244
Data
warehousing
Correlation Coefficient .708**
1.000
Sig. (2-tailed) .000 .
N 244 244
**. Correlation is significant at the 0.05 level (2-tailed).
Source (Researcher, 2016)
Table 4.11 shows a strong positive relationship (r =.708; p= .000; α = 0.05) between data
warehousing and service delivery to patients. The computed value (r= 0.708) is greater than 0.5
which shows a positive relationship between variables. This implies that there is a significant
relationship between data warehousing and service delivery to patients.
4.7 Influence of data application on service delivery to patients
For analysis of objective four Spearman Rank Order Correlation was the preferred statistic
because the items of the dependent variable were measured in ordinal scale. This statistic helped
to assess the influence of data application on service delivery to patients. The analysis therefore
starts with the descriptive statistics (frequency, percentage and mean distribution) for the level of
agreement on a five point Likert scale of the variable data collection (Table 4.9).
46
4.7.1. Descriptive statistics for influence of data application on service delivery
For analysis, frequency, percentages and mean ratings of response for each item were assessed
and summarized in Table 4.12.
Table 4.11: Descriptive statistics for influence of data application on service delivery
Statement on data application SD D U A SA MEAN
Clearly determined aim for
collecting data improve data
accuracy
F 32 15 14 109 74
3.73 % 13.1 6.1 5.7 44.7 30.3
Legality of the available data to be
collected for application improved
data accessibility
F 13 25 15 106 85
3.92 % 5.3 10.2 6.1 43.4 34.8
Clarification on data usage and
identification of end-users,
enhances data comprehensiveness
F 5 9 32 67 131
4.27
% 2.0 3.7 13.1 27.5 53.7
Consideration of the changes in
appropriateness or value of an
application improve data currency
F 8 21 6 110 99
4.11
% 3.7 8.6 2.5 45.1 40.6
Adequate staffing is ensured
through continues patient census
F 11 30 25 87 91
3.89 % 4.5 12.3 10.2 35.7 37.3
Source (Researcher, 2016)
Table 4.12 shows that 109(44.7%) respondents agreed with the statement that a clearly
determined aim for collecting data improved data accuracy, hence quality service delivery,
74(30.3%) respondents strongly agreed with the statement, 32(13.1%) respondents strongly
disagreed with the statement and 15(6.1%) were in a disagreement with the statement while
47
14(5.7%) respondents were undecided on the statement. The study findings suggested that the
respondents tended to agree (Mean=3.73) that a clearly determined aim for collecting data
improved data accuracy, hence quality service delivery. This implies that when the aim for
collecting data is clearly determined data accuracy is improved, hence quality service delivery
Similarly, 106(43.4%) respondents agreed with the statement that the legality of the available
data to be collected for application improved data accessibility, hence enhanced service delivery,
85(34.8%) respondents strongly agreed with the statement, 23(10.2%) respondents disagreed
with the statement and 15(6.1%) respondents were undecided on the statement while 13(5.3%)
respondents strongly disagreed with the statement. It emerged from the study that the
respondents tended to agreed (Mean=3.92) that legality of the available data to be collected for
application improved data accessibility, hence enhanced service delivery. This is in agreement
with the findings of Kazanjian & Green (2002) and Wootton (2009) that health decision makers
are often unaware of the information they lack, and rarely obtain feedback on the consequences
of their decisions, costs, ethical, legal or social implications of technology. This implies that
when the legality of the available data to be collected for application is ensured the data
accessibility is improved hence efficient service delivery to patients.
In addition, 131(53.7%) respondents strongly agreed with the statement that clarification on data
usage and identification of end-users, enhances data comprehensiveness, thus efficient service
delivery, 67(27.5%) respondents agreed with the statement, 32(13.1%) respondents were
undecided on the statement, 9(3.7%) respondents disagreed and 5(2.0%) strongly disagreed with
the statement. The study findings suggested that the respondents agreed (Mean=4.27) that
clarification on data usage and identification of end-users, enhances data comprehensiveness,
thus efficient service delivery. This is in agreement with the findings of Dooling (2011) that
health care professionals spend a significant proportion of their working time collecting large
amounts of client and patient data that is rarely analyzed and used at the point of collection. This
implies that when clarification on data usage and identification of end-users is ensured, data
comprehensiveness is improved, thus efficient service delivery
Further, 110(45.1%) respondents agreed with the statement that consideration of the changes in
appropriateness or value of an application improved data currency, thus enhanced service
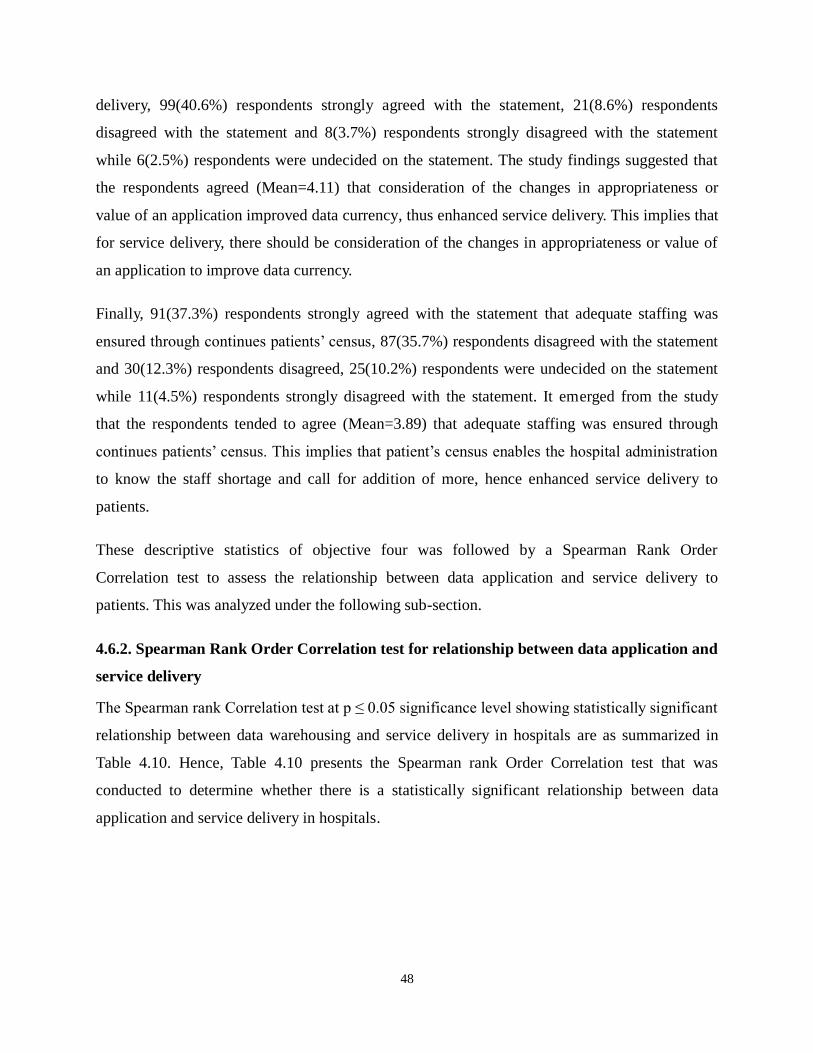
48
delivery, 99(40.6%) respondents strongly agreed with the statement, 21(8.6%) respondents
disagreed with the statement and 8(3.7%) respondents strongly disagreed with the statement
while 6(2.5%) respondents were undecided on the statement. The study findings suggested that
the respondents agreed (Mean=4.11) that consideration of the changes in appropriateness or
value of an application improved data currency, thus enhanced service delivery. This implies that
for service delivery, there should be consideration of the changes in appropriateness or value of
an application to improve data currency.
Finally, 91(37.3%) respondents strongly agreed with the statement that adequate staffing was
ensured through continues patients‟ census, 87(35.7%) respondents disagreed with the statement
and 30(12.3%) respondents disagreed, 25(10.2%) respondents were undecided on the statement
while 11(4.5%) respondents strongly disagreed with the statement. It emerged from the study
that the respondents tended to agree (Mean=3.89) that adequate staffing was ensured through
continues patients‟ census. This implies that patient‟s census enables the hospital administration
to know the staff shortage and call for addition of more, hence enhanced service delivery to
patients.
These descriptive statistics of objective four was followed by a Spearman Rank Order
Correlation test to assess the relationship between data application and service delivery to
patients. This was analyzed under the following sub-section.
4.6.2. Spearman Rank Order Correlation test for relationship between data application and
service delivery
The Spearman rank Correlation test at p ≤ 0.05 significance level showing statistically significant
relationship between data warehousing and service delivery in hospitals are as summarized in
Table 4.10. Hence, Table 4.10 presents the Spearman rank Order Correlation test that was
conducted to determine whether there is a statistically significant relationship between data
application and service delivery in hospitals.
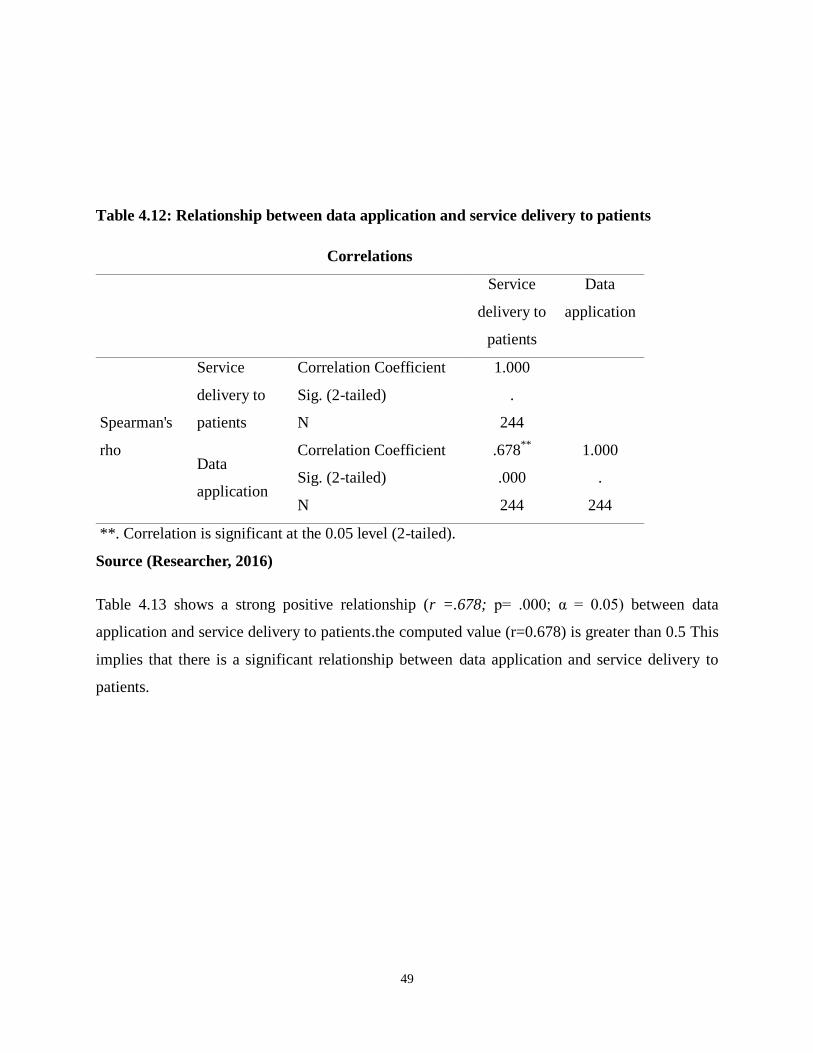
49
Table 4.12: Relationship between data application and service delivery to patients
Correlations
Service
delivery to
patients
Data
application
Spearman's
rho
Service
delivery to
patients
Correlation Coefficient 1.000
Sig. (2-tailed) .
N 244
Data
application
Correlation Coefficient .678**
1.000
Sig. (2-tailed) .000 .
N 244 244
**. Correlation is significant at the 0.05 level (2-tailed).
Source (Researcher, 2016)
Table 4.13 shows a strong positive relationship (r =.678; p= .000; α = 0.05) between data
application and service delivery to patients.the computed value (r=0.678) is greater than 0.5 This
implies that there is a significant relationship between data application and service delivery to
patients.
50
CHAPTER FIVE
SUMMARY OF FINDINGS, CONCLUSION AND RECOMMENDATIONS
5.1 Introduction
This chapter summarized the findings, gave conclusions and recommendations. It also suggested
areas for further research in the following sub themes
5.2 Summary of the study findings
Based on the data and information analysed in chapter four. The findings are summarized in this
section.
5.2.1 Demographic characteristics of respondents
The findings indicates that most 149(61.1%) of the respondents were male and majority
88(36.1%) of the respondents were of the ages between 28 to 37 years. In addition, majority
137(56.1%) of the respondents were protestants. Further to that, majority 118(48.4%) of the
respondents had tertiary level of education and most 60(24.6%) had University level.
5.2.2 Influence of data collection on service delivery to patients
The study findings suggested that the respondents tended to agree (Mean=3.92) that suitable
education and training to those who collect data improved accuracy, hence efficient service
delivery. In addition, it emerged from the study that the respondents agreed (Mean=4.01) that
development of data collection instrument that explored methods to access needed data ensured
efficient service delivery. Similarly, the study findings suggested that the respondents agreed
(Mean=4.16) that data definition and data precision impacted from comprehensive data
collection improved quality service delivery. Further, the study findings suggested that the
respondents agreed (Mean=4.19) that adoption of standardized data collection and integrated/
interfaced systems ensured data consistency hence, improved service delivery. Finally, it
emerged from the study that the respondents agreed (Mean=4.05) that pilot of the data collection
instrument ensured data relevancy, thus efficient service delivery. For correlation analysis, the
findings shows a strong positive relationship (r =.653; p= .000; α = 0.05) between data
51
collection and service delivery to patients.
5.2.3 Influence of data analysis on service delivery to patients
The study findings suggested that the respondents tended to agree (Mean=3.94) that an
appropriate use of algorithms, formulas, and translation systems improved service delivery. In
addition, it emerged from the study that the respondents agreed (Mean=4.05) that ensuring that
all pertinent data impacting the application were analyzed appropriately improved data
comprehensiveness hence, efficient service delivery. Similarly, the study findings suggested that
the respondents agreed (Mean=4.34) that data analysis under reproducible circumstances by use
of standard formulas, scientific equations, variance calculations adopted ensured data
consistency, hence efficient service delivery. Further, the study findings suggested that the
respondents agreed (Mean=4.13) that data displayed to reflect the purpose for which they were
collected ensured clear definitions of data, hence quality service delivery. Finally, it emerged
from the study that the respondents agreed (Mean=4.02) that timely data analysis allowed for the
initiation of action, thus efficient service delivery. For correlation analysis, the findings indicates
a strong positive relationship (r =.672; p= .000; α = 0.05) between data analysis and service
delivery to patients.
5.2.4 Influence of data warehousing on service delivery to patients
The study findings suggested that the respondents tended to agree (Mean=3.78) that appropriate
edits put in place ensured data accuracy, hence improved service delivery. In addition, it emerged
from the study that the respondents tended to agreed (Mean=3.84) that technology and hardware
impacted data accessibility, hence enhanced service delivery. Similarly, the study findings
suggested that the respondents agreed (Mean=4.29) that management of relationships of data
owners, data collectors, and data end-users to ensured awareness of the data availability in the
inventory and accessible systems. Further, the study findings suggested that the respondents
agreed (Mean=4.18) that warehousing employed edits or conversion tables by coordinating edits
and tables to ensure consistency, hence improved service delivery. Finally, it emerged from the
study that the respondents agreed (Mean=4.05) that continually updating of systems, tables, and
databases ensured data currency, thus efficient service delivery. For correlation analysis, the
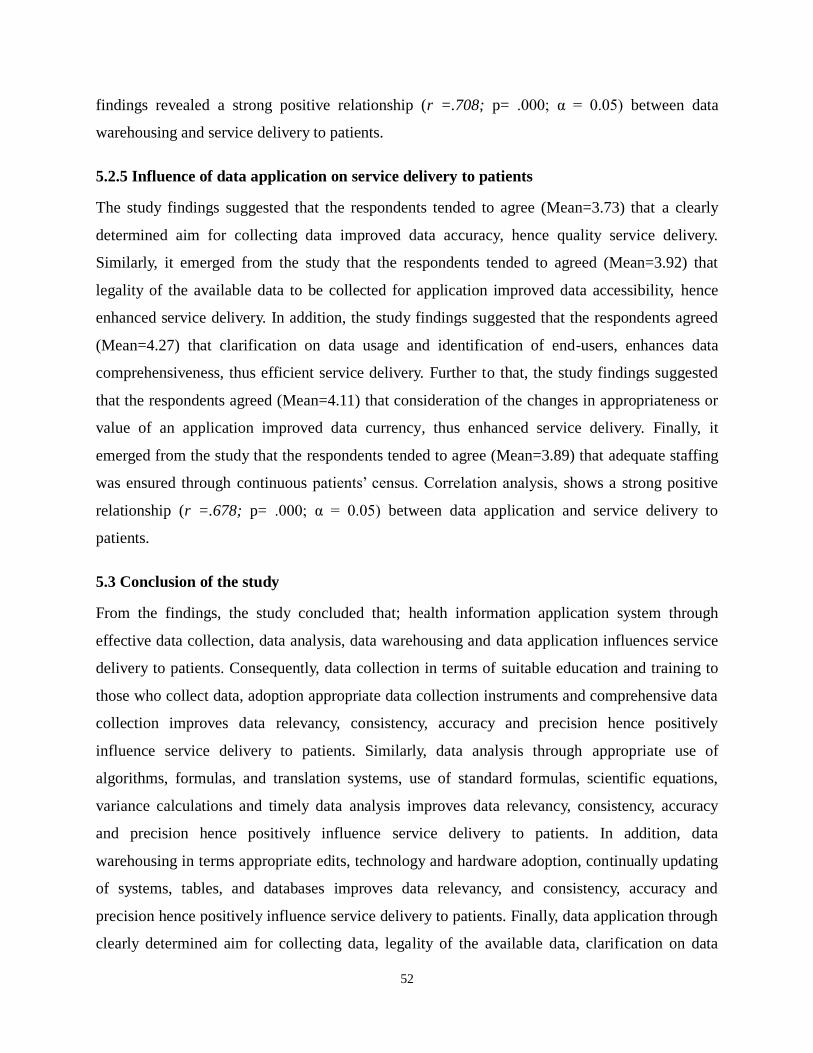
52
findings revealed a strong positive relationship (r =.708; p= .000; α = 0.05) between data
warehousing and service delivery to patients.
5.2.5 Influence of data application on service delivery to patients
The study findings suggested that the respondents tended to agree (Mean=3.73) that a clearly
determined aim for collecting data improved data accuracy, hence quality service delivery.
Similarly, it emerged from the study that the respondents tended to agreed (Mean=3.92) that
legality of the available data to be collected for application improved data accessibility, hence
enhanced service delivery. In addition, the study findings suggested that the respondents agreed
(Mean=4.27) that clarification on data usage and identification of end-users, enhances data
comprehensiveness, thus efficient service delivery. Further to that, the study findings suggested
that the respondents agreed (Mean=4.11) that consideration of the changes in appropriateness or
value of an application improved data currency, thus enhanced service delivery. Finally, it
emerged from the study that the respondents tended to agree (Mean=3.89) that adequate staffing
was ensured through continuous patients‟ census. Correlation analysis, shows a strong positive
relationship (r =.678; p= .000; α = 0.05) between data application and service delivery to
patients.
5.3 Conclusion of the study
From the findings, the study concluded that; health information application system through
effective data collection, data analysis, data warehousing and data application influences service
delivery to patients. Consequently, data collection in terms of suitable education and training to
those who collect data, adoption appropriate data collection instruments and comprehensive data
collection improves data relevancy, consistency, accuracy and precision hence positively
influence service delivery to patients. Similarly, data analysis through appropriate use of
algorithms, formulas, and translation systems, use of standard formulas, scientific equations,
variance calculations and timely data analysis improves data relevancy, consistency, accuracy
and precision hence positively influence service delivery to patients. In addition, data
warehousing in terms appropriate edits, technology and hardware adoption, continually updating
of systems, tables, and databases improves data relevancy, and consistency, accuracy and
precision hence positively influence service delivery to patients. Finally, data application through
clearly determined aim for collecting data, legality of the available data, clarification on data
53
usage and identification of end-users and continuous patients‟ census improves data relevancy,
and consistency, accuracy and precision hence positively influence service delivery to patients.
5.4 Recommendation of the study
In reference to the findings, conclusions and the guidance from the literature review, it was clear
that health information application system enhances services delivery to patients. Therefore, the
hospitals administration, policy makers and other health stakeholders should ensure;
Effective data collection through adequate training and education of data entry clerks,
adoption of appropriate data collection instruments.
Appropriate data analysis procedure in terms of usage of suitable algorithms, formulas,
and translation systems, use of standard formulas, scientific equations, variance
calculations.
Efficient data warehousing through appropriate technology adoption, edits and
continuous update of systems, tables and database.
Appropriate data application through clearly determined aim for collecting data, legality
of the available data, clarification on data usage.
5.5 Suggestions for further studies
The researcher suggests the following further areas of research
1. A similar research should be carried out in a different institution to determine if the health
information application system still influence service delivery to patients.
2. A research should be carried on the influence of other elements of health information
application system on service delivery to patients.
3. A research should also be carried on the entire health institution in the country to
determine the effects of health information application system on service delivery to
patients in Kenya.
4. Further research should be done on the mediating effects on the relationship between
health information application system and service delivery to patients.
5. Future studies need to test significant levels of the findings of the hypothesis using chi
square test.
54
REFERENCES
Aghajani, M. (2002). “Analytical and comparative study of hospital information systems,”
Medicine and Islam, 10th year, vol. 47, pp. 36-29.
Ashish K., Catherine M. DesRoches, Eric G, Karen D, Sowmya R, Timothy G. Ferris, M,
Alexandra S, Sara R, J.D., and David B, M.D., (2009). Use of Electronic Health Records
in U.S. Hospitals.
Aghajani, M. (2002). “Scientific basis and a report on the successful pilot implementation
of automation of hospital information,” in Proceedings of National Seminar on Hospital
Management, Tehran, Emam Hosein University, pp. 28-25.
AHIMA, (2012). “Managing a Data Dictionary.” Journal of AHIMA 83, no. 1: 48-52
Bansler, J.P., and Havn, E. (2010). „Pilot implementation of health information systems: issues
and challenges‟, International journal of medical informatics, 2010, 79, (9).
Barki, H., Titah, R. Boffo. C. (2007). Information System Use-Related Activity: An Expanded
Behavioral Conceptualization of Individual-Level Information System Use, Inf. Syst. Res. 18
173-192.
Bartel, C. A. 2001. Social comparisons in boundary-spanning work: Effects of community
outreach on members' organizational identity and identification, Adm. Sci. Q. 379-413.
Bartels, J., A. Pruyn, M. de Jong, Joustra. I. (2007). Multiple organizational identification levels
and the impact of perceived external prestige and communication climate, J. Organ. Behav.
28 173-190.
Blaya, J.A., Fraser, H.S., and Holt, B. (2010).„E-health technologies show promise in developing
countries‟, Health affairs (Project Hope), 29, (2), pp. 244-251 – 24.
Campbell, R. J. (2008). Change management in health care. Health Care Manager, 27(1), 23-39.
Charles, D., Gabriel, M., Searcy T. (2015). Adoption of Electronic Health Record Systems among
U.S. Non-Federal Acute Care Hospitals: 2008-2014. ONC Data Brief, no.23. Office of
the National Coordinator for Health Information Technology: Washington DC.
CIHI (2007). Patient Safety in Canada: An Update. Retrieved from:
https://secure.cihi.ca/free_products/Patient_Safety_AIB_EN_070814.pdf
Clark, C. (2010). From incivility to civility: Transforming the culture. Reflections on Nursing
55
Leadership, 36 (3).
DesRoches C.M, Campbell E.G, Rao S.R, (2008). Electronic health records in ambulatory care-a
national survey of physicians. N Engl J Med; 359:50-60
Dooling, J. A. (2012). “The Responsibility of Managing Health Information.” HIP Week -2012.
AHIMA.
Duranti, L. (2001). Concepts, Principles, and Methods for the Management of Electronic Records.
The Information Society: An International Journal, 17(4), 271.
Hillestad, R., Bigelow, J., Bower, A., Girosi, F., Meili, R., Scoville, R., & Taylor, R. (2005). Can
electronic medical record systems transform health care? Potential health benefits,
savings, and costs. Health Affairs, 24(5), 1103-1117.
Holtz, B., & Krein, S. (2011). Understanding nurse perceptions of a newly implemented
electronic medical record system. Journal of Technology in Human Services, 29(4), 247-
262.
Horner, S.D., Abel, E., Taylor, K., & Sands, D. (2004). Using theory to guide the diffusion of
genetics content in nursing curricula. Nurse Outlook, 52, 80-84.
Horning, R. (2011). Implementing an electronic medical record with computerized prescriber
order entry at a critical access hospital. American Journal of Health-System Pharmacy,
68(23), 2288-2292
Hunter, G. S. (1997). Developing and Maintaining Practical Archives: A How-to Do-It Manual.
New York: Neal-Schuman Publishers.
Indratmo and J. Vassileva, (2008). A review of organaizational structures of personal information
management. Journal of digital information 2008. 9. (1).
Iron K, Manuel D. G. (2007). Quality assessment of administrative data (QuAAD): an for
enhancing Ontario’s health data opportunity. ICES Investigative Report. Toronto:
Institute for Clinical Evaluative Sciences;637-648
Jha A, Ferris T, Donelan K, (2006). How common are electronic health records in the United
States? A summary of the evidence. Health Aff (Millwood); 25:
w496-w507. 7.

56
Jody R, (2011). Health Information and Health Care: The Role of Technology in Unlocking Data
and Wellness-A Discussion Paper, (Washington, D.C.: United Nations Foundation &
Vodafone Foundation Technology Partnership).
Kahooei M. and Soleimani, M. (2007).“Behavior and satisfaction of the nurses and other hospital
ward personnel about the effectiveness of computer systems of hospital information on
caring process,” Health Information Management, vol. 4, no. 2, pp. 202.
Kotter, J.P. (1996). Leading Change. Boston, MA: Harvard Business School Press.
Lechtenbörger, (2001).Data Warehouse Design: Modern Principles and Methodologies
D. C. Evans, W. Paul Nichol, and J. B. Perlin, “Effect of the Implementation
of an Enterprise-Wide Electronic Health Record on Productivity in the
Veterans Health Administration,” Health Economics, Policy and Law,1(Pt.
2):163–69.
Mohammed-Rajput, N.A., Smith, D.C., Mamlin, B., Biondich, P., and Doebbeling, B.N. (2011).
„OpenMRS, a global medical records system collaborative: factors influencing successful
implementation‟, AMIA ... Annual Symposium proceedings /AMIA Symposium. AMIA
Symposium, pp. 960-968.
McCarthy, C., & Eastman, D. (2010). Change Management Strategies for an Effective EMR
Implementation. HIMSS, Chicago, IL.
McLane, S. (2005). Designing an EMR planning process based on staff attitudes toward
and Opinions about computers in healthcare. CIN: Computers, Informatics,
Nursing, 23(2), 85-92.
McEwen, M., & Wills, E.M. (2007). Theoretical Basis for Nursing 2nd
Edition. New York, NY:
Lippincott Williams & Wilkins.
Nyamtema A, S, (2003), Mgaya HN, Hamudu NS. A survey on obstetric care, factors
affecting Provision of care and pregnancy outcome in Dar es Salaam district
hospitals. Tanz Med J. ;18:36–39.
Inmon,W. H., (2002). Building the Data Warehouse 3rd
Ed. John Wiley & Sons, Inc.
Pemberton, J. M., & Nugent, C. R. (1995). Information Studies: Emergent Field, Convergent
Curriculum. Journal of Education for Library and Information Science, 36(2), 126-138.
57
Plato. (2005). Plato's Euthyphro, Apology, Crito, Phaedo: Benjamin Jowett's Translation. Millis,
MA: Agora Publications, Inc.
Reitz, J. M. (2004). Dictionary for Library and Information Science. Westport, Conn:
Libraries Unlimited.
Pomerleau, M. (2008). Electronic health record: Are you ready for the next step? Nursing
for Women’s Health, 12(2), 151-156.
Rogers, E. (1983). Diffusion of Innovations. New York, NY: Free Press.
Schoen C, Osborn R, Huynh PT, Doty M, Peugh J, Zapert K (2006). On the front lines of
care: primary care doctors‟ office systems, experiences, and views in seven countries.
Health Aff (Millwood); 25:w555-w571.
Sassen E.J. (2009). Love, hate, or indifference: How nurses really feel about the
electronic health record system. Computers, Informatics, Nursing, 27(5), 281-287.
Ting-Ting Lee (2004). Nurses‟ adoption of technology: Application of Rogers‟
Innovation-Diffusion Model. Applied Nursing Research, 17(4), 231-238.
Wolf, D.M. (2006). Community hospital successfully implements eRecord and CPOE.
Computers, Informatics, Nursing, 24(6), 307-316.
Zlabek, J. A. Wickus , J. W. and Mathiason, M. A. (2011). “Early Cost and Safety
Benefits of an Inpatient Electronic Health Record,” Journal of the American
Medical Informatics Association, 3(6), 157-209
Zlabek, J. A Wickus, J. W, and M. A (2011). Mathiason, “Early Cost and Safety Benefits
Of an Inpatient Electronic Health Record,” Journal of the American Medical
Informatics Association 18(2):169–72.
Jones, S. S. Koppel, R. Ridgely M. S, (2009). Guide to Reducing Unintended
Consequences of Electronic Health Records (Rockville, Md., Agency for
Healthcare Research and Quality.
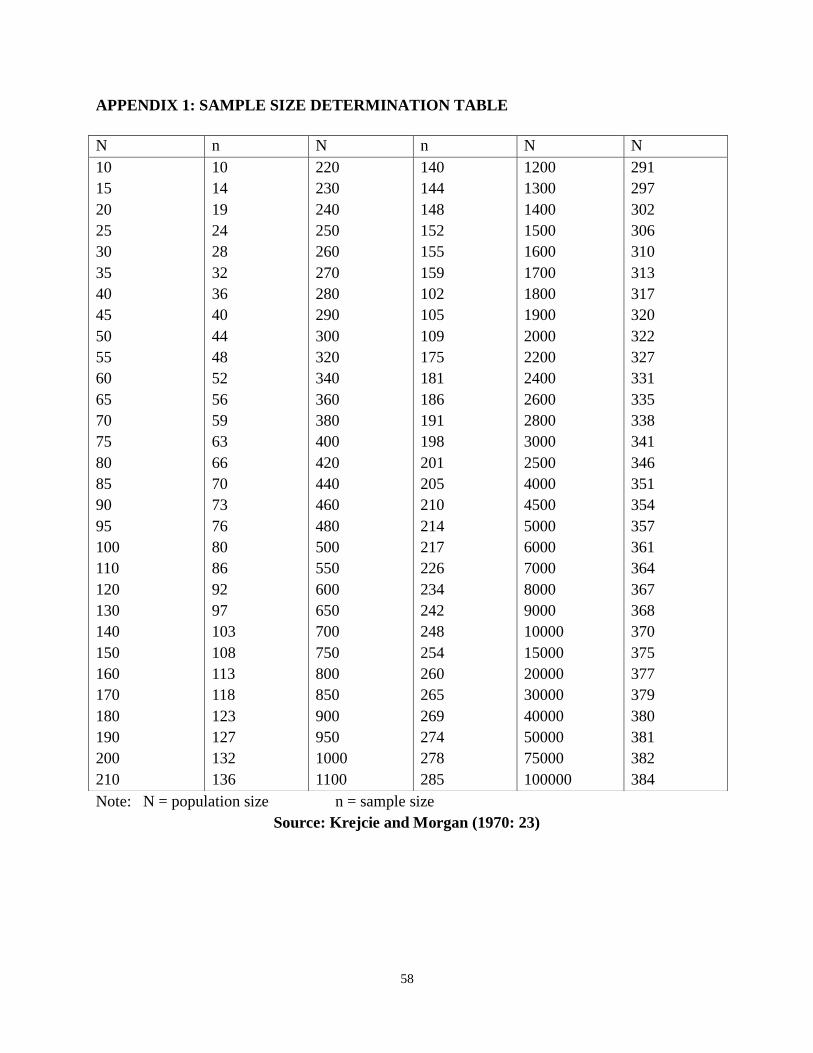
58
APPENDIX 1: SAMPLE SIZE DETERMINATION TABLE
Note: N = population size n = sample size
Source: Krejcie and Morgan (1970: 23)
N n N n N N
10
15
20
25
30
35
40
45
50
55
60
65
70
75
80
85
90
95
100
110
120
130
140
150
160
170
180
190
200
210
10
14
19
24
28
32
36
40
44
48
52
56
59
63
66
70
73
76
80
86
92
97
103
108
113
118
123
127
132
136
220
230
240
250
260
270
280
290
300
320
340
360
380
400
420
440
460
480
500
550
600
650
700
750
800
850
900
950
1000
1100
140
144
148
152
155
159
102
105
109
175
181
186
191
198
201
205
210
214
217
226
234
242
248
254
260
265
269
274
278
285
1200
1300
1400
1500
1600
1700
1800
1900
2000
2200
2400
2600
2800
3000
2500
4000
4500
5000
6000
7000
8000
9000
10000
15000
20000
30000
40000
50000
75000
100000
291
297
302
306
310
313
317
320
322
327
331
335
338
341
346
351
354
357
361
364
367
368
370
375
377
379
380
381
382
384
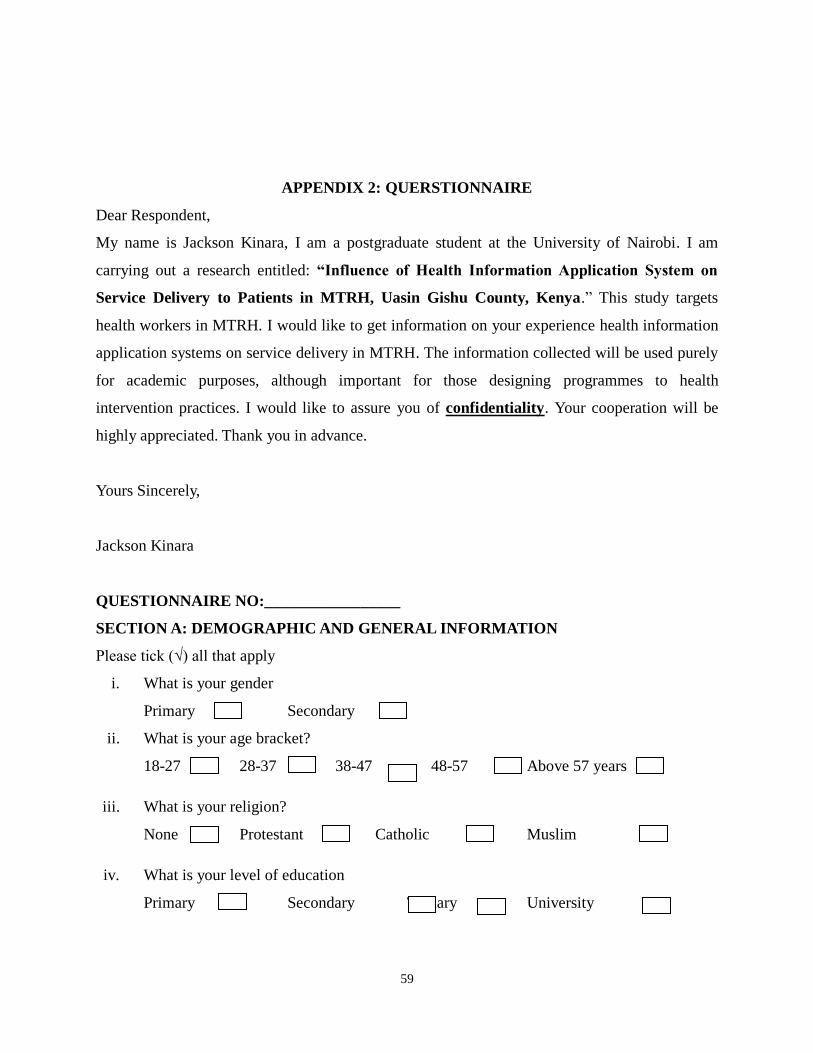
59
APPENDIX 2: QUERSTIONNAIRE
Dear Respondent,
My name is Jackson Kinara, I am a postgraduate student at the University of Nairobi. I am
carrying out a research entitled: “Influence of Health Information Application System on
Service Delivery to Patients in MTRH, Uasin Gishu County, Kenya.” This study targets
health workers in MTRH. I would like to get information on your experience health information
application systems on service delivery in MTRH. The information collected will be used purely
for academic purposes, although important for those designing programmes to health
intervention practices. I would like to assure you of confidentiality. Your cooperation will be
highly appreciated. Thank you in advance.
Yours Sincerely,
Jackson Kinara
QUESTIONNAIRE NO:_________________
SECTION A: DEMOGRAPHIC AND GENERAL INFORMATION
Please tick (√) all that apply
i. What is your gender
Primary Secondary
ii. What is your age bracket?
18-27 28-37 38-47 48-57 Above 57 years
iii. What is your religion?
None Protestant Catholic Muslim
iv. What is your level of education
Primary Secondary Tertiary University
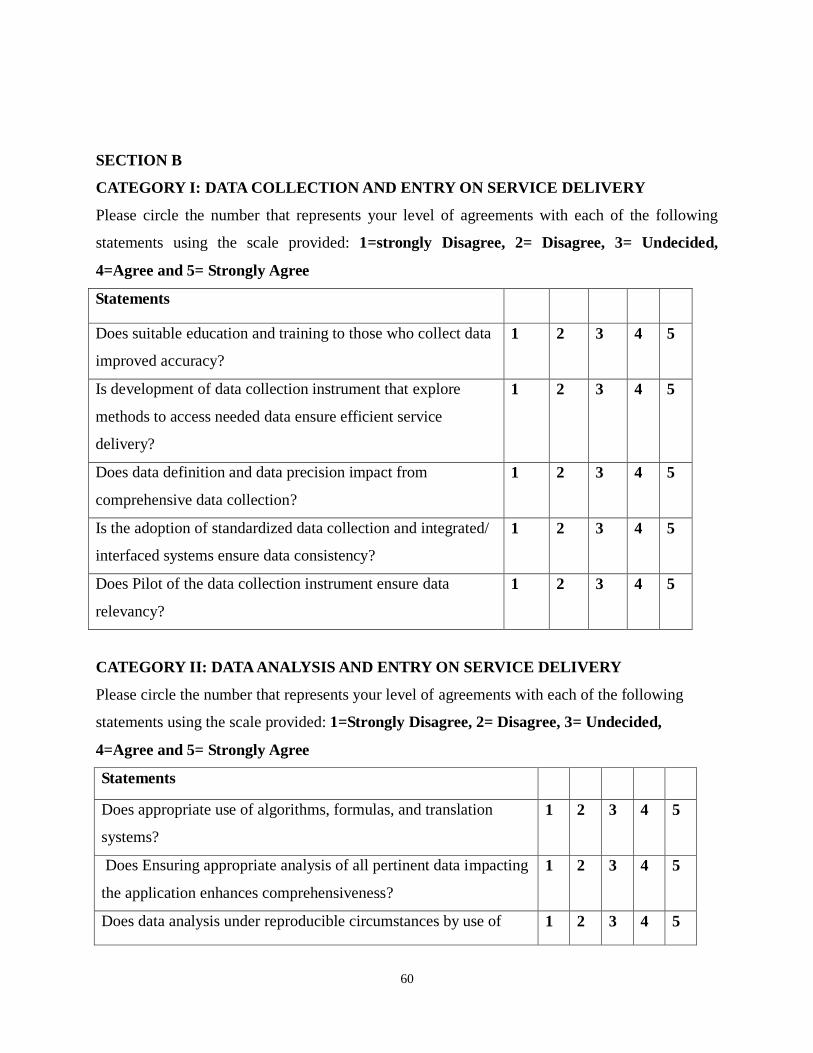
60
SECTION B
CATEGORY I: DATA COLLECTION AND ENTRY ON SERVICE DELIVERY
Please circle the number that represents your level of agreements with each of the following
statements using the scale provided: 1=strongly Disagree, 2= Disagree, 3= Undecided,
4=Agree and 5= Strongly Agree
Statements
Does suitable education and training to those who collect data
improved accuracy?
1 2 3 4 5
Is development of data collection instrument that explore
methods to access needed data ensure efficient service
delivery?
1 2 3 4 5
Does data definition and data precision impact from
comprehensive data collection?
1 2 3 4 5
Is the adoption of standardized data collection and integrated/
interfaced systems ensure data consistency?
1 2 3 4 5
Does Pilot of the data collection instrument ensure data
relevancy?
1 2 3 4 5
CATEGORY II: DATA ANALYSIS AND ENTRY ON SERVICE DELIVERY
Please circle the number that represents your level of agreements with each of the following
statements using the scale provided: 1=Strongly Disagree, 2= Disagree, 3= Undecided,
4=Agree and 5= Strongly Agree
Statements
Does appropriate use of algorithms, formulas, and translation
systems?
1 2 3 4 5
Does Ensuring appropriate analysis of all pertinent data impacting
the application enhances comprehensiveness?
1 2 3 4 5
Does data analysis under reproducible circumstances by use of 1 2 3 4 5
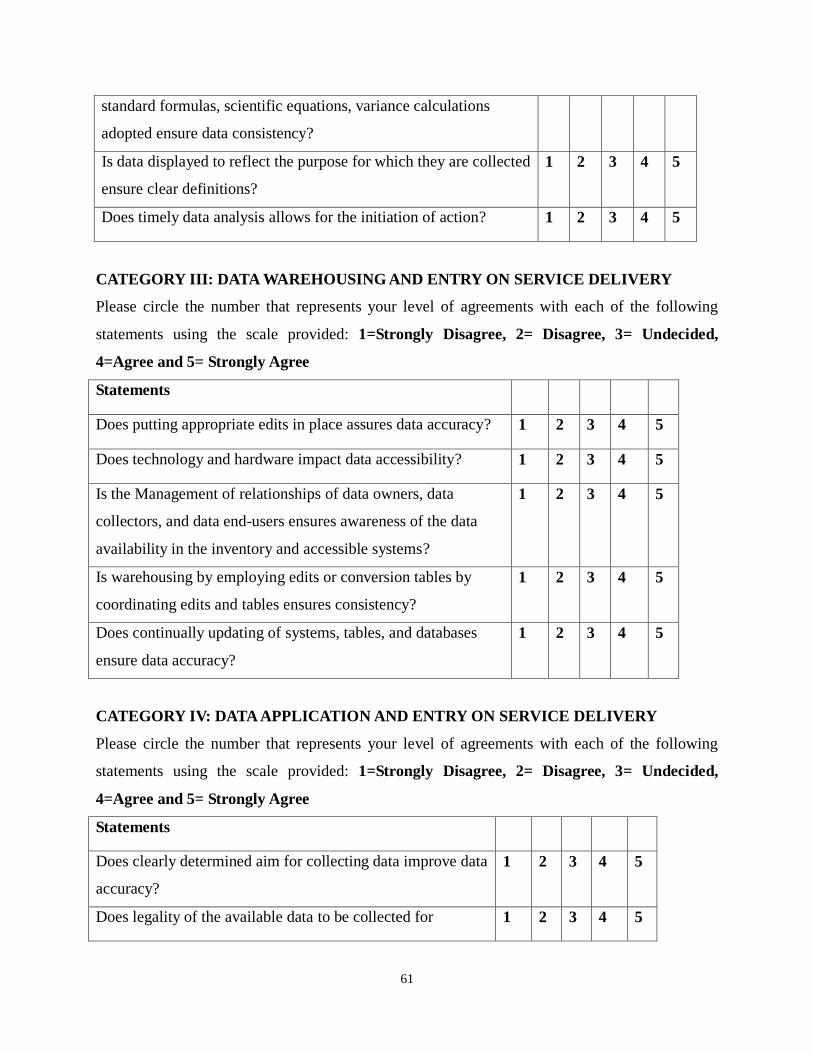
61
standard formulas, scientific equations, variance calculations
adopted ensure data consistency?
Is data displayed to reflect the purpose for which they are collected
ensure clear definitions?
1 2 3 4 5
Does timely data analysis allows for the initiation of action? 1 2 3 4 5
CATEGORY III: DATA WAREHOUSING AND ENTRY ON SERVICE DELIVERY
Please circle the number that represents your level of agreements with each of the following
statements using the scale provided: 1=Strongly Disagree, 2= Disagree, 3= Undecided,
4=Agree and 5= Strongly Agree
Statements
Does putting appropriate edits in place assures data accuracy? 1 2 3 4 5
Does technology and hardware impact data accessibility? 1 2 3 4 5
Is the Management of relationships of data owners, data
collectors, and data end-users ensures awareness of the data
availability in the inventory and accessible systems?
1 2 3 4 5
Is warehousing by employing edits or conversion tables by
coordinating edits and tables ensures consistency?
1 2 3 4 5
Does continually updating of systems, tables, and databases
ensure data accuracy?
1 2 3 4 5
CATEGORY IV: DATA APPLICATION AND ENTRY ON SERVICE DELIVERY
Please circle the number that represents your level of agreements with each of the following
statements using the scale provided: 1=Strongly Disagree, 2= Disagree, 3= Undecided,
4=Agree and 5= Strongly Agree
Statements
Does clearly determined aim for collecting data improve data
accuracy?
1 2 3 4 5
Does legality of the available data to be collected for 1 2 3 4 5
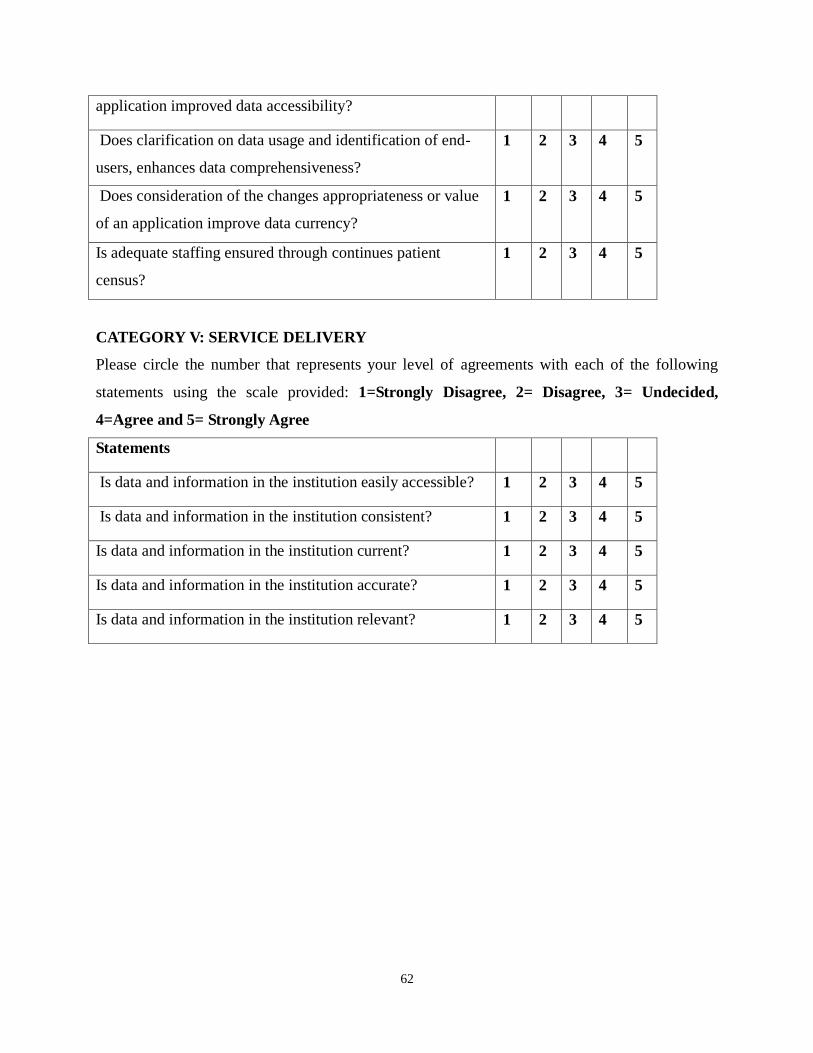
62
application improved data accessibility?
Does clarification on data usage and identification of end-
users, enhances data comprehensiveness?
1 2 3 4 5
Does consideration of the changes appropriateness or value
of an application improve data currency?
1 2 3 4 5
Is adequate staffing ensured through continues patient
census?
1 2 3 4 5
CATEGORY V: SERVICE DELIVERY
Please circle the number that represents your level of agreements with each of the following
statements using the scale provided: 1=Strongly Disagree, 2= Disagree, 3= Undecided,
4=Agree and 5= Strongly Agree
Statements
Is data and information in the institution easily accessible? 1 2 3 4 5
Is data and information in the institution consistent? 1 2 3 4 5
Is data and information in the institution current? 1 2 3 4 5
Is data and information in the institution accurate? 1 2 3 4 5
Is data and information in the institution relevant? 1 2 3 4 5


![Influence of fluoride ion on the electrochemical behaviour of [beta]-Ti alloy for dental implant application](https://static.fdokumen.com/doc/165x107/63239d9b5f71497ea9046a34/influence-of-fluoride-ion-on-the-electrochemical-behaviour-of-beta-ti-alloy-for.jpg)