Inflow Perfomance Relationship (IPR) - Teknik Produksi - Poltek Akamigas Palembang
1
Paper Number: 01-1182
An ASAE Meeting Presentation
Influence of Dynamically Varying Inflow Rates on Clean Grain Elevator
Yield Monitor Accuracy
by
Thomas F. Burks Assistant Professor
Agricultural & Biological Engineering University of Florida
Scott A. Shearer Associate Professor
Biosystems & Agricultural Engineering University of Kentucky
John P. Fulton Engineering Associate
Biosystems & Agricultural Engineering University of Kentucky
Christopher J. Sobolik Development Engineer
John Deere Werke, Zweibruecken
University of Kentucky
Lexington, Ky, USA
Written for Presentation at the 2001 ASAE Annual International Meeting
Sponsored by ASAE Sacramento Convention Center
Sacramento, California, USA July 30-August 1, 2001
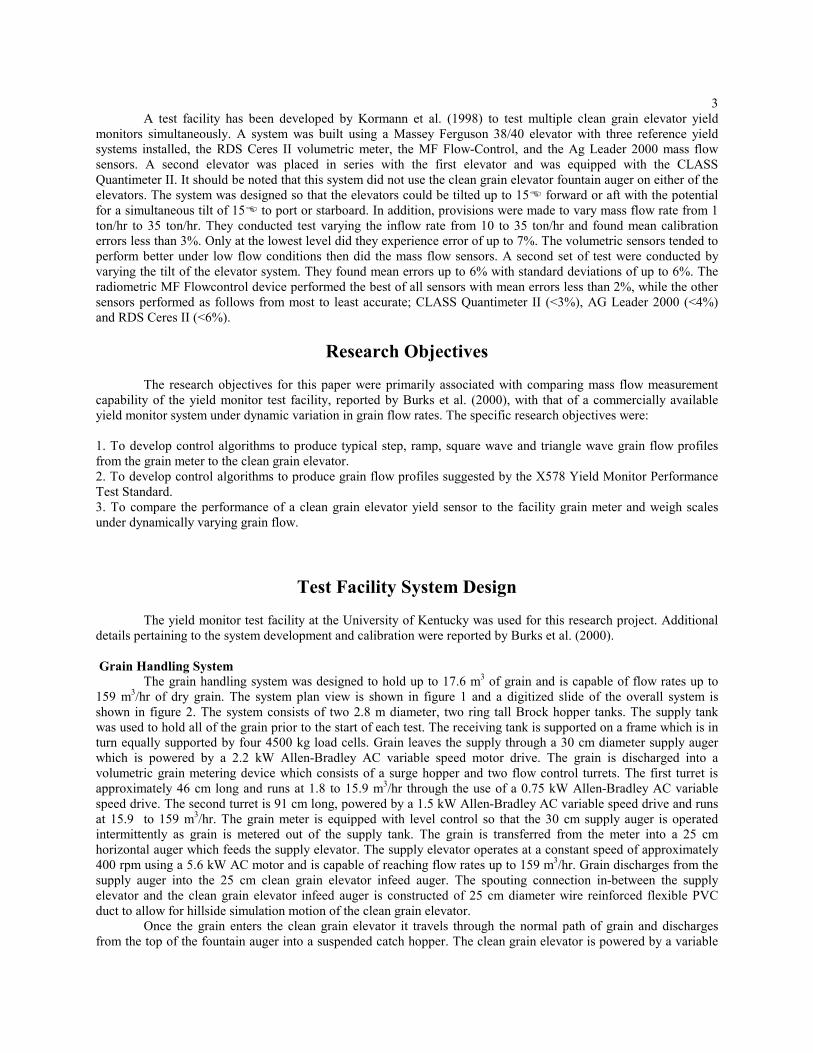
Summary: The Yield Monitor Test Facility was used to evaluate the GreenStar® mass flow sensor in a 9600 clean grain elevator under dynamically varying inflow rates. It was found that the GreenStar® yield sensor accurately predicts (less than 4% error) accumulated mass (under dynamically varying step and ramp flow rates) within normal operating conditions of 4.2 to 16.9 kg/s (10 to 40 bu/min), and does a reasonable job of predicting flow at upper limits of 20kg/s. The yield sensor accurately followed X578 variable step flow rates while operating under 20 kg/s, but exhibited significant errors for flows above 20 kg/s. This was probably due to the fact that the GreenStar® was calibrated at 12.7 kg/s. The maximum error in accumulated mass for the variable step profile was less than 2%, while the average instantaneous flow error during steady state grain metering was estimated at 4.4% with a 3.4% standard deviation. Time averaging adjacent readings reduced the error to 3.2%. It was found that transient flow had maximum accumulated flow errors of approximately 5%, while oscillating flow had errors around 2.5%. This was due to the fact that the transient flow maintains flow at the extremity of the GreenStar® operation range (based on 12.7 kg/s calibration) for longer periods. The results from these test indicated that the GreenStar® mass flow sensor accurately predicted total accumulated mass flow across a broad range of dynamic inflow rates and demonstrated good instantaneous flow prediction. Additionally, two second time averaging of adjacent flow readings smoothed noise in the original signal with minimal loss of signal definition Keywords: Precision farming, global positioning system, site-specific crop management, grain harvester. The authors are solely responsible for the content of this technical presentation. The technical presentation does not necessarily reflect the official position of ASAE, and its printing and distribution does not constitute an endorsement of views which may be expressed. Technical presentations are not subject to the formal peer review process by ASAE editorial committees; therefore, they are not to be presented as refereed publications. Citations of this work should state that it is from an ASAE meeting paper. EXAMPLE: Author’s Last Name, Initial. 2001. Title of Presentation. ASAE Meeting Paper No. xx-xxxx. St. Joseph, MI.:ASAE. For information about securing permission to reprint or reproduce a technical presentation, please contact ASAE at [email protected] or 616-429-0300 ( 2950 Niles Rd., St. Joseph, MI 49085-9659 USA)

2
Influence of Dynamically Varying Inflow Rates on Clean Grain Elevator Yield Monitor Accuracy
T.F. Burks, S.A. Shearer, J.P. Fulton, and C. J. Sobolik
Introduction
Several researchers have documented significant spatial variation in crop yield within a given field (Stafford et al., 1991 and C. Yang et al.,1996). Sources of spatial yield variation have been attributed to soil type, nutrient availability, slope, elevation, aspect, moisture availability, and cropping history. Significant errors in crop yield prediction can adversely affect any attempts to manage crop production. Perez-Munoz and Colvin (1994) noted that yield monitors tend to overestimate crop yield in regions of low yield. Kormann et al. (1998) reported that errors up to 7% were observed in force impetus yield monitors under low inflow conditions of 10 metric tons per hour. As a result of actual in-field variability of crop yield and the questions surrounding yield monitor accuracies under dynamically varying field conditions, the Yield Monitor Test Facility was developed at the University of Kentucky to assess clean grain elevator yield monitor sensing technology.
Literature Review
A study was conducted by Shearer et al. (1997) in which four combines (two John Deere 9500's, a Gleaner R70 and a Case IH 1680) were used to harvest wheat with in the same field. Each combine was equipped with yield monitors, the John Deere’s used GreenStar® and the other combines used the Ag Leader 2000. The data from each combine was imported into a popular mapping package to compare the yield estimates. They found that significant differences in measured yield existed between adjacent harvest swaths. These differences were attributed to potential machine/operator variability. In response to these differences, they developed data filtering techniques to help minimize the influence of calibration and machine/operator differences. They concluded that machine calibration techniques were critical in multiple-combine harvest systems. Strubbe et al (1996) agreed by stating, “ Our investigations show that the accuracy of yield estimates depends greatly on the variability of the harvesting conditions, on the total field area in one grid, and on the range of operating conditions over which a sensor is calibrated.” Thylen and Murphy (1996) conducted a study of the key factors, which cause errors in momentary yield data. They identified five key sources of error. The errors were associated with low yields at the start of harvest transects, interruptions in crop intake, sudden changes in forward speed, failure to use full cutting width, and the time delay for grain to travel from the cutter bar to the yield sensor. Data filters were evaluated which removed these sources of error. They concluded that the removal of start of harvest transects improves data quality as measured by geostatistical analysis, and that filtered mean instantaneous yield is similar to mean yield calculated from total grain mass and the harvested area. In a study conducted by Kettle and Peterson (1998), it was observed that the accuracy of combine yield monitors were significantly effected by hill-side conditions and variation in harvest rates. Test were conducted on two John Deere combines equipped with Greenstar® in the hilly Palouse region of northern Idaho. They observed that the yield monitor’s response to variation in inflow was exponential rather than linear and suggested that calibration should been done at several operating points rather than the traditional two point method. The observed yield monitor error was 20.3% when operating the combine at 1/3 the calibration throughput and 5.7% at half the calibration throughput. They also found that the error in yield monitor estimates were as high as 18.2% when harvesting uphill and 60.7% when harvesting downhill, on 6 to 9% slopes. Finally, they found a very weak correlation between the yield monitor estimates and hand samples (R2 =0.203) indicating that the yield monitor is not as sensitive to local variation in crop yield. Arslan and Colvin (1998) reported the development of a test stand for combine grain yield monitors. They constructed a facility to compare the accuracy of a yield monitor to an electronic scale. The strong correlations found between the measured flow in the yield monitor and the electronic scale (R2 =0.99). They observed stronger agreement when testing at higher flow rates over longer durations.
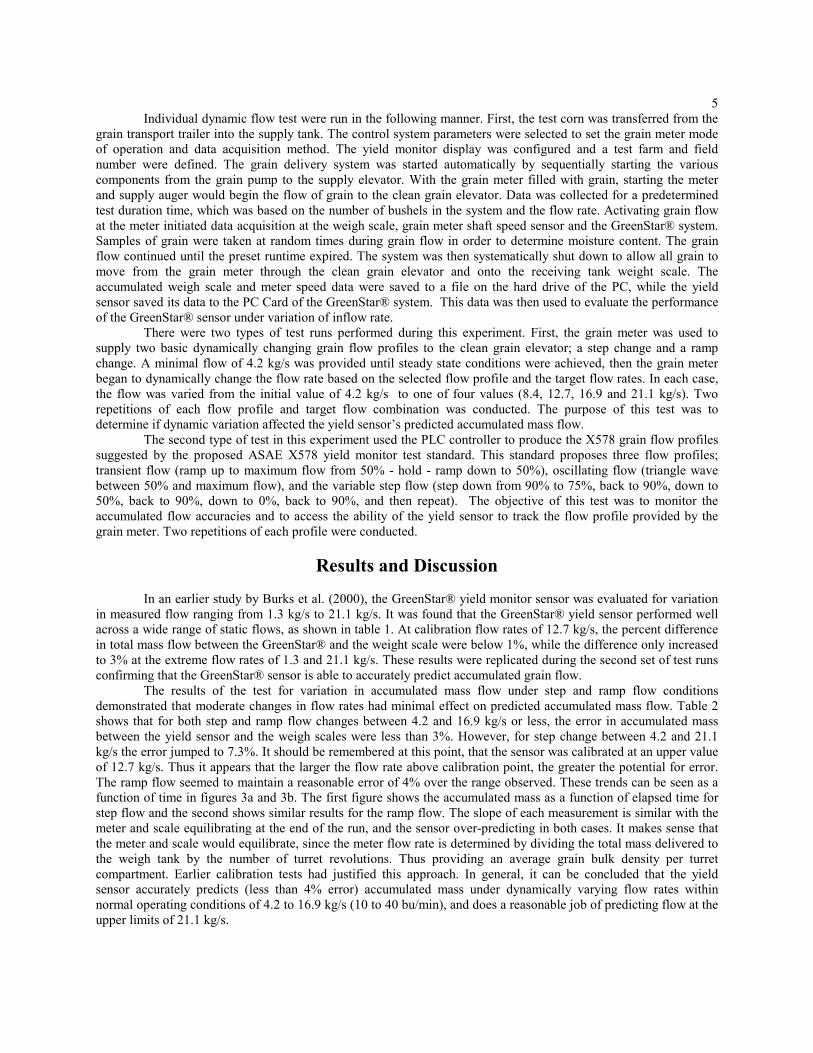
3 A test facility has been developed by Kormann et al. (1998) to test multiple clean grain elevator yield monitors simultaneously. A system was built using a Massey Ferguson 38/40 elevator with three reference yield systems installed, the RDS Ceres II volumetric meter, the MF Flow-Control, and the Ag Leader 2000 mass flow sensors. A second elevator was placed in series with the first elevator and was equipped with the CLASS Quantimeter II. It should be noted that this system did not use the clean grain elevator fountain auger on either of the elevators. The system was designed so that the elevators could be tilted up to 15� forward or aft with the potential for a simultaneous tilt of 15� to port or starboard. In addition, provisions were made to vary mass flow rate from 1 ton/hr to 35 ton/hr. They conducted test varying the inflow rate from 10 to 35 ton/hr and found mean calibration errors less than 3%. Only at the lowest level did they experience error of up to 7%. The volumetric sensors tended to perform better under low flow conditions then did the mass flow sensors. A second set of test were conducted by varying the tilt of the elevator system. They found mean errors up to 6% with standard deviations of up to 6%. The radiometric MF Flowcontrol device performed the best of all sensors with mean errors less than 2%, while the other sensors performed as follows from most to least accurate; CLASS Quantimeter II (<3%), AG Leader 2000 (<4%) and RDS Ceres II (<6%).
Research Objectives
The research objectives for this paper were primarily associated with comparing mass flow measurement capability of the yield monitor test facility, reported by Burks et al. (2000), with that of a commercially available yield monitor system under dynamic variation in grain flow rates. The specific research objectives were: 1. To develop control algorithms to produce typical step, ramp, square wave and triangle wave grain flow profiles from the grain meter to the clean grain elevator. 2. To develop control algorithms to produce grain flow profiles suggested by the X578 Yield Monitor Performance Test Standard. 3. To compare the performance of a clean grain elevator yield sensor to the facility grain meter and weigh scales under dynamically varying grain flow.
Test Facility System Design
The yield monitor test facility at the University of Kentucky was used for this research project. Additional details pertaining to the system development and calibration were reported by Burks et al. (2000). Grain Handling System The grain handling system was designed to hold up to 17.6 m3 of grain and is capable of flow rates up to 159 m3/hr of dry grain. The system plan view is shown in figure 1 and a digitized slide of the overall system is shown in figure 2. The system consists of two 2.8 m diameter, two ring tall Brock hopper tanks. The supply tank was used to hold all of the grain prior to the start of each test. The receiving tank is supported on a frame which is in turn equally supported by four 4500 kg load cells. Grain leaves the supply through a 30 cm diameter supply auger which is powered by a 2.2 kW Allen-Bradley AC variable speed motor drive. The grain is discharged into a volumetric grain metering device which consists of a surge hopper and two flow control turrets. The first turret is approximately 46 cm long and runs at 1.8 to 15.9 m3/hr through the use of a 0.75 kW Allen-Bradley AC variable speed drive. The second turret is 91 cm long, powered by a 1.5 kW Allen-Bradley AC variable speed drive and runs at 15.9 to 159 m3/hr. The grain meter is equipped with level control so that the 30 cm supply auger is operated intermittently as grain is metered out of the supply tank. The grain is transferred from the meter into a 25 cm horizontal auger which feeds the supply elevator. The supply elevator operates at a constant speed of approximately 400 rpm using a 5.6 kW AC motor and is capable of reaching flow rates up to 159 m3/hr. Grain discharges from the supply auger into the 25 cm clean grain elevator infeed auger. The spouting connection in-between the supply elevator and the clean grain elevator infeed auger is constructed of 25 cm diameter wire reinforced flexible PVC duct to allow for hillside simulation motion of the clean grain elevator. Once the grain enters the clean grain elevator it travels through the normal path of grain and discharges from the top of the fountain auger into a suspended catch hopper. The clean grain elevator is powered by a variable

4speed 15 kW hydraulic motor provided by White Hydraulics. The speed of the hydraulic motor is approximately 400 rpm and is controlled by a laboratory hydraulic test bench. This hopper discharges the grain into another 25 cm flexible spout, which discharges into a 30 cm U-trough. The U-trough operates at approximately 190 rpm and is powered by a 2.2 kW electric motor. The U-trough moves the grain up to a discharge point above the grain pump. The 25 cm grain pump is manufactured by Hutchinson and is capable of flow rates up 211 m3/hr of dry grain. It is powered by a 15 kW electric motor with a chain speed of 100 m/s. The grain pump elevates and discharges the grain into the receiving tank where weight data is being sampled once per second. The grain pump is also used to move the grain from the receiving tank back to the supply tank for repeated testing. Control System and Instrumentation The control system for the grain handling system was developed to provide automated control of the start up process, level and speed control for the grain meter, system monitoring, data acquisition, and dynamic grain inflow simulation. The automated control system consists of a Allen-Bradley SLC-500 programmable logic controller for machine systems control, and a Gateway 2000 Pentium personal computer which serves as the User Interface Terminal (UIT) and as the Data Acquisition System (DAS). The UIT was programmed in Visual Basic 6.0 with the use of Allen-Bradley’s RSToolsTM, Computer Board’s Universal Library and Keithly’s DriverLINX ActiveX controls. The SLC-500 was programmed in ladder logic using Allen-Bradley’s RSLogix 500TM to control all of the grain handling system functions. The primary components of the data acquisition system were the Pentium PC, a Computerboards’ CIO-DAS801 analog card and a Keithley CTM05 counter card. The PC serves as a user interface to the data acquisition system and for data storage. The principal data variables were the four receiving tank load cell weights, the tare weight prior to grain flow, the grain meter shaft speeds, and an interrupt driven running clock for assisting in data synchronization. A synchronization signal is sent to the yield monitor undergoing testing to initiate data acquisition. This signal assists in associating the weigh scale and meter data with the yield monitor data. The receiving tank was instrumented with four 4500 kg load cells, which supported the bulk tank and its support frame. Each load cell was calibrated at the factory to a response range of 3.0 mV/volt of excitation at full scale loading. The load cells were matched and calibrated in the laboratory with a load cell transmitter. The transmitter provided zero offset and gain adjustment. It also provides a stable 10 V DC excitation voltage to the load cell with line length compensation. Additionally, the transmitter provides a scaled 4 to 20 mA output signal which provides a more robust signal in the presence of potential RF noise produced by the AC inverters. The load cell signals are transmitted to the CIO-DAS801 for data acquisition. The four signals are combined to give a tank weight which can be used to monitor the flow of grain through the system. The grain meter shaft speeds are used to determine the volumetric flow rate of grain being supplied to the clean grain elevator. Each turret motor has a shaft speed sensing unit, which consist of a special dual pick-up shaft coupling and a inductive proximity switch. The pick-up lugs are tapped into the shaft coupling at 180 degrees apart and rotates at the same RPM as the motor shaft. Therefore each revolution of the motor shaft produces two pulses on the inductive proximity switch. This signal is monitored by a Keithley CTM05 counter card in the PC. The CTM05 counts pulses per second, calculates turret shaft speed based on the gear ratio, and then determines the delivered volumetric flow.
Experimental Methods
A series of calibration test were conducted on the Yield Monitor Test Facility system, and were reported in Burks et al. (2000). All calibration and test procedures were conducted using corn at normal storage moisture content conditions of 15.3%. Moisture content was measured using a Dickey-John GAC 2100. The clean grain elevator yield monitor sensor was re-calibrated before running the dynamic flow test using the standard two point calibration technique recommended by the manufacturer. The GreenStar® yield monitor system was equipped with the latest hardware and firmware version being marketed by John Deere for the 9600 series combine. First, the system was calibrated at a corn flow set point of 12.7 kg/s, and the recommended adjustments were made in the calibration factor. Then the system was set to “Low Flow Comp Mode” and the system was run at 6.3 kg/s and the low-flow comp number was adjusted. The remainder of the tests was run with this calibration. Dynamic Flow Tests
5 Individual dynamic flow test were run in the following manner. First, the test corn was transferred from the grain transport trailer into the supply tank. The control system parameters were selected to set the grain meter mode of operation and data acquisition method. The yield monitor display was configured and a test farm and field number were defined. The grain delivery system was started automatically by sequentially starting the various components from the grain pump to the supply elevator. With the grain meter filled with grain, starting the meter and supply auger would begin the flow of grain to the clean grain elevator. Data was collected for a predetermined test duration time, which was based on the number of bushels in the system and the flow rate. Activating grain flow at the meter initiated data acquisition at the weigh scale, grain meter shaft speed sensor and the GreenStar® system. Samples of grain were taken at random times during grain flow in order to determine moisture content. The grain flow continued until the preset runtime expired. The system was then systematically shut down to allow all grain to move from the grain meter through the clean grain elevator and onto the receiving tank weight scale. The accumulated weigh scale and meter speed data were saved to a file on the hard drive of the PC, while the yield sensor saved its data to the PC Card of the GreenStar® system. This data was then used to evaluate the performance of the GreenStar® sensor under variation of inflow rate. There were two types of test runs performed during this experiment. First, the grain meter was used to supply two basic dynamically changing grain flow profiles to the clean grain elevator; a step change and a ramp change. A minimal flow of 4.2 kg/s was provided until steady state conditions were achieved, then the grain meter began to dynamically change the flow rate based on the selected flow profile and the target flow rates. In each case, the flow was varied from the initial value of 4.2 kg/s to one of four values (8.4, 12.7, 16.9 and 21.1 kg/s). Two repetitions of each flow profile and target flow combination was conducted. The purpose of this test was to determine if dynamic variation affected the yield sensor’s predicted accumulated mass flow. The second type of test in this experiment used the PLC controller to produce the X578 grain flow profiles suggested by the proposed ASAE X578 yield monitor test standard. This standard proposes three flow profiles; transient flow (ramp up to maximum flow from 50% - hold - ramp down to 50%), oscillating flow (triangle wave between 50% and maximum flow), and the variable step flow (step down from 90% to 75%, back to 90%, down to 50%, back to 90%, down to 0%, back to 90%, and then repeat). The objective of this test was to monitor the accumulated flow accuracies and to access the ability of the yield sensor to track the flow profile provided by the grain meter. Two repetitions of each profile were conducted.
Results and Discussion In an earlier study by Burks et al. (2000), the GreenStar® yield monitor sensor was evaluated for variation in measured flow ranging from 1.3 kg/s to 21.1 kg/s. It was found that the GreenStar® yield sensor performed well across a wide range of static flows, as shown in table 1. At calibration flow rates of 12.7 kg/s, the percent difference in total mass flow between the GreenStar® and the weight scale were below 1%, while the difference only increased to 3% at the extreme flow rates of 1.3 and 21.1 kg/s. These results were replicated during the second set of test runs confirming that the GreenStar® sensor is able to accurately predict accumulated grain flow. The results of the test for variation in accumulated mass flow under step and ramp flow conditions demonstrated that moderate changes in flow rates had minimal effect on predicted accumulated mass flow. Table 2 shows that for both step and ramp flow changes between 4.2 and 16.9 kg/s or less, the error in accumulated mass between the yield sensor and the weigh scales were less than 3%. However, for step change between 4.2 and 21.1 kg/s the error jumped to 7.3%. It should be remembered at this point, that the sensor was calibrated at an upper value of 12.7 kg/s. Thus it appears that the larger the flow rate above calibration point, the greater the potential for error. The ramp flow seemed to maintain a reasonable error of 4% over the range observed. These trends can be seen as a function of time in figures 3a and 3b. The first figure shows the accumulated mass as a function of elapsed time for step flow and the second shows similar results for the ramp flow. The slope of each measurement is similar with the meter and scale equilibrating at the end of the run, and the sensor over-predicting in both cases. It makes sense that the meter and scale would equilibrate, since the meter flow rate is determined by dividing the total mass delivered to the weigh tank by the number of turret revolutions. Thus providing an average grain bulk density per turret compartment. Earlier calibration tests had justified this approach. In general, it can be concluded that the yield sensor accurately predicts (less than 4% error) accumulated mass under dynamically varying flow rates within normal operating conditions of 4.2 to 16.9 kg/s (10 to 40 bu/min), and does a reasonable job of predicting flow at the upper limits of 21.1 kg/s.

6 The series of test conducted using the X578 profiles provided several interesting discoveries. First, figures 4a and 4b show the instantaneous flow measurements of the sensor and meter for the variable step profile. In both cases, noise can be observed in the sensor’s predicted flow. In figure 4a, we see the profile that was calculated using a maximum flow of 26 kg/s. It can be seen that the sensor accurately follows the meter for flow rates under 20 kg/s, but exhibits significant error for flows above 20 kg/s. This is probably due to the 12.7 kg/s upper calibration point. Once the flow exceeds a certain threshold above the calibration point, the accuracy begins to deteriorate quickly. In figure 4b, the sensor accurately tracks the meter throughout the entire flow profile. This profile was based on a maximum flow of 21 kg/s (50 bu/min). It should be clear from these figures that sensor performance can be enhanced by accurately selecting the calibration points based on the average and maximum expected flow rate. In this case, instantaneous predicted flow near the set point of 12.7 kg/s is very good. While, sensor predictions at flows nearly 70% above the upper calibration set point still provide acceptable results. The error in one second readings is very difficult to predict, since there is not an accurate means to register the two data streams and thus perfectly align the step transitions. However, if we look at the portions of the flow where steady state grain metering is occurring, we get an average error of 4.4% with a standard deviation of 3.4%. If adjacent sensor readings are averaged, the error drops to 3.2% with a 2.6% standard deviation. The error in accumulated mass between the yield sensor and the weigh scale is given in table 3. The maximum error in accumulated mass for the variable step profile is less than 2%. This speaks well for the accuracy of predicted grain yield at flows with in the operational flow range, which appears to be in the range of 4.2 kg/s to 20 kg/s at these calibration settings. The filtering technique of averaging adjacent values in a data stream has been used successfully for reducing signal noise. It does however result in a loss of signal information due to smoothing. The influence of time averaging on adjacent sensor readings can be observed in figures 5a and 5b. Figure 5a and 5b are from the same data stream, but for different durations. In figures 5a, it can be seen that the two and three second average still follow the original signal, but with two noticeable differences. First, filtered data has less noise (smoother), but it also has a loss of definition at the transitions. In figure 5b, it can be seen that the three second average has less pronounced corners or transitions. The results of the remaining two X578 flow profiles can be seen in figures 6a and 6b. Figure 6a shows the transient flow condition, which demonstrates excellent tracking of the ramp up and ramp down portion of the flow. However, it does show higher error at flows of 21 kg/s (50 bu/min). Figure 6b shows the oscillating flow, which maintains good tracking of the meter flow at all levels. When looking at the error in accumulated mass flow for the profiles, it is found that the transient flow has maximum errors of approximately 5%, while the oscillating flow has errors around 2.5%. This is due to the fact that the transient flow profile maintains flow at the maximum level for the greatest period of time. The greater error results from the yield sensor operating at the extremity of its calibrated operation range for longer periods.
Summary and Conclusions The Yield Monitor Test Facility was used to evaluate the GreenStar® mass flow sensor in a 9600 clean grain elevator under dynamically varying inflow rates. It was found that the GreenStar® yield sensor accurately predicts (less than 4% error) accumulated mass (under dynamically varying step and ramp flow rates) with in normal operating conditions of 4.2 to 16.9 kg/s (10 to 40 bu/min), and does a reasonable job of predicting flow at upper limits of 21 kg/s. The yield sensor accurately followed X578 variable step flow rates while operating under 20 kg/s, but exhibited significant errors for flows above 20 kg/s. This was probably due to the fact that the GreenStar® was calibrated at 12.7 kg/s. The maximum error in accumulated mass for the variable step profile was less than 2%, while the average instantaneous flow error during steady state grain metering was estimated at 4.4% with a 3.4% standard deviation. Time averaging adjacent readings reduced the error to 3.2%. It was found that transient flow had maximum errors of approximately 5%, while oscillating flow had errors around 2.5%. This was due to the fact that the transient flow maintains flow at the extremity of the GreenStar® operation range (based on 12.7 kg/s calibration) for longer periods. The results from these tests indicate that the GreenStar® mass flow sensor accurately predicts total accumulated mass flow across a broad range of dynamic inflow rates and demonstrated good instantaneous flow prediction when operated with in an acceptable flow range. Additionally, two second time averaging of adjacent flow readings smoothes noise in the original signal with minimal loss of signal definition. However, this study was limited to laboratory test of a stationary clean grain elevator. Consequently, potential error sources such as; error in

7ground speed, shock and vibration, measured swath width, transport delays in the threshing unit and others may still influence the overall accuracy of the yield map.
References Arslan, S. and T.S. Colvin. 1998. Laboratory Test Stand for Combine Grain Yield Monitors. Applied Engineering in Agriculture, Vol. 14(4):369-371 Burks, T.F., S.A. Shearer, C.J. Sobolik, and J.P. Fulton. 2000. Combine Yield Monitor Test Facility Development. ASAE Paper No. 00-1084. ASAE, St. Joseph, Michigan. Kettle, L.Y. and C.L. Peterson. 1998. An evaluation of Yield Monitors and GPS Systems on Hillside Combines Operating on the Steep Slopes in the Palouse. ASAE Paper No. 98-1046. ASAE, St. Joseph, Michigan. Kormann G., M. Demmel, H. Auernhammer. 1998. Testing Stand for Yield Measurement Systems in Combine Harvesters. ASAE Paper No. 98-3102. ASAE, St. Joseph, Michigan. Perez-Munoz, F. And T.S. Colvin. 1994. Continuous grain yield monitoring. ASAE Paper No. 94-1053. ASAE, St. Joseph, Michigan. Shearer, S. A., S. G. Higgins, S. G. McNeill, and G. A. Watkins. 1997. Data Filtering and Correction Techniques for Generating Yield Maps from Multiple -Combine Harvesting Systems. ASAE Paper No. 97-1034. ASAE, St. Joseph, Michigan. Stafford, J.V., B. Ambler, and M.P. Smith. 1991. Sensing and Mapping Grain Yield Variation. Automated Agriculture for the 21st Century, ASAE, St. Joseph, Michigan. pp. 356-366. Strubb, G., B. Missotten, and J. De Baerdemaeker. 1996. Performance Evaluation of a Three-Dimensional Optical Volume Flow Meter. Applied Engineering in Agriculture. Vol. 12(4):403-409. Thylen, L. and P.L. Murphy. 1996. The Control of Errors in Momentary Yield Data from Combine Harvesters. Journal of Agricultural Engineering Research. 64: 271-278. Yang, C., C.L. Peterson, G.J. Shropshire, and T. Otawa. 1998. Spatial Variability of Field Topography and Wheat Yield in the Palouse Region of the Pacific Northwest. Transactions of the ASAE. Vol. 41(1):17-27.

8
Supply Tank Weigh Tank
Grain Pump
Grain Flow Meter
Elevator Support Structure
Clean Grain Elevator
AugerElevator
U-Trough
Figure 1. Yield Monitor Test Facility Plan View.
Figure 2. Yield Monitor Test Facility.

9
a) Step flow with 21 kg/s maximum. b) Ramp flow with 21 kg/s maximum.
Figure 3. Accumulated flow comparison between sensor, meter and scales. Sensor calibrated using two point method at 6.3 and 12.7 kg/s.
a) Flow based on 26 kg/s maximum flow. b)
Flow based on 21 kg/s maximum flow.
Figure 4. X578 Instantaneous flow comparison between sensor and meter for Step flow. Sensor calibrated using two point method at 6.3 and 12.7 kg/s.

10
a) 70 seconds comparison. b) 25 second comparison.
Figure 5. X578 Instantaneous flow comparison between actual sensor 1s reading, and the 2s and 3s average reading.
a) X578 Transient flow comparison. b) X578 Oscillating flow comparison.
Figure 6. X578 Instantaneous flow comparison between sensor and meter. Sensor calibrated using two point method at 6.3 and 12.7 kg/s.

11
Table 1. Accumulated mass flow comparison for static flow rates.
Target
Flow
Run
Time
Actual
Flow 1 Sensor
Scale
Total
Error
Test
(kg/s) (sec) (kg/s) (kg) (kg) %
1.3 600 1.3 795 771 3.1
4.2 180 4.4 810 798 1.5
8.4 180 8.5 1552 1554 0.1
12.7 180 12.7 2322 2329 0.3
16.9 120 17.0 2063 2067 0.2
21.1 120 21.2 2502 2573 2.7
Table 2. Accumula
T
C
(k
4.
4.
4.
4.
1. The actual flow is calculated using the average total mass accumulated at the weigh scale divided by the number of seconds that the meter was delivering grain to the clean grain elevator.
ted mass flow comparison for dynamic flow rate change.
arget Flow
hange
Run
Time Step Change Flow Ramp Change Flow
Sensor Scale Error Sensor Scale Error
g/s) (sec) (kg) (kg) % (kg) (kg) %
2 to 8.4 90 625 610 2.5 569 556 2.3
2 to 12.7 90 855 872 0.7 756 739 2.2
2 to 16.9 90 1110 1118 0.7 941 925 1.8
2 to 21.1 90 1456 1356 7.3 1163 1119 4.0

12
Table 3. Accumulated mass flow comparison for X578 flow profiles.
Flow Type
Flow
Range
Run
Time Sensor Scale
Mean
Error 1
Max.
Error 1
(kg/s) (sec) (kg) (kg) % %
Transient 13 - 21 60 768 739 3.9 4.9
Oscillating 13 - 21 180 1199 1179 1.7 2.4
Variable Step 0 - 19 180 2618 2624 0.2 1.3
1. The mean error is based on the average of two unique observations, while the maximum error is the higher of the two observations
Copyright © 2022 FDOKUMEN


![Elevator Catalog [1.3 MB] - Wirerope Works](https://static.fdokumen.com/doc/165x107/6327034c6d480576770d1104/elevator-catalog-13-mb-wirerope-works.jpg)

