Infiltration from an impoundment for coal-bed natural gas, Powder River Basin, Wyoming: Evolution of...
16
Infiltration from an impoundment for coal-bed natural gas, Powder River Basin, Wyoming: Evolution of water and sediment chemistry Richard W. Healy, 1 Cynthia A. Rice, 1 Timothy T. Bartos, 2 and Michael P. McKinley 3 Received 31 July 2007; revised 24 March 2008; accepted 8 April 2008; published 27 June 2008. [1] Development of coal-bed natural gas (CBNG) in the Powder River Basin, Wyoming, has increased substantially in recent years. Among environmental concerns associated with this development is the fate of groundwater removed with the gas. A preferred water-management option is storage in surface impoundments. As of January 2007, permits for more than 4000 impoundments had been issued within Wyoming. A study was conducted on changes in water and sediment chemistry as water from an impoundment infiltrated the subsurface. Sediment cores were collected prior to operation of the impoundment and after its closure and reclamation. Suction lysimeters were used to collect water samples from beneath the impoundment. Large amounts of chloride (12,300 kg) and nitrate (13,500 kg as N), most of which accumulated naturally in the sediments over thousands of years, were released into groundwater by infiltrating water. Nitrate was more readily flushed from the sediments than chloride. If sediments at other impoundment locations contain similar amounts of chloride and nitrate, impoundments already permitted could release over 48 10 6 kg of chloride and 52 10 6 kg of nitrate into groundwater in the basin. A solute plume with total dissolved solid (TDS) concentrations at times exceeding 100,000 mg/L was created in the subsurface. TDS concentrations in the plume were substantially greater than those in the CBNG water (about 2300 mg/L) and in the ambient shallow groundwater (about 8000 mg/L). Sulfate, sodium, and magnesium are the dominant ions in the plume. The elevated concentrations are attributed to cation-exchange-enhanced gypsum dissolution. As gypsum dissolves, calcium goes into solution and is exchanged for sodium and magnesium on clays. Removal of calcium from solution allows further gypsum dissolution. Citation: Healy, R. W., C. A. Rice, T. T. Bartos, and M. P. McKinley (2008), Infiltration from an impoundment for coal-bed natural gas, Powder River Basin, Wyoming: Evolution of water and sediment chemistry, Water Resour. Res., 44, W06424, doi:10.1029/2007WR006396. 1. Introduction [2] In arid and semiarid regions of the United States, salts are deposited onto the land surface from precipitation and dry atmospheric deposition. As water from precipitation infiltrates, it carries these salts into the subsurface. Most of the water that infiltrates is eventually returned to the atmosphere by evaporation from soil or plants; therefore most of the salts remain in the subsurface. As the cycle of deposition and evaporation is repeated over hundreds to thousands of years, large quantities of salts accumulate in the unsaturated zone in these regions. Phillips [1994] reported chloride storage greater than 20,000 kg/ha in some areas of the western United States. Patterns of chloride accumulation in sediments can be used to estimate rates of groundwater recharge [Allison and Hughes, 1978; Allison, 1988; Cook et al., 1992; Phillips, 1994]. Typically, areas of low chloride accumulation correspond to areas of active recharge (i.e., percolating recharge water transports chloride out of the unsaturated zone), whereas areas of high chloride accumulation are associated with low rates of recharge (i.e., chloride is being deposited on land surface at rates greater than it is being transported out of the unsaturated zone). Because streams in these regions often are a source of recharge, salts tend to be flushed out of sediments underly- ing stream channels [Hartsough et al., 2001; Heilweil and Solomon, 2004; Heilweil et al., 2006]. Nitrate also has accumulated in sediments in arid and semiarid regions [Boyce et al., 1976; Hartsough et al., 2001; Walvoord et al., 2003; McMahon et al., 2006]. There can be multiple sources for this nitrate, including atmospheric deposition, plant fixation of atmospheric nitrogen, and oxidation of geologic sources of NH 4 to nitrate. [3] Climate or land-use changes can cause displacement of salts stored in the unsaturated zone [Boyce et al., 1976; Walvoord et al., 2003]. Stonestrom et al. [2004] showed that peaks in chloride concentration occurred at much deeper depths in unsaturated zones underlying irrigated fields in the Amargosa Desert as compared with unsaturated zones in areas of native vegetation. Presumably, percolating irriga- 1 U.S. Geological Survey, Lakewood, Colorado, USA. 2 U.S. Geological Survey, Cheyenne, Wyoming, USA. 3 U.S. Bureau of Land Management, Buffalo, Wyoming, USA. This paper is not subject to U.S. copyright. Published in 2008 by the American Geophysical Union. W06424 WATER RESOURCES RESEARCH, VOL. 44, W06424, doi:10.1029/2007WR006396, 2008 1 of 16
-
Upload
independent -
Category
Documents
-
view
2 -
download
0
Transcript of Infiltration from an impoundment for coal-bed natural gas, Powder River Basin, Wyoming: Evolution of...

Infiltration from an impoundment for coal-bed natural gas,
Powder River Basin, Wyoming: Evolution of water and
sediment chemistry
Richard W. Healy,1 Cynthia A. Rice,1 Timothy T. Bartos,2 and Michael P. McKinley3
Received 31 July 2007; revised 24 March 2008; accepted 8 April 2008; published 27 June 2008.
[1] Development of coal-bed natural gas (CBNG) in the Powder River Basin, Wyoming,has increased substantially in recent years. Among environmental concerns associatedwith this development is the fate of groundwater removed with the gas. A preferredwater-management option is storage in surface impoundments. As of January 2007,permits for more than 4000 impoundments had been issued within Wyoming. A study wasconducted on changes in water and sediment chemistry as water from an impoundmentinfiltrated the subsurface. Sediment cores were collected prior to operation of theimpoundment and after its closure and reclamation. Suction lysimeters were used tocollect water samples from beneath the impoundment. Large amounts of chloride(12,300 kg) and nitrate (13,500 kg as N), most of which accumulated naturally in thesediments over thousands of years, were released into groundwater by infiltrating water.Nitrate was more readily flushed from the sediments than chloride. If sediments at otherimpoundment locations contain similar amounts of chloride and nitrate, impoundmentsalready permitted could release over 48 � 106 kg of chloride and 52 � 106 kg of nitrateinto groundwater in the basin. A solute plume with total dissolved solid (TDS)concentrations at times exceeding 100,000 mg/L was created in the subsurface. TDSconcentrations in the plume were substantially greater than those in the CBNG water(about 2300 mg/L) and in the ambient shallow groundwater (about 8000 mg/L). Sulfate,sodium, and magnesium are the dominant ions in the plume. The elevated concentrationsare attributed to cation-exchange-enhanced gypsum dissolution. As gypsum dissolves,calcium goes into solution and is exchanged for sodium and magnesium on clays.Removal of calcium from solution allows further gypsum dissolution.
Citation: Healy, R. W., C. A. Rice, T. T. Bartos, and M. P. McKinley (2008), Infiltration from an impoundment for coal-bed natural
gas, Powder River Basin, Wyoming: Evolution of water and sediment chemistry, Water Resour. Res., 44, W06424,
doi:10.1029/2007WR006396.
1. Introduction
[2] In arid and semiarid regions of the United States, saltsare deposited onto the land surface from precipitation anddry atmospheric deposition. As water from precipitationinfiltrates, it carries these salts into the subsurface. Most ofthe water that infiltrates is eventually returned to theatmosphere by evaporation from soil or plants; thereforemost of the salts remain in the subsurface. As the cycle ofdeposition and evaporation is repeated over hundreds tothousands of years, large quantities of salts accumulate inthe unsaturated zone in these regions. Phillips [1994]reported chloride storage greater than 20,000 kg/ha in someareas of the western United States. Patterns of chlorideaccumulation in sediments can be used to estimate rates ofgroundwater recharge [Allison and Hughes, 1978; Allison,1988; Cook et al., 1992; Phillips, 1994]. Typically, areas of
low chloride accumulation correspond to areas of activerecharge (i.e., percolating recharge water transports chlorideout of the unsaturated zone), whereas areas of high chlorideaccumulation are associated with low rates of recharge (i.e.,chloride is being deposited on land surface at rates greaterthan it is being transported out of the unsaturated zone).Because streams in these regions often are a source ofrecharge, salts tend to be flushed out of sediments underly-ing stream channels [Hartsough et al., 2001; Heilweil andSolomon, 2004; Heilweil et al., 2006]. Nitrate also hasaccumulated in sediments in arid and semiarid regions[Boyce et al., 1976; Hartsough et al., 2001; Walvoord etal., 2003; McMahon et al., 2006]. There can be multiplesources for this nitrate, including atmospheric deposition,plant fixation of atmospheric nitrogen, and oxidation ofgeologic sources of NH4 to nitrate.[3] Climate or land-use changes can cause displacement
of salts stored in the unsaturated zone [Boyce et al., 1976;Walvoord et al., 2003]. Stonestrom et al. [2004] showed thatpeaks in chloride concentration occurred at much deeperdepths in unsaturated zones underlying irrigated fields in theAmargosa Desert as compared with unsaturated zones inareas of native vegetation. Presumably, percolating irriga-
1U.S. Geological Survey, Lakewood, Colorado, USA.2U.S. Geological Survey, Cheyenne, Wyoming, USA.3U.S. Bureau of Land Management, Buffalo, Wyoming, USA.
This paper is not subject to U.S. copyright.Published in 2008 by the American Geophysical Union.
W06424
WATER RESOURCES RESEARCH, VOL. 44, W06424, doi:10.1029/2007WR006396, 2008
1 of 16

tion water transported the chloride peak downward. Re-placement of native vegetation with dryland crops, such aswheat, has led to increased recharge rates, with the unin-tended consequence of increased salinization of local aqui-fers due to a flushing of accumulated salts in areas ofMontana [Miller et al., 1980] and Australia [Salama etal., 1993]. Land surface storage of groundwater extractedduring energy development in northern Wyoming raisessome concerns in regard to flushing of naturally occurringsalts into ground or surface waters.[4] The Powder River Structural Basin comprises more
than 61,000 km2 in Wyoming and Montana (Figure 1). Ithas historically been an important source of energy resour-ces, containing the largest coal resources of any coal field inthe contiguous United States [Glass, 1997]. Oil and con-ventional natural gas resources also are abundant. Recenttechnological advances have allowed development of aknown, but unconventional, source of natural gas, gasstored in coal beds (CBNG). Since 1997, development ofCBNG has increased rapidly in the Basin. As of 2006, therewere more than 19,000 active CBNG wells in the Wyomingpart of the Basin; that number is projected to exceed 50,000by 2013 [U.S. Bureau of Land Management (U.S. BLM),2003b].
[5] CBNG wells generally tap coal beds in the Fort UnionFormation at depths of 100–1000 m. Overlying the FortUnion Formation in much of the Basin is the WasatchFormation, which consists of shales, siltstones, and sand-stones. The Wasatch Formation is overlain in many areaswith unconsolidated surficial sediments. The steppe cli-mate in the Basin is typical of semiarid grassland prairies[Martner, 1986]. Average temperature in Gillette is about7�C; average annual precipitation is 410 mm [WesternRegional Climate Center, 2001].[6] Natural gas in the Basin is extracted by withdrawing
water from coal beds, thus lowering the water pressure andreleasing the gas. Additional information on CBNG gener-ation, reserves, and development within the Powder RiverBasin is given by De Bruin et al. [2000], Bartos and Ogle[2002], and Rice et al. [2002]. The rapid and extensivedevelopment gives rise to several environmental issues,including depletion of groundwater resources, soil erosion,changes in wildlife habitat, possible introduction of invasiveplant species, and air quality and noise impacts [U.S. BLM,2003a]. The fate of the produced CBNG water, one of themost salient of these issues, is the focus of this study.[7] The average rate of water pumpage from new wells in
the Basin is about 47 m3/d [Wheaton and Brown, 2005].Water production declines gradually over the 7- to 10-yearlife of the well. In 2006, about 680 million barrels(108,000,000 m3) of water were produced (Wyoming Oiland Gas Conservation Commission; see http://wogcc.state.wy.us). CBNG water in the Basin is generally a sodium-bicarbonate type with total dissolved solids (TDS) andsodium adsorption ratio in the range of 200–4000 mg/Land 5.6–69, respectively [Rice et al., 2002; Bartos andOgle, 2002]. Sodium adsorption ratio (SAR) is a measure ofthe concentration of sodium in water or sediment relative tothe concentrations of calcium and magnesium. Concernabout the CBNG water cited in the Federal EnvironmentalImpact Statement [U.S. BLM, 2003a] centers on high valuesof SAR. Water with SARs in excess of 13 can causedeterioration of soil structure [Soil Survey Laboratory,1995]. Hence such waters are undesirable for irrigation. Apreferred option for disposal of CBNG water is to place it inimpoundments where the water can infiltrate and evaporate[U.S. BLM, 2003b]. As of January 2007, permits had beenissued for more than 4000 of these impoundments in thePowder River Basin in the state of Wyoming (WyomingState Engineer’s Office, written communication, 2007).Typical surface water storage capacity of an impoundmentis 12,000 m3.[8] The impact of impoundments for CBNG water on
naturally occurring salts stored in sediments and the possi-ble transport of those salts to surface water and groundwaterbodies within the Powder River Basin are critical questions.This paper presents results of a study of the fate of CBNGwater placed in one such impoundment. We report on waterand sediment chemistry in the subsurface immediatelyunderlying the impoundment prior to the initial introductionof CBNG water and how that chemistry changed throughthe 10-month period that the impoundment was in operationand for more than a year after the impoundment wasdecommissioned. Results presented here are based onanalyses of sediment cores obtained before and after theoperational life of the reservoir and on analyses of water
Figure 1. Location map for Skewed Reservoir study andmonitoring network.
2 of 16
W06424 HEALY ET AL.: POWDER RIVER BASIN WATER AND SEDIMENT CHEMISTRY W06424

samples obtained from suction cup lysimeters installedbeneath the reservoir. Groundwater transport of solutes,which is the subject of another paper, is not discussed here,with the exception that concentrations of chloride andnitrate in samples from observation wells are used toestimate the total amounts of those constituents that wereflushed from sediments.
2. Methods
[9] The study was conducted at Skewed Reservoir inJohnson County, Wyoming (Figure 1). A compacted earthendam, approximately 6 m in height and 1 ha in area, wasconstructed with native colluvial sediments in July 2003 tocreate the reservoir. The dam was built across a smallephemeral channel that drained approximately 20 ha ofland. Capacity of the reservoir was about 12,000 m3.Underlying the impoundment were 8 m of unconsolidateddeposits on top of bedrock. While the reservoir was underconstruction, and prior to the introduction of CBNG water,50-mm-diameter suction cup lysimeters were installed intothe sediments beneath the base of the reservoir at depths of3, 4.9, and 6.7 m. (For convenience, these will be referred toas the 3-m, 5-m, and 7-m lysimeters throughout the remain-der of this paper.) An additional lysimeter was installed at a
depth of 5.2 m at a control site, which is unaffected by anyimpoundments or CBNG discharge water, about 1.5 kmnorth of Skewed Reservoir. Suction lysimeters allow col-lection of water samples when the sediments are fully orpartially saturated. A hand auger was used to bore holes forthe lysimeters; sediment samples were collected at intervalsof about 0.3 m. Sediment samples were also obtained bymeans of a hollow-stem auger at two locations along theephemeral channel across which the dam was constructed(Figure 1). Nineteen observation wells were installed nearthe reservoir (Figure 1) with a hollow-stem auger. Theunconsolidated surficial sediments, which consist of veryfine to fine sand with silt and clay, were initially unsaturat-ed. Bedrock is part of the Wasatch Formation; its surface isvariable in terms of lateral continuity, elevation, degree ofweathering and fracturing, and composition (shale, siltstone,or sandstone). Along the center axis of the small valley thatcontained the reservoir, the bedrock surface dips toward thesouth–southwest, eventually intersecting the Beaver Creekalluvial aquifer at a distance of about 200 m from the dam(Figure 2). Most wells were screened at the bottom of theunconsolidated deposits (Figure 2), immediately overlyingthe bedrock, and thus were initially dry. In the immediatevicinity of the reservoir, groundwater was initially encoun-tered in only four wells (2D, 3, 5, and 6). These wells all
Figure 2. Skewed Reservoir north-south hydrogeologic section (prior to discharge of water intoSkewed Reservoir). Line of section shown on Figure 1.
W06424 HEALY ET AL.: POWDER RIVER BASIN WATER AND SEDIMENT CHEMISTRY
3 of 16
W06424

extended into bedrock. On the basis of depth of geologicunits, water levels, and water chemistry, it was determinedthat these saturated zones were hydraulically isolated fromeach other. A confined sandstone aquifer was encounteredat a depth of about 33 m in well 3; no other aquifers wereencountered. Wells 13–18 were completed in the BeaverCreek alluvial aquifer (Figures 1 and 2). Well 12 iscompleted in bedrock, but appears to be hydraulicallyconnected to the alluvial aquifer and is the closest suchwell to the reservoir.[10] The reservoir began accepting water from 6 CBNG
wells on 16 August 2003 and continued to accept wateruntil May 2004. A flowmeter measured the volume of waterdischarged to the reservoir. Approximately 95,000 m3 ofwater was pumped into the reservoir, an average of 52 m3/dper well. Anecdotal evidence suggests that initial infiltrationrates from the reservoir were high; stage height in thereservoir was stable at about 2 m for the first several monthsof operations. Over time, the stage height increased as,presumably, the infiltration rate decreased. By May 2004,the stage height was greater than 4.5 m. Stage height in thereservoir decreased gradually after discharge to it was haltedin May 2004. By mid-August 2004, there was standingwater with a height less than 0.5 m in only the lowestreaches of the reservoir. Some standing water remainedthere until the area was reclaimed in August 2005. Duringreclamation, the remaining water was pumped out of thereservoir, the dam was torn down, the sediments that madeup the dam were redistributed over the base of the reservoir,and the site was reseeded. Two months after reclamation, inOctober 2005, 50-mm-diameter continuous sediment coreswere collected from land surface to bedrock using apneumatic drill rig at three sites close to the lysimeters.These cores are referred to as postreservoir sedimentsamples.[11] The prereservoir sediment samples were analyzed for
moisture content, bulk density, and particle size by methodsdescribed by Dane and Topp [2002]. Concentrations ofwater-leachable ions in prereservoir and postreservoir sed-iment samples were determined with the method describedby McMahon et al. [2003]. Briefly, air-dried sediment wasmixed with deionized water in a 1:10 mass ratio, asrecommended by Faulkner et al. [2001]. After mixing, sam-ples were placed on an orbital shaker for 1 h at 170 rpm. Thesamples were then spun in a centrifuge for 10 min, afterwhich water was extracted and passed through a 0.45-mmfilter. Anion concentrations were determined using standardion chromatographic methods [Dionex Corporation, 2001]with an AS14 column; cation concentrations were determinedby inductively coupled plasma-atomic emission spectrometry[Briggs, 2003; Lamothe et al., 2002]. Cation exchangecapacity on samples of bulk soil and sediment was deter-mined by utilizing a modification of the unbuffered saltextraction method described by Sumner and Miller [1996];0.1M SrCl2 and 0.1M CaCl2 were used instead of 0.2MNH4Cl and 0.2M KNO3 (B. Jones, U.S. Geological Survey,oral communication, 2005). Bulk soil and sediment sampleswere prepared for X-ray diffraction (XRD) analysis by air-drying the sample and splitting by hand. The representativesplits were then processed for either bulk XRD or claymineral identification according to the respective methodsfor each. X-ray diffraction identification of bulk soil and
sediment samples was accomplished according to methodsdescribed by Eberl [2003] utilizing a micronized sample towhich a known amount of zinc oxide was mixed as areference intensity pattern. Identification of minerals wasaccomplished utilizing Jade 7 software [Materials Data,Inc., 2005] (any use of trade, firm, or product names is fordescriptive purposes only and does not imply endorsement bythe U.S. government), and X-ray diffraction patterns of bulksamples were analyzed with the RockJock software [Eberl,2003] to quantify the minerals. RockJock can generallyquantify minerals to ±5% of a particular phase if a gooddegree of fit can be obtained for the calculated pattern versusthe measured pattern. Clay minerals were prepared andanalyzed by methods described by Moore and Reynolds[1997] using the glass-slide method and a four-step techniquethat notes changes in mineralogy following air-drying, eth-ylene glycol solvation, heating to 400�C, and heating to550�C.[12] Water samples were collected from lysimeters and
wells on 15 dates between late August 2003 and October2005. Lysimeter water samples were obtained by applyingsuction to each lysimeter, waiting about 4 h, and thenapplying positive air pressure to push the water sampleout of the lysimeter through a sampling tube. This firstsample was discarded, and the process was repeated. Thesecond sample was saved for analysis. Water samples fromwells were obtained after purging three casing volumes witheither submersible pumps or bailers. Samples were analyzedfor major dissolved-ion chemistry and metals using standardmethods [Rice et al., 2002; Bartos and Ogle, 2002].Geochemical modeling was performed with the Phreeqcmodel [Parkhurst and Appelo, 1999].
3. Results
3.1. Sediment Properties
[13] The unconsolidated sediments are very fine to finesand and silt with about 11% clay; there was little variationin texture with depth. Gravimetric soil moisture contentsbetween the depths of 0.5 and 4.5 m were relatively uniformat about 0.07. From depths of 5 to 6.25 m, moisture contentswere higher, between 0.12 and 0.14. Cation exchangecapacity (CEC) varied little with depth. Samples from36 different depths were analyzed for CEC. The averageCEC was 24.5 meq per 100 g sediment (standard deviationof 4.4). Results of bulk mineralogical analyses (Figure 3)show that quartz is the predominant mineral, generallyaccounting for 30–50% of total mass. Gypsum, calcite,and dolomite are present throughout the profile, in abun-dances of about 1–2%, although at some depths abundancesexceed 8%. Clay minerals account for about 30–35% oftotal mass. Smectites account for 10–18% of the sedimentmass. To gain some understanding of possible cation-exchange mechanisms as water infiltrated from the reser-voir, an effort was made to identify cations that originallyoccupied exchange sites on the smectites. Distinguishingcalcium and sodium saturated smectites by analysis of initialX-ray diffraction patterns with the RockJock softwareproved problematic. A second round of X-ray patternswas run on samples from 10 depths (0.3–7 m). For thissecond round, samples were heated to 400�C for 24 h andthen immediately X rayed, thus minimizing the possibility
4 of 16
W06424 HEALY ET AL.: POWDER RIVER BASIN WATER AND SEDIMENT CHEMISTRY W06424

of dried clays becoming rehydrated. Although this proce-dure was not able to provide actual percentages of sodiumand calcium saturated exchange sites, qualitative trendswere apparent. At the shallowest depths, X-ray patternsresembled patterns produced from a 15% pure calcium-saturated smectite standard (mixed with quartz). At thedeepest depths, X-ray patterns were very similar to thosefor an analogous sodium-saturated smectite standard. Therewas a consistent trend in the intermediate depths: Thedeeper the sample, the more the X-ray pattern resembledthat of the sodium-saturated smectite. Although not quan-tifiable, the implication is that calcium-saturated smectites,which dominated at shallow depths, grade into sodium-saturated smectites at depth. A similar trend was noted for
smectites in sediment samples obtained at well 12. Attemptswere also made to directly measure the amount of sodium-occupied exchange sites, referred to as the exchangeablesodium percentage, or ESP, by the standard laboratorymethod of Helmke and Sparks [1996]. These results wereinconclusive; the possible presence of naturally occurringsoluble salts in these sediments made it impossible todistinguish between dissolution phenomena and exchangereactions.
3.2. Initial Water Chemistry
[14] CBNG water is a sodium-bicarbonate type with anaverage TDS concentration of 2275 mg/L (Table 1), typi-cally void of available oxygen, nitrate, sulfate, and otherelectron acceptors due to the reducing environment of thecoal beds in which natural gas is generated. Data for theCBNG water in Table 1 represent average concentrationsfrom nine gas production wells located within 2 km ofSkewed Reservoir. These wells do not discharge to thereservoir, but they produce from the same coal bed (BigGeorge) at about the same depth (408 m) as the wells thatdo discharge to the reservoir. It was not possible to directlysample the wells that discharged into Skewed Reservoir.[15] The sediments within which the lysimeters were
installed were initially too dry to allow collection of watersamples (lysimeters cannot collect samples if soil-watertension exceeds about 1 bar). The lysimeters were unableto produce water samples until 5 d after water beganflowing into the reservoir (21 August 2003). Although thereare no background data on unsaturated zone water chemis-try at the site, water samples were obtained from the controlsite lysimeter. Sediments at the control site were similar intexture to those near Skewed Reservoir. Unsaturated zonewater at the control site is a magnesium-sodium-sulfate typewith TDS concentration of 13,400 mg/L (Table 1).[16] Most observation wells were initially dry. Table 1
shows data for water from monitoring wells 2D and 6 thatproduced water prior to the reservoir going into operation(Figure 1). Data in Table 1 are from samples obtained before
Figure 3. Mineralogy as a function of depth at lysimeterborehole.
Table 1. Total Dissolved Solids (TDS), Major Ion Concentrations, and Sodium Adsorption Ratio (SAR) for Coal-Bed Natural Gas
(CBNG) Water, Shallow Groundwater, and Lysimeter Water Samples From Beneath Skewed Reservoir and From a Control Site Away
From the Reservoira
Location and DateTDSb
(mg/L)SO4
(mg/L)HCO3
c
(mg/L)NO3 asN (mg/L)
Cl(mg/L)
Ca(mg/L)
Mg(mg/L)
Na(mg/L)
K(mg/L)
pHUnits SAR
CBNG water 2,275 0.03 3,038 <0.05 28.9 50.5 37.5 1,040 47.4 8.37 27GW monitoring well 2D,27 Aug 2003
1,050 380 527 0.33 15 53.6 23.8 300 17.5 7.51 8.6
GW monitoring well 6,27 Aug 2003
7,504 5,240 749 0.97 42 424 1,038 350 41 7.62 2.1
3-m lysimeter,12 Nov 2003
5,950 2,890 1,495 0.2 206 663 251 1,033 11.4 7.30 8.6
5-m lysimeter,12 Nov 2003
15,100 8,300 482 118 1,822 480 1,680 1,987 11.0 7.28 9.5
7-m lysimeter,12 Nov 2003
105,000 79,000 484d 736 181 443 12,300 12,700 20.3 7.12 24.3
Control lysimeter,30 May 2002
13,400 9,720 310 23 87 435 1,710 1,260 23.1 7.45 5.7
aCBNG water represents average values from nine natural gas production wells near Skewed Reservoir; all other data represent individual samples.bCalculated value [Hem, 1992].cTotal alkalinity, expressed as HCO3.dEstimated value; alkalinity contains some noncarbonate species.
W06424 HEALY ET AL.: POWDER RIVER BASIN WATER AND SEDIMENT CHEMISTRY
5 of 16
W06424
these wells were affected by reservoir water. Well 2D isscreened at a depth of 16 m in sandstone; its water wasoriginally a sodium-bicarbonate-sulfate type with TDSconcentration of 1050 mg/L. Well 6 is screened at a depthof 5 m in shale and sandstone; its water was a magnesium-sulfate type with TDS concentration of about 7500 mg/L. Ingeneral, groundwater chemistry within the Wasatch Forma-tion is highly variable depending on local geology. Insandstone aquifers within the Formation, Bartos and Ogle[2002] and Rice et al. [2002] found that TDS concentrationswere in the range of from 200 to about 4000 mg/L; sulfateand bicarbonate were the dominant anions, and calcium andmagnesium were the dominant cations. Lowry et al. [1986]reported TDS concentrations as high as 8200 mg/L ingroundwater from the Formation, so the chemistries of theinitial groundwater samples from wells 2D and 6 were notatypical for the Wasatch Formation.
3.3. Groundwater Mound Formation
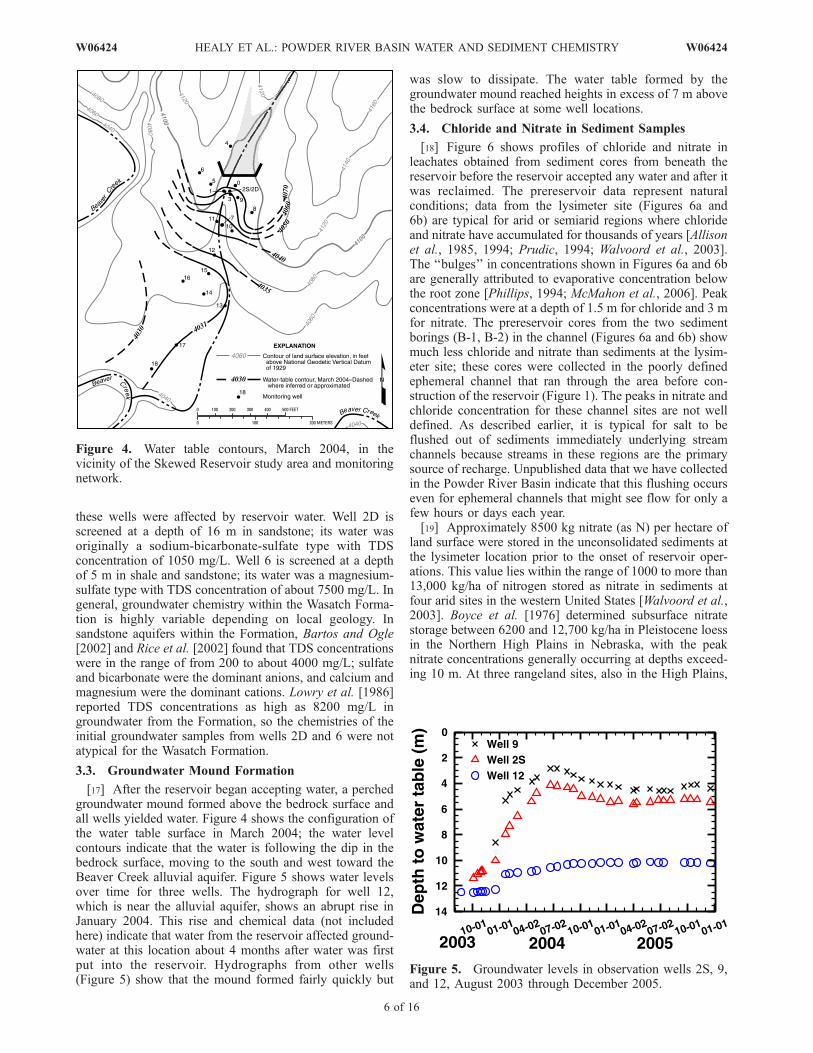
[17] After the reservoir began accepting water, a perchedgroundwater mound formed above the bedrock surface andall wells yielded water. Figure 4 shows the configuration ofthe water table surface in March 2004; the water levelcontours indicate that the water is following the dip in thebedrock surface, moving to the south and west toward theBeaver Creek alluvial aquifer. Figure 5 shows water levelsover time for three wells. The hydrograph for well 12,which is near the alluvial aquifer, shows an abrupt rise inJanuary 2004. This rise and chemical data (not includedhere) indicate that water from the reservoir affected ground-water at this location about 4 months after water was firstput into the reservoir. Hydrographs from other wells(Figure 5) show that the mound formed fairly quickly but
was slow to dissipate. The water table formed by thegroundwater mound reached heights in excess of 7 m abovethe bedrock surface at some well locations.
3.4. Chloride and Nitrate in Sediment Samples
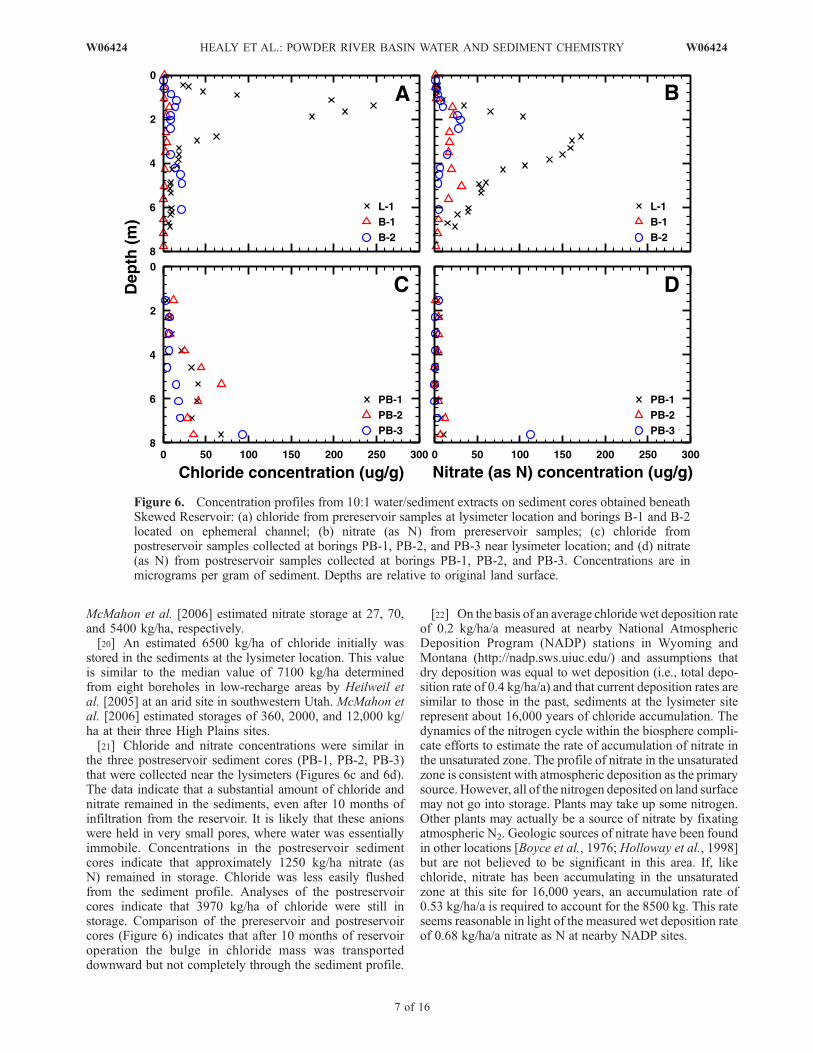
[18] Figure 6 shows profiles of chloride and nitrate inleachates obtained from sediment cores from beneath thereservoir before the reservoir accepted any water and after itwas reclaimed. The prereservoir data represent naturalconditions; data from the lysimeter site (Figures 6a and6b) are typical for arid or semiarid regions where chlorideand nitrate have accumulated for thousands of years [Allisonet al., 1985, 1994; Prudic, 1994; Walvoord et al., 2003].The ‘‘bulges’’ in concentrations shown in Figures 6a and 6bare generally attributed to evaporative concentration belowthe root zone [Phillips, 1994; McMahon et al., 2006]. Peakconcentrations were at a depth of 1.5 m for chloride and 3 mfor nitrate. The prereservoir cores from the two sedimentborings (B-1, B-2) in the channel (Figures 6a and 6b) showmuch less chloride and nitrate than sediments at the lysim-eter site; these cores were collected in the poorly definedephemeral channel that ran through the area before con-struction of the reservoir (Figure 1). The peaks in nitrate andchloride concentration for these channel sites are not welldefined. As described earlier, it is typical for salt to beflushed out of sediments immediately underlying streamchannels because streams in these regions are the primarysource of recharge. Unpublished data that we have collectedin the Powder River Basin indicate that this flushing occurseven for ephemeral channels that might see flow for only afew hours or days each year.[19] Approximately 8500 kg nitrate (as N) per hectare of
land surface were stored in the unconsolidated sediments atthe lysimeter location prior to the onset of reservoir oper-ations. This value lies within the range of 1000 to more than13,000 kg/ha of nitrogen stored as nitrate in sediments atfour arid sites in the western United States [Walvoord et al.,2003]. Boyce et al. [1976] determined subsurface nitratestorage between 6200 and 12,700 kg/ha in Pleistocene loessin the Northern High Plains in Nebraska, with the peaknitrate concentrations generally occurring at depths exceed-ing 10 m. At three rangeland sites, also in the High Plains,
Figure 4. Water table contours, March 2004, in thevicinity of the Skewed Reservoir study area and monitoringnetwork.
Figure 5. Groundwater levels in observation wells 2S, 9,and 12, August 2003 through December 2005.
6 of 16
W06424 HEALY ET AL.: POWDER RIVER BASIN WATER AND SEDIMENT CHEMISTRY W06424
McMahon et al. [2006] estimated nitrate storage at 27, 70,and 5400 kg/ha, respectively.[20] An estimated 6500 kg/ha of chloride initially was
stored in the sediments at the lysimeter location. This valueis similar to the median value of 7100 kg/ha determinedfrom eight boreholes in low-recharge areas by Heilweil etal. [2005] at an arid site in southwestern Utah. McMahon etal. [2006] estimated storages of 360, 2000, and 12,000 kg/ha at their three High Plains sites.[21] Chloride and nitrate concentrations were similar in
the three postreservoir sediment cores (PB-1, PB-2, PB-3)that were collected near the lysimeters (Figures 6c and 6d).The data indicate that a substantial amount of chloride andnitrate remained in the sediments, even after 10 months ofinfiltration from the reservoir. It is likely that these anionswere held in very small pores, where water was essentiallyimmobile. Concentrations in the postreservoir sedimentcores indicate that approximately 1250 kg/ha nitrate (asN) remained in storage. Chloride was less easily flushedfrom the sediment profile. Analyses of the postreservoircores indicate that 3970 kg/ha of chloride were still instorage. Comparison of the prereservoir and postreservoircores (Figure 6) indicates that after 10 months of reservoiroperation the bulge in chloride mass was transporteddownward but not completely through the sediment profile.
[22] On the basis of an average chloride wet deposition rateof 0.2 kg/ha/a measured at nearby National AtmosphericDeposition Program (NADP) stations in Wyoming andMontana (http://nadp.sws.uiuc.edu/) and assumptions thatdry deposition was equal to wet deposition (i.e., total depo-sition rate of 0.4 kg/ha/a) and that current deposition rates aresimilar to those in the past, sediments at the lysimeter siterepresent about 16,000 years of chloride accumulation. Thedynamics of the nitrogen cycle within the biosphere compli-cate efforts to estimate the rate of accumulation of nitrate inthe unsaturated zone. The profile of nitrate in the unsaturatedzone is consistent with atmospheric deposition as the primarysource. However, all of the nitrogen deposited on land surfacemay not go into storage. Plants may take up some nitrogen.Other plants may actually be a source of nitrate by fixatingatmospheric N2. Geologic sources of nitrate have been foundin other locations [Boyce et al., 1976; Holloway et al., 1998]but are not believed to be significant in this area. If, likechloride, nitrate has been accumulating in the unsaturatedzone at this site for 16,000 years, an accumulation rate of0.53 kg/ha/a is required to account for the 8500 kg. This rateseems reasonable in light of the measured wet deposition rateof 0.68 kg/ha/a nitrate as N at nearby NADP sites.
Figure 6. Concentration profiles from 10:1 water/sediment extracts on sediment cores obtained beneathSkewed Reservoir: (a) chloride from prereservoir samples at lysimeter location and borings B-1 and B-2located on ephemeral channel; (b) nitrate (as N) from prereservoir samples; (c) chloride frompostreservoir samples collected at borings PB-1, PB-2, and PB-3 near lysimeter location; and (d) nitrate(as N) from postreservoir samples collected at borings PB-1, PB-2, and PB-3. Concentrations are inmicrograms per gram of sediment. Depths are relative to original land surface.
W06424 HEALY ET AL.: POWDER RIVER BASIN WATER AND SEDIMENT CHEMISTRY
7 of 16
W06424
3.5. Chloride and Nitrate in Water Samples
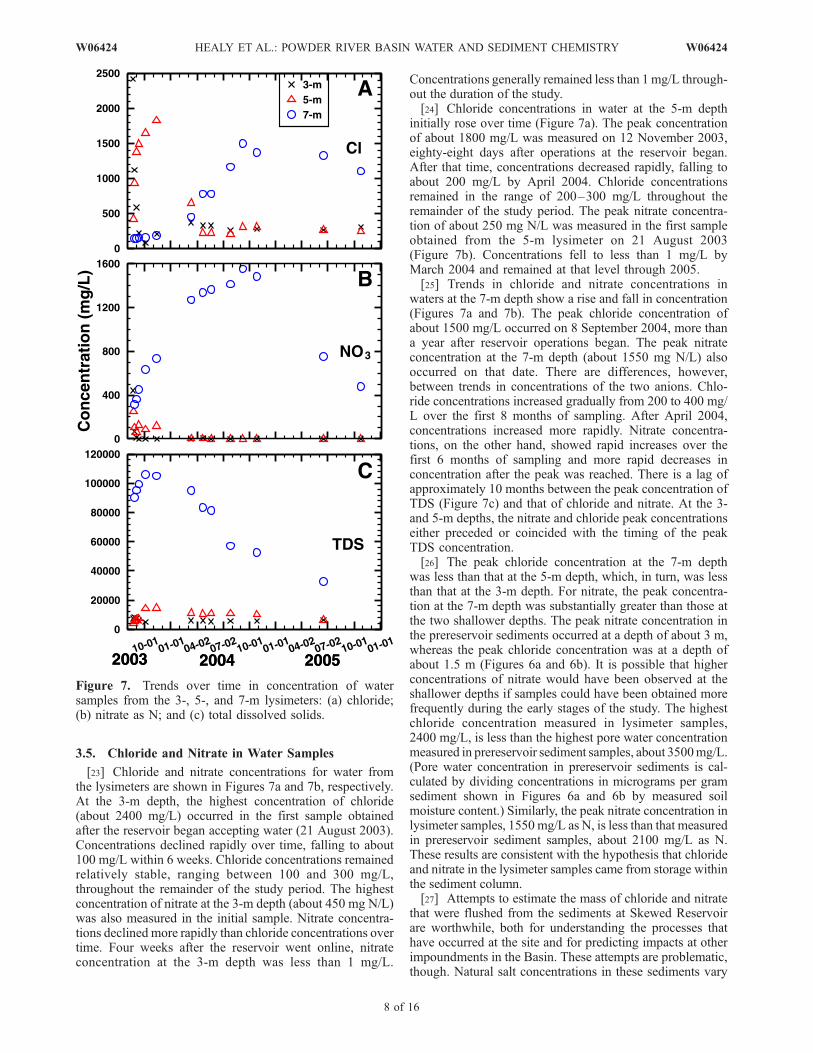
[23] Chloride and nitrate concentrations for water fromthe lysimeters are shown in Figures 7a and 7b, respectively.At the 3-m depth, the highest concentration of chloride(about 2400 mg/L) occurred in the first sample obtainedafter the reservoir began accepting water (21 August 2003).Concentrations declined rapidly over time, falling to about100 mg/L within 6 weeks. Chloride concentrations remainedrelatively stable, ranging between 100 and 300 mg/L,throughout the remainder of the study period. The highestconcentration of nitrate at the 3-m depth (about 450 mg N/L)was also measured in the initial sample. Nitrate concentra-tions declined more rapidly than chloride concentrations overtime. Four weeks after the reservoir went online, nitrateconcentration at the 3-m depth was less than 1 mg/L.
Concentrations generally remained less than 1mg/L through-out the duration of the study.[24] Chloride concentrations in water at the 5-m depth
initially rose over time (Figure 7a). The peak concentrationof about 1800 mg/L was measured on 12 November 2003,eighty-eight days after operations at the reservoir began.After that time, concentrations decreased rapidly, falling toabout 200 mg/L by April 2004. Chloride concentrationsremained in the range of 200–300 mg/L throughout theremainder of the study period. The peak nitrate concentra-tion of about 250 mg N/L was measured in the first sampleobtained from the 5-m lysimeter on 21 August 2003(Figure 7b). Concentrations fell to less than 1 mg/L byMarch 2004 and remained at that level through 2005.[25] Trends in chloride and nitrate concentrations in
waters at the 7-m depth show a rise and fall in concentration(Figures 7a and 7b). The peak chloride concentration ofabout 1500 mg/L occurred on 8 September 2004, more thana year after reservoir operations began. The peak nitrateconcentration at the 7-m depth (about 1550 mg N/L) alsooccurred on that date. There are differences, however,between trends in concentrations of the two anions. Chlo-ride concentrations increased gradually from 200 to 400 mg/L over the first 8 months of sampling. After April 2004,concentrations increased more rapidly. Nitrate concentra-tions, on the other hand, showed rapid increases over thefirst 6 months of sampling and more rapid decreases inconcentration after the peak was reached. There is a lag ofapproximately 10 months between the peak concentration ofTDS (Figure 7c) and that of chloride and nitrate. At the 3-and 5-m depths, the nitrate and chloride peak concentrationseither preceded or coincided with the timing of the peakTDS concentration.[26] The peak chloride concentration at the 7-m depth
was less than that at the 5-m depth, which, in turn, was lessthan that at the 3-m depth. For nitrate, the peak concentra-tion at the 7-m depth was substantially greater than those atthe two shallower depths. The peak nitrate concentration inthe prereservoir sediments occurred at a depth of about 3 m,whereas the peak chloride concentration was at a depth ofabout 1.5 m (Figures 6a and 6b). It is possible that higherconcentrations of nitrate would have been observed at theshallower depths if samples could have been obtained morefrequently during the early stages of the study. The highestchloride concentration measured in lysimeter samples,2400 mg/L, is less than the highest pore water concentrationmeasured in prereservoir sediment samples, about 3500mg/L.(Pore water concentration in prereservoir sediments is cal-culated by dividing concentrations in micrograms per gramsediment shown in Figures 6a and 6b by measured soilmoisture content.) Similarly, the peak nitrate concentration inlysimeter samples, 1550 mg/L as N, is less than that measuredin prereservoir sediment samples, about 2100 mg/L as N.These results are consistent with the hypothesis that chlorideand nitrate in the lysimeter samples came from storage withinthe sediment column.[27] Attempts to estimate the mass of chloride and nitrate
that were flushed from the sediments at Skewed Reservoirare worthwhile, both for understanding the processes thathave occurred at the site and for predicting impacts at otherimpoundments in the Basin. These attempts are problematic,though. Natural salt concentrations in these sediments vary
Figure 7. Trends over time in concentration of watersamples from the 3-, 5-, and 7-m lysimeters: (a) chloride;(b) nitrate as N; and (c) total dissolved solids.
8 of 16
W06424 HEALY ET AL.: POWDER RIVER BASIN WATER AND SEDIMENT CHEMISTRY W06424

spatially, as clearly indicated in Figure 6. To estimate theseflushed masses, a simple mass balance model based onchloride and nitrate concentrations in groundwater was used.Because there was initially no perched groundwater abovebedrock, the reservoir is the source of the free-movingperched water, and the chloride and nitrate in the perchedgroundwater derive either from the CBNG water itself(chloride concentration 28.9 mg/L, nitrate concentration lessthan 1 mg/L as N, Table 1) or from the sediments.[28] The mass of chloride in the perched water is equal to
the volume of water times the average concentration of thatwater. Generally, the volume of water in a perched zonesuch as this is very difficult to determine because ofgeologic heterogeneities. However, in this study, the volumeof water put into the reservoir is known, about 95,000 m3.Assuming that all of this water ended up in the perchedlayer, it remains then to estimate the average chlorideconcentration of the perched groundwater. To do this,chloride concentrations in observation well samples wereaveraged by date. Figure 8 shows the average chlorideconcentrations in water samples from all observation wellsaffected by infiltration from the reservoir for sampling datesbetween October 2003 and May 2005 (Note that the numberof wells included in the calculations shown in Figure 8varied over time. For the first sample date shown, only twowells were affected by the reservoir. The number of affectedwells rose to 15 by July 2004 and remained at 15 thereafter.)On any individual sampling date there was variability inchloride concentrations; the coefficient of variation (CV)ranged from 46 to 78%. However, the average value foreach sample date did not vary substantially over this period.The average concentration over all sample dates was129 mg/L (CV of 19%). Thus about 12,300 kg of chloridewere in the groundwater mound produced from the reser-voir. About 22% of this chloride, or about 2700 kg, can beattributed to the CBNG water itself. The remaining 9600 kgwere flushed from the sediments. It is important to note thatit is not just the sediments immediately underlying thereservoir that contribute chloride to the perched groundwa-ter; sediments that the perched water encounters as it movestoward the alluvial aquifer may also contribute chloride.This can be shown by simply calculating the mass that
would exist in the sediment column if only the 1-ha areaof the reservoir were contributing chloride. This amount,9600 kg/ha, is much greater than that measured at thelysimeter location (6500 kg/ha) or at any other boreholelocation in the study area for which chloride concentrationdata are available.[29] A similar approach is used to estimate the total amount
of nitrate in the perched groundwater. Figure 8 shows averagenitrate concentrations for water samples obtained in obser-vation wells that were affected by the reservoir for sampledates between October 2003 and May 2005. Variability innitrate concentration among wells on the same sampling date
Figure 8. Average concentration over time of chloride andnitrate (as N) in observation wells affected by SkewedReservoir.
Figure 9. Trends over time of major ion concentrations forwater samples from (a) 3-m lysimeter, (b) 5-m lysimeter,and (c) 7-m lysimeter.
W06424 HEALY ET AL.: POWDER RIVER BASIN WATER AND SEDIMENT CHEMISTRY
9 of 16
W06424
was greater (average CVof 103%) than that for chloride. Aswith chloride, however, the average concentration for eachsample date did not vary greatly; the average for all sampledates was 142 mg/L (as N), with a CVof 13%. Multiplyingthis average value by the 95,000 m3 of water from thereservoir produces an estimate of 13,500 kg of nitrate (asN) within the perched groundwater. The CBNG water isessentially void of nitrate, but it does contain about 6.3 mg/LNH4 as N. If all of this ammonium were oxidized to nitrate, itcould account for about 600 kg of the nitrate in the perchedgroundwater. The remaining 12,900 kg must have beenflushed from the sediments. The concentration of nitrate thatwould be required, if all of the nitrate came from the 1-ha areaof the reservoir, is calculated to be 12,900 kg/ha. Again, thisnumber is considerably greater than the 8,500 kg/ha that wasmeasured for the lysimeter site. The ratio of these twonumbers for nitrate of 1.52 is very similar to the ratio foundfor chloride of 1.48.
3.6. Major Ion Water Chemistry of Lysimeter Samples
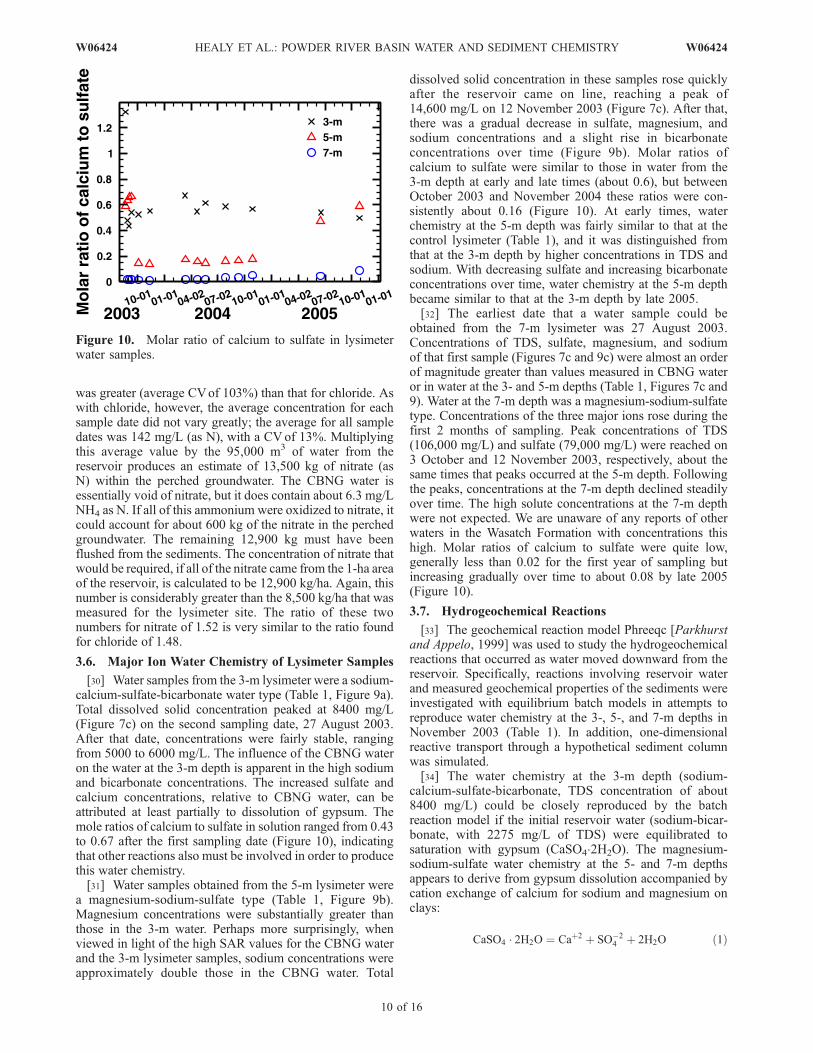
[30] Water samples from the 3-m lysimeter were a sodium-calcium-sulfate-bicarbonate water type (Table 1, Figure 9a).Total dissolved solid concentration peaked at 8400 mg/L(Figure 7c) on the second sampling date, 27 August 2003.After that date, concentrations were fairly stable, rangingfrom 5000 to 6000 mg/L. The influence of the CBNG wateron the water at the 3-m depth is apparent in the high sodiumand bicarbonate concentrations. The increased sulfate andcalcium concentrations, relative to CBNG water, can beattributed at least partially to dissolution of gypsum. Themole ratios of calcium to sulfate in solution ranged from 0.43to 0.67 after the first sampling date (Figure 10), indicatingthat other reactions also must be involved in order to producethis water chemistry.[31] Water samples obtained from the 5-m lysimeter were
a magnesium-sodium-sulfate type (Table 1, Figure 9b).Magnesium concentrations were substantially greater thanthose in the 3-m water. Perhaps more surprisingly, whenviewed in light of the high SAR values for the CBNG waterand the 3-m lysimeter samples, sodium concentrations wereapproximately double those in the CBNG water. Total
dissolved solid concentration in these samples rose quicklyafter the reservoir came on line, reaching a peak of14,600 mg/L on 12 November 2003 (Figure 7c). After that,there was a gradual decrease in sulfate, magnesium, andsodium concentrations and a slight rise in bicarbonateconcentrations over time (Figure 9b). Molar ratios ofcalcium to sulfate were similar to those in water from the3-m depth at early and late times (about 0.6), but betweenOctober 2003 and November 2004 these ratios were con-sistently about 0.16 (Figure 10). At early times, waterchemistry at the 5-m depth was fairly similar to that at thecontrol lysimeter (Table 1), and it was distinguished fromthat at the 3-m depth by higher concentrations in TDS andsodium. With decreasing sulfate and increasing bicarbonateconcentrations over time, water chemistry at the 5-m depthbecame similar to that at the 3-m depth by late 2005.[32] The earliest date that a water sample could be
obtained from the 7-m lysimeter was 27 August 2003.Concentrations of TDS, sulfate, magnesium, and sodiumof that first sample (Figures 7c and 9c) were almost an orderof magnitude greater than values measured in CBNG wateror in water at the 3- and 5-m depths (Table 1, Figures 7c and9). Water at the 7-m depth was a magnesium-sodium-sulfatetype. Concentrations of the three major ions rose during thefirst 2 months of sampling. Peak concentrations of TDS(106,000 mg/L) and sulfate (79,000 mg/L) were reached on3 October and 12 November 2003, respectively, about thesame times that peaks occurred at the 5-m depth. Followingthe peaks, concentrations at the 7-m depth declined steadilyover time. The high solute concentrations at the 7-m depthwere not expected. We are unaware of any reports of otherwaters in the Wasatch Formation with concentrations thishigh. Molar ratios of calcium to sulfate were quite low,generally less than 0.02 for the first year of sampling butincreasing gradually over time to about 0.08 by late 2005(Figure 10).
3.7. Hydrogeochemical Reactions
[33] The geochemical reaction model Phreeqc [Parkhurstand Appelo, 1999] was used to study the hydrogeochemicalreactions that occurred as water moved downward from thereservoir. Specifically, reactions involving reservoir waterand measured geochemical properties of the sediments wereinvestigated with equilibrium batch models in attempts toreproduce water chemistry at the 3-, 5-, and 7-m depths inNovember 2003 (Table 1). In addition, one-dimensionalreactive transport through a hypothetical sediment columnwas simulated.[34] The water chemistry at the 3-m depth (sodium-
calcium-sulfate-bicarbonate, TDS concentration of about8400 mg/L) could be closely reproduced by the batchreaction model if the initial reservoir water (sodium-bicar-bonate, with 2275 mg/L of TDS) were equilibrated tosaturation with gypsum (CaSO4�2H2O). The magnesium-sodium-sulfate water chemistry at the 5- and 7-m depthsappears to derive from gypsum dissolution accompanied bycation exchange of calcium for sodium and magnesium onclays:
CaSO4 � 2H2O ¼ Caþ2 þ SO�24 þ 2H2O ð1Þ
Figure 10. Molar ratio of calcium to sulfate in lysimeterwater samples.
10 of 16
W06424 HEALY ET AL.: POWDER RIVER BASIN WATER AND SEDIMENT CHEMISTRY W06424

Caþ2 þMgX2 ¼ Mgþ2 þ CaX2 ð2Þ
Caþ2 þ 2NaX ¼ 2Naþ þ CaX2: ð3Þ
[35] As calcium is removed from solution by exchangeonto clays, more dissolution of gypsum can occur. Waterchemistry at the 5-m depth could be reasonably wellreproduced with the batch model by equilibrating thereservoir water to saturation with gypsum, calcite, anddolomite and including 1 mole of cation-exchange siteswith an initial composition that was 67% Mg, 14% Na, and19% Ca by equivalents. The average cation exchangecapacity of 24.5 meq per 100 g of sediment and moisturecontent of 0.28 g water per gram of dry sediment (asmeasured in the postreservoir sediment cores) imply thatthere were about 0.875 moles of exchange sites per liter ofwater at the lysimeter location, in good agreement with the1 mole used in the model. Water chemistry at the 7-m depthcould be created by the same model but with cation-exchange sites having an initial composition that was 66%Mg, 32% Na, and 2% Ca. As discussed previously, miner-alogical and laboratory analyses were unable to quantifycation concentrations on clay exchange sites. No inferenceson magnesium could be made, but the mineralogical anal-yses did indicate that the relative number of sodium-occupied exchange sites increased with depth and thatsodium-saturated smectites dominated at the 7-m depth.[36] To further examine water chemistry at the 7-m depth,
a one-dimensional reactive solute transport simulation wasconstructed with Phreeqc for flow through a hypothetical7-m-long column. As with the batch model, water in thecolumn was equilibrated to saturation with gypsum, cal-cite, and dolomite, and 1 mole of exchange sites per literwas available with initial composition that was 66% Mg,32% Na, and 2% Ca. Inflow to the column was reservoirwater. This simulation should be considered qualitative innature. Because Phreeqc assumes that all pores are water
filled, the advancement of a wetting front through acolumn whose sediments are initially only partially watersaturated is not exactly represented. Nonetheless, themodel is a useful tool for examining the above statedhypothesis.[37] Initial column outflow (Figure 11) has high concen-
trations of sulfate, magnesium, and sodium, values similarto those in the 7-m lysimeter samples from late 2003(Figure 9c). After about one pore volume has flowedthrough the column, simulated sulfate, sodium, and magne-sium concentrations decrease, and alkalinity increases. In aqualitative sense, concentrations in the 7-m lysimeter sam-ples (Figure 9c) show similar trends. The timescales forFigures 9c and 11 cannot be directly compared because theactual flux rates within the subsurface, as discussed below,are unknown and probably vary widely in both space andtime. Nonetheless, the simulation results demonstrate theplausibility of the hypothesis that gypsum dissolution isenhanced by cation exchange. The amount of gypsumrequired to support results of the transport simulation isequivalent to slightly less than 2% of the solids in thecolumn; this amount is consistent with the mineralogyshown in Figure 3. Predicted changes in calcite and dolo-mite amounts were negligible.[38] The rates at which water moves through the subsur-
face and the pathways it follows are difficult to discern.Apparent vertical water velocity, vA, can be calculated basedon measured chloride and nitrate concentrations:
vA ¼ Dlys � Dpeak
� �=Dt; ð4Þ
where Dlys is lysimeter depth, Dpeak is depth of the initialpeak concentration in sediments (1.5 m for chloride and 3 mfor nitrate), and Dt is the difference between the time ofpeak concentration in lysimeter samples and the time whenthe reservoir first received water. Apparent velocity can alsobe calculated from the time it took for the wetting front fromthe reservoir to reach each lysimeter depth (Dt0):
vA ¼ Dlys=Dt0: ð5Þ
[39] Wetting front movement was not directly monitored,but it can be inferred from lysimeter performance. Thesuction lysimeters can obtain samples only when soil matricpotentials are greater than –100 kPa. The fact that thelysimeters were unable to collect samples prior to waterentering the reservoir indicates that matric potentials wereinitially less than –100 kPa. Because the wetting front musthave reached the depth of each lysimeter by the first datethat each lysimeter was able to collect a sample, those firstsample dates can be used to approximate Dt0: 5 d for the
Table 2. Apparent Vertical Velocities Calculated by Using
Equation (4) on the Basis of Chloride and Nitrate Concentrations
and Equation (5) on the Basis of Wetting-Front Movementa
Depth, m Chloride Nitrate Wetting Front
3 0.3 . . . 0.65 0.04 0.7 17 0.01 0.01 0.64
aVelocities are m/d.
Figure 11. Major ion concentrations in outflow from ahypothetical 7-m-long column as simulated with Phreeqc.Inflow to the column is coal-bed natural gas (CBNG) water(Table 1). In the column, the water is equilibrated tosaturation with gypsum, calcite, and dolomite; and there is1 mole of exchange sites with initial composition of 66%Mg, 32% Na, and 2% Ca.
W06424 HEALY ET AL.: POWDER RIVER BASIN WATER AND SEDIMENT CHEMISTRY
11 of 16
W06424
3- and 5-m depths and 11 d for the 7-m depth. Theinconsistency in the calculated apparent velocities (Table 2)demonstrates the complexity of subsurface water movementat the site and highlights the difficulty in reconciling thetimescales of Figures 9c and 11. Particularly noteworthy isthe discrepancy in velocities at the 7-m depth; the wetting-front-based velocity is much higher than those based onchloride and nitrate. This discrepancy and the fact that thepeak TDS concentration at the 7-m depth occurred almost ayear before those of nitrate and chloride (Figure 7) castconsiderable doubt on the initial assumption that the threelysimeters were aligned along a single flow path (i.e., thatwater movement was strictly vertical). An alternative hy-pothesis is that the water sampled at early times from the 7-mlysimeter infiltrated at some other part of the reservoir wherechloride concentrations in sediments were low (such as theephemeral channel); that water then became perched abovethe bedrock surface and moved laterally to the 7-m lysimeter.The uncertainty in travel paths limits the options for moredetailed solute transport modeling.
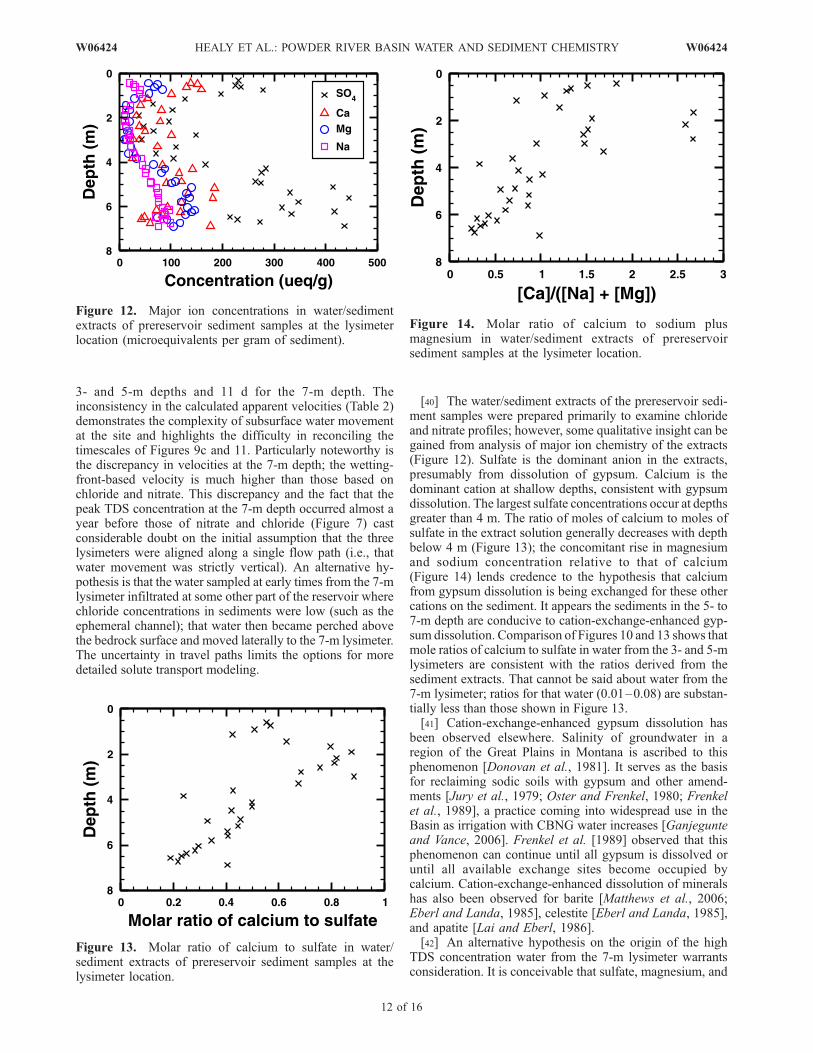
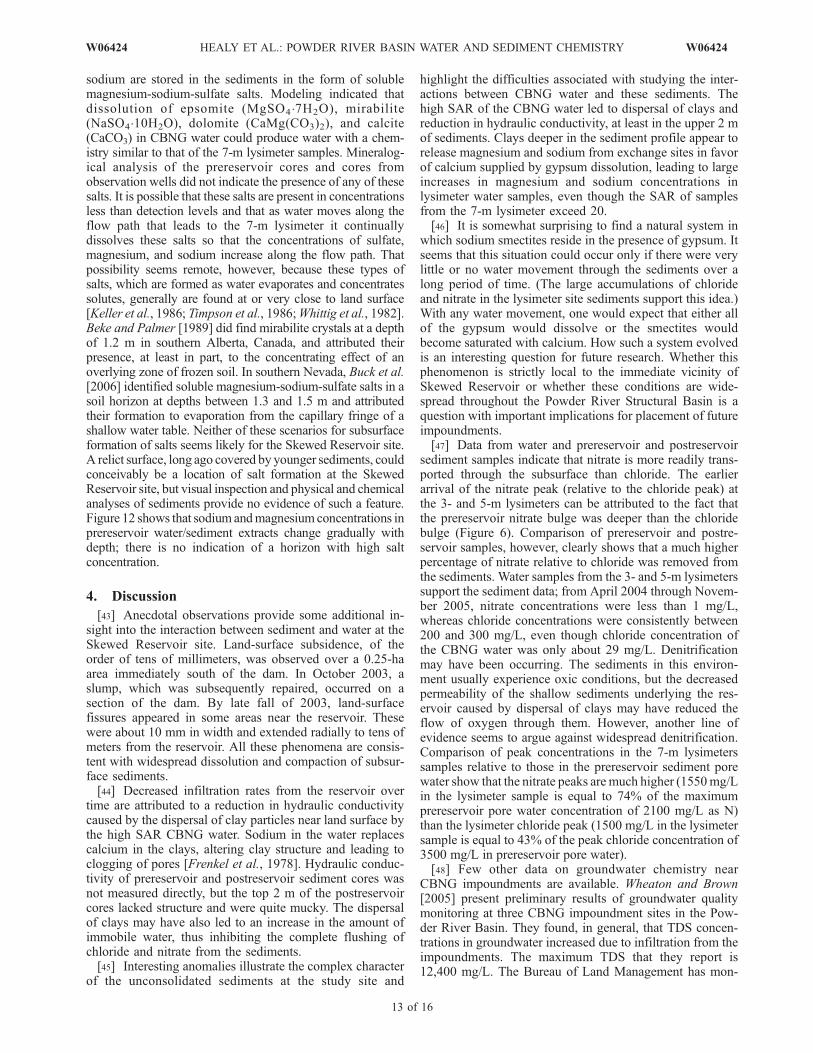
[40] The water/sediment extracts of the prereservoir sedi-ment samples were prepared primarily to examine chlorideand nitrate profiles; however, some qualitative insight can begained from analysis of major ion chemistry of the extracts(Figure 12). Sulfate is the dominant anion in the extracts,presumably from dissolution of gypsum. Calcium is thedominant cation at shallow depths, consistent with gypsumdissolution. The largest sulfate concentrations occur at depthsgreater than 4 m. The ratio of moles of calcium to moles ofsulfate in the extract solution generally decreases with depthbelow 4 m (Figure 13); the concomitant rise in magnesiumand sodium concentration relative to that of calcium(Figure 14) lends credence to the hypothesis that calciumfrom gypsum dissolution is being exchanged for these othercations on the sediment. It appears the sediments in the 5- to7-m depth are conducive to cation-exchange-enhanced gyp-sum dissolution. Comparison of Figures 10 and 13 shows thatmole ratios of calcium to sulfate in water from the 3- and 5-mlysimeters are consistent with the ratios derived from thesediment extracts. That cannot be said about water from the7-m lysimeter; ratios for that water (0.01–0.08) are substan-tially less than those shown in Figure 13.[41] Cation-exchange-enhanced gypsum dissolution has
been observed elsewhere. Salinity of groundwater in aregion of the Great Plains in Montana is ascribed to thisphenomenon [Donovan et al., 1981]. It serves as the basisfor reclaiming sodic soils with gypsum and other amend-ments [Jury et al., 1979; Oster and Frenkel, 1980; Frenkelet al., 1989], a practice coming into widespread use in theBasin as irrigation with CBNG water increases [Ganjegunteand Vance, 2006]. Frenkel et al. [1989] observed that thisphenomenon can continue until all gypsum is dissolved oruntil all available exchange sites become occupied bycalcium. Cation-exchange-enhanced dissolution of mineralshas also been observed for barite [Matthews et al., 2006;Eberl and Landa, 1985], celestite [Eberl and Landa, 1985],and apatite [Lai and Eberl, 1986].[42] An alternative hypothesis on the origin of the high
TDS concentration water from the 7-m lysimeter warrantsconsideration. It is conceivable that sulfate, magnesium, and
Figure 12. Major ion concentrations in water/sedimentextracts of prereservoir sediment samples at the lysimeterlocation (microequivalents per gram of sediment).
Figure 13. Molar ratio of calcium to sulfate in water/sediment extracts of prereservoir sediment samples at thelysimeter location.
Figure 14. Molar ratio of calcium to sodium plusmagnesium in water/sediment extracts of prereservoirsediment samples at the lysimeter location.
12 of 16
W06424 HEALY ET AL.: POWDER RIVER BASIN WATER AND SEDIMENT CHEMISTRY W06424
sodium are stored in the sediments in the form of solublemagnesium-sodium-sulfate salts. Modeling indicated thatdissolution of epsomite (MgSO4�7H2O), mirabilite(NaSO4�10H2O), dolomite (CaMg(CO3)2), and calcite(CaCO3) in CBNG water could produce water with a chem-istry similar to that of the 7-m lysimeter samples. Mineralog-ical analysis of the prereservoir cores and cores fromobservation wells did not indicate the presence of any of thesesalts. It is possible that these salts are present in concentrationsless than detection levels and that as water moves along theflow path that leads to the 7-m lysimeter it continuallydissolves these salts so that the concentrations of sulfate,magnesium, and sodium increase along the flow path. Thatpossibility seems remote, however, because these types ofsalts, which are formed as water evaporates and concentratessolutes, generally are found at or very close to land surface[Keller et al., 1986; Timpson et al., 1986;Whittig et al., 1982].Beke and Palmer [1989] did find mirabilite crystals at a depthof 1.2 m in southern Alberta, Canada, and attributed theirpresence, at least in part, to the concentrating effect of anoverlying zone of frozen soil. In southern Nevada, Buck et al.[2006] identified soluble magnesium-sodium-sulfate salts in asoil horizon at depths between 1.3 and 1.5 m and attributedtheir formation to evaporation from the capillary fringe of ashallow water table. Neither of these scenarios for subsurfaceformation of salts seems likely for the Skewed Reservoir site.A relict surface, long ago covered by younger sediments, couldconceivably be a location of salt formation at the SkewedReservoir site, but visual inspection and physical and chemicalanalyses of sediments provide no evidence of such a feature.Figure 12 shows that sodium andmagnesium concentrations inprereservoir water/sediment extracts change gradually withdepth; there is no indication of a horizon with high saltconcentration.
4. Discussion
[43] Anecdotal observations provide some additional in-sight into the interaction between sediment and water at theSkewed Reservoir site. Land-surface subsidence, of theorder of tens of millimeters, was observed over a 0.25-haarea immediately south of the dam. In October 2003, aslump, which was subsequently repaired, occurred on asection of the dam. By late fall of 2003, land-surfacefissures appeared in some areas near the reservoir. Thesewere about 10 mm in width and extended radially to tens ofmeters from the reservoir. All these phenomena are consis-tent with widespread dissolution and compaction of subsur-face sediments.[44] Decreased infiltration rates from the reservoir over
time are attributed to a reduction in hydraulic conductivitycaused by the dispersal of clay particles near land surface bythe high SAR CBNG water. Sodium in the water replacescalcium in the clays, altering clay structure and leading toclogging of pores [Frenkel et al., 1978]. Hydraulic conduc-tivity of prereservoir and postreservoir sediment cores wasnot measured directly, but the top 2 m of the postreservoircores lacked structure and were quite mucky. The dispersalof clays may have also led to an increase in the amount ofimmobile water, thus inhibiting the complete flushing ofchloride and nitrate from the sediments.[45] Interesting anomalies illustrate the complex character
of the unconsolidated sediments at the study site and
highlight the difficulties associated with studying the inter-actions between CBNG water and these sediments. Thehigh SAR of the CBNG water led to dispersal of clays andreduction in hydraulic conductivity, at least in the upper 2 mof sediments. Clays deeper in the sediment profile appear torelease magnesium and sodium from exchange sites in favorof calcium supplied by gypsum dissolution, leading to largeincreases in magnesium and sodium concentrations inlysimeter water samples, even though the SAR of samplesfrom the 7-m lysimeter exceed 20.[46] It is somewhat surprising to find a natural system in
which sodium smectites reside in the presence of gypsum. Itseems that this situation could occur only if there were verylittle or no water movement through the sediments over along period of time. (The large accumulations of chlorideand nitrate in the lysimeter site sediments support this idea.)With any water movement, one would expect that either allof the gypsum would dissolve or the smectites wouldbecome saturated with calcium. How such a system evolvedis an interesting question for future research. Whether thisphenomenon is strictly local to the immediate vicinity ofSkewed Reservoir or whether these conditions are wide-spread throughout the Powder River Structural Basin is aquestion with important implications for placement of futureimpoundments.[47] Data from water and prereservoir and postreservoir
sediment samples indicate that nitrate is more readily trans-ported through the subsurface than chloride. The earlierarrival of the nitrate peak (relative to the chloride peak) atthe 3- and 5-m lysimeters can be attributed to the fact thatthe prereservoir nitrate bulge was deeper than the chloridebulge (Figure 6). Comparison of prereservoir and postre-servoir samples, however, clearly shows that a much higherpercentage of nitrate relative to chloride was removed fromthe sediments. Water samples from the 3- and 5-m lysimeterssupport the sediment data; from April 2004 through Novem-ber 2005, nitrate concentrations were less than 1 mg/L,whereas chloride concentrations were consistently between200 and 300 mg/L, even though chloride concentration ofthe CBNG water was only about 29 mg/L. Denitrificationmay have been occurring. The sediments in this environ-ment usually experience oxic conditions, but the decreasedpermeability of the shallow sediments underlying the res-ervoir caused by dispersal of clays may have reduced theflow of oxygen through them. However, another line ofevidence seems to argue against widespread denitrification.Comparison of peak concentrations in the 7-m lysimeterssamples relative to those in the prereservoir sediment porewater show that the nitrate peaks are much higher (1550mg/Lin the lysimeter sample is equal to 74% of the maximumprereservoir pore water concentration of 2100 mg/L as N)than the lysimeter chloride peak (1500 mg/L in the lysimetersample is equal to 43% of the peak chloride concentration of3500 mg/L in prereservoir pore water).[48] Few other data on groundwater chemistry near
CBNG impoundments are available. Wheaton and Brown[2005] present preliminary results of groundwater qualitymonitoring at three CBNG impoundment sites in the Pow-der River Basin. They found, in general, that TDS concen-trations in groundwater increased due to infiltration from theimpoundments. The maximum TDS that they report is12,400 mg/L. The Bureau of Land Management has mon-
W06424 HEALY ET AL.: POWDER RIVER BASIN WATER AND SEDIMENT CHEMISTRY
13 of 16
W06424

itoring wells in the vicinity of four impoundments; theirgroundwater chemistry data do not show the high TDS andion concentrations found in the 7-m lysimeter samples atSkewed Reservoir. These results could mean that sedimentscharacteristic of the Skewed Reservoir site are not wide-spread throughout the Basin; they also could mean that thecomplex geology and groundwater flow paths that typifythe Basin require very detailed monitoring well networks toaccurately assess flow and transport patterns.[49] Impoundments built over existing channels should
minimize the flushing of chloride, nitrate, and other con-stituents into groundwater. Most CBNG impoundments inWyoming are classified as ‘‘on-channel’’ by the state.Indeed, Skewed Reservoir was an ‘‘on-channel’’ impound-ment. In the small watersheds of the Basin, stream channelsare quite narrow, typically less than 1 m in width. Becauseof the height of the dam and the surface extent of thereservoir, streams channels may make up only a smallpercentage of the base of reservoirs. Even though the lysim-eters were located near a channel, the sediments therecontained a large store of chloride and nitrate. So if ‘‘on-channel’’ impoundment waters extend beyond establishedchannels, there is potential for flushing salts from sediments.[50] On the basis of sediment samples collected in and
around the Skewed Reservoir site, the bulk of the naturallyoccurring chloride and nitrate resides in the top few metersof sediments. Removal of these sediments from areas to beinundated by an impoundment would remove the source ofcontamination. At one of the study sites reported on byWheaton and Brown [2005], unconsolidated surface sedi-ments were removed during construction. The base of thereservoir was in weathered bedrock. The maximum con-centrations reported in groundwater were 26.7 mg/L chlo-ride and 8.8 mg/L nitrate, values much less than thosemeasured at the Skewed Reservoir site.[51] It is difficult to predict the fate of the solute plume
that formed in the perched saturated zone atop the bedrocksurface beneath the reservoir. Movement of that water is tothe south and west toward the Beaver Creek alluvial aquiferat a distance of about 200 m from the reservoir site.Chloride and nitrate may behave conservatively withingroundwater. Water in the alluvial aquifer will dilute theplume and reduce nitrate and chloride concentrations. Thefate of the high sulfate, magnesium, and sodium concen-trations in the plume is not so clear. The reactions thatproduced the high TDS concentration water at the 7-mdepth occurred in sediments that had historically witnessedvery low rates of water flow. If groundwater moving alongthe top of the bedrock encounters sediments with similarchemical characteristics, continued gypsum dissolution andcation exchange reactions could occur, thus enhancing theTDS concentrations. It also is possible that other, differentreactions would occur to reduce the TDS concentration (e.g.,if clays with calcium-saturated exchange sites are present, theprocess could be reversed with sodium reexchanging forcalcium and subsequently causing gypsum to precipitate).These reactions would not be expected to continue once theperched water flows into the alluvial aquifer.[52] The importance of our results lies largely in how
representative they are for other impoundment sites in thePowder River Basin. We have collected sediment coresfrom several different areas across the Basin and analyzed
them for chloride and nitrate. Preliminary results suggestthat the profiles seen at the Skewed Reservoir site aretypical of other areas. In addition, our data are similar tosediment profile data for arid and semiarid regions pre-sented by Boyce et al. [1976], Walvoord et al. [2003], andMcMahon et al. [2006]. So it is reasonable to expect similarchloride and nitrate profiles at other impoundment sites inthe Basin. As of January 2007, in excess of 4000 permitshad been issued for impoundments in the Basin by the stateof Wyoming. On the basis of findings at Skewed Reservoir,we determined that water infiltrating from 4000 reservoirscould release more than 48 million kg of chloride and52 million kg of nitrate (as N) into groundwater.[53] It is not possible to estimate loads of sulfate, sodium,
and magnesium to groundwater at the Skewed Reservoirsite or to calculate potential loads for the Powder RiverBasin as a whole. In addition to the nonconservative natureof these constituents, quantification of available sourcematerial for these solutes is problematic. For chloride andnitrate, there is a limited, quantifiable source in the sediments.According to our hypothesis, gypsum dissolution is accom-panied by cation exchange at our study site. There is anabundance of gypsum in sediments at the Skewed Reservoirsite and, in general, in sediments across the Basin [Bartos andOgle, 2002]. The limitation on these reactions is the presenceof clays whose exchange sites are dominated by magnesiumand sodium. Efforts to directly measure the abundance ofsuch clays at the Skewed Reservoir site have not been fullysuccessful. Currently (2007), there is no way to determinewhether cation-exchange-enhanced gypsum dissolution isoccurring at other impoundments except by detailed moni-toring of groundwater chemistry. Ongoing research is aimedat developing easily measured indicators that could be used toidentify areas susceptible to these reactions.[54] The fast pace and wide extent of energy development
in the Powder River Basin complicate efforts for controlledstudy of surface and subsurface hydrology. Our investiga-tion was designed to study water movement from SkewedReservoir through the subsurface and associated changes ingroundwater chemistry for 3 years. However, the reservoirwas shut down after only 10 months of operation. Inaddition, the down gradient area between the reservoirand Beaver Creek underwent extensive development overthe course of the study. Several pipelines were installed inthe subsurface to transport gas and water. A center pivotirrigation system was put into operation, and a large watertreatment facility was constructed. All of these featuresaffected the local hydrology. Results reported in this paperare not affected by these features, but it will be difficult inthe future to distinguish impacts on the Beaver Creekalluvial aquifer due to Skewed Reservoir from those asso-ciated with other local development.
5. Summary
[55] CBNG water infiltrating from Skewed Reservoirproduced a groundwater contaminant plume. Total dis-solved solids concentration in CBNG water was about2300 mg/L; concentrations in excess of 100,000 mg/L weremeasured in samples from the 7-m lysimeter. Magnesium,sodium, and sulfate were the dominant ions in the plume.The mechanism for the creation of the high TDS concen-trations at the 7-m depth appears to be a coupling of mineral
14 of 16
W06424 HEALY ET AL.: POWDER RIVER BASIN WATER AND SEDIMENT CHEMISTRY W06424

dissolution and cation exchange, whereby calcium thatbecomes available from the dissolution of gypsum displacessodium and magnesium on clays. This exchange reduces thecalcium concentration in groundwater, allowing additionaldissolution of gypsum.[56] Large amounts of chloride (12,300 kg) and nitrate
(13,500 kg as N) were released into groundwater by waterinfiltrating from the reservoir. Concentrations of nitrate (asN) in groundwater were as high as 1550 mg/L; the maxi-mum chloride concentration was about 2400 mg/L. As ofJanuary 2007, permits for more than 4000 impoundmentsfor CBNG water had been issued for the Wyoming portionof the Powder River Basin. If conditions at Skewed Reser-voir are typical of other impoundment sites, constructionand operation of the impoundments could result in over48 million kg of chloride and 52 million kg of nitrate (as N)being released into shallow groundwater.
[57] Acknowledgments. David Parkhurst, Michelle Walvoord,Edwin P. Weeks, Rasmus Jakobsen, an anonymous reviewer, and twojournal editors provided helpful comments on various drafts of thismanuscript. Dennis Eberl provided generous guidance on the analysis ofclay minerals.
ReferencesAllison, G. B. (1988), A review of some of the physical, chemical, andisotopic techniques available for estimating groundwater recharge, inEstimation of Natural Groundwater Recharge, edited by I. Simmers,pp. 49–72, D. Riedel, Norwell, Mass.
Allison, G. B., and M. W. Hughes (1978), The use of environmental chlor-ide and tritium to estimate total recharge to an unconfined aquifer, Aust.J. Soil Res., 16, 181–195, doi:10.1071/SR9780181.
Allison, G. B., W. J. Stone, and M. W. Hughes (1985), Recharge in karstand dune elements of a semi-arid landscape as indicated by natural iso-topes and chloride, J. Hydrol., 76, 1 – 25, doi:10.1016/0022-1694(85)90088-5.
Allison, G. B., G. W. Gee, and S. W. Tyler (1994), Vadose-zone techniquesfor estimating groundwater recharge in arid and semiarid regions, SoilSci. Soc. Am. J., 1, 6–14.
Bartos, T. T., and K. M. Ogle (2002), Water quality and environmentalisotopic analyses of ground-water samples collected from the Wasatchand Fort Union Formations in areas of coalbed methane development:Implications to recharge and ground-water flow, eastern Powder RiverBasin, Wyoming, U.S. Geol. Surv. Water Resour. Invest. Rep., 02-4045,88 pp.
Beke, G. J., and C. J. Palmer (1989), Subsurface occurrence of mirabilite ina Mollisol of southern Alberta, Canada: A case study, Soil Sci. Soc. Am.J., 52, 1611–1614.
Boyce, J. S., J. Muir, A. P. Edwards, E. C. Seim, and R. A. Olson (1976),Geologic nitrogen in Pleistocene loess of Nebraska, J. Environ. Qual., 5,93–96.
Briggs, P. H. (2003), The determination of twenty-seven elements in aqu-eous samples by inductively coupled plasma-atomic emission spectro-metry, in Analytical Methods for Chemical Analysis of Geologic andOther Materials, edited by J. E. Taggart Jr., U.S. Geol. Surv. Open FileRep., 02-223, 13 pp.
Buck, B. J., K. Wolff, D. J. Merkler, and N. J. McMillan (2006), Saltmineralogy of Las Vegas Wash, Nevada: Morphology and subsurfaceevaporation, Soil Sci. Soc. Am. J., 70, 1639 – 1651, doi:10.2136/sssaj2005.0276.
Cook, P. G., W. M. Edmunds, and C. B. Gaye (1992), Estimating paleo-recharge and paleoclimate from unsaturated zone profiles, Water Resour.Res., 28, 2721–2731, doi:10.1029/92WR01298.
Dane, J. H., and G. C. Topp (Eds.) (2002), Methods of Soil Analysis, Part 4,Physical Methods, 1692 pp., Soil Sci. Soc. of Am., Madison, Wisc.
De Bruin, R. H., R. M. Lyman, R. W. Jones, and L. W. Cook (2000),Coalbed methane in Wyoming, Pam. 7, Wyo. State Geol. Surv., Laramie.
Dionex Corporation (2001), Determination of inorganic anions in waste-water by ion chromatography, Appl. Not. 135, 11 pp., Sunnyvale, Calif.(Available at http://www1.dionex.com/en-us/webdocs/4085_AN135_V13.pdf)
Donovan, J. J., J. L. Sonderegger, and M. R. Miller (1981), Investigationsof soluble salt loads controlling mineralogy, and factors affecting therates and amounts of leached salts, Open File Rep., 89, 72 pp., Mont.Bur. of Mines and Geol., Butte.
Eberl, D. D. (2003), User’s guide to RockJock: A program for determiningquantitative mineralogy from powder X-ray diffraction data, U.S. Geol.Surv. Open File Rep., 03-78, 47 pp.
Eberl, D. D., and E. R. Landa (1985), Dissolution of alkaline earth sulfatesin the presence of montmorillonite, Water Air Soil Pollut., 25, 207–214,doi:10.1007/BF00568389.
Faulkner, H., B. R. Wilson, K. Solman, and R. Alexander (2001), Compar-ison of three cation extraction methods and their use in determination ofsodium adsorption ratios of some sodic soils, Commun. Soil Sci. PlantAnal., 32, 1765–1777, doi:10.1081/CSS-120000248.
Frenkel, H., J. O. Goertzen, and J. D. Rhoades (1978), Effects of clay typeand content, exchangeable sodium percentage, and electrolyte concentra-tion on clay dispersion and soil hydraulic conductivity, Soil Sci. Soc. Am.J., 42, 32–39.
Frenkel, H., Z. Gerstl, and N. Alperovitch (1989), Exchange-induced dis-solution of gypsum and the reclamation of sodic soils, J. Soil Sci., 40,599–611, doi:10.1111/j.1365-2389.1989.tb01301.x.
Ganjegunte, G. K., and G. F. Vance (2006), Deviations from the empiricalsodium adsorption ratio (SAR) and exchangeable sodium percentage(ESP) relationship, Soil Sci., 171, 364–373.
Glass, G. B. (1997), Coal geology in Wyoming (reprinted from the 1997Keystone Coal Industry Manual), Reprint 63, 21 pp., Wyo. State Geol.Surv., Laramie.
Hartsough, P. C., S. W. Tyler, J. Sterling, and M. A. Walvoord (2001), A14.6-kyr record of nitrogen flux from desert soil profiles as inferred fromvadose zone pore waters, Geophys. Res. Lett., 28(15), 2955–2958,doi:10.1029/2000GL011823.
Heilweil, V. M., and D. K. Solomon (2004), Millimeter- to kilometer-scalevariations in vadose zone bedrock solutes: Implications for estimatingrecharge in arid settings, in Groundwater Recharge in a Desert Environ-ment: The Southwestern United States, Water Sci. Appl. Ser., vol. 9,edited by J. F. Hogan et al., pp. 49–67, AGU, Washington, D. C.
Heilweil, V. M., D. D. Susong, P. M. Gardner, and D. E. Watt (2005), Pre-and post-reservoir ground-water conditions and assessment of artificialrecharge at Sand Hollow, Washington County, Utah (1995–2005), U.S.Geol. Surv. Sci. Invest. Rep., 2005-5185, 74 pp.
Heilweil, V. M., D. K. Solomon, and P. M. Gardner (2006), Boreholeenvironmental tracers for evaluating net infiltration and recharge throughdesert bedrock, Vadose Zone J., 5, 98–120, doi:10.2136/vzj2005.0002.
Helmke, P. A., and K. L. Sparks (1996), Lithium, sodium, potassium,rubidium, and cesium, in Methods of Soil Analysis, Part 3, ChemicalMethods, edited by D. L. Sparks et al., pp. 551–574, Soil Sci. Soc. ofAm., Madison, Wisc.
Hem, J. D. (1992), Study and interpretation of the chemical characteristicsof natural water, U.S. Geol. Surv. Water Supply Pap., 2254, 263 pp.
Holloway, J. M., R. A. Dahlgren, B. Hansen, and W. H. Casey (1998),Contribution of bedrock nitrogen to high nitrate concentrations in streamwater, Nature, 395, 785–788, doi:10.1038/27410.
Jury, W. A., W. M. Jarrell, and D. Devitt (1979), Reclamation of saline-sodic soils by leaching, Soil Sci. Soc. Am. J., 43, 1100–1106.
Keller, L. P., G. J. McCarthy, and J. L. Richardson (1986), Mineralogy andstability of soil evaporites in North Dakota, Soil Sci. Soc. Am. J., 50,1069–1071.
Lai, T.-M., and D. D. Eberl (1986), Controlled and renewable releaseof phosphorous in soils from mixtures of phosphate rock and NH4-exchanged clinoptilolite, Zeolites, 6, 129–132, doi:10.1016/S0144-2449(86)80010-0.
Lamothe, P. J., A. L. Meier, and S. A. Wilson (2002), The determination offorty-four elements in aqueous samples by inductively coupled plasma-mass spectrometry, in Analytical Methods for Chemical Analysis of Geo-logic and Other Materials, edited by J. E. Taggart, chap. H, U.S. Geol.Surv. Open File Rep., 02-223, 11 pp.
Lowry, M. E., et al. (1986), Hydrology of Area 50, Northern Great Plainsand Rocky Mountain coal provinces, U.S. Geol. Surv. Open File Rep.,83-545, 137 pp.
Martner, B. E. (1986), Wyoming Climate Atlas, 432 pp., Univ. of Nebr.Press, Lincoln.
Materials Data, Inc. (2005), Jade 7: XRD Pattern Processing, Identifica-tion, and Quantification, Livermore, Calif.
Matthews, J. C., S. Li, C. T. Swann, and R. L. Ericksen (2006), Incubationwith moist topsoils enhances solubilization of radium and other compo-nents from oil-field scale and sludge: Environmental concerns from Mis-sissippi, Environ. Geosci., 13, 43–53, doi:10.1306/eg.11160404037.
W06424 HEALY ET AL.: POWDER RIVER BASIN WATER AND SEDIMENT CHEMISTRY
15 of 16
W06424

McMahon, P. B., K. F. Dennehy, R. L. Michel, M. A. Sophocleous, K. M.Ellett, and D. B. Hurlbut (2003), Water movement through thick unsa-turated zones overlying the central High Plains Aquifer, southwesternKansas, 2000–2001, U.S. Geol. Surv. Water Resour. Invest. Rep., 03-4171, 32 pp.
McMahon, P. G., K. F. Dennehy, B. W. Bruce, J. K. Bohlke, R. L. Michel,J. J. Gurdak, and D. B. Hurlbut (2006), Storage and transit time ofchemicals in thick unsaturated zones under rangeland and irrigated crop-land, High Plains, United States, Water Resour. Res., 42, W03413,doi:10.1029/2005WR004417.
Miller, M. R., P. L. Brown, J. J. Donovan, R. N. Bergantino, J. L.Sonderegger, and F. A. Schmidt (1980), Saline-seep development andcontrol in the North American Great Plains: Hydrogeological aspects,in Land and Stream Salinity Workshop, Perth, Australia, Nov. 1980,Open File Rep., 58, Mont. Bur. of Mines and Geol., Butte.
Moore, D. M., and R. C. Reynolds Jr. (1997), X-Ray Diffraction and theIdentification and Analysis of Clay Minerals, 378 pp., Oxford Univ.Press, Oxford, U.K.
Oster, J. D., and H. Frenkel (1980), The chemistry of the reclamation ofsodic soils with gypsum and lime, Soil Sci. Soc. Am. J., 44, 41–45.
Parkhurst, D. L., and C. A. J. Appelo (1999), User’s guide to PHREEQC(Version 2)—A computer program for speciation, batch-reaction, one-dimensional transport, and inverse geochemical calculations, U.S. Geol.Surv. Water Resour. Invest. Rep., 99-4259, 310 pp.
Phillips, F. M. (1994), Environmental tracers for water movement in desertsoils of the American Southwest, Soil Sci. Soc. Am. J., 58, 15–24.
Prudic, D. E. (1994), Estimates of percolation rates and ages of water inunsaturated sediments at two Mojave desert sites, U.S. Geol. Surv. WaterResour. Invest. Rep., 94-4160, 19 pp.
Rice, C. A., T. T. Bartos, and M. S. Ellis (2002), Chemical and isotopiccomposition of water in the Fort Union and Wasatch Formations of thePowder River Basin, Wyoming and Montana: Implications for coalbedmethane development, in Coalbed Methane of North America, II, editedby S. D. Schwochow and V. F. Nuccio, pp. 53–70, Rocky Mt. Assoc. ofGeol., Denver, Colo.
Salama, R. B., P. Farrington, G. A. Bartle, and G. D. Watson (1993), Thechemical evolution of groundwater in a first order catchment and theprocess of salt accumulation in the soil profile, J. Hydrol., 143, 233–258, doi:10.1016/0022-1694(93)90194-E.
Soil Survey Laboratory (1995), Soil Survey Laboratory Information Man-ual, Soil Surv. Lab. Invest. Rep., 45, Version 1.0, 316 pp., Natural Resour.Cons. Serv., U.S. Dep. of Agric., Washington, D. C.
Stonestrom, D. A., D. E. Prudic, R. J. Laczniak, and K. C. Akstin (2004),Tectonic, climatic, and land-use controls on groundwater recharge in anarid alluvial basin: Amargosa Desert U.S.A., in Groundwater Rechargein a Desert Environment: The Southwestern United States, Water Sci.Appl. Ser., vol. 9, edited by J. F. Hogan et al., pp. 29–48, AGU,Washington, D. C.
Sumner, M. E., and W. P. Miller (1996), Cation exchange capacity andexchange coefficients, in Methods of Soil Analysis, Part 3, ChemicalMethods, edited by D. L. Sparks, pp. 1201–1229, Soil Sci. Soc. ofAm., Madison, Wisc.
Timpson, M. E., J. L. Richardson, L. P. Keller, and G. J. McCarthy (1986),Evaporite mineralogy associated with saline seeps in southwestern NorthDakota, Soil Sci. Soc. Am. J., 50, 490–493.
U.S. Bureau of Land Management (2003a), Final environmental impactstatement and proposed plan amendment for the Powder River BasinOil and Gas Project, Rep. WY-070-02-065, Buffalo, Wyo.
U.S. Bureau of Land Management (2003b), Record of decision and re-source management plan amendments for the Powder River Basin Oiland Gas Project, Rep. WY-070-02-065, Buffalo, Wyo.
Walvoord, M. A., F. M. Phillips, D. A. Stonestrom, R. D. Evans, P. C.Hartsough, B. D. Newman, and R. G. Striegl (2003), A reservoir ofnitrate beneath desert soils, Science, 302, 1021–1024, doi:10.1126/science.1086435.
Western Regional Climate Center (2001), Digital data, Reno, Nev. (Avail-able at http://www.wrcc.dri.edu)
Wheaton, J., and T. H. Brown (2005), Predicting changes in groundwaterquality associated with coalbed natural gas infiltration ponds, in WesternResources Project Final Report: Produced Groundwater Associated WithCoalbed Natural Gas Production in the Powder River Basin, edited byM. D. Zoback, Invest. Rep. 55, pp. 45–70, Wyo. State Geol. Surv.,Laramie.
Whittig, L. D., A. E. Devo, and K. K. Tanji (1982), Evaporite mineralspecies in Mancos Shale and salt efflorescence, Upper Colorado RiverBasin, Soil Sci. Soc. Am. J., 46, 645–651.
����������������������������T. T. Bartos, U.S. Geological Survey, 2617 East Lincolnway, Cheyenne,
WY 82001, USA.
R. W. Healy and C. A. Rice, U.S. Geological Survey, P.O. Box 25046,Mail Stop 413, Denver Federal Center, Lakewood, CO 80225, USA.([email protected])
M. P. McKinley, U.S. Bureau of Land Management, 1425 Fort Street,Buffalo, WY 82834, USA.
16 of 16
W06424 HEALY ET AL.: POWDER RIVER BASIN WATER AND SEDIMENT CHEMISTRY W06424