Infiltration Characteristics of Tropical Soil Based on Water Retention Data
13
215 原著論文 原著論文 水文・水資源学会誌 第21巻 第3号(2008) Infiltration Characteristics of Tropical Soil Based on Water Retention Data Ⅰ.INTRODUCTION Infiltration is the physical process of water entering the soil from its surface. The amount of water that infiltrates into the soil and its variation with time depend upon slope, soil structure, surface roughness, soil texture, surface cover, hydraulic conductivity and surface water content (Leonard and Andrieux, 1998). It plays important role for agricultural planning, environmental research and policy analysis such as development of plant irrigation, fertilizer and soil nutrition movement, surface and subsurface water pollution, and groundwater recharge (Netto et al ., 1999; Dingman, 2002). In the tropical region such as Indonesia, soils often receive high precipitation and subject to Muhamad ASKARI 1) Tadashi TANAKA 2) Budi Indra SETIAWAN 3) Satyanto Krido SAPTOMO 3) 1) Ph.D. student of Graduate School of Life and Environmental Sciences, University of Tsukuba (Ibaraki 305-8572, Japan) 2) Graduate School of Life and Environmental Sciences, University of Tsukuba (Ibaraki 305-8572, Japan) 3) Department of Agricultural Engineering, Bogor Agricultural University, Kampus IPB Darmaga (Bogor 16680, Indonesia) 水 文 ・ 水 資 源 学 会 誌 J. Japan Soc. Hydrol. and Water Resour. Vol. 21, No.3, May 2008 pp. 215 - 227 Water retention and hydraulic properties of undisturbed tropical soils collected from many regions of Indonesia were analyzed to estimate infiltration characteristics of the soils. Soil texture was classified based on International Society of Soil Science (ISSS) classification. The van-Genuchten model was used to estimate the relationship between water content and matrix potential at pF=1, pF=2, pF=2.54, pF=4.2. The 165 soil water retention data were used to optimize parameters of the model and to find the air entry value. Green-Ampt and Philip's infiltration models were applied to characterize soil infiltrability of each textural type. The Nash and Sutcliffe's efficiency was used to evaluate numerical simulation of cumulative infiltration of Green-Ampt's infiltration model compared to the results of laboratory experiments. The 165 soil samples were classified and were optimized into 10 ISSS textural types: heavy clay, sandy clay, sandy clay loam, sandy loam, sand, light clay, clay loam, loam, silty clay, and silty clay loam. The results of performance evaluation of Green-Ampt's infiltration model showed that Green-Ampt's infiltration model can describe infiltration characteristics by using soil water retention and hydraulic properties data. The tropical soils based on soil texture exhibit contrasting infiltration characteristics as indicated by infiltration rate, length of wetting front and sorptivity. The characteristics of soil infiltrability are mainly influenced by hydraulic conductivity, initial water content, and matrix potential at the wetting front. Key words: soil water retention, tropical soil, ISSS texture classification, Green-Ampt, wetting front, sorptivity
-
Upload
independent -
Category
Documents
-
view
0 -
download
0
Transcript of Infiltration Characteristics of Tropical Soil Based on Water Retention Data
215原著論文
原著論文
水文・水資源学会誌第21巻第3号(2008)
Infiltration Characteristics of Tropical Soil Based on Water Retention Data
Ⅰ.INTRODUCTION
Infiltration is the physical process of water
entering the soil from its surface. The amount of
water that infiltrates into the soil and its variation
with time depend upon slope, soil structure,
surface roughness, soil texture, surface cover,
hydraulic conductivity and surface water content(Leonard and Andrieux, 1998). It plays important
role for agricultural planning, environmental
research and policy analysis such as development
of plant irrigation, fertilizer and soil nutrition
movement, surface and subsurface water pollution,
and groundwater recharge (Netto et al., 1999;
Dingman, 2002).
In the tropical region such as Indonesia, soils
often receive high precipitation and subject to
Muhamad ASKARI 1) Tadashi TANAKA 2)
Budi Indra SETIAWAN 3) Satyanto Krido SAPTOMO3)
1)Ph.D. student of Graduate School of Life and Environmental Sciences, University of Tsukuba(Ibaraki 305-8572, Japan)
2)Graduate School of Life and Environmental Sciences, University of Tsukuba(Ibaraki 305-8572, Japan)
3)Department of Agricultural Engineering, Bogor Agricultural University,
Kampus IPB Darmaga(Bogor 16680, Indonesia)
水 文 ・ 水 資 源 学 会 誌J. Japan Soc. Hydrol. and Water Resour.Vol. 21, No.3, May 2008 pp. 215 - 227
Water retention and hydraulic properties of undisturbed tropical soils collected from many regions of
Indonesia were analyzed to estimate infiltration characteristics of the soils. Soil texture was classified based on
International Society of Soil Science (ISSS) classification. The van-Genuchten model was used to estimate the
relationship between water content and matrix potential at pF=1, pF=2, pF=2.54, pF=4.2. The 165 soil water
retention data were used to optimize parameters of the model and to find the air entry value. Green-Ampt and Philip's
infiltration models were applied to characterize soil infiltrability of each textural type. The Nash and Sutcliffe's
efficiency was used to evaluate numerical simulation of cumulative infiltration of Green-Ampt's infiltration model
compared to the results of laboratory experiments. The 165 soil samples were classified and were optimized into 10 ISSS
textural types: heavy clay, sandy clay, sandy clay loam, sandy loam, sand, light clay, clay loam, loam, silty clay, and silty
clay loam. The results of performance evaluation of Green-Ampt's infiltration model showed that Green-Ampt's
infiltration model can describe infiltration characteristics by using soil water retention and hydraulic properties
data. The tropical soils based on soil texture exhibit contrasting infiltration characteristics as indicated by
infiltration rate, length of wetting front and sorptivity. The characteristics of soil infiltrability are mainly influenced by
hydraulic conductivity, initial water content, and matrix potential at the wetting front.
Key words: soil water retention, tropical soil, ISSS texture classification, Green-Ampt, wetting front, sorptivity
216 原著論文
loose their top soils due to run-off and soil erosion
especially when their surfaces openly exposed to
the atmosphere. In this situation, soil infiltrability
reduces with times because of the crust formation,
or the exposure of subsoil whose relatively dense
on the soil surface after its top soil is being
removed by soil erosion process. Soil infiltrability
which is variant of soil textures also changes with
their bulk density and initial water content. These
conditions become big constraints to measure
infiltrability of soils in the fields. Therefore,
numerical simulation models of soil infiltrability
will be very important in understanding this
process.
Many water flow problems near the soil surface
can only be solved numerically due to soil
heterogeneity, non-linearity of soil physical
properties, non-uniform root water uptake and
rapid changing boundary conditions. Water flow in
the vadose zone in term of infiltration process is
predominantly vertical, and commonly can be
simulated as one-dimensional flow in many
applications (Romano et al., 1998). By running the
one-dimensional model at various locations,
horizontal variability of meteorological conditions,
crop characteristics, soil properties and drainage
conditions is accommodated and regional water
can be determined (Bresler and Dagan, 1983;
Hopmans and Stricker, 1989).
Soil water retention and hydraulic data which
are collected at a great number of soil physical
laboratories (Rawls and Pachepsky, 2002; Hodnett
and Tomasella, 2002) enhance the applicability of
the some equations related to infiltrability of the
soil such as Richards-Darcy's, Philip's and Green-
Ampt's infiltration model (Wang et al., 1997;
Romano et al., 1998; van Dam and Feddes, 2000;
Braud et al., 2005; Regalado et al., 2005; Kozak
and Ahuja, 2005). Most of studies concerning the
application of soil water retention and hydraulic
properties on simulation of the soil infiltrability
have been widely conducted at subtropical region.
On the contrary, the characteristics of soil
infiltrability at tropical region using those data
have not been extensively studied. In Indonesia,
the application of soil water retention and
hydraulic data on the estimation of soil
infiltrability has been recently conducted on sand
and silty clay textures (Saleh, 2000) and sandy
clay texture (Hermantoro, 2003) using Richards-
Darcy's infiltration model.
The objective of present study, therefore, was to
optimize soil hydraulic function using van
Genuchten's equation and to estimate the
infiltration characteristics of various tropical soil
textures using the optimized soil hydraulic
function data.
Ⅱ.INFILTRATION MODEL
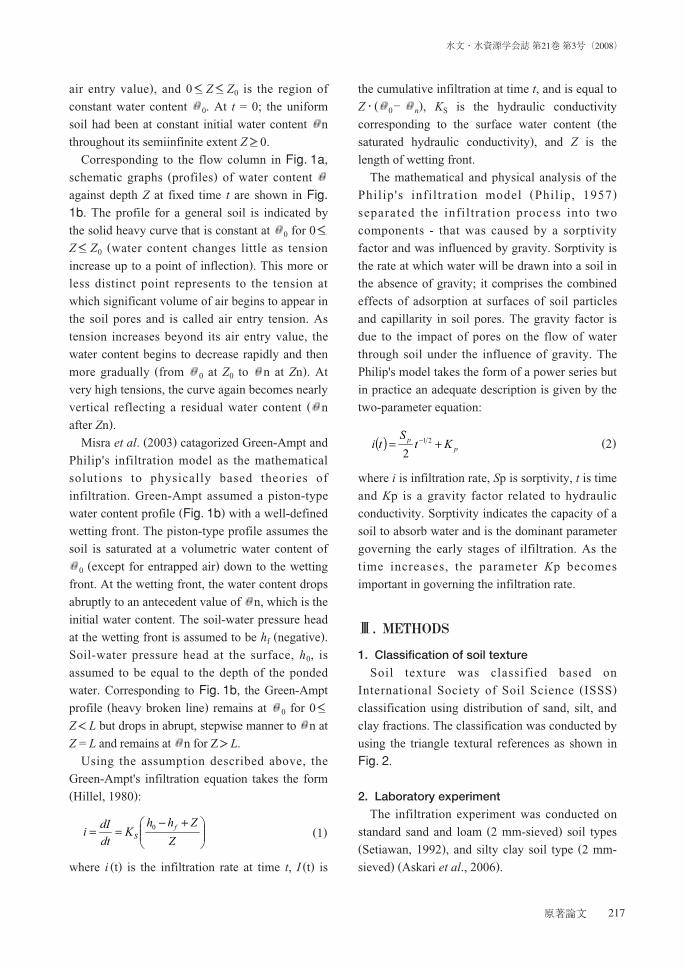
The one-dimensional, downward-infiltration
flow system is depicted schematically in Fig. 1a.At fixed time t 0 after the instantaneous ponding
of water depth hc at t = 0 on the top surface of the
soil (Z = 0), position coordinate Z being taken as
positive downward. Volumetric water content =(Z, t) for independent Z and t in general, Z0 is
the depth above which = 0 at time t (for zero
J. Japan Soc. Hydrol. and Water Resour.Vol. 21, No.3, 2008
Fig. 1 (a) Schematic diagram of the ponded-water, onedimensional downward water-infiltration flow problem;and (b) two exemplary graphs of water-content profilescorresponding to the uniform soil column in (a)(Swartzendruber, 2000).
217原著論文
air entry value), and 0 Z Z0 is the region of
constant water content 0. At t = 0; the uniform
soil had been at constant initial water content n
throughout its semiinfinite extent Z 0.
Corresponding to the flow column in Fig. 1a,
schematic graphs (profiles) of water content
against depth Z at fixed time t are shown in Fig.1b. The profile for a general soil is indicated by
the solid heavy curve that is constant at 0 for 0
Z Z0 (water content changes little as tension
increase up to a point of inflection). This more or
less distinct point represents to the tension at
which significant volume of air begins to appear in
the soil pores and is called air entry tension. As
tension increases beyond its air entry value, the
water content begins to decrease rapidly and then
more gradually (from 0 at Z0 to n at Zn). At
very high tensions, the curve again becomes nearly
vertical reflecting a residual water content ( n
after Zn).
Misra et al. (2003) catagorized Green-Ampt and
Philip's infiltration model as the mathematical
solutions to physically based theories of
infiltration. Green-Ampt assumed a piston-type
water content profile (Fig. 1b) with a well-defined
wetting front. The piston-type profile assumes the
soil is saturated at a volumetric water content of
0 (except for entrapped air) down to the wetting
front. At the wetting front, the water content drops
abruptly to an antecedent value of n, which is the
initial water content. The soil-water pressure head
at the wetting front is assumed to be hf (negative).
Soil-water pressure head at the surface, h0, is
assumed to be equal to the depth of the ponded
water. Corresponding to Fig. 1b, the Green-Ampt
profile (heavy broken line) remains at 0 for 0
Z L but drops in abrupt, stepwise manner to n at
Z = L and remains at n for Z L.
Using the assumption described above, the
Green-Ampt's infiltration equation takes the form(Hillel, 1980):
(1)
where i (t) is the infiltration rate at time t, I (t) is
the cumulative infiltration at time t, and is equal to
Z・( 0- n), KS is the hydraulic conductivity
corresponding to the surface water content (the
saturated hydraulic conductivity), and Z is the
length of wetting front.
The mathematical and physical analysis of the
Philip's infiltration model (Philip, 1957)
separated the infiltration process into two
components - that was caused by a sorptivity
factor and was influenced by gravity. Sorptivity is
the rate at which water will be drawn into a soil in
the absence of gravity; it comprises the combined
effects of adsorption at surfaces of soil particles
and capillarity in soil pores. The gravity factor is
due to the impact of pores on the flow of water
through soil under the influence of gravity. The
Philip's model takes the form of a power series but
in practice an adequate description is given by the
two-parameter equation:
(2)
where i is infiltration rate, Sp is sorptivity, t is time
and Kp is a gravity factor related to hydraulic
conductivity. Sorptivity indicates the capacity of a
soil to absorb water and is the dominant parameter
governing the early stages of ilfiltration. As the
time increases, the parameter Kp becomes
important in governing the infiltration rate.
Ⅲ.METHODS
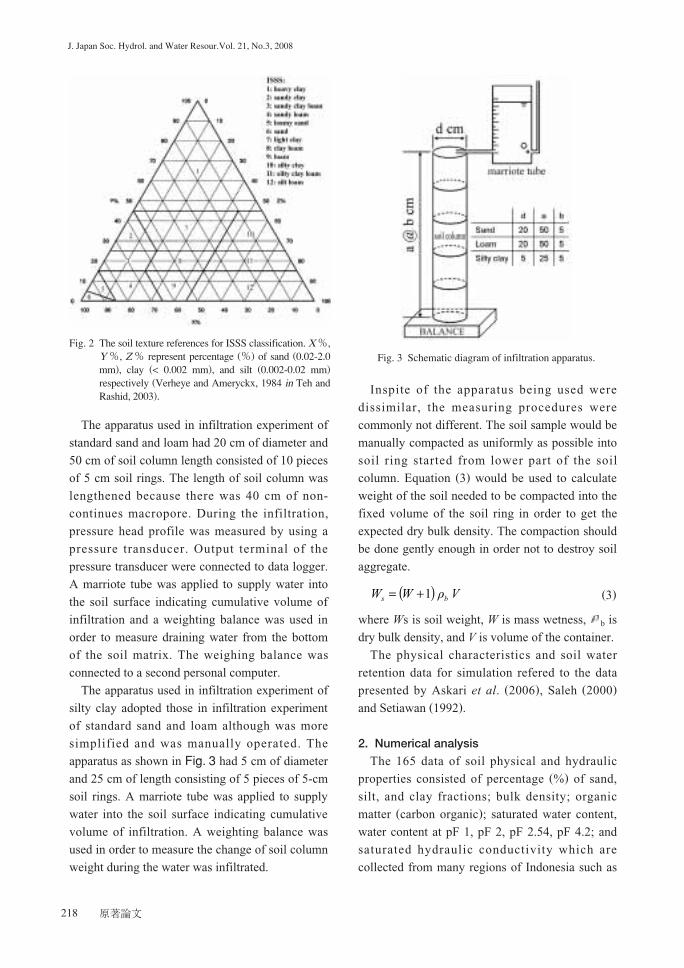
1. Classification of soil texture
Soil texture was classified based on
International Society of Soil Science (ISSS)
classification using distribution of sand, silt, and
clay fractions. The classification was conducted by
using the triangle textural references as shown in
Fig. 2.
2. Laboratory experiment
The infiltration experiment was conducted on
standard sand and loam (2 mm-sieved) soil types(Setiawan, 1992), and silty clay soil type (2 mm-
sieved) (Askari et al., 2006).
( )p
p
Kt
S
ti += − 21
2
+−==
Z
Zhh
K
dt
dI
i
f
S
0
水文・水資源学会誌第21巻第3号(2008)
218 原著論文
The apparatus used in infiltration experiment of
standard sand and loam had 20 cm of diameter and
50 cm of soil column length consisted of 10 pieces
of 5 cm soil rings. The length of soil column was
lengthened because there was 40 cm of non-
continues macropore. During the infiltration,
pressure head profile was measured by using a
pressure transducer. Output terminal of the
pressure transducer were connected to data logger.
A marriote tube was applied to supply water into
the soil surface indicating cumulative volume of
infiltration and a weighting balance was used in
order to measure draining water from the bottom
of the soil matrix. The weighing balance was
connected to a second personal computer.
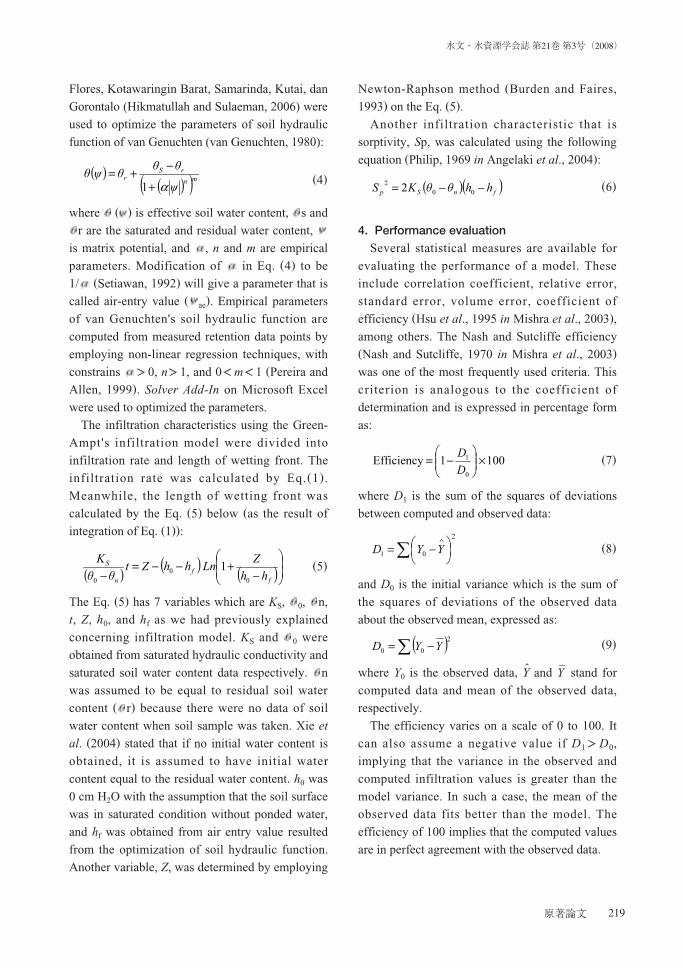
The apparatus used in infiltration experiment of
silty clay adopted those in infiltration experiment
of standard sand and loam although was more
simplified and was manually operated. The
apparatus as shown in Fig. 3 had 5 cm of diameter
and 25 cm of length consisting of 5 pieces of 5-cm
soil rings. A marriote tube was applied to supply
water into the soil surface indicating cumulative
volume of infiltration. A weighting balance was
used in order to measure the change of soil column
weight during the water was infiltrated.
Inspite of the apparatus being used were
dissimilar, the measuring procedures were
commonly not different. The soil sample would be
manually compacted as uniformly as possible into
soil ring started from lower part of the soil
column. Equation (3) would be used to calculate
weight of the soil needed to be compacted into the
fixed volume of the soil ring in order to get the
expected dry bulk density. The compaction should
be done gently enough in order not to destroy soil
aggregate.
(3)
where Ws is soil weight, W is mass wetness, b is
dry bulk density, and V is volume of the container.
The physical characteristics and soil water
retention data for simulation refered to the data
presented by Askari et al. (2006), Saleh (2000)
and Setiawan (1992).
2. Numerical analysis
The 165 data of soil physical and hydraulic
properties consisted of percentage (%) of sand,
silt, and clay fractions; bulk density; organic
matter (carbon organic); saturated water content,
water content at pF 1, pF 2, pF 2.54, pF 4.2; and
saturated hydraulic conductivity which are
collected from many regions of Indonesia such as
( ) VρWWbs
1+=
J. Japan Soc. Hydrol. and Water Resour.Vol. 21, No.3, 2008
Fig. 2 The soil texture references for ISSS classification. X%,Y%, Z% represent percentage (%) of sand (0.02-2.0mm), clay (< 0.002 mm), and silt (0.002-0.02 mm)respectively (Verheye and Ameryckx, 1984 in Teh andRashid, 2003).
Fig. 3 Schematic diagram of infiltration apparatus.
219原著論文
Flores, Kotawaringin Barat, Samarinda, Kutai, dan
Gorontalo (Hikmatullah and Sulaeman, 2006) were
used to optimize the parameters of soil hydraulic
function of van Genuchten (van Genuchten, 1980):
(4)
where ( ) is effective soil water content, s and
r are the saturated and residual water content,
is matrix potential, and , n and m are empirical
parameters. Modification of in Eq. (4) to be
1/ (Setiawan, 1992) will give a parameter that is
called air-entry value ( ae). Empirical parameters
of van Genuchten's soil hydraulic function are
computed from measured retention data points by
employing non-linear regression techniques, with
constrains 0, n 1, and 0 m 1 (Pereira and
Allen, 1999). Solver Add-In on Microsoft Excel
were used to optimized the parameters.
The infiltration characteristics using the Green-
Ampt's infiltration model were divided into
infiltration rate and length of wetting front. The
infiltration rate was calculated by Eq.(1).
Meanwhile, the length of wetting front was
calculated by the Eq. (5) below (as the result of
integration of Eq. (1)):
(5)
The Eq. (5) has 7 variables which are KS, 0, n,
t, Z, h0, and hf as we had previously explained
concerning infiltration model. KS and 0 were
obtained from saturated hydraulic conductivity and
saturated soil water content data respectively. n
was assumed to be equal to residual soil water
content ( r) because there were no data of soil
water content when soil sample was taken. Xie et
al. (2004) stated that if no initial water content is
obtained, it is assumed to have initial water
content equal to the residual water content. h0 was
0 cm H2O with the assumption that the soil surface
was in saturated condition without ponded water,
and hf was obtained from air entry value resulted
from the optimization of soil hydraulic function.
Another variable, Z, was determined by employing
Newton-Raphson method (Burden and Faires,
1993) on the Eq. (5).
Another infiltration characteristic that is
sorptivity, Sp, was calculated using the following
equation (Philip, 1969 in Angelaki et al., 2004):
(6)
4. Performance evaluation
Several statistical measures are available for
evaluating the performance of a model. These
include correlation coefficient, relative error,
standard error, volume error, coefficient of
efficiency (Hsu et al., 1995 in Mishra et al., 2003),
among others. The Nash and Sutcliffe efficiency(Nash and Sutcliffe, 1970 in Mishra et al., 2003)
was one of the most frequently used criteria. This
criterion is analogous to the coefficient of
determination and is expressed in percentage form
as:
(7)
where D1 is the sum of the squares of deviations
between computed and observed data:
(8)
and D0 is the initial variance which is the sum of
the squares of deviations of the observed data
about the observed mean, expressed as:
(9)
where Y0 is the observed data, Y and Y- stand for
computed data and mean of the observed data,
respectively.
The efficiency varies on a scale of 0 to 100. It
can also assume a negative value if D1 D0,
implying that the variance in the observed and
computed infiltration values is greater than the
model variance. In such a case, the mean of the
observed data fits better than the model. The
efficiency of 100 implies that the computed values
are in perfect agreement with the observed data.
( )200 ∑ −= YYD
2
01 ∑
−=∧YYD
1001Efficiency
0
1 ×
−=D
D
( )( )fnSp
hhθθKS −−=00
2
2
( ) ( ) ( )
−+−−=
−f
f
n
S
hh
Z
LnhhZt
θθ
K
0
0
0
1
( )( )( )mn
rS
r
ψ
θθ
θψθ
α+
−+=1
水文・水資源学会誌第21巻第3号(2008)
220 原著論文
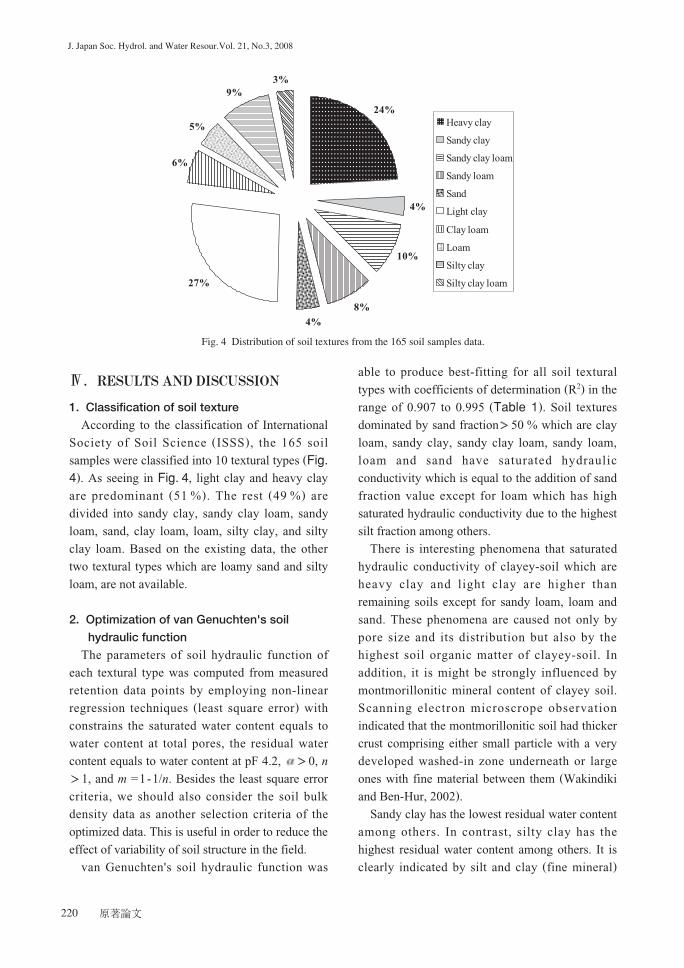
Ⅳ.RESULTS AND DISCUSSION
1. Classification of soil texture
According to the classification of International
Society of Soil Science (ISSS), the 165 soil
samples were classified into 10 textural types (Fig.4). As seeing in Fig. 4, light clay and heavy clay
are predominant (51 %). The rest (49 %) are
divided into sandy clay, sandy clay loam, sandy
loam, sand, clay loam, loam, silty clay, and silty
clay loam. Based on the existing data, the other
two textural types which are loamy sand and silty
loam, are not available.
2. Optimization of van Genuchten's soil
hydraulic function
The parameters of soil hydraulic function of
each textural type was computed from measured
retention data points by employing non-linear
regression techniques (least square error) with
constrains the saturated water content equals to
water content at total pores, the residual water
content equals to water content at pF 4.2, 0, n
1, and m =1-1/n. Besides the least square error
criteria, we should also consider the soil bulk
density data as another selection criteria of the
optimized data. This is useful in order to reduce the
effect of variability of soil structure in the field.
van Genuchten's soil hydraulic function was
able to produce best-fitting for all soil textural
types with coefficients of determination (R2) in the
range of 0.907 to 0.995 (Table 1). Soil textures
dominated by sand fraction 50 % which are clay
loam, sandy clay, sandy clay loam, sandy loam,
loam and sand have saturated hydraulic
conductivity which is equal to the addition of sand
fraction value except for loam which has high
saturated hydraulic conductivity due to the highest
silt fraction among others.
There is interesting phenomena that saturated
hydraulic conductivity of clayey-soil which are
heavy clay and light clay are higher than
remaining soils except for sandy loam, loam and
sand. These phenomena are caused not only by
pore size and its distribution but also by the
highest soil organic matter of clayey-soil. In
addition, it is might be strongly influenced by
montmorillonitic mineral content of clayey soil.
Scanning electron microscrope observation
indicated that the montmorillonitic soil had thicker
crust comprising either small particle with a very
developed washed-in zone underneath or large
ones with fine material between them (Wakindiki
and Ben-Hur, 2002).
Sandy clay has the lowest residual water content
among others. In contrast, silty clay has the
highest residual water content among others. It is
clearly indicated by silt and clay (fine mineral)
J. Japan Soc. Hydrol. and Water Resour.Vol. 21, No.3, 2008
Fig. 4 Distribution of soil textures from the 165 soil samples data.
221原著論文
fraction content although low soil organic matter
of silty clay. Silty clay loam has the highest
saturated soil water content among others due to
particle size distribution of this soil is dominated
by silt and clay and also due to high soil organic
matter content. In contrast, clay loam has the
lowest saturated water content among others.
Mitchell (1993) stated that the smaller soil
particles performed, the larger contact area
increased among its particles. As a result, the
higher micropores with steady structure occurred.
Thus, this soil has water content relatively higher
than one which is composed by larger particle(Saxton and Rawls, 2006). The occurrence of
higher soil organic matters not only will strengthen
the soil aggregate but also enhance soil capacity in
holding and storing water. This is because soil
organic matter minimizes soil compaction,
provides pores, and is able to store a quantity of
water which corresponds to a multiple of the
organic matter's weight (Emerson, 1995).
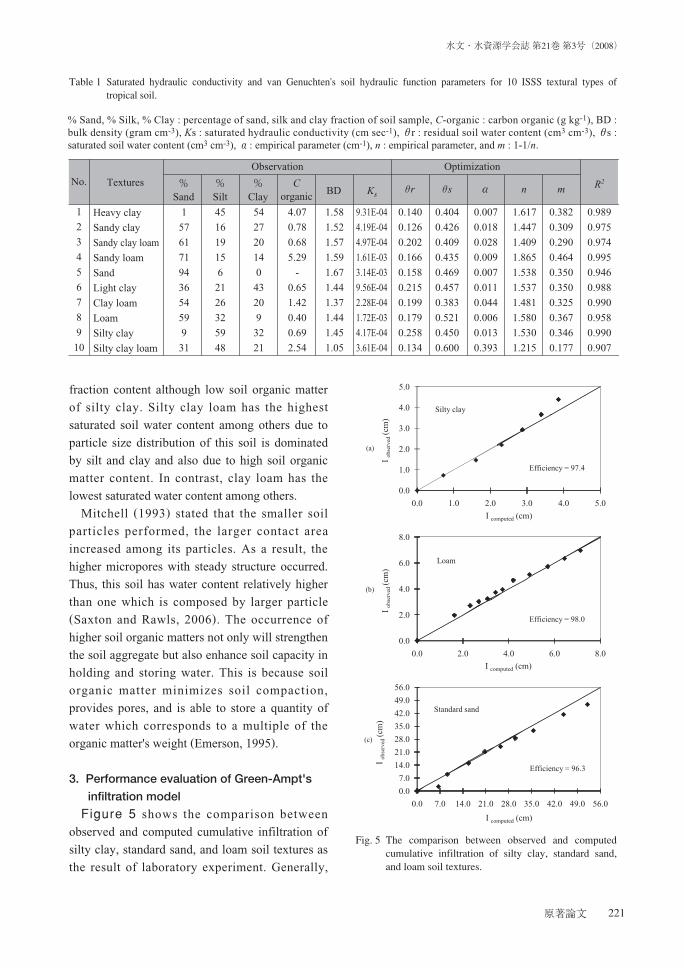
3. Performance evaluation of Green-Ampt's
infiltration model
Figure 5 shows the comparison between
observed and computed cumulative infiltration of
silty clay, standard sand, and loam soil textures as
the result of laboratory experiment. Generally,
水文・水資源学会誌第21巻第3号(2008)
Table 1 Saturated hydraulic conductivity and van Genuchten's soil hydraulic function parameters for 10 ISSS textural types oftropical soil.
Fig. 5 The comparison between observed and computedcumulative infiltration of silty clay, standard sand,and loam soil textures.
222 原著論文
sand has the highest cumulative infiltration
followed by loam and silty clay respectively. The
value of efficiency of each soil textures indicated
that numerical simulation of Green-Ampt's
infiltration model agreed well with measured data.
These good agreements between experimental and
numerical results confirmed that Green-Ampt's
infiltration model can describe infiltration
characteristics using soil water retention and
hydraulic properties.
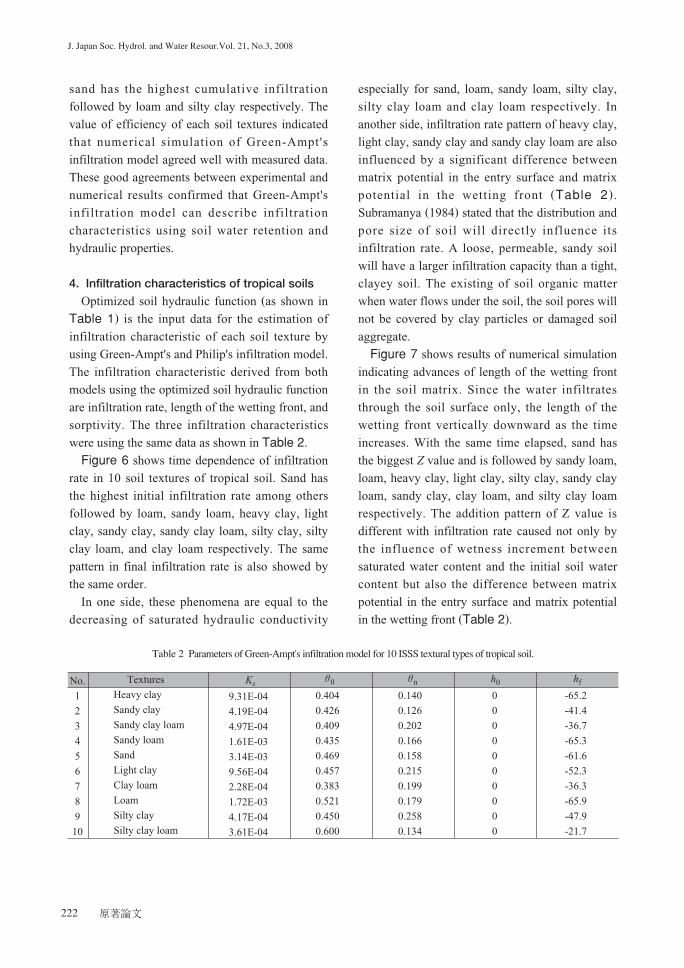
4. Infiltration characteristics of tropical soils
Optimized soil hydraulic function (as shown in
Table 1) is the input data for the estimation of
infiltration characteristic of each soil texture by
using Green-Ampt's and Philip's infiltration model.
The infiltration characteristic derived from both
models using the optimized soil hydraulic function
are infiltration rate, length of the wetting front, and
sorptivity. The three infiltration characteristics
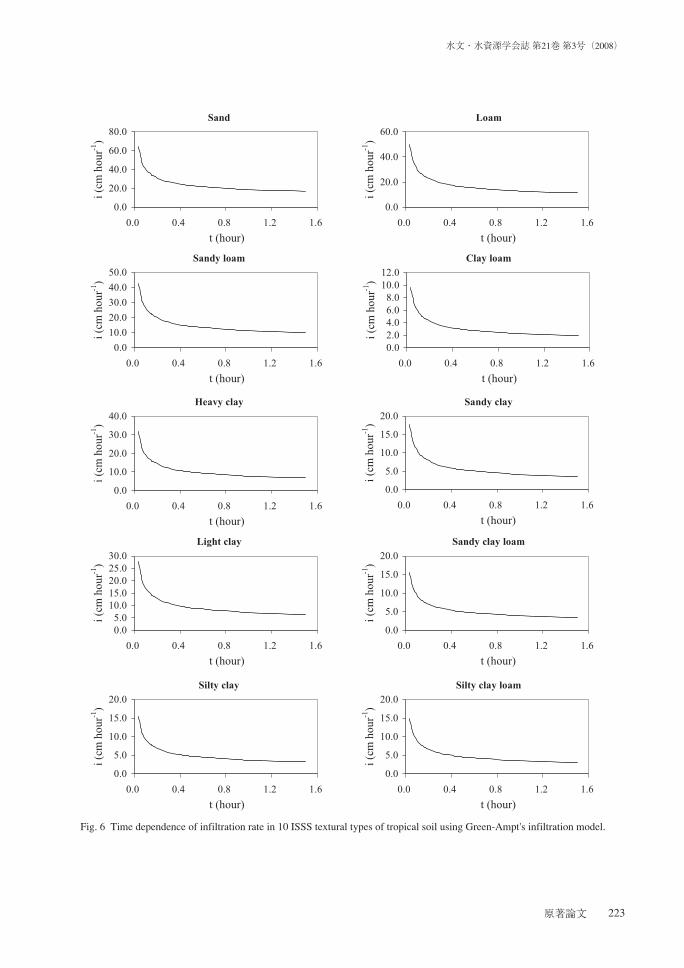
were using the same data as shown in Table 2.Figure 6 shows time dependence of infiltration
rate in 10 soil textures of tropical soil. Sand has
the highest initial infiltration rate among others
followed by loam, sandy loam, heavy clay, light
clay, sandy clay, sandy clay loam, silty clay, silty
clay loam, and clay loam respectively. The same
pattern in final infiltration rate is also showed by
the same order.
In one side, these phenomena are equal to the
decreasing of saturated hydraulic conductivity
especially for sand, loam, sandy loam, silty clay,
silty clay loam and clay loam respectively. In
another side, infiltration rate pattern of heavy clay,
light clay, sandy clay and sandy clay loam are also
influenced by a significant difference between
matrix potential in the entry surface and matrix
potential in the wetting front (Table 2).
Subramanya (1984) stated that the distribution and
pore size of soil will directly influence its
infiltration rate. A loose, permeable, sandy soil
will have a larger infiltration capacity than a tight,
clayey soil. The existing of soil organic matter
when water flows under the soil, the soil pores will
not be covered by clay particles or damaged soil
aggregate.
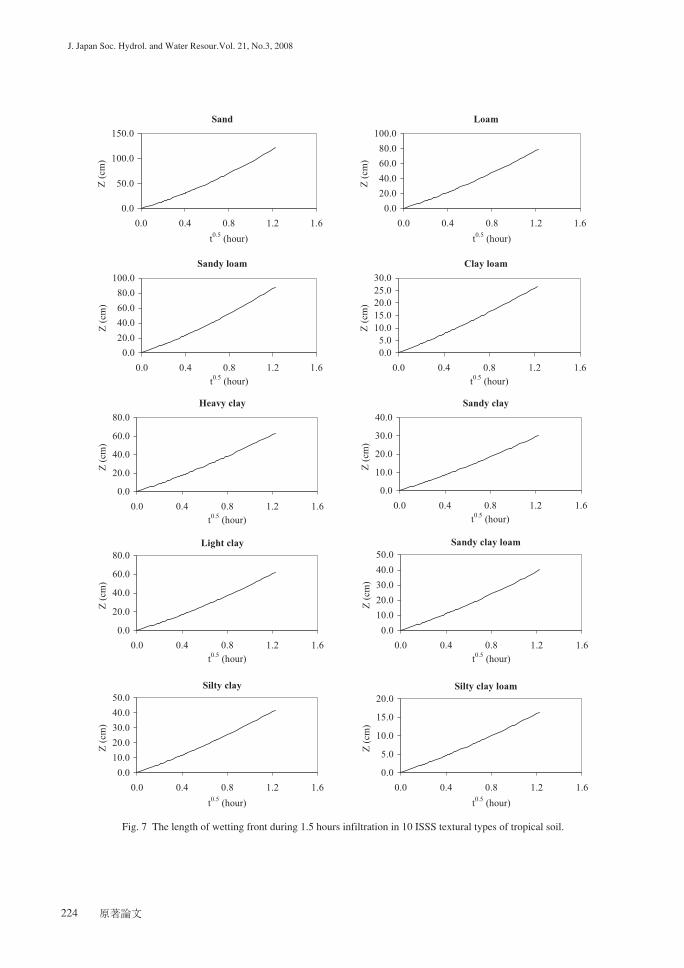
Figure 7 shows results of numerical simulation
indicating advances of length of the wetting front
in the soil matrix. Since the water infiltrates
through the soil surface only, the length of the
wetting front vertically downward as the time
increases. With the same time elapsed, sand has
the biggest Z value and is followed by sandy loam,
loam, heavy clay, light clay, silty clay, sandy clay
loam, sandy clay, clay loam, and silty clay loam
respectively. The addition pattern of Z value is
different with infiltration rate caused not only by
the influence of wetness increment between
saturated water content and the initial soil water
content but also the difference between matrix
potential in the entry surface and matrix potential
in the wetting front (Table 2).
J. Japan Soc. Hydrol. and Water Resour.Vol. 21, No.3, 2008
Table 2 Parameters of Green-Ampt's infiltration model for 10 ISSS textural types of tropical soil.
223原著論文
水文・水資源学会誌第21巻第3号(2008)
Fig. 6 Time dependence of infiltration rate in 10 ISSS textural types of tropical soil using Green-Ampt's infiltration model.
224 原著論文
J. Japan Soc. Hydrol. and Water Resour.Vol. 21, No.3, 2008
Fig. 7 The length of wetting front during 1.5 hours infiltration in 10 ISSS textural types of tropical soil.
225原著論文
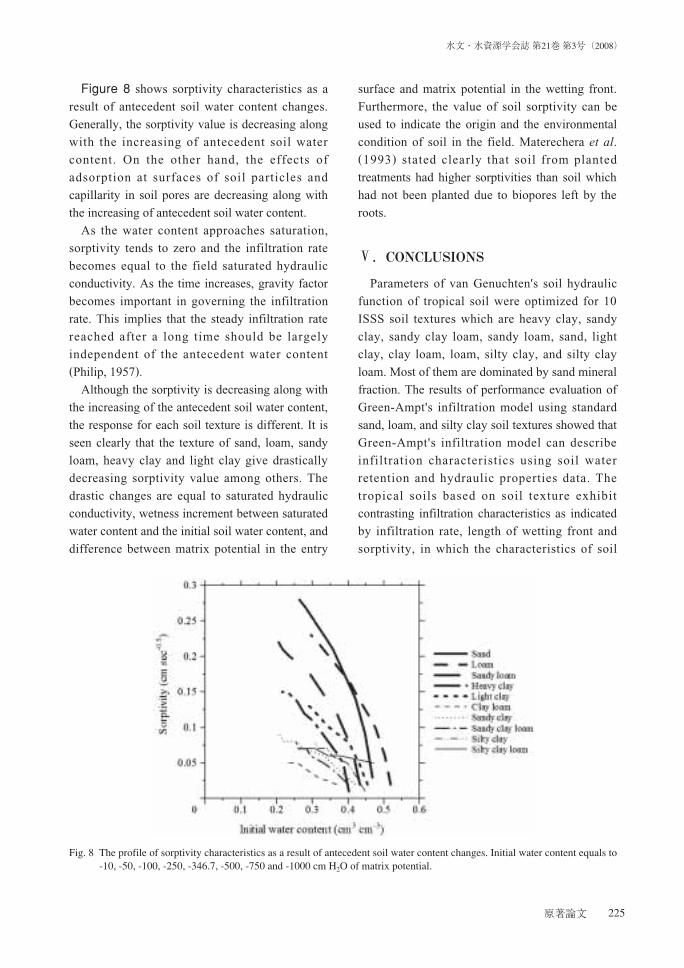
Figure 8 shows sorptivity characteristics as a
result of antecedent soil water content changes.
Generally, the sorptivity value is decreasing along
with the increasing of antecedent soil water
content. On the other hand, the effects of
adsorption at surfaces of soil particles and
capillarity in soil pores are decreasing along with
the increasing of antecedent soil water content.
As the water content approaches saturation,
sorptivity tends to zero and the infiltration rate
becomes equal to the field saturated hydraulic
conductivity. As the time increases, gravity factor
becomes important in governing the infiltration
rate. This implies that the steady infiltration rate
reached after a long time should be largely
independent of the antecedent water content(Philip, 1957).
Although the sorptivity is decreasing along with
the increasing of the antecedent soil water content,
the response for each soil texture is different. It is
seen clearly that the texture of sand, loam, sandy
loam, heavy clay and light clay give drastically
decreasing sorptivity value among others. The
drastic changes are equal to saturated hydraulic
conductivity, wetness increment between saturated
water content and the initial soil water content, and
difference between matrix potential in the entry
surface and matrix potential in the wetting front.
Furthermore, the value of soil sorptivity can be
used to indicate the origin and the environmental
condition of soil in the field. Materechera et al.(1993) stated clearly that soil from planted
treatments had higher sorptivities than soil which
had not been planted due to biopores left by the
roots.
Ⅴ.CONCLUSIONS
Parameters of van Genuchten's soil hydraulic
function of tropical soil were optimized for 10
ISSS soil textures which are heavy clay, sandy
clay, sandy clay loam, sandy loam, sand, light
clay, clay loam, loam, silty clay, and silty clay
loam. Most of them are dominated by sand mineral
fraction. The results of performance evaluation of
Green-Ampt's infiltration model using standard
sand, loam, and silty clay soil textures showed that
Green-Ampt's infiltration model can describe
infiltration characteristics using soil water
retention and hydraulic properties data. The
tropical soils based on soil texture exhibit
contrasting infiltration characteristics as indicated
by infiltration rate, length of wetting front and
sorptivity, in which the characteristics of soil
水文・水資源学会誌第21巻第3号(2008)
Fig. 8 The profile of sorptivity characteristics as a result of antecedent soil water content changes. Initial water content equals to-10, -50, -100, -250, -346.7, -500, -750 and -1000 cm H2O of matrix potential.
226 原著論文
infiltrability are mainly influenced by hydraulic
conductivity, initial water content, and matrix
potential at the wetting front.
This study can be used to estimate soil
infiltrability in a field scale with previously known
its soil properties. However it still needs to
consider inhomogeneous of initial water content in
the soil profiles.
ACKNOWLEDGEMENTSThe authors would like to thank Mr. Trisnadi
and Mr. Rudiyanto of Department of Agricultural
Engineering, Bogor Agricultural University for
their assistance to achieve laboratory experiment
and numerical simulation of infiltration. The data
of soil physical and hydraulics properties were
provided by Mr. Yiyi Sulaeman of Indonesian
Center for Agricultural Land Resources Research
and Development. We are also grateful to
anonymous reviewer for their help to improve the
quality of this paper. This study has been
supported by Directorate General of Higher
Education of Ministry of Education of Indonesia
through The Postgraduate Program Scholarship(BPPS).
REFERENCES
Angelaki A, Sakellariou-Makrantonaki M, Tzimopoulos C.2004. Laboratory experiments and estimation of cumulativeinfiltration and sorptivity. Water, Air, & Soil Pollution: Focus 4 :241-251.Askari M, Saptomo SK, Setiawan BI. 2006. Error analysis on theestimation of cumulative infiltration in soil using Green andAmpt model. J. Indonesian Soc. of Agric. Engineering 20 :189-195.Braud I, De Condappa D, Soria JM, Haverkamp R, Angulo-Jaramillo R, Galle S, Vauclin M. 2005. Use of scaled forms ofthe infiltration equation for the estimation of unsaturated soilhydraulic properties (the Beerkan method). European Journal ofSoil Science 56 : 361-374.Bresler E, Dagan G. 1983. Unsaturated flow in spatiallyvariable fields. 2. Application of water flow models to variousfields. Water Resour. Res. 19 : 421-428.Burden RL, Faires JD. 1993. Numerical Analysis, 5th Edition.PWS Publishing Company: Boston. 768p.Dingman SL. 2002. Physical Hydrology, 2nd Edition. PrenticeHall: New Jersey. 646p.Emerson WW. 1995. Water retention, organic C and soiltexture. Austr J. Soil Sci. 33 : 241-251.Hermantoro. 2003. Efektivitas sistem fertigasi kendi: Kasuspada tanaman lada perdu. Disertasi Doktor. ProgramPascasarjana IPB, Bogor (in Indonesian language).Hikmatullah, Sulaeman Y. 2006. Pendugaan retensi air tanah darisifat-sifat tanah lainnya. J. Tanah dan Iklim. (in Indonesian
language with English abstract, in press).Hillel D. 1980. Application of Soil Physics. Academic Press,Inc.: USA. 385p.Hodnett MG, Tomasella J. 2002. Marked differences between vanGenuchten soil water-retention parameters for temperateand tropical soils: a new water-retention pedo-transferfunctions developed for tropical soils. Geoderma 108 : 155-180.Hopmans JW, Stricker JNM. 1989. Stochastic analysis of soilwater regime in a watershed. J. Hydrol. 105 : 57-84.Kozak JA, Ahuja LR. 2005. Scaling of infiltration andredistribution of water across soil textural classes. Soil SciSoc Am J. 69 : 816-827.Leonard J, Andrieux P. 1998. Infiltration characteristics of soils inMediterranean vineyards in Southern France. Catena 32 :209-223.Materechera SA, Alston AM, Kirby JM, Dexter AR. 1993. Fieldevaluation of laboratory techniques for predicting the ability ofroots to penetrate strong soil and of the influence of roots onwater sorptivity. Plant and Soil 149 : 149-158.Misra SK, Tyagi JV, Singh VP. 2003. Comparison of infiltrationmodels. Hydrol. Process. 17 : 2629-2652.Mitchell JK. 1993. Fundamentals of Soil Behavior, 2nd Edition.John Wiley & Sons, Inc.: New York. 445p.Netto AM, Pieritz RA, Gaudet JP. 1999. Field study on thelocal variability of soil water content and solute concentration. J.Hydrol. 215 :23-37.Pereira LS, Allen RG. 1999. Irigation and Drainage. In: vanLier HN, Pereira LS, Steiner FR. (Editors). CIGR Handbook ofAgricultural Engineering Vol. I Land & Water Engineering.American Society of Agricultural Engineering. Chapter 5.Philip JR. 1957. Theory of infiltration: 5. The influence of the initialmoisture content. Soil Science 84 : 329-339.Rawls WJ, Pachepsky YA. 2002. Soil consistence andstructure as predictors of water retention. Soil Sci. Soc. Am. J.66 : 1115-1126.Regalado CM, Rittera A, Álvarez-BenedÍb J, Munoz-Carpena R.2005. Simplified method to estimate the Green-Ampt wettingfront suction and soil sorptivity with the Philip-Dunne falling-headpermeameter. Vadose Zone J. 4 : 291-299.Romano N, Brunone B, Santini A. 1998. Numerical analysis ofone-dimensional unsaturated fow in layered soils. Adv. WaterResour. 21 : 315-324.Saleh E. 2000. Kinerja sistem irigasi kendi untuk tanaman didaerah kering. Disertasi Doktor. Program Pascasarjana IPB,Bogor (in Indonesia language).Saxton KE, Rawls WJ. 2006. Soil water characteristicsestimates by texture and organic matter for hydrologicsolutions. Soil Sci. Soc. Am. J. 70 : 1569-1578.Setiawan BI. 1992. Studies on infiltration in soil havingmacropore. Dissertation. Division of Agricultural Engineering,Faculty of Agriculture, The University of Tokyo, Japan. 216p.Subramanya K. 1984. Engineering Hydrology. Tata McGraw-Hill Publishing Company Limited: New Delhi. 312p.Swartzendruber D. 2000. Derivation of a two term infiltrationequation from the Green-Ampt model. J. Hydrol. 236 : 247-251.Teh CBS, Rashid MA. 2003. Object-oriented code to lookupsoil texture classes for any soil classification scheme.Communications in Soil Science and Plant Analysis 34 : 1-11.van Dam JC, Feddes RA. 2000. Numerical simulation ofinfiltration, evaporation and shallow groundwater levels withthe Richards equation. J. Hydrol. 233 : 72-85.van Genuchten MT. 1980. A closed-form equation forpredicting the hydraulic conductivity of unsaturated soils. SoilSci. Soc. Am. J. 44 : 892-898.Wakindiki IIC, Ben-Hur M. 2002. Soil mineralogy and textureeffects on crust micromorphology, infiltration, and erosion.
J. Japan Soc. Hydrol. and Water Resour.Vol. 21, No.3, 2008
227原著論文
Soil Sci. Soc. Am. J. 66 : 897-905.Wang Z, Feyen J, Nielsen DR, van Genuchten MT. 1997.Two-phase flow infiltration equations accounting for airentrapment effects. Water Resour. Res. 12 : 2759-2767.
Xie M, Esaki T, Cai M. 2004. A time-space based approach formapping rainfall-induced shallow landslide hazard.Environmental Geology 46 : 840-850.
(Received:Sep.13,2007, Accepted:Feb.8,2008)
水文・水資源学会誌第21巻第3号(2008)
土壌水分保持データに基づく熱帯土壌の浸透特性
熱帯土壌の浸透特性を予測するため,インドネシアの多くの地域から採取された未撹乱土壌の水分保持特性と水理特性を分析した.採取した土壌の土性は国際土壌科学学会の分類法に基づいて分類した.また,pF=1,pF=2,pF=2.54,pF=4.2で体積含水率と土壌水分張力との関係を予測するためにvan-Genuchtenモデルを適用した.このモデルのパラメータを最適化するために,また空気浸入値を予測するために合計165個の土壌水分保持特性データを使用した.それぞれの土性の浸透能特性を明らかにするために,Green-AmptとPhilipの浸透モデルを適用した.さらに,室内実験結果との比較において,Green-Amptの浸透モデルによる累積浸透の数値シミュレーション結果を検証するために,Nash and Sutcliffeの効率係数を使用した.本研究の結果,合計165個の土壌試料が,国際土壌科学学会分類法に基づいて分類され,重粘土,砂質粘土,砂質粘ローム土,砂壌土,砂土,軽粘土,埴壌土,ローム土,シルト質粘土,シルト質粘ローム土の10タイプに分けられた.Green-Amptの浸透モデルの性能評価試験結果から,Green-Amptの浸透モデルは土壌の水分保持特性と水理特性のデータを使用することによって,各土壌の浸透特性を評価できることが明らかとなった.また,熱帯土壌の土性の違いは,浸透速度,浸潤前線深度,およびsorptivityに関して,著しい対照を示した. さらに,熱帯土壌の浸透特性は主に,透水係数,初期水分量,および浸潤前線先端における土壌水分張力の大きさによって影響されていることが明らかとなった.
キーワード:熱帯土壌, 国際土壌科学学会分類法, 土壌水分保持特性, Green-Amptモデル, 浸潤前線, sorptivity
Muhamad ASKARI 1) 田中 正 2)
Budi Indra SETIAWAN 3) Satyanto Krido SAPTOMO 3)
1)筑波大学大学院生命環境科学研究科博士後期課程(〒305-8572 茨城県つくば市天王台1-1-1)
2)筑波大学大学院生命環境科学研究科(〒305-8572 茨城県つくば市天王台1-1-1)
3)インドネシア・ボゴール農科大学農業工学研究室(ボゴール農科大学Darmaga Campus, Bogor 16680, Indonesia)