Inferring orientation distributions in anisotropic powders of nano-layered crystallites from a...
11
arXiv:cond-mat/0602007v1 [cond-mat.mtrl-sci] 1 Feb 2006 research papers Journal of Applied Crystallography ISSN 0021-8898 Received 0 XXXXXXX 0000 Accepted 0 XXXXXXX 0000 Online 0 XXXXXXX 0000 © 20005 International Union of Crystallography Printed in Great Britain – all rights reserved Inferring orientation distributions in anisotropic powders of nano-layered crystallites from a single two-dimensional WAXS image Yves M´ eheust, a * Kenneth Dahl Knudsen b and Jon Otto Fossum a a Physics Department, Norwegian University of Science and Technology, 7491 Trondheim, Norway, and b Physics Department, Institute for Energy Technology, Kjeller, Norway. Correspondencee-mail: [email protected] The wide-angle scattering of X-rays by anisotropic powders of nano-layered crys- tallites (nano-stacks) is addressed. Assuming that the orientation distribution prob- ability function f of the nano-stacks only depends on the deviation of the crystal- lites’ orientation from a fixed reference direction, we derive a relation providing f from the dependence of a given diffraction peak’s amplitude on the azimuthal angle. The method is applied to two systems of Na-fluorohectorite (NaFH) clay particles, using synchrotron radiation and a WAXS setup with a two-dimensional detector. In the first system, which consists of dry-pressed NaFH samples, the orientation distribution probability function corresponds to a classical uniaxial nematic order. The second system is observed in bundles of polarized NaFH par- ticles in silicon oil; in this case, the nanostacks have their directors on average in a plane normal to the reference direction, and f is a function of the angle between a nano-stack’s director and that plane. In both cases, a suitable Maier-Saupe func- tion is obtained for the distributions, and the reference direction is determined with respect to the laboratory frame. The method only requires one scattering image. Besides, consistency can be checked by determining the orientation distri- bution from several diffraction peaks independently. 1. Introduction The recording of a powder diffraction signal using a two- dimensional detector is a potentially simple and efficient tech- nique for determining characteristic structural length scales in crystals. The basis of the technique lies in that a scattering vol- ume containing an isotropic powder consisting of a large num- ber of particles with identical crystalline structure offers to the incoming beam all possible incidence orientations with respect to the crystallites. Consequently, all the diffraction peaks char- acteristic of the crystallite structure are visible in any of the azimuthal planes, and all azimuthal planes are equivalent: a sim- ple scan of the deviation angle, 2 θ, in a given azimuthal plane, provides a spectrum containing peaks at all structural length scales characteristic of the crystallites, apart from those extinct due to form factor effects. The scattering image collected by a two-dimensional detector is isotropic, and its center of symme- try denotes the direction of the incident beam. Radial cuts of the images passing through this center provide identical one- dimensional spectra that can be averaged over all azimuthal angles in order to significantly increase the signal to noise ratio. It is well known that reconstruction of the three-dimensional crystal structure from powder data is made difficult by the over- lapping of reflections with similar diffraction angles. The inter- pretation is fairly easy in the case where only a dominant fea- ture of the structure is investigated. A particular case is that of nano-layered systems, where the powder is made of particles, or clusters of particles, that consist of a stack of identical quasi- 2D crystallites. The Bragg reflections resulting from the set of Bragg planes associated to those stacks are the most intense and can be interpreted in quite a straightforward manner. A num- ber of natural (vermiculite, montmorillonite) and synthetic (flu- orohectorite) smectite clays have the properties of presenting, in the weakly-hydrated states, a microstructure where particles are platelet-shaped and nano-layered. The repeating crystallite is a 1nm-thick silicate-platelet, and the stacks are held together by cations shared between adjacent platelets. The stacks can swell by intercalation of ions and molecules (water, in particu- lar), and powder diffraction has been used extensively to study that swelling, both on natural (Wada et al., 1990) and synthetic (da Silva et al., 2002) smectite clays. A wide range of natural or man-made materials are aggre- gates of crystallites with the same crystallographic structure. The distribution of the crystallite orientations inside the mate- rial are rarely isotropic, hence their X-ray diffraction signal is that of an anisotropic powder. Many examples of such poly- crystalline aggregates can be found among metals. The analy- sis from X-ray diffraction data of the preferred crystallographic orientations in those metals, i. e., their texture, provides infor- mation on the history of their deformation (Wenk, 1985), as it does for rocks, another type of polycrystalline materials with a larger degree of complexity (several types of crystals coexist). This is done by decomposing the distribution of the reflections’ intensities as a function of the angular direction into a super- position of distributions resulting from single reflections (pole 1
-
Upload
independent -
Category
Documents
-
view
0 -
download
0
Transcript of Inferring orientation distributions in anisotropic powders of nano-layered crystallites from a...
arX
iv:c
ond-
mat
/060
2007
v1 [
cond
-mat
.mtr
l-sci
] 1
Feb
200
6
research papers
Journal of Applied Crystallography
ISSN 0021-8898
Received 0 XXXXXXX 0000
Accepted 0 XXXXXXX 0000
Online 0 XXXXXXX 0000
© 20005 International Union of Crystallography
Printed in Great Britain – all rights reserved
Inferring orientation distributions in anisotropicpowders of nano-layered crystallites from a singletwo-dimensional WAXS image
Yves Meheust,a* Kenneth Dahl Knudsenb and Jon Otto Fossuma
aPhysics Department, Norwegian University of Science and Technology, 7491 Trondheim, Norway, and
bPhysics Department, Institute for Energy Technology, Kjeller, Norway. Correspondence e-mail: [email protected]
The wide-angle scattering of X-rays by anisotropic powdersof nano-layered crys-tallites (nano-stacks) is addressed. Assuming that the orientation distribution prob-ability function f of the nano-stacks only depends on the deviation of the crystal-lites’ orientation from a fixed reference direction, we derive a relation providingf from the dependence of a given diffraction peak’s amplitudeon the azimuthalangle. The method is applied to two systems of Na-fluorohectorite (NaFH) clayparticles, using synchrotron radiation and a WAXS setup with a two-dimensionaldetector. In the first system, which consists of dry-pressedNaFH samples, theorientation distribution probability function corresponds to a classical uniaxialnematic order. The second system is observed in bundles of polarized NaFH par-ticles in silicon oil; in this case, the nanostacks have their directors on average ina plane normal to the reference direction, andf is a function of the angle betweena nano-stack’s director and that plane. In both cases, a suitable Maier-Saupe func-tion is obtained for the distributions, and the reference direction is determinedwith respect to the laboratory frame. The method only requires one scatteringimage. Besides, consistency can be checked by determining the orientation distri-bution from several diffraction peaks independently.
1. Introduction
The recording of a powder diffraction signal using a two-dimensional detector is a potentially simple and efficient tech-nique for determining characteristic structural length scales incrystals. The basis of the technique lies in that a scattering vol-ume containing an isotropic powder consisting of a large num-ber of particles with identical crystalline structure offers to theincoming beam all possible incidence orientations with respectto the crystallites. Consequently, all the diffraction peaks char-acteristic of the crystallite structure are visible in any of theazimuthal planes, and all azimuthal planes are equivalent:a sim-ple scan of the deviation angle, 2θ, in a given azimuthal plane,provides a spectrum containing peaks at all structural lengthscales characteristic of the crystallites, apart from those extinctdue to form factor effects. The scattering image collected by atwo-dimensional detector is isotropic, and its center of symme-try denotes the direction of the incident beam. Radial cuts ofthe images passing through this center provide identical one-dimensional spectra that can be averaged over all azimuthalangles in order to significantly increase the signal to noiseratio.
It is well known that reconstruction of the three-dimensionalcrystal structure from powder data is made difficult by the over-lapping of reflections with similar diffraction angles. Theinter-pretation is fairly easy in the case where only a dominant fea-ture of the structure is investigated. A particular case is that ofnano-layered systems, where the powder is made of particles,or clusters of particles, that consist of a stack of identical quasi-
2D crystallites. The Bragg reflections resulting from the set ofBragg planes associated to those stacks are the most intenseandcan be interpreted in quite a straightforward manner. A num-ber of natural (vermiculite, montmorillonite) and synthetic (flu-orohectorite) smectite clays have the properties of presenting,in the weakly-hydrated states, a microstructure where particlesare platelet-shaped and nano-layered. The repeating crystalliteis a 1nm-thick silicate-platelet, and the stacks are held togetherby cations shared between adjacent platelets. The stacks canswell by intercalation of ions and molecules (water, in particu-lar), and powder diffraction has been used extensively to studythat swelling, both on natural (Wadaet al., 1990) and synthetic(da Silvaet al., 2002) smectite clays.
A wide range of natural or man-made materials are aggre-gates of crystallites with the same crystallographic structure.The distribution of the crystallite orientations inside the mate-rial are rarely isotropic, hence their X-ray diffraction signal isthat of an anisotropic powder. Many examples of such poly-crystalline aggregates can be found among metals. The analy-sis from X-ray diffraction data of the preferred crystallographicorientations in those metals, i. e., theirtexture, provides infor-mation on the history of their deformation (Wenk, 1985), as itdoes for rocks, another type of polycrystalline materials with alarger degree of complexity (several types of crystals coexist).This is done by decomposing the distribution of the reflections’intensities as a function of the angular direction into a super-position of distributions resulting from single reflections (pole
1

research papers
figures), and subsequently inferring the orientation distributionprobability (ODP) for the crystallites. Several general meth-ods (Wenk, 1985; Bunge, 1993) have been developed to tacklethat potentially difficult (and sometimes, non-univoque) inver-sion. From the experimental point of view, 2D detectors haveproved useful in such texture analyses, as they allow gatheringof the data necessary to the pole figure analysis in a short timeand without changing the sample position (Ischiaet al., 2005).See (Wenk & Grigull, 2003) about the practical applicabilityof those methods. Note that texture studies have recently foundan interesting application in methods allowing to determine thecomplete 3D structure of a crystal from anisotropic powderdiffraction data collected from samples with different textures(Lasocha & Schenk, 1997; Wesselset al., 1999).
The study of preferential orientations in polycrystallinemate-rials consisting of nano-layered particles (quasi-1D crystals)such as the clays presented above has made little use of the gen-eral inversion technique for texture data, since there is basicallyno overlap of pole figures for those materials. In the case wherethe ODP possesses an axial symmetry, it is classically deter-mined experimentally by measuring arocking-curve, in whichthe sample is rotated around an incidence angleθ correspondingto a well known(00k) reflection, and the scattered intensity ismeasured at the deviation angle 2θ as a function ofθ (Guntert& Cvikevich, 1964; Taylor & Norrish, 1966). In this paper,we present an alternative method for determining the orienta-tion distribution from the scattering data in the case in whichit only depends on one characteristic angle. When the assem-bly of nano-stacks present a partial priviledged orientation, allazimuthal planes are not equivalent any more. Our method isbased on monitoring the dependence of the intensity of a givenreflection peak on the azimuthal angle. It can thus be carriedout on a single two-dimensional wide angle scattering image.In other words, we monitor the anisotopry of that image at agiven reflection. Note that monitoring of the intensity alongDebye rings has previously been done in a similar manner forcubic and hexagonal materials (Puig-Molinaet al., 2003; Wenk& Grigull, 2003). We do not address the influence of the ODPon the diffraction profiles in a given azimuthal plane, a problemto which much attention has been given in the past, for systemslike pyrolytic graphite (Guntert & Cvikevich, 1964) and smec-tite clays (de Courvilleet al., 1979; Plancon, 1980).
The paper is organized as follows. In section 2, we present thetheoretical background of the method, for both geometries.Themethod is applied to data from two experiments correspondingto two geometrical configurations observed in systems of thesynthetic smectite clay Na-fluorohectorite (in sections 3 and 4,respectively). In section 5, we discuss the interest of the method.Section 6 is the conclusion.
2. Theoretical background
We consider a clay sample placed at the originO of the labo-ratory frame(O, x, y, z) (see Fig. 1). An incident X-ray beamparallel tox, and of wavelengthλ, is scattered by the sample,and the scattered intensity recorded in a detector planeyO′z, O′
being the point where the direct beam would hit the detector in
the absence of a beam stop behind the sample. The sample con-sists of a population of nano-layered crystallites consisting of∼ 100 stacked identical layers. The orientation distribution f ofthe crystallite population with respect to the laboratory frame isassumed known and anisotropic, resulting in an anisotropicdis-tribution of the scattered intensities in the detector plane. Therunning point M on the detector is denoted by the direction ofthe lineOu passing through the pointsOandM; the correspond-ing angular frame consists of the scattering deviation angle 2θ
and the azimuthal angleφ.
2.1. Diffraction by an anisotropic distribution of nano-stacks
The orientation of each crystallite’s director,n, with respectto the fixed frame, is denoted by the angular frame (Θ,Φ) (seeFig. 1), withΘ in the range[0;π/2] andΦ in the range[−π; π].Θ is the angle between the crystallite’s director and the planeyOz, while Φ is the azimuthal angular coordinate of the direc-tor.
Let us first consider a single crystallite whose stacking planesmake with the incident beam an angleθ, corresponding to theBragg condition for the stack. This implies that it mostly scat-ters along the directionOu, i.e, that the azimuthal direction forscattering isφ = Φ, and the deviation angle is 2θ = 2Θ (seefigure 2(a)). As the azimuthφ describes the[−π; π] range, thetrajectory on the unit sphere of the director for the crystallitesthat scatter along that azimuth describes a circle in the planex = sinθ (see Fig. 2(b)). This director is therefore defined inthe frame(x, y, z) by the coordinates
n2θ(φ)
sinθ
− cosθ sinφ
cosθ cosφ
. (1)
Next, we assume that the angular distributionf only dependson an single angleα, which is the angle between a crystallite’sdirector n and a reference orientationn0. The distribution isnormalized with respect to the total solid angle available to thedescription, i. e.
∫ 2π
0
∫
π
0f (α) sinα dα dβ = 1 , (2)
where (α,β) is a standard spherical angular frame. We assumethat the size- and orientation- distribution of the particles areuncorrelated, and that the beam defines a scattering volume thatis large enough for the size distribution of the scatterers to beentirely contained in it. Hence, we assume that the amplitude ofa diffraction peak in the direction (2θ,φ) is proportional to thenumber of scatterers that satisfy the Bragg condition for thatdirection, and that the proportionality constant is independentof φ. This also assumes that the scattering peak is well sepa-rated from other peaks along the 2θ line. We denoteI2θ(φ) theamplitude of the diffraction peak at deviation angle 2θ and at agiven azimuthal angle valueφ, andα2θ(φ) the angle betweenthe reference directorn0 and that of the crystallites that diffractin the(2θ, φ) direction. The intensityI2θ(φ) ∆φ along a length
2
research papers
∆φ of the angular scattering cone of half-opening 2θ is propor-tional to the quantityf (α2θ(φ)) ∆α(φ, ∆Φ), where the angularlength∆α is that travelled byn on the unit sphere asφ describesthe range∆φ. The trajectory in Fig. 2(b) is travelled at constantspeed when varyingφ uniformly, as appears from the vectordn/dφ having a norm cosθ (computed from Eq. (1)), and thusindependent ofφ. Therefore,∆α only depends on∆φ, whichyields:
I2θ(φ) ∆φ ∝ f (α2θ(φ)) ∆α(∆φ) . (3)
Consequently, a uniform sampling of the azimuthal profile ofa WAXS peak in the scattering figure is directly related to theorientation distribution for the scatterers,f . In particular, a con-stant profile corresponds to a uniform angular distributionof theplatelets, i.e, the scattering figure of an isotropic clay powder isisotropic, as expected.
The angleα2θ(φ) can be computed from its cosine whichequalsn0 · n2θ(φ). The orientation with respect to the labora-tory frame of the mean directorn0 is defined by the anglesΘ0
andΦ0, and thus its coordinates in the(x, y, z) frame are
n0
sinΘ0
− cosΘ0 sinΦ0
cosΘ0 cosΦ0
. (4)
Thus,
α2θ(φ) = acos[sinθ sinΘ0 + cosθ cosΘ0 cos(φ − Φ0]) .(5)
For a uniform sampling of the azimuthal scattering intensity
profile I2θ(φ), one can directly relate the functionI2θ(φ) andf (α) bringing together Eq. (3) and (5) according to
I2θ(φ) ∝ f (acos[sinθ sinΘ0 + cosθ cosΘ0 cos(φ − Φ0)]) .(6)
From a given functional form for the distributionf , with agiven set of shape parameters (peak position, width, referencelevel), it is possible to fit a function in the form (6) to the exper-imental data, and infer both the distribution’s shape parametersand the reference orientationn0(Θ0, Φ0). The obtained param-eters are independent of the particular reflection (2θ or q) cho-sen, which provides a interesting way of checking the results’consistency.
2.2. Two particular geometries
2.2.1. Uniaxial nematic configuration: In the classical uni-axial nematic geometry, the reference orientation is the meanorientation for the population of nano-stacks. The smallerα,the more crystallites have their orientation alongn(α). The ori-entation distributionf is peaked in 0 and monotically decreas-ing to its minimum f (π/2). An order parameter (de Gennes &Prost, 1993), defined as
S=12
⟨
3 cos2 α − 1⟩
f, (7)
i.e S= π
∫
π
0(3 cos2 α − 1) f (α) sinα dα , (8)
quantifies the overall alignment of the crystallites. ForS = 0,the population is completely isotropic, while forS= 1 all crys-tallites are perfectly aligned. The alignment can also be quan-tified in terms of the root mean square (RMS) widthwf of thedistribution, according to
w2f = 〈α2〉 f = 2π
∫
π
0α2 f (α) sinα dα . (9)
2.2.2. Uniaxial ”anti-nematic” configuration: In the config-uration that we denote ”anti-nematic”, the crystallites have theirdirections on average in a plane perpendicular to the referencedirection. In other words, the stacking planes of the crystallitescontain the reference direction, on average. The distribution fis peaked aroundπ/2, monotically increasing withα from itsminimum valuef (0). By analogy to the nematic description, anorder parameter can be defined as well, according to:
S=⟨
3 cos2(π
2− α
)
− 2⟩
f=⟨
3 sin2 α − 2⟩
f, (10)
i.e S= 2π
∫ π
0
(
3 sin2 α − 2)
f (α) sinα dα , (11)
and an RMS angular width according to:
w2f =
⟨
(π
2− α
)2⟩
f
, (12)
i.e w2f = 2π
∫ π
0
(π
2− α
)2f (α) sinα dα . (13)
2.3. Modelled azimuthal profiles
Fig. 3 shows expected azimuthal profiles, computed fromEq. (6), in the case of a nematic geometry where the distribu-tion f is of the classical Maier-Saupe form observed in uni-axial nematic liquid crystals (Maier & Saupe, 1958; Maier &Saupe, 1959):
f (α) ∝ exp(m cos2 α) . (14)
For a reflection corresponding to a particular value of the devi-ation angle 2θ = 3.29°, two values of the distribution’s angu-lar width wf (15 and 30°), and three different orientations ofthe mean directorn0 (Θ0 = −5, 0 and 5°) have been used.The profiles are normalized to an integral value 1 over thewhole azimuthal range. A profile corresponding toΘ0 = 5°for 2θ = 6.54 is also shown.
Fig. 3 shows clearly how the parameters describing the orien-tational ordering of the crystallites translate into the azimuthaldependence of a diffraction peak’s intensity. The angular widthof the orientation distribution controls the width of the profile’speaks. The azimuthal coordinate of the mean director,Φ0, onlyhas the effect of translating the profile along theφ scale, whileΘ0 is responsible for the curve’s asymmetry with respect to theazimuthφ = Φ0 + 90◦, or, equivalently, the asymmetry of the2D diffractogram with respect to the planexOy (see Fig. 1). Inaddition, the magnitude of this asymmetry depends on the valueof 2θ: if there is asymmetry (i.e, ifΘ0 6= 0), it shall be morepronounced for the higher order peaks of a given reflection.
3. Application to a nematic geometry
3

research papers
3.1. Fluorohectorite, a synthetic smectite clay
Fluorohectorite belongs to the family of smectite (or swelling2:1) clays, whose base structural unit is 1nm-thick phyllosilicateplatelet consisting of two inverted silicate tetrahedral sheets thatshare their apical oxygens with a tetrahedral sheet sandwitchedin between (Velde, 1992). Fluorohectorite has a chemical for-mula per unit cell Xx-(Mg3−xLi x)Si4O10F2. Substitutions of Li+
for Mg2+ in part of the fully occupied octahedral sheet sitesare responsible for a negative surface charge along the platelets.This results here in a large surface charge, 1.2 e−(Kaviratnaet al., 1996) (as opposed to 0.4 e− for the synthetic smec-tite clay laponite), allowing the platelets to stack by sharing anintercalated cation X, for example Na+, Ni2+, Fe3+. The result-ing nano-stacks remain stable in suspension, even at low ionicstrength of the solvent, and are therefore present both in watersolutions, gels (DiMasiet al., 2001) and weakly-hydrated sam-ples (Knudsenet al., 2004).
Wide-angle X-ray scattering of gel (DiMasiet al., 2001)and weakly-hydrated (da Silvaet al., 2002) samples of Na-fluorohectorite (for which X=Na+), have shown that the char-acteristic platelet separation is well defined, and varies step-wise as a function of the surrounding temperature and humidity(da Silvaet al., 2003). Samples are anisotropic, but the widthof the corresponding WAXS peaks allows inferring the typi-cal nano-stack thickness, which is of about 80− 100 platelets.This thickness is significantly larger than thicknesses (. 20platelets) for which asymmetry and irrationality in the(00k)reflections are known to occur (Drits & Tchoubar, 1990), whichmakes the analysis of(00k) peaks in powder diffraction spectraof Na-fluorohectorite relatively easy.
3.2. Dry-pressed samples of Na-fluorohectorite
Dry-pressed samples of Na-fluorohectorite were preparedfrom raw fluorohectorite powder purchased from Corning Inc.(New York). The raw powder was carefully cation-exchangedso as to force the replacement of all intercalated cations byNa+
(Løvoll et al., 2005). The resulting wet gel was then suspendedin deionized water again, and after sufficient stirring time, waterwas expelled by applying a uniaxial load in a hydrostatic press.The resulting dry assembly was then cut in strips of 4mm by47mm.
The resulting samples are anisotropic, with a marked aver-age alignment of the clay crystallites parallel to the horizontalplane (Knudsenet al., 2004), as shown in the two-dimensionalsketch of the sample geometry, in the insert to Fig. 4. A nematicdescription such as that presented in section 2.2.1, with a meandirectorn0 close to the direction of the applied uniaxial load,describes their geometry well.
3.3. Experimental setup
Two-dimensional diffractograms of dry-pressed sampleswere obtained on beamline BM01A at the European Syn-chrotron Radiation Facility (ESRF) in Grenoble (France). Weused a focused beam with energy 17.46 keV corresponding to awavelength 0.71A. The scattering images were recorded usinga two-dimensional MAR345 detector, with a resolution of 2300
pixels across the diameter of the 345mm wide circular detec-tor. The distance between the sample and the detector was cal-ibrated to 375.25mm using a silicon powder standard sample(NBS640b).
Fig. 4 shows a simplified sketch of the experimental geom-etry. The samples were lying with the average nano-stackdirector close to vertical. A sample cell allowing humidity-and temperature- control in the surrounding atmosphere is notshown. A more complete description of the sample environmentcan be found in (Meheustet al., 2005a).
3.4. Image analysis
The center part of a two-dimensional scattering imageobtained from a dry-pressed Na-fluorohectorite sample at a tem-perature of 98°C is shown in Fig. 5(a). The image anisotropyappears clearly, with a much stronger intensity of some ofthe diffraction rings along the vertical direction. Some grainy-looking isotropic rings can also be seen, they are due to impu-rities (mostly mica). In what follows, we infer the orientationdistribution for the clay crystallites from three rings, separately.These rings correspond to the three first orders of the samereflection.
3.4.1. Method: The images were analyzed in the followingway. After finding the image center (incident beam direction),we compute diffraction lines at azimuthal angle valuesφm, vary-ing φm between 0 and 359° by steps of 1°. For a given valueof φm, the diffraction line is obtained by integrating overφ
the image subpart corresponding to values ofφ in the range[φm − δφ/2;φm + δφ/2], whereδφ = 5°. Six of these powderdiffraction profiles are shown in Fig. 6. They exhibit 6 peakscharacteristic of the nano-layered structure of the crystallites:the 3 first orders for the population of crystallites with no waterlayer intercalated (0WL), and the orders 1, 2, and 4 for the pop-ulation of crystallites with one water layer intercalated.At thistemperature, the 1WL state is unstable (da Silvaet al., 2003);it is present in these pictures because the transition between thetwo hydration states is not finished yet. The analysis is carriedout on the peaks 0WL(001), 0WL(002) and 0WL(003), whichare the most intense, and are weakly perturbed by other peaks.The corresponding characteristic length scales are listedin table1; they are in good agreement with previous measurements (daSilva et al., 2002).
For each of the three peaks 0WL(001), 0WL(002) and0WL(003), the peak’s intensity was plotted as a function ofφ,and the obtained profiles were fitted with Eq. (6). The three nor-malized profiles are shown in Fig. 7; they have been translatedvertically for clarity. As a functional form for the orientationdistribution, we chose the Maier-Saupe function (Eq.( 14)). Wealso allowed for a constant backgroundI0 to be accounted for.This resulted in fitting to the profiles a function in the form(using Eq. (6) and (14))
I0 + C exp[
m (sinθ sinΘ0 + cosθ cosΘ0 cos(φ − Φ0))2]
,
(15)with the fitting parametersI0, C, m, Θ0 and Φ0. Note that
4

research papers
Eq. (15) depends on the diffraction peak chosen, as the valuefor the half-deviation angleθ is no parameter for the fit but isdifferent for each of the three profiles. As each of the fit param-eters controls a particular shape aspect of the profiles (seesec-tion 2.3), we can derive estimates for the parametersI0, C, m,Θ0 andΦ0, using a few approximations (see appendix A), anduse these estimates as initial parameters for the fits. The fittingprocedure is fast and the fitted parameters do not depend on theinitial guesses.
Using the fitted model, we then derived the quantities char-acteristic of the orientational ordering in the samples, namelythe order parameterS (Eq. (8)) and the angular RMS widthwf
(Eq. (9)).
3.4.2. Results: The fits are shown in Fig. 7 as solid lines, ontop of the data points. Asφ moves away from the peak valuesΦ0 andΦ0 + π/2, and as the intensity goes down to the noiselevel of the diffraction profiles shown in Fig. 6, the significanceof the intensityI(φ) in terms of orientation distribution of theprofiles is somewhat diluted. Hence, the points in the flat sec-tions outside the peaks in Fig. 7 are little relevant when fittingthe model to the data. We therefore estimate an uncertainty onthe fitted parameters from the fluctuations in the fit parametersobtained by varying the range of data points (between 30 and90 degrees from the peaks) considered for the fit. This uncer-tainty is considerably larger than the statistical error onthe fittedparameters themselves, for a given fit.
For each of the profiles, the fitted parameters and the derivedquantities are shown in table 2. The results obtained from thedifferent orders are consistent with each other within the uncer-tainties, except for the parameterΘ0 where a 0.5°discrepancyexists. This is however small, and the first order profile wasexpected to behave slightly differently from the others as thecorresponding peak is not totally separated from the 1WL(001)peaks (see Fig. 6). This profile also gives a value slightlydifferent for the angular width, but consistent with the otherorders within the error bars. We can thus estimate the aver-age orientation of the nano-stack population to(Θ0, Φ0) =(5.8°±0.5°; 176.3°±0.1°). This value results from a possiblenon-parallelism of the average crystallite orientation from thedirection of the constraint applied during sample preparation,and from a possible misaligment of the sample (a few degreesat most) from the horizontal direction.
4. Application to an ”anti-nematic” configuration
We now apply the technique to data obtained in wide angle X-ray scattering experiments from bundles of Na-fluorohectoriteparticle in silicon oil.
4.1. Electorheological chains of fluorohectorite particles
Fluorohectorite samples were prepared by suspending 1.5 %by weight of clay particles in silicon oil (Rothiterm M150, witha viscosity of 100cSt at 25°C). The hydration state of the parti-cles prior to suspension in the oil was 1WL. When an electricfield above 500 V.mm−1 was applied, the suspended crystal-lites polarize, and the subsequent induced dipoles interact with
each other, leading to aggregation of the clay crystallitesincolumnar bundles (Fossumet al., 2005). This can be seen inthe microscopy picture shown in Fig. 8. These bundles are onaverage parallel to the applied electric field.
4.2. Experimental setup
The orientation of the polarized crystallites inside the bundleswas investigated using synchrotron wide angle X-ray scattering.A top view sketch of the experimental setup is shown in Fig. 9:the suspensions were contained in a sample cell in between twovertical copper electrodes separated by a 2mm gap. A 1 kV elec-tric field was applied between the electrodes. Horizontal bun-dles of polarized particles were observed to form within 20safter the field was switched on, and two-dimensional diffrac-tograms were recorded after formation of the bundles. Theexperiments were performed at the Swiss-Norwegian Beam-lines at ESRF, using the same beam energy and detector as pre-sented in section 3.3.
4.3. Image analysis
Fig. 5(b) displays the center of a scattering image obtainedafter the chains have settled in the electric field. This WAXSdata contains an significant background, with a broad ring dueto diffuse scattering from the oil, but the 1WL(001) peak char-acteristic of the nano-layered structure of the crystallites isclearly visible. It is observed to be much more intense alongthe horizontal direction, which means that the directors ofthecrystallites are on average in a plane perpendicular to the direc-tion of the bundle (Fossumet al., 2005). Furthermore, an axialsymmetry around the horizontal direction perpendicular totheX-ray beam, that is, around the average direction for the bun-dles, is expected. Thus, the antinematic description presentedin paragraph 2.2.2 is well suited to describe the orientationalordering in the chains.
4.3.1. Method: The image analysis was done in the exactsame way as for the nematic geometry studied previously. It iscarried out on the ring corresponding to the first order reflectionfor the 1WL hydration state, as shown by the arrow in Fig. 5(b).The choice of a Maier-Saupe functional form for the orientationdistribution is not only phenomenological here. Indeed, this pre-cise shape is expected in a system of identical induced dipoleswhere alignment by an external field competes with the homo-geneizing entropy (Fossumet al., 2005; Meheustet al., 2005b).
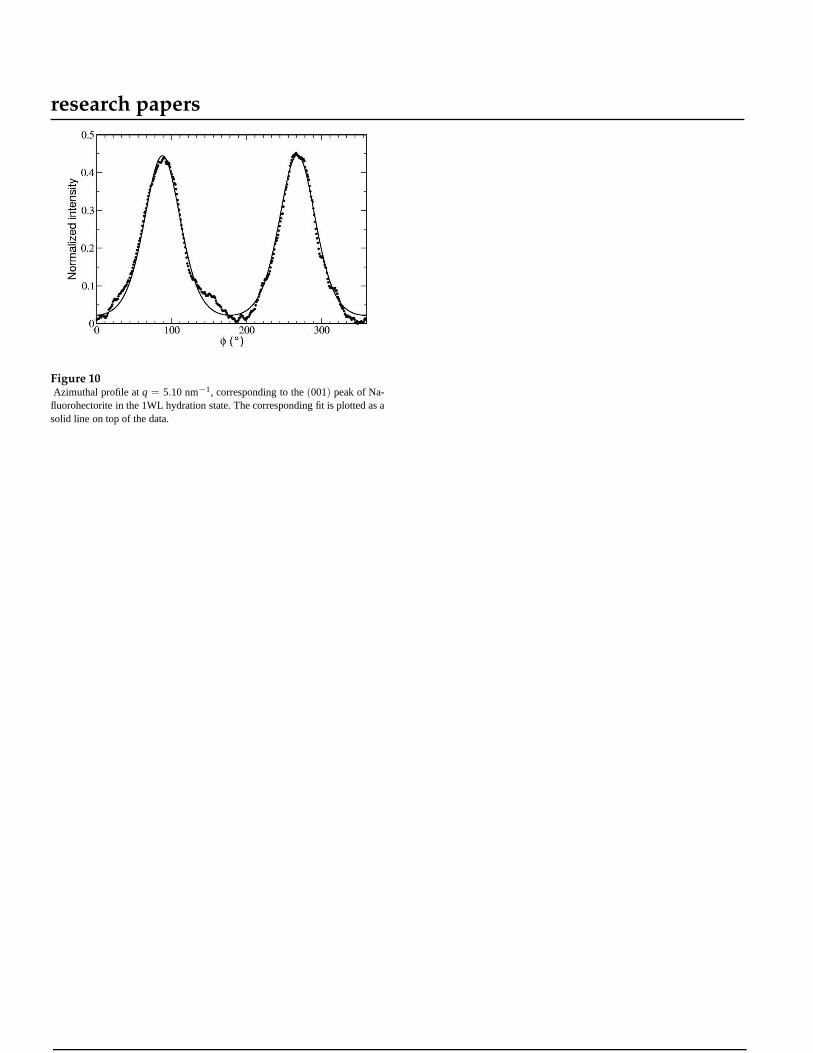
4.3.2. Results: The normalized azimuthal profile extractedfrom the two-dimensional scattering image is shown in Fig. 10,with the corresponding model fitted on the whole range ofazimuthal angles. Despite a significant noise away from thepeak positions, the fit is satisfying. The uncertainties on theangular RMS width and order parameters (see table 2, columnmarked ER) are estimated in the way described in paragraph3.4.2.
5. Discussion
5

research papers
The method reported in this paper displays several strong pointswith respect to a technique based on a one-dimensional record-ing, like the ”rocking curve” technique. The first one is thatitrequires very little data acquisition time, since only one record-ing is necessary. Such a recording can be obtained in a coupleof minutes at a 3rd generation synchrotron source. It thereforeallows in situ measurements of the orientation distribution whilechanging experimental parameters. In the two examples givenhere, it could be the surrounding humidity and the magnitudeof the applied electric field, respectively. The second benefit isthat it allows determination of the reference orientation in thethree dimensions of space. The rocking curve method providesthe inclinationΘ0 of that direction with respect to planes nor-mal to the incident beam in the case whereΦ0 = 0 only. Itdoes not intrinsically provide correct estimates of the anglesΘ0
andΦ0 without prior time-consuming adjustment of the sam-ple azimuthal orientation so as to ensure the conditionΦ0 = 0.Besides, it introduces a bias in the estimated width of the orien-tation distribution in the case whereΦ0 6= 0.
We determine an uncertainty on the inferred ordering param-eters from the dispersion on the fitted values when changingthe range of azimuth angles used for the fit. This uncertaintyistherefore dependent on the noise level of the scattering image,and the process is more trustworthy if the diffraction peakconsidered is more intense. How the accuracy of the methoddepends on the peak’s intensity with respect to the noise levelis not quantified here. How the vicinity of another peak to thepeak used to determinef , as in the 0WL(001) peak in sec-tion 3, modifies the azimuthal profiles, is not known quanti-tatively either, and we propose our method as accurate whenapplied to a reflection whose peak is well separated from otherpeaks. Despite those shortcomings, we think the method hasseveral advantages over the rocking curve method and allowstobetter constrain the description of the orientational order in thesamples, because (i) the reference directionn is determined, (ii)no bias in the angular width is introduced in the case wherendoes not coincide with theOz direction of the laboratory frame,(iii) an uncertainty is determined during the fitting procedure,for each azimuthal profile considered, and (iv) measurementconsistency can be checked by comparing the results obtainedfrom several different azimuthal profiles corresponding tosev-eral different diffraction peaks, on the same single recording.Finally, the method is easily carried out practically, since theonly mathematical procedure involved is the fitting of Eq. 6 toazimuthal profiles.
6. Conclusion and prospects
We have developed a method to determine orientation distribu-tions in anisotropic powders of nano-layered crystallitesfroma single two-dimensional scattering image, in the case whenit only depends on the deviation from a reference direction.The method relies on fitting the proper relation to the azimuthaldecay of a given diffraction peak’s amplitude. It allows determi-nation of the reference direction and of the angular dispersion ofthe distribution. It was applied succesfully to data obtained fromtwo synchrotron X-ray scattering experiments, on two differentsystems of synthetic smectite clay particles where the particle
assemblies exhibit a nematic and anti-nematic ordering, respec-tively. In the first case, the consistency of the inferred quantitieswas checked by comparing the results obtained from three dif-ferent orders of the same reflection.
The method is promising as it is performed on a single two-dimensional recording, and therefore allows in situ determina-tion of orientational ordering in samples when thermodynami-cal conditions are varying. It shall be used in this respect,in thefuture.
Appendix AInitial parameters for the fits
The initial parameters for the fitting function in the form (15)are set to prior estimates of those parameters. The prior esti-mates are obtained from the data profiles using a few approxi-mations, as explained below.
The parameterI (i)0 is first estimated as the minimum value
of the data plot. A running average is performed on the datain order to smooth out the noise and obtain a curve with onlytwo maxima: those corresponding to the peaks. The value forΦ(i)
0 is set to the azimuthal position of the largest peak. Its peakintensity,I1 and that of the second peak,I2 are determined. Thehalf-width at half maximumw of the largest peak is estimatednumerically. The parameterm(i) is then defined fromw by stat-ing:
exp(m(i) cos2 w) =exp(m(i))
2, (16)
which provides the relation
m(i) =ln 2
1− cos2 w. (17)
The maximaI1 andI2 are obtained forφ = Φ0 andφ = Φ0 +π,hence one can state:
I1 − I (i)0 = C exp
(
m(i) cos2(θ − Θ(i)0 ))
I2 − I (i)0 = C exp
(
m(i) cos2(θ + Θ(i)0 )) . (18)
From this, it follows that
ln
(
I1 − I (i)0
I2 − I (i)0
)
= m(i) sin(2θ) sin(2Θ(i)0 ) . (19)
from which an estimate ofΘ0 is obtained:
Θ(i)0 =
12
Asin
[
1m(i) sin(2θ)
ln
(
I1 − y(i)0
I2 − y(i)0
)]
. (20)
Finally, going back to (18), we obtainC(i) in the form
C(i) =I1 − y(i)
0
exp(
m(i) cos2(θ − Θ(i)0 )) . (21)
6

research papers
The staff at the Swiss-Norwegian Beamlines at ESRF isgratefully acknowledged for its support during the synchrotronexperiment. This work was supported by the NorwegianResearch Council (NRC), through the research grants numbers152426/431, 154059/420 and 148865/432.
7

research papers
Table 1Characteristic momentum transfer (in nm−1) and length scales (inA) measuredfor the 0WL diffraction peaks from dry-pressed samples of Na-fluorohectorite.”Dry” denotes the dry-pressed Na-fluorohectorite samples,while ”ER” denotesthe electro-rheological bundles of Na-fluorohectorite particles.
Reflection 0WL(001) OWL(002) OWL(003)q 6.50± 0.03 13.02± 0.03 19.57± 0.03d 9.67± 0.04 9.65± 0.03 9.63± 0.03
Table 2Values obtained for the fit parametersm, Θ0 andΦ0, and for the angular widthwf and order parameterS.
Profile Dry (001) Dry (002) Dry (003) ER (001)m 10.45± 0.06 10.21± 0.27 10.21± 0.13 3.10± 0.23wf 19.10± 0.07 19.38± 0.33 19.37± 0.16 24.48± 0.50S 0.85± 0.01 0.85± 0.01 0.84± 0.01 0.56± 0.02
Θ0 6.12± 0.04 5.57± 0.10 5.87± 0.05 −1.64± 0.05Φ0 176.37± 0.01 176.32± 0.01 176.37± 0.02 267.74± 0.02
Figure 1In the fixed frame(x, y, z) attached to the laboratory (withx parallel to the inci-dent beam), the angular direction of the diffracted beam, denoted by pointM inthe detector planeyO′z, is defined by the deviation angle 2θ and the azimuthalangleφ. The area painted in light gray denotes the plane containingthe incidentand diffracted beams; it is normal to theyOz plane and makes an angleφ withthezOx plane. The area painted in dark gray also denotes a plane normal to theto theyOz plane and that makes an angleΦ with the zOx plane. It is used todefine the orientation of the directorn of a given crystallite with respect to thefixed frame, according to the anglesΘ andΦ.
(a) (b)
Figure 2(a) The condition of specular reflection on the Bragg planes requests that
Θ = θ, as sketched here in thexOu plane. (b) The thick curve is that describedon the unit sphere by the end of vectorn (director of the scatterer) as theazimuthal position of the diffracted beam,φ, varies between 0 andπ/2. Here thedeviation angle 2θ corresponds to the Bragg reflexion (002) on a nano-layeredNa-Fluorohectorite particle in the hydration state 1WL, with λ = 0.71 A.
Figure 3Computed profiles describing how the intensity of a given diffraction peak (i,e,at a given deviation angle 2θ) depends on the azimuthal angle for a popula-tion of crystallites with a nematic orientational ordering. The computation wasdone for various values of the orientation(Θ0, Φ0) of the main director withrespect to the fixed frame of the laboratory, and of the 2D RMS width, wf ,of the nematic angular distribution of the scatterers’ directors. Two values ofthe deviation angle, 2θ = 6.58°and 3.29°, were used, which means that twodiffraction peaks corresponding to two different orders ofthe same reflection,were used.
Figure 4Side view sketch of the experimental scattering geometry used to scatter X-rayby dry-pressed fluorohectorite samples. The insert shows a two-dimensional cutof the sample with the nano-layered crystallites lying on average aligned alonga plane close to horizontal.
8

research papers
(a) (b)
Figure 5Center part of two-dimensional scattering images obtainedfrom the anisotropicpowders of clay nano-stacks. The anisotropic rings used to infer the orientationdistributions of the crystallites are denoted by arrows. (a) Picture obtained fromdry-pressed samples. The camera length was 375 mm. (b) Picture from elec-trorheological chains of crystallites in oil. The camera length was 376 mm. Theanisotropic ring in the center of (b) is the(001) ring for the nano-stack structurein the 1WL hydration state. Its anisotropy is orthogonal to that observed in (a).The image magnification is 1.5 with respect to (a). The broad peak outside the(001) ring is due to diffuse scattering from the silicon oil.
Figure 6Powder diffraction profiles recorded along different azimuthal directions on the2D detector, with a dry-pressed sample atT = 97.7°C. Several peaks character-istic of the nano-layered structure of the crystallites arevisible. Their intensitydecreases dramatatically asφ increases due to the dropdown of the number ofcrystallites that meet the Bragg condition at these angles.
Figure 7Azimuthal profiles observed from the scattering of dry-pressed samples at threevalues ofq corresponding to the three first orders of reflection by the populationof crystallites in the 1WL hydration state. The profiles havebeen normalizedand translated vertically for clarity. The fits according toEq. (15) are shown insolid lines on the symbol plots for the data.
Figure 8Close view of a chain formed under the application of a strongelectric field
by Na-fluorohectorite crystallites suspended in silicon oil. The original colorimage has been filtered. The gap between the electrodes, whose boundaries areshown by two vertical bold lines on the sides of the picture, is 2 mm.
Figure 9Top view sketch of the experimental scattering geometry used to scatter X-rayby electrorheological chains of Na-fluorohectorite crystallites. The electrodesare vertical, and the chains of aggregated crystallites along a direction which isclose to perpendicular to the electrodes. The disorder in the chains is exagger-ated in this sketch.
9
research papers
Figure 10Azimuthal profile atq = 5.10 nm−1, corresponding to the(001) peak of Na-fluorohectorite in the 1WL hydration state. The corresponding fit is plotted as asolid line on top of the data.
10

research papers
References
Bunge, H.-J. (1993).Texture Analysis in Materials Science. CuvillierVerlag, Gottingen, Germany.
de Courville, J., Tchoubar, D. & Tchoubar, C. (1979).J. Appl. Cryst.12, 332–338.
da Silva, G. J., Fossum, J. O. & DiMasi, E. (2002).Phys. Rev. E, 66(1),011303.
DiMasi, E., Fossum, J. O., Gog, T. & Venkataraman, C. (2001).Phys.Rev. E, 64, 061704.
Drits, V. A. & Tchoubar, C. (1990).X-Ray Diffraction by Disor-dered Lamellar Structures, chap. Chapter 2, pp. 40–42. Springer-Verlag.
Fossum, J. O., Meheust, Y., Parmar, K. P. S., Knudsen, K. D. &Maløy, K. J. (2005). Intercalation-enhanced electric polarizationand chain formation of nano-layered particles. Preprint submit-ted.
de Gennes, P. G. & Prost, J. (1993).The Physics of Liquid Crystals,chap. 2.1, pp. 41,42. Oxford Science Publications, 2nd ed.
Guntert, O. J. & Cvikevich, S. (1964).Carbon, 1, 309–313.Ischia, G., Wenk, H.-R., Lutterotti, L. & Berberich, F. (2005). J. Appl.
Cryst. 38, 377–380.Kaviratna, P. D., Pinnavaia, T. J. & Schroeder, P. A. (1996).J. Phys.
Chem. Solids, 57, 1897–1906.Knudsen, K. D., Fossum, J. O., Helgesen, G. & Haakestad, M. W.
(2004).Physica B, 352(1-4), 247–258.Lasocha, W. & Schenk, H. (1997).J. Appl. Cryst.30, 561–564.
Løvoll, G., Sandnes, B., Meheust, Y., da Silva, G. J., Mundim, M. S. P.,Droppa, R. & d. M. Fonseca, D. (2005).PHYSICA B. Accepted.
Maier, W. & Saupe, A. (1958).Naturforsch. A13, 564.Maier, W. & Saupe, A. (1959).Naturforsch. A14, 882.Meheust, Y., Fossum, J. O., Knudsen, K. D., Maløy, K. J. & Helge-
sen, G. (2005a). Mesostructural changes in a clay intercalationcompound during hydration transitions. Preprint submitted.
Meheust, Y., Parmar, K., Fossum, J. O., d. Miranda Fonseca,D., Knud-sen, G. & Maløy, K. J. (2005b). Orientational ordering insideelectrorheological chains of nano-silicate particles in silicon oil– A WAXS study. Preprint to be submitted.
Plancon, A. (1980).J. App. Cryst.13, 524–528.Puig-Molina, A., Wenk, H.-R., Berberich, F. & Graafsma, H. (2003).
Z. Metallkd. 94, 1199–1205.da Silva, G. J., Fossum, J., DiMasi, E. & Maløy, K. J. (2003).Phys.
Rev. B, 67, 094114.Taylor, R. M. & Norrish, K. (1966).Clay Minerals, 6, 127–141.Velde, B. (ed.) (1992).Origin and Mineralogy of Clays. Chapman and
Hall.Wada, N., Hines, D. R. & Ahrenkiel, S. P. (1990).Phys. Rev. B, 41(18),
12895–12901.Wenk, H.-R. (ed.) (1985).Preferred Orientation in Deformed Metals
and Rocks: An Introduction to Modern Texture Analysis. Aca-demic Press, Inc., London.
Wenk, H.-R. & Grigull, S. (2003).J. Appl. Cryst.36, 1040–1049.Wessels, T., Baerlocher, C. & McCusker, L. B. (1999).Science, 284,
477.
11