Inference of Missing ICD 9 Codes Using Text Mining and Nearest Neighbor Techniques
10
Inference of Missing ICD 9 Codes Using Text Mining and Nearest Neighbor Techniques Madhav Erraguntla KBSI [email protected] Belita Gopal KBSI bgopal @kbsi.com Satheesh Ramachandran KBSI sramachandran @kbsi.com Richard Mayer KBSI [email protected] Abstract Missing data is a common characteristic of many databases. In electronic medical records, missing data in fields like ICD 9 (International Classification of Diseases) [1] impact the effective analysis of medical results, medical procedures, environmental conditions, and demographics. The accurate labeling of diseases in medical records is critical to all types of epidemiological analyses that leverage health system data. Methods that address this issue in health management systems would significantly enhance the data’s potential in knowledge discovery applications. This paper describes the algorithms we developed to handle missing ICD 9 codes in medical datasets. Our approach involved developing a prediction model for the ICD 9 codes based on other associated attributes like medical diagnosis, medical remarks, and patient statements. Text mining was performed on this unstructured data to extract key concepts in these fields, and nearest neighborhood based techniques were used to predict the missing ICD 9 codes [2, 3]. 1. Introduction 1.1. Missing data problem in medical records Understanding and characterizing occupational injury risk phenomena are important steps in achieving the DoD’s directive to protect its personnel from accidental death, injury, and illness caused by hazardous occupational or environmental exposures, and to eliminate mishaps, deaths, injuries, and illnesses by applying suitable risk management strategies (DoD Instruction # 6055.05, November 11, 2008) [4]. Once the risk is properly characterized, the application of suitable risk management strategies should lead to significant reductions in all mishaps, injuries, and illnesses. To achieve this goal, in the TATRC funded Environment, Epidemiology, and Etiology Surveillance and Analysis Toolkit (E3SAT) project [5, 6], we collaborated with Hill Air Force Base (AFB) and obtained occupational health and safety administration (OSHA) data from the DoD. The focus of our analysis is in developing statistical models for characterizing risk for certain injury types: e.g., hearing loss injuries, back injuries, and carpal tunnel injuries. A critical need for the analysis is accurately identifying the injuries that are recorded within the dataset. Within the dataset, there are a number of indicators related to injury type, and each of these types has their own challenges regarding the accurate capture of the injury in the dataset: • A - Through ICD 9 coding, the most accurate classification mechanism; however, this field is not fully populated and is missing in 30% of records. • B - Through a coarse “body part” classification, which specifies the location of the injury (such as wrist, back, etc.); this is fairly well populated and complete but is not as clinically granular as the ICD 9 classification system. • C - Patient and medical statements, which are very revealing with respect to the nature and cause of injury, but are not directly useable without using complex text mining and natural language processing methods. The most accurate and unambiguous diagnosis information is the ICD 9 code. But, since this field is missing in 30% of the data, we had to develop techniques for inferring missing data using other relevant information in the record. 1.2. Literature review Missing data is a common phenomenon in most databases, and researchers must address it in some form in a variety of application domains [7, 8, 9, 10]. The reasons for missing data can range from data not being available or known, data that is too expensive or burdensome to collect, data that is incompatible with a particular database design, and data that is not entered properly or transmitted properly to list a few common causes. Missing data is very common in the medical domain and affects demographic data (race,
Transcript of Inference of Missing ICD 9 Codes Using Text Mining and Nearest Neighbor Techniques
Inference of Missing ICD 9 Codes Using Text Mining and Nearest Neighbor Techniques
Madhav Erraguntla
KBSI [email protected]
Belita Gopal KBSI
bgopal @kbsi.com
Satheesh Ramachandran KBSI
sramachandran @kbsi.com
Richard Mayer KBSI
Abstract
Missing data is a common characteristic of many databases. In electronic medical records, missing data in fields like ICD 9 (International Classification of Diseases) [1] impact the effective analysis of medical results, medical procedures, environmental conditions, and demographics. The accurate labeling of diseases in medical records is critical to all types of epidemiological analyses that leverage health system data. Methods that address this issue in health management systems would significantly enhance the data’s potential in knowledge discovery applications. This paper describes the algorithms we developed to handle missing ICD 9 codes in medical datasets. Our approach involved developing a prediction model for the ICD 9 codes based on other associated attributes like medical diagnosis, medical remarks, and patient statements. Text mining was performed on this unstructured data to extract key concepts in these fields, and nearest neighborhood based techniques were used to predict the missing ICD 9 codes [2, 3].
1. Introduction
1.1. Missing data problem in medical records Understanding and characterizing occupational
injury risk phenomena are important steps in achieving the DoD’s directive to protect its personnel from accidental death, injury, and illness caused by hazardous occupational or environmental exposures, and to eliminate mishaps, deaths, injuries, and illnesses by applying suitable risk management strategies (DoD Instruction # 6055.05, November 11, 2008) [4]. Once the risk is properly characterized, the application of suitable risk management strategies should lead to significant reductions in all mishaps, injuries, and illnesses. To achieve this goal, in the TATRC funded Environment, Epidemiology, and Etiology Surveillance and Analysis Toolkit (E3SAT) project [5, 6], we collaborated with Hill Air Force
Base (AFB) and obtained occupational health and safety administration (OSHA) data from the DoD. The focus of our analysis is in developing statistical models for characterizing risk for certain injury types: e.g., hearing loss injuries, back injuries, and carpal tunnel injuries. A critical need for the analysis is accurately identifying the injuries that are recorded within the dataset. Within the dataset, there are a number of indicators related to injury type, and each of these types has their own challenges regarding the accurate capture of the injury in the dataset: • A - Through ICD 9 coding, the most accurate
classification mechanism; however, this field is not fully populated and is missing in 30% of records.
• B - Through a coarse “body part” classification, which specifies the location of the injury (such as wrist, back, etc.); this is fairly well populated and complete but is not as clinically granular as the ICD 9 classification system.
• C - Patient and medical statements, which are very revealing with respect to the nature and cause of injury, but are not directly useable without using complex text mining and natural language processing methods. The most accurate and unambiguous diagnosis
information is the ICD 9 code. But, since this field is missing in 30% of the data, we had to develop techniques for inferring missing data using other relevant information in the record.
1.2. Literature review
Missing data is a common phenomenon in most
databases, and researchers must address it in some form in a variety of application domains [7, 8, 9, 10]. The reasons for missing data can range from data not being available or known, data that is too expensive or burdensome to collect, data that is incompatible with a particular database design, and data that is not entered properly or transmitted properly to list a few common causes. Missing data is very common in the medical domain and affects demographic data (race,
ethnicity), vital statistics (pulse, B.P., different test results), diagnosis, and treatments. Even though standardized codes were developed for diagnosis and procedure codes [1], it is very common to see missing ICD 9 codes in operation medical databases.
Approaches to dealing with missing values also range from ignoring the record, treating the missing value as a separate class, or infering values based on average or function fitting (regression) and maximum likelihood estimators [7, 8, 9, 10, 11]. [12] presents missing data in longitudinal studies and some approaches for addressing it. An important issue to consider is whether the data is missing at random or whether the missing phenomenon is associated with the data value. For example, are extremely low or high income people more likely not to report incomes? The results generated by any algorithm used to account for missing data can vary drastically based on the data and the reasons for the missing data: there is no universal, generic approach for addressing missing data. A solution has to be developed for the specific dataset based on the nature of the data and the reasons the data is missing. We present an innovative approach based on text mining and nearest neighbor algorithms for handling missing ICD 9 codes in electronic medical records.
The relevance of better ICD coding for drawing meaningful patterns from the dataset has been described in other research [13]. Our approach to inferring the missing ICD codes involves using text and data mining with both structured and unstructured features drawn from patient statements/medical remarks. Our approach and validation results are presented in this paper. Espino and Wagner present an approach for determining disease cohorts when ICD 9 codes are missing [14]. Similar to our approach, they use other associated data like medications and lab test results to account for missing ICD 9 codes and for determining cohorts. Their approach requires development of a feature set (template) by clinicians and domain experts for each disease cohort (e.g., the number of abnormal hemoglobin A1C tests, or the number of anti-diabetic medications and abnormal blood glucose tests for diabetes cohort identification). Our approach does not require the development of such a feature set. We attempt to identify the most closely matching ICD 9 code using the unstructured and structured content in other associated fields. Our approach is generic and is applicable to any ICD 9 code, whereas the approach presented by Kandula et al. [14] requires developing a feature set (template) for each focus disease cohort. The algorithms and software for text mining and inferring missing ICD 9 codes were developed by KBSI.
2. Proposed method The data set used for the study is the occupational
injury and illness data from the DoD. The data set consists of incidences (key field of injury date and patient Unique ID), and associated with the incidences are “incidence related visits” (visit date). As a consequence, an injury could be a single or multiple-event visit, but the majority (about 90%) of the injuries are single event visits. Each of the visits related to a particular injury could have multiple ICD 9s (symptoms and manifestations of the injury). In this paper, we also refer to a visit as either a record or an entity. The other piece of information relates to the patient table, which stores the demographics of each patient including the patient job codes. Each work environment is characterized through a collection of PEGs, and a particular occupational history implies exposure to a set of PEGs. Each patient is tracked in terms of PEG codes: a patient enters and exits with a PEG (tracked through PEG begin and end dates), and each of the PEG codes has associated hazards. Thus, the PEG exposure history encapsulates the exposure of patients to various hazards. The goal of our efforts in the E3SAT project is to characterize how the PEG exposure history affects the injuries and illnesses of a patient. This paper presents our approach to handling missing ICD 9 codes in the data.
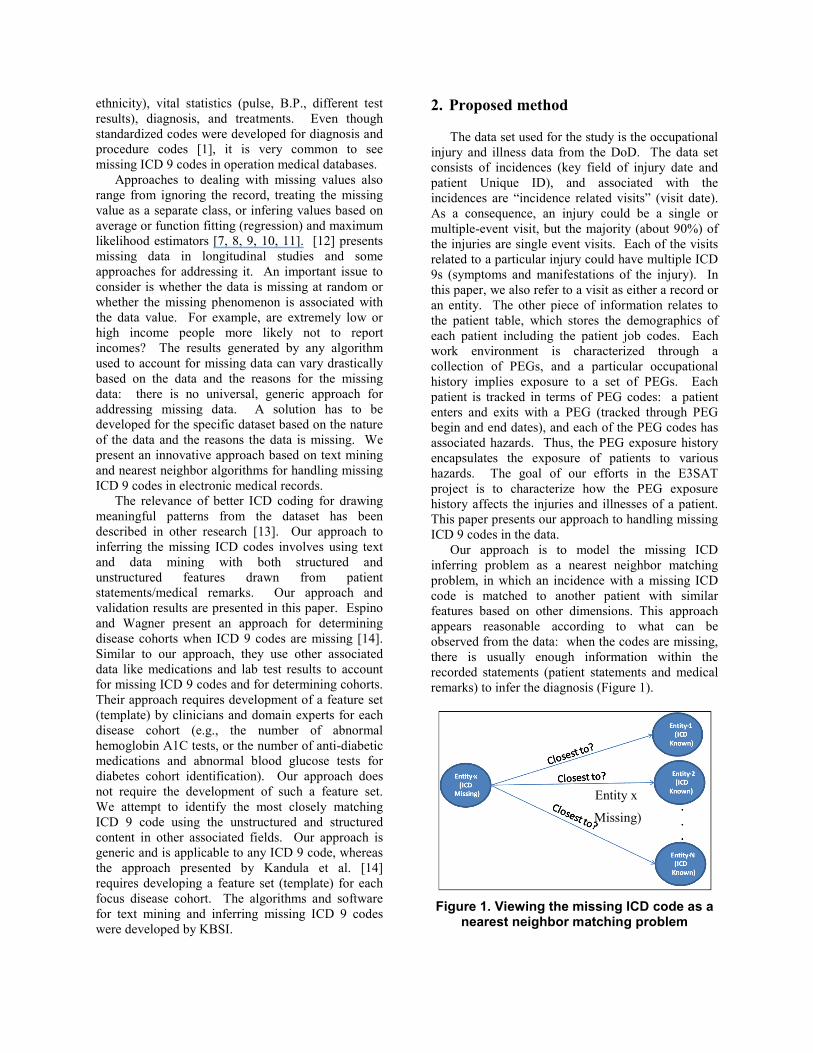
Our approach is to model the missing ICD inferring problem as a nearest neighbor matching problem, in which an incidence with a missing ICD code is matched to another patient with similar features based on other dimensions. This approach appears reasonable according to what can be observed from the data: when the codes are missing, there is usually enough information within the recorded statements (patient statements and medical remarks) to infer the diagnosis (Figure 1).
Figure 1. Viewing the missing ICD code as a
nearest neighbor matching problem
Missing)
Entity x
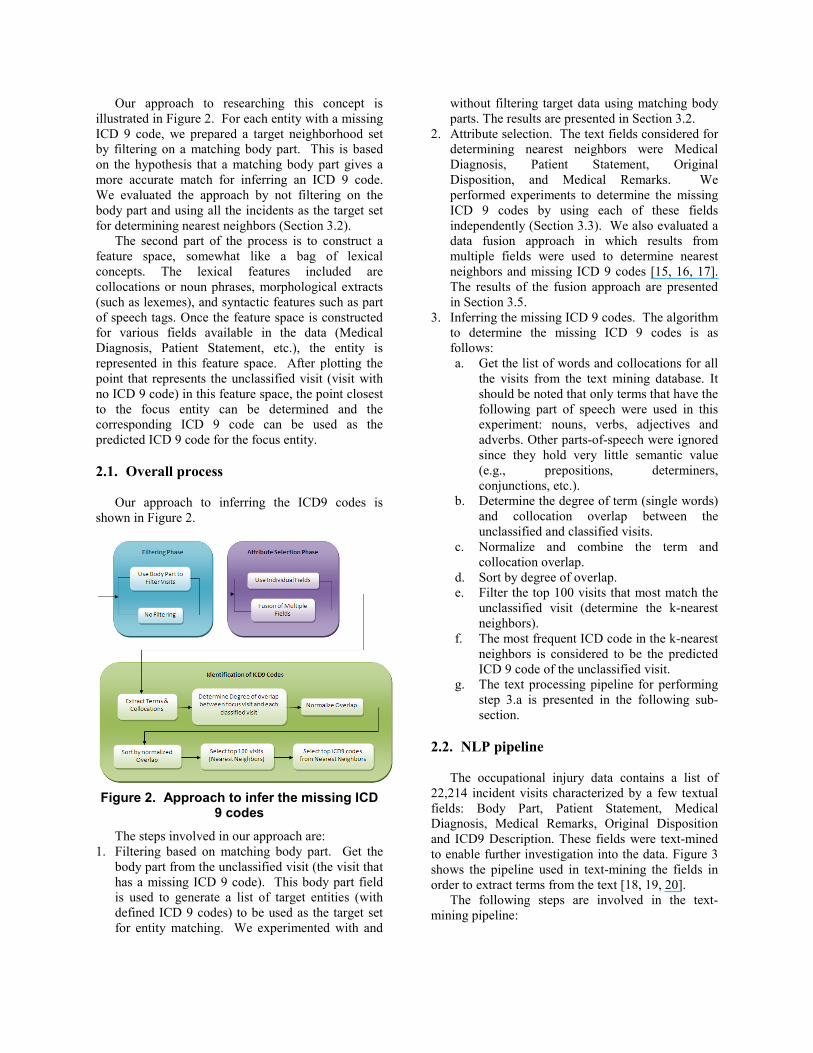
Our approach to researching this concept is illustrated in Figure 2. For each entity with a missing ICD 9 code, we prepared a target neighborhood set by filtering on a matching body part. This is based on the hypothesis that a matching body part gives a more accurate match for inferring an ICD 9 code. We evaluated the approach by not filtering on the body part and using all the incidents as the target set for determining nearest neighbors (Section 3.2).
The second part of the process is to construct a feature space, somewhat like a bag of lexical concepts. The lexical features included are collocations or noun phrases, morphological extracts (such as lexemes), and syntactic features such as part of speech tags. Once the feature space is constructed for various fields available in the data (Medical Diagnosis, Patient Statement, etc.), the entity is represented in this feature space. After plotting the point that represents the unclassified visit (visit with no ICD 9 code) in this feature space, the point closest to the focus entity can be determined and the corresponding ICD 9 code can be used as the predicted ICD 9 code for the focus entity.
2.1. Overall process
Our approach to inferring the ICD9 codes is
shown in Figure 2.
Figure 2. Approach to infer the missing ICD
9 codes
The steps involved in our approach are: 1. Filtering based on matching body part. Get the
body part from the unclassified visit (the visit that has a missing ICD 9 code). This body part field is used to generate a list of target entities (with defined ICD 9 codes) to be used as the target set for entity matching. We experimented with and
without filtering target data using matching body parts. The results are presented in Section 3.2.
2. Attribute selection. The text fields considered for determining nearest neighbors were Medical Diagnosis, Patient Statement, Original Disposition, and Medical Remarks. We performed experiments to determine the missing ICD 9 codes by using each of these fields independently (Section 3.3). We also evaluated a data fusion approach in which results from multiple fields were used to determine nearest neighbors and missing ICD 9 codes [15, 16, 17]. The results of the fusion approach are presented in Section 3.5.
3. Inferring the missing ICD 9 codes. The algorithm to determine the missing ICD 9 codes is as follows: a. Get the list of words and collocations for all
the visits from the text mining database. It should be noted that only terms that have the following part of speech were used in this experiment: nouns, verbs, adjectives and adverbs. Other parts-of-speech were ignored since they hold very little semantic value (e.g., prepositions, determiners, conjunctions, etc.).
b. Determine the degree of term (single words) and collocation overlap between the unclassified and classified visits.
c. Normalize and combine the term and collocation overlap.
d. Sort by degree of overlap. e. Filter the top 100 visits that most match the
unclassified visit (determine the k-nearest neighbors).
f. The most frequent ICD code in the k-nearest neighbors is considered to be the predicted ICD 9 code of the unclassified visit.
g. The text processing pipeline for performing step 3.a is presented in the following sub-section.
2.2. NLP pipeline
The occupational injury data contains a list of
22,214 incident visits characterized by a few textual fields: Body Part, Patient Statement, Medical Diagnosis, Medical Remarks, Original Disposition and ICD9 Description. These fields were text-mined to enable further investigation into the data. Figure 3 shows the pipeline used in text-mining the fields in order to extract terms from the text [18, 19, 20].
The following steps are involved in the text-mining pipeline:

1. Each corpus (record or visit) is converted into a pre-defined XML format.
2. Tokenization: The text is broken into paragraphs, sentences and tokens.
3. Part of speech tagging of each token. 4. Statistics like word counts are generated. 5. Collocations are extracted based on some
patterns. One example pattern is noun-preposition-noun.
6. The results of text-mining are finally saved to a database.
2.3. Fusion of results from different fields
Several text fields in the Occupational Health data
were considered in this research, including Medical Diagnosis, Patient Statement, Original Disposition, and Medical Remarks. Each of these fields generated an overlapping metric between the unclassified visit and the classified ones. Next, all the overlapping metrics were combined to take into account the importance of each field on the inference of the missing ICD 9 codes. A single fused metric was generated at the end of the pipeline. The entities were sorted based on the frequency of the ICD 9 codes, and the ICD 9 code with the highest score is considered the best fit for the unclassified visit.
3. Results
3.1. Validation approach
The approach was validated by measuring the
accuracy of ICD 9 predictions for 500 records in the database. The sample visits chosen did not have null values for the four text fields considered. It should be noted that for each prediction there are 15651 diagnosis ICD 9 codes to choose from. Getting the
exact match is difficult given the large number of target ICD 9 codes. Therefore, we decided to consider the top five ICD 9 codes proposed by the pipeline when evaluating the accuracy of the proposed approach. Figure 4 shows a sample of the accuracy of the system when entity matching was performed using the Medical Diagnosis field. The accuracy for the first bar is the percentage of visits that were correctly classified by the system when only the top predicted ICD 9 code is considered. Similarly, the last bar shows the accuracy of the system if the actual ICD 9 code matches with any of the top five predicted ICD 9 codes. The idea is that if the system can propose a short list of five ICD 9 codes to choose from, a subject matter expert could easily go through the list and identify the most appropriate ICD 9 code for the visit.
Figure 4. Model accuracy of top 5 ICD9 predictions based on medical diagnosis
The following sections present the model accuracy results for (1) not filtering the neighboring entities based on body part, (2) comparing the results of different text fields, (3) the effect of adjectives and adverbs, and (4) the fusion of results from different fields.
Figure 3. Pipeline showing the processes involved in text-mining
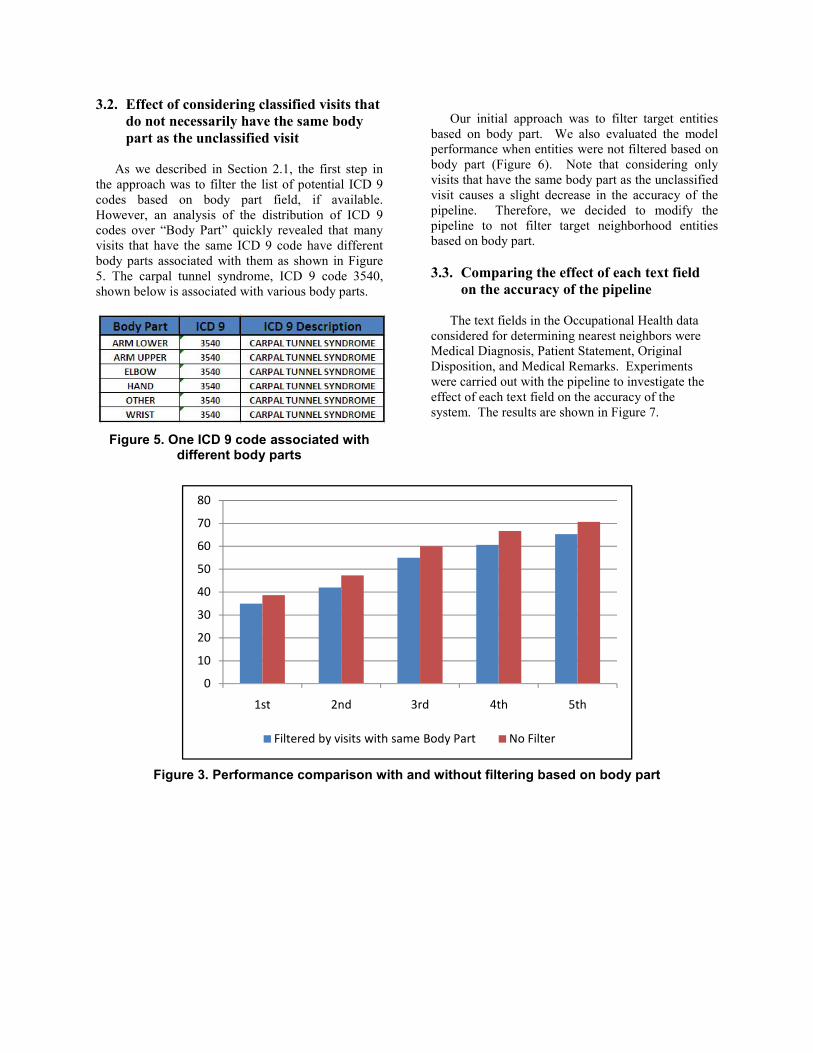
3.2. Effect of considering classified visits that do not necessarily have the same body part as the unclassified visit
As we described in Section 2.1, the first step in
the approach was to filter the list of potential ICD 9 codes based on body part field, if available. However, an analysis of the distribution of ICD 9 codes over “Body Part” quickly revealed that many visits that have the same ICD 9 code have different body parts associated with them as shown in Figure 5. The carpal tunnel syndrome, ICD 9 code 3540, shown below is associated with various body parts.
Figure 5. One ICD 9 code associated with
different body parts
Our initial approach was to filter target entities
based on body part. We also evaluated the model performance when entities were not filtered based on body part (Figure 6). Note that considering only visits that have the same body part as the unclassified visit causes a slight decrease in the accuracy of the pipeline. Therefore, we decided to modify the pipeline to not filter target neighborhood entities based on body part.
3.3. Comparing the effect of each text field
on the accuracy of the pipeline The text fields in the Occupational Health data
considered for determining nearest neighbors were Medical Diagnosis, Patient Statement, Original Disposition, and Medical Remarks. Experiments were carried out with the pipeline to investigate the effect of each text field on the accuracy of the system. The results are shown in Figure 7.
Figure 3. Performance comparison with and without filtering based on body part
0
10
20
30
40
50
60
70
80
1st 2nd 3rd 4th 5th
Filtered by visits with same Body Part No Filter
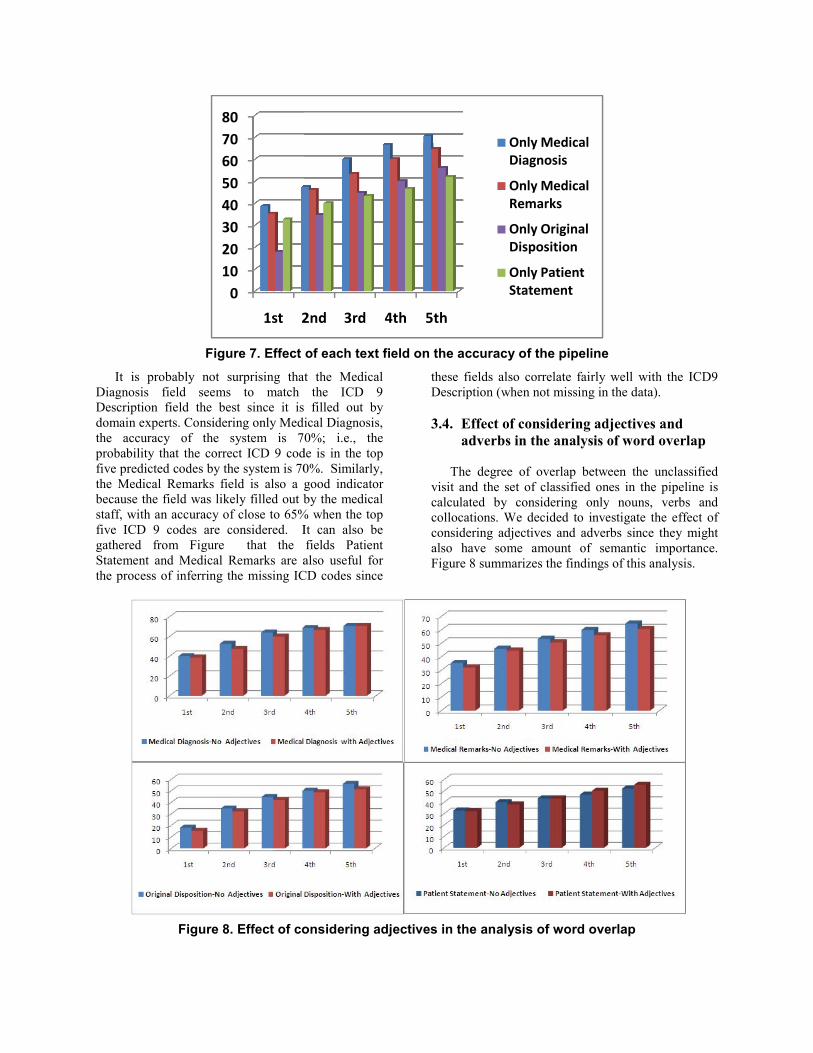
Figure 7. Effect
It is probably not surprising thatDiagnosis field seems to match Description field the best since it is domain experts. Considering only Medithe accuracy of the system is 7probability that the correct ICD 9 codfive predicted codes by the system is 70the Medical Remarks field is also a gbecause the field was likely filled out bstaff, with an accuracy of close to 65%five ICD 9 codes are considered. Igathered from Figure that the Statement and Medical Remarks are athe process of inferring the missing IC
Figure 8. Effect of co
01020304050607080
1st 2
of each text field on the accuracy of the pipeline
t the Medical the ICD 9
filled out by ical Diagnosis, 0%; i.e., the
de is in the top 0%. Similarly, good indicator by the medical
% when the top It can also be fields Patient also useful for
CD codes since
these fields also correlate fairly Description (when not missing in
3.4. Effect of considering ad
adverbs in the analysis o The degree of overlap betwe
visit and the set of classified oncalculated by considering onlycollocations. We decided to inveconsidering adjectives and adveralso have some amount of seFigure 8 summarizes the findings
onsidering adjectives in the analysis of word ove
2nd 3rd 4th 5th
Only Medical Diagnosis
Only Medical Remarks
Only Original Disposition
Only Patient Statement
well with the ICD9 the data).
djectives and of word overlap
een the unclassified nes in the pipeline is y nouns, verbs and estigate the effect of rbs since they might emantic importance. s of this analysis.
erlap
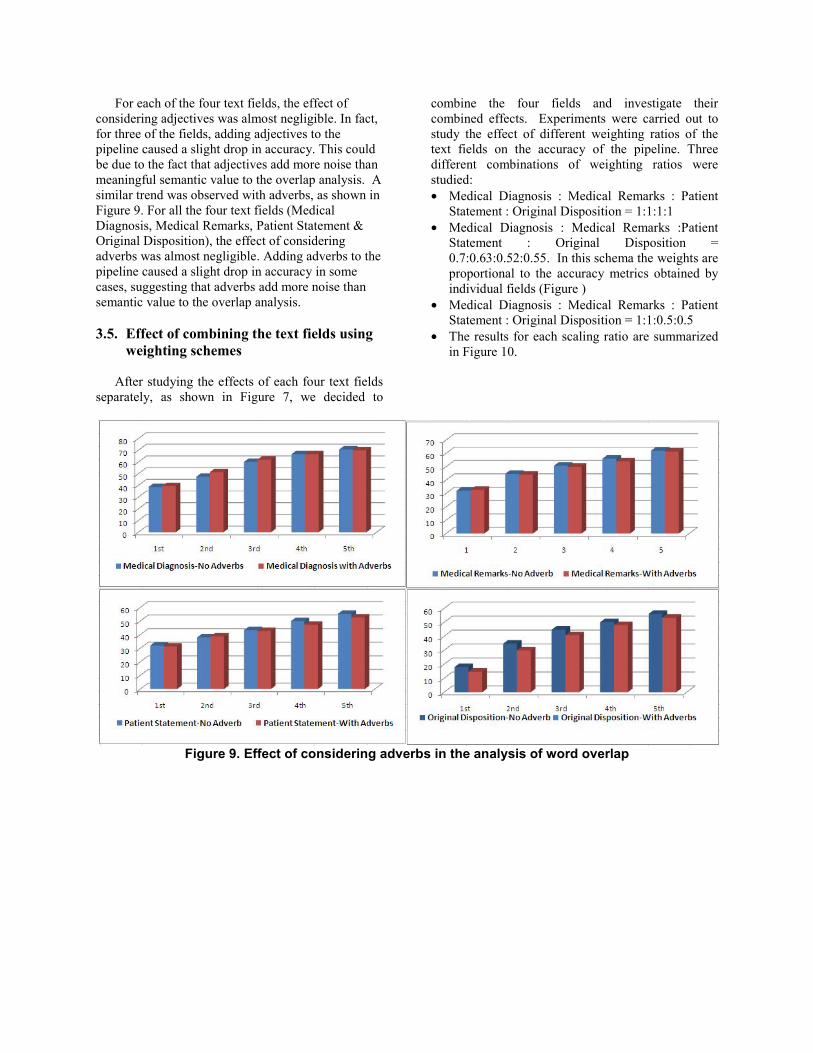
For each of the four text fields, the effect of considering adjectives was almost negligible. In fact, for three of the fields, adding adjectives to the pipeline caused a slight drop in accuracy. This could be due to the fact that adjectives add more noise than meaningful semantic value to the overlap analysis. A similar trend was observed with adverbs, as shown in Figure 9. For all the four text fields (Medical Diagnosis, Medical Remarks, Patient Statement & Original Disposition), the effect of considering adverbs was almost negligible. Adding adverbs to the pipeline caused a slight drop in accuracy in some cases, suggesting that adverbs add more noise than semantic value to the overlap analysis.
3.5. Effect of combining the text fields using
weighting schemes After studying the effects of each four text fields
separately, as shown in Figure 7, we decided to
combine the four fields and investigate their combined effects. Experiments were carried out to study the effect of different weighting ratios of the text fields on the accuracy of the pipeline. Three different combinations of weighting ratios were studied: • Medical Diagnosis : Medical Remarks : Patient
Statement : Original Disposition = 1:1:1:1 • Medical Diagnosis : Medical Remarks :Patient
Statement : Original Disposition = 0.7:0.63:0.52:0.55. In this schema the weights are proportional to the accuracy metrics obtained by individual fields (Figure )
• Medical Diagnosis : Medical Remarks : Patient Statement : Original Disposition = 1:1:0.5:0.5
• The results for each scaling ratio are summarized in Figure 10.
Figure 9. Effect of considering adverbs in the analysis of word overlap
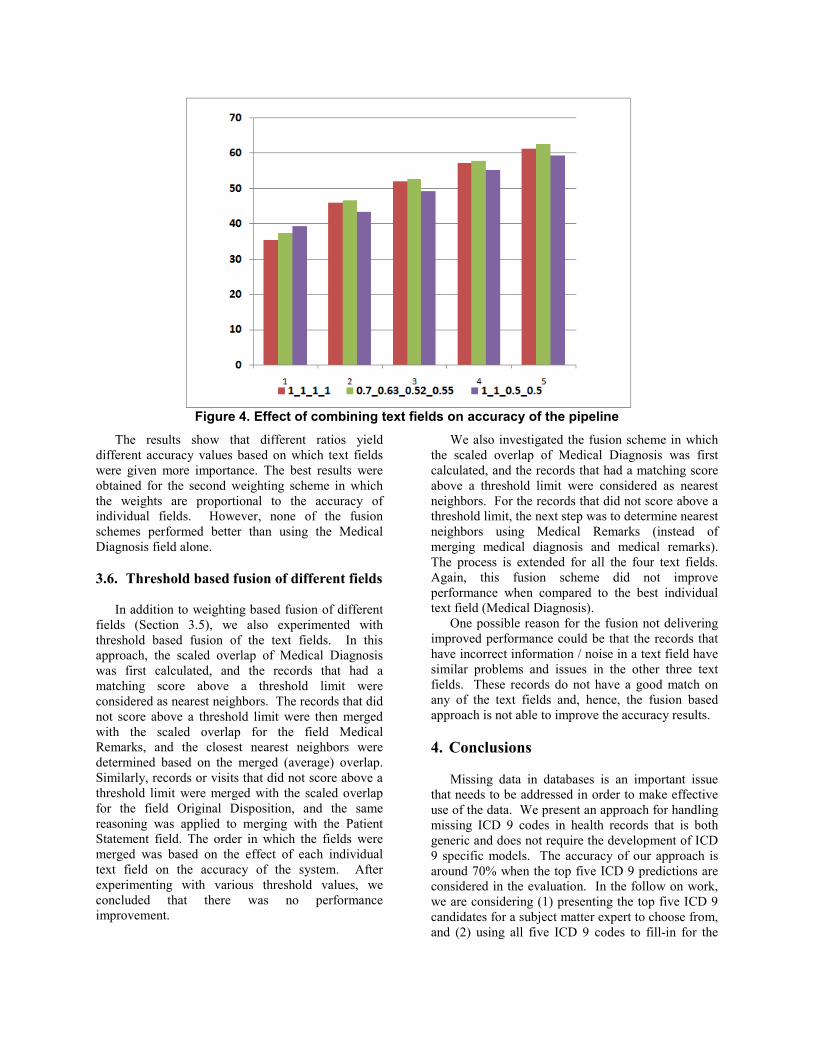
Figure 4. Effect of combining text fields on accuracy of the pipeline
The results show that different ratios yield different accuracy values based on which text fields were given more importance. The best results were obtained for the second weighting scheme in which the weights are proportional to the accuracy of individual fields. However, none of the fusion schemes performed better than using the Medical Diagnosis field alone.
3.6. Threshold based fusion of different fields
In addition to weighting based fusion of different
fields (Section 3.5), we also experimented with threshold based fusion of the text fields. In this approach, the scaled overlap of Medical Diagnosis was first calculated, and the records that had a matching score above a threshold limit were considered as nearest neighbors. The records that did not score above a threshold limit were then merged with the scaled overlap for the field Medical Remarks, and the closest nearest neighbors were determined based on the merged (average) overlap. Similarly, records or visits that did not score above a threshold limit were merged with the scaled overlap for the field Original Disposition, and the same reasoning was applied to merging with the Patient Statement field. The order in which the fields were merged was based on the effect of each individual text field on the accuracy of the system. After experimenting with various threshold values, we concluded that there was no performance improvement.
We also investigated the fusion scheme in which the scaled overlap of Medical Diagnosis was first calculated, and the records that had a matching score above a threshold limit were considered as nearest neighbors. For the records that did not score above a threshold limit, the next step was to determine nearest neighbors using Medical Remarks (instead of merging medical diagnosis and medical remarks). The process is extended for all the four text fields. Again, this fusion scheme did not improve performance when compared to the best individual text field (Medical Diagnosis).
One possible reason for the fusion not delivering improved performance could be that the records that have incorrect information / noise in a text field have similar problems and issues in the other three text fields. These records do not have a good match on any of the text fields and, hence, the fusion based approach is not able to improve the accuracy results.
4. Conclusions
Missing data in databases is an important issue
that needs to be addressed in order to make effective use of the data. We present an approach for handling missing ICD 9 codes in health records that is both generic and does not require the development of ICD 9 specific models. The accuracy of our approach is around 70% when the top five ICD 9 predictions are considered in the evaluation. In the follow on work, we are considering (1) presenting the top five ICD 9 candidates for a subject matter expert to choose from, and (2) using all five ICD 9 codes to fill-in for the
missing ICD codes in the subsequent health data analysis.
One limitation of our approach is that the accuracy is measured using the records for which the ICD 9 codes are already known (biased sample). The accuracy results may not be valid if there is a significant difference between the classes of records for which ICD codes are missing and records for which ICD 9 codes are present. A more accurate characterization of results can be obtained when accuracy is measured just for the records that have missing ICD 9 codes. That approach, however, will require that a subject matter expert validate the model results.
Another limitation is that the accuracy is limited to 40% when a single predicted ICD 9 code is considered. These results do not justify automatic selection of the ICD 9 code. The accuracy improves to about 70% when the metric considered is matched with any one of the top five ICD 9 predictions. Our vision is that the system proposes a short list of five candidate ICD 9 codes and a subject matter expert makes the final selection.
5. Acknowledgements
This work was performed under funding from the
Office of the Secretary of Defense (OSD) Small Business Innovative Research (SBIR) program (9). We would like to acknowledge the support of our sponsor, Dr. Kevin Montgomery. We also acknowledge the contributions of Maj. Moghaddam Abdollah (OSD) who provided us with the data set and facilitated our research.
6. References [1] Chrisendres, “ICD 9 Codes,” [Online], 2010, http://icd9cm.chrisendres.com/. [2] R. Weber, H. Schek, and S. Blott, “A Quantitative Analysis and Performance Study for Similarity-Search Methods in High-Dimensional Spaces” Proceedings of the 24th VLDB Conference, 1998. [3] K. Fakunga and P. M. Narendra, “A Branch and Bound Algorithm for Computing k-Nearest Neighbors,” Transactions on Computers, 1975. [4] Department of Defense, Occupational Medical Examinations and Surveillance Manual, [Online], 2008, www.dtic.mil/whs/directives/corres/pdf/605505mp.pdf. [5] KBSI, Environment, Epidemiology, and Etiology Surveillance and Analysis Toolkit Phase II, 2009, W81XWH-08-C-0756.
[6] M. Erraguntla et al., Avian Influenza Datamining Using Environment, Epidemiology, and Etiology Surveillance and Analysis Toolkit (E3SAT), s.l. : 43 Hawaii International Conference on System Sciences, 2010. [7] P. D. Allison, Missing Data Thousand Oaks. s.l. : Sage Publications, 2001. [8] C. D. Howell,”Treatment of Missing Data” [Online] http://www.uvm.edu/~dhowell/StatPages/More_Stuff/MissiMi_Data/Missing.html. [9] R. J. A. Little and D. B. Rubin, Statistical analysis with missing data, New York, Wiley, 1987. [10] P. T. von Hippel, “Filling Holes in Your Data:Multiple Imputation Education Research,” [Online], www.sociology.ohio-state.edu/ptv/Brownbags/MI/MI.ppt. [11] Yuan, Y. C, “Multiple Imputation for Missing Data: Concepts and New Development,” [Online], http://support.sas.com/rnd/app/papers/multipleimputation.pdf. [12] Schafer, J, “Missing Data in Longitudinal Studies: A Review,” [online], http://www.stat.psu.edu/~jls/aaps_schafer.pdf [13] J. U. Espino and M. A. Wagner, “Accuracy of ICD-9-coded Chief Complaints and Diagnoses for the Detection of Acute Respiratory Illness,” AMIA, 2001. http://www.ncbi.nlm.nih.gov/pmc/articles/PMC2243564/pdp/procamiasymp00002-0203.pdf. [14] S. Kandula et al., “A Bootstrapping Method to Improve Cohort Identification,” 2010. http://syndromic.org/annual-conference/2010. [15] J. Esteban et al., “A Review of data fusion models and architectures: towards engineering guidelines,” 4, s.l., Neural Computing & Applications , 2005, Vol. 14. DOI: 10.1007/s00521-004-0463-7. [16] M. E. Liggins, J. Llinas, and D. L. Hall, Handbook of Multisensor Data Fusion: Theory and Practice, Second Edition (Electrical Engineering & Applied Signal Processing Series), s.l. : CRC Press, 2008. [17] J. Llinas, et al., “Revisiting the JDL data fusion model II,” s.l. : 7th Int. Conf. on Information Fusion, 2004. [18] C. Fellbaum, An Electronic Lexical Database, Cambridge, MA : MIT Press, 1999. [19] D. Lin, “A C++ Implementation of Hidden Markov Model” [Online], http://www.cs.ualberta.ca/~lindek/hmm.htm.

[20] D. Sleator and D. Temperley, “Parsing English with a link grammar,” Third International Workshop on Parsing Technologies, 1993.