Two Phase K-Nearest Neighbors Approach
8
(IJCSIS) International Journal of Computer Science and Information Security, Vol. 12, No. 1, 2014 Two Phase K-Nearest Neighbors Appoach Siddhartha Kumar Arjaria 1 , Deepak Singh Tomar 2 , Devshri Roy 3 Department of computer science & Engg. Maulana Azad National Institute of Technology Bhopal, (M.P.), India 1 [email protected], 2 [email protected], 3 [email protected] Abstract— K-nearest neighbors approach is the popular algorithm for classification. The majority of votes of neighbors of testing sample decide the class of in K-nearest neighbors approach. It only utilizes the information stored in the first few samples while it considers the remaining samples unimportant. The classification result of K-nearest neighbors approach highly depends on the single criteria, due to this classifier many times produces the wrong result. The paper presents a novel idea to deal with the classification problem in two Phases. First phase deals with the extraction of useful information from the training space regarding the occurrence behavior of each training sample in the neighbor list of other training samples. This occurring behavior decides each training sample to be part of one of the three classes namely important, unimportant, and neutral. In the second phase, On the basis of this collected information the training samples in the neighbors of testing sample are rearranged by removing the unimportant samples. Now classification decision totally omitted the unimportant training samples and considers only the important & neutral class training samples. Algorithm is designed to provide the extra weights to the important samples on the basis of its position in neighbor list, it's occurrence frequency as a neighbors of other training samples and the number of training samples of that class used for training. Performance is tested on three database seven most frequent categories of Reuters-21578, four most frequent categories of RCV1, seven most frequent categories of TDT2 corpus. our approach outperforms K-nearest neighbors approach in terms of F1 value in almost each case. Keywords- K-nearest neighbors approach;Two Phase KNN;Classification; I. INTRODUCTION In the present era of information technology, digital text information is growing exponentially. As a consequence, one of the major challenges is to organize and manage them automatically. One of the ways to organize text information is the classification of text documents into the correct category. Machine learning approaches are used for text classification. Different machine learning algorithms such as inductive learning [2], neural networks (W., E., J.O. Pedersen, and A.S. Weigend 1993) Naïve Bayes classifiers [14] decision trees, K- NN[7], Support Vector Machine (SVM) is already proposed . The traditional KNN has some limitations. All the training samples are treated equally and given the same weight. But in practical situations, some samples are more significant than others. The contribution of more significant samples should be more as compared to others. The most significant sample could help in correct classification, which in turn increases the classification performance. The approach used in this paper is divided in to two phases. First phase collects the information regarding the usefulness of training samples. For this the occurring behavior of each training sample in the neighborhood of other training samples give important information by finding how much time the Tri will be in the neighbors of training samples of class s. On the basis of the information each training sample will belong one of three classes namely important, unimportant and neutral. The important class training samples have the property that the occurrence of these samples is restricted to specific class. And their occurrence count in that class is above predefined threshold .They will almost not occur in the neighbor list of training samples of other class. The unimportant class holds the training samples that are occurred in more than one class with significant occurrence count. The neutral class has the remaining training samples which are not the part of important and unimportant class. In the second phase for classification of each testing sample the information collected from phase1 is used. The neighbor list of testing samples contains the training samples that belong to one of three classes. It is clear that the occurrence of training samples of the unimportant class in the neighbor of testing sample have a confusing behavior of class occurrence (occurred in more than one class)so it's occurrence in the neighbor of testing sample need to be eliminated for good classification results. On the other hand the occurrence of neighbors of important class needs the encouragement as it's occurrence is dedicated to a single class only. The idea is to discourage the occurrence of training samples of unimportant class in neighbor list of testing sample by completely removing it from the neighbor list & in turn not consider it in class decision making. In place considering the next important or neutral neighbors of that testing sample, means that class decision making is completely based on samples of important and neutral class. For best classification result it is needed to increase the weight of important neighbors by a certain calculated factor. The weighting factor of each important samples determined by considering the following points The important neighbors that are near to testing sample provide more weights as compare to important neighbors that are far from the testing sample. 18 http://sites.google.com/site/ijcsis/ ISSN 1947-5500
-
Upload
independent -
Category
Documents
-
view
1 -
download
0
Transcript of Two Phase K-Nearest Neighbors Approach

(IJCSIS) International Journal of Computer Science and Information Security,
Vol. 12, No. 1, 2014
Two Phase K-Nearest Neighbors Appoach
Siddhartha Kumar Arjaria1, Deepak Singh Tomar
2, Devshri Roy
3
Department of computer science & Engg.
Maulana Azad National Institute of Technology
Bhopal, (M.P.), India [email protected],
Abstract— K-nearest neighbors approach is the popular
algorithm for classification. The majority of votes of neighbors of
testing sample decide the class of in K-nearest neighbors
approach. It only utilizes the information stored in the first few
samples while it considers the remaining samples unimportant.
The classification result of K-nearest neighbors approach highly
depends on the single criteria, due to this classifier many times
produces the wrong result. The paper presents a novel idea to
deal with the classification problem in two Phases. First phase
deals with the extraction of useful information from the training
space regarding the occurrence behavior of each training sample
in the neighbor list of other training samples. This occurring
behavior decides each training sample to be part of one of the
three classes namely important, unimportant, and neutral. In the
second phase, On the basis of this collected information the
training samples in the neighbors of testing sample are
rearranged by removing the unimportant samples. Now
classification decision totally omitted the unimportant training
samples and considers only the important & neutral class
training samples. Algorithm is designed to provide the extra
weights to the important samples on the basis of its position in
neighbor list, it's occurrence frequency as a neighbors of other
training samples and the number of training samples of that class
used for training. Performance is tested on three database seven
most frequent categories of Reuters-21578, four most frequent
categories of RCV1, seven most frequent categories of TDT2
corpus. our approach outperforms K-nearest neighbors approach
in terms of F1 value in almost each case.
Keywords- K-nearest neighbors approach;Two Phase
KNN;Classification;
I. INTRODUCTION
In the present era of information technology, digital text
information is growing exponentially. As a consequence, one
of the major challenges is to organize and manage them
automatically. One of the ways to organize text information is
the classification of text documents into the correct category.
Machine learning approaches are used for text classification.
Different machine learning algorithms such as inductive
learning [2], neural networks (W., E., J.O. Pedersen, and A.S.
Weigend 1993) Naïve Bayes classifiers [14] decision trees, K-
NN[7], Support Vector Machine (SVM) is already proposed .
The traditional KNN has some limitations. All the training
samples are treated equally and given the same weight. But in
practical situations, some samples are more significant than
others. The contribution of more significant samples should be
more as compared to others. The most significant sample
could help in correct classification, which in turn increases the
classification performance.
The approach used in this paper is divided in to two phases.
First phase collects the information regarding the usefulness of
training samples. For this the occurring behavior of each
training sample in the neighborhood of other training samples
give important information by finding how much time the Tri
will be in the neighbors of training samples of class s. On the
basis of the information each training sample will belong one
of three classes namely important, unimportant and neutral.
The important class training samples have the property that the
occurrence of these samples is restricted to specific class. And
their occurrence count in that class is above predefined
threshold .They will almost not occur in the neighbor list of
training samples of other class. The unimportant class holds
the training samples that are occurred in more than one class
with significant occurrence count. The neutral class has the
remaining training samples which are not the part of important
and unimportant class.
In the second phase for classification of each testing sample
the information collected from phase1 is used. The neighbor
list of testing samples contains the training samples that
belong to one of three classes. It is clear that the occurrence of
training samples of the unimportant class in the neighbor of
testing sample have a confusing behavior of class occurrence
(occurred in more than one class)so it's occurrence in the
neighbor of testing sample need to be eliminated for good
classification results. On the other hand the occurrence of
neighbors of important class needs the encouragement as it's
occurrence is dedicated to a single class only. The idea is to
discourage the occurrence of training samples of unimportant
class in neighbor list of testing sample by completely
removing it from the neighbor list & in turn not consider it in
class decision making. In place considering the next important
or neutral neighbors of that testing sample, means that class
decision making is completely based on samples of important
and neutral class. For best classification result it is needed to
increase the weight of important neighbors by a certain
calculated factor. The weighting factor of each important
samples determined by considering the following points
The important neighbors that are near to testing
sample provide more weights as compare to
important neighbors that are far from the testing
sample.
18 http://sites.google.com/site/ijcsis/ ISSN 1947-5500
(IJCSIS) International Journal of Computer Science and Information Security,
Vol. 12, No. 1, 2014 The important neighbors that have more occurring
frequency in training space provide more weights as
compare to important neighbors have less occurring
frequency in training space.
If the important neighbors belongs to the class that
have more samples for training will provide the less
weights as compare the important neighbors that
belongs to the class that have less samples for
training
Combination of all these factor leads towards the increased
classifier performance as compared to KNN classifier
algorithm.
II. RELATED WORK
[8] had given K-nearest neighbor approach for text
classification Traditional KNN is one of most popular and
extensively used method of text classification. However it has
many drawbacks like classification accuracy depends on the
value of K, equal value of weight to K nearest neighbours, no
differentiation of relevant features, the classification
performance is easily affected by irrelevant features, more
memory requirement etc. To overcome the drawbacks of
KNN, many researchers had worked & proposed some
improvement.
A weighted K-nearest approach to overcome limitation of
assigning equal weight to k nearest neighbors[3] is proposed.
Different Weights are assigned to all training samples
according to the distance calculated. All training samples are
used instead of K nearest neighbors. Therefore, computation
complexity is increased in calculating weights for all training
samples made the algorithm slow. [1] introduces Condensed
nearest neighbor. It Reduce size of training data , by
elimination of training data which do not add new useful
information due to this query time and memory requirements
improves. [15] proposes a method nearest feature Line
Neighbor uses the ignored information of nearest neighbor and
improves the accuracy this is good for small size but the
computational complexity of this approach is increased. [19]
propose a modification in KNN which uses the concept of
weights and validity of data point for classification. The low
accuracy of weighted KNN is improved by them partially. [9]
proposed reduced nearest neighbor method for text
classification. The aim of this method is to reduce the size of
the training data by eliminating patterns which do not affect
the final result. Advantage of this method is less memory
requirement. The disadvantages are computational complexity;
cost and time consumption is more.
[10] proposed an improved KNN algorithm for text
categorization, which builds the classification model by
combining constrained one pass clustering algorithm and
KNN text categorization. [23] proposed an improved KNN
text classification algorithm based on clustering center. It
clusters each training set by K value clustering and obtain all
cluster centers from the new training set. According to the
number of training samples in each cluster, weight is assigned.
The training samples which lie near border are removed from
the training sets. However, these samples also give important
information that the border training samples have dominance
of the other classes than the actual class. This fact can be used
in the decision rule for predicting the class of unknown
training sample. Approach use in this paper achieves the
significant improvement in accuracy as compared to the
traditional KNN.
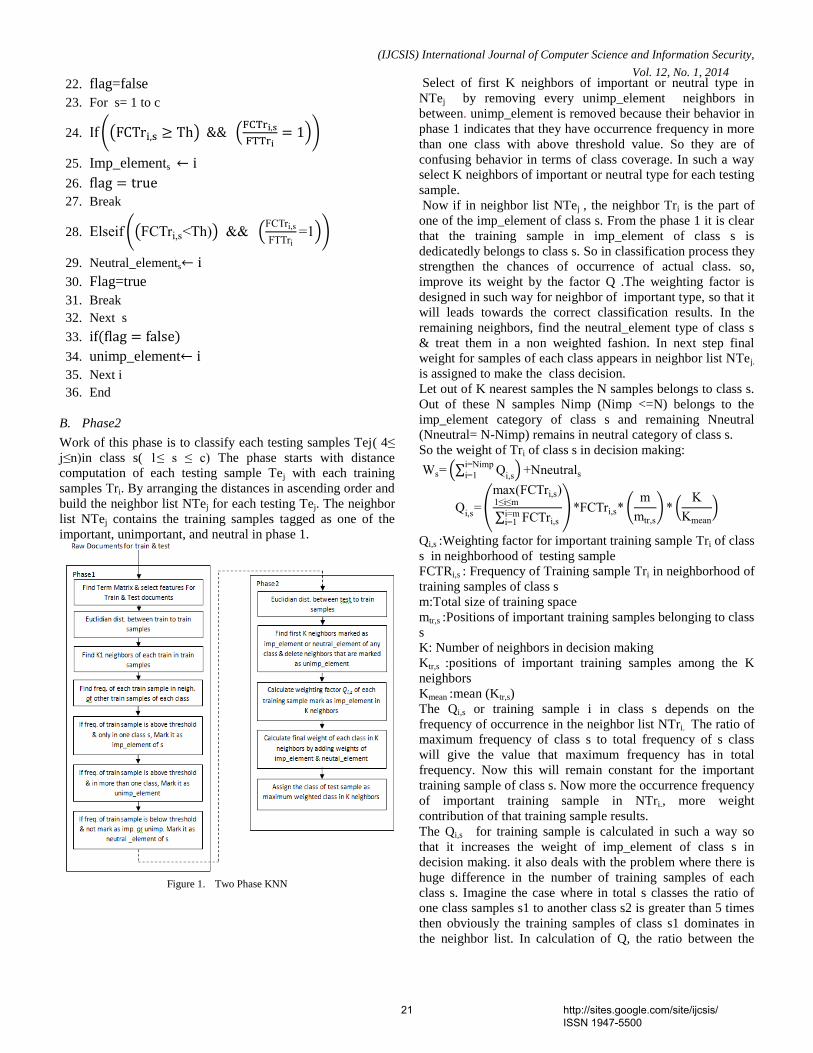
III. TWO PHASE KNN
The algorithm is break in two phases. the output of phase1 will work as the input of phase 2.
A. Phase1
The phase 1 starts with the feature selection of each document
1) Feature selection
The steps used for feature selection is discussed in algorithm1
Algorithm 1. Feature selection
Input
1. Document set of n documents
2. Stop word list
3. Value of local and global threshold
4. N: Number of features selected
Output
1. Term Frequency matrix for Documenti
1. Begin
2. For i = 1 to Number of documents
3. Extract the term set satisfying local and global threshold
4. Remove the stop words
5. Apply stemming
6. Apply Normalization
7. Term Frequency matrix for Documenti
8. Next i
9. End
Up to this point the algorithm makes the term frequency
matrix of each document. Although size of raw document is
reduced by great extent, but all these terms are not equally
important for classification. Terms should be picked up for in
such a way that most specific and unique terms of different
classes takes the leading edge over other terms, to boost the
classifier performance in terms of accuracy, classification time
and memory requirement.
In the last few years the researcher makes lot of attempt for
choosing the best terms of document database. Few are odds
ratio[17], document frequency[22], mutual information[16],
information gain[11], improved Gini index[21], measure of
deviation from Poisson distribution[18], chi-square[4]. The
algorithm chooses the top N features using the measure of
deviation from Poisson distribution to select the features for
classification.
a) Degree of deviation from Poisson distribution
The measure of deviation from Poisson distribution method is
used to select the features of databases. Hiroshi Ogura[18]
proposed a feature selection method for text . It will take the
degree of deviation from Poisson distribution in to
consideration. The Poisson distribution is used for describing
the probability of a number of events occurring in each series
of units and it is given by
19 http://sites.google.com/site/ijcsis/ ISSN 1947-5500
(IJCSIS) International Journal of Computer Science and Information Security,
Vol. 12, No. 1, 2014
Where is a positive real number which is equal to the expected number of occurrence.
Where Fi is the total frequency of terms in all documents & N is the total number of documents in the text corpus.
Where
A= Number of documents containing term t in documents of category c
B= Number of documents not containing term t in documents of category c
C= Number of documents containing term t and not belonging to category c
D= Number of documents not containing term t and not belonging to category c
, = predicted values of A,B,C,D
POI= Chi square statistic measure deviations from Poisson
M: Number of documents that belongs to category c
To collect information regarding the training samples, find the distances between each pair of training samples
Training space = Tri
Testing space = Tej
Find the Euclidian distance between each training sample Tri
to remaining training samples & arrange these neighbors for
Tri in the ascending order of distance. Now select K1
neighbors of each training sample, thus finds neighbor list for
all training set. Training space is distributed over c different
classes. for the training samples of of class c ,find occurrence
frequency of each training sample Tri in the K1 neighbors .
Now for each training sample one of three cases will occurred
The training sample Tri is dedicatedly occurred only
in the class s of the c classes with frequency f. if
f>threshold1 then Tri is in the imp_element of class s.
The training sample Tri is occurred in the neighbor
list of more than one class with the frequency f. if
f>threshold2 then Tri is in the unimp_element
maintained for all classes
All other training samples Tri that are neither the
member of imp_element of class s & nor the member
of unimp_element is Part of neutal_element. All the
Tri that are member of neutral_element either has no
occurrence in any class c or have frequency below
threshold.
Each training sample is the member of one of three above
mentioned cases. This will improves the quality of neighbor
list for each testing sample to be maintained in phase2.
NTri : m*K1 size array to hold the Neighborhood of Tri in
training space
FTTri : 1*m size array to hold the Frequency of Tri in
neighborhood of all training samples
Algorithm 2.Find the Important, Unimportant, Neutral element
list
Input
Training space: Tri 1≤ ≤m
represented by top N informative terms selected by
deviation from Poisson distribution method
K1:Number of neighbors 4≤K1≤ 5
Th: Threshold value
c: Number of classes
Output
: Array to hold the index of unique
& most frequent training samples of class s
: Array to hold the index of
neutral training samples of class s
: Array to hold index of
unimportant training samples
: Array to hold the Frequency of Training
sample Tri in neighborhood of training samples of
class s
1. Begin
2. For i =1 to m
3. For j= 1 to m
4. Calculate Euclidian distance between ith
& jth
training
sample
5. Next j
6. Sort distances in ascending order
7. NTr ←First K1 neighbors of Tri 4≤K1≤ 5
8. Next i
9. For s= 1 to c
10. For i= 1 to m
11. FCTri,s← 0
12. for x=1 to m
13. If (Tri NTr(x))
14. FCTri,s= FCTri,s +1
15. Else
16. FCTri,s= FCTri,s
17. Next x
18. Next i
19. Next s
20. for i=1 to m
21. 1
20 http://sites.google.com/site/ijcsis/ ISSN 1947-5500
(IJCSIS) International Journal of Computer Science and Information Security,
Vol. 12, No. 1, 2014 22. flag=false
23. For s= 1 to c
24.
25. Imp_elements ←
26.
27. Break
28.
1
29. Neutral_elements←
30. Flag=true
31. Break
32. Next s
33.
34. unimp_element← 35. Next i
36. End
B. Phase2
Work of this phase is to classify each testing samples Tej( 4≤
j≤n in class s( 1≤ ≤ The phase starts with distance
computation of each testing sample Tej with each training
samples Tri. By arranging the distances in ascending order and
build the neighbor list NTej for each testing Tej. The neighbor
list NTej contains the training samples tagged as one of the
important, unimportant, and neutral in phase 1.
Figure 1. Two Phase KNN
Select of first K neighbors of important or neutral type in
NTej by removing every unimp_element neighbors in
between. unimp_element is removed because their behavior in
phase 1 indicates that they have occurrence frequency in more
than one class with above threshold value. So they are of
confusing behavior in terms of class coverage. In such a way
select K neighbors of important or neutral type for each testing
sample.
Now if in neighbor list NTej , the neighbor Tri is the part of
one of the imp_element of class s. From the phase 1 it is clear
that the training sample in imp_element of class s is
dedicatedly belongs to class s. So in classification process they
strengthen the chances of occurrence of actual class. so,
improve its weight by the factor Q .The weighting factor is
designed in such way for neighbor of important type, so that it
will leads towards the correct classification results. In the
remaining neighbors, find the neutral_element type of class s
& treat them in a non weighted fashion. In next step final
weight for samples of each class appears in neighbor list NTej.
is assigned to make the class decision.
Let out of K nearest samples the N samples belongs to class s.
Out of these N samples Nimp (Nimp <=N) belongs to the
imp_element category of class s and remaining Nneutral
(Nneutral= N-Nimp) remains in neutral category of class s.
So the weight of Tri of class s in decision making:
m
1 n
m 1≤ ≤m
m 1
m
m
K
Km n
Qi,s :Weighting factor for important training sample Tri of class
s in neighborhood of testing sample
FCTRi,s : Frequency of Training sample Tri in neighborhood of
training samples of class s
m:Total size of training space
mtr,s :Positions of important training samples belonging to class
s
K: Number of neighbors in decision making
Ktr,s :positions of important training samples among the K
neighbors
Kmean :mean (Ktr,s)
The Qi,s or training sample i in class s depends on the
frequency of occurrence in the neighbor list NTri. The ratio of
maximum frequency of class s to total frequency of s class
will give the value that maximum frequency has in total
frequency. Now this will remain constant for the important
training sample of class s. Now more the occurrence frequency
of important training sample in NTri., more weight
contribution of that training sample results.
The Qi,s for training sample is calculated in such a way so
that it increases the weight of imp_element of class s in
decision making. it also deals with the problem where there is
huge difference in the number of training samples of each
class s. Imagine the case where in total s classes the ratio of
one class samples s1 to another class s2 is greater than 5 times
then obviously the training samples of class s1 dominates in
the neighbor list. In calculation of Q, the ratio between the
21 http://sites.google.com/site/ijcsis/ ISSN 1947-5500
(IJCSIS) International Journal of Computer Science and Information Security,
Vol. 12, No. 1, 2014 total training samples to number of training sample belonging
to class s will encourage the class s whose training samples are
low as compared to number of training samples of other
classes.
Qi,sfor training sample i in class s also depends on its positions
in the neighbor list of Tej. The closer positions acquired by
the important training samples of class s in the K neighbor
of testing sample Tej results in the higher weight participation
in over all weight as compares to the important training
samples that acquired the far positions. The designed so
encourages the possibility of correct class assignment to
testing sample Tej.
n m j m
1≤ ≤
Algorithm 3.Find class of testing sample
Input
1. Testing space: Tej represented by top N informative
terms selected by deviation from Poisson distribution
method
2. Imp_elements :holds the index of unique & most
frequent training samples of class s
3. neutral_elements :holds the index of neutral
training samples of class s
4. unimp_element: holds index of unimportant training
samples
5. FCTri,s:Frequency of Training sample Tri in
neighborhood of training samples of class s
6. : Total size of training space
7. mtr,s :size of training samples belonging to class s
8. : Total neighbors consider in decision making
Output
1.
Function Used
1. : Function that
returns the index of element of matrix sample in the
Neighborlist if they exist in it.
Variable Used
1. NTej : Neighbors of Tej in training space
2. Contains K neighbors after removing
the unimp_element for Tej (3≤ K≤ 30)
1. Begin
2. For j=1 to n
3. For i= 1 to m
4. Calculate Euclidian distance between ith
training sample
& jth
testing sample
5. Next i
6. Sort distances in ascending order
7.
8. NTej ←neighbors of Tej
9.
10. do
11. n m n m m n j m n m n
12. m n m n K- n m
13. remain_element=size(Iunimp)
14. while((selected_element-K)~=0)
15. Put selected K elements in NimpneuTej
16. For s= 1 to c
17. Ineu=member(neutral_elements, NimpneuTej)
18. Iimp=member(imp_elements, NimpneuTej)
19. For r = 1 to size(Iimp)
20. Ind= Iimp(r)
21.
m 1≤ ≤m
m 1
m
m
K
Km n
22. Next r
23.
m
1 n
24. 25. ←
26. Next j
27. End
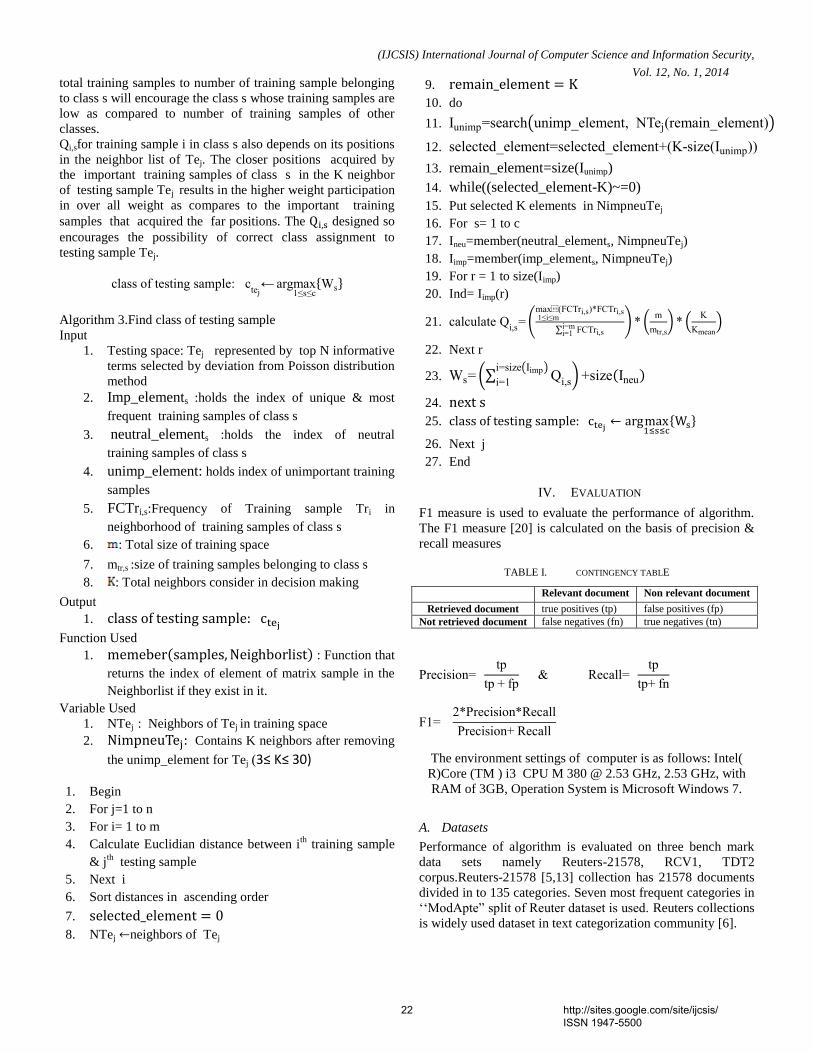
IV. EVALUATION
F1 measure is used to evaluate the performance of algorithm.
The F1 measure [20] is calculated on the basis of precision &
recall measures
TABLE I. CONTINGENCY TABLE
Relevant document Non relevant document
Retrieved document true positives (tp) false positives (fp)
Not retrieved document false negatives (fn) true negatives (tn)
n
n
1 n
n
The environment settings of computer is as follows: Intel(
R)Core (TM ) i3 CPU M 380 @ 2.53 GHz, 2.53 GHz, with
RAM of 3GB, Operation System is Microsoft Windows 7.
A. Datasets
Performance of algorithm is evaluated on three bench mark
data sets namely Reuters-21578, RCV1, TDT2
corpus.Reuters-21578 [5,13] collection has 21578 documents
divided in to 135 categories. Seven most frequent categories in
‘‘ ” Reuters collections
is widely used dataset in text categorization community [6].
22 http://sites.google.com/site/ijcsis/ ISSN 1947-5500

(IJCSIS) International Journal of Computer Science and Information Security,
Vol. 12, No. 1, 2014 Reuters Corpus Volume I [12] is an archive of over 800,000
manually categorized newswire stories recently made
available by Reuters, Ltd. for research purposes. The subset of
RCV1 with 4 categories is used.
TDT2 [5]corpus consists of data collected during the first half
of 1998 and taken from 6 sources, including 2 newswires
(APW, NYT), 2 radio programs (VOA, PRI) and 2 television
programs (CNN, ABC). It consists of 11201 on-topic
documents which are classified into 96 semantic categories. In
this subset, those documents appearing in two or more
categories were removed, and only the largest 30 categories
were kept, thus leaving us with 9,394 documents in total.
B. Effect of variation of K1 (Neighbors in Train to Train) on
average correctly classify samples
The Fig. 2, 3 & 4 shows the effect of Value of K1 on the
performance of our classifier in terms of correctly classified
training samples of seven most frequent categories of Reuters-
21578, four most frequent categories of RCV1, seven most
frequent categories of TDT2 corpus. First fix the value of K1
and then for that value of K1 we perform the classification on
the different values of K. All the K results we get in such a
way is averaged to give the average training samples correctly
classified for the particular K1 value. This is performed over
all values of K1.
The behavior of graphs indicated that the value of K1 should
not be too high or not too low. The too low values omit the
some useful training samples while the large values of K1
include the unnecessary samples and chances to drop the
classification accuracy.
Figure 2. Classifier Performance analysis for different values Neighbors in
training (K1) in terms of average sample correctly classified for RCV1
Figure 3. Classifier Performance analysis for different values Neighbors in
training (K1) in terms of average sample correctly classified for Reuters-21578
Figure 4. Classifier Performance analysis for different values Neighbors in
training (K1) in terms of average sample correctly classified for TDT2
C. Comparison of Two Phases KNN & KNN on Average F1
The Table 2, 3 & 4 shows KNN classifier & Two Phases KNN
performance for each category of database and also shows the
detail of the number of training & testing samples for each
category of Reuters-21578, four most frequent categories of
RCV1, seven most frequent categories of TDT2. The features
are selected by the method of deviation from Poisson
distribution. The top 5000, 5500, 1200 terms having highest
TABLE II. COMPARING AVERAGE F1 VALUE OF KNN & TWO PHASE KNN ON DIFFERENT K1 VALUES FOR FOUR MOST FREQUENT CATEGORIES OF RCV1
Category Train Test KNN
(F1 in %)
Two Phase KNN (F1 in %)
K1=2 K1=5 K1=10 K1=15 K1=20 K1=26
C15 1000 1022 50.38 68.17 66.94 60.90 60.16 59.56 58.99
ECAT 1000 1064 62.65 62.37 70.38 72.13 71.09 71.60 71.83
GCAT 1000 1901 57.35 71.10 63.98 73.73 73.23 71.10 70.31
MCAT 1000 1638 71.78 64.23 68.74 77.33 75.80 74.62 74.22
0 5 10 15 20 25 303300
3400
3500
3600
3700
3800
3900
4000
Neighbors in training
Avera
ge N
o.o
f S
maple
s c
orr
ecly
cla
ssifie
d
KNN
2PKNN
0 5 10 15 20 25 301750
1760
1770
1780
1790
1800
1810
1820
1830
1840
Neighbors in training
Avera
ge N
o.o
f S
maple
s c
orr
ecly
cla
ssifie
d
KNN
2PKNN
0 5 10 15 20 25 302350
2400
2450
2500
2550
2600
2650
2700
2750
Neighbors in training
Avera
ge N
o.o
f S
maple
s c
orr
ecly
cla
ssifie
d
KNN
2PKNN
23 http://sites.google.com/site/ijcsis/ ISSN 1947-5500

(IJCSIS) International Journal of Computer Science and Information Security,
Vol. 12, No. 1, 2014TABLE III. COMPARING AVERAGE F1 VALUE OF KNN & TWO PHASE KNN ON DIFFERENT K1 VALUES FOR SEVEN MOST FREQUENT CATEGORIES OF REUTERS-
21578
Category Train Test KNN
(F1 in %)
Two Phase KNN (F1 in %)
K1=2 K1=5 K1=10 K1=15 K1=20 K1=26
Earn 2700 1013 92.60 96.72 96.54 96.39 96.25 95.96 95.80
ACQ 1400 655 88.84 90.11 90.07 90.89 91.17 91.88 91.61
Crude 221 100 67.64 82.23 81.01 83.12 84.39 85.21 85.54
Trade 200 98 64.95 79.72 79.75 79.59 79.49 80.09 80.27
Money-fx 180 65 48.52 51.40 50.12 55.20 52.62 56.94 57.71
Interest 150 47 70.16 67.27 68.94 67.77 69.06 73.92 74.83
Ship 110 32 39 37.03 36.37 46.82 45.99 45.81 43.48
TABLE IV. COMPARING AVERAGE F1 VALUE OF KNN & TWO PHASE KNN ON DIFFERENT K1 VALUES FOR SEVEN MOST FREQUENT CATEGORIES OF TDT2
Category Train Test KNN
(F1 in %)
Two Phase KNN(F1 in %)
K1=2 K1=5 K1=10 K1=15 K1=20 K1=26
20001 1100 744 89.73 81.10 93.97 95.34 95.50 95.63 95.44
20015 1100 728 93.71 93.30 98.25 98.34 98.00 98.04 97.91
20002 700 522 96.88 95.04 98.58 98.06 98.27 98.33 98.24
20013 500 311 88.83 84.04 96.44 96.66 96.67 96.67 96.49
20070 241 200 96.78 93.87 96.18 98.75 98.76 98.80 98.71
20044 240 167 98.06 68.67 98.44 98.63 98.50 98.42 98.54
20076 150 122 68.14 58.32 77.88 81.38 80.99 81.95 79.64
value of deviation from Poisson distribution are selected as a
feature for Reuters-21578, RCV1, TDT2. The results shown in
the tables are the comparison of F1 value for each class by
Two Phase KNN & KNN. For a certain value of K1, find the
F1 for each value of K (1to 18).and then averaged these values
and get the averaged F1 value for that K1. In such a way
averaged F1 value for all K is achieved. The table 2,3 & 4
indicates the classifier performance on K1=2,5,10,15,20 & 26.
The table also shows the number of training & testing samples
used in classification.
V. CONCLUSION
Every classification algorithm is designed keeping the
accuracy enhancement in mind. This paper proposes certain
well designed modifications in KNN that leads towards the
better classification performance of classifier. The algorithm
used in this paper extract the information about important,
neutral & unimportant elements of each class from training
samples. This information is extracted in phase1. The main
factor involved in this phase is the number of neighbors for
training sample, e.g.K1.The K1 should be neither too low nor
too high.
In the second phase the class decision making depends on the
filtered list of neighbors, means no unimportant training
sample should present as the neighbors of testing sample. The
K important or neutral training samples only are used as
neighbors of testing sample. Each important training sample in
these K neighbors is multiplied with a weight. The weight for
each important training sample is calculated on the basis of
(1) Occurrence frequency in training space
(2) Its positions of important training samples among the
K neighbors.
(3) The number of training samples in that important
training sample's class The neutral elements are processed in a conventional
fashion by no increase in weight for class decision making. The performance is tested on three publicly available bench mark databases namely Reuters-21578, RCV1, & TDT2 corpus. In
each case Two Phase KNN outperforms the traditional KNN approach in terms of F1 measure. This improvement in performance require more time for algorithm to find and use the additional information as compare to traditional KNN.
REFERENCES
[1] Angiulli ,F.: Fast condensed nearest neighbor rule, In: Proceedings of the 22 nd International Conference on Machine Learning (2005)
[2] Apte, C. , Damerau,F. ,Weiss, S. M .:Automate learning of decision rules for text categorization. ACM Transactions on Information Systems. 12(3), 233-251(1994)
[3] Bailey ,T., Jain, A. K.:A note on Distance weighted k-nearest neighbor rules.IEEE Trans. Systems, Man Cybernatics. 8, 311- 313 (1978)
[4] Chen ,Y.T., Chen,M.C. : Using chi-square statistics to measure similarities for text categorization. Expert Systems with Applications. 38 (4),3085–3090(2011)
[5] Dataset collection from http://www.cad.zju.edu.cn/home/dengcai/Data /TextData.html accessed on may 2013
[6] Debole, F., Sebastiani, F. :An analysis of the relative hardness of reuters-21,578 subsets. Journal of the American Society for Information Science and Technology.56(6), 584–596(2005)
[7] Duda, R.O. , Hart, P.E.:Pattern Classification and Scene Analysis. New York, John Wiley & Sons(1973)
[8] Fix, E., Hodges, J. L.JR: Discriminatory Analysis, Nonparametric Discrimination: Consistency Properties. USAF School of Aviation Medicine. Report No. 4, Project No. 21-49-004(1951)
[9] Gates ,G.W. :Reduced Nearest Neighbor Rule, IEEE Trans Information Theory.18(3),431-433(1972)
[10] Jiang,S., Pang, G., Wu ,M., Kuang,L.: An improved K-nearest-neighbor algorithm for text categorization. Expert Systems with Applications. 39,1503–1509(2012)
[11] Lee, C., Lee , G.G.: Information gain and divergence-based feature selection for machine learning-based text categorization. Information Processing and Management. 42 (1), 155–165(2006)
[12] Lewis ,D. D., Yang ,Y., Rose,T.G., and Li, F.:RCV1: A New Benchmark Collection for Text Categorization Research. Journal of Machine Learning Research 5, 361-397(2004)
[13] Lewis, D. D. :Reuters-21,578 text categorization collection, http://kdd.ics.uci.edu/databases/reuters21578/reuters21578.html .(1999) accessed on 11 may 2013
24 http://sites.google.com/site/ijcsis/ ISSN 1947-5500

(IJCSIS) International Journal of Computer Science and Information Security,
Vol. 12, No. 1, 2014[14] Lewis, D.D. and, and M. Ringuette: A Comparison of two learning
algorithms for text categorization. In :Third Annual Symposium on Document Analysis and Information Retrieval (1994)
[15] Li,S. Z, Chan,K. L.:Performance Evaluation of The nearest feature line Method in Image Classification and Retrieval. IEEE Trans on Pattern Analysis and Machine Intelligence. 22(11),1335-1339(2000)
[16] Liu ,H., Sun J., Liu,L., Zhang, H.:Feature selection with dynamic mutual information. Pattern Recognition. 42 (7), 1330–1339(2009)
[17] Mladenic ,D., Grobelnik,M.:Feature selection on hierarchy of web documents. Decision Support Systems. 35 (1),45–87(2003)
[18] Ogura ,H., Amano,H., Kondo,M.:Feature selection with a measure of deviations from Poisson in text categorization.Decision Support Systems. 36 (3) ,6826–6832(2009)
[19] Parvin ,H., Alizadeh,H., Minaei,B.:Modified k Nearest Neighbor.Global Journal of Computer Science and Technology.10 (14),37-41(2010)
[20] Sebastiani, F. :Machine learning in automated text categorization.ACM Computing Surveys. 34(1),1–47(2002)
[21] Shang ,W., Huang,H., Zhu,H., Lin ,Y., Qu ,Y., Wang, Z.:A novel feature selection algorithm for text categorization.Expert Systems with Applications. 33 (1), 1–5(2007)
[22] Yang ,Y., Pedersen,J.O. :A comparative study on feature selection in text categorization.In: Proceedings of the 14th International Conference on Machine Learning(1997)
[23] Yong ,Z. :An Improved kNN Text Classification Algorithm based on Clustering. Journal of computers.4(3), 230–237(2009)
AUTHORS PROFILE
Siddhartha Kumar Arjaria has obtained the Bachelor of Engineering from
Institute of technology, university of bilaspur(C.G.) in year 2001, and has
obtained Master of technology from Pt. Ravi Shankar university,Raipur in 2006. Currently he is pursuing Ph.D in computer science & engineering
departmentfrom Maulana Azad National Insitute of Technology
,Bhopal(M.P.) Dr.Deepak singh Tomar has obtained his Ph.D in computer science &
engineering from in Maulana Azad National Institute of Technology, Bhopal .
Currently he is working as an Assistant Professor in Maulana Azad National Institute of Technology, Bhopal . His research area is Data mining . he has
published about 3o papers in international & national journals.
D. Roy has obtained the Bachelor of Engineering in Electronics from Maulana Azad National Institute of Technology, Bhopal in the year 1990, Master of
Engineering in Computer Science Engineering from National Institute of
Technology, Rourkela in the year 1998 and Ph D in the year 2007 from the Department of Computer Science Engineering, Indian Institute of Technology,
Kharagpur, India. She has worked with many prestigious institutes of India
like Indian Institute of Technology, National Institute of Technology etc. in India. Currently she is working as an Associate Professor in Maulana Azad
National Institute of Technology, Bhopal Dr. Roy has received a research
grant of worth Rupees 9.73 lakhs from Government of India to carry out a research project. Total number of papers published in referred Journals,
International conferences and International workshops are 25. Current
research interest includes Information Retrieval, natural language processing and application of Artificial Engineering techniques in Electronic and mobile
Learning.
25 http://sites.google.com/site/ijcsis/ ISSN 1947-5500