Inference of Drawing Elements and Space Usage on ... - MDPI
14
applied sciences Article Inference of Drawing Elements and Space Usage on Architectural Drawings Using Semantic Segmentation Jihyo Seo, Hyejin Park and Seungyeon Choo * School of Architecture, Kyungpook National University, 80, Daehak-ro, Buk-gu, Daegu 41566, Korea; [email protected] (J.S.); [email protected] (H.P.) * Correspondence: [email protected]; Tel.: +82-535-593 Received: 16 September 2020; Accepted: 16 October 2020; Published: 20 October 2020 Abstract: Artificial intelligence presents an optimized alternative by performing problem-solving knowledge and problem-solving processes under specific conditions. This makes it possible to creatively examine various design alternatives under conditions that satisfy the functional requirements of the building. In this study, in order to develop architectural design automation technology using artificial intelligence, the characteristics of an architectural drawings, that is, the architectural elements and the composition of spaces expressed in the drawings, were learned, recognized, and inferred through deep learning. The biggest problem in applying deep learning in the field of architectural design is that the amount of publicly disclosed data is absolutely insufficient and that the publicly disclosed data also haves a wide variety of forms. Using the technology proposed in this study, it is possible to quickly and easily create labeling images of drawings, so it is expected that a large amount of data sets that can be used for deep learning for the automatic recommendation of architectural design or automatic 3D modeling can be obtained. This will be the basis for architectural design technology using artificial intelligence in the future, as it can propose an architectural plan that meets specific circumstances or requirements. Keywords: image segmentation; labeling; DeeplabV3+; deep learning; architectural design 1. Introduction The use arrangement of a building space is created based on the expertise and experience of a design expert, and is a complex result of a wide variety of factors related to the use, scale, environment, and regulations of the building itself [1]. Therefore, automating architectural design has a lot of difficulties because it has a deep relationship with humans own creative domain. This is because it is difficult to describe and express architectural drawings with a few simple rules because very complex knowledge and experience must be combined. As a modern machine learning method, deep learning is increasingly used to achieve the state-of-the-art performance in many fields including computer vision, natural language processing and bioinformatics [2]. Recently, with the rapid development of artificial intelligence technology, there are increasing attempts to apply artificial intelligence technology to urban and architectural design [3]. However, in the field of architecture, research such as design automation has been continuing for a long time, but it is difficult to find remarkable growth or development announcements [4]. Artificial intelligence presents an optimized alternative by performing problem-solving knowledge and problem-solving processes under specific conditions. This makes it possible to creatively examine various design alternatives under conditions that satisfy the functional requirements of the building [5]. In this study, in order to develop an architectural design automation technology using artificial intelligence, the characteristics of architectural drawings, that is, the architectural elements and the Appl. Sci. 2020, 10, 7347; doi:10.3390/app10207347 www.mdpi.com/journal/applsci
-
Upload
khangminh22 -
Category
Documents
-
view
0 -
download
0
Transcript of Inference of Drawing Elements and Space Usage on ... - MDPI

applied sciences
Article
Inference of Drawing Elements and Space Usage onArchitectural Drawings Using Semantic Segmentation
Jihyo Seo, Hyejin Park and Seungyeon Choo *
School of Architecture, Kyungpook National University, 80, Daehak-ro, Buk-gu, Daegu 41566, Korea;[email protected] (J.S.); [email protected] (H.P.)* Correspondence: [email protected]; Tel.: +82-535-593
Received: 16 September 2020; Accepted: 16 October 2020; Published: 20 October 2020�����������������
Abstract: Artificial intelligence presents an optimized alternative by performing problem-solvingknowledge and problem-solving processes under specific conditions. This makes it possibleto creatively examine various design alternatives under conditions that satisfy the functionalrequirements of the building. In this study, in order to develop architectural design automationtechnology using artificial intelligence, the characteristics of an architectural drawings, that is,the architectural elements and the composition of spaces expressed in the drawings, were learned,recognized, and inferred through deep learning. The biggest problem in applying deep learning in thefield of architectural design is that the amount of publicly disclosed data is absolutely insufficient andthat the publicly disclosed data also haves a wide variety of forms. Using the technology proposed inthis study, it is possible to quickly and easily create labeling images of drawings, so it is expected thata large amount of data sets that can be used for deep learning for the automatic recommendation ofarchitectural design or automatic 3D modeling can be obtained. This will be the basis for architecturaldesign technology using artificial intelligence in the future, as it can propose an architectural planthat meets specific circumstances or requirements.
Keywords: image segmentation; labeling; DeeplabV3+; deep learning; architectural design
1. Introduction
The use arrangement of a building space is created based on the expertise and experience of adesign expert, and is a complex result of a wide variety of factors related to the use, scale, environment,and regulations of the building itself [1]. Therefore, automating architectural design has a lot ofdifficulties because it has a deep relationship with humans own creative domain. This is because it isdifficult to describe and express architectural drawings with a few simple rules because very complexknowledge and experience must be combined.
As a modern machine learning method, deep learning is increasingly used to achieve thestate-of-the-art performance in many fields including computer vision, natural language processingand bioinformatics [2]. Recently, with the rapid development of artificial intelligence technology,there are increasing attempts to apply artificial intelligence technology to urban and architecturaldesign [3]. However, in the field of architecture, research such as design automation has been continuingfor a long time, but it is difficult to find remarkable growth or development announcements [4].Artificial intelligence presents an optimized alternative by performing problem-solving knowledgeand problem-solving processes under specific conditions. This makes it possible to creatively examinevarious design alternatives under conditions that satisfy the functional requirements of the building [5].In this study, in order to develop an architectural design automation technology using artificialintelligence, the characteristics of architectural drawings, that is, the architectural elements and the
Appl. Sci. 2020, 10, 7347; doi:10.3390/app10207347 www.mdpi.com/journal/applsci

Appl. Sci. 2020, 10, 7347 2 of 14
composition of spaces expressed in the drawings, were learned, recognized, and inferred throughdeep learning.
Classification, localization/detection, and segmentation are image-related techniques most widelyused in computer vision. Classification is a task of predicting a label for an input, Localization/detectionprovides information by drawing a bounding box at the spot where the object is located predictingthe label for an object. Semantic segmentation supports many computer vision applications acrossmultiple domains, as the identification of the region of interest increases the accuracy of the final result.
Semantic segmentation has been one of the leading research interests in computer vision recently [6].Semantic segmentation does not represent an object in a static range such as a bounding box butpredicts the object in pixels and separates the target pixel area into meaningful units when detectingan object in an image. It not only checks which object exists in the image in a semantic unit, but alsoidentifies the spatial feature of the object and reflects it in the segmentation result [7]. Therefore,in the case of drawings representing architectural spaces with many symbolic expressions, semanticsegmentation is considered to be a suitable technique for grasping the relationship between space andspace or between drawing elements.
Many semantic segmentation approaches are based on CNNs (convolutional neural network)and FCN (fully convolution network). CNNs are at the core of an FCN, which employs forward skipconnections from the downsampling layers to the upsampling layers to offset the downsampling effectand thus avoid feature deterioration and enhance the inference process. But, FCN shows limitationswith time, such as mismatched relationships, and unclear classes. To avoid the limitations of FCNresolution, Deeplab consider two types of neural networks that use spatial pyramid pooling module orencoder-decoder structure for semantic segmentation, where the former one captures rich contextualinformation by pooling features at different resolution while the latter one is able to obtain sharp objectboundaries [8,9].
The biggest problem in applying deep learning in the field of architectural design is that theamount of publicly disclosed data is absolutely insufficient and that the publicly disclosed data alsohas a wide variety of forms [10]. Using the technology proposed in this study, it is possible to quicklyand easily create labeling images of drawings, so it is expected that a large amount of data sets thatcan be used for deep learning for automatic recommendation of architectural design or automatic 3Dmodeling can be obtained.
2. Related Works
As part of the literature review, this paper analyzes some architecture-related articles published intop-ranked international journals claiming high Impact Factors. The present analysis of related worksis focused on top three journals covering architecture, design, BIM (Building information modeling),computing technology, construction, and engineering among top ten journals. Specifically, a total of43 articles on AI, machine learning and deep learning applications published over the past three years(January 2018~May 2020) in the field of architecture are analyzed. Specifically, a total of 43 articles on AI,machine learning and deep learning applications published over the past 3 years (January 2018~May2020) in the field of architecture are analyzed. As shown in Table 1, the scholarly articles published inthe following top three journals are analyzed.
In this paper, Section 2.1 analyzesd prior research related to artificial intelligence, machine learning,and deep learning technologies in the construction field, and Section 2.2 analyzesd prior researchrelated to the architectural design phase.
2.1. Field of Engineering and Construction
Previous studies applying artificial intelligence technology in the field of construction was havebeen a lot significantly related to safety and can be divided into construction safety and structural safety.

Appl. Sci. 2020, 10, 7347 3 of 14
Table 1. Journal information and number of articles analyzed in this study.
NO Journal Publisher Field IF Number of ArticlesAnalyzed in This Study
1computer-aided civil
and infrastructureengineering
WILEYDevelopment and
application ofcomputing technology
5.4 10
2 Automation inconstruction
ELSEVIERSCIENCE BV Construction automation 4.0 25
3 Advanced Engineeringinformatics
ELSEVIERSCIENCE BV Engineering application 3.7 8
2.1.1. Construction Safety
Among the scholarly articles published over the past three years, the largest number of articlesexplored the application of AI, machine learning and deep learning techniques to constructionsafety. Mostly, the previous studies concerned the recognition of actions involving human behavioridentification, vehicle detection, and structure detection on construction sites and proposed some objectdetection techniques for safety monitoring. In relation to the safety prediction with the recognition ofactions in computer vision, a study observed and identified unsafe actions on construction sites from2D images to predict safety [11]. As for the safety monitoring, a study proposed a collision monitoringsystem, which recognized the 3D spatial correlation between workers and large vehicles [12]. Notably,Saeed Arabi et al. [13] experimentally demonstrated an accuracy of over 90% in identifying the types ofvehicles through image recognition with deep learning using a dataset of construction vehicle images.Also, Ling Chena et al. [14] performed an efficient detection of semantic domains through the imagelabeling boxes for a real-time event detection on construction sites. Taken together, the previous studieson safety monitoring mostly proposed the methods of object detection.
2.1.2. Structural Safety
Most structure safety studies analyzed here explored the bridge cracks in civil engineering. A studyused a convolutional autoencoder to detect the defects on concrete structures [15]. Another studyused the real-time object detection technique YOLOv3 for surface damage detection [16]. Both reportsmay be extended to the field of architecture using concrete structures. Particularly, a study onarchitecture-related structure safety identified the roof surface damage information relevant tohistoric buildings by using 100 roof images for training with the Mask R-CNN and convolutionalnetworks, and verified the viability for the automatic measurement of damaged areas and ratios [17].Also, Lichen Wang et al. [18] used 1953 ceiling images and the CNN for training to measure thecontour of damaged domains. Thus, the previous studies on architecture-related structure safetymostly experimentally demonstrated if deep learning techniques could address the limitations ofvisual inspection.
2.2. Field of Architectural Design
Applying AI, machine learning and deep learning techniques to architectural design was rarelydocumented in the past. By contrast, according to the present analysis of the previous studies on imagerecognition published in the field of architectural design over the past three years, lots of relevantarticles have been published in 2020. The previous studies on image recognition published over thepast three years in the field of architectural design largely delved into four themes, i.e., ‘automaticplane generation’, ‘space generation and space recognition’, ‘recognition of structural members’,and ‘recognition of elevation.’
2.2.1. Automated Floor Plan Design
Abdullah AlOmani et al. [19] performed the segmentation of natural images and used an algorithmthat analyzed the image segments to extract their domains and borders in order to automatically

Appl. Sci. 2020, 10, 7347 4 of 14
generate initial and optimal architectural layouts in accordance with designers’ requirements (area androom adjacency). Also, Nitant Upasani et al. [20] proposed a methodology of using deep learning toautomatically compose the RFP of rectangular floor plans in line with user-defined initial spacedimensionality and adjacency requirements. Both studies applied the image segmentation toautomatically generate rough planes at an early stage of design.
2.2.2. Space Generation/Space Recognition
Along with the foregoing studies on automatic plane generation, studies on space generationand space recognition have been published in recent times. Fan Yang et al. [21] reconstructed 3Dinterior models with laser scanning and enabled the recognition of the architectural element constraintsthrough deep learning for the segmentation and recognition of the semantic structure of interiorspace. Salman Khalili-Araghia et al. [22] developed a customized housing system which uses BIM tolearn about the constraints of stratified object relations and dimensionality and tested the proposedautomatic house design plans. This is the first study that applied both the automatic plane generationand space generation techniques to propose an AI-based automatic design.
2.2.3. Recognition of Structural Members
Thomas Czerniawski et al. [23] explored a methodology of visual object recognition for automatingthe digital modeling by recognizing the class information of BIM including walls, ceilings, doors andwindows. Also, with scanning techniques utilized in design, many studies extracted objects fromscanned data and automated the identification of structural members through image recognition.Yujie Wei et al. [24] proposed a method of recognizing the objects in interior space through scanning,automatically classifying them with semantic mapping, and applying the results to the maintenanceof facilities. Therefore, the previous studies on the recognition of structural members indicate theresearch trend has developed toward the integration of diverse data involving BIM data, scan data,virtual reality, and augmented reality.
2.2.4. Recognition of Elevation
It is hard to find previous studies on elevation image recognition, except one intended to proposethe automatic facade design and reflecting it in practical design. Fatemeh Hamid-Lakzaeian [25]applied the segmentation technique to enable the recognition of the openings and overhangs of historicbuildings from their facade scan data, and generated virtual facade design plans.
The aforementioned analysis of previous studies concerning the image recognition in design showsthat relevant research is still in its early stage, which underscores the need for further descriptive studies.With the rapid advancement of artificial intelligence technology, new technological development isnow viable rather than the automation of simple modeling based on existing rules and logics. Hence,it is essential for architectural design to make use of AI-based image recognition techniques such asGAN (generative adversarial network), CNN, and reinforcement learning for intelligent studies, so asto generate and propose diverse design plans.
3. Model Structure of Semantic Segmentation
Semantic segmentation refers to predicting objects’ pixel units to sort their pixel domains intomeaningful units, not representing them as static ranges such as bounding boxes, when detecting objectsin images. To add to the performance of segmentation, it is crucial not only to determine the objects inimages in terms of semantic units, but also to identify the objects’ spatial features and reflect them in theresults of image segmentation. In this study, among the segmentation network models, we conductedexperiments with DeepLabV3+, which has the best performance compared to other networks in boththe image dataset (Camvid) taken by car and the pascal voc dataset, which is widely used as data forcomputer vision challenge [26]. DeepLabV3+ can obtain multi-scale information when the object scaleof the image is varied by grafting the encoder-decoder structure to the atrous convolution.

Appl. Sci. 2020, 10, 7347 5 of 14
3.1. Encoder-Decoder
Deep neural networks widely used for classification, such as AlexNet and VGG (Visual GeometryGroup), are not suitable for semantic segmentation, since those models have a layer, which reducesthe number and dimensionality of parameters, causing the loss of detailed location information.To address the challenge, semantic segmentation models usually have downsampling & upsampling [27].This concept is shown in Figure 1.
Appl. Sci. 2020, 10, x FOR PEER REVIEW 5 of 15
Semantic segmentation refers to predicting objects’ pixel units to sort their pixel domains into meaningful units, not representing them as static ranges such as bounding boxes, when detecting objects in images. To add to the performance of segmentation, it is crucial not only to determine the objects in images in terms of semantic units, but also to identify the objects’ spatial features and reflect them in the results of image segmentation. In this study, among the segmentation network models, we conducted experiments with DeepLabV3+, which has the best performance compared to other networks in both the image dataset (Camvid) taken by car and the pascal voc dataset, which is widely used as data for computer vision challenge [26]. DeepLabV3+ can obtain multi-scale information when the object scale of the image is varied by grafting the encoder-decoder structure to the atrous convolution.
3.1. Encoder-Decoder
Deep neural networks widely used for classification, such as AlexNet and VGG (Visual Geometry Group), are not suitable for semantic segmentation, since those models have a layer, which reduces the number and dimensionality of parameters, causing the loss of detailed location information. To address the challenge, semantic segmentation models usually have downsampling & upsampling [27]. This concept is shown in Figure 1.
Figure 1. Structure of encoder-decoder.
Downsampling reduces the dimensionality for the sake of a deep convolution with less memory. A convolution with two or more strides or pooling is often used. Information about features is lost in downsampling [28]. At the end of downsampling, a fully connected network (FCN) is usually used without inserting a fully-connected layer. Since the FCN model suggested the foregoing method, most models have used this method. Upsampling is a process of increasing the dimensionality of the result received from the downsampling to the same dimensionality as that of inputs. In upsampling, FCN, SegNet, and UNet are well-known models that have the encoder-decoder types.
3.2. Atrous Convolution
Atrous convolution is an effective technique to enlarge the field-of-view of filters at any convolutional layer. This structure catches more features without adding to the computation [29]. Atrous convolution uses another parameter called the dilation rate, which defines the spacing placed between values to be used in a kernel. In an ordinary convolution where a kernel has no spacing, the dilation rate is defined to be one. When a 3 × 3 kernel has a dilation rate of two, its actual field of view becomes equivalent to that of a 5 × 5 kernel. In this way, a wider field of view is secured at the same computational cost.
Atrous convolution delivers better performance than the downsampling-convolution-upsampling process. Still, if a fixed rate is applied when using the atrous convolution, the filter size is fixed and only limited features can be found among other various features. To address this challenge, different sizes of rates are used, which is called the atrous spatial pyramid pooling, or ASPP [30]. DeepLabV3+ is a model where those two structures are incorporated. The encoder properly uses the atrous convolution, and the resultant feature map is placed in the decoder.
3.3. DeeplabV3+
Figure 1. Structure of encoder-decoder.
Downsampling reduces the dimensionality for the sake of a deep convolution with less memory.A convolution with two or more strides or pooling is often used. Information about features is lostin downsampling [28]. At the end of downsampling, a fully connected network (FCN) is usuallyused without inserting a fully-connected layer. Since the FCN model suggested the foregoing method,most models have used this method. Upsampling is a process of increasing the dimensionality of theresult received from the downsampling to the same dimensionality as that of inputs. In upsampling,FCN, SegNet, and UNet are well-known models that have the encoder-decoder types.
3.2. Atrous Convolution
Atrous convolution is an effective technique to enlarge the field-of-view of filters at anyconvolutional layer. This structure catches more features without adding to the computation [29].Atrous convolution uses another parameter called the dilation rate, which defines the spacing placedbetween values to be used in a kernel. In an ordinary convolution where a kernel has no spacing,the dilation rate is defined to be one. When a 3 × 3 kernel has a dilation rate of two, its actual field ofview becomes equivalent to that of a 5 × 5 kernel. In this way, a wider field of view is secured at thesame computational cost.
Atrous convolution delivers better performance than the downsampling-convolution-upsamplingprocess. Still, if a fixed rate is applied when using the atrous convolution, the filter size is fixed and onlylimited features can be found among other various features. To address this challenge, different sizesof rates are used, which is called the atrous spatial pyramid pooling, or ASPP [30]. DeepLabV3+ is amodel where those two structures are incorporated. The encoder properly uses the atrous convolution,and the resultant feature map is placed in the decoder.
3.3. DeeplabV3+
The resolution of the feature map gained from the encoder is 16 times lower than that of theoriginal image. (Output Stride: 16). In the decoding for an effective recovery of image details, low-levelfeatures are included. 16 was selected as it was a good trade-off point of velocity and accuracy basedon the experimental results. The ‘rate’ in the ASPP structure means the dilation rate of the atrousconvolution. The 1 × 1 Conv is applied to the low-level features to reduce the output from the encoderand channels. Given 48 channels were experimentally proved to deliver the best result, 48 channels areapplied to the low-level features. The 3 × 3 Conv is lastly performed in the decoder to bring a sharperresult to the edge of the object. In the last part of the encoder, the 1 × 1 convolution is performed forupsampling followed by the dimensionality reduction and then concat. This is similar to the U-Netstructure [8,28,30,31].

Appl. Sci. 2020, 10, 7347 6 of 14
The backbone networks used in DeepLab v3+ are Xception and ResNet-101. In this study,despite not much difference in performance found between the two networks, Xception performedmarginally better when its structure was slightly altered. To apply the atrous separable convolution,all pooling was replaced with the depth-wise separable convolution, and following each 3 × 3depth-wise convolution, batch normalization and ReLU function were added. DeepLab V3 usesthe ResNet pre-trained on ImageNet as the default feature extractor. In the final block of ResNet,the atrous convolution with multiple dilation rates is used to extract different sizes of features. Also,the atrous spatial pyramid pooling (ASPP), which was introduced in the earlier Deeplab version, is used.It is not a new idea but a model where the attributes of high-performance models are incorporated.The convolution uses kernels with diverse dilation rates in parallel. [8,28,30,31]
4. Experiment
This study used DeepLabV3+ to conduct an experiment on the automatic recognition and inferenceof the drawing elements and space usage on architectural drawings. Given the varying purposes orsizes of buildings and the resultant differences in the composition of planes, this study was limited toapartment houses. The elements on architectural drawings were classified into five types, viz. walls,windows, hinged doors, sliding doors, and evacuation doors, and the space usage into 8 types,viz. rooms, entrances, balconies, dress rooms, bathrooms, living rooms, evacuation space, and pantries(with backgrounds excluded). The experiment process is shown in Figure 2.
Appl. Sci. 2020, 10, x FOR PEER REVIEW 6 of 15
The resolution of the feature map gained from the encoder is 16 times lower than that of the original image. (Output Stride: 16). In the decoding for an effective recovery of image details, low-level features are included. 16 was selected as it was a good trade-off point of velocity and accuracy based on the experimental results. The ‘rate’ in the ASPP structure means the dilation rate of the atrous convolution. The 1 × 1 Conv is applied to the low-level features to reduce the output from the encoder and channels. Given 48 channels were experimentally proved to deliver the best result, 48 channels are applied to the low-level features. The 3 × 3 Conv is lastly performed in the decoder to bring a sharper result to the edge of the object. In the last part of the encoder, the 1 × 1 convolution is performed for upsampling followed by the dimensionality reduction and then concat. This is similar to the U-Net structure. [8,28,30,31]
The backbone networks used in DeepLab v3+ are Xception and ResNet-101. In this study, despite not much difference in performance found between the two networks, Xception performed marginally better when its structure was slightly altered. To apply the atrous separable convolution, all pooling was replaced with the depth-wise separable convolution, and following each 3 × 3 depth-wise convolution, batch normalization and ReLU function were added. DeepLab V3 uses the ResNet pre-trained on ImageNet as the default feature extractor. In the final block of ResNet, the atrous convolution with multiple dilation rates is used to extract different sizes of features. Also, the atrous spatial pyramid pooling (ASPP), which was introduced in the earlier Deeplab version, is used. It is not a new idea but a model where the attributes of high-performance models are incorporated. The convolution uses kernels with diverse dilation rates in parallel. [8,28,30,31]
4. Experiment
This study used DeepLabV3+ to conduct an experiment on the automatic recognition and inference of the drawing elements and space usage on architectural drawings. Given the varying purposes or sizes of buildings and the resultant differences in the composition of planes, this study was limited to apartment houses. The elements on architectural drawings were classified into five types, viz. walls, windows, hinged doors, sliding doors, and evacuation doors, and the space usage into 8 types, viz. rooms, entrances, balconies, dress rooms, bathrooms, living rooms, evacuation space, and pantries (with backgrounds excluded). The experiment process is shown in Figure 2.
Figure 2. Flow of the research. Figure 2. Flow of the research.
4.1. Data Collecting
As shown in Figure 3, Korea Land and Housing Corporation’s House Floor Plans (August 2019)published in the json file format on data.go.kr was used as the data for this study. The data includes330 json files in 75 folders. The json (JavaScript Object Notation) file format is an open standardformat using human readable texts to deliver the data objects composed of attribute–value pairs andarray data types (or any other serializable value) or “key-value pairs.” Carrying minimal connotativeinformation, the format is characterized by lightweight volumes and fast parsing. Therefore, it is
Appl. Sci. 2020, 10, 7347 7 of 14
often used for bulk data interchange. The json data files are uploaded on the government data portal(https://www.data.go.kr/).
Appl. Sci. 2020, 10, x FOR PEER REVIEW 7 of 15
4.1. Data Collecting
As shown in Figure 3, Korea Land and Housing Corporation’s House Floor Plans (August 2019) published in the json file format on data.go.kr was used as the data for this study. The data includes 330 json files in 75 folders. The json (JavaScript Object Notation) file format is an open standard format using human readable texts to deliver the data objects composed of attribute–value pairs and array data types (or any other serializable value) or “key-value pairs.” Carrying minimal connotative information, the format is characterized by lightweight volumes and fast parsing. Therefore, it is often used for bulk data interchange. The json data files are uploaded on the government data portal. (https://www.data. go.kr/)
Figure 3. Korean government data portal.
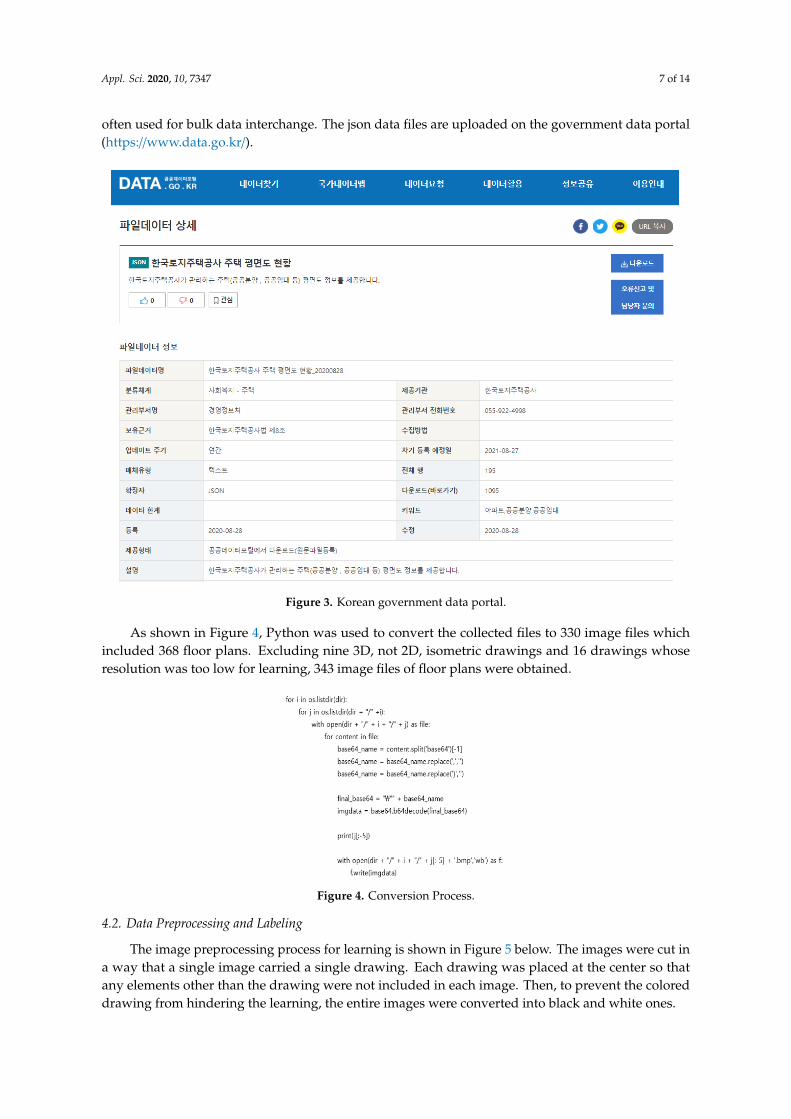
As shown in Figure 4, Python was used to convert the collected files to 330 image files which included 368 floor plans. Excluding nine 3D, not 2D, isometric drawings and 16 drawings whose resolution was too low for learning, 343 image files of floor plans were obtained.
Figure 4. Conversion Process.
Figure 3. Korean government data portal.
As shown in Figure 4, Python was used to convert the collected files to 330 image files whichincluded 368 floor plans. Excluding nine 3D, not 2D, isometric drawings and 16 drawings whoseresolution was too low for learning, 343 image files of floor plans were obtained.
Appl. Sci. 2020, 10, x FOR PEER REVIEW 7 of 15
4.1. Data Collecting
As shown in Figure 3, Korea Land and Housing Corporation’s House Floor Plans (August 2019) published in the json file format on data.go.kr was used as the data for this study. The data includes 330 json files in 75 folders. The json (JavaScript Object Notation) file format is an open standard format using human readable texts to deliver the data objects composed of attribute–value pairs and array data types (or any other serializable value) or “key-value pairs.” Carrying minimal connotative information, the format is characterized by lightweight volumes and fast parsing. Therefore, it is often used for bulk data interchange. The json data files are uploaded on the government data portal. (https://www.data. go.kr/)
Figure 3. Korean government data portal.
As shown in Figure 4, Python was used to convert the collected files to 330 image files which included 368 floor plans. Excluding nine 3D, not 2D, isometric drawings and 16 drawings whose resolution was too low for learning, 343 image files of floor plans were obtained.
Figure 4. Conversion Process. Figure 4. Conversion Process.
4.2. Data Preprocessing and Labeling
The image preprocessing process for learning is shown in Figure 5 below. The images were cut ina way that a single image carried a single drawing. Each drawing was placed at the center so thatany elements other than the drawing were not included in each image. Then, to prevent the coloreddrawing from hindering the learning, the entire images were converted into black and white ones.

Appl. Sci. 2020, 10, 7347 8 of 14
Appl. Sci. 2020, 10, x FOR PEER REVIEW 8 of 15
4.2. Data Preprocessing and Labeling
The image preprocessing process for learning is shown in Figure 5 below. The images were cut in a way that a single image carried a single drawing. Each drawing was placed at the center so that any elements other than the drawing were not included in each image. Then, to prevent the colored drawing from hindering the learning, the entire images were converted into black and white ones.
In deep learning, insufficient data are likely to cause overfitting, in which case a model generated based on training performs the image segmentation smoothly with the existing data but not with new data. To avoid overfitting, the data augmentation [32] was adopted in this experiment. The data augmentation helps improve the performance of a model by adding fake data when the dataset to be used for training the model is insufficient. A few operations including flipping, brightness variation, coordinate translation, rotation and zooming may be used to augment the data. In the present experiment, given the formulaic characteristics of drawings, the pixel shifting was applied to the original and target data, with ten pixels moved up and down and to the left and right.
Figure 5. Before and after image preprocessing.
When the histogram of an image is concentrated too much on a certain domain, it is far from a good image due to the low contrast. The contrast evenly distributed across all domains makes a good image. Therefore, as the image processing technique ensuring a good image, the histogram equalization was applied. In the process, to avoid extreme darkness or brightness, the CLAHE (contrast limited adaptive histogram equalization, which controls the contrast by imposing limits) was applied to the original images. Thus, 3430 pieces of data, which were ten times more than the original data, were obtained, with 70% (2400) and 30% (1030) used as the training and test data, respectively.
The experiment largely comprised two parts. The first part concerned the recognition of such elements as walls, doors, windows on drawings, while the second part concerned the recognition of such space as rooms, living rooms and bathrooms. The elements on architectural drawings were classified into five elements, i.e., walls, windows, hinged doors, sliding doors and evacuation doors. The space usage was classified into seven types, i.e., rooms, entrances, balconies, dress rooms, bathrooms, living rooms, evacuation space, and pantries.
As shown in the Figure 6 below, each of the 343 images of drawings to be used for the training and test underwent the labeling(Figure 7) based on the foregoing indexing.
Figure 5. Before and after image preprocessing.
In deep learning, insufficient data are likely to cause overfitting, in which case a model generatedbased on training performs the image segmentation smoothly with the existing data but not withnew data. To avoid overfitting, the data augmentation [32] was adopted in this experiment. The dataaugmentation helps improve the performance of a model by adding fake data when the datasetto be used for training the model is insufficient. A few operations including flipping, brightnessvariation, coordinate translation, rotation and zooming may be used to augment the data. In thepresent experiment, given the formulaic characteristics of drawings, the pixel shifting was applied tothe original and target data, with ten pixels moved up and down and to the left and right.
When the histogram of an image is concentrated too much on a certain domain, it is far from a goodimage due to the low contrast. The contrast evenly distributed across all domains makes a good image.Therefore, as the image processing technique ensuring a good image, the histogram equalization wasapplied. In the process, to avoid extreme darkness or brightness, the CLAHE (contrast limited adaptivehistogram equalization, which controls the contrast by imposing limits) was applied to the originalimages. Thus, 3430 pieces of data, which were ten times more than the original data, were obtained,with 70% (2400) and 30% (1030) used as the training and test data, respectively.
The experiment largely comprised two parts. The first part concerned the recognition of suchelements as walls, doors, windows on drawings, while the second part concerned the recognitionof such space as rooms, living rooms and bathrooms. The elements on architectural drawingswere classified into five elements, i.e., walls, windows, hinged doors, sliding doors and evacuationdoors. The space usage was classified into seven types, i.e., rooms, entrances, balconies, dress rooms,bathrooms, living rooms, evacuation space, and pantries.
As shown in the Figure 6 below, each of the 343 images of drawings to be used for the trainingand test underwent the labeling (Figure 7) based on the foregoing indexing.Appl. Sci. 2020, 10, x FOR PEER REVIEW 9 of 15
Figure 6. Example of data labeling process: pre-processed image (left), labeling of drawing elements (center), labeling of space usage (right) (The transparency was set to 55% to ensure visibility.).
Figure 7. Indexing of drawing elements and space usage.
4.3. Customization of Deep Learning Model
In this study, we built a network that infers drawing elements and usage of space through ‘transfer learning’ that re-learns by changing a specific layer to an existing learned model, rather than creating a new layer from scratch. Transfer learning is transferred to a target network and fine-tuned, and the remaining weights in the target network are set with the available training dataset, offers one means of overcoming the problem of limited data. [33] Fine-tuning begins with copying (transferring) the weights from a pre-trained network to the network we wish to train. The exception is the last fully connected layer whose number of nodes depends on the number of classes in the dataset. [34] Transfer learning can be implemented quickly and easily by using a pretrained network as a starting point. By training the network on a new data set, it has the advantage of fine-tuning the deeper layers of the network.
The original layer architecture of Deeplab was maintained in our implementation. In the last layer and output part of the decoder part, the class has been modified to fit 9 element recognition and 6 spatial use recognition. As input data, 2400 image files, 70% of the 3430 image data, were used for training, and 1030 data corresponding to the remaining 30% were used for testing. The training process is shown in Figure 8 [8]. In the encoder, it is first bilinearly upsampled to quadruple bilinear and then linked to the corresponding lower-level features of the network backbone with the same spatial resolution. Then, because lower-level features can contain many channels that can generally make training more difficult, another convolution is applied to lower-level features to reduce the number of channels. The feature is then reconstructed by applying several 3 × 3 convolutions, and another simple bilinear upsampling is quadrupled. The explanation for this is shown in Figure 8.
Figure 6. Example of data labeling process: pre-processed image (left), labeling of drawing elements(center), labeling of space usage (right) (The transparency was set to 55% to ensure visibility).

Appl. Sci. 2020, 10, 7347 9 of 14
Appl. Sci. 2020, 10, x FOR PEER REVIEW 9 of 15
Figure 6. Example of data labeling process: pre-processed image (left), labeling of drawing elements (center), labeling of space usage (right) (The transparency was set to 55% to ensure visibility.).
Figure 7. Indexing of drawing elements and space usage.
4.3. Customization of Deep Learning Model
In this study, we built a network that infers drawing elements and usage of space through ‘transfer learning’ that re-learns by changing a specific layer to an existing learned model, rather than creating a new layer from scratch. Transfer learning is transferred to a target network and fine-tuned, and the remaining weights in the target network are set with the available training dataset, offers one means of overcoming the problem of limited data. [33] Fine-tuning begins with copying (transferring) the weights from a pre-trained network to the network we wish to train. The exception is the last fully connected layer whose number of nodes depends on the number of classes in the dataset. [34] Transfer learning can be implemented quickly and easily by using a pretrained network as a starting point. By training the network on a new data set, it has the advantage of fine-tuning the deeper layers of the network.
The original layer architecture of Deeplab was maintained in our implementation. In the last layer and output part of the decoder part, the class has been modified to fit 9 element recognition and 6 spatial use recognition. As input data, 2400 image files, 70% of the 3430 image data, were used for training, and 1030 data corresponding to the remaining 30% were used for testing. The training process is shown in Figure 8 [8]. In the encoder, it is first bilinearly upsampled to quadruple bilinear and then linked to the corresponding lower-level features of the network backbone with the same spatial resolution. Then, because lower-level features can contain many channels that can generally make training more difficult, another convolution is applied to lower-level features to reduce the number of channels. The feature is then reconstructed by applying several 3 × 3 convolutions, and another simple bilinear upsampling is quadrupled. The explanation for this is shown in Figure 8.
Figure 7. Indexing of drawing elements and space usage.
4.3. Customization of Deep Learning Model
In this study, we built a network that infers drawing elements and usage of space through‘transfer learning’ that re-learns by changing a specific layer to an existing learned model, rather thancreating a new layer from scratch. Transfer learning is transferred to a target network and fine-tuned,and the remaining weights in the target network are set with the available training dataset, offers onemeans of overcoming the problem of limited data. Fine-tuning [33] begins with copying (transferring)the weights from a pre-trained network to the network we wish to train. The exception is the last fullyconnected layer whose number of nodes depends on the number of classes in the dataset. Transfer [34]learning can be implemented quickly and easily by using a pretrained network as a starting point.By training the network on a new data set, it has the advantage of fine-tuning the deeper layers ofthe network.
The original layer architecture of Deeplab was maintained in our implementation. In the lastlayer and output part of the decoder part, the class has been modified to fit 9 element recognition and6 spatial use recognition. As input data, 2400 image files, 70% of the 3430 image data, were used fortraining, and 1030 data corresponding to the remaining 30% were used for testing. The training processis shown in Figure 8 [8]. In the encoder, it is first bilinearly upsampled to quadruple bilinear andthen linked to the corresponding lower-level features of the network backbone with the same spatialresolution. Then, because lower-level features can contain many channels that can generally maketraining more difficult, another convolution is applied to lower-level features to reduce the number ofchannels. The feature is then reconstructed by applying several 3 × 3 convolutions, and another simplebilinear upsampling is quadrupled. The explanation for this is shown in Figure 8.Appl. Sci. 2020, 10, x FOR PEER REVIEW 10 of 15
Figure 8. Deep Learning Process using DeepLabV3+.
5. Result Analysis
The drawing elements inference result and the space usage inference result were separated and analyzed, and MIOU (mean intersection over union) was used as the accuracy evaluation index. Intersect over union (IOU) is a metric that allows to evaluate how similar a predicted bounding box is to a Ground Truth bounding box. The IOU is very intuitive to interpret because the ratio of the area where the two boxes overlap is compared to the total combined area of the two boxes.
A score of 1 means that the predicted bounding box exactly matches the actual bounding box, and a score of 0 means that the predicted and actual bounding boxes do not overlap at all. The MIOU is the mean-iou, referring to the mean IOU of all classes in an image.
5.1. Results of Recognition and Inference of Drawing Elements & Analysis of Accuracy
Firstly, the experimental results of the inference of drawing elements are outlined in the Table 2 below. Overall, the inferred images parallel the target images, with doors, windows, and sliding doors inferred as well.
Table 2. Original image, result image, target image of experiment1.
Image No. 241 244 252 267 299
Original image
Result image
Target image
Figure 8. Deep Learning Process using DeepLabV3+.

Appl. Sci. 2020, 10, 7347 10 of 14
5. Result Analysis
The drawing elements inference result and the space usage inference result were separated andanalyzed, and MIOU (mean intersection over union) was used as the accuracy evaluation index.Intersect over union (IOU) is a metric that allows to evaluate how similar a predicted bounding box isto a Ground Truth bounding box. The IOU is very intuitive to interpret because the ratio of the areawhere the two boxes overlap is compared to the total combined area of the two boxes.
A score of 1 means that the predicted bounding box exactly matches the actual bounding box,and a score of 0 means that the predicted and actual bounding boxes do not overlap at all. The MIOUis the mean-iou, referring to the mean IOU of all classes in an image.
5.1. Results of Recognition and Inference of Drawing Elements & Analysis of Accuracy
Firstly, the experimental results of the inference of drawing elements are outlined in the Table 2below. Overall, the inferred images parallel the target images, with doors, windows, and sliding doorsinferred as well.
Table 2. Original image, result image, target image of experiment1.
Image No. 241 244 252 267 299
Original image
Appl. Sci. 2020, 10, x FOR PEER REVIEW 10 of 15
Figure 8. Deep Learning Process using DeepLabV3+.
5. Result Analysis
The drawing elements inference result and the space usage inference result were separated and analyzed, and MIOU (mean intersection over union) was used as the accuracy evaluation index. Intersect over union (IOU) is a metric that allows to evaluate how similar a predicted bounding box is to a Ground Truth bounding box. The IOU is very intuitive to interpret because the ratio of the area where the two boxes overlap is compared to the total combined area of the two boxes.
A score of 1 means that the predicted bounding box exactly matches the actual bounding box, and a score of 0 means that the predicted and actual bounding boxes do not overlap at all. The MIOU is the mean-iou, referring to the mean IOU of all classes in an image.
5.1. Results of Recognition and Inference of Drawing Elements & Analysis of Accuracy
Firstly, the experimental results of the inference of drawing elements are outlined in the Table 2 below. Overall, the inferred images parallel the target images, with doors, windows, and sliding doors inferred as well.
Table 2. Original image, result image, target image of experiment1.
Image No. 241 244 252 267 299
Original image
Result image
Target image
Result image
Appl. Sci. 2020, 10, x FOR PEER REVIEW 10 of 15
Figure 8. Deep Learning Process using DeepLabV3+.
5. Result Analysis
The drawing elements inference result and the space usage inference result were separated and analyzed, and MIOU (mean intersection over union) was used as the accuracy evaluation index. Intersect over union (IOU) is a metric that allows to evaluate how similar a predicted bounding box is to a Ground Truth bounding box. The IOU is very intuitive to interpret because the ratio of the area where the two boxes overlap is compared to the total combined area of the two boxes.
A score of 1 means that the predicted bounding box exactly matches the actual bounding box, and a score of 0 means that the predicted and actual bounding boxes do not overlap at all. The MIOU is the mean-iou, referring to the mean IOU of all classes in an image.
5.1. Results of Recognition and Inference of Drawing Elements & Analysis of Accuracy
Firstly, the experimental results of the inference of drawing elements are outlined in the Table 2 below. Overall, the inferred images parallel the target images, with doors, windows, and sliding doors inferred as well.
Table 2. Original image, result image, target image of experiment1.
Image No. 241 244 252 267 299
Original image
Result image
Target image
Target image
Appl. Sci. 2020, 10, x FOR PEER REVIEW 10 of 15
Figure 8. Deep Learning Process using DeepLabV3+.
5. Result Analysis
The drawing elements inference result and the space usage inference result were separated and analyzed, and MIOU (mean intersection over union) was used as the accuracy evaluation index. Intersect over union (IOU) is a metric that allows to evaluate how similar a predicted bounding box is to a Ground Truth bounding box. The IOU is very intuitive to interpret because the ratio of the area where the two boxes overlap is compared to the total combined area of the two boxes.
A score of 1 means that the predicted bounding box exactly matches the actual bounding box, and a score of 0 means that the predicted and actual bounding boxes do not overlap at all. The MIOU is the mean-iou, referring to the mean IOU of all classes in an image.
5.1. Results of Recognition and Inference of Drawing Elements & Analysis of Accuracy
Firstly, the experimental results of the inference of drawing elements are outlined in the Table 2 below. Overall, the inferred images parallel the target images, with doors, windows, and sliding doors inferred as well.
Table 2. Original image, result image, target image of experiment1.
Image No. 241 244 252 267 299
Original image
Result image
Target image
The experimental results are shown in Table 3. The notably high IOU of the EVACUATIONDOORclass is attributable to the fact that evacuation doors are represented on less than 50% of all the drawingimage data for the training and test, which may have led to an absolute lack of learning, impeding theinference. Except the EVACUATIONDOOR class, the mean IOU is 0.8783. Also, in that the slidingdoors are distinguished from the windows despite the difference between the two on the drawingsbeing hardly visible to the naked eye, as shown in the figure below, the semantic segmentation allowsnot only the recognition of the objects in the images at the level of their semantic units, but also thedetection of their spatial features. (Figure 9).
Table 3. IOU of experiment1.
NO. CLASS IOU
1 WALL 0.93742 DOOR 0.90703 WINDOW 0.78644 SLIDINGDOOR 0.80255 EVACUATIONDOOR 0.4489
BACKGROUND 0.9585
MIOU 0.8068Average excluding
EVACUATIONDOOR 0.8783

Appl. Sci. 2020, 10, 7347 11 of 14
Appl. Sci. 2020, 10, x FOR PEER REVIEW 11 of 15
The experimental results are shown in Table 3. The notably high IOU of the EVACUATIONDOOR class is attributable to the fact that evacuation doors are represented on less than 50% of all the drawing image data for the training and test, which may have led to an absolute lack of learning, impeding the inference. Except the EVACUATIONDOOR class, the mean IOU is 0.8783. Also, in that the sliding doors are distinguished from the windows despite the difference between the two on the drawings being hardly visible to the naked eye, as shown in the figure below, the semantic segmentation allows not only the recognition of the objects in the images at the level of their semantic units, but also the detection of their spatial features. (Figure 9).
Table 3. IOU of experiment1.
NO. CLASS IOU 1 WALL 0.9374 2 DOOR 0.9070 3 WINDOW 0.7864 4 SLIDINGDOOR 0.8025 5 EVACUATIONDOOR 0.4489 BACKGROUND 0.9585 MIOU 0.8068
Average excluding
EVACUATIONDOOR 0.8783
Figure 9. Slidingdoor and window, which are difficult to distinguish by form, were accurately inferred.
5.2. Results of Recognition and Inference of Space Usage & Analysis of Accuracy
Secondly, the experiment on the inference of space usage returned the following Table 4 results.
Table 4. Original image, result image, target image of experiment2.
Image No 253 264 269 322 339
Original image
Result image
Figure 9. Slidingdoor and window, which are difficult to distinguish by form, were accurately inferred.
5.2. Results of Recognition and Inference of Space Usage & Analysis of Accuracy
Secondly, the experiment on the inference of space usage returned the following Table 4 results.
Table 4. Original image, result image, target image of experiment2.
Image No 253 264 269 322 339
Original image
Appl. Sci. 2020, 10, x FOR PEER REVIEW 11 of 15
The experimental results are shown in Table 3. The notably high IOU of the EVACUATIONDOOR class is attributable to the fact that evacuation doors are represented on less than 50% of all the drawing image data for the training and test, which may have led to an absolute lack of learning, impeding the inference. Except the EVACUATIONDOOR class, the mean IOU is 0.8783. Also, in that the sliding doors are distinguished from the windows despite the difference between the two on the drawings being hardly visible to the naked eye, as shown in the figure below, the semantic segmentation allows not only the recognition of the objects in the images at the level of their semantic units, but also the detection of their spatial features. (Figure 9).
Table 3. IOU of experiment1.
NO. CLASS IOU 1 WALL 0.9374 2 DOOR 0.9070 3 WINDOW 0.7864 4 SLIDINGDOOR 0.8025 5 EVACUATIONDOOR 0.4489 BACKGROUND 0.9585 MIOU 0.8068
Average excluding
EVACUATIONDOOR 0.8783
Figure 9. Slidingdoor and window, which are difficult to distinguish by form, were accurately inferred.
5.2. Results of Recognition and Inference of Space Usage & Analysis of Accuracy
Secondly, the experiment on the inference of space usage returned the following Table 4 results.
Table 4. Original image, result image, target image of experiment2.
Image No 253 264 269 322 339
Original image
Result image
Result image
Appl. Sci. 2020, 10, x FOR PEER REVIEW 11 of 15
The experimental results are shown in Table 3. The notably high IOU of the EVACUATIONDOOR class is attributable to the fact that evacuation doors are represented on less than 50% of all the drawing image data for the training and test, which may have led to an absolute lack of learning, impeding the inference. Except the EVACUATIONDOOR class, the mean IOU is 0.8783. Also, in that the sliding doors are distinguished from the windows despite the difference between the two on the drawings being hardly visible to the naked eye, as shown in the figure below, the semantic segmentation allows not only the recognition of the objects in the images at the level of their semantic units, but also the detection of their spatial features. (Figure 9).
Table 3. IOU of experiment1.
NO. CLASS IOU 1 WALL 0.9374 2 DOOR 0.9070 3 WINDOW 0.7864 4 SLIDINGDOOR 0.8025 5 EVACUATIONDOOR 0.4489 BACKGROUND 0.9585 MIOU 0.8068
Average excluding
EVACUATIONDOOR 0.8783
Figure 9. Slidingdoor and window, which are difficult to distinguish by form, were accurately inferred.
5.2. Results of Recognition and Inference of Space Usage & Analysis of Accuracy
Secondly, the experiment on the inference of space usage returned the following Table 4 results.
Table 4. Original image, result image, target image of experiment2.
Image No 253 264 269 322 339
Original image
Result image
Target image
Appl. Sci. 2020, 10, x FOR PEER REVIEW 12 of 15
Target image
In Table 5, the accuracy of the inference of pantries and evacuation space is notably low, which may be explained by the fact that the pantries and evacuation space are represented on some, not all, drawings, as in the case of the evacuation doors in the experiment on the inference of drawing elements. Except the pantries and evacuation space, the overall MIOU is 0.9209.
Table 5. IOU of experiment2.
NO. CLASS IOU
1 LIVINGROOM 0.9708 2 ROOM 0.9390 3 BATHROOM 0.9542 4 BALCONY 0.9235 5 DRESSROOM 0.7937 6 ENTRANCE 0.9071 7 EVACUATION 0.4556 8 PANTRY 0.4553 BACKGROUND 0.9580
MIOU 0.8175
Average excluding EVACUATION and PANTRY 0.9209
6. Conclusions
This study was intended to obtain large quantities of datasets by using deep learning for the automatic training with architectural drawings and enabling the automatic recognition, inference and labeling of the drawing elements and space usage represented on architectural drawings. To that end, GOOGLE DeepLabV3+ was used with the floor plans of apartment houses in the experiment. As a result, the accuracy of the inference of such elements as walls, doors, windows and sliding doors from the floor plan images reached 87.83%, while the accuracy of the inference of such space as living rooms, rooms, bathrooms, balconies, and entrances was 92.09%.
The low accuracy found in this study was analyzed in terms of three aspects. First, the data were insufficient. Excluding government-owned corporations such as Korea Land & Housing Corporation, private companies as well as their design sub-contractors hardly publish their architectural drawings and relevant data, which is adverse to the collection of floor plan data. Therefore, in this study, the pixel shifting was conducted for data augmentation as well as other applicable techniques such as flipping or rotation. Second, as for the size of the training data, larger images led to low accuracies. Subsequently, the re-training with the re-sized smaller images proved conducive to higher accuracies. This finding warrants the need for the additional pre-processing of limiting the sizes of images. Yet, when not only the geometry, but also the dimensionality on architectural drawings is to be used, the scales need be kept intact. Any random adjustment of the sizes of images makes it difficult to recognize the scales, which should be taken into account. Third, the accuracy was lower on the drawings where each space was unlabeled than those where the name of each space was present. This result seems attributable to the fact that the difference between the rooms and living rooms on the drawings is vague to the naked eye. To address the challenge, as aforementioned, large amounts of data with names unspecified may be used for training. Alternatively, the hybrid approach of incorporating the deep learning-
In Table 5, the accuracy of the inference of pantries and evacuation space is notably low, which maybe explained by the fact that the pantries and evacuation space are represented on some, not all,drawings, as in the case of the evacuation doors in the experiment on the inference of drawing elements.Except the pantries and evacuation space, the overall MIOU is 0.9209.
Table 5. IOU of experiment2.
NO. CLASS IOU
1 LIVINGROOM 0.97082 ROOM 0.93903 BATHROOM 0.95424 BALCONY 0.92355 DRESSROOM 0.79376 ENTRANCE 0.90717 EVACUATION 0.45568 PANTRY 0.4553
BACKGROUND 0.9580
MIOU 0.8175Average excluding EVACUATION
and PANTRY 0.9209

Appl. Sci. 2020, 10, 7347 12 of 14
6. Conclusions
This study was intended to obtain large quantities of datasets by using deep learning for theautomatic training with architectural drawings and enabling the automatic recognition, inference andlabeling of the drawing elements and space usage represented on architectural drawings. To that end,GOOGLE DeepLabV3+ was used with the floor plans of apartment houses in the experiment. As aresult, the accuracy of the inference of such elements as walls, doors, windows and sliding doors fromthe floor plan images reached 87.83%, while the accuracy of the inference of such space as living rooms,rooms, bathrooms, balconies, and entrances was 92.09%.
The low accuracy found in this study was analyzed in terms of three aspects. First, the data wereinsufficient. Excluding government-owned corporations such as Korea Land & Housing Corporation,private companies as well as their design sub-contractors hardly publish their architectural drawingsand relevant data, which is adverse to the collection of floor plan data. Therefore, in this study, the pixelshifting was conducted for data augmentation as well as other applicable techniques such as flipping orrotation. Second, as for the size of the training data, larger images led to low accuracies. Subsequently,the re-training with the re-sized smaller images proved conducive to higher accuracies. This findingwarrants the need for the additional pre-processing of limiting the sizes of images. Yet, when not onlythe geometry, but also the dimensionality on architectural drawings is to be used, the scales need bekept intact. Any random adjustment of the sizes of images makes it difficult to recognize the scales,which should be taken into account. Third, the accuracy was lower on the drawings where each spacewas unlabeled than those where the name of each space was present. This result seems attributable tothe fact that the difference between the rooms and living rooms on the drawings is vague to the nakedeye. To address the challenge, as aforementioned, large amounts of data with names unspecified maybe used for training. Alternatively, the hybrid approach of incorporating the deep learning-basedimage segmentation and the rule-based coding is applicable as attempted in this study. The hybridapproach has already been documented and proved more accurate than the approach of using thedeep learning only. In the case of rooms and living rooms that are not easy to distinguish based ontheir geometric forms, rules such as the number or geometry of openings and the correlation betweenrooms may be added to increase the accuracy.
Each of the two experimental categories proposed in this study is applicable in practice. First,the recognition of the drawing elements is applicable to the automatic generation of a 3D model foreach object, combination of the elements, and future automation of 3D modeling. Also, the recognitionof walls and openings is applicable to generating the evacuation paths and calculating the evacuationdistances. Moreover, it may be applicable to the automatic calculation of the window and wall areasand the analysis of building energy ratings involving window area ratios. Second, the recognition ofspace enables the training with large quantities of architectural design plans and allows the generationof virtual drawing images using network models including GAN. If the rules necessary for constructingthe architectural space are added to the process, some construction plans fit for specific situationsor requirements can be proposed, which will lay the foundation for future AI-based architecturaldesign techniques.
This study is a study to construct a learning data set essential for deep learning implementationas an early stage for developing artificial intelligence architectural design technology. Using themethod proposed in this study, it is possible to generate a large amount of labeled data, and it can beused to implement artificial intelligence-based architectural design. If more data and more advancednetwork models are used in the future, compared to the existing design method that relies only on theknowledge and experience of experts, it is not only superior in terms of efficiency, but also in terms ofaccuracy because it is based on a large amount of quantitative data. It seems to be possible, This shouldbe considered in future research projects.
Author Contributions: J.S. conceived experiments, analyzed data, and wrote papers; H.P. investigated priorresearch and edited thesis; S.C. supervised the research. All authors have read and agreed to the published versionof the manuscript.

Appl. Sci. 2020, 10, 7347 13 of 14
Funding: This research is a basic research project in the field of science and technology that was conducted withthe support of the Korea Research Foundation with funding from the government (Future Creation Science) in2020. Assignment number: 2019R1A2C2006983.
Conflicts of Interest: The authors declare no conflict of interest.
References
1. Kwon, O.; Cho, J. Quantitative Comparison of BIM Architectural Space Designs by Decision Tree and ExpertSystem. Korean J. Comput. Des. Eng. 2020, 25, 36–44. [CrossRef]
2. Wang, C.; Li, L. Multi-Scale Residual Deep Network for Semantic Segmentation of Buildings with Regularizerof Shape Representation. Remote Sens. 2020, 12, 2932. [CrossRef]
3. Rhee, J.; Chung, J.W. A Study of Automation of Housing Design Method Using Artificial Intelligence—OptimalSpace Exploration with Genetic Algorithm Based on Building Codes. J. Archit. Inst. Korea Fall Conf. 2019,39, 181–184.
4. Lee, Y.G. A Study on the Application of Deep Learning for Automatic Alternative Placement of NurseryArea. Asia-Pac. J. Multimed. Serv. Converg. Art Humanit. Sociol. 2019, 9, 813–821.
5. Kim, H.J.; Kim, M.K.; Jun, H.J. A Study on the Design Generation Process of BIM Design Using AI. J. Archit.Inst. Korea Fall Conf. 2019, 39, 136–139.
6. Lyu, Y.; Vosselman, G.; Wang, X.; Yilmaz, A.; Yang, M.Y. UAVid: A semantic segmentation dataset for UAVimagery. ISPRS J. Photogramm. Remote. Sens. 2020, 165, 108–119. [CrossRef]
7. Lim, H.; Lee, Y.; Jee, M.; Go, M.; Kim, H.; Kim, W. Efficient Inference of Image Objects using SemanticSegmentation. J. Broadcast Eng. 2019, 24, 67–76. [CrossRef]
8. Chen, L.-C.; Zhu, Y.; Papandreou, G.; Schroff, F.; Adam, H. Encoder-Decoder with Atrous SeparableConvolution for Semantic Image Segmentation. CoRR 2018, 833–851. [CrossRef]
9. Shaaban, A.M.; Salem, N.M.; Al-Atabany, W.I. A Semantic-based Scene segmentation using convolutionalneural networks. AEU—Int. J. Electron. Commun. 2020, 125, 153364. [CrossRef]
10. Gu, H.M.; Seo, J.H.; Choo, S.Y. A Development of Façade Dataset Construction Technology Using DeepLearning-based Automatic Image Labeling. Archit. Inst. Korea 2019, 35, 43–53.
11. Fang, W.; Love, P.E.; Luo, H.; Ding, L. Computer vision for behaviour-based safety in construction: A reviewand future directions. Adv. Eng. Inform. 2020, 43, 100980. [CrossRef]
12. Seo, J.; Han, S.; Lee, S.; Kim, H. Computer vision techniques for construction safety and health monitoring.Adv. Eng. Inform. 2015, 29, 239–251. [CrossRef]
13. Arabi, S.; Haghighat, A.; Sharma, A. A deep-learning-based computer vision solution for construction vehicledetection. Comput. Civ. Infrastruct. Eng. 2020, 35, 753–767. [CrossRef]
14. Chen, L.; Wang, Y.; Siu, M.-F.F. Detecting semantic regions of construction site images by transfer learningand saliency computation. Autom. Constr. 2020, 114, 103185. [CrossRef]
15. Chow, J.; Su, Z.; Wu, J.; Tan, P.; Mao, X.; Wang, Y. Anomaly detection of defects on concrete structures withthe convolutional autoencoder. Adv. Eng. Inform. 2020, 45, 101105. [CrossRef]
16. Zhang, C.; Chang, C.C.; Jamshidi, M. Concrete bridge surface damage detection using a single-stage detector.Comput. Civ. Infrastruct. Eng. 2019, 35, 389–409. [CrossRef]
17. Wang, N.; Zhao, X.; Zou, Z.; Zhao, P.; Qi, F. Autonomous damage segmentation and measurement of glazedtiles in historic buildings via deep learning. Comput. Civ. Infrastruct. Eng. 2019, 35, 277–291. [CrossRef]
18. Wang, L.; Kawaguchi, K.; Wang, P. Damaged ceiling detection and localization in large-span structures usingconvolutional neural networks. Autom. Constr. 2020, 116, 103230. [CrossRef]
19. Alomani, A.; El-Rayes, K. Automated generation of optimal thematic architectural layouts using imageprocessing. Autom. Constr. 2020, 117, 103255. [CrossRef]
20. Upasani, N.; Shekhawat, K.; Sachdeva, G. Automated generation of dimensioned rectangular floorplans.Autom. Constr. 2020, 113, 103149. [CrossRef]
21. Yang, F.; Li, L.; Su, F.; Li, D.; Zhu, H.; Ying, S.; Zuo, X.; Tang, L. Semantic decomposition and recognitionof indoor spaces with structural constraints for 3D indoor modelling. Autom. Constr. 2019, 106, 102913.[CrossRef]
22. Khalili-Araghi, S.; Kolarevic, B. Variability and validity: Flexibility of a dimensional customization system.Autom. Constr. 2020, 109, 102970. [CrossRef]

Appl. Sci. 2020, 10, 7347 14 of 14
23. Czerniawski, T.; Leite, F. Automated digital modeling of existing buildings: A review of visual objectrecognition methods. Autom. Constr. 2020, 113, 103131. [CrossRef]
24. Wei, Y.; Akinci, B. A vision and learning-based indoor localization and semantic mapping framework forfacility operations and management. Autom. Constr. 2019, 107, 102915. [CrossRef]
25. Hamid-Lakzaeian, F. Structural-based point cloud segmentation of highly ornate building façades forcomputational modelling. Autom. Constr. 2019, 108, 102892. [CrossRef]
26. Zhao, Z.Q.; Zheng, P.; Tao Xu, S.; Wu, X. Object Detection with Deep Learning: A Review. arXiv 2019,arXiv:1807.05511v2. [CrossRef]
27. Long, J.; Shelhamer, E.; Darrell, T. Fully convolutional networks for semantic segmentation. In Proceedingsof the IEEE Conference on Computer Vision and Pattern Recognition, Boston, MA, USA, 7–12 June 2015;pp. 3431–3440.
28. Chen, L.C.; Papandreou, G.; Kokkinos, I.; Murphy, K.; Yuille, A. Semantic Image Segmentation with DeepConvolutional Nets and Fully Connected CRFs. arXiv 2014, arXiv:1412.7062.
29. Qiao, S.; Chen, L.-C.; Yuille, A. DetectoRS: Detecting Objects with Recursive Feature Pyramid and SwitchableAtrous Convolution. arXiv 2020, arXiv:2006.02334.
30. Chen, L.-C.; Papandreou, G.; Kokkinos, I.; Murphy, K.; Yuille, A.L. DeepLab: Semantic Image Segmentationwith Deep Convolutional Nets, Atrous Convolution, and Fully Connected CRFs. IEEE Trans. Pattern Anal.Mach. Intell. 2017, 40, 834–848. [CrossRef] [PubMed]
31. Chen, L.-C.; Papandreou, G.; Schroff, F.; Adam, H. Rethinking Atrous Convolution for Semantic ImageSegmentation. arXiv 2017, arXiv:1706.05587.
32. Cubuk, E.D.; Zoph, B.; Shlens, J.; Le, Q.V. Randaugment: Practical automated data augmentation with areduced search space. arXiv 2020, arXiv:1909.13719v2.
33. Kim, S.; Noh, Y.-K.; Park, F.C. Efficient neural network compression via transfer learning for machine visioninspection. Neurocomputing 2020, 413, 294–304. [CrossRef]
34. Tajbakhsh, N.; Shin, J.Y.; Gurudu, S.R.; Hurst, R.T.; Kendall, C.B.; Gotway, M.B.; Liang, J. ConvolutionalNeural Networks for Medical Image Analysis: Full Training or Fine Tuning? IEEE Trans. Med Imaging 2016,35, 1299–1312. [CrossRef]
Publisher’s Note: MDPI stays neutral with regard to jurisdictional claims in published maps and institutionalaffiliations.
© 2020 by the authors. Licensee MDPI, Basel, Switzerland. This article is an open accessarticle distributed under the terms and conditions of the Creative Commons Attribution(CC BY) license (http://creativecommons.org/licenses/by/4.0/).