Inequality and Happiness: The Role of Perceptions of the Distributive Process (Master Thesis)
87
Inequality and Happiness: The Role of Perceptions of the Distributive Process Master Thesis MSc Sociology
Transcript of Inequality and Happiness: The Role of Perceptions of the Distributive Process (Master Thesis)

Inequality and Happiness:
The Role of Perceptions of the Distributive Process
Master Thesis MSc Sociology

August 2014
Candidate number: 370276
ABSTRACT
The stock of research has produced contradicting findings on the much-debated
happiness-impact of inequality. The strength and direction of this impact has
been thought to depend on several external factors: relative concerns, personal
future expectations, and perceptions of the distributive process. Previous findings
provide support for these presumed links, although some links are still awaiting
empirical assessment. For instance, it is not clear yet whether inequality amplifies
the positive happiness-impact of having optimistic beliefs about one’s future.
Furthermore, the level of inequality and people’s perceptions on the distributive
process, have been thought to shape people’s incentives to compete for high
social positions. However, it remains questionable whether rising inequalities are
interpreted in the same way by people regardless of the (perceived) social-
distributive contexts. Rather than people being intrinsically inclined to compete
(given a certain level of inequality), a great deal may depend on the cultural-
ideological context, fostered by the (perceived) distributive context. Certain
context could undo any effect of the level of inequality upon people’s competitive
incentives. Eventually, the resulting intensity of competitive pressures is thought
to affect happiness. Cross-national survey data were analysed using regression
analysis. Two datasets were used, because no single dataset contains all required
information: one worldwide (18 countries) and one European (33 countries).
Overall, happiness turned out not to be unaffected by inequality, regardless of the
kind of popular perceptions on the distributive process in societies. Instead, the
effect of inequality was rather dependent upon the perceived corruption-level (for
Europe), being negative for corrupt countries. The patterns were also identical for
people with and without strong relative concerns. Finally, the happiness-benefits
Master Thesis MSc Sociology - Candidate No. 370276 1

of being optimistic about one’s own future were not larger in more unequal
societies. However, regarding this, the results were sensitive to the specific
inequality-measure used.
ACKNOWLEDGEMENTS
I would like to thank Robert de Vries and Tim Huijts, for
supervising me in this masterthesis-project. I benefited
largely from their insights and advices. Furthermore, I
would like to thank the people close to me for indirectly
inspiring me, or for suggesting interesting literature, in
our discussions about inequality.
Master Thesis MSc Sociology - Candidate No. 370276 2

CONTENTS
1. Introduction
04
1.1 Literature Review
06
2. Theory
08
2.1 Theoretical Overview
08
2.2 Theoretical Framework
12
Master Thesis MSc Sociology - Candidate No. 370276 3

3. Data and Methods
14
3.1 Dependent Variable
15
3.2 Explanatory Variables: Micro-Level
16
3.3 Explanatory Variables: Macro-Level
17
3.4 Control Variables
18
3.5 Methods 19
4. Results 20
4.1 Popular Meritocratic Perceptions and Relative
Concerns 20
4.2 Optimism/ Pessimism 21
5. Conclusion and Discussion
30
APPENDIX 37
A Variable-Details
37
B Data-Sources
47
C Model-Comparison
48
D Additional Results
49
Master Thesis MSc Sociology - Candidate No. 370276 4

REFERENCES 52
1. INTRODUCTION
Research has indicated that happiness is ranked the most
important eventual life-goal by people (Inglehart, 1985:
110). Moreover, all sorts of states and events have been
associated with happiness, such as marriage (Myers, 1999;
Lee & Ono, 2012) and employment (Whelan & McGinnity, 2000;
Stavrova et al., 2011; Russell et al., 2013). In addition, a
whole body of literature has focused on the effect of
income-inequality on happiness. This theme has particularly
risen from the 1970s, from which large-scale comparative
survey-data became available. A potential other source of
the increased attention since then is the sudden reversal of
a long-standing income-equalizing trend throughout the world
(Esping-Andersen, 2009: 56). This could have had
consequences for people’s happiness.
Still, much is unclear about the direction of the effect and
how the interplay of several factors may attenuate
potentially harmful effects of inequality. Previous studies
have arrived at contradicting results. Some studies have
Master Thesis MSc Sociology - Candidate No. 370276 5

found a negative impact of inequality on happiness: in
multiple world-regions in the 1970s by Veenhoven (1984) and
in the 2000’s by Fischer (2009) and in the same years for
South-America (Graham & Felton, 2005) and for Japan (Oshio &
Kobayashi, 2010), for the US throughout the last four
decades (Blanchflower & Oswald, 2003; Oishi, Kesebir &
Diener, 2011) and for the European non-rich and the American
rich by Alesina et al. (2004). Conversely, other studies have
documented a positive effect: for Canada during the 1970s by
Tomes (1986), for Britain in the 1990s (Clark, 2003) and
across world-regions for the last two decades (Berg &
Veenhoven, 2010; Bjørnskov et al, 2013). A null-effect was
reported by Senik (2002) for Russia in the 1990s.
This work aims to clarify this confusion about the impact of
inequality, with possibly fruitful implications for policy.
For this aim, two different theoretical approaches were
integrated. Particularly some puzzling differences between
Eastern-European and Western-European findings could be
clarified. Specifically, Caporale et al (2009) showed that
the effect of inequality (a higher gap between the
respondent’s income and the average income of his
demographic reference-group) was positive for the happiness
of Eastern-Europeans and negative in West-Europe (Senik,
2008; Caporale et al., 2009). According to the authors, this
pattern reflects regional differences in perceived social
mobility possibilities and people’s relative concerns.
Specifically, relative concerns are people’s pre-occupations
with their location in the economic hierarchy (Duesenberry,
Master Thesis MSc Sociology - Candidate No. 370276 6

1949; Hopkins, 2008). In short, relative concerns could
foster different interpretations of the same inequalities,
depending on which (perceived) societal-distributive context
people find themselves in. Indeed, this perceived context
differs systematically along the East-West line, with
Eastern Europeans being much more susceptible in calling
their society meritocratic (Marshall et al., 1999; Roex,
2013).
The perspective here combines the relative concerns-approach with
another approach focusing on people’s perceptions of social
mobility and the distributive process. Here it is expected
that inequality has a different impact on people in
perceived meritocracies than in societies perceived as less
meritocratic (‘perceived non-meritocracies’). Central are
the assumptions that both inequality and popular
meritocratic perceptions influence the intensity of status-
competition in a society, and that this competition is
thought to reduce happiness among people. Furthermore,
people with stronger relative concerns are thought to be
more vulnerable for these forces, because such concerns
capture a competitive element. In short, this study aims to
answer the following main question:
How do meritocratic perceptions on the income-distributive process, either as
popular society-wide perceptions or as personal perceptions, influence the effect
that inequality has on people’s happiness?
Specifically, a society-wide endorsed ‘meritocratic promise’
of economic opportunities for all who deploy their
Master Thesis MSc Sociology - Candidate No. 370276 7

abilities, may impose a certain cultural-normative pressure
on people to compete for high income-positions (Neves, 2000;
Swierstra & Tonkens, 2008 Fourcade, 2013; Roex, 2013).
However, empirical studies have only addressed the role of
people’s personal perceptions on the distributive process,
rather than popularly held perceptions in societies (Alesina
et al., 2004; Fischer, 2009; Jiang, Lu & Sato, 2011;
Bjørnskov et al., 2013). This study will contribute to the
literature by examining both the role of popular and personal
meritocratic perceptions. The inequality-level and both
popular and personal meritocratic perceptions have been
thought to influence people’s incentives, opportunity-sets
and strategies (Alesina et al., 2004; Jiang, Lu & Sato,
2011; Bjørnskov et al., 2013).
Furthermore, it has been thought that those living in more
meritocratic societies, or who perceive their society as
more meritocratic, are more optimistic about their own
financial future mobility (Caporale et al., 2009; Jiang, Lu
& Sato, 2011; Bjørnskov et al., 2013). Conversely, Alesina
et al. (2004) conjectured that meritocratic perceptions
could foster anxiety in people about downward mobility.
Common in these works is the expectation that a rising
income-inequality amplifies these effects. In fact,
optimists have higher top-incomes to endeavour and
pessimists have a deeper bottom to fear. No previous study
has examined both rivalling hypotheses about the effects of
personal meritocratic perceptions, nor has the possible
interaction between the effects of such perceptions and
Master Thesis MSc Sociology - Candidate No. 370276 8

inequality been examined. This study provided a first
indicative look at this issue.
1.1 Literature Review
The literature on the link between inequality and happiness
consists of predominantly quantitative comparative work. The
ambiguity of reported effects of inequality across these
previous studies, could point to external factors that (a)
vary between contexts/ studies and (b) influence the effect
that inequality has on happiness. For instance, the extent
to which the poorest or the richest benefit from a change in
the income-distribution, was shown to matter for people’s
happiness. Specifically: when the poorest 20% suffered, the
average happiness in a society declined, whereas happiness
increased when the richest 20% experienced an income-loss
(Blanchflower & Oswald, 2004). Furthermore, studies
suggested that the effect of inequality depended upon
people’s evaluations of the underlying distributive process
(Fischer, 2009; Jiang, Lu & Sato, 2011; Bjørnskov et al.,
2013). Specifically, inequalities resulting from
discriminative processes reduced the average happiness in a
society. Conversely, inequality that resulted from a more
meritocratic distributive process, positively influenced
people’s happiness. Additionally, the effect of inequality
may depend on people’s relative concerns (Caporale et al.,
2009). In fact, many studies have suggested that such
concerns are widespread among people, and that these affect
Master Thesis MSc Sociology - Candidate No. 370276 9

their happiness (Frey & Stutzer, 2002; Blanchflower &
Oswald, 2004; Ferrer-i-Carbonell, 2005; Luttmer, 2005; Ball
& Chernova, 2008; Clark et al., 2008; Senik, 2008; Layard et
al., 2009). For instance, Easterlin (1974) showed that in
advanced economies, people’s social status or relative
income influenced their happiness. Moreover, a low social
status was shown to induce frustration (Henry, 2009), and
the position of one’s income in the income-distribution (the
relative income) had stronger happiness-implications than the
absolute income (Ball & Chernova, 2008), or equally strong
(Layard et al., 2009). Likewise, Caporale et al. (2009)
found that the happiness-gains of earning a high absolute
income were smaller when the average incomes of similar
people was high as well (although only for Western-
Europeans).
However, disagreement persists regarding whether people
compare themselves to these similar others (Senik, 2002;
Clark, 2003; Ferrer-i-Carbonell, 2005; Caporale et al.,
2009), or rather to the top (Blanchflower & Oswald, 2004;
Hopkins & Kornienko, 2009). Hopkins & Kornienko (2009: 554)
assumed that although people with relative concerns compete
with similar others in everyday life, they eventually aspire
to reach the top. This view will be taken here as well.
Similarly, relative concerns can emphasize an individual’s
rank or rather his deviation from the mean in the income-
distribution (Hopkins, 2008). This has different
consequences for how inequality influences happiness. For
instance, assume that the incomes of the top rise, whereas
Master Thesis MSc Sociology - Candidate No. 370276 10

the incomes of all other income-groups remain stable.
Members of the other income-groups would become more unhappy
if their social comparisons are mean-oriented and directed
at the top-incomes, rather than rank-oriented. Following
Hopkins (2008) and Hopkins & Kornienko (2009), I assumed
rank-oriented relative concerns, because people are probably
more aware of their approximate rank than of the mean
income.
Finally, as mentioned in the introduction, some scholars
expected that inequality would amplify the happiness-
benefits of being optimistic about one’s own socio-economic
future. This has not been examined yet. Furthermore, people
with meritocratic perceptions were expected to be more
optimistic about their future than other people (Jiang, Lu &
Sato, 2011; Bjørnskov et al., 2013). Suggestive is the
finding that people who perceive their society as
meritocratic, tend to be more happy with inequality
(Fischer, 2009; Bjørnskov et al., 2013). Moreover, Jiang, Lu
& Sato (2011) showed that optimists were indeed more happy.
However, the literature has not yet examined whether people
with meritocratic perceptions are more often such optimists
compared to other people. Furthermore, research has not yet
tested the equally plausible counter-hypothesis expressed by
Alesina et al. (2004) that meritocratic perceptions would
foster pessimism about one’s future mobility.
Master Thesis MSc Sociology - Candidate No. 370276 11

2. THEORY
The consequences of inequality on happiness have received
attention from multiple disciplines, which has generated a
plurality of theoretical approaches. Some main approaches
are discussed below. Here, I used the ideas from Hopkins
(2008) and Hopkins & Kornienko (2009; 2010), Elster (2009),
Swierstra & Tonkens (2008) and Fourcade (2013) in
particular. Given the evident variability of the effect of
inequality on happiness between studies, any theoretical
account should include a contextual factor upon which this
effect is dependent. Here, popular meritocratic perceptions
were newly considered as a contextual factor.
2.1 Theoretical Overview
It has been argued that having relative concerns is a
natural human tendency, resulting from biological-
psychological tendencies or from rational action
(Duesenberry, 1949; Frank, 1985; Hopkins, 2008). By
contrast, other arguments have presented relative concerns
as a latent human attribute that is reinforced by some
popular beliefs and norms about success and competition
(Merton, 1939; Caporale et al., 2009, p. 48; Verhaeghe,
2011). Either way, in the relative concerns-approach, the effect
of inequality on happiness differs between individuals,
Master Thesis MSc Sociology - Candidate No. 370276 12

depending on their relative position (Duesenberry, 1949;
Ball & Chernova, 2004; Caporale et al., 2009; Bjørnskov et
al., 2013). Specifically, if more inequality implies a lower
position for an individual, his happiness will decline, and
vice versa. However, an alternative variant of this approach
(Hopkins, 2008; Hopkins & Kornienko, 2009; 2010) expects one
identical effect of inequality for all people, regardless of
their income-position. This variant, which I will call the
status-competition model, depicts people with relative concerns
as strategic actors in a status-competition in which
eventually all people lose (in terms of happiness). Firstly,
the approach elaborates on a competition for a high visible
position (to be distinguished from genuinely high income-
positions) (Hopkins, 2008; Hopkins & Kornienko, 2009; 2010).
Essentially, in order to assess their own relative position,
people must also assess that of others. Because they lack
direct information on this, people focus at visible clues
such as consumption-patterns. In turn, people actively
display their position by their consumption-patterns
(Hopkins & Kornienko, 2009). One sort of consumption has
been thought to function primarily to signal social
position, coined ‘conspicuous consumption’ by Veblen (1899:
50-70). Specifically, less inequality is thought to catch
people in a strategic dilemma that prevents them from a more
adequate satisfaction of their desires. Indeed, competitors
mutually reinforce each other’s excessive involvement. Each
competitor has a choice regarding how to divide his budget
between ‘conspicuous consumption’ and ‘normal consumption’.
Master Thesis MSc Sociology - Candidate No. 370276 13

In making this choice, he anticipates on the behaviour of
others (Hopkins, 2008; Hopkins & Kornienko, 2009; 2010). An
individual increases his visible position by consuming
relatively more status-goods than most similar others,
creating a discrepancy between his visible position and his
income-position. However, this discrepancy is only a
temporary one, because similar others and those situated
above him will wipe out his previous accomplishments and
restore the initial rank-order by their own conspicuous
consumption. Subsequently, our individual needs to consume
additional status goods in other to retain this discrepancy.
However, his capacity to do so will face a limit at some
point, imposed by his budget constraint. The lower his
genuine income-position, the more quickly this limit will
appear. Consequently, eventually the visible and genuine
relative position of all individuals will be equal.
Regarding happiness, people will have ‘lost’ some happiness by
strategically spending an excessive amount on status-goods;
money they could have spent on more intrinsically preferred
goods. Moreover, people have not achieved a higher visible
position with this conspicuous consumption. Thus, this
status-competition involves a happiness-loss for all, and
more so when the intensity of this competition is higher.
This intensity will be higher in more equal societies. Note
that this goes contrary to Wilkinson & Pickett’s (2010)
expectation that it is rather more inequality that fosters
competitive pressures. Conversely, the status-competition
model expects that more equality provides stronger
Master Thesis MSc Sociology - Candidate No. 370276 14

incentives for individuals to intensely compete for a high
visible status. Specifically, imitating the consumption
patterns of the richer ranks is easier for competitors in
more equal societies, because of the smaller income-
differences between them and the richer rank. Thus,
increasing one’s visible position has become relatively
cheaper. Conversely, in more unequal societies, it is harder
for people to increase their visible status. Therefore,
individuals will more quickly refrain from participating in
this status-competition. In the end, for both societies,
people’s visible position will eventually be equal to their
genuine income-position. But the overall happiness-loss is
larger in more equal societies, because people are longer
caught into this competition.
However, the status-competition model does not state that
more equality does always make people worse off. The model
elaborates on another status-competition that would generate
the opposite relationship between inequality and happiness:
the competition for high income-positions. Instead of
choosing how to divide their monetary budget between normal
and conspicuous consumption, people here choose how to
divide their time between leisure and effort (Hopkins &
Kornienko, 2010). If incomes are less equally distributed,
the additional income-gain of investing an additional amount
of effort for a higher income-position, is higher.
Consequently, the competition for income-positions will be
more intense in more unequal societies. This will catch
people into a similar strategic dilemma, in which each
Master Thesis MSc Sociology - Candidate No. 370276 15

contestant is held to exert more effort than would have been
necessary without competitive pressures (Hopkins, 2008;
Hopkins & Kornienko, 2010). In such cases, inequality will
harm the happiness of all. In sum, the effect of income-
inequality on happiness is ambiguous in the status-
competition model. The eventual direction of the effect of
equality on happiness depends on which of the described
forces are more salient in a society (Hopkins, 2008).
Another approach may provide insights on the relative
salience of each of these forces. This approach emphasizes
the role of people’s perceptions on the distributive process
generating the income-differences. The literature has
particularly focused on people’s perceptions on the
importance of effort and ability for individual economic
opportunities, and on the perceived role of discrimination
(Alesina et al., 2004; Fischer, 2009; Jiang, Lu & Sato,
2011; Bjørnskov et al., 2013). This approach will be called
the perceived meritocracy thesis. Occupying a high relative position
may have a strong moral superior connotation when
meritocratic perceptions are high, since such a position is
thought to reflect several virtues of an individual, such as
industriousness. Conversely, a low relative position may be
associated with laziness and is therefore vulnerable for
stigma (Neves, 2000; Swierstra & Tonkens, 2008; Fourcade,
2013). Specifically, popular meritocratic perceptions can be
considered as fostering a society-wide social norm to
endeavour and achieve high positions. This norm disfavours
being poor or unemployed, when this is considered to reflect
Master Thesis MSc Sociology - Candidate No. 370276 16

laziness. An individual’s relative position may determine
the amount of received immaterial social benefits or costs
(disapproval). In all, meritocratic perceptions increase
both the financial incentives to compete (given the high
perceived success-probability: Boudon, 1981), as well the as
social incentives to compete.
The social norms-literature provides insights to clarify
these social incentives. Here I adopt a notion of social
norms advocated by Bicchieri (2006) and Elster (2009),
rather than of Parsons (1937) and Merton (1968), in which
people can be strongly concerned about the responses of
others without having internalized the norms themselves.
Indeed, social norms are why popular meritocratic perceptions
may be more important determinants of people’s strategies
than their personal perceptions. For example, a low-income
individual who questions the ‘meritocratic fairytale’ may be
aware of a high popular belief in this throughout his
society. This awareness can reduce his happiness, because he
can be considered as lazy and can expect social sanctions.
Research has indicated that people have a strong distaste
for being disapproved by others (Christensen et al., 2004;
Spitzer et al., 2007), which is considered the most
fundamental social sanction (Elster, 2009). Thus, social
pressure may also induce people with low meritocratic
perceptions to compete for high status-positions in
popularly perceived meritocracies. Consequently, people
collectively exert more effort than would be necessary
without such a competition, and some happiness is lost. My
Master Thesis MSc Sociology - Candidate No. 370276 17

assumptions go contrary to Bjørnskov et al.’s (2013)
suggestion that the ‘sceptical’ individuals would opt for
unemployment. However, by opting for unemployment, they risk
facing disapproval from others. The accompanying disutility
from this may outweigh the benefits from refraining from a
presumably senseless effort. Illustratively, studies have
shown a negative happiness-impact of joblessness (Whelan &
McGinnity, 2000; McKee-Ryan et al., 2005; Stavrova et al.,
2011; Russell et al., 2013), which was stronger in countries
with a stronger social norm to work (Stavrova et al., 2011).
Alternatively, other accounts focus on people’s personal
perceptions rather than on popular perceptions. Such
accounts often state that individuals with meritocratic
perceptions may be optimistically incentivized to compete
for high positions (Jiang, Lu & Sato, 2011; Bjørnskov et
al., 2013). In fact, Senik (2002) and Caporale et al. (2009)
conjectured that Eastern-Europeans tend to interpret rising
inequalities between their own incomes and that of similar
others, as a sign of rising opportunities to move upwards.
By contrast, Alesina et al. (2004) conjectured that
perceptions of a high social mobility may make people
anxious about the possibility of moving downward, and more
so when the income-differences are larger. A meritocracy
involves positions that are not pre-fixed for a lifetime and
contingent upon the employee’s performance relative to other
potential incumbents. Therefore, meritocratic perceptions
may foster status-insecurity in people.
2.2 Theoretical Framework
Master Thesis MSc Sociology - Candidate No. 370276 18

Here I will combine the relative-concerns approach and the perceived
meritocracy-thesis. As discussed above, the status-competition
model expects people’s pressure to compete for a high status
to depend upon the level of inequality in societies. Even
more, such competitive pressures could be fed (or
discouraged) by certain popular discourses in societies: the
popularity of meritocratic perceptions. In fact, such
perceptions can heighten the pressure to compete, regardless
of the level of income-inequality in a society. Thus,
societies with highly popular meritocratic perceptions will
witness an intense status-competition, regardless of the
level of inequality.
Regarding the competition for high visible positions in such
‘perceived meritocracies’, the rising financial costs of
increasing one’s visible position when inequality is rising,
may be exceeded by the social benefits of doing so. Thus,
popular meritocratic perceptions could partly wipe out the
‘discouraging’ effect of inequality on people to compete for
a high visible status. Indeed, these social benefits may
induce people to keep consuming status-goods beyond their
budget constraint. Today, buying on credit is a widespread
phenomenon. Conversely, regarding ‘perceived non-
meritocracies’, the intensity of this competition depends
more strongly on the inequality-level. This is because
additional (social) incentives to compete are virtually absent
in such societies. In conclusion, the positive association between
inequality and happiness would be weaker in perceived meritocracies than in
perceived non-meritocracies, or even be absent.
Master Thesis MSc Sociology - Candidate No. 370276 19

Similarly, the competition for high income-positions, while
initially weakened by a larger equality, could be re-
intensified by higher popular meritocratic perceptions.
Whereas the financial benefits of increasing one’s income-
position may be relatively low, the social benefits are
high. Because inequality partly determines the financial
benefits of rising-up to a higher income-position,
inequality influences the intensity of competition (and thus
people’s happiness) among perceived meritocracies.
Conversely, in perceived non-meritocracies, the inequality-
level does not influence the intensity of this competition
(and thus people’s happiness). This is because ‘investing’
much effort in a competition for high income-positions is
popularly considered as ‘naïve’ in such societies: social
positions are dominantly thought to be unrelated to
individuals’ effort. Consequently, both the financial and
social incentives of exerting much effort to achieve a high
income-position, are low in such societies, regardless of
their inequality-levels. In all, the negative impact of inequality on
happiness will be stronger for perceived meritocracies relative to perceived non-
meritocracies.
Net of all, inequality would be positively (or less
negatively) associated with happiness in perceived non-
meritocracies. Combined with the lower popularity of
meritocratic perceptions in Eastern-Europe (Marshall et al.,
1999; Roex, 2013), an East-West difference may be expected
in the inequality-happiness relationship. Furthermore, the
predicted patterns may be more pronounced among people with
Master Thesis MSc Sociology - Candidate No. 370276 20

stronger relative concerns, who are by definition more
responsive to competitive pressures.
Thus:
H1: inequality has a negative impact on happiness in perceived
meritocracies, whereas its impact in perceived non-meritocracies is likely
reversed, or weaker-negative.
This study will also consider individuals’ personal
perceptions of the distributive process. When people
perceive their society as meritocratic, their perceptions
can either emphasize the opportunities to move upwards or
the risks of moving downwards. In turn, people’s optimism or
pessimism will have larger happiness-impacts in more unequal
societies, since higher inequalities provide a higher top to
look forward to for optimists and a deeper bottom to fear
for pessimists. In sum, meritocratic perceptions may
generate different effects of inequality on happiness. If
meritocratic perceptions foster optimism in people, any
negative effects of inequality will be softened and any
positive effects will be strengthened. The inverse applies
if meritocratic perceptions foster pessimism.
Thus:
H2a: People with meritocratic perceptions are more often optimistic about
their future mobility than other people, and optimism increases people’s
happiness. The level of inequality enlarges this happiness-gain of optimism.
Alternatively:
Master Thesis MSc Sociology - Candidate No. 370276 21

H2a: People with meritocratic perceptions are more often pessimistic about
their future mobility than other people, and pessimism reduces happiness.
The level of inequality enlarges this happiness-penalty of pessimism.
3. DATA AND METHODS
For hypothesis 1, data were used from the most recent World
Values Study (WVS) (2010-2012). This dataset covers
countries from many continents and an item about relative
concerns. Furthermore, the strong international coordination
of the data collection process has produced a high cross-
national comparability of the data. Moreover, the WVS has
been used by a number of previous studies on happiness and
inequality (e.g. Ball & Chernova, 2008; Fischer, 2009;
Bjørnskov et al., 2013), which eases the reflection upon the
present results from previous findings. The dataset contains
51 countries and 72,739 adult-respondents, randomly sampled
from their national populations through stratified
probability-sampling. Face-to-face interviews had been used
to collect the data. More information about the data can be
found at www.worldvaluessurvey.org. Unfortunately,
information on personal meritocratic perceptions (and on the
popularity of meritocratic perceptions through aggregation)
was only available for 18 countries. This information was
extracted from the International Social Survey Programme’s
Social Inequality Module 2009, which did not cover all WVS-
countries (Table A3). In these countries, 27,345 respondents
were interviewed. For the descriptive and predictive
Master Thesis MSc Sociology - Candidate No. 370276 22

analyses, only those respondents were retained who had no
missing values at any of the explanatory, dependent and
control variables. As a result, 4,530 respondents were
omitted. Income and people’s self-reported class-position
entailed a relatively large number of missing values (5%).
Still, I kept these variables in the analyses because these
were substantial confounders.
For the second hypotheses, the third European Quality of
Life Survey (EQLS) (Eurofound, 2011-2012) was used. This
dataset contains information on respondents’ optimism/
pessimism about their future financial situation. Again, the
data are highly comparable between countries thanks to a
strong central coordination of the data-collection. The
sampling procedure is very similar to that of the WVS. More
information about the data is provided in the reports of
Vila et al. (2013) and Eurofound & GfK EU3C (2013). The
EQLS-dataset contains 34 countries from all different
European regions and cover all 28 EU-member-states.
Eventually, one country was dropped from the analyses,
because of missing values at virtually all macro-level
variables (Kosovo). Again, respondents with missing values
were omitted, resulting in a workable sample of 29,745
adult-respondents. In order to prevent a more dramatic loss
of respondents, I decided to control for people’s income-
quartile (in their country) instead of their absolute
income. Furthermore, I omitted EGP as a control-variable, as
I would lose as much as 56% of my workable sample by
including this variable. Finally, for the analyses assessing
Master Thesis MSc Sociology - Candidate No. 370276 23

the link between meritocratic perceptions and optimism/
pessimism, the sample had shrunk to only 23 countries and
22,512 respondents. Fortunately, the proportional
representation of optimists, pessimists and neutrals was
virtually identical as in the larger sample.
The variables are discussed below. Appendix A displays the
exact wording of the selected survey-items for the variables
of interest, and their operationalization. In addition,
descriptive statistics are displayed in Table A2. Appendix
B outlines how to access the used datasets.
3.1 Dependent Variable
Happiness consists of an affective and cognitive component
(Blanchflower & Oswald, 2004; Berg & Veenhoven, 2010;
Russell et al., 2013). The affective component configures
people’s overall, ‘typical’ mood, whereas the cognitive
aspect reflects the extent to which people think their life
fits their desired life (Berg & Veenhoven, 2010). Self-
reported happiness and life-satisfaction are the two most
often used quantitative measures for happiness. A recent
discussion focuses on the claim that these two measures
actually measure different things. Whereas some authors find
a high correlation between the two (Alesina et al., 2004),
others do not (Bjørnskov et al., 2013). Still, Blanchflower
& Oswald (2004) generated very similar outcomes with each
measure. Here I found that the two correlate fairly high but
Master Thesis MSc Sociology - Candidate No. 370276 24

probably not as strong as one would expect if they measure
the same (rho = .53, p < .001). Because self-reported
happiness more directly asks people about their happiness, I
preferred this item. Specifically, respondents had rated
their happiness at an ordinal point-scale running from not
at all happy to completely happy.
Previous findings grant some validity to the self-reported
happiness measure: it is highly correlated with physical
responses that have often been thought to reflect happiness
(Seidlitz et al., 1997; Alesina et al., 2004; Blanchflower &
Oswald, 2004; Ball & Chernova, 2008). However, there can be
cross-cultural variation in how respondents interpret and
respond to happiness-questions at a survey (Bjørnskov et
al., 2013). Fortunately, as Berg & Veenhoven (2010) argue,
the fact that people in different countries and among
different studies have been shown to react very similarly in
their self-reported happiness to a host of events (for
example: Di Tella et al., 1997; Frey & Stutzer, 2002;
Blanchflower & Oswald, 2004; Berg & Veenhoven, 2010; Russell
et al., 2013), provides confidence in the belief that the
influence of cultural differences is not a serious problem.
Clearly, most respondents were happy, both in the WVS- and
EQLS sample (see Table A2). In the WVS, as much as 86%
reported to be (very) happy, whereas the remaining 14%
reported to be not very happy or not at all happy. In the
EQLS, slightly more than half of the sample (54%) scored an
8 on a scale from 1 (very unhappy) to 10 (very happy). Only
less than 10% (8%) scored below 5. Moreover, as much as 72%
Master Thesis MSc Sociology - Candidate No. 370276 25

scored between a 7 and 10. In both datasets, happiness was
non-normally distributed.
3.2 Explanatory Variables: Micro-Level
Relative concerns were captured by an item asking respondents
how important it is for them ‘to be rich and possess many
high-priced goods’ (World Values Survey Association, 2012:
6). This captures both concerns with both visible status and
income-position. Respondents could indicate the strength of
their concerns at a 6-pointscale. The sample was subdivided
into a group with strong relative concerns and those without
strong concerns about their position. For the full sample,
relative concerns were entered as a continuous variable.
Notably, approximately two-third of the sample reported only
weak or no relative concerns.
Furthermore, respondents were asked to express their
expectations about their financial situation for the coming
year. People could indicate that their situation would
likely improve (optimism), remain stable (neutral), or
deteriorate (pessimism) (Appendix A). Almost one-third of the
sample was pessimistic about their future financial
mobility, whereas 16% was optimistic, and half of the sample
neutral (52%).
People with high meritocratic perceptions were expected to be
either more optimistic or more pessimistic than others.
Unfortunately, no single dataset captured information about
Master Thesis MSc Sociology - Candidate No. 370276 26

both the degree of optimism/ pessimism and people’s
meritocratic perceptions. Therefore, I had to resort to the
popularity of meritocratic perceptions in the respondent’s
society as a predictor of his degree of optimism/ pessimism.
Because meritocratic perceptions were entered in a logistic
regression here, countries were allocated to one of several
consecutive dummy-categories, ordered from a very low
popularity to a very high popularity of such perceptions
(Appendix A and Table A2-A3). This popularity was assessed
using the same measure as for the first set of hypotheses
(discussed below).
3.3 Explanatory Variables: Macro-Level
The degree of income-inequality has been measured in various
(but highly inter-correlated) ways in the literature
(Wilkinson & Pickett, 2010). One of the most adopted
measures is the Gini-coefficient, which takes the whole
income distribution into account. The Gini-coefficient
ranges between 0 (complete equality) and 1 (complete
inequality) (Berg & Veenhoven, 2010; Wilkinson & Pickett,
2010) and is sometimes expressed in a percentage (‘Gini-
index’). The Gini-indexes used here were derived from Solt’s
(2009a) carefully constructed database: the Standardized
World Income Inequality Database (SWIID). His calculations
are based upon multiple informational sources and have
successfully integrated cross-nationally different Gini-
reports into consistent estimates for all countries (Solt,
Master Thesis MSc Sociology - Candidate No. 370276 27

2009b). The estimates mostly cover the year 2011, except for
a few countries for which the most recent available (post-
2008) year was chosen (Table A3). Unfortunately, the Gini-
statistic has often been based upon low-quality information
for developing countries (Berg & Veenhoven, 2010).
Therefore, I conducted a robustness-check with countries’
income-quintile ratio over 2011, which is less sensitive to
such problems (Veenhoven & Berg, 2010). These statistics are
provided by the United Nations over 2011 (United Nations
Development Programme, 2011: 135-138).
The Gini-index ranged from 24% (Slovenia) to 43% (Macedonia)
among the EQLS-countries and to 50% (Philippines) among the
WVS-countries. The mean was 34 for the WVS-group and 30 for
the EQLS. The distribution of Ginis was somewhat skewed
towards low Ginis (below 30%). Overall, inequality appears
to be slightly lower among the European country-group than
among WVS-countries. Country-levels are displayed in Table
A3.
For meritocratic perceptions, I replicated Marshall et al.’s
(1999) scale from the International Social Survey Project
Social Inequality Survey (ISSP) 1992 (see Table A1). These
items cover respondents’ accounts of how people become poor
or rich, how wages/ salaries are determined, and on equal
opportunities. Respondents could select answer-categories
that point to individual skills or effort or to structural
disadvantages. Alternatively, Bjørnskov et al. (2013) used a
3-item scale from another WVS-wave (1995-1996), assessing
respondents’ accounts of how people become poor and rich.
Master Thesis MSc Sociology - Candidate No. 370276 28

The present WVS-wave only contains one of these items, which
nevertheless correlated high with the old measure on the
country-level (rho = .77, p <.001). Still, I preferred the
ISSP-measure for its much higher reliability and richness.
This 13-item scale (also used in Roex, 2013) reached an
alpha of .68, whereas the WVS-measure’s alpha was only .56
at best. Moreover, the ISSP-measure is theoretically richer
since it also includes respondents’ perceptions of ‘anti-
meritocratic’ distributive mechanisms.
Assigning a mean-score of meritocratic perceptions to
countries, aggregated from individual scores on the
abovementioned ISSP-scale, would have been a suitable
measure. However, country-scores did barely vary here, which
is problematic for assessing any influences of meritocratic
perceptions (King et al., 1994). Instead, more variance was
achieved by calculating the 75th percentile score (3.92)
across the whole ISSP-sample and then assessing the
proportion of people with this score in each individual
country. Between countries, the size of this group of people
differed considerably: from only 5% (China) to 72% (New
Zealand). The overall median size for the WVS-countries was
26%. For the logistic regression predicting people’s
optimism/ pessimism from the popularity of meritocratic
perceptions, countries were ordered from ‘1’ (lowest
popularity) to ‘6’ (highest popularity). The specific
allocation and country-levels are displayed in Appendix A
and Table A3.
Master Thesis MSc Sociology - Candidate No. 370276 29

3.4 Control Variables
The selection of control variables was based on the
following criteria: variables must (1) be significant
predictors of one of the explanatory variables and of the
dependent variable (2) not have a dramatic number of missing
values (3) cause no multi-collinearity (VIF, Tollerance,
correlations). The micro-level control-variables for the
WVS-analyses were: income, educational attainment, health,
marital status, age, class, religion and sex. On the macro-
level, eventually no control variables were added. The
possible candidates lost significance in multi-level models,
and some (post-communism and GDP) correlated strongly (r
> .60, p < .01) with meritocratic perceptions. Leaving them
out did not affect the results.
The micro-level control-variables for the EQLS-analyses
were: income, educational attainment, health, marital
status, age, sex, and past financial mobility. The macro-
level control-variables were the corruption perception
index-score (CPI) and post-communism. For the WVS-analyses,
CPI was not included for substantive reasons, the included
measure of meritocratic perceptions also captures perceived
corruption. Because of multi-collinearity between CPI and
post-communism in the EQLS-data, post-communism was included
in a model estimated only for ‘low-corruption’ countries.
Because of a potential confounding role for meritocratic
perceptions in the EQLS-analyses, models were estimated both
with and without meritocratic perceptions. Specifically,
Master Thesis MSc Sociology - Candidate No. 370276 30

models were estimated twice because of many missing
countries at meritocratic perceptions.
In analyzing the link between meritocratic perceptions and
optimism/ pessimism, I controlled for people’s income,
educational attainment and past financial mobility. At the
macro-level, I controlled for post-communism and the level
of unemployment. A cross-tabulation revealed a near-perfect
correlation between meritocratic perceptions and post-
communism. Fortunately, this issue was only present among
countries with a high unemployment rate. Therefore, I
included the post-communism dummy only for low-unemployment
countries. Appendix A provides details about all control-
variables.
3.5 Methods
Multi-level linear regression analysis was conducted on
happiness for testing hypotheses 1 and 2a-b. This
corresponds with the multi-level nature of the theory and
recognizes the fact that people are embedded in countries,
which could generate more similar observations for people
within the same country (Hox, 2002). All continuous
variables were centred for the multi-level analyses, in
order to obtain the coefficients and variances for the point
where each predictor has its mean value (Hox, 2002).
Furthermore, I used single-level logistic regression
analysis for predicting people’s optimism/ pessimism from
Master Thesis MSc Sociology - Candidate No. 370276 31

meritocratic perceptions, for a more complete test of
hypotheses 2a-b. In all analyses, no weights were used,
because this does not solve the persistent problem of
selective representation of several groups in the sample.
Specifically, respondents that belong to subgroups known for
a high non-response, are likely untypical for their
subgroup. Thus, assigning a larger weight to those
individuals would not generate a more representative picture
(Peterson, 2005). For similar reasons, no mean-imputation
was used for the missing values. In fact, it is very likely
that the answers of the responders differ from what the non-
responders would have answered.
4. RESULTS
Table 1 displays the results of the multi-level linear
regression of happiness concerning Hypothesis 1. The
findings for happiness regarding Hypotheses 2a-b are
provided in Table 2. These analyses on happiness are
separate analyses because I had to rely on two different
datasets. Finally, Table 3 displays the findings of the
logistic (single-level) regression of optimism/ pessimism.
For all analyses, the alpha-level for the significance-tests
was set at p < .05. In the discussion of the results,
coefficients of the complete theoretical model will be used.
This model turned out to be a solid fit to the observed
patterns, relative to the more basic models (for a model
comparison, see Appendix C). Finally, because causality
Master Thesis MSc Sociology - Candidate No. 370276 32

cannot be fully proved by regression analysis (Agresti &
Finlay, 2009), but merely suggested, words as 'effect' must
here be taken as referring to only provisional suggestions
of true effects.
4.1 Popular Meritocratic Perceptions and Relative Concerns
Overall, the results do not support Hypothesis 1. The
coefficient for the level of inequality was not significant.
Moreover, the coefficient was not different between
countries (b = .001, p = .057). This pattern remained when
countries were divided into strongly unequal (Gini above the
median level) and less unequal (Gini equal or below the
median). Neither did the popularity of meritocratic
perceptions interact with inequality in their effects on
happiness. However, for one subsample (high-corruption
countries) of the EQLS-countries, the coefficient of
inequality was significant and negative (Model 1, Table A8).
Consistent with one of the underlying assumptions, the
coefficient for relative concerns was negative and
statistically significant. However, the coefficient did not
significantly vary across countries. Moreover, the
(non-)effect of inequality was virtually identical across
people with and without relative concerns. Furthermore, the
interaction-term with meritocratic perceptions remained
insignificant and small across these subsamples (Models 2
and 3, Table 1). Finally, shifting towards an income-
Master Thesis MSc Sociology - Candidate No. 370276 33

quintile measure of inequality did not alter the results
(Model 1, Table A7).
4.2 Optimism/ Pessimism
On average, optimists rated their happiness .41 points
higher than pessimists do (Model 1, Table 2). Moreover, this
effect of being optimistic rather than pessimistic, differed
significantly between countries (b = .093, p = .006), but
that of being optimistic rather than neutral did not (b
= .031, p = .058). Generally, optimists were happier than
neutrals (changing the reference-category towards neutrals
yielded: b = .128 with p = .008), and neutrals in turn were
happier than pessimists. Moreover, this latter happiness-gap
varied across countries (b = .048, p = .008). Nevertheless,
none of the interaction-terms was significant. Limiting the
sample to low-corruption countries yielded similar results,
with two exceptions. Firstly, the coefficient of being
optimistic rather than pessimistic did not differ
significantly between these countries (b = .057, p = .096).
Secondly, this ‘optimism-coefficient’ was somewhat smaller
among these countries (Model 2, Table 2). Notably, the
results were not robust for shifting the measure of
inequality towards the income-quintile ratio: both the main-
effect of inequality as well as its interaction-terms with
optimism, became significant (see Models 2-3, Table A7).
Moreover, in the analyses including the continuous measure
for popular meritocratic perceptions (with 23 countries),
Master Thesis MSc Sociology - Candidate No. 370276 34

Gini gained statistical significance (b = -. 059, p = .003)
(Model 2, Table A8). In the discussion-section, I elaborate
further on these additional findings.
Consistent with Hypothesis 2a, (popular) meritocratic
perceptions generally increased individuals’ likelihood of
being optimistic (rather than neutral). However, the effect
was not linear: lower-tread countries did not always have
larger negative log odds for optimism (Table 3). Contrary to
Hypothesis 2b, it were countries belonging to the lower
treads that showed larger positive log-odds for pessimism.
The relationship between being pessimistic (rather than
neutral) and meritocratic perceptions was more consistently
linear than for the optimism-figures, although the
relationship became slightly less linear after controlling
for post-communism and the unemployment-level (Models 3 and
4, Table 3).
Master Thesis MSc Sociology - Candidate No. 370276 35

Table 1: Multilevel Regression Results on Happiness Predicted from Inequality and Relative Concerns
Total Sample People with People without relative concerns relative concerns
M1 M2 M3
b SE b SE b SE
Intercept +0.550*** (0.039) +0.580**
* (0.057) +0.527***
(0.044)
Individual-Level characteristics Relative Concerns - 0.007* (0.003)
Income Quintile
- Lowest - 0.188*** (0.026) -
0.184*** (0.047) - 0.179***
(0.032)
- Quintile 2 - 0.104*** (0.025) -
0.160*** (0.043) - 0.073* (0.031)
- Quintile 3 - 0.025 (0.024) - 0.059 (0.042) - 0.004 (0.030)
- Quintile 4 - 0.014 (0.025) - 0.013 (0.042) - 0.013 (0.031)
- Highest (ref.) - - - - - -
Educational attainment
Master Thesis MSc Sociology - Candidate No. 370276 36

- Low +0.029* (0.014) - 0.004 (0.025) +0.046** (0.016)
- Medium +0.022* (0.010) - 0.006 (0.019) +0.036** (0.012)
- High (ref.) - - - - - - Health
- Poor - 0.846*** (.019)
- Fair - 0.532*** (0.012)
- Good - 0.304*** (0.011)
- Very good (ref.) - -
Marital Status - Single -
0.170*** (0.012)
- Divorced - 0.233*** (0.015)
- Widowed - 0.204*** (0.017)
- Married (ref.) - -
Age - 16-24 +0.006 (0.019)
- 25-34 - 0.058*** (0.015)
- 35-49 - 0.103*** (0.013)
- 50-64 - 0.091*** (0.013)
- 65+ (ref.) - -
Master Thesis MSc Sociology - Candidate No. 370276 37

Class - Bottom/ Working
- 0.039*** (0.010) - 0.001 (0.018) -
0.055***(0.011)
- Lower-Middle(ref.) - - - - - -
- Upper(-Middle)
+0.070*** (0.011) +0.088**
* (0.020) +0.061***
(0.014)
Religiosity - No Denomination
- 0.039*** (0.010)
- Denomination(ref.) - -
Sex
- Male - .052*** (0.008)
- Female (ref.) - -
Country-Level Variables Income-inequality +0.004 (0.004) +0.003 (0.004) +0.003 (0.00
4) Meritocratic Perceptions +0.003 (0.002) +0.003 (0.002) +0.004 (0.00
2) Income-Inequality × Meritocratic
- 0.001 (0.001) - 0.001 (0.001) - 0.001 (0.001)
Perceptions Individual-Level Variance 96.7% 97.1% 96.5%
Master Thesis MSc Sociology - Candidate No. 370276 38
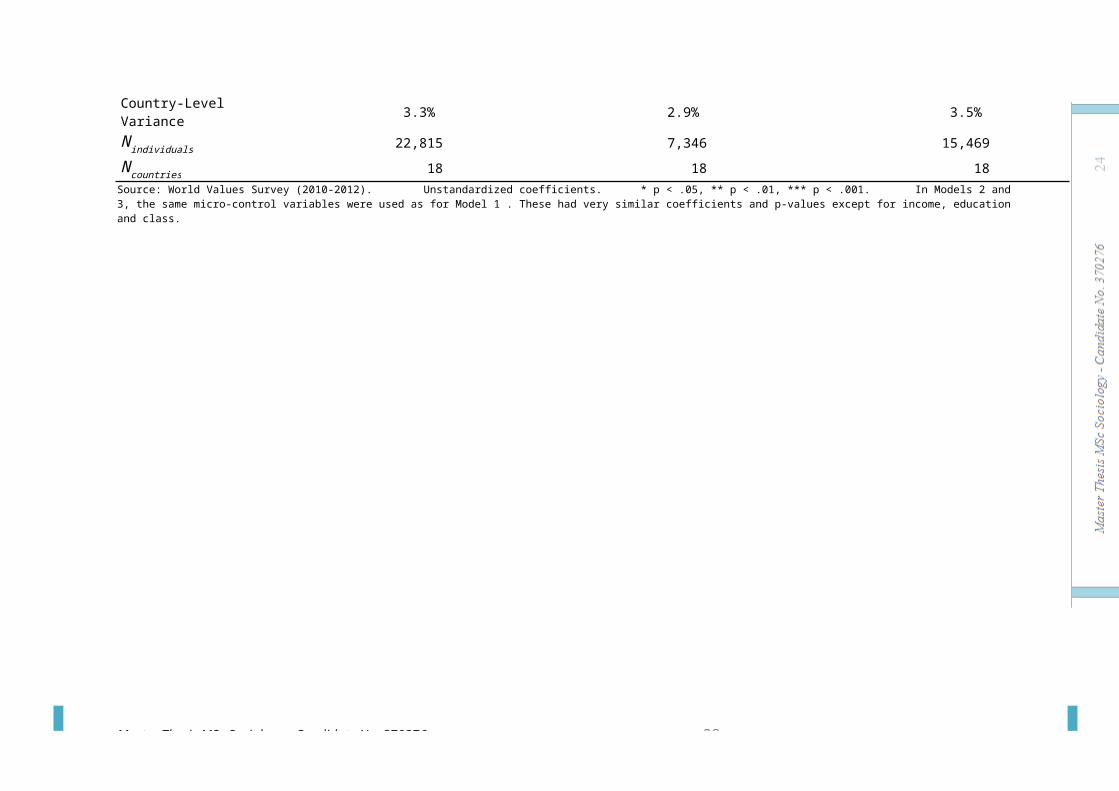
Country-Level Variance 03.3% 02.9% 03.5%
Nindividuals 22,815 07,346 15,469Ncountries 00,018 00,018 00,018Source: World Values Survey (2010-2012). Unstandardized coefficients. * p < .05, ** p < .01, *** p < .001. In Models 2 and 3, the same micro-control variables were used as for Model 1 . These had very similar coefficients and p-values except for income, education and class.
Master Thesis MSc Sociology - Candidate No. 370276 39

Table 2: Multilevel Regression Results on Happiness Predicted from Inequality and Optimism/ Pessimism
All Countries Low-Corruption Countries
M1 M2
b SE b SE
Intercept +0.780*** (0.115) +1.586*** (0.103) Individual-Level Variables Optimism/ Pessimism - Optimistic +0.408*** (0.065) +0.255** (0.077) - Neutral +0.280*** (0.048) +0.212* (0.079) - Pessimistic (ref.) - - - - Income Quartile
- Lowest - 0.441*** (0.031)
- Quartile 2 - 0.222*** (0.030)
- Quartile 3 - 0.118*** (0.028)
- Highest (ref.) - - Educational attainment- Low - 0.097* (0.041)
- Medium - 0.091*** (0.026)
- High (ref.) - - Health
Master Thesis MSc Sociology - Candidate No. 370276 40

- Very Bad - 2.709*** (0.069)
- Bad - 1.933*** (0.044)
- Fair - 1.093*** (0.031)
- Good - 0.580*** (0.028)
- Very good (ref.) - - Marital Status
- Single - 0.534*** (0.032)
- Divorced - 0.694*** (0.034)
- Widowed - 0.697*** (0.035)
- Married (ref.) - - Age - 18-24 - 0.130* (0.051)
- 25-34 - 0.364*** (0.039)
- 35-49 - 0.473*** (0.032)
- 50-64 - 0.300*** (0.030)
- 65+ (ref.) - -Past Financial Mobility - Better +0.328*** (0.038) - Same +0.321*** (0.025) - Worse (ref.) - - Sex
Master Thesis MSc Sociology - Candidate No. 370276 41

- Male - 0.155*** (0.021)
- Female (ref.) - -
Country-Level Variables Income-inequality +- 0.007 (0.008) +- 0.003 (0.006) Post-Communism +- 0.229 (0.125) +- 0.565 (0.267) Treads Cross-Level Interaction Income-Inequality ×Optimistic
+0.003 (0.006) +0.001 (0.005)
Income-Inequality ×Neutral +0.002 (0.004) +0.001 (0.005) Income-Inequality ×Pessimistic (ref.)
- - 0
Individual-Level Variance 92.6% 96.3%
Country-Level Variance 07.4% 03.7%Nindividuals 29,745 15,534Ncountries 00,033 00,016Source: European Quality of Life Survey (2011-2012). Unstandardized coefficients. * p < .05, ** p < .01, *** p < .001. In Model 2, the same micro-control variables were used as for Model 1. These had very similar coefficients and p-values.
Master Thesis MSc Sociology - Candidate No. 370276 42

Table 3: Logistic Regression Results on Optimism/ Pessimism
All Countries Low-/ Medium-Unemployment All Countries Low-/ Medium-Unemployment Countries Countries OPTIMISM PESSIMISM
M1 (basic) M2 (post-comm) M3 (basic) M4 (post-comm)
b SE b SE b SE b SE
Intercept +- 2.445*** (0.290) +-
2.389*** (0.323) +1.021*** (.314) +0.428 (0.336)
Country-Level MeritocraticPerceptions - Lowest - 0.333** (0.115) - 0.188 (0.171) +1.669*** (0.095) 1.209*** (0.129) - Tread 2 +0.038 (0.083) +0.065 (0.087) +0.624*** (0.089) +0.439*** (0.092)
- Tread 3 - 0.509*** (0.070) -
0.636*** (0.083) +0.842*** (0.075) +0.549*** (0.082)
- Tread 4 - 0.614*** (0.070) -
0.633*** (0.074) +0.725*** (0.075) +0.327*** (0.080)
- Tread 5 - 0.046 (0.062) - 0.007 (0.065) +0.638*** (0.073) +0.728*** (0.075) - Highest (ref.) - - - - - - - -
Post-Communism - 0.033 (0.072) +0.616*** (0.054)
Master Thesis MSc Sociology - Candidate No. 370276 43

Individual Level + Past Financial Mobility
+
- Better +0.703*** (0.059) - 2.042*** (0.071)
- Same - 1.116*** (0.049) -
2.351*** (0.038)
- Worse (ref.) - - - - Educational Attainment
- Low - 0.816*** (0.085) +0.321*** (0.065)
- Medium - 0.171*** (0.049) +0.063 (0.047)
- High (ref.) - - - - Income Quartile
- Lowest +0.607*** (0.060) +0.386*** (0.053)
- Quartile 2 - 0.250*** (0.059) +0.237*** (0.052)
- Quartile 3 - 0.075 (0.058) +0.109* (0.052)- Highest (ref.) - - - -
Nindividuals 22,512 18,295 22,512 18,295Ncountries 23 17 00,023 00,017Source: European Quality of Life Survey (2011-2012). Unstandardized coefficients. * p < .05, ** p < .01, *** p < .001. In Models 2 and 4, the same micro-control variables were used as for Models 1 and 3. These had very similar coefficients and p-values.
Master Thesis MSc Sociology - Candidate No. 370276 44

Overall, the largest and most robust differences appeared between (1) the lowest-ranked countries
and the rest, and between (2) the highest-ranked countries and the rest.
Master Thesis MSc Sociology - Candidate No. 370276 45

5. CONCLUSION AND DISCUSSION
This study considered two ways in which meritocratic
perceptions and inequality interact in their impacts on
happiness. The expectations were tested with data from
widely-established survey projects and with carefully
constructed reliable and valid measures. However, this study
leaves some points for improvement for future work. In this
section I elaborate more deeply on the results in order to
arrive at conclusions.
Regarding the expected influence of popular meritocratic
perceptions upon the inequality-happiness relationship, the
data offered no support. Inequality did not have a stronger
negative effect upon happiness in perceived meritocracies
than in perceived non-meritocracies. Indeed, people’s
happiness was generally not affected by the level of
inequality, and this pattern did not differ between
countries. This absence of statistically significant effects
was not attributable to the low power of the analyses
(country-level N = 18): an analysis of 33 EQLS-countries
revealed the same null-effect of inequality. A closer look
suggests that the inequality-effect differs between country-
groups (Eastern- versus West-Europe) rather than between
individual countries. Indeed, estimating the models
separately for high-corruption and low-corruption countries
(which distinction mainly overlaps the East-West line),
yielded different inequality-effects: inequality negatively
influenced happiness in the first country-group (Model 1,
Master Thesis MSc Sociology - Candidate No. 370276 46

Table A8) whereas it did not in the latter (Model 2, Table
2). Indeed, including an interaction-term for ‘low
corruption’ with Gini for the full sample, revealed that the
inequality-effect is somewhat milder among low-corruption
countries (b = .032, marginally significant at p = .056).
This supports the idea of differential happiness-
implications of inequality for Eastern- and West-Europeans.
Importantly, however, the direction of the interaction is in
the opposite direction as expected.
Status-competition was proposed to be a central underlying
mechanism for generating the expected patterns. From this
the assumption followed that the expected effects would be
stronger for people with relative concerns. However, the
patterns appeared to be similar between groups (Table 1).
Furthermore, rather than having a large negative impact upon
happiness, such competitive concerns did only weakly reduce
people’s happiness. In fact, happiness was only 0.035 points
(0.007*5) lower for those with the strongest relative
concerns compared with those with the weakest, while
happiness-scores ranged from 1 to 4 in the sample. More
importantly: their negative consequences did not differ
between societies. However, it should be reminded that
respondents who self-report to be free from such concerns,
actually may have such concerns and are subject to the same
mechanisms. Specifically, their survey-responses could have
been formed by a norm to present oneself as more progressive
(or post-material) than ‘most others’, a tendency suggested
by earlier findings (Neugarten et al., 1965).
Master Thesis MSc Sociology - Candidate No. 370276 47

Altogether, the findings challenge the central elements of
the status-competition model and perceived meritocracy-
thesis. Possibly, the intensity of the status-competition
does not depend on the inequality-level or on the popularity
of meritocratic perceptions. Specifically, it could be that
popular meritocratic perceptions do not induce any
additional pressure on people to compete. Similarly,
different inequality-levels could fail to produce the
predicted incentives for people to compete. Probably, people
are unaware of the actual shape of the income distribution
and inequality, as shown in an American study (Ariely,
2012). Then, the actual inequality-level of a country does
not influence people’s happiness if their perceptions only
weakly match with objective figures. Rather, it is the
society people think they live that influences their feelings
and interactions (Thomas & Thomas, 1928: 571-573).
Unfortunately, recent cross-national data on people’s
inequality-perceptions were unavailable. Alternatively,
people may have an intrinsic desire for status-goods or to
work hard. In that case, intense status-competitions do not
involve the theorized happiness-deadweight-loss. Because of
the potentially important role of individuals’ perceptions and
desires, future work should dig into the perceived inequality-
level and perceived specific income-gaps, as well as the
perceived costs and benefits of competing for status and
people’s preferences.
Regarding the hypotheses about people’s optimism/ pessimism,
I had to rely on European data for testing them.
Master Thesis MSc Sociology - Candidate No. 370276 48
Consequently, the resulting findings cannot be generalized
to non-European contexts. Specifically, it was assessed
whether people with personal meritocratic perceptions were
more often optimistic (expecting an improvement in their
financial situation) or pessimistic (expecting a
deterioration) rather than neutral (expecting stability).
Because I had to rely on popular meritocratic perceptions,
this is only an indicative test. Self-evidently, personal
perceptions are unlikely to be fully predictable by
popularly held perceptions. Nevertheless, the data partly
supported Hypothesis 2a. Overall, meritocratic perceptions
fostered optimism in people, but not in a smooth linear
fashion. Illustratively, the likelihood of being an optimist
(rather than neutral) was 1.40 times larger in countries
where meritocratic perceptions were most popular (tread 6),
compared to the likelihood for people in the lowest-ranked
countries (tread 1) (Model 1, Table 3). This is a
substantial difference. However, people in ‘tread 2’
countries did not significantly differ in their tendency to
be optimists from people in the highest-ranked countries.
Conversely, the results did not support Hypothesis 2b. In
fact, high meritocratic perceptions diminished people’s
tendency to be pessimistic. Compared to people in ‘tread 6’
countries, the likelihood of being pessimistic (rather than
neutral) was as much as 5 times larger for people in ‘tread
1’ countries (Model 3, Table 3). This relationship was not
fully linear, although more consistent than that for
optimism. The inconsistency of these relationships could be
Master Thesis MSc Sociology - Candidate No. 370276 49

due to a greater role for people’s personal perceptions
(compared to popular perceptions) in determining their
optimism and pessimism.
Regarding happiness, the prediction was supported that
optimists were on average most happy, whereas pessimists
were the least happy. However, on an observed range of
happiness-scores from 1 to 10, the effect of being
optimistic (b = .041, Model 1, Table 2) or neutral instead
of pessimistic (b = .28) were rather small. Optimists gained
only .041 additional happiness-points compared to
pessimists, while overall, the observed happiness-scores
ranged from 1 to 10, with approximately 95% located between
4 and 10. Moreover, although the happiness-gains of being
optimistic or neutral (instead of pessimistic) differs
cross-nationally, these differences are only small (b = .09,
p = .006 and b = .05, p = .008 respectively). Thus, the
happiness-gap between optimists and pessimists appears to be
small in virtually each country. Moreover, contrary to what
was expected, the size of this happiness-gap in a given
country was not related to the national inequality-level.
Rather, other country-level factors may be at play.
Interestingly, optimism yielded a stronger happiness-gain
for people in countries with, on average, an unhappier
population (b = -.108, p = .010). Furthermore, the size of
the happiness-gap between optimists and pessimists did not
differ across low-corruption countries. Possibly, the size
of this happiness-gap is related to countries’ perceived
corruption-level.
Master Thesis MSc Sociology - Candidate No. 370276 50

Thus, the ideas behind the expectation of larger happiness-
gaps between optimists and pessimists in more unequal
societies, have become questionable. Specifically,
inequality was here thought to heighten the top-incomes that
optimists expect to acquire. However, the optimism-item only
assessed whether people expected an improvement in their
financial situation and did not ask the expected magnitude
of this improvement. Indeed, it could be that the upward
mobility expected by most optimists is limited, while people
perceive that inequality does only lift the top-incomes.
Similarly, if people think that it is predominantly the
bottom that ‘suffers’ from inequality, pessimists who only
perceive to ‘fall down’ to a position above this bottom, are
likely unaffected by a higher inequality. Alternatively,
happiness is probably not affected by the financial rewards
or punishments people expect to receive when they will move
up- or downwards. Rather, the expected upward or downward
mobility in itself may suffice to affect an individual’s
happiness. This because people may care more about their
relative status (relative income) than about the
accompanying financial benefits (absolute income). Indeed,
earlier research has supported this (Ball & Chernova, 2008).
Thus, if inequality enlarges these financial rewards or
punishments of social mobility, this does possibly not
affect happiness.
The models of Table 2 were re-estimated while controlling
for popular meritocratic perceptions (Model 2, Table A8).
Notably, this revealed a negative effect of inequality on
Master Thesis MSc Sociology - Candidate No. 370276 51

happiness. However, this was not the case for low-corruption
and high-corruption countries separately (b = -.045, p
= .058 and b = -.047, p = .273). This could be due to a
smaller macro-level N in the separate analyses and multi-
collinearity between the macro-level control-variables.
Indeed: Cpi is largely captured by the item-scale for
meritocratic perceptions. Thus, the suddenly appearing
inequality-effect for the whole sample, when controlling for
meritocratic perceptions, could be explained by another
finding of this study: the differing inequality-effect
between low- and high-corruption countries. Alternatively,
meritocratic perceptions could have suppressed an actual
effect of inequality in the original models. However, this
was not the case here: inequality did not influence the
popularity of meritocratic perceptions at the country-level
(b = -.657, p = .321). Another potential cause of this
suddenly appearing inequality-effect is the interplay of
several unknown macro-factors that are related with the
variables of interest. However, including meritocratic
perceptions as a predictor in the model did not yield a
significant effect for inequality in the WVS-analyses.
Because of this lack of robustness, one should not lend much
confidence to these results. In case any effect is present,
this will only apply for Europe.
A negative effect for inequality did also appear in the
EQLS-sample when using the income-quintile ratio (Table A7).
Furthermore, a higher inequality now accentuated the
happiness-gains of being optimistic instead of pessimistic.
Master Thesis MSc Sociology - Candidate No. 370276 52

Still, contrary to the central assumption behind Hypothesis
1, the effect of inequality on happiness did not differ
cross-nationally (b = .016, p = .482). Controlling for
popular meritocratic perceptions yielded similar results.
Clearly, the different results from using the Gini or the
income-quintile, need some clarification. Consulting the
stock of previous studies, it does not appear that Gini
structurally fails to generate significant results. On the
contrary, many effects were found (e.g. Alesina et al.,
2004, Berg & Veenhoven, 2010; Jiang, Lu & Sato, 2011; Oishi,
Kesebir & Diener, 2011; Bjørnskov et al, 2013).
Alternatively, it could be that countries varied more
regarding their income-quintile ratios than regarding their
Ginis, making it more likely for the first measure to reveal
effects (Agresti & Finlay, 2009). But instead, here Gini had
the largest spread (range and standard deviation). In fact,
having both a theoretical range from 1 to 100, the income-
quintile ratio had only an observed range of 6.7, while this
was 18.7 for Gini.
One explanation of these puzzling differential results could
be that the Gini considers the whole income-distribution,
whereas the income-quintile ratio focuses at the extremes.
Possibly, people’s happiness is more responsive to these
extremes, because their relative concerns may be more
focused towards the top and bottom. However, societies with
large gaps between the extremes also tend to have high Ginis
(r = .84, p < .001). Still, the distance between the top-
incomes and the mean-income will be more consistently
Master Thesis MSc Sociology - Candidate No. 370276 53

largest among countries with high quintile-ratios than among
high-Gini countries. Consequently, top-oriented people’s
happiness would be more responsive to the income-quintile
ratio.
Because of the careful estimation of the Ginis used here,
the results generated through this measure deserve credit.
Indeed, the problem of unreliable Gini-estimates for
developing countries, does not apply to the EQLS-countries.
Moreover, the measure is less arbitrary and more informative
than the quintile-ratio, since it considers all income-
differences rather than only one certain part. But as the
quintile-measure is also based upon good-quality data (UN-
rapport) and reveals effects despite a relatively small
range, future work towards which measure generates more
valid results, is welcome.
Since happiness was severely non-normally distributed in
both datasets, future research could assess whether the
results of this study are robust against using a multi-level
logistic regression method. Taking the log of happiness did
not ‘normalize’ this variable, according to normality-tests.
Linear regression analysis was here preferred because
relatively much information is retained in such analysis. By
contrast, in logistic regression analysis, observations on
continuous variables have to be allocated to wider dummy-
categories, which causes information-loss. Furthermore, with
a large individual-level N, linear regression has been shown
to yield results that are fairly robust against using a non-
normally distributed dependent variable (Agresti & Finlay,
Master Thesis MSc Sociology - Candidate No. 370276 54

2009: 284). Certainly, the confidence in the results would
increase if logistic regression reveals similar findings
(regarding statistical significance and the relative
strength of effects).
Thus, future research could improve upon this study in
several ways. Firstly, by conducting a large-scale
quantitative study, I only assessed relationships between
phenomena. Future qualitative work could supplement the
findings here by revealing the underlying mechanisms
(Goldthorpe, 2007). Especially the micro-level should be
more explicated: individuals’ perceptions and desires.
Furthermore, quantitative work should use cross-temporal
data, ideally panel-data in which the repeated measurement
had followed closely after the change in inequality. In
fact, happiness may be more sensitive for changes in the
inequality-level. Whereas people at Time 2 do structurally
compare their situation with that of their past-selves at
T1, people between countries do possibly not. Moreover,
cross-temporal data could also provide more (although still
provisional) insights about the causality of relationships,
by revealing the sequence of phenomena. Finally, datasets
should be combined by in order to obtain a larger number of
countries. Berg & Veenhoven (2010)’s work is a good example.
Here, the number of countries was rather small, particularly
for the WVS-analyses. Apart from statistical power, re-
estimating the patterns among a larger number of countries
would give more confidence in the results, because of a
stronger leverage. Here, the leverage was low, given that
Master Thesis MSc Sociology - Candidate No. 370276 55

one needs at least at least rk countries in order to estimate a
model with k macro-level variables having r categories
(Agresti & Finlay, 2009: 442).
Overall, the theoretical framework was not supported. This
exclusion of theoretically plausible patterns is an
improvement of current knowledge. Specifically, cross-
national differences in the popularity of meritocratic
perceptions cannot explain the previously found differential
effects of inequality on happiness. Instead, the happiness-
consequences of inequality depended upon the perceived
corruption-level of countries. Specifically, inequality was
only harmful in countries with a high perceived corruption-
level (Model 1 Table A8). This new finding would, when
replicated in more future studies, contribute to a better
understanding of the inequality-happiness link. Indeed, I
found no robust evidence of differences in the nature of the
inequality-happiness relationship between individual
countries, although it appeared to differ between country-
groups. Furthermore, some robustness-checks offered fertile
ground for further research: the expected patterns turned up
when using the income-quintile ratio. Furthermore,
controlling for meritocratic perceptions revealed an effect
for Gini. Here, I offered a few speculations on the reason
why, and it remains plausible that these effects were only
due to statistical artifacts. Future research is invited to
explore the role of meritocratic perceptions with a larger
number of countries or with different measures. Also
important is to consider the impacts of capital-inequality
Master Thesis MSc Sociology - Candidate No. 370276 56

besides only of income-inequality. Capital-inequalities are
even larger (Piketty, 2014: 40 and 336) and possibly more
important for people’s happiness than income-inequalities.
Finally, from happiness-concerns, some could conclude that
governments do not need to curb the rising inequalities. But
given the instability of the inequality-effect, and given
the many adverse effects of inequality on other happiness-
determinants (Wilkinson & Pickett, 2010), a continued
increase in the inequality-level could still become harmful
for (the overall high levels of) happiness in the long-term.
Master Thesis MSc Sociology - Candidate No. 370276 57

APPENDIX
APPENDIX A: Variable-details
HAPPINESS
Question wording self-reported happiness (World Values
Survey Association, 2012: 2):
“Taking all things together, would you say you are:1 Very happy2 Rather happy3 Not very happy4 Not at all happy”
As a scale-variable, this variable was reverse-coded.
Question wording self-reported happiness (Eurofound, 2011:
20):
“Taking all things together on a scale of 1 to 10, how happy would you say youare? Here 1 means you are very unhappy and 10 means you are very happy”.
INCOME-INEQUALITY
The Gini-indexes in the SWIID (Solt, 2009a) are based on
people’s equivalized disposable, after-tax (post-transfer)
household-income. More information on these data can be
found in Solt (2009b).
Master Thesis MSc Sociology - Candidate No. 370276 58

Regarding the income-quintile measure, the UN did not report
values for Taiwan, Cyprus, Luxembourg, Malta and Iceland.
For these countries (except Taiwan), I calculated the
income-quintile ratio from information provided by the EQLS-
data. I used two income-measures in order to calculate
income-quintiles: people’s self-reported monthly net
household-income (Eurofound, 2011: 28) and this income in
equivalized PPP-euro’s (Y11_Income_percapita in Eurofound,
2011-2012). From this, then the income-quintile ratio was
determined by taking the mean from the income-quintile
ratios according to the two respective income-measures.
Unfortunately, due to a fairly large number of missing
values at the income-items, these calculations may be less
reliable and probably more biased than the UN’s statistics.
Country-scores for both inequality-measures are displayed in
Table A3.
RELATIVE CONCERNS
The item for relative concerns (World Values Survey
Association, 2012: 6):
“Now I will briefly describe some people. Using this card, would you pleaseindicate for each description whether that person is very much like you, like you,somewhat like you, not like you, or not at all like you? – It is important to thisperson to be rich; to have a lot of money and expensive things”.“1 Very much like me2 Like me3 Somewhat like me4 A little like me5 Not like me6 Not at all like me”
Master Thesis MSc Sociology - Candidate No. 370276 59

This variable was reverse-coded such that higher scores
represent stronger relative concerns. For the separate
analyses for people with and without relative concerns, this
variable was dichotomized:
(Strong) relative concerns: people who answered “somewhat like
me”, “like me” or “very much like me”.
Weak or no relative concerns: people who answered “a little like
me”, “not like me” or “not at all like me”.
MERITOCRATIC PERCEPTIONS (WVS)
Table A1: Replication of Marshall et al.’s (1999) Item-scale
ISSP-2009 Items in the Scale of This Study (and Roex, 2013) (ISSP, 2009) and corresponding ISSP-1992 Items in Marshall et al., 1999 (Appendix 1, p. 365-366)
Please tick one box for each of these to show how important you think it is for getting ahead in life (‘1’ essential – ‘5’ not important at all)
Master Thesis MSc Sociology - Candidate No. 370276 60

a) how important is coming from a wealthy family? (question 24 p. 366)
b) how important is having a good education yourself? * (question 6, p. 365)
c) how important is having ambition? * (question 12, p. 365)
d) how important is hard work? * (question 12, p. 365)
e) how important is knowing the right people? (question 19, p. 366)
f) how important is having political connections? (question 19, p. 366)
g) how important is giving bribes? (question 21, p. 366)
h) how important is a person’s race? (question 27, p. 366)
i) how important is a person’s religion? (question 27, p. 366)
j) how important is being born a man or a woman? (question 26, p. 366)
To what extent do you agree or disagree with the following statements? (‘1’ strongly agree – ‘5’ strongly disagree)
a) To get all the way to the top in <country> today, you have to be corrupt. (question 21, p. 366)
b) In <country>, only the rich can afford the costs of attending university. (question 17, p. 365)
c) In <country> people have the same chances to enter university, regardless of their gender, ethnicity or social background. * (question 17, p. 365)
*reverse-coded in order to make higher scores represent stronger meritocratic perceptions
Master Thesis MSc Sociology - Candidate No. 370276 61

MERITOCRATIC PERCEPTIONS (EQLS)
For the logistic regression, countries were categorized
according to how popularly meritocratic perceptions were
endorsed by their resident-respondents. These categories
were then entered as dummies in the regression. The
categories were: countries
1) with 14.8% or less ‘high meritocratic perceivers’
2) where this group is larger than 14.8%, but maximally
17.8%
3) larger than 17.8%, but maximally 21.6%
4) larger than 21.6%, but maximally 25.8%
5) larger than 25.8%, but maximally 47.0%
6) larger than 47%
OPTIMISM/ PESSIMISM
The item for optimism/ pessimism (Eurofound, 2011: 30):
“When it comes to the financial situation of your household, what are yourexpectations for the 12 months to come, will the next 12 months be better, worseor the same?” “1 Better2 The same3 Worse”
These answers were each entered into the analyses as
dummies.
CONTROL-VARIABLES
Post-communism for countries was assessed through a consult of
the previous literature that had distinguished countries
Master Thesis MSc Sociology - Candidate No. 370276 62

regarding their communist past (Marshall et al., 1999;
Armingeon & Careja, 2004; Salavecz et al., 2010). Here, the
following EQLS-countries were coded ‘post-communistic’:
Bulgaria, Croatia, Czech Republic, Estonia, Hungary, Latvia,
Lithuania, Macedonia, Montenegro, Poland, Romania, Serbia,
Slovakia and Slovenia.
Country’s corruption perception index (Cpi) over 2011 (Transparency
International, 2011) was used to distinguish ‘high-
corruption’ countries from ‘low-corruption’ countries. Low-
corruption countries are those with scores below or at the
median-level: Austria, Belgium, Cyprus, Germany, Denmark,
Estonia, Spain, Finland, France, Ireland, Luxembourg,
Netherlands, Portugal, Sweden, UK and Iceland. Between the
two groups of countries, the spread of Gini-scores was
fairly equal. Originally, the Cpi constitutes a scale from 0
(high perceived corruption) to 10 (low perceived
corruption).
Country’s unemployment rate in 2011 was taken from the World
Bank (2014a) and gives the proportion of jobless people in
the labour force that is willing and capable to work
(International Labour Organisation, 1982). Because of
missing information about Taiwan in the World Bank data, I
used Taiwanese government statistics (Directorate-General of
Budget, Accounting and Statistics Taiwan, 2013) for Taiwan’s
figures. For the regression predicting people’s optimism/
pessimism, countries were divided into a ‘low/ medium’
unemployment and a ‘high’ unemployment group (see Table A3).
Master Thesis MSc Sociology - Candidate No. 370276 63

The latter group captured countries with the 26% highest
unemployment rates: Croatia, Estonia, Latvia, Spain,
Portugal and Slovakia. Dichotomizing was chosen above using
multiple treads of unemployment-levels, because within some
of these finer categories, the popularity of meritocratic
perceptions (treads) barely varied and many treads did not
occur in several categories.
Country’s Gross Domestic Product (GDP) in 2011 was taken from the
World Bank (World Bank, 2014b). GDP is calculated by summing
all gross-value produced by a country’s populace, as well as
revenues from product-taxes, and subtracting all subsidies
from this. This summed product is then divided by the number
of residents in the country. Eventually, this variable was
not included in the final analyses because it was not
significant in the multi-level models.
In the WVS-data, income was assessed by an item in which
respondents were asked to position their household on an
‘income scale on which 1 indicates the lowest income group
and 10 the highest income group’ in their country’ (World
Values Survey Association, 2012: 18). To keep the model more
parsimonious, the income-deciles were transformed into
quintiles. The WVS contained no other information on
people’s incomes other than this self-ranking question. In
addition, the EQLS offered information on people’s income-
quartile. This was computed by the EQLS-staff based upon
people’s self-reported equivalised net-household income in
Master Thesis MSc Sociology - Candidate No. 370276 64

purchasing power parity (PPP) Euros (Y11_Income_percapita in
Eurofound, 2011-2012). As a predictor, this latter variable
appeared a stronger confounder than people’s income
quartile, but contained more missings.
For age, dummy categories were computed, because of non-
normality of the continuous age-distribution (with a skew
towards younger ages and a very small tail at the right).
The same categorization was used as was ready-made offered
in the EQLS, which originated from a similar item as in the
WVS that asked people about their current age:
a) 18-24
b) 25-34
c) 35-49
d) 50-64
e) 65+
For sex, a dummy was made that assigned a 1 to male
respondents and a 0 to women. This dummy was extracted from
a variable ‘sex’, that was assessed by the interviewers’
observation (World Values Survey Association, 2012;
Eurofound, 2011).
WVS Health was assessed by asking respondents to self-evaluate
their current health. They were offered four answer
categories in the WVS and five in the EQLS, resulting in
ordinal measures of self-reported health ranging from very
good to poor or very bad. For each category, a dummy was
made.
Master Thesis MSc Sociology - Candidate No. 370276 65

The education-dummies were extracted from an item containing
internationally comparable educational levels as its answer-
categories (World Values Survey Association, 2012: 19;
Eurofound, 2011: 23), as recoded from nation-specific items
by the staff of the survey-projects. Respondents were asked
about their highest attained educational level. The answer-
categories were very fine-tuned. Here, a more parsimonious
categorization was chosen, because it captured the
confounding influences of educational attainment more
strongly:
Education: WVS EQLS
Low primary school (in)complete primary
school
incomplete secondary-
vocational school
Medium secondary-vocational school complete
secondary education
incomplete (secondary)
academic school
High academic degree tertiary
education degree
For marital status, dummies were extracted from an item asking
people to their current marital status. The following
dummies were made: ‘married/ cohabitation’, ‘divorced/
separated), (single) and (widowed) ’. This is a widely used
categorization in previous work.
Class was assessed by people’s self-reported class (World
Values Survey Association, 2012: 18). Because of multi-
Master Thesis MSc Sociology - Candidate No. 370276 66

collinearity when making a dummy for each category (which
was not related with income or education), a more
parsimonious categorization was made: (1) bottom or working
class, (2) middle class, (3) upper-middle and upper class.
Alternatively, the dataset also contains variables that
would have enabled the construction of a measure of
objective class (EGP-style), but this information is only
available for 1 country (Turkey).
People were also asked about their religion (World Values
Survey Association, 2012: 10). The datafile contained a host
of self-categorisations, which were coded into more
sparsimonous categories consistent with that in earlier WVS-
based studies (Bloom & Arikan, 2012). However, because many
categories were missing in multiple countries, I eventually
used a dummy distinguishing atheist from religious
respondents.
People’s past financial mobility was assessed by extracting dummies
from an item asking people about ‘the financial situation of
their household compared to 12 months ago’ (Eurofound, 2011:
30). Respondents could report an improvement, stability, or
deterioration of their situation. For each possibility, a
dummy was constructed.
Master Thesis MSc Sociology - Candidate No. 370276 67
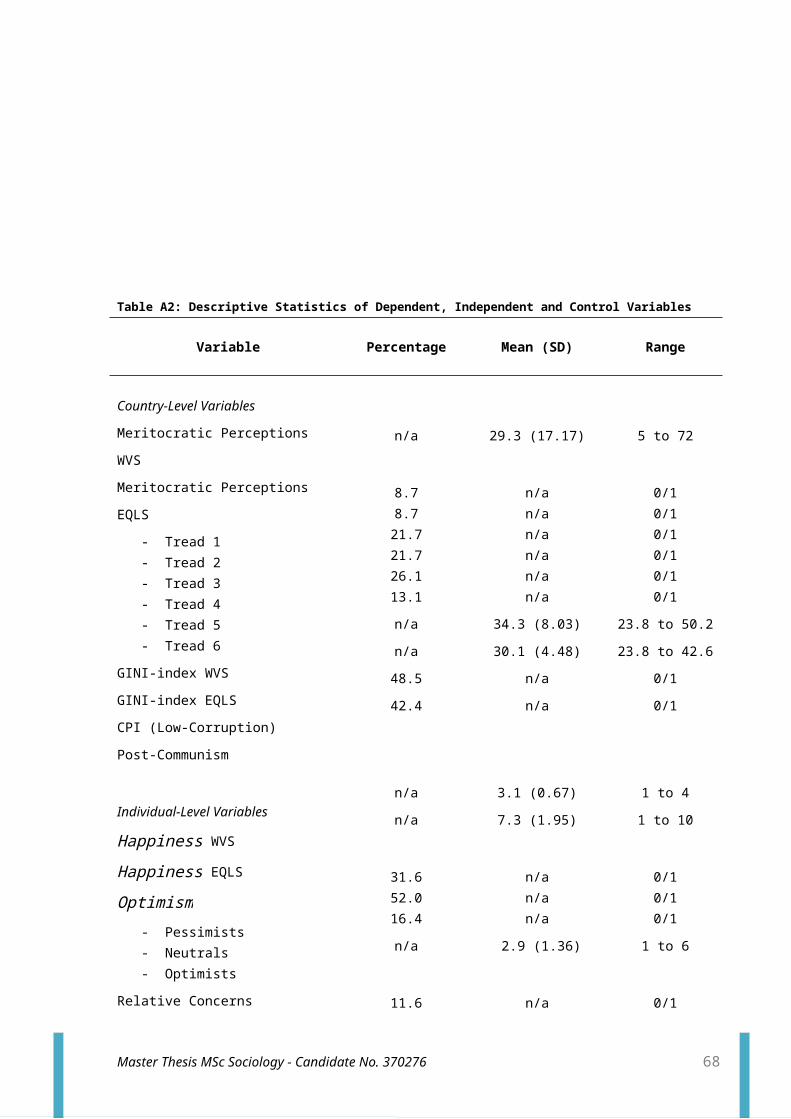
Table A2: Descriptive Statistics of Dependent, Independent and Control Variables
Variable Percentage Mean (SD) Range
Country-Level Variables
Meritocratic Perceptions
WVS
Meritocratic Perceptions
EQLS
- Tread 1- Tread 2- Tread 3- Tread 4- Tread 5- Tread 6
GINI-index WVS
GINI-index EQLS
CPI (Low-Corruption)
Post-Communism
Individual-Level Variables
Happiness WVSHappiness EQLSOptimism
- Pessimists- Neutrals- Optimists
Relative Concerns
n/a
8.78.721.721.726.113.1
n/a
n/a
48.5
42.4
n/a
n/a
31.652.016.4
n/a
11.6
29.3 (17.17)
n/an/an/an/an/an/a
34.3 (8.03)
30.1 (4.48)
n/a
n/a
3.1 (0.67)
7.3 (1.95)
n/an/an/a
02.9 (1.36)
n/a
5 to 72
0/10/10/10/10/10/1
23.8 to 50.2
23.8 to 42.6
0/1
0/1
1 to 4
1 to 10
0/10/10/1
1 to 6
0/1
Master Thesis MSc Sociology - Candidate No. 370276 68

Age WVS
- 18-24- 25-34- 35-49- 50-64- 65+
Age EQLS
- 18-24- 25-34- 35-49- 50-64- 65+
Sex (male) WVSSex (male) EQLSHealth WVS
- Poor- Fair- Good- Very good
Health EQLS
- Very bad- Bad- Fair- Good- Very good
Income WVS
- lowest quintile- second quintile- third quintile- fourth quintile- highest quintile
Income EQLS
- lowest quartile- second quartile- third quartile- highest quartile
Educational Attainment WVS
- Low- Medium
17.727.026.517.3
7.915.026.026.224.9
47.3
43.3
6.927.244.621.3
2.68.829.038.221.4
14.628.037.416.93.1
24.325.025.325.4
21.154.724.1
n/an/an/an/a
n/an/an/an/an/a
n/a
n/a
n/an/an/an/a
n/an/an/an/an/a
n/an/an/an/an/a
n/an/an/an/a
n/an/an/a
0/10/10/10/1
0/10/10/10/10/1
0/1
0/1
0/10/10/10/1
0/10/10/10/10/1
0/10/10/10/10/1
0/10/10/10/1
0/10/10/1
Master Thesis MSc Sociology - Candidate No. 370276 69

- HighEducational Attainment EQLS
- Low- Medium- Highest
Marital Status WVS
- Single- Married/ Cohabitation- Divorced/ Separated- Widowed
Marital Status EQLS
- Single- Married/ Cohabitation- Divorced/ Separated- Widowed
Past Financial Mobility
- Downwards- Stable- Upwards
Subjective Class
- Bottom/ Working-Class- Middle- Upper-Middle/ Upper
Denomination (Atheist)
12.763.224.2
19.465.87.87.0
16.260.610.612.6
35.952.911.2
37.240.722.1
33.8
n/an/an/a
n/an/an/an/a
n/an/an/an/a
n/an/an/a
n/an/an/a
n/a
0/10/10/1
0/10/10/10/1
0/10/10/10/1
0/10/10/1
0/10/10/1
0/1
WVS: Individual-Level N = 22,815; Macro-Level N = 18. EQLS: Individual-Level N = 29,745,Macro-Level N = 33 (for Meritocratic Perceptions N= 22,512 and 23 respectively).
Table A3: Country-Scores
Total Sample (All Countries)
Countries GINI
Meritocratic Perceptions (Continuous)
Meritocratic Perceptions (Tread)
Income Quintile-Ratio
WVS-Sample
Australia 33.27* 51 7.0
Chili 47.08 30 3.6
Master Thesis MSc Sociology - Candidate No. 370276 70

China 47.38** 5 8.4
Taiwan 30.07 25
Japan 29.39* 44 3.4
New Zealand 31.85 72 6.8
Phillipines 50.20** 24 9.0
United States 37.20 46 8.5
WVS and EQLS
Cyprus 29.09 27 5 5.9***
Estonia 31.97 27 5 6.3
Germany 28.95 25 4 4.3
Poland 29.26 19 3 5.6
Russia 42.93 13 8.2
Slovenia 23.81 16 2 4.8
Spain 33.41 32 5 6.0
Sweden 25.87 48 6 4.0
Turkey 40.08 17 2 8.0
Ukraine 25.65* 07 3.9
EQLS-Sample
Austria 27.44 24 4 4.4
Belgium 25.13 21 3 4.9
Bulgaria 34.89 22 4 10.2
Croatia 30.76 18 3 5.2 Czech Republic 25.16 23 4 3.5
Denmark 26.12 58 6 4.3
Greece 33.15 6.2
Master Thesis MSc Sociology - Candidate No. 370276 71

Finland 25.54 50 6 3.8
France 30.53 32 5 5.6
Hungary 27.87 10 1 4.8
Italy 32.94 21 3 6.5
Ireland 28.36 5.7
Latvia 35.63 18 3 6.3
Lithuania 34.93 6.7
Luxembourg 26.84 4.1***
Malta 27.52 5.2***
Macedonia 42.55* 9.3
Montenegro 29.34* 4.6
Netherlands 26.47 5.1
Portugal 33.22 24 4 7.9
Romania 31.92 4.9
Serbia 28.73* 4.1
Slovakia 26.27 14 1 4.0
UK 35.51 47 5 7.2
Iceland 24.82 47 5 4.9***
*2010; **2009; ***calculated from EQLS income-data
APPENDIX B: Data-Sources
Master Thesis MSc Sociology - Candidate No. 370276 72

WVS Wave 6 and 3
http://www.worldvaluessurvey.org/WVSDocumentationWV6.jsp
http://www.worldvaluessurvey.org/WVSDocumentationWV3.jsp
Third EQLS
UK Data Archive, login required. After log-in, click on
‘Discover’, and search for ‘EQLS 2011’
ISSP Social Inequality Module 2009
GESIS Data Archive, log in required. Go to:
https://dbk.gesis.org/dbksearch/sdesc2.asp?no=5400&db=E&tab=3
Solt’s (2009a; 2009b) SWIID
Go to:
http://thedata.harvard.edu/dvn/dv/fsolt/faces/study/StudyPage.xhtml?
studyId=36908&tab=files
Download ‘SWIIDv4_0.zip’.
APPENDIX C: Model Comparison
Table A4: Model Comparison of Happiness on Income-Inequality, Relative Concerns,Meritocratic Perceptions
Total Sample (All Subgroups)
Including: M1 M2 M3 M4 M5 M6*
Master Thesis MSc Sociology - Candidate No. 370276 73

Intercept X X X X X X Micro-Level Controls X X X X X
Relative Concerns X X X X
Income-Inequality X X X
Meritocratic Perceptions X X
Income-Inequality × Meritocratic Perceptions
X
-2 Loglikelihood (df) 44,986.5 40,755.7
(20)40,775.8 (21)
40,784.5 (22)
40,791,3 (23)
40,805.6 (24)
*Model 6 appears as Model 1 in Table 1.
Table A5: Model Comparison of Happiness on Income-Inequality and Optimism/ Pessimism
Total Sample (All Countries)
Including: M1 M2 M3 M4 M5*
Intercept X X X X X Micro-Level Controls X X X X
Macro-Level Controls X X X
Optimism-Dummies X X
Income-Inequality ×Optimism-Dummies
X
-2 Loglikelihood (df) 121,318.4 116,231.1 (19)
116,231.2 (20)
116,210.4 (22)
116,236.6 (24)
*Model 5 appears as Model 1 in Table 2 in the text.
Table A6: Model Comparison of Optimism/ Pessimism on Meritocratic Perceptions
Master Thesis MSc Sociology - Candidate No. 370276 74

Total Sample (All Countries)
Including: M1 M2 M3*
Intercept X X X
Micro-Level Control-Variables X X
Meritocratic-Perceptions-Dummies X
-2 Loglikelihood (df) 9,853.0 626.6 (14) 2,297.9 (24)*Model 3 appears as Model 1 and Model 3 in Table 3 in the text.
Master Thesis MSc Sociology - Candidate No. 370276 75

APPENDIX D: Additional Results
Table A7: Robustness-Analysis Results on Happiness Influenced from Income-Quintile Ratio (Inequality)
Replication M1 Table 1 text Replication M1 Table 2 text Replication M2 Table 2 text
M1 (WVS) M2 (EQLS) M3 (EQLS)
b SE b SE b SE
Intercept +0.552*** (0.039) +
+1.318***(0.089)
+1.527***
(0.094)
Individual-Level characteristics Optimism/ Pessimism
- Optimistic +0.418***
(0.060) +0.241** (0.08
0)
- Neutral +0.286***
(0.045) +0.239** (0.07
6) - Pessimistic (ref.) - - - - Relative Concerns - 0.007* (0.003)
Country-Level Variables Income-inequality (Income-Quintile Ratio) +0.009 (0.015) -
0.202***(0.042)
+- 0.151*
(0.063)
Meritocratic Perceptions +0.003 (0.002) +. Income-Inequality × - 0.001 (0.001)
Master Thesis MSc Sociology - Candidate No. 370276 76

Meritocratic Perceptions Income-Inequality × Optimistic
00.092* (0.038) - 0.021 (0.06
7) Income-Inequality × Neutral
00.053 (0.029) 00.079 (0.06
3) Income-Inequality × Pessimistic (ref.)
- - - -
Individual-Level Variance 96.7% 95.9% 97.4%Country-Level Variance 03.3% 04.1% 02.6%Nindividuals 21,701 29,745 15,534Ncountries 00,017 00,033 00,016Source: World Values Survey (2010-2012) and European Quality of Life Survey (2011-2012). Note: The same controls were used as in the corresponding original models. Unstandardized coefficients. * p < .05, ** p < .01, *** p < .001.
Master Thesis MSc Sociology - Candidate No. 370276 77

Table A8: Additional Models EQLS
Replication M2 Table 2 text Replication M1 Table 2 text
M1 (High-Corruption Countries) M2 (Control for Meritocratic Perceptions)
b SE b SE
Intercept +0.895** (0.184)++1.252***
(0.090)
Individual-Level characteristics Optimism/ Pessimism
- Optimistic +0.513 (0.071) +0.378*** (0.079)
- Neutral +0.295*** (0.046) +0.273**
* (0.058)
- Pessimistic (ref.) - - - - Country-Level Variables
Income-inequality (GINI) - 0.045* (0.017) - 0.057** (0.018)
Meritocratic Perceptions + +0.021*** (0.003)
Income-Inequality × Optimistic
+0.023 (0.013) 00.034 (0.018)
Master Thesis MSc Sociology - Candidate No. 370276 78
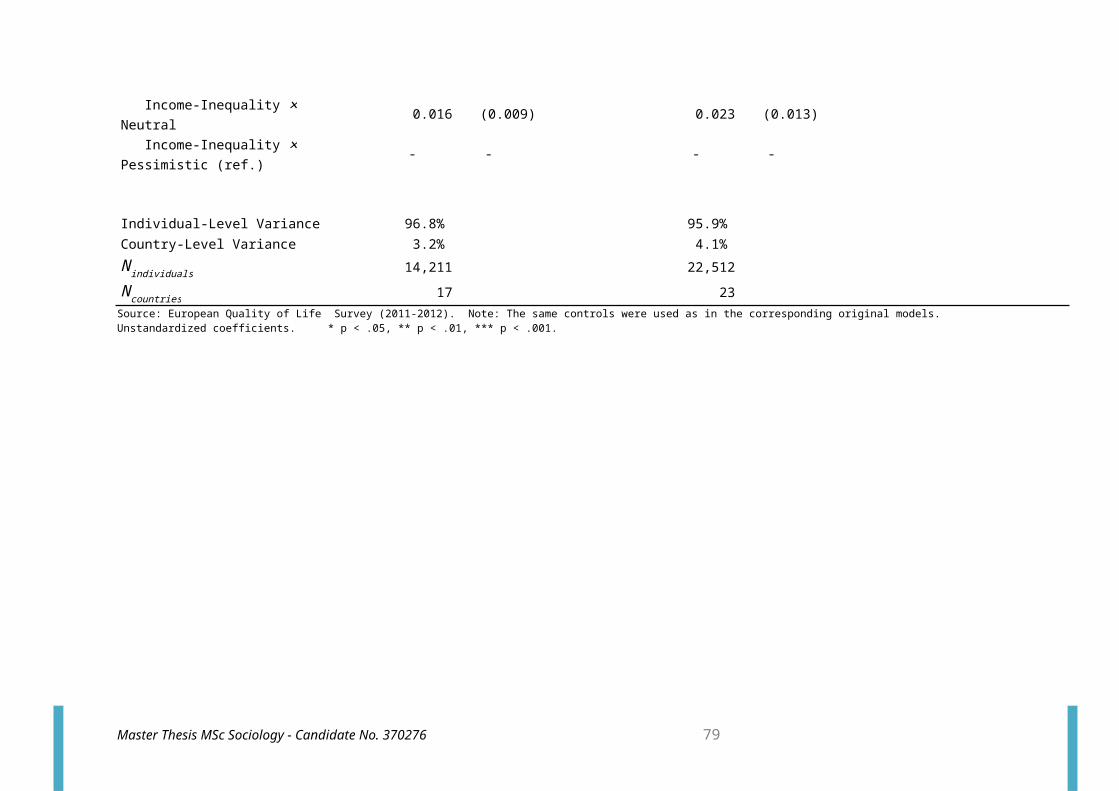
Income-Inequality × Neutral
+0.016 (0.009) 00.023 (0.013)
Income-Inequality × Pessimistic (ref.)
- - - -
Individual-Level Variance 96.8% 95.9%Country-Level Variance 03.2% 04.1%Nindividuals 14,211 22,512Ncountries 00,017 00,023Source: European Quality of Life Survey (2011-2012). Note: The same controls were used as in the corresponding original models. Unstandardized coefficients. * p < .05, ** p < .01, *** p < .001.
Master Thesis MSc Sociology - Candidate No. 370276 79

REFERENCES
Agresti, A. & Finlay, B. (2009). Statistical Methods for the Social Sciences.New Jersey: Prentice Hall.
Alesina, A., Tella, R. Di. & MacCulloch, R. (2004). Inequality andHappiness: are Europeans and Americans Different? Journal of PublicEconomics, 88(9-10), 2009-2042.
Allen, P. & Bennett, K. (2010). PASW Statistics by SPSS: A Practical Guide,Version 18.0. South Melbourne: Cengage Learning Australia Hall.
Ariely, D. (2012, August 2) Americans Want to Live in a Much MoreEqual Country (They Just Don’t Realize It). The Atlantic. Retrieved on30 July 2014, fromhttp://www.theatlantic.com/business/archive/2012/08/americans-want-to-live-in-a-much-more-equal-country-they-just-dont-realize-it/260639/2/ .
Armingeon, K. & Careja, R. (2004). Comparative Data Set for 28 Post-Communist Countries, 1989-2004. Codebook. Bern: Institute of PoliticalScience, University of Bern. Retrieved on 21 July 2014, fromhttp://www.ipw.unibe.ch/unibe/wiso/ipw/content/e2425/e2426/e3672/e5203/files5204/SPSSCodebook2006_ger.pdf .
Ball, R. & Chernova, K. (2008). Absolute Income, Relative Income,and Happiness. Social Indicators Research, 88, 497-529.
Berg, M. & Veenhoven, R. (2010). Income Inequality and Happinessin 119 Nations In Search for an Optimum that Does Not Appear toExist. In: B. Greve (Ed.), Social Policy and Happiness in Europe (pp. 174-194). Cheltenham: Edgar Elgar Publishing.
Bicchieri, C. (2006). The Grammar of Society. The Nature and Dynamics ofSocial Norms. New York: Cambridge University Press.
Bjørnskov, C. Dreher, A., Fischer, J. A. V., Schnellenbach, J. &Gehring, K. (2013). Inequality and Happiness: When PerceivedSocial Mobility and Economic Reality do not Match. Journal of EconomicBehavior & Organization, 91, 75-92.
Blanchflower, D. & Oswald, A. (2003). Kesebir, S. & Diener, E.(2011). Income Inequality and Happiness. Psychological Science,22(9),1095-1100.
Blanchflower, D. G. & Oswald, A. J. (2004). Well-Being Over Timein Britain and the USA. Journal of Public Economics, 88, 1359-1386.
Master Thesis MSc Sociology - Candidate No. 370276 80

Bloom, P. B. N. & Arikan, G. (2012). Religion and Support for Democracy: ACross National Test of the Mediating Mechanisms. [Supplementary Online Appendix].Retrieved on 15 July 2014, from http://garikan.yasar.edu.tr/wp-content/uploads/2012/06/BJPOLS-SUPP-APPENDIX.pdf.
Caporale, G. M., Georgellis, Y. Tsitsianis, N. & Yin, Y. P.(2009). Income and Happiness Across Europe: Do Reference ValuesMatter? Journal of Economic Psychology, 30, 42-51.
Clark, A. E. (2003). Inequality-Aversion and Income Mobility: A Direct Test.Paris: CNRS and DELTA-Fédération Jourdan.
Clark, A. E., Frijters, P. & Shields, M. A. (2008). RelativeIncome, Happiness, and Utility: An Explanation fort he EasterlinParadox and Other Puzzles. Journal of Economic Literature, 46(1), 95-144.
Christensen, P. N., Rothgerber, H., Wood, W., & Matz, D. C.(2004). Social Norms and Identity Relevance. A MotivationalApproach to Normative Behavior. Personal and Social Psychology Bulletin, 30,1295–1309.
Directorate-General of Budget, Accounting and Statistics Taiwan(2013). Manpower Survey Results in October 2013. Retrieved on 17July 2014, from:http://eng.dgbas.gov.tw/public/Attachment/3112116234A8RD8SAF.pdf .
Di Tella, R., MacCulloch, R. & Oswald, A. (1997). The Macroeconomicsof Happiness. CEP Working Paper 19. London: CPE.
Duesenberry, J. S. (1949). Income, Saving and the Theory of ConsumerBehavior. Cambridge, Massachusetts: Harvard University Press.
Easterlin, R. (1974). Does Economic Growth Improve the Human Lot?In P. A. David & M. W. Reder (Eds.), Nations and Households in EconomicGrowth (pp. 89-125). New York: Academic Press.
Elster, J. (2007). Explaining Social Behavior: More Nuts and Bolts for the SocialSciences. Cambridge: Cambridge University Press.
Elster, J. (2009). Norms In P. Hedström & P. Bearman (Eds.), TheOxford Handbook of Analytical Sociology (pp. 194-215). Oxford: OxfordUniversity Press.
Esping-Andersen, G. (2009). The Incomplete Revolution: Adapting to Women’sNew Roles. Cambridge: Polity Press.
Eurofound (2011-2012). European Quality of Life Survey, 2011-2012. StudyNumber 7316, 2nd Edition [Data set]. Colchester, Essex: UK Data Archive[Distributor]. Retrieved on 21 January 2014, fromhttp://dx.doi.org/10.5255/UKDA-SN-7316-2.
Master Thesis MSc Sociology - Candidate No. 370276 81

Eurofound (2011). Third European Quality of Life Survey. Questionnaire. Dublin/Brussels: Eurofound. Retrieved on 5 February 2014, fromhttp://www.eurofound.europa.eu/surveys/eqls/2011/questranslation.htm .
Eurofound & GfK EU3C. (2013). 3rd European Quality of Life Survey. TechnicalReport. Dublin/ Brussels: Eurofound.
Fourcade, M. (2013). The Economy as Morality Play, andImplications for the Eurozone Crisis In M. Fourcade & P. Steiner(eds.), Moral Categories in the Financial Crisis (pp. 21-27). Paris: MaxPlanck Sciences Po Center.
Ferrer-i-Carbonell, A. (2005). Income and Well-Being: An EmpiricalAnalysis of the Comparison Income Effect. Journal of Public Economics, 89,997-1019.
Fischer, J. A. (2009). The Welfare Effects of Social Mobility.OECD Social, Employment and Migration Working Papers, No. 93. Paris: OECD.Retrieved at 1 May 2014, fromhttp://dx.doi.org/10.1787/221272634852 .
Frank, R. H. (1985). The Demand for Unobservable and OtherPositional Goods. American Economic Review, 75(1), 101-116.
Frey, B. S. & Stutzer, A. (2002). The Economics of Happiness.World Economics, 3(1), 1-17.
Goldthorpe, J. H. (2007). On Sociology. Volume One – Critique and Program.Stanford: Standford University Press.
Graham, C. & Felton, A. (2005). Inequality and Happiness: Insightsfrom Latin America. Journal of Economic Inequality, 4, 107-122.
Henry, P. J. (2009). Low-Status Compensation. A Theory forUnderstanding the Role of Status in Cultures of Honor. Journal ofPersonality and Social Psychology, 97, 451-466.
Hopkins, E. (2008). Inequality, Happiness and Relative Concerns:What Actually is their Relationship? Journal of Economic Inequality, 6(4),351-372.
Hopkins, E. & Kornienko, T. (2009). Status, Affluence, andInequality: Rank-Based Comparisons in Games of Status. Games andEconomic Behavior, 67, 552-568.
Hox, J. (2002). Multilevel Analysis. Techniques and Applications. New Jersey:Lawrence Erlbaum Associates.
Master Thesis MSc Sociology - Candidate No. 370276 82

Inglehart, R. (1985). Aggregate Stability and Individual LevelFlux in Mass Belief Systems: the Level of Analysis Paradox.American Political Science Review, 79, 97- 116.
International Labour Organisation (1982). Statistics of LabourForce, Employment, Unemployment and Underemployment. MainStatistics (Annual) – Unemployment. Conference-Paper, October1982, Geneva.
International Social Survey Programme (2009). Social Inequality IV –ZA5400 Version 3.0.0 [Data set]. ISSP Research Group. Cologne: GESIS DataArchive. Retrieved on 4 April 2014, from doi:10.4232/1.11506 .
Jiang, S., Lu, M. & Sato, H. (2011). Identity, Inequality, andHappiness: Evidence from Urban China. World Development, 40(6), 1190-1200.
King, G., Keohane, R. O. & Verba, S. (1994). Designing Social Inquiry.Princeton: Princeton University Press.
Layard, R. Mayraz, G., Stephen, N. (2009). Does Relative Income Matter?Are the Critics Right? CEP Discussion Paper No. 918. London: CEP.
Lee, K. S. & Ono, H. (2012). Marriage, Cohabitation, andHappiness: A Cross-National Analysis of 27 Countries. Journal ofMarriage and Family, 74(5), 953-972.
Marshall, G., Swift. A., Routh, D. & Burgqyne, C. (1999). What Isand What Ought to Be. Popular Beliefs About Distributive Justicein Thirtheen Countries. European Sociological Review,15(4), 349-367.
Merton, R.K. (1939). Social Structure and Anomie. AmericanSociological Review, 3(5), 672-682.
Merton, R. K. (1968). Social Theory and Social Structure. New York: FreePress.
Myers, D. G. (1999). Close Relationships and Quality of Life In D.Kahneman, E. Diener & N. Schwartz (Eds.), Well-Being: The Foundations ofHedonic Psychology (pp. 376-393). New York: Russell Sage Foundation.
Neugarten, B. L., Moore, J. W. & Lowe, J. C. (1965). Age Norms,Age Constraints, and Adult Socialization. American Journal of Sociology,70, 710-717.
Neves, L.M.P. (2000). Putting Meritocracy in its Place The Logicof Performance in the United States, Brazil and Japan, Critique ofAnthropology, 20(4), 333-357.
Master Thesis MSc Sociology - Candidate No. 370276 83

Oishi, S., Kesebir, S. & Diener, E. (2011). Does Inequality ReduceHappiness? Evidence from the States of the USA from the 1970’s tothe 1990’s, Conference-Paper, March 2003, Milan.
Oshio, T. & Kobayashi, M. (2010). Income Inequality, PerceivedHappiness, and Self-Rated Health: Evidence from Nationwide Surveysin Japan. Social Science & Medicine, 70, 1358-1366.
Parsons, T. (1937). The Structure of Social Action. New York: McGraw Hill.
Peterson, R. A. (2005). Problems in Comparative Research. TheExample of Omnivorousness. Poetics, 33, 257-282.
Piketty, T. (2014). Capital in the Twenty-First Century. Cambridge,Massachusetts: Harvard University Press.
Roex, K.L.A. (2013). Favouring the Competition You Have Lost. A Study of Supportfor Meritocratic Values in Various Societies among Different Individuals. Retrieved on21 December, 2013, fromhttp://dspace.library.uu.nl/handle/1874/283599 .
Russell, H. Watson, D. & McGinnity, F. (2013). Unemployment andSubjective Well-Being In D. Gallie (eds.), Economic Crisis, Quality ofWork, & Social Integration (pp.229-255). Oxford: Oxford University Press.
Salavecz, G., Chandola, T., Pikhart, H., Dragano, N., Siegrist,J., Jöckel, K. H., Erbel, R., Pajak, A., Malyutina, S., Kubinova,R., Marmot, M., Bobak, M. & Kopp, M. (2010). Work Stress andHealth in Western European and Post-Communist Countries: An East-West Comparison Study. Journal of Epidemiology & Community Health, 64, 57-62.
Senik, C. (2002). When Information Dominates Comparison: A Panel Data AnalysisUsing Russian Subjective Data. Working Papers Series 495. Michigan: WilliamDavidson Institute.
Senik, C. (2008). Ambition and Jealousy: Income Interactions inthe ‘Old’ Europe Versus the ‘New’ Europe and the United States.Economics, 75, 495-513.
Siedlitz, L., Wyer, R. & Diener, E. (1997). Cognitive Correlatesof Subjective Well-Being: The Processing of Valenced events byHappy and Unhappy Persons. Journal of Research in Personality, 31(1), 240-56.
Solt, Frederick. (2009a). Standardizing the World Income Inequality Database.SWIID Version 4.0, September 2013 [Data set]. Cambridge, Massachusetts:Harvard Dataverse Network. Retrieved on 6 July 2014, fromhttp://thedata.harvard.edu/dvn/dv/fsolt/faces/study/StudyPage.xhtml?studyId=36908&tab=files.
Master Thesis MSc Sociology - Candidate No. 370276 84

Solt, Frederick. (2009b). Standardizing the World IncomeInequality Database. Social Science Quarterly, 90(2), 231-242.
Spitzer, M., Fischbacher, U., Herrnberger, B., Grön, G. & Fehr, E.(2007). The Neural Signature of Social Norm Compliance. Neuron, 56,185-196.
Stavrova, O. Schlösser, T. & Fetchenhauer, D. (2011). Are theUnemployed Equally Unhappy All Around the World? The Role of theSocial Norms to Work and Welfare State Provision in 28 OECDCountries. Journal of Economic Psychology, 32, 156-171.
Swierstra, T. & Tonkens, E. (2008). De Beste de Baas? Prestatie, Respect enSolidariteit in een Meritocratie. Amsterdam: Amsterdam University Press.
Thomas, W. I. & Thomas, D. S. (1928). The Child in America: BehaviorProblems and Programs. New York: Knopf.
Tomes, N. (1986). Income Distribution, Happiness and Satisfaction:A Direct Test of the Interdependent Preferences Model. Journal ofEconomic Psychology, 7, 425-446.
Transparency International (2011). Corruption Perception Index 2011.Berlin: Transparency International.
United Nations Development Programme (2011). Human Development Report2011. Sustainability and Equity: A Better Future for All. New York: MacMillan.
Veblen, T. (1899). The Theory of the Leisure Class. New York: Macmillan.
Veenhoven, R. (1984). Conditions of Happiness. Dordrecht/ Boston.Kluwer Academic.
Verhaeghe, P. (2011). De Effecten van een Neoliberale Meritocratieop Identiteit en Interpersoonlijke Verhoudingen. Oikos, 56(1), 4-22.
Vila, J. Cervera, J. & Carausu, F. Quality Assessment oft he Third EuropeanQuality of Life Survey. Dublin: Eurofound. Retrieved on 22 July 2014,from http://esds.ac.uk/doi/?sn=7316#2 .
Whelan, C. & McGinnity, F. (2000) Unemployment and Satisfaction: AEuropean Analysis In D. Gallie & S. Paugam (Eds.), Welfare Regimesand the Experience of Unemployment in Europe (pp. 286-306). Oxford: OxfordUniversity Press.
Wilkinson, R. & Pickett, K. (2010). The Spirit Level. Why Equality is Betterfor Everyone. London: Penguin.
World Bank (2014a). Unemployment, Total (% of Total Labor Force) (Modeled ILOEstimate). Countries Between 1980-2013. Retrieved on 17 July 2014, from:http://data.worldbank.org/indicator/SL.UEM.TOTL.ZS .
Master Thesis MSc Sociology - Candidate No. 370276 85

World Bank (2014b). GDP per Capita (Current US Dollars). Countries Between 1980-2013. Retrieved on 17 July 2014, from:http://data.worldbank.org/indicator/NY.GDP.PCAP.CD .
World Values Survey Association (2012). WVS 2010-2012 Wave, RevisedMaster. Alcobendas/ Stockholm: World Values Survey Association.Retrieved on 8 May 2014, from http://www.worldvaluessurvey.org/WVSDocumentationWV6.jsp.
World Values Survey Association (2014). Fieldwork and Sampling.Alcobendas/ Stockholm: World Values Survey Association. Retrievedon 22 July 2014, fromhttp://www.worldvaluessurvey.org/WVSContents.jsp .
World Values Survey Association (2014). Questionnaire Development.Alcobendas/ Stockholm: World Values Survey Association. Retrievedon 22 July 2014, fromhttp://www.worldvaluessurvey.org/WVSContents.jsp .
World Values Survey Wave 3 (1995-1998). Official Aggregate v.20140429[Data set]. World Values Survey Association(www.worldvaluessurvey.org). Aggregate File Producer: Madrid:Asep/ JDS. Retrieved on 9 May 2014, fromhttp://www.worldvaluessurvey.org/WVSDocumentationWV3.jsp .
World Values Survey Wave 6 (2010-2014). Official Aggregate v.20140429[Data set]. World Values Survey Association(www.worldvaluessurvey.org). Aggregate File Producer: Madrid:Asep/ JDS. Retrieved on 3 May 2014, fromhttp://www.worldvaluessurvey.org/WVSDocumentationWV6.jsp .
Master Thesis MSc Sociology - Candidate No. 370276 86