Inequalities in Health Outcomes: Evidence from NSS Data
27
Inequalities in Health Outcomes: Evidence from NSS Data Anushree K N S Madheswaran
-
Upload
khangminh22 -
Category
Documents
-
view
4 -
download
0
Transcript of Inequalities in Health Outcomes: Evidence from NSS Data
Inequalities in HealthOutcomes: Evidencefrom NSS Data
Anushree K NS Madheswaran

ISBN 978-81-7791-269-2
© 2018, Copyright Reserved
The Institute for Social and Economic Change,Bangalore
Institute for Social and Economic Change (ISEC) is engaged in interdisciplinary researchin analytical and applied areas of the social sciences, encompassing diverse aspects ofdevelopment. ISEC works with central, state and local governments as well as internationalagencies by undertaking systematic studies of resource potential, identifying factorsinfluencing growth and examining measures for reducing poverty. The thrust areas ofresearch include state and local economic policies, issues relating to sociological anddemographic transition, environmental issues and fiscal, administrative and politicaldecentralization and governance. It pursues fruitful contacts with other institutions andscholars devoted to social science research through collaborative research programmes,seminars, etc.
The Working Paper Series provides an opportunity for ISEC faculty, visiting fellows andPhD scholars to discuss their ideas and research work before publication and to getfeedback from their peer group. Papers selected for publication in the series presentempirical analyses and generally deal with wider issues of public policy at a sectoral,regional or national level. These working papers undergo review but typically do notpresent final research results, and constitute works in progress.
Working Paper Series Editor: Marchang Reimeingam
INEQUALITIES IN HEALTH OUTCOMES: EVIDENCE FROM NSS DATA
Anushree K N∗ and S Madheswaran∗∗
Abstract The purpose of this study is to assess the socioeconomic inequalities in health outcomes by gender and place of residence and to explain the contribution of different factors to the overall inequality. The study used data of NSSO 60th (2004) and 71st (2014) rounds. The health outcome of interest was self-reported morbidity captured in the survey with fifteen days’ recall period. Socioeconomic status was measured by per capita monthly expenditure and the concentration index is used as a measure of socioeconomic health inequalities and is decomposed into its contributing factors. Our findings show that high level inequalities in self-reported morbidity were largely concentrated among wealthier groups in India. Though the inequalities in self-reported morbidity were more among the wealthier groups for Karnataka, yet the magnitude of inequalities in reported morbidity was low for both the years. Decomposition analysis shows that inequalities in reported morbidity are particularly associated with demographic, economic and geographical factors. Keywords: Self-reported morbidities, socio economic factors, health inequalities,
concentration index, decomposition analysis.
Introduction Health is a multidimensional entity whose enhancement and sustenance among population is considered
as an important objective of any health system (WHO, 2000). In this context, several studies have
examined the relationship between age, gender, socioeconomic status and its association to health.
However, in the last few decades, the issue of socioeconomic inequalities and their subsequent
relationship to differences in several health outcomes among various sub groups of the population has
gained importance in the policy documents at sub national, national and international levels (Acheson,
2011; GOK, 2001; Murray & Frenk, 2000). In this context, the existence of a clear socioeconomic status
[SES] gradient in health is well documented in the industrialised world (Dalstra et al., 2005; Heidi
Ullmann, Buttenheim, Goldman, Pebley, & Wong, 2011; Kunst et al., 2005; Kunst, Geurts, & Van Den
Berg, 1995; Vasquez, Paraje, & Estay, 2013). Such gradients shows consistency across different health
outcomes. For instance, improvements in reported health has been observed for every successive
increase in socioeconomic hierarchy (Vasquez et al., 2013). In addition, there are some evidences that
the magnitude of SES inequalities in health outcomes differ between gender and subgroups of
population within males and females and by geographical areas i.e. rural and urban areas (Patra &
Bhise, 2016; Bora & Saikia, 2015; Matthews, Manor, & Power, 1999; MacIntyre & Hunt, 1997). Further,
even in low and middle income countries, such socioeconomic gradient in health outcomes is observed
(Rahman, Mohammad Hifzur, 2011; S Vellakkal et al., 2015; Sukumar Vellakkal et al., 2013; Xu & Xie,
2017). For instance, a study in Thailand found that inequality gradients were disadvantageous to the
∗ PhD Scholar, Centre for Economic Studies and Planning (CESP), Institute for Social and Economic Change [ISEC]
Nagarbhavi, Bangalore-560072, India. Email: [email protected] ∗∗ Professor, Centre for Economic Studies and Planning (CESP), Institute for Social and Economic Change [ISEC]
Nagarbhavi, Bangalore-560072, India. Email: [email protected]
The authors are thankful to Ms B P Vani, Dr Sobin George and Dr Lekha Subaiya for their useful comments and discussions on the earlier versions of this paper. They are also grateful to the anonymous referees.

2
poor for both self-reported morbidity and self-assessed health (Yiengprugsawan, Lim, Carmichael,
Sidorenko, & Sleigh, 2007). Other studies in India also confirmed that inequality gradients were
disproportionately biased towards the poor for self-assessed health (Brinda, Attermann, Gerdtham, &
Enemark, 2016; Goli, Singh, Jain, & Pou, 2014); while, the inequality gradients were more concentrated
among the rich for self-reported morbidity (Jain, Goli, & Arokiasamy, 2012; Prinja, Jeyashree, Rana,
Sharma, & Kumar, 2015). Thus, the observed gradients are not consistent between and within the
countries and also vary with change in health outcomes. Moreover, only a few evidences are found in
terms of accounting for gender or spatial differences while analysing the magnitude of SES inequalities
in self-reported morbidity (Hosseinpoor et al., 2012). Therefore, given the varying levels of availability
of health infrastructure and varying levels of people’s awareness about their own health, an inaccurate
picture regarding the concentration of certain health outcomes may lead to major public health
challenges in terms of effective targeting of the health programmes in LIMCS especially, in a country
like India which is experiencing different levels of demographic transition reflected by an aging
population and epidemiological transition indicated by changes in the leading causes of death and
burden of disease. Within this context, the paper tries to understand the SES health inequalities in self-
reported morbidity after accounting for gender i.e. male and female and spatial differences i.e. rural and
urban areas.
Since health is a state subject in India and many policy interventions identified and
implemented are state specific in nature, the exploration of the above-mentioned issues are analysed in
this paper for Karnataka, one of the South Indian states, vis-à-vis India. The main reason for choosing a
South Indian state is that despite the remarkable achievements of all South Indian states in reducing
MMR and IMR targets as set by the Government of India to achieve MDGs, morbidity levels across the
South Indian states have increased and are high in different age groups compared to all-India levels
(Paul & Singh, 2017). One of the main arguments put forth in the literature for high levels of morbidity
with lower levels of mortality in Kerala, one of the South Indian states, is that the poor health status is
associated with low levels of income and low levels of nutritional intake (Suryanarayana, 2008).Thus,
the current paper addresses three questions: First, does the magnitude of reported morbidity as defined
by SES differ after taking into account gender and spatial differences? Second, if so, what are the major
factors associated in explaining those differences? Third, do the SES inequalities in self-reported
morbidity after taking into account gender and spatial differences vary over time? The rest of the paper
is organised as follows: Section two provides information on data and methodology; Section three
presents the empirical results of the study findings, followed by the discussion in Section four and
conclusion in Section five.
Data and Methods In order to assess health inequality over time, we made use of unit level nationally representative cross-
sectional household survey data titled “Morbidity Health Care and Condition of the Aged” and “Social
Consumption: Health”, which was collected by the National Sample Survey Organisation, India for 2004
and 2014.

3
Sampling The sampling design was stratified into two stages, with urban blocks and census villages as the First
Stage Units [FSUs] for urban and rural areas respectively, and households as the Second Stage Units
[SSUs]. These surveys were conducted during the period of January to June during 2004 and 2014
respectively in line with 35th, 42nd and 52nd rounds of NSS. The main purpose of these surveys is to
collect information on morbidity and death profile of the population, individual and socioeconomic
background, extent of utilisation of outpatient, inpatient and preventive health care services, related
expenditure incurred for the treatment and lastly, the conditions and problems of the aged persons. The
present study makes use of the self-morbidity information with a 15-day reference period captured by
the survey to assess the magnitude of inequality in health across income groups. The conceptualisation
of illness in the 60th round (NSS, 2004) with the 15-day reference period includes (i) Cases of visual,
hearing, speech, loco motor and mental disabilities (ii) Injuries such as cuts, wounds, haemorrhage,
fractures and burns caused due to accident, including bites to any part of the body (iii) Cases of
spontaneous abortion – natural or accidental. Whereas the NSS 71st round of definition of illness with
15-day reference period includes (i) All types of injuries, such as cuts, wounds, haemorrhage, fractures
and burns caused by accident, including bites to any part of the body (ii) Cases of abortion – natural or
accidental. Further, in the 71st round (NSS, 2014) all pre-existing disabilities which were considered as
chronic ailments provided they were under treatment for a month or more during the reference period.
Disabilities acquired during the reference period i.e. whose onset was within the reference period were
recorded as ailment. NSSO, 2004 and NSSO, 2014 reports provide an elaborate sampling strategy and
definitions adopted for collecting information of various indicators. Table 1 shows the total number of
households sampled during 2004 and 2014, which were 73,868 and 65,932 respectively, thus
constituting 383,338 indivduals in 2004 and 333,104 in 2014 respectively. In the present analysis,
individuals aged less than 14 years were excluded because the reporting of the health of children was
mostly by proxy by some member of the household. Thus, the study analysis comprised 257,503 and
234,546 individuals aged 15 years and above in 2004 and 2014 respectively.
Table 1: Sample Size
India
Year 2004 2014
Rural Urban Total Rural Urban Total
Household 47,302 26,566 73,868 36,480 29,452 65,932
Individuals 2,50,775 1,32,563 3,83,338 1,89,573 1,43,531 3,33,104
Individuals >15 1,63,425 94,094 2,57,519 1,30,311 1,04,237 2,34,548 Source: Unit records from NSS, Using 71st (2014) and 60th (2004) Round Data.

4
Variables In quantifying health inequality, we utilize two groups of variables: Health outcome variables, and
control variables.
Health outcome Variable [Dependent Variable]
The health outcome variable is measured in the following perspective: The probability of an individual
reporting some illness in the last 15 days is analysed, which is based on the question “Were you were
suffering from any aliment during the last 15 days?” The information is captured as binary Yes = 1 if an
individual reported an aliment; otherwise = 0. In the present analysis, the reported morbidity is
examined for male and female, rural and urban separately. Table 2 reports that around 10 % in rural
and 11% in urban areas were reported to have some ailment in the last 15 days’ reference period in
2004 which increased to 13 % in urban areas and remained constant in rural areas in 2014.
Explanatory Variables
Various studies suggest in the literature that four broad factors affect the health of an individual, which
includes demographic factors, social factors, economic factors and environmental factors. Based on the
availability of information, the following set of variables are included in the study.
Demographic factors: Among the demographic factors, age, sex and marital status are the three most
important factors that influence health. Age was captured as a continuous variable in the survey.
However, in the present analysis, we created 5 age dummies [15-29, 30-44, 45-59, 60-69 and 70 plus]
with 15-29 years as a base category.
Information on marital status is originally captured in four categories. However, in the current
analysis, by merging divorced category into never married, 3 marital status dummies [never married,
currently married, widow] were created. Separate dummies were created with currently married as a
base category.
Economic Factors: Among economic factors, level of education, income levels, and occupation
status are said to influence an individual’s health condition. However, due to the non-availability of
information on occupation status in both the time periods, the variable is not included in the study.
NSS data does not capture information on household income. However, the survey captures
information on the usual monthly consumption expenditure of each household. This variable has been
divided by household size in order to obtain monthly per capita consumption expenditure. Later, the
MPCE is ranked (in ascending order after taking into account the state and rural-urban variations) and
divided into five equal parts, with the first quintile representing the poorest group and the fifth (last)
quintile representing the richest group in the order of consumption. Separate dummies were created
with the richest (fifth quintile) as a base category.
Information on the general educational level of individuals was collected in 13 categories in the
60th round and 15 categories in the 71st round. However, for the analyses, the 13 and 15 categories
were further classified into three broad categories: Illiterate, Primary, and Secondary and Above with
Secondary and Above level of education as a base category.

5
Social Factors: Among other social factors, caste and religion are two factors which indirectly and
directly are said to influence health. The information on the caste of the individuals was collected in 4
categories in both the surveys: Scheduled Tribe, Scheduled Caste, OBC and Forward Caste. Separate
dummies were created with Forward Caste as a base category. On the other hand, the information on
religion of the household was collected in 8 categories in both the surveys. However, for the analyses, 8
categories were further classified into four broad categories: Hindus, Muslims, Christians, and Other
Religions with Hindus as a base category.
Household Factors: The availability of certain amenities at household level such as proper sanitation
facilities, clean drinking water, proper drainage system and cooking facilities are said to influence an
individual’s health at various levels. Hence, two main indicators, proper sanitation and proper drainage
system, are considered in the present analysis. The information on sanitation facilities and drainage
facilities was collected in 5 categories in both the surveys. However, for the present study, the
information is further construed as a binary variable (Yes/No). The statistics of these variables are
summarized in Table 2.
Table 2: Description of Variables in the Year of 2004 and 2014 (means)
Variables
India
2004 2014
Rural Urban Rural Urban
Self-Reported Morbidity Prevalence 0.1 0.11 0.1 0.13
Age
15-29 0.4 0.41 0.39 0.37
30-44 0.3 0.31 0.3 0.32
45-59 0.19 0.18 0.21 0.2
60-69 0.07 0.06 0.07 0.07
70+ 0.04 0.03 0.04 0.04
Sex
Male 0.5 0.52 0.5 0.52
Female 0.5 0.48 0.5 0.48
Marital Status
Never Married 0.21 0.28 0.23 0.27
Currently Married 0.71 0.65 0.69 0.66
Widow 0.08 0.07 0.07 0.07
Caste
Scheduled Tribe 0.1 0.02 0.12 0.03
Scheduled Caste 0.21 0.15 0.2 0.14
Other Backward Caste 0.42 0.35 0.44 0.42
Forward Caste 0.28 0.47 0.24 0.41

6
Religion
Hindus 0.85 0.79 0.83 0.78
Muslims 0.1 0.15 0.12 0.16
Christians 0.02 0.03 0.02 0.03
Other Religions 0.03 0.03 0.03 0.03
Education
Illiterate 0.56 0.27 0.44 0.23
Primary 0.3 0.32 0.3 0.26
Secondary 0.14 0.41 0.26 0.51
Income Class
Poorest 0.26 0.04 0.25 0.07
Poor 0.25 0.08 0.26 0.12
Middle 0.22 0.14 0.21 0.15
Rich 0.18 0.25 0.19 0.22
Richest 0.09 0.49 0.09 0.44
Household Characteristics
Open Defecation 0.73 0.19 0.54 0.1
Non Availability of Drainage Facility 0.58 0.14 0.44 0.1 Source: Authors’ Calculation from NSS, Using 71st (2014) and 60th (2004) Round Data.
Methods Morbidity prevalence was calculated per 1000 population. The morbidity prevalence was defined as:
Where,
= Number of ailing persons
= Total number of persons alive in the sample households.
We carried out bivariate analysis between the background characteristics and the outcome
variable i.e. self-reported morbidity. In the second part of analysis, we used ratios to measure gender
differentials in health and further extended the analysis by incorporating the health concentration
curves and health concentration index to measure the extent of deviation in the ill-health of the people
irrespective of their income (Wagstaff, Paci, & van Doorslaer, 1991). We used concentration curves to
graphically present the cumulative distribution of ill-health (self-reported morbidity) on the y-axis
against the cumulative distribution of the population [based on monthly per capita expenditure (MPCE)]
from the poorest to the richest on the x-axis. The concentration curve above the line of equality (below)
suggests that inequality in ill-health is more concentrated among the advantaged (disadvantaged)
groups. If the curve coincides with the line of equality, it reflects that there is perfect equality in terms
of health among the groups. Further, we estimated the concentration index to quantify the magnitude
of socioeconomic inequality in self-reported morbidity. The concentration index is represented as twice
the covariance of the health variable (ill health; self-reported morbidity in the present study) and an

7
individual’s relative rank in terms of economic status (MPCE in the present study), divided by the
variable mean, as defined by the equation below(O’Donnell & Doorslaer, 2008) where is the ill-health
of the ith individual, is the fractional rank of the ith individual in terms of the monthly per capita
expenditure, is the sample size, is the (weighted) mean of the ill-health.
.
The value of the concentration index can vary between -1 and +1. A positive value indicates
that the health variable of interest is concentrated among the higher socioeconomic groups while the
opposite is true for negative values. The concentration index will be zero when there is perfect equality.
Since the variable of health whose inequality is measured is binary in nature, therefore, the minimum
and maximum possible values of the concentration index as showed (by (Wagstaff, 2005) will be equal
to and respectively.
After obtaining the estimates of health inequality, it is interesting to probe further into the
association of such inequalities with key socioeconomic correlates. For this purpose, the computed
health concentration index is decomposed to know the contributions of key socioeconomic factors
(Wagstaff, Van Doorslaer, & Watanabe, 2003). The decomposition method was first introduced to use
with a linear, additively separable model as shown in equation (iii) (O’Donnell et al., 2008). Since the
health variables are in general binary in nature, an appropriate statistical technique for non-linear
settings is needed. To elaborate, we first estimated determinants of self-reported morbidity for finding
the coefficients of the explanatory variables using probit regression analysis and obtained the marginal
effects of the coefficients.
Thus, given the relationship between Yi and Xki the health concentration index for Y ‘C’ can be
written as
Where βk is the coefficient from a regression of health outcome on determinant k, is the
mean of determinant k, µ is the mean of the health outcome, and Ck is the concentration index for
determinant k. In the latter component, GCε is the generalised concentration index for the error term.
Thus, equation 4 shows that the overall inequality in self-reported morbidity decomposed has two
components, a deterministic component and an unexplained component, which cannot be explained by
systematic variation in determinants across income groups. Thus, the deterministic component, the
decomposition analysis focuses on two main elements. That is the impact of each determinant on health
outcome , and the magnitude of unequal distribution of each determinant across the income
groups .

Prev
elan
ce r
ate'
000
Popu
latio
n
Tren
The p
popula
same
urban
areas
trend
gradua
was o
morbid
urban
and ur
popula
Fi
morbid
India f
and ab
years.
and m
morbid
age gr
interes
revers
72
020406080
100120140
ds in self –
revalence of s
ation during 20
time period (F
areas. For ins
compared to r
is also observe
ally increased i
bserved with i
dity was highe
areas. Interes
rban areas am
ation for the ye
igure 1: Trend
Tables in t
dity and key s
for two time p
bove reported
There exist st
marital status w
dity ratios sugg
roups for both
sting point obs
es and more m
65 70
2004
Karn
–reported m
self-reported m
004-2014. In K
Fig.1). Further
stance, at nati
ural areas (108
ed in Karnatak
n both male an
ncrease in age
er across the a
stingly, no diffe
ong females fo
ear 2014.
ds in Self-rep
K
the Appendix
socioeconomic
eriods. It show
more illness (a
atistically signi
with more illne
gest that in gen
the time peri
served in both
morbidity burde
98109
2014
ataka
Ru
Re
morbidity
morbidity at all
Karnataka, it in
r, variations in
onal level, hig
8 v/s 98; 130 v
ka except for th
nd female popu
e for both the
age group amo
erence was fo
or 2004. A sim
ported Morbid
Karnataka and
(A1 and A2)
and demogra
ws that a consi
around 40 per
ficant differenc
ess reported am
neral, females
ods in rural an
rural and urb
en is among th
8
98102
ral Urban
esults
-India level ha
ncreased from
n reported mor
her levels of r
v/s 99) betwee
he year 2004.
ulation (Table 3
genders in bo
ong females a
und in reporte
milar pattern is
dity Prevelanc
d India, 2004
illustrate biva
phic factors by
iderable propo
cent) as comp
ces in the prev
mong females.
have a higher
nd urban areas
ban areas for I
he males (Fig.2
108 100
2004
In
as increased fr
70 to 120 pe
rbidity are obs
reported morb
en 2004 and 20
Self- reported
3). Higher repo
oth time period
s compared to
ed morbidity in
observed in K
ce Rate by Pl
4-2014
riate associatio
y place of res
rtion of the old
ared to the yo
valence of repo
. The gender d
illness burden
s for Karnatak
India is that in
2 (a-b)). Furth
99
130
2014
dia
rom 100 to 13
er 1000 popula
served betwee
idity is observ
014 respectivel
morbidity pre
orted morbidity
ds. However, t
o males both i
n Karnataka be
Karnataka amon
lace of Reside
on between s
sidence for Kar
der population
unger populati
orted illness am
differentials as
compared to m
ka and India. H
n 2014, the illn
er, marital stat
109
30 per 1000
ation for the
en rural and
ed in urban
y. Similar, a
evalence has
y prevalence
the reported
in rural and
etween rural
ng the male
ence in
self-reported
rnataka and
of 70 years
ion of 15-59
mong gender
s defined by
males across
However, an
ness burden
tus also has

consid
widow
marrie
by soc
their c
among
per ce
quintil
in 200
income
Howev
Figur
Fi
0.00
1.00
2.00
3.00
4.00
1
Mor
bidi
ty R
atio
(F/
M)
derable influenc
ws reported mo
ed individuals in
cial class sugge
counterparts. I
g the illiterate
ent and 8 per
es reporting hi
04 and 2014.
e quintile in 2
ver, for both ru
re 2(a): Gend
gure 2(b): Ge
5‐29 30‐44
ce on the preva
ore illness (22
n rural and urb
ests that backw
In 2014 for K
(14 per cent a
cent) in rural
gher morbidity
Both in Karna
2014 than 200
ural and urban
der Differentia
ender Differe
4 45‐59
alence of self-r
v/s 10 and 5
ban areas respe
ward communit
Karnataka, the
nd 17 per cent
and urban are
y was observed
ataka and Indi
04 for urban a
areas, the repo
als in Morbid
200
entials in Mor
Karnatak
9
60‐69 70p
reported morbi
5; 33 v/s 14) w
ectively. Simila
ties have a high
difference in
t) in compariso
eas respectively
d in both rural a
ia, self-reporte
areas, while it
orted morbidity
ity by Age Gr
04-2014
bidity by Age
ka 2004-2014
lus Total
idity. In 2014,
when compare
rly, the prevale
her prevalence
reported mor
on to those wit
y. A clear econ
and urban area
ed morbidity ra
t was almost
y increased wit
roups and Pla
e Groups and
4
2004
2004
2014
2014
those who rep
ed to currently
ence of reporte
e of morbidity c
rbidity was alm
th secondary an
nomic gradient
as for Karnatak
ate were high
stagnant for
th each income
ace of Reside
Place of Resi
4 Rural
4 Urban
4 Rural
4 Urban
ported being
y and never
ed morbidity
compared to
most double
nd above (4
t with richer
ka and India
her for each
rural areas.
e quintile.
nce, India
idence,

10
Table 3: Trends of Self-reported Morbidity Prevalence Rate by Gender and Place of
Residence in Karnataka and India, 2004-2014
Age Distribution
India
2004 2014
Rural Urban Rural Urban
M F M F M F M F
15-29 42 56 44 56 35 58 38 60
30-44 64 93 64 95 60 94 71 126
45-59 114 143 128 174 109 163 173 239
60-69 273 278 325 354 247 270 331 379
70 plus 372 378 419 455 327 286 376 371
Total 90 111 94 123 84 115 108 154
Age Distribution
Karnataka
2004 2014
Rural Urban Rural Urban
M F M F M F M F
15-29 22 23 27 15 37 46 40 51
30-44 36 49 33 55 40 88 31 117
45-59 85 102 74 89 115 138 119 192
60-69 251 233 220 249 246 319 330 319
70 plus 508 433 487 587 308 325 359 485
Total 68 72 60 71 83 113 84 137 Source: Authors’ Calculation from NSS, Using 71st (2014) and 60th (2004) Round Data.
Inequality in Self-reported Morbidity We use Concentration Curve [CC] and Concentration Index [CI] to examine whether or not reported
morbidity was associated with the socio-economic status of the individuals. As shown in figure 3, for
both the years in rural and urban areas, the CCs for self-reported morbidity lie below the diagonal,
indicating that morbidity prevalence is higher among the richer income groups. The CC for self-reported
morbidity of urban Karnataka in 20014 overlaps with the diagonal for the poorer sections, but it
deviates from the diagonal for the middle and higher income sections. The shape of the CC suggests
there is differential in the morbidity prevalence between middle and higher income classes with
relatively greater concentration observed among higher income class (figure 4). However, whether or
not the deviation from the diagonal is statistically significant needs to be confirmed based on the CI.
Table 4 shows that the CI value for self-reported morbidity is positive and significant in Karnataka (CI:
0.069; CI: 0.055; CI: 0.040; CI: 0.064) for the year 2004 and 2014 between rural and urban areas
respectively. Further, even at the national level, the CI for self-reported morbidity in rural and urban
areas are positive and significant (CI: 0.154; CI: 0.095; CI: 0.153; CI: 0.116) for the year 2004 and
2014 respectively, indicating pro rich inequalities in reported ill-health.

11
00.20.40.60.81
0 0.2 0.4 0.6 0.8 1
Cum
ulat
ive
shar
e of
se
lf-re
port
ed m
orbi
dity
Cumulative share of population
India - 2004
Line of Equality Rural Urban
0
0.2
0.4
0.6
0.8
1
0 0.2 0.4 0.6 0.8 1Cum
ulat
ive
shar
e of
sel
f re
port
ed m
orbi
dity
Cumulative share of population
India -2014
Line of Equality Rural Urban
Figure 3: Concentration Curves for Self-reported Morbidity in India, 2004-2014
Similarly, Table A3 in the appendix also confirms significant inequalities manifesting along the
dimension of gender. For instance, at the national level, the socioeconomic inequalities in self-reported
morbidity among males (CI: 0.107) was constant for the two time periods, whereas the socioeconomic
inequalities within females increased from (CI: 0.146; CI: 0.156) during 2004-2014. For the state of
Karnataka, socioeconomic inequalities in self-reported morbidity showed that there were no systematic
differences in reporting of ill-health among males in 2004 while positive and significant variations
(CI:0.11) were found during 2014.
Table 4: Concentration Indices for Self-reported Morbidity by Place of Residence,
2004-2014
Year 2004 CI for Rural (se) CI for Urban (se) CI Total (se)
Karnataka 0.069** (0.026) 0.055* (0.029) 0.042** (0.019) All India 0.154*** (0.004) 0.095*** (0.005) 0.133*** (0.003)
Year 2014 CI for Rural (se) CI for Urban (se) CI Total (se)
Karnataka 0.040* (0.023) 0.064** (0.023) 0.060** (0.016) All India 0.153*** (0.005) 0.116*** (0.005) 0.163*** (0.003)
Source: Authors’ Calculation from NSS, Using 71st (2014) and 60th (2004) Round Data.
Note: Standard error of the CI in parenthesis; Denotes significance at ***1% level, **5% level, * 10
% level.

12
00.20.40.60.81
0 0.2 0.4 0.6 0.8 1
Cum
ulat
ive
shar
e of
sel
f
repo
rted
mor
bidi
ty
Cumulative share of population
Karnataka-2004
Line of Equality Rural Urban
00.20.40.60.81
0 0.2 0.4 0.6 0.8 1
Cum
ulat
ive
shar
e of
sel
f re
port
ed m
orbi
dity
Cumulative share of population
Karnataka- 2014
Line of Equality Rural Urban
Figure 4: Concentration Curves for Self-reported Morbidity in Karnataka, 2004-2014
Levels of Inequality Contribution for Self-reported Morbidity Finally, we decompose the concentration index for self-reported morbidity in Karnataka and India. The
decomposition allows us to understand the relative importance of each variable and its distribution in
magnifying health inequality. Given the nature of the data, we have estimated the probability of
reported morbidity using a probit model. In this case, we made a linear approximation to the model
using the partial effects evaluated at sample means. The marginal effects estimated at sample means
bear the expected signs. For instance, the demographic (age) variable shows that reported morbidity
increases with age. Similarly, females and widows had 2 per cent and 0.4 per cent higher probability of
reporting morbidity as compared to their counterparts respectively. Further, income has a negative
impact on reporting morbidity with lesser marginal effects associated with poorer and middle income
quintiles. Similarly, individuals belonging to backward and disadvantaged social groups are more likely
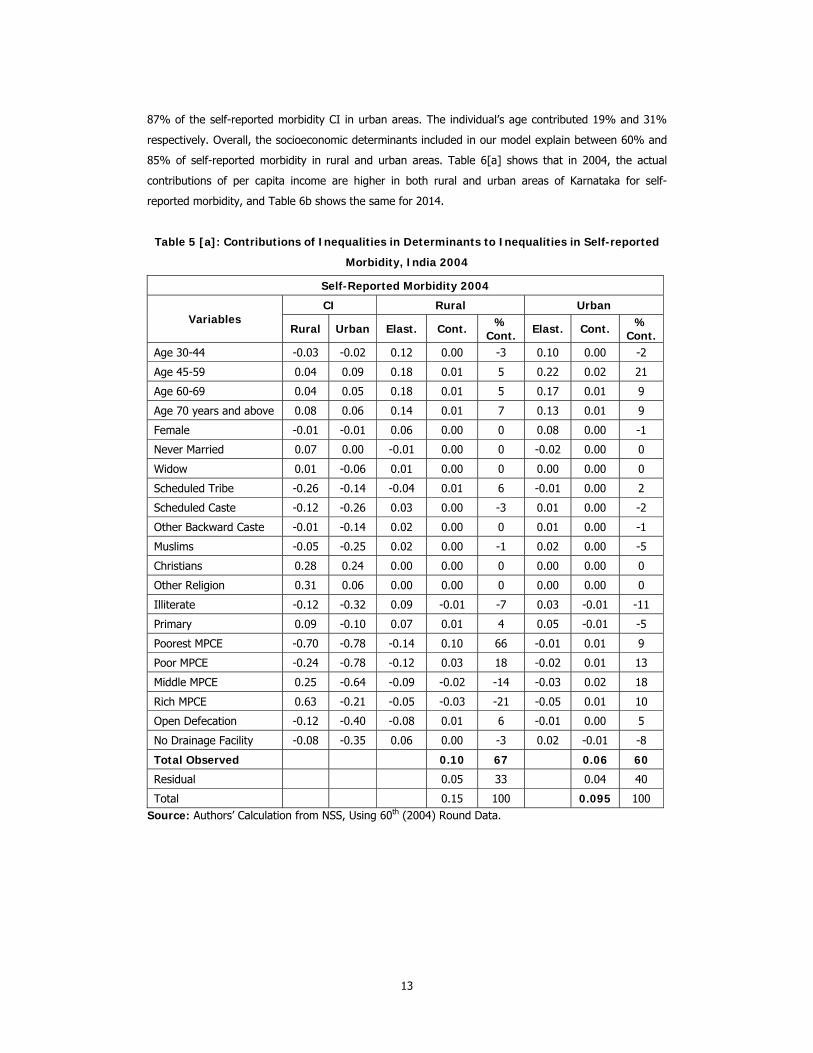
to report lower levels of health. Table 5 [a-b] presents the detailed decomposition results. It shows that
at national level, the largest contribution to inequality in self-reported morbidity comes from income,
followed by the individual’s age and access to sanitation facilities. For instance, in 2004, per capita
income contributed to around 49% of the self-reported morbidity CI in rural areas and around 50% of
the self-reported morbidity CI in urban areas. Further, the contribution of age to the self-reported
morbidity is 14% and 37% respectively. Inequalities in access to sanitation facilities contributed to 6%
and 5% of self-reported morbidity in rural and urban areas respectively. Similarly, (Table 5b) in 2014,
inequality in per capita income contributed to 67% of the self-reported morbidity CI in rural areas and
13
87% of the self-reported morbidity CI in urban areas. The individual’s age contributed 19% and 31%
respectively. Overall, the socioeconomic determinants included in our model explain between 60% and
85% of self-reported morbidity in rural and urban areas. Table 6[a] shows that in 2004, the actual
contributions of per capita income are higher in both rural and urban areas of Karnataka for self-
reported morbidity, and Table 6b shows the same for 2014.
Table 5 [a]: Contributions of Inequalities in Determinants to Inequalities in Self-reported
Morbidity, India 2004
Self-Reported Morbidity 2004
Variables CI Rural Urban
Rural Urban Elast. Cont. % Cont. Elast. Cont. %
Cont.Age 30-44 -0.03 -0.02 0.12 0.00 -3 0.10 0.00 -2
Age 45-59 0.04 0.09 0.18 0.01 5 0.22 0.02 21
Age 60-69 0.04 0.05 0.18 0.01 5 0.17 0.01 9
Age 70 years and above 0.08 0.06 0.14 0.01 7 0.13 0.01 9
Female -0.01 -0.01 0.06 0.00 0 0.08 0.00 -1
Never Married 0.07 0.00 -0.01 0.00 0 -0.02 0.00 0
Widow 0.01 -0.06 0.01 0.00 0 0.00 0.00 0
Scheduled Tribe -0.26 -0.14 -0.04 0.01 6 -0.01 0.00 2
Scheduled Caste -0.12 -0.26 0.03 0.00 -3 0.01 0.00 -2
Other Backward Caste -0.01 -0.14 0.02 0.00 0 0.01 0.00 -1
Muslims -0.05 -0.25 0.02 0.00 -1 0.02 0.00 -5
Christians 0.28 0.24 0.00 0.00 0 0.00 0.00 0
Other Religion 0.31 0.06 0.00 0.00 0 0.00 0.00 0
Illiterate -0.12 -0.32 0.09 -0.01 -7 0.03 -0.01 -11
Primary 0.09 -0.10 0.07 0.01 4 0.05 -0.01 -5
Poorest MPCE -0.70 -0.78 -0.14 0.10 66 -0.01 0.01 9
Poor MPCE -0.24 -0.78 -0.12 0.03 18 -0.02 0.01 13
Middle MPCE 0.25 -0.64 -0.09 -0.02 -14 -0.03 0.02 18
Rich MPCE 0.63 -0.21 -0.05 -0.03 -21 -0.05 0.01 10
Open Defecation -0.12 -0.40 -0.08 0.01 6 -0.01 0.00 5
No Drainage Facility -0.08 -0.35 0.06 0.00 -3 0.02 -0.01 -8
Total Observed 0.10 67 0.06 60
Residual 0.05 33 0.04 40
Total 0.15 100 0.095 100 Source: Authors’ Calculation from NSS, Using 60th (2004) Round Data.

14
Table 5 [b]: Contributions of Inequalities in Determinants to Inequalities in Self-reported
Morbidity, India 2014.
Self-Reported Morbidity 2014
Variables CI Rural Urban
Rural Urban Elast. Cont. % Cont. Elast. Cont. %
Cont. Age 30-44 -0.03 -0.01 0.13 0.00 -3 -0.05 0.00 -1
Age 45-59 0.06 0.07 0.25 0.01 9 -0.57 0.02 15
Age 60-69 0.06 0.06 0.18 0.01 7 -0.31 0.01 9
Age 70 years and above 0.07 0.08 0.13 0.01 6 -0.26 0.01 8
Female 0.00 -0.01 0.10 0.00 0 0.00 0.00 -1
Never Married 0.01 0.00 0.00 0.00 0 0.00 0.00 0
Widow 0.04 -0.01 0.00 0.00 0 0.00 0.00 0
Scheduled Tribe -0.22 -0.21 -0.04 0.01 6 -0.23 0.00 2
Scheduled Caste -0.10 -0.21 0.02 0.00 -1 -0.01 0.00 -2
Other Backward Caste 0.01 -0.08 0.00 0.00 0 0.00 0.00 -3
Muslims -0.06 -0.24 0.02 0.00 -1 -0.01 0.00 -3
Christians 0.12 0.20 0.00 0.00 0 0.00 0.00 0
Other Religion 0.31 0.22 0.01 0.00 2 -0.02 0.00 0
Illiterate -0.10 -0.29 0.06 -0.01 -4 -0.10 -0.01 -12
Primary -0.01 -0.14 0.05 0.00 0 0.00 -0.01 -9
Poorest MPCE -0.75 -0.93 -0.18 0.13 86 -53.43 0.03 30
Poor MPCE -0.24 -0.73 -0.16 0.04 25 -4.60 0.04 31
Middle MPCE 0.24 -0.47 -0.11 -0.03 -17 -2.14 0.03 22
Rich MPCE 0.63 -0.10 -0.07 -0.04 -27 -5.40 0.01 4
Open Defecation -0.17 -0.49 0.01 0.00 -1 -0.02 0.00 -1
No Drainage Facility -0.10 -0.34 0.08 -0.01 -5 -0.18 -0.01 -7
Total Observed 0.12 80 0.10 84
Residual 0.03 20 0.02 16
Total 0.15 100 0.12 100 Source: Authors’ Calculation from NSS, Using 71st (2014) Round Data.

15
Table 6 [a]: Contributions of Inequalities in Determinants to Inequalities in Self-reported
Morbidity, Karnataka 2004.
Karnataka Self-Reported Morbidity 2004
Variables CI Rural Urban
Rural Urban Elast. Cont. % Cont. Elast. Cont. %
Cont. Age 30-44 -0.02 0.00 0.14 0.00 -3 0.02 0.00 0
Age 45-59 0.02 0.08 0.33 0.01 7 0.07 0.01 10
Age 60-69 0.03 0.01 0.32 0.01 8 0.07 0.00 2
Age 70 years and above 0.12 0.08 0.20 0.02 21 0.06 0.00 8
Female -0.01 -0.01 -0.06 0.00 1 0.01 0.00 0
Never Married 0.10 0.00 0.04 0.00 4 -0.02 0.00 0
Widow 0.02 -0.14 0.01 0.00 0 -0.01 0.00 2
Scheduled Tribe -0.17 -0.41 0.00 0.00 1 0.00 0.00 -3
Scheduled Caste -0.14 -0.29 0.04 -0.01 -5 0.00 0.00 2
Other Backward Caste 0.00 -0.11 0.03 0.00 0 0.02 0.00 -4
Muslims -0.02 -0.25 0.03 0.00 -1 0.02 0.00 -9
Christians 0.46 0.28 0.01 0.01 6 0.00 0.00 1
Other Religion -0.18 -0.07 0.00 0.00 0 0.00 0.00 0
Illiterate -0.13 -0.32 0.11 -0.01 -14 0.00 0.00 2
Primary 0.10 -0.03 0.06 0.01 6 -0.02 0.00 1
Poorest MPCE -0.72 -0.77 -0.13 0.09 86 0.00 0.00 -1
Poor MPCE -0.20 -0.77 -0.05 0.01 10 -0.01 0.00 8
Middle MPCE 0.28 -0.64 -0.04 -0.01 -9 -0.02 0.01 19
Rich MPCE 0.69 -0.16 -0.05 -0.03 -31 -0.01 0.00 2
Open Defecation -0.10 -0.49 -0.22 0.02 20 0.01 0.00 -5
No Drainage Facility -0.05 -0.39 0.17 -0.01 -7 -0.01 0.00 5
Total Observed 0.11 100 0.021 39
Residual -0.04 0.03 61
Total 0.069 100 0.055 100 Source: Authors’ Calculation from NSS, Using 60th (2004) Round Data.

16
Table 6 [b]: Contributions of Inequalities in Determinants to Inequalities in Self-reported
Morbidity, Karnataka 2014
Karnataka Self-Reported Morbidity 2014
Variables CI Rural Urban
Rural Urban Elast. Cont. % Cont. Elast. Cont. %
Cont. Age 30-44 -0.05 0.01 0.10 -0.01 4 0.23 0.00 1
Age 45-59 0.04 0.04 0.23 0.01 -6 0.33 0.01 15
Age 60-69 0.00 0.00 0.21 0.00 0 0.30 0.00 0
Age 70 years and above 0.06 -0.03 0.17 0.01 -6 0.14 0.00 -5
Female -0.02 -0.03 0.14 0.00 2 0.09 0.00 -3
Never Married 0.05 0.03 -0.10 -0.01 3 -0.11 0.00 -3
Widow 0.08 -0.08 0.01 0.00 0 0.02 0.00 -2
Scheduled Tribe -0.30 -0.36 0.00 0.00 1 0.00 0.00 1
Scheduled Caste -0.10 -0.30 0.04 0.00 3 0.01 0.00 -4
Other Backward Caste 0.00 -0.02 0.11 0.00 0 -0.01 0.00 0
Muslims 0.03 -0.25 0.01 0.00 0 0.03 -0.01 -8
Christians 0.03 0.08 0.01 0.00 0 0.00 0.00 0
Other Religion 0.65 -0.04 0.00 0.00 -1 0.00 0.00 0
Illiterate -0.06 -0.33 0.06 0.00 2 0.03 -0.01 -11
Primary 0.01 -0.15 0.02 0.00 0 0.09 -0.01 -14
Poorest MPCE -0.80 -0.94 -0.10 0.08 -53 -0.04 0.03 35
Poor MPCE -0.31 -0.78 -0.28 0.08 -56 -0.06 0.05 52
Middle MPCE 0.29 -0.49 -0.16 -0.05 31 -0.09 0.04 45
Rich MPCE 0.78 -0.06 -0.09 -0.07 45 -0.09 0.01 6
Open Defecation -0.09 -0.60 -0.09 -0.09 60 0.02 -0.01 -12
No Drainage Facility -0.12 -0.43 0.01 -0.11 72 -0.02 0.01 7
Total Observed -0.15 100 0.10 100
Residual 0.19 -0.03
Total 0.04 100 0.064 100 Source: Authors’ Calculation from NSS, Using 71st (2014) Round Data.
Discussion Given due consideration to the existing literature, we have largely examined the trends, patterns in self-
reported morbidity at aggregate and sub-national levels (Ghosh & Arokiasamy, 2010; Mutharayappa,
2008; Paul & Singh, 2017; G. Sen, 2003). Further, studies that have examined differentials in self-
reported morbidity have either concentrated only on gender differentials in health, ignoring health
(Dhak & R, 2009) or have only focused on SES inequalities in self-reported health without considering
the gender aspect (Jain et al., 2012; Prinja et al., 2015).There, however, have been some exceptions in
which gender, SES and health have been examined mostly using self-assessed health or disease specific
health vignettes (Hosseinpoor et al., 2012; S Vellakkal et al., 2015). Our investigation is a further
attempt to readdress the issue, especially in respect of whether gender and spatial differences exist in

17
the magnitude of SES inequalities in self-reported morbidity among populations aged 15 years and
above and further, whether after taking into account gender and spatial differences, the explanations
for SES inequalities in self-reported morbidity vary over time. Thus, we have extended the previous
analysis of inequalities in self-reported morbidity by considering gender and place of residence
variables.
Our findings show that self-reported morbidities have been on the rise over the last decade
(2004-2014) in India and also for the state of Karnataka. The Global Burden of Disease Study shows
that the total disease burden measured as the disability-adjusted life years lost in India has increased
for the older population from 67 million in 1990 to 110 million in 2013 (Global Burden of Disease Study
2013, 2014). Thus, the rise in morbidity prevalence in the last decade may be partly attributed to the
increasing disease burden of the country with an ageing population and higher levels of morbidity
prevalence at older ages. Further, it is evident that in Karnataka, the morbidity prevalence is slightly
higher in rural areas than in urban areas, while the reverse pattern was observed at the all-India level in
2004. On the other hand, in 2014, as compared to rural areas, morbidity prevalence was slightly higher
in urban areas for Karnataka and also for India. Further, findings suggest economic status is a strong
independent determinant of self-reported morbidity in Karnataka and India. Inequality in self-reported
morbidity favoured the rich. However, there is a difference in the degree to which inequalities in self-
reported morbidity occurred over two time periods in Karnataka and India. Four prominent findings
related to inequality emerge from this study. First, both at state and national level, the overall inequality
reported morbidity has increased between 2004 and 2014 and continued to favour the rich. However,
during the same period, such inequalities remained constant in rural India, while increasing levels of
inequality were observed in urban India. On the other hand, declining of such inequalities was observed
for rural Karnataka. Second, both at the state and national level, irrespective of the age groups, females
had a higher morbidity burden. Further, for both the time periods, statistically significant inequalities in
reported morbidity were observed within both males and females. However, no such inequalities were
observed for males in 2004 and for females in 2014 at the state level for Karnataka.
Third, for both the time periods, the socioeconomic inequalities in self-reported morbidity are
low for both the genders and between rural and urban areas in Karnataka compared to the all-India
level. This may be due to the fact that Karnataka has higher levels of health care utilisation as
compared to all-India levels, and thus more people tend to report morbidity across the socioeconomic
strata (Rudra, Kalra, Kumar, & Joe, 2017). Fourth, the decomposition findings suggest that income, age
and access to sanitation facilities were the major contributors to inequality in self-reported morbidity.
Socioeconomic inequality in self-reported morbidity with a wealthier population having higher
levels of reporting illness is not a persistent phenomenon in low and middle income countries. A
previous study in Thailand found that lower income groups had both higher levels of reporting illness on
self-reported morbidity measure and poorer health on self-assessed health (Yiengprugsawan, Lim,
Carmichael, Seubsman, & Sleigh, 2009).However, pro-rich inequality in self-reported morbidity is
consistent with evidence from other studies in India and Ghana (J, 1993; Jain et al., 2012; S Vellakkal
et al., 2015; Sukumar Vellakkal et al., 2013).The latter unexpected results are in general to be
attributed to perception bias (A. Sen, 2002).That is a tendency among the deprived to underestimate
18
their health problems which may be due to prevailing differentials in access to health services, customs
and traditions etc. Another explanation for results is attributed to differential rates of epidemiological
transition between socioeconomic strata leading to higher levels of morbidity reported among the rich
(Bhojani et al., 2013; Prinja et al., 2015).
Although this study provides a snapshot of the emerging patterns of inequalities in self-
reported morbidity, covering a span for the last decade from a national representative population-based
sample, the findings need to be taken in the light of a few limitations. In general, self-reported
morbidity suffers from both under-reporting and over-reporting among the population sub groups
(Sundararaman & Muraleedharan, 2015). Thus, the absence of any objective measure of health in the
NSS surveys makes it difficult to detach the real increase in disease burden and enhanced subjective
perception of illness from increasing levels of morbidity prevalence. The overall sample size from the
60th round of NSS (2004) to the most recent round (2014) has considerably declined, and as a result it
is likely that the prevalence estimates across various rounds of NSS is affected. Further, there is a slight
variation in the definition adopted in both the rounds. That is, in 2014, persons suffering from chronic
illness were also considered to be ailing in the last fifteen days if they were under treatment for one
month or more. However, such inclusions were not there in the earlier round which may underestimate
the true morbidity prevalence for the year 2004. Moreover, factors life-style, occupational status etc.
which may have a significant bearing on morbidity have not been examined in this study (Prentice,
2006).
Conclusion In conclusion, this study provides evidence of a higher burden of self-reported morbidity and greater
inequalities in self-reported morbidity in India and Karnataka. Further, studies for the understanding of
the socio-economic determinants of each disease are required instead of considering all morbidities in
one basket. Policy initiatives aiming to reduce these inequalities in health must focus on reorienting
programmes by including diseases associated with poverty and are impoverishing through increasing
public investment in health, providing preventive care facilities for early prevention of diseases and
improving the provision of curative services both in rural and urban areas as needed by the community
in Karnataka and India.
References Acheson, D (2011). Independent Inquiry Into Inequalities in Health (the Acheson Report). Health (San
Francisco), 1–8.
Bhojani, U, T S Beerenahalli, R Devadasan, C M Munegowda, N Devadasan, B Criel and P Kolsteren
(2013). No Longer Diseases of the Wealthy: Prevalence and Health-seeking for Self-reported
Chronic Conditions among Urban Poor in Southern India. BMC Health Services Research, 13
(1): 306. https://doi.org/10.1186/1472-6963-13-306
Bora, J K and N Saikia (2015). Gender Differentials in Self-rated Health and Self-reported Disability
among Adults in India. PLoS ONE, 10 (1). https://doi.org/10.1371/journal.pone.0141953
Brinda, E M, J Attermann, U G Gerdtham and U Enemark (2016). Socio-economic Inequalities in Health

19
and Health Service Use among Older Adults in India: Results from the WHO Study on Global
AGEing and Adult Health Survey. Public Health, 141: 32-41.
https://doi.org/10.1016/j.puhe.2016.08.005
Dalstra, J A A, A E Kunst, C Borell, E Breeze, E Cambois, G Costa, … J P Mackenbach (2005). Socio-
economic Differences in the Prevalence of Common Chronic Diseases: An Overview of Eight
European Countries. International Journal of Epidemiology. https://doi.org/10.1093/ije/dyh386.
Dhak, B and R M (2009). GEnder Differential in Disease Burden: Its Role to Explain Gender Differential
in Mortality. Retrieved from http://www.isec.ac.in/WP 221 - Biplab and Mutharayappa.pdf.
Ghosh, S and P Arokiasamy (2010). Emerging Patterns of Reported Morbidity and Hospitalisation in
West Bengal, India. Global Public Health, 5 (4): 427–440.
https://doi.org/10.1080/17441692.2010.480845
Global Burden of Disease Study 2013 (2014). Global Burden of Disease Study 2013 (GBD 2013) Age-Sex
Specific All-Cause and Cause-Specific Mortality 1990-2013 | GHDx. Institute for Health Metrics
and Evaluation (IHME). Retrieved from http://ghdx.healthdata.org/record/global-burden-
disease-study-2013-gbd-2013-age-sex-specific-all-cause-and-cause-specific
GoK (2001). Task Force on Health and Family Welfare, Karnataka:Towards Equity, Quality and Integrity
in Health. Focus on Primary Healthcare and Public Health. Bangalore.
Goli, S, L Singh, K Jain and L M A Pou (2014). Socio-economic Determinants of Health Inequalities
Among the Older Population in India: A Decomposition Analysis. Journal of Cross-Cultural
Gerontology, 29 (4): 353-69. https://doi.org/10.1007/s10823-014-9251-8
Heidi Ullmann, S, A M Buttenheim, N Goldman, A R Pebley and R Wong (2011). Socio-economic
Differences in Obesity among Mexican Adolescents. International Journal of Pediatric Obesity:
IJPO: An Official Journal of the International Association for the Study of Obesity, 6 (2-2),
e373-80. https://doi.org/10.3109/17477166.2010.498520.
Hosseinpoor, A R, N Bergen, A Kunst, S Harper, R Guthold, D Rekve, … S Chatterji (2012). Socio-
economic Inequalities in Risk Factors for Non Communicable Diseases in Low-income and
Middle-income Countries: Results from the World Health Survey. BMC Public Health, 12 (1):
912. https://doi.org/10.1186/1471-2458-12-912
J, B J and van der G (1993). Equity in Health Care and Health Care Financing: Evidence from Five
Developing Countries. In R F an Doorslaer E, Wagstaff A (eds), Equity in the Finance and
Delivery of Health Care:An International Perspective. New York: Oxford University Press.
Jain, K, S Goli and P Arokiasamy (2012). Are Self Reported Morbidities Deceptive in Measuring Socio-
economic Inequalities. Indian Journal of Medical Research, 136 (5): 750-57.
Kunst, A E, V Bos, E Lahelma, M Bartley, I Lissau, E Regidor, … J P Mackenbach (2005). Trends in
Socio-economic Inequalities in Self-assessed Health in 10 European Countries. International
Journal of Epidemiology, 34 (2): 295-305. https://doi.org/10.1093/ije/dyh342
Kunst, A E, J J M Geurts and J Van Den Berg (1995). International Variation in Socio-economic
Inequalities in Self Reported Health. Journal of Epidemiology and Community Health, 49: 117-
23. https://doi.org/10.1136/jech.49.2.117
MacIntyre, S and K Hunt (1997). Socio-economic Position, Gender and Health. How do they Interact?

20
Journal of Health Psychology. https://doi.org/10.1177/135910539700200304
Matthews, S, O Manor and C Power (1999). Social Inequalities in Health: Are there Gender Differences?
Social Science & Medicine, 48 (1): 49-60. https://doi.org/10.1016/S0277-9536(98)00288-3
Murray, C J L and J Frenk (2000). A Framework for Assessing the Performance of Health Systems.
Bulletin of the World Health Organization, 78 (6): 717-31. https://doi.org/10.1590/S0042-
96862000000600004
Mutharayappa, R (2008). A Study on Morbidity Pattern and Cost of Illness in Karnataka.
NSS (2004). Morbidity, Health Care and the Condition of the Aged.
————— (2014). Key Indicators of Social Consumption in India: Health.
O’Donnell, O and Doorslaer, E Van (2008). Analyzing Health Equity Using Household Survey Data.
Washington. … Health Equity Using …. https://doi.org/10.2471/BLT.08.052357
Patra, S and M D Bhise (2016). Gender Differentials in Prevalence of Self-reported Non-communicable
Diseases (NCDs) in India: Evidence from Recent NSSO Survey. Journal of Public Health
(Germany), 24 (5): 375-85. https://doi.org/10.1007/s10389-016-0732-9
Paul, K and J Singh (2017). Emerging Trends and Patterns of Self-reported Morbidity in India: Evidence
from Three Rounds of National Sample Survey. Journal of Health, Population and Nutrition, 36
(1): 32. https://doi.org/10.1186/s41043-017-0109-x
Prentice, A M (2006). The Emerging Epidemic of Obesity in Developing Countries. International Journal
of Epidemiology. https://doi.org/10.1093/ije/dyi272
Prinja, S, K Jeyashree, S Rana, A Sharma and R Kumar (2015). Wealth Related Inequalities in Self
Reported Morbidity: Positional Objectivity or Epidemiological Transition? Indian Journal of
Medical Research, 141 (April): 438-45. https://doi.org/10.4103/0971-5916.159290
Rahman, Mohammad Hifzur and A S (2011). Socio-economic Inequalities in the Risk of Diseases and
Associated Risk Factors in India. Journal of Public Health and Epidemiology, 3 (11): 520-28.
Retrieved from http://www.academicjournals.org/article/article1379499911_Rahman and
Singh.pdf
Rudra, S, A Kalra, A Kumar and W Joe (2017). Utilization of Alternative Systems of Medicine as Health
Care Services in India: Evidence on AYUSH care from NSS 2014. PLoS ONE, 12 (5).
https://doi.org/10.1371/journal.pone.0176916
Sen, A (2002). Health: Perception versus Observation. British Medical Journal, 324 (August 2006): 860-
61. https://doi.org/10.1136/bmj.324.7342.860
Sen, G (2003). Inequalities and Health in India. Development, 46 (2): 18-20. Retrieved from
http://sf5mc5tj5v.search.serialssolutions.com/?ctx_ver=Z39.88-2004&ctx_enc=info:ofi/
enc:UTF-8&rfr_id=info:sid/ProQ:abiglobal&rft_val_fmt=info:ofi/fmt:kev:mtx:journal&rft.genre
=article&rft.jtitle=Development&rft.atitle=Inequalities+and+Health+in+India&rft.
StataCorp (2013). Stata Statistical Software: Release 13. 2013. https://doi.org/10.2307/2234838
Sundararaman, T and V R Muraleedharan (2015). Falling Sick, Paying the Price: NSS 71st Round on
Morbidity and Costs of Healthcare. Economic & Political Weekly, 50 (33): 17–20.
Suryanarayana, M H (2008). Morbidity Profiles of Kerala and All-India: An Economic Perspective
Morbidity Profiles of Kerala and All-India: World Development, (March).

21
Vasquez, F, G Paraje and M Estay (2013). Income-related Inequality in Health and Health Care
Utilization in Chile, 2. Revista Panamericana de Salud Publica, 33 (1680–5348 (Electronic)): 98-
106. https://doi.org/10.1590/S1020-49892013000200004
Vellakkal, S, C Millett, S Basu, Z Khan, A Aitsi-Selmi, D Stuckler and S Ebrahim (2015). Are Estimates of
Socio-economic Inequalities in Chronic Disease Artefactually Narrowed by Self-reported
Measures of Prevalence in Low-income and Middle-income Countries? Findings from the WHO-
SAGE Survey. J Epidemiol Community Health, 69 (3): 218-25. https://doi.org/10.1136/jech-
2014-204621
Vellakkal, S, S V Subramanian, C Millett, C., Basu, D Stuckler and S Ebrahim (2013). Socio-economic
Inequalities in Non-Communicable Diseases Prevalence in India: Disparities between Self-
Reported Diagnoses and Standardized Measures. PLoS ONE, 8 (7).
https://doi.org/10.1371/journal.pone.0068219
Wagstaff, A (2005). The Bounds of the Concentration Index When the Variable of Interest is Binary,
with an Application to Immunization Inequality. Health Economics, 14 (4): 429-32.
https://doi.org/10.1002/hec.953
Wagstaff, A, P Paci and E van Doorslaer (1991). On the Measurement of Inequalities in Health. Social
Science and Medicine, 33 (5): 545-57. https://doi.org/10.1016/0277-9536(91)90212-U
Wagstaff, A, E Van Doorslaer and N Watanabe (2003). On Decomposing the Causes of Health Sector
Inequalities with An Application to Malnutrition Inequalities in Vietnam. Journal of
Econometrics, 112 (1): 207-23. https://doi.org/10.1016/S0304-4076(02)00161-6
WHO (2000). The World Health Report 2000 - Health Systems: Improving Performance. Bulletin of the
World Health Organization, Vol. 78.
Xu, H and Y Xie (2017). Socio-economic Inequalities in Health in China: A Reassessment with Data from
the 2010-2012 China Family Panel Studies. Social Indicators Research, 132 (1): 219-39.
https://doi.org/10.1007/s11205-016-1244-2
Yiengprugsawan, V, L Lim, G Carmichael, A Sidorenko and A Sleigh (2007). Measuring and
Decomposing Inequity in Self-reported Morbidity and Self-assessed Health in Thailand.
International Journal for Equity in Health, 6 (1): 23. https://doi.org/10.1186/1475-9276-6-23
Yiengprugsawan, V, L L Y Lim, G A Carmichael, S A Seubsman and A C Sleigh (2009). Tracking and
Decomposing Health and Disease Inequality in Thailand. Annals of Epidemiology, 19 (11): 800-
07. https://doi.org/10.1016/j.annepidem.2009.04.009.

22
Appendix Table A1: Bivariate Association between Socioeconomic Status and Self-Reported Morbidity
Prevalence (per 100) States, India 2004-2014.
Covariates India -2004 India -2014
Rural Urban Rural Urban
Age
15-29 5 5 5 5
30-44 8 8 8 10
45-59 12 15 14 21
60-69 26 34 26 36
70+ 35 44 31 37
Sex
Male 9 9 8 11
Female 11 12 11 15
Marital Status
Never Married 5 5 5 6
Currently Married 10 11 10 14
Widow 23 29 22 33
Caste
Scheduled Tribe 6 5 7 6
Scheduled Caste 10 10 10 12
Other Backward Caste 10 10 10 14
Forward Caste 11 12 12 13
Religion
Hindus 9 11 10 13
Muslims 12 10 10 11
Christians 17 14 17 20
Other Religion 13 11 15 12
Education
Illiterate 11 14 13 18
Primary 9 10 9 15
Secondary and Above 7 9 7 10
Income
Poorest 7 8 7 7
Poor 8 10 9 10
Middle 10 9 9 11
Rich 12 10 12 13
Richest 17 12 17 15
Sanitation Open Defecation 9 9 8 12
Drainage Facility No Drainage 10 11 10 13 Source: Authors’ Calculation from NSS, Using 71st (2014) and 60th (2004) Round Data.

23
Table A2: Bivariate Association between Socio-economic Status and Self-Reported
Morbidity Prevalence (per 100) States, Karnataka 2004-2014.
Covariates Karnataka -2004 Karnataka -2014
Rural Urban Rural Urban
Age
15-29 2 2 4 4
30-44 4 4 6 7
45-59 10 8 13 15
60-69 25 23 28 32
70+ 44 54 32 42
Sex Male 7 6 8 8
Female 7 7 11 14
Marital Status
Never Married 3 2 3 4
Currently Married 7 7 10 12
Widow 20 18 25 27
Caste
Scheduled Tribe 6 6 6 6
Scheduled Caste 7 5 12 9
Other Backward Caste 8 6 11 10
Forward Caste 7 7 9 13
Religion
Hindus 7 6 10 11
Muslims 7 7 12 10
Christians 20 7 25 14
Other Religion 7 22 0 27
Education
Illiterate 9 10 14 17
Primary 6 4 9 12
Secondary and Above 4 6 4 8
Income
Poorest 5 9 9 9
Poor 8 6 10 10
Middle 8 5 11 8
Rich 7 7 8 11
Richest 10 7 15 12
Sanitation Open Defecation 7 5 8 9
Drainage Facility No Drainage 7 7 9 5 Source: Authors’ Calculation from NSS, Using 71st (2014) and 60th (2004) Round Data.
Table A3: Concentration Indices for Self-reported Morbidity, Gender, 2004-2014
Year 2004 2014
States CI for Male (se) CI for Female (se) CI for Male (se) CI for Female (se)
Karnataka 0.002 (0.028) 0.079** (0.027) 0.113*** (0.026) 0.032 (0.021)
All India 0.107*** (0.005) 0.146*** (0.004) 0.174*** (0.005) 0.156*** (0.004) Source: Authors’ Calculation from NSS, Using 71st (2014) and 60th (2004) Round Data. \
Note: Standard error of the CI in parenthesis; Denotes significance at ***1% level, **5% level.

351 Food Security in Karnataka: Paradoxes ofPerformanceStacey May Comber, Marc-Andre Gauthier,Malini L Tantri, Zahabia Jivaji and Miral Kalyani
352 Land and Water Use Interactions:Emerging Trends and Impact on Land-useChanges in the Tungabhadra and TagusRiver BasinsPer Stalnacke, Begueria Santiago, Manasi S, K VRaju, Nagothu Udaya Sekhar, Maria ManuelaPortela, António Betaâmio de Almeida, MartaMachado, Lana-Renault, Noemí, Vicente-Serranoand Sergio
353 Ecotaxes: A Comparative Study of Indiaand ChinaRajat Verma
354 Own House and Dalit: Selected Villages inKarnataka StateI Maruthi and Pesala Busenna
355 Alternative Medicine Approaches asHealthcare Intervention: A Case Study ofAYUSH Programme in Peri Urban LocalesManasi S, K V Raju, B R Hemalatha,S Poornima, K P Rashmi
356 Analysis of Export Competitiveness ofIndian Agricultural Products with ASEANCountriesSubhash Jagdambe
357 Geographical Access and Quality ofPrimary Schools - A Case Study of South24 Parganas District of West BengalJhuma Halder
358 The Changing Rates of Return to Educationin India: Evidence from NSS DataSmrutirekha Singhari and S Madheswaran
359 Climate Change and Sea-Level Rise: AReview of Studies on Low-Lying and IslandCountriesNidhi Rawat, M S Umesh Babu andSunil Nautiyal
360 Educational Outcome: Identifying SocialFactors in South 24 Parganas District ofWest BengalJhuma Halder
361 Social Exclusion and Caste Discriminationin Public and Private Sectors in India: ADecomposition AnalysisSmrutirekha Singhari and S Madheswaran
362 Value of Statistical Life: A Meta-Analysiswith Mixed Effects Regression ModelAgamoni Majumder and S Madheswaran
363 Informal Employment in India: An Analysisof Forms and DeterminantsRosa Abraham
364 Ecological History of An Ecosystem UnderPressure: A Case of Bhitarkanika in OdishaSubhashree Banerjee
365 Work-Life Balance among WorkingWomen – A Cross-cultural ReviewGayatri Pradhan
366 Sensitivity of India’s Agri-Food Exportsto the European Union: An InstitutionalPerspectiveC Nalin Kumar
Recent Working Papers367 Relationship Between Fiscal Deficit
Composition and Economic Growth inIndia: A Time Series EconometricAnalysisAnantha Ramu M R and K Gayithri
368 Conceptualising Work-life BalanceGayatri Pradhan
369 Land Use under Homestead in Kerala:The Status of Homestead Cultivationfrom a Village StudySr. Sheeba Andrews and Elumalai Kannan
370 A Sociological Review of Marital Qualityamong Working Couples in BangaloreCityShiju Joseph and Anand Inbanathan
371 Migration from North-Eastern Region toBangalore: Level and Trend AnalysisMarchang Reimeingam
372 Analysis of Revealed ComparativeAdvantage in Export of India’s AgriculturalProductsSubhash Jagdambe
373 Marital Disharmony among WorkingCouples in Urban India – A SociologicalInquityShiju Joseph and Anand Inbanathan
374 MGNREGA Job Sustainability and Povertyin SikkimMarchang Reimeingam
375 Quantifying the Effect of Non-TariffMeasures and Food Safety Standards onIndia’s Fish and Fishery Products’ ExportsVeena Renjini K K
376 PPP Infrastructure Finance: An EmpiricalEvidence from IndiaNagesha G and K Gayithri
377 Contributory Pension Schemes for thePoor: Issues and Ways ForwardD Rajasekhar, Santosh Kesavan and R Manjula
378 Federalism and the Formation of States inIndiaSusant Kumar Naik and V Anil Kumar
379 Ill-Health Experience of Women: A GenderPerspectiveAnnapuranam Karuppannan
380 The Political Historiography of ModernGujaratTannen Neil Lincoln
381 Growth Effects of Economic Globalization:A Cross-Country AnalysisSovna Mohanty
382 Trade Potential of the Fishery Sector:Evidence from IndiaVeena Renjini K K
383 Toilet Access among the Urban Poor –Challenges and Concerns in BengaluruCity SlumsS Manasi and N Latha
384 Usage of Land and Labour under ShiftingCultivation in ManipurMarchang Reimeingam

385 State Intervention: A Gift or Threat toIndia’s Sugarcane Sector?Abnave Vikas B and M Devendra Babu
386 Structural Change and Labour ProductivityGrowth in India: Role of Informal WorkersRosa Abraham
387 Electricity Consumption and EconomicGrowth in KarnatakaLaxmi Rajkumari and K Gayithri
388 Augmenting Small Farmers’ Incomethrough Rural Non-farm Sector: Role ofInformation and InstitutionsMeenakshi Rajeev and Manojit Bhattacharjee
389 Livelihoods, Conservation and ForestRights Act in a National Park: AnOxymoron?Subhashree Banerjee and Syed Ajmal Pasha
390 Womanhood Beyond Motherhood:Exploring Experiences of VoluntaryChildless WomenChandni Bhambhani and Anand Inbanathan
391 Economic Globalization and IncomeInequality: Cross-country EmpiricalEvidenceSovna Mohanty
392 Cultural Dimension of Women’s Healthacross Social Groups in ChennaiAnnapuranam K and Anand Inbanathan
393 Earnings and Investment Differentialsbetween Migrants and Natives: A Study ofStreet Vendors in Bengaluru CityChannamma Kambara and Indrajit Bairagya
394 ‘Caste’ Among Muslims: EthnographicAccount from a Karnataka VillageSobin George and Shrinidhi Adiga
395 Is Decentralisation Promoting orHindering the Effective Implementation ofMGNREGS? The Evidence from KarnatakaD Rajasekhar, Salim Lakha and R Manjula
396 Efficiency of Indian Fertilizer Firms: AStochastic Frontier ApproachSoumita Khan
397 Politics in the State of Telangana: Identity,Representation and DemocracyAnil Kumar Vaddiraju
398 India’s Plantation Labour Act - A CritiqueMalini L Tantri
399 Federalism and the Formation of States inIndia: Some Evidence from Hyderabad-Karnataka Region and Telangana StateSusant Kumar Naik
400 Locating Armed Forces (Special Powers)Act, 1958 in the Federal Structure: AnAnalysis of Its Application in Manipur andTripuraRajiv Tewari
401 Performance of Power Sector in Karnatakain the Context of Power Sector ReformsLaxmi Rajkumari and K Gayithri
402 Are Elections to Grama Panchayats Party-less? The Evidence from KarnatakaD Rajasekhar, M Devendra Babu and R Manjula
403 Hannah Arendt and Modernity: Revisitingthe Work The Human ConditionAnil Kumar Vaddiraju
404 From E-Governance to Digitisation: SomeReflections and ConcernsAnil Kumar Vaddiraju and S Manasi
405 Understanding the Disparity in FinancialInclusion across Indian States: AComprehensive Index for the Period 1984– 2016Shika Saravanabhavan
406 Gender Relations in the Context ofWomen’s Health in ChennaiAnnapuranam K and Anand Inbanathan
407 Value of Statistical Life in India: AHedonic Wage ApproachAgamoni Majumder and S Madheswaran
408 World Bank’s Reformed Model ofDevelopment in KarnatakaAmitabha Sarkar
409 Environmental Fiscal Instruments: A FewInternational ExperiencesRajat Verma and K Gayithri
410 An Evaluation of Input-specific TechnicalEfficiency of Indian Fertilizer FirmsSoumita Khan
411 Mapping Institutions for AssessingGroundwater Scenario in West Bengal,IndiaMadhavi Marwah
412 Participation of Rural Households inFarm, Non-Farm and Pluri-Activity:Evidence from IndiaS Subramanian
Price: ` 30.00 ISBN 978-81-7791-269-2
INSTITUTE FOR SOCIAL AND ECONOMIC CHANGEDr V K R V Rao Road, Nagarabhavi P.O., Bangalore - 560 072, India
Phone: 0091-80-23215468, 23215519, 23215592; Fax: 0091-80-23217008E-mail: [email protected]; Web: www.isec.ac.in