
Industry Survey on the Current State of Stope Design Methods ...
20
Citation: Janiszewski, M.; Pontow, S.; Rinne, M. Industry Survey on the Current State of Stope Design Methods in the Underground Mining Sector. Energies 2022, 15, 240. https://doi.org/10.3390/en15010240 Academic Editors: Maxim Tyulenev, Aleksandr Rakhmangulov and Nikita Osintsev Received: 24 November 2021 Accepted: 25 December 2021 Published: 30 December 2021 Publisher’s Note: MDPI stays neutral with regard to jurisdictional claims in published maps and institutional affil- iations. Copyright: © 2021 by the authors. Licensee MDPI, Basel, Switzerland. This article is an open access article distributed under the terms and conditions of the Creative Commons Attribution (CC BY) license (https:// creativecommons.org/licenses/by/ 4.0/). energies Article Industry Survey on the Current State of Stope Design Methods in the Underground Mining Sector Mateusz Janiszewski * , Sebastian Pontow and Mikael Rinne Department of Civil Engineering, School of Engineering, Aalto University, 00076 Espoo, Finland; [email protected] (S.P.); mikael.rinne@aalto.fi (M.R.) * Correspondence: mateusz.janiszewski@aalto.fi Abstract: Stope design is a core discipline within mining engineering. This study analyzes the current state-of-the-art of stope design through a survey addressed to mining industry professionals. In stope design research the dominance of empirical methods has slowly shifted towards numerical methods. Recent advancements have mostly focused on the development of stope optimization algorithms. The survey consisted of 19 questions and was distributed to stope design experts via email, LinkedIn messages, and the Mining Industry Professionals network forum. In total, 36 responses of satisfying quality from 20 countries were received and analyzed. No dominance of a single stope design method was recognized. Empirical methods and personal expertise are still used widely. However, a readiness for change in stope design practice was indicated in 87% of responses. The current needs of the stoping-based underground mining sector are to increase the amount of geotechnical data, automate stope design and implement related software, and integrate these into general mine planning. According to 70% of the participants, acquired geotechnical data should be available within three days to be employed in design practice. The industry is ready to implement more efficient stope design methods if they offer results proven in case studies. Keywords: stope design; geomechanics; mine design; underground mining; industry; survey 1. Introduction Underground mining operations are progressing into deeper and increasingly more complex deposits, associated with more challenging geological conditions, while the de- mand for minerals and metals continues to grow rapidly. Additionally, ore grades are decreasing, and thus, valuable metals will more likely occur as refractory or trace minerals in future mining operations [1]. With the goal of transforming the mining industry into a more sustainable one, the necessity to utilize mining methods with limited impact on the surface is becoming ever more urgent. To satisfy this need, the application of non-caving un- derground mining methods offers a convenient solution and presents a promising prospect for increasing the importance of these mining methods for the mining industry. Brady and Brown [2] divide mining methods into three main categories: pillar supported, artificially supported and unsupported. Each category is further divided into specific mining methods with varying degrees of rock mass response to mining. The pillar and artificially supported, so-called stoping-based, mining methods, with no or very limited subsidence, are the solutions of choice for the future challenges of the mining industry [3]. The lack of visible environmental damage from these mines allows for a more positive public perception of the mining industry. These stoping-based mining methods rely on diving the orebody into stopes for ore production and have already become amongst the most common methods in modern underground mining. This is due to their inherent operational safety, reliable de- sign, and cost efficiency [4]. Therefore, this study focuses on stoping-based mining methods. Additionally, increasingly challenging geological conditions can potentially result in more hazardous working environments. To prevent this, adequate consideration during mine Energies 2022, 15, 240. https://doi.org/10.3390/en15010240 https://www.mdpi.com/journal/energies
-
Upload
khangminh22 -
Category
Documents
-
view
1 -
download
0
Transcript of Industry Survey on the Current State of Stope Design Methods ...

�����������������
Citation: Janiszewski, M.; Pontow, S.;
Rinne, M. Industry Survey on the
Current State of Stope Design
Methods in the Underground Mining
Sector. Energies 2022, 15, 240.
https://doi.org/10.3390/en15010240
Academic Editors: Maxim Tyulenev,
Aleksandr Rakhmangulov and
Nikita Osintsev
Received: 24 November 2021
Accepted: 25 December 2021
Published: 30 December 2021
Publisher’s Note: MDPI stays neutral
with regard to jurisdictional claims in
published maps and institutional affil-
iations.
Copyright: © 2021 by the authors.
Licensee MDPI, Basel, Switzerland.
This article is an open access article
distributed under the terms and
conditions of the Creative Commons
Attribution (CC BY) license (https://
creativecommons.org/licenses/by/
4.0/).
energies
Article
Industry Survey on the Current State of Stope Design Methodsin the Underground Mining SectorMateusz Janiszewski * , Sebastian Pontow and Mikael Rinne
Department of Civil Engineering, School of Engineering, Aalto University, 00076 Espoo, Finland;[email protected] (S.P.); [email protected] (M.R.)* Correspondence: [email protected]
Abstract: Stope design is a core discipline within mining engineering. This study analyzes the currentstate-of-the-art of stope design through a survey addressed to mining industry professionals. In stopedesign research the dominance of empirical methods has slowly shifted towards numerical methods.Recent advancements have mostly focused on the development of stope optimization algorithms.The survey consisted of 19 questions and was distributed to stope design experts via email, LinkedInmessages, and the Mining Industry Professionals network forum. In total, 36 responses of satisfyingquality from 20 countries were received and analyzed. No dominance of a single stope designmethod was recognized. Empirical methods and personal expertise are still used widely. However,a readiness for change in stope design practice was indicated in 87% of responses. The currentneeds of the stoping-based underground mining sector are to increase the amount of geotechnicaldata, automate stope design and implement related software, and integrate these into general mineplanning. According to 70% of the participants, acquired geotechnical data should be available withinthree days to be employed in design practice. The industry is ready to implement more efficient stopedesign methods if they offer results proven in case studies.
Keywords: stope design; geomechanics; mine design; underground mining; industry; survey
1. Introduction
Underground mining operations are progressing into deeper and increasingly morecomplex deposits, associated with more challenging geological conditions, while the de-mand for minerals and metals continues to grow rapidly. Additionally, ore grades aredecreasing, and thus, valuable metals will more likely occur as refractory or trace mineralsin future mining operations [1]. With the goal of transforming the mining industry into amore sustainable one, the necessity to utilize mining methods with limited impact on thesurface is becoming ever more urgent. To satisfy this need, the application of non-caving un-derground mining methods offers a convenient solution and presents a promising prospectfor increasing the importance of these mining methods for the mining industry. Brady andBrown [2] divide mining methods into three main categories: pillar supported, artificiallysupported and unsupported. Each category is further divided into specific mining methodswith varying degrees of rock mass response to mining. The pillar and artificially supported,so-called stoping-based, mining methods, with no or very limited subsidence, are thesolutions of choice for the future challenges of the mining industry [3]. The lack of visibleenvironmental damage from these mines allows for a more positive public perception ofthe mining industry. These stoping-based mining methods rely on diving the orebody intostopes for ore production and have already become amongst the most common methods inmodern underground mining. This is due to their inherent operational safety, reliable de-sign, and cost efficiency [4]. Therefore, this study focuses on stoping-based mining methods.Additionally, increasingly challenging geological conditions can potentially result in morehazardous working environments. To prevent this, adequate consideration during mine
Energies 2022, 15, 240. https://doi.org/10.3390/en15010240 https://www.mdpi.com/journal/energies

Energies 2022, 15, 240 2 of 20
planning and design are deemed necessary [5]. Stoping-based mining methods are proneto dangers related to instability of the surrounding rock mass. This creates a considerabledanger to both people and equipment [6]. Thus, stoping-based mining methods are relianton adequate estimations of the stability of the rock mass in which they are applied, to allowtheir application. This condition results in considerable efforts being applied to enablereliable estimations, predictions and dimensioning of the stopes to be mined.
Empirical methods have been used in geomechanics since their development inthe 1970s. Most commonly they are used for preliminary design in the early stage ofmining [7–10]. The empirical methods include, but are not limited to: rock mass rating(RMR) system [11], Q-system [12], geological strength index (GSI) [13], mining rock massrating (MRMR) system [14], Laubscher block caving rules [15], hard rock pillar designchart [12,16], and the tributary area method for naturally supported mining. A comprehen-sive overview of the most common empirical methods within geomechanics can be foundin [7]. For stope design, empirical methods can be grouped within three commonly used de-sign methods [17], the stability graph method and its adaptations [18], the Hoek and Brownfailure criterion [19,20], and the span design graph [21,22]. The most well-known empiricalmethod for stope design is the stability graph method. Over time, several issues have beenidentified as intrinsic to the stability graph (e.g., limited database entries) [23,24]. Thus,the original stability graph was extended, modified, and the underlying system adaptedto different needs and challenges of stope design, for various mining methods, mine en-vironments, and geological conditions [25–45]. The Hoek and Brown failure criterion isan empirical failure criterion that has undergone repeated revisions since its introductionin the 1980s [19,46–50]. Even though it is an effective tool for estimating the strength ofjointed rock masses, there is a high degree of uncertainty of estimations related to theevaluation of in situ rock mass conditions being heavily reliant on subjective interpretationof qualitative guidelines [51]. The span design graph [21,22] method relies on comparingrock mass data and geometry of stope designs to case histories and uses the RMR76 (rockmass rating) system. The RMR76 classification is plotted against the desired span whileconsidering, in a rudimentary way, the joint orientations and stress levels. One of the mostrecent developments in empirical methods was the creation of novel empirical softwarethat enables the creation of regional and mine specific case studies [43].
Numerical modeling methods for modeling underground stopes have become evermore important with the advancements in computing power which allows numericalmodeling of the behavior of rock mass for increasingly complex scenarios [44–54]. Bothcontinuum-based [55–59], and discrete numerical methods [60–65] are used in stope de-sign. An important advancement in numerical approaches to stope design is the ability tosimulate jointed rock masses to analyze stope stability [66,67]. Stability analysis of stopesis based on the characteristic mechanical properties of jointed rock masses. Therefore,deformability and strength of a fractured rock mass must be evaluated first. The simplestapproach is to use the equivalent continuum (EC) method to estimate strength and deforma-bility properties, using empirical, analytical, or numerical methods and to up-scale them forthe region of interest [68]. In a more comprehensive approach, geometrical fracture proper-ties are characterized by field mapping, geostatistical, and geophysical methods [69–72]or remote sensing [73,74], and the mechanical properties of both intact rocks and rockdiscontinuities are measured in the laboratory or field. This enables large-scale modelingand stability analysis of multiple stopes, and the stability of each stope can be analyzedby numerical deterministic or probabilistic approaches e.g., [75–77]. Another approachfor formulating a fractured rock mass model uses explicitly defined discontinuities withproperties back-calculated using in situ measurements and the EC method for the sur-rounding rock mass. This can allow for efficient modeling of the whole mine and stopeoptimization [78]. Another method implemented numerically is the back-analysis methodfor stope design aimed at analyzing how previous stope designs behaved compared totheir expected behavior. This allows for a reconciliation process, where the results fromback-analysis are used to adapt the design of future stopes [79].
Energies 2022, 15, 240 3 of 20
Recent research related to stope design has not advanced to the same extent as researchin other mining-related areas [80–83]. The research is mainly focused on optimization ofstope boundaries, production schedule, and development activities [9]. An overview ofspecific research topics with a selection of featured research papers is given here:
• The incorporation of grade uncertainty and minimization of associated risk on stopedesign optimization [84,85]
• Iterative cut-off grade optimization [86,87]• Integration of stope design into mine planning [88,89]• Empirical software to create deposit-specific case studies [43,44]• Integration of real-time instrumentation and risk assessment [90]• Finding novel mining methods that allow for facilitated optimization methods [91]• Big data analytics in mining geomechanics [92]• Machine and deep learning methods for prediction and classification of stope de-
signs [93,94]• Stope sequencing optimization [95]• Improvements in the efficiency of stope optimization algorithms [83]
Many studies have focused on stope design optimization algorithms due to the largercomputing power available [96–110]. The first group of stope optimization algorithmsis level-oriented algorithms that are applied at the single mine level, including Riddledynamic programming [111], the branch and bound method [99,100], mixed integer pro-gramming [84], optimum limit integrated probable stope (OLIPS) [112–114], and the globaloptimization for underground mining area (GOUMA) algorithm [115]. The second group isfield-oriented algorithms where the entire mining area is considered for the determinationof mining limits, including the floating stope algorithm [103,116], multiple pass floatingstope process (MPFSP) [101], maximum value neighborhood method, nested stopes [104],heuristic approaches [97,106,117,118], network flow method [119], octree-division [120],and integrated method [88]. However, the transition from algorithms working in 2D to-wards algorithms realizing a truly 3D optimization is still advancing as there are onlya limited number of 3D algorithms available [83]. A wide variety of underground mineplanning and optimization software tools have been implemented recently [121]. In general,the recent developments can be understood as a growing trend towards developing newsoftware tools to overcome problems in design, scheduling and optimization. Software forstope design and mine planning and their working principles are explained in more detailin [121].
Even though a large amount of stope design research on various aspects is published inthe literature, the level of implementation of this research in the mining industry is not clear.No existing study has been found in the literature that addresses this problem. Therefore,this study aims to adequately identify the degree of stope design research implementationin the mining industry and to characterize the most urgent challenges related to stopedesign. Thus, a questionnaire, following principles of questionnaire design and statisticalscience [122,123], was created and responded to by mining industry professionals whowork with stope design. The key value of this work relates to the assessment of the currentresearch focus on the one hand, and the identification of industry needs on the other, aswell as the relationship between these.
2. Methodology2.1. Questionnaire Development
The WebRoPol electronic survey system [124] was utilized for the development of thequestionnaire. This allowed for the creation of various interactive features and facilitatedthe distribution of the questionnaire, as well as enabling evaluation of the results.
The questionnaire consisted of 19 questions with multiple choice and free answeroptions addressing 19 topics (see Table 1) and was designed based on state-of-the-art surveymethodology [123]. The design adhered to scientific survey principles, such as balancedmultiple-choice response options, non-mandatory responses, randomized answer option
Energies 2022, 15, 240 4 of 20
order, and use of a multilayer funnel approach. The questionnaire started with generalquestions, evolving into detailed questions about stope design. While each questionrequired specific responses, each question also allowed for detailed free-text answers.The questionnaire was represented on several small pages, based on specific topics. Tominimize information overload, additional answer options were only shown when theprevious option was selected.
Table 1. Questions asked in the industry survey on stope design methods.
Question
Q1. Provide your contact details and positionQ2. Do you wish to be notified about the results of the survey?Q3. Which exact stoping/mining methods do you apply?Q4. Have there been changes in your applied mining/stoping methods and if so why and when?Q5. Which mining methods did you use previously?Q6. Which methods are you currently applying to design your stopes?Q7. How long does the process of designing stopes usually take and how many people are commonly involved?Q8. How important are different parameters for the stope design (1 = very important; 5 = very unimportant)?Q9. How challenging are the geological conditions in your deposit?Q10. Are your stopes checked for accuracy and stability after excavation?Q11. Would you recommend your current stope design and stability estimations to other mines?Q12. What would you consider the most valuable improvement to the stope designing process?Q13. Have you utilized any geochemical, geophysical and/or geomechanical investigation methods for stope design before?Q14. Are you planning to utilize geochemical, geophysical and/or geomechanical methods for your stope design?Q15. Would you be interested in applying new rock/ore characterization methods?
Q16. Would you be interested in applying new in-situ rock mass characterization methods (geophysical/geomechanical tests)in your mine?
Q17. How fast would new geochemical/geophysical/geomechanical information have to be available to be implemented inthe stope designing process?
Q18. Would you consider implementing changes in your stope designing process and under what conditions?Q19. Please feel free to leave any remarks or recommendations here.
2.2. Questionnaire Target
The Mining Intelligence database [125] was drawn from to create a database containing250 international mines that use stoping methods. The database created included continent,country, commodity, mining method, owner, and contact information (if available). Oncethe population size for the survey had been estimated (250 mines), the aim was to contactas many of the mines as possible to exceed the target sample size needed to represent thepopulation adequately. Following the principles of survey science, the desired sample sizewas estimated according to the following formula [126]:
Sample Size =
z2×p(1−p)e2
1 +(
z2×p(1−p)e2×N
) (1)
where N = population size, e = margin of error, z = z-score (standard deviation), andp = expected proportion. With a confidence level of 90% and a margin of error of 14%,with a population size of 250, this resulted in the estimated sample size desired to exceed31 responses.
2.3. Participant Details
About 1000 potential participants were identified and contacted, and about 500 personsreceived an invitation to participate in the survey. Additionally, the survey invitation wasadvertised on the Mining Industry Professionals network forum on the LinkedIn platform.The invitation to the survey was additionally featured in LinkedIn’s June 2019 newsletterof the Mining Industry Professionals network with about 300,000 members. To allow fortracing which form of contact delivered the best results, the survey was split into three

Energies 2022, 15, 240 5 of 20
groups (direct contact via emails, LinkedIn messages, and Mining Industry Professionalsnetwork forum on LinkedIn platform). In total, approximately 500 people were contacted,and a total of 36 responses were gathered. Therefore, the targeted sample size of 31 wasexceeded by 16% and was considered a good representation of the studied population.
The survey was undertaken between May and July 2019. Due to the creation of differ-ent response origin sub-groups, it was possible to analyze where most responses originated,and which form of contact achieved the best results. The origin of the respondents bycontact form and region can be seen in Figure 1. Mines from all continents were representedwith the most answers received from European mines. However, the participants fromEurope represented Nordic mines that are technologically advanced. A broad variety ofdifferent areas of expertise of respondents was achieved; the job titles of the respondentscovered a broad range including mine managers and mining engineers, rock mechanicsengineers, geotechnical engineers, project engineers, and geologists. The participants repre-sented mines of varying sizes and commodities, such as gold, silver, copper, zinc, and lead.The annual ore production amongst survey respondents ranged between 0.2 Mt to 10.7 Mtwith an average of 1.8 Mt.
Energies 2022, 15, x FOR PEER REVIEW 5 of 22
Q19. Please feel free to leave any remarks or recommendations here.
2.3. Participant Details About 1000 potential participants were identified and contacted, and about 500 per-
sons received an invitation to participate in the survey. Additionally, the survey invitation was advertised on the Mining Industry Professionals network forum on the LinkedIn plat-form. The invitation to the survey was additionally featured in LinkedIn’s June 2019 news-letter of the Mining Industry Professionals network with about 300,000 members. To allow for tracing which form of contact delivered the best results, the survey was split into three groups (direct contact via emails, LinkedIn messages, and Mining Industry Professionals network forum on LinkedIn platform). In total, approximately 500 people were contacted, and a total of 36 responses were gathered. Therefore, the targeted sample size of 31 was exceeded by 16% and was considered a good representation of the studied population.
The survey was undertaken between May and July 2019. Due to the creation of dif-ferent response origin sub-groups, it was possible to analyze where most responses orig-inated, and which form of contact achieved the best results. The origin of the respondents by contact form and region can be seen in Figure 1. Mines from all continents were repre-sented with the most answers received from European mines. However, the participants from Europe represented Nordic mines that are technologically advanced. A broad vari-ety of different areas of expertise of respondents was achieved; the job titles of the re-spondents covered a broad range including mine managers and mining engineers, rock mechanics engineers, geotechnical engineers, project engineers, and geologists. The par-ticipants represented mines of varying sizes and commodities, such as gold, silver, cop-per, zinc, and lead. The annual ore production amongst survey respondents ranged be-tween 0.2 Mt to 10.7 Mt with an average of 1.8 Mt.
The responses from participants contacted via LinkedIn messages showed the high-est response quality, while the responses from the Mining Industry Professionals network forum showed the longest average response times. A more detailed survey description is given in [127].
Figure 1. Origin of survey respondents: (a) survey distribution method (b) region.
3. Results of Stope Design Survey 3.1. Applied Mining Methods
The distribution of the applied mining methods is illustrated in Figure 2. The survey shows a strong dominance of the sublevel stoping mining method, with approximately 46% of the responses reporting it as their applied mining method, followed by cut and fill with 22% of the responses.
To enable improved insight into the consistency of the applied mining methods, whether the currently applied mining methods had been used since the beginning of the
16
7
13
LinkedIn Forum Direct
a)
4
7
410
2
5
4
Africa AsiaAustralia EuropeNorth America South America
b)
Figure 1. Origin of survey respondents: (a) survey distribution method (b) region.
The responses from participants contacted via LinkedIn messages showed the highestresponse quality, while the responses from the Mining Industry Professionals networkforum showed the longest average response times. A more detailed survey description isgiven in [127].
3. Results of Stope Design Survey3.1. Applied Mining Methods
The distribution of the applied mining methods is illustrated in Figure 2. The surveyshows a strong dominance of the sublevel stoping mining method, with approximately46% of the responses reporting it as their applied mining method, followed by cut and fillwith 22% of the responses.
Energies 2022, 15, x FOR PEER REVIEW 6 of 22
life of the mine or changes had been applied to them was assessed. Figure 3 shows that changes in the mining method were reported in 69% of the responses. The reasons for the changes in the applied mining methods varied between economic, geological, technical, and geotechnical factors.
Figure 2. Applied mining methods at mines participating in the survey.
Figure 3. Ratio of the mines where changes were made to the applied mining methods, which indi-cates the process is adjusted to the conditions.
3.2. Geological Conditions The mining professionals were asked to evaluate the geological conditions in their
mines. More than 80% of the respondents described their mine’s geological conditions as “challenging” or “very challenging” (Figure 4).
Figure 2. Applied mining methods at mines participating in the survey.

Energies 2022, 15, 240 6 of 20
To enable improved insight into the consistency of the applied mining methods,whether the currently applied mining methods had been used since the beginning of thelife of the mine or changes had been applied to them was assessed. Figure 3 shows thatchanges in the mining method were reported in 69% of the responses. The reasons for thechanges in the applied mining methods varied between economic, geological, technical,and geotechnical factors.
Energies 2022, 15, x FOR PEER REVIEW 6 of 22
life of the mine or changes had been applied to them was assessed. Figure 3 shows that changes in the mining method were reported in 69% of the responses. The reasons for the changes in the applied mining methods varied between economic, geological, technical, and geotechnical factors.
Figure 2. Applied mining methods at mines participating in the survey.
Figure 3. Ratio of the mines where changes were made to the applied mining methods, which indi-cates the process is adjusted to the conditions.
3.2. Geological Conditions The mining professionals were asked to evaluate the geological conditions in their
mines. More than 80% of the respondents described their mine’s geological conditions as “challenging” or “very challenging” (Figure 4).
Figure 3. Ratio of the mines where changes were made to the applied mining methods, whichindicates the process is adjusted to the conditions.
3.2. Geological Conditions
The mining professionals were asked to evaluate the geological conditions in theirmines. More than 80% of the respondents described their mine’s geological conditions as“challenging” or “very challenging” (Figure 4).
Energies 2022, 15, x FOR PEER REVIEW 7 of 22
Figure 4. Geological conditions present at mines represented in the survey.
3.3. Stope Design Methods Concerning the various methods for stope design, it was important to assess which
of these were utilized in the industry. As shown in Figure 5, personal expertise and nu-merical methods represented a significantly higher proportion than empirical methods.
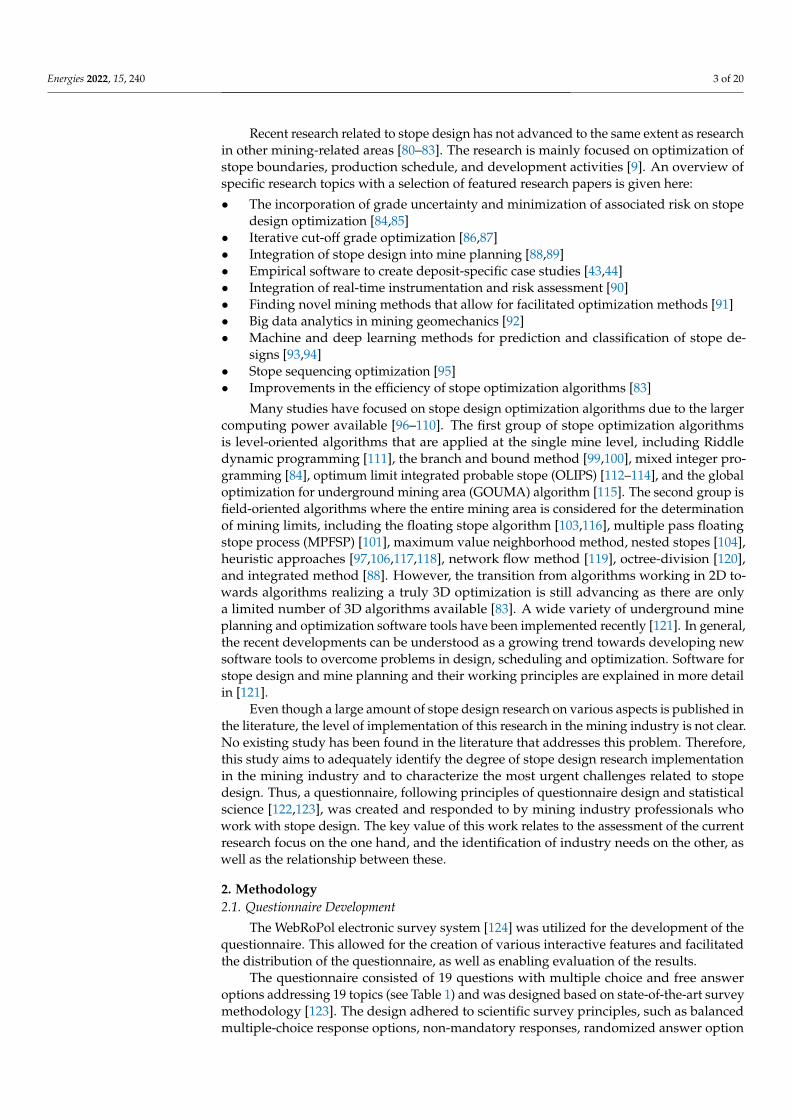
The empirical methods used were mainly limited to the application of Mathew´s sta-bility graph or the modified Mathew´s stability graph and utilization of the rock mass rating system (Figure 6). Personal expertise was utilized in the form of a broad variety of personnel from different disciplines including mine planners, drill and blast engineers, geologists, specialists in rock mechanics, and mining and geotechnical engineers. Com-monly, they utilized their personally acquired experience within specific geological set-tings. This can be viewed as a personal empirical approach.
The most utilized software in stope design were Micromine, Map3D, Surpac, Maptek Vulcan, Gantt Scheduler, Deswik (Microstation), Auto Stope Designer and Stope Opti-mizer, Rocscience (RS2, Slide, Phase2, Examine, DIPS, Unwedge and CPillar) and Recur-sos Mineros. Quantifiable values are not available here since these methods were only assessed in the free-text answers. Of note is that no participants mentioned any of the ITASCA software, such as FLAC, UDEC or 3DEC, that are widely used for rock mechan-ical numerical simulations.
Figure 7 illustrates in which state of mining the principal stope design was carried out. It is to be noted, that an iterative approach (stope design applied at multiple stages) was executed by only 6 respondents.
The survey respondents were asked how long it took to design stopes. Figure 8 pro-vides an overview of the duration of the stope design process. Based on the survey, stope design mainly required less than a week; some stopes though were reported to be de-signed as quickly as in a matter of minutes, whereas other responses stated several weeks. The relationships between stope size and geological complexity and the time needed to perform stope design were frequently mentioned as important influencing factors.
Figure 4. Geological conditions present at mines represented in the survey.
3.3. Stope Design Methods
Concerning the various methods for stope design, it was important to assess which ofthese were utilized in the industry. As shown in Figure 5, personal expertise and numericalmethods represented a significantly higher proportion than empirical methods.
Energies 2022, 15, x FOR PEER REVIEW 8 of 22
Figure 5. Ratio of the method that is used for design stopes in the mines.
Figure 6. Ratio of the applied empirical method for designing stopes: Mathew’s stability graph, Mathews modified stability graph, and other (e.g., rock mass rating, RMR).
Figure 7. Mining stage at which the stope design process takes place. The iterative stage means the stope design takes place in multiple stages with a feedback loop.
Figure 5. Ratio of the method that is used for design stopes in the mines.
Energies 2022, 15, 240 7 of 20
The empirical methods used were mainly limited to the application of Mathew´sstability graph or the modified Mathew´s stability graph and utilization of the rock massrating system (Figure 6). Personal expertise was utilized in the form of a broad variety ofpersonnel from different disciplines including mine planners, drill and blast engineers, ge-ologists, specialists in rock mechanics, and mining and geotechnical engineers. Commonly,they utilized their personally acquired experience within specific geological settings. Thiscan be viewed as a personal empirical approach.
Energies 2022, 15, x FOR PEER REVIEW 8 of 22
Figure 5. Ratio of the method that is used for design stopes in the mines.
Figure 6. Ratio of the applied empirical method for designing stopes: Mathew’s stability graph, Mathews modified stability graph, and other (e.g., rock mass rating, RMR).
Figure 7. Mining stage at which the stope design process takes place. The iterative stage means the stope design takes place in multiple stages with a feedback loop.
Figure 6. Ratio of the applied empirical method for designing stopes: Mathew’s stability graph,Mathews modified stability graph, and other (e.g., rock mass rating, RMR).
The most utilized software in stope design were Micromine, Map3D, Surpac, MaptekVulcan, Gantt Scheduler, Deswik (Microstation), Auto Stope Designer and Stope Opti-mizer, Rocscience (RS2, Slide, Phase2, Examine, DIPS, Unwedge and CPillar) and RecursosMineros. Quantifiable values are not available here since these methods were only assessedin the free-text answers. Of note is that no participants mentioned any of the ITASCA soft-ware, such as FLAC, UDEC or 3DEC, that are widely used for rock mechanical numericalsimulations.
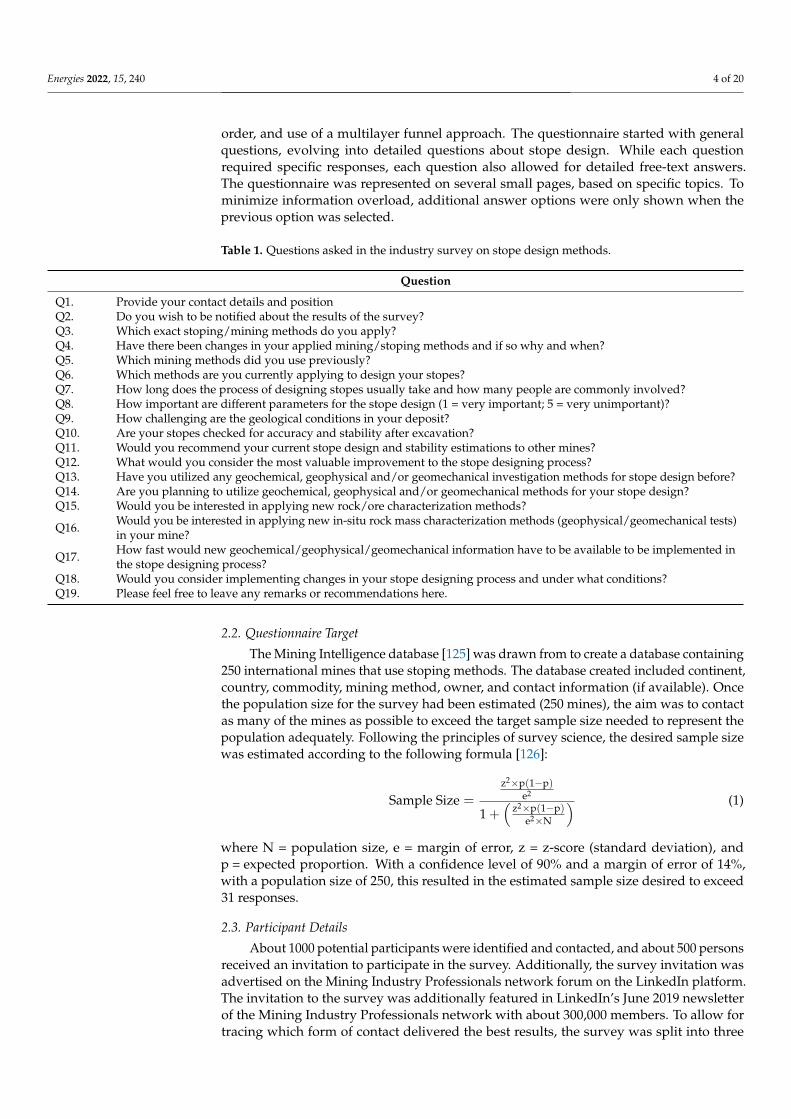
Figure 7 illustrates in which state of mining the principal stope design was carried out.It is to be noted, that an iterative approach (stope design applied at multiple stages) wasexecuted by only 6 respondents.
Energies 2022, 15, x FOR PEER REVIEW 8 of 22
Figure 5. Ratio of the method that is used for design stopes in the mines.
Figure 6. Ratio of the applied empirical method for designing stopes: Mathew’s stability graph, Mathews modified stability graph, and other (e.g., rock mass rating, RMR).
Figure 7. Mining stage at which the stope design process takes place. The iterative stage means the stope design takes place in multiple stages with a feedback loop.
Figure 7. Mining stage at which the stope design process takes place. The iterative stage means thestope design takes place in multiple stages with a feedback loop.
The survey respondents were asked how long it took to design stopes. Figure 8provides an overview of the duration of the stope design process. Based on the survey,stope design mainly required less than a week; some stopes though were reported to bedesigned as quickly as in a matter of minutes, whereas other responses stated several weeks.The relationships between stope size and geological complexity and the time needed toperform stope design were frequently mentioned as important influencing factors.

Energies 2022, 15, 240 8 of 20Energies 2022, 15, x FOR PEER REVIEW 9 of 22
Figure 8. Duration of stope design.
An additional aspect of stope design is the number of people involved in the process. The average number reported was three, though numbers as low as a single person and a maximum of 15 people were reported. Several responses indicated that the number of people involved depends on how much of the previous planning work was counted as part of the stope design process.
Finally, respondents were asked to rank parameters influencing stope design (Figure 9). Cutoff grade and dilution were reported as the most important parameters, though no single factor was of outstanding importance. Several additional factors were stated to have a considerable influence on stope design, though these cannot be assessed quantita-tively as they were provided as individual free-text answers. These factors were: produc-tivity, ventilation, mining cost, sequencing, drill and blast, flexibility in mine planning, rock mass, labor efficiency, selective mining unit (SMU), and safety. A discussion of these factors is not provided here, but they should be considered important factors sometimes affecting stope design.
Figure 9. Impact of factors on stope design (1 = very unimportant to 5 = very important).
3.4. Stope Performance The prevalence of stope stability monitoring is shown in Figure 10. According to the
survey, almost all (97%) respondents stated that stability monitoring occurred, most often (77%) using cavity monitoring systems (CMS). The other methods used relied on compar-ing planned and mucked tons, visual inspections, seismic controls, borehole extensome-ters, and laser scanning with point cloud data.
3.5. Most Important Improvement Suggestions for Stope Design Expert suggestions on the most important improvements for stope design were as-
sessed. Figure 11 illustrates that the implementation of additional geotechnical data, im-provements in software, and integration into general mine planning, were reported as the
Figure 8. Duration of stope design.
An additional aspect of stope design is the number of people involved in the process.The average number reported was three, though numbers as low as a single person anda maximum of 15 people were reported. Several responses indicated that the number ofpeople involved depends on how much of the previous planning work was counted as partof the stope design process.
Finally, respondents were asked to rank parameters influencing stope design (Figure 9).Cutoff grade and dilution were reported as the most important parameters, though nosingle factor was of outstanding importance. Several additional factors were stated to havea considerable influence on stope design, though these cannot be assessed quantitativelyas they were provided as individual free-text answers. These factors were: productivity,ventilation, mining cost, sequencing, drill and blast, flexibility in mine planning, rock mass,labor efficiency, selective mining unit (SMU), and safety. A discussion of these factors isnot provided here, but they should be considered important factors sometimes affectingstope design.
Energies 2022, 15, x FOR PEER REVIEW 9 of 22
Figure 8. Duration of stope design.
An additional aspect of stope design is the number of people involved in the process. The average number reported was three, though numbers as low as a single person and a maximum of 15 people were reported. Several responses indicated that the number of people involved depends on how much of the previous planning work was counted as part of the stope design process.
Finally, respondents were asked to rank parameters influencing stope design (Figure 9). Cutoff grade and dilution were reported as the most important parameters, though no single factor was of outstanding importance. Several additional factors were stated to have a considerable influence on stope design, though these cannot be assessed quantita-tively as they were provided as individual free-text answers. These factors were: produc-tivity, ventilation, mining cost, sequencing, drill and blast, flexibility in mine planning, rock mass, labor efficiency, selective mining unit (SMU), and safety. A discussion of these factors is not provided here, but they should be considered important factors sometimes affecting stope design.
Figure 9. Impact of factors on stope design (1 = very unimportant to 5 = very important).
3.4. Stope Performance The prevalence of stope stability monitoring is shown in Figure 10. According to the
survey, almost all (97%) respondents stated that stability monitoring occurred, most often (77%) using cavity monitoring systems (CMS). The other methods used relied on compar-ing planned and mucked tons, visual inspections, seismic controls, borehole extensome-ters, and laser scanning with point cloud data.
3.5. Most Important Improvement Suggestions for Stope Design Expert suggestions on the most important improvements for stope design were as-
sessed. Figure 11 illustrates that the implementation of additional geotechnical data, im-provements in software, and integration into general mine planning, were reported as the
Figure 9. Impact of factors on stope design (1 = very unimportant to 5 = very important).
3.4. Stope Performance
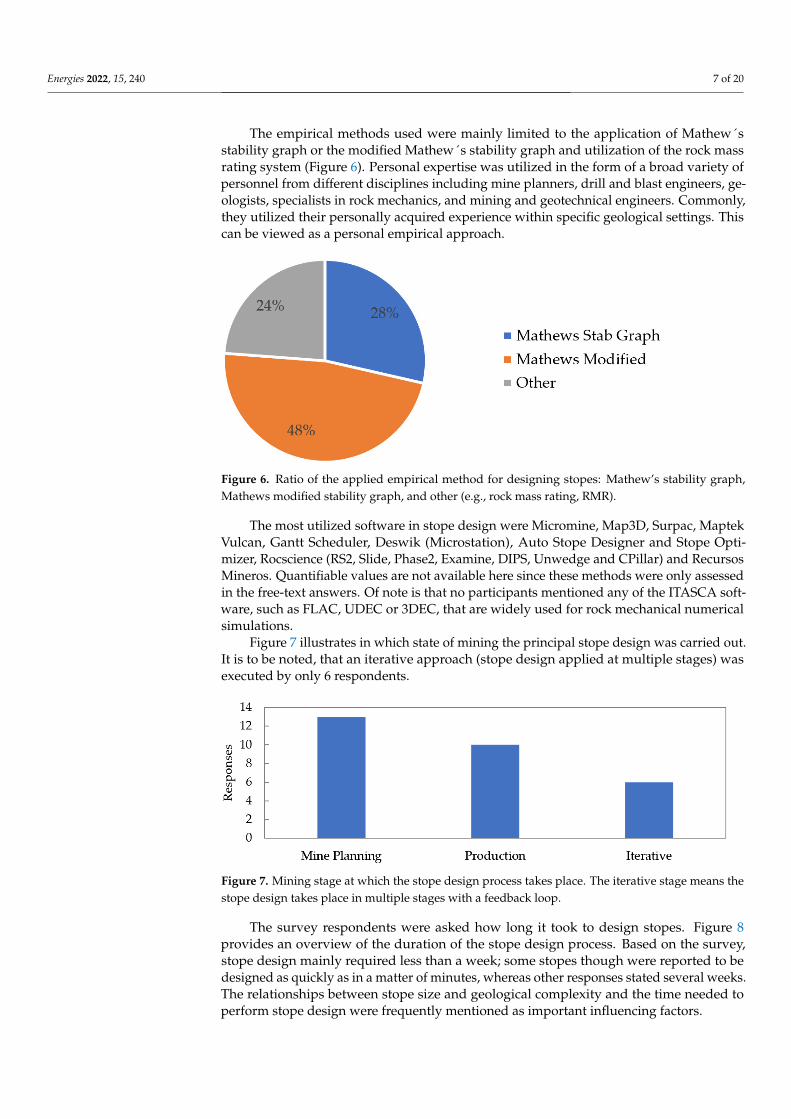
The prevalence of stope stability monitoring is shown in Figure 10. According to thesurvey, almost all (97%) respondents stated that stability monitoring occurred, most often(77%) using cavity monitoring systems (CMS). The other methods used relied on comparingplanned and mucked tons, visual inspections, seismic controls, borehole extensometers,and laser scanning with point cloud data.
Energies 2022, 15, 240 9 of 20
Energies 2022, 15, x FOR PEER REVIEW 10 of 22
most urgently desired improvements. There was considerable diversity within the listed methods, which indicates that there are several aspects requiring improvement in the stope design process. Several other areas for improvement were mentioned, such as the implementation of more reliable grade data, a variable cut-off, reliable performance indi-cation for dilution-cable-bolt utilization, and utilization of hanging-wall offset to decrease dilution.
Figure 10. The application of stope performance and control after excavation takes place (a) includ-ing the cavity monitoring system (CMS) to measure the stopes (b).
Figure 11. Most important improvement suggestions for stope design.
3.6. Utilization of Geotechnical Methods The utilization of rock mass characterization methods was assessed. This served as
an indication of how likely potential implementation of specific methods within the in-dustry would be considered. Figure 12 shows that 45% of the respondents have utilized rock mass investigations for stope design. Most of the applied methods dealt with geome-chanics, while minor parts involved geophysical and geochemical investigations. The ge-omechanical methods reported included RQD, RMR, MRMR, life of mine (LOM) stress model, deformation monitoring, core logging, Q-system, equivalent linear overbreak (ELOS)-chart and the Hoek–Brown failure-criterion. The geophysical methods reported
97%
3%
Are your stopes checked for accuracy and/or stability after excavation?
Yes
No
a)
77%
23%
How is your stope performance monitored?
CMS
Other
b)
20%
18%
17%
13%
12%
12%
8%
More Geotech data
Software
Integration into general mine planning
Speed
Automation
Backfill predictability
Other
Figure 10. The application of stope performance and control after excavation takes place (a) includingthe cavity monitoring system (CMS) to measure the stopes (b).
3.5. Most Important Improvement Suggestions for Stope Design
Expert suggestions on the most important improvements for stope design were as-sessed. Figure 11 illustrates that the implementation of additional geotechnical data,improvements in software, and integration into general mine planning, were reported asthe most urgently desired improvements. There was considerable diversity within the listedmethods, which indicates that there are several aspects requiring improvement in the stopedesign process. Several other areas for improvement were mentioned, such as the imple-mentation of more reliable grade data, a variable cut-off, reliable performance indication fordilution-cable-bolt utilization, and utilization of hanging-wall offset to decrease dilution.
Energies 2022, 15, x FOR PEER REVIEW 10 of 22
most urgently desired improvements. There was considerable diversity within the listed methods, which indicates that there are several aspects requiring improvement in the stope design process. Several other areas for improvement were mentioned, such as the implementation of more reliable grade data, a variable cut-off, reliable performance indi-cation for dilution-cable-bolt utilization, and utilization of hanging-wall offset to decrease dilution.
Figure 10. The application of stope performance and control after excavation takes place (a) includ-ing the cavity monitoring system (CMS) to measure the stopes (b).
Figure 11. Most important improvement suggestions for stope design.
3.6. Utilization of Geotechnical Methods The utilization of rock mass characterization methods was assessed. This served as
an indication of how likely potential implementation of specific methods within the in-dustry would be considered. Figure 12 shows that 45% of the respondents have utilized rock mass investigations for stope design. Most of the applied methods dealt with geome-chanics, while minor parts involved geophysical and geochemical investigations. The ge-omechanical methods reported included RQD, RMR, MRMR, life of mine (LOM) stress model, deformation monitoring, core logging, Q-system, equivalent linear overbreak (ELOS)-chart and the Hoek–Brown failure-criterion. The geophysical methods reported
97%
3%
Are your stopes checked for accuracy and/or stability after excavation?
Yes
No
a)
77%
23%
How is your stope performance monitored?
CMS
Other
b)
20%
18%
17%
13%
12%
12%
8%
More Geotech data
Software
Integration into general mine planning
Speed
Automation
Backfill predictability
Other
Figure 11. Most important improvement suggestions for stope design.
3.6. Utilization of Geotechnical Methods
The utilization of rock mass characterization methods was assessed. This served as anindication of how likely potential implementation of specific methods within the industrywould be considered. Figure 12 shows that 45% of the respondents have utilized rock massinvestigations for stope design. Most of the applied methods dealt with geomechanics,while minor parts involved geophysical and geochemical investigations. The geomechan-ical methods reported included RQD, RMR, MRMR, life of mine (LOM) stress model,deformation monitoring, core logging, Q-system, equivalent linear overbreak (ELOS)-chartand the Hoek–Brown failure-criterion. The geophysical methods reported included acousti-cal and optical televiewer and gravimetric testing, and geochemical methods, which weremostly limited to atomic absorption spectroscopy and fire assay.

Energies 2022, 15, 240 10 of 20
Energies 2022, 15, x FOR PEER REVIEW 11 of 22
included acoustical and optical televiewer and gravimetric testing, and geochemical methods, which were mostly limited to atomic absorption spectroscopy and fire assay.
The planned future implementation of rock mass characterization methods into the stope design process was assessed (Figure 13). The term “new rock mass characterization methods” was meant to address the willingness of the participants of the survey to imple-ment new methods for rock mass characterization that are different from their currently applied methods. The results indicated that half of the participants were willing to imple-ment novel methods. The geophysical and geochemical methods included in Figure 13b refer to collecting the rock mass data for stope design specifically, such as for location and orientation of discontinuities, or determination of their properties, the ore/waste bound-ary, or in situ rock strength. It was concluded that there was a marked trend towards the utilization of geophysical and geochemical methods for rock mass characterization in stope design in the future.
Figure 12. The current utilization of rock mass and ore investigation methods in the mines (a) and the type of method that is used to collect rock mass and ore data (b).
Figure 13. The planned implementation of rock mass and ore characterization methods for stope design (a) and the type of method that is planned to be used to collect rock mass and ore data (b).
45%
55%
Have you utilized any rock massand ore characterization methods
for stope design before?
Yes
No
a)
14%
13%
73%
Which rock mass and ore investigation methods do you apply?
geophysical
geochemical
geomechanical
b)
50%50%
Are you planning to utilize new rock mass characterization
methods for your stope design?
Yes Noa)
16%
26%58%
Which methods are you planning to utilize?
geophysical geochemical
geomechanicalb)
Figure 12. The current utilization of rock mass and ore investigation methods in the mines (a) andthe type of method that is used to collect rock mass and ore data (b).
The planned future implementation of rock mass characterization methods into thestope design process was assessed (Figure 13). The term “new rock mass characterizationmethods” was meant to address the willingness of the participants of the survey to imple-ment new methods for rock mass characterization that are different from their currentlyapplied methods. The results indicated that half of the participants were willing to imple-ment novel methods. The geophysical and geochemical methods included in Figure 13brefer to collecting the rock mass data for stope design specifically, such as for location andorientation of discontinuities, or determination of their properties, the ore/waste boundary,or in situ rock strength. It was concluded that there was a marked trend towards theutilization of geophysical and geochemical methods for rock mass characterization in stopedesign in the future.
Energies 2022, 15, x FOR PEER REVIEW 11 of 22
included acoustical and optical televiewer and gravimetric testing, and geochemical methods, which were mostly limited to atomic absorption spectroscopy and fire assay.
The planned future implementation of rock mass characterization methods into the stope design process was assessed (Figure 13). The term “new rock mass characterization methods” was meant to address the willingness of the participants of the survey to imple-ment new methods for rock mass characterization that are different from their currently applied methods. The results indicated that half of the participants were willing to imple-ment novel methods. The geophysical and geochemical methods included in Figure 13b refer to collecting the rock mass data for stope design specifically, such as for location and orientation of discontinuities, or determination of their properties, the ore/waste bound-ary, or in situ rock strength. It was concluded that there was a marked trend towards the utilization of geophysical and geochemical methods for rock mass characterization in stope design in the future.
Figure 12. The current utilization of rock mass and ore investigation methods in the mines (a) and the type of method that is used to collect rock mass and ore data (b).
Figure 13. The planned implementation of rock mass and ore characterization methods for stope design (a) and the type of method that is planned to be used to collect rock mass and ore data (b).
45%
55%
Have you utilized any rock massand ore characterization methods
for stope design before?
Yes
No
a)
14%
13%
73%
Which rock mass and ore investigation methods do you apply?
geophysical
geochemical
geomechanical
b)
50%50%
Are you planning to utilize new rock mass characterization
methods for your stope design?
Yes Noa)
16%
26%58%
Which methods are you planning to utilize?
geophysical geochemical
geomechanicalb)
Figure 13. The planned implementation of rock mass and ore characterization methods for stopedesign (a) and the type of method that is planned to be used to collect rock mass and ore data (b).
3.7. Improvement Implementation and Conditions
Next, the participants were asked if they would be interested in applying new methodsin stope design. This is different from the previous question (Figure 13a) where theparticipants were asked if they were already planning to implement new methods. Figure 14illustrates that the interest in the implementation of novel ore characterization, such asLIBS (laser-induced breakdown spectroscopy) and novel in-situ rock mass characterization

Energies 2022, 15, 240 11 of 20
methods, ranged between 65% and 70%. This is considerably higher than response ratesfor the already planned implementation of new methods, as assessed in the previousquestions. This should be understood as an indication that by explaining the specificmethods and their associated benefits in detail, the potential for implementation for theproposed methods could be increased considerably.
Energies 2022, 15, x FOR PEER REVIEW 12 of 22
3.7. Improvement Implementation and Conditions Next, the participants were asked if they would be interested in applying new meth-
ods in stope design. This is different from the previous question (Figure 13a) where the participants were asked if they were already planning to implement new methods. Figure 14 illustrates that the interest in the implementation of novel ore characterization, such as LIBS (laser-induced breakdown spectroscopy) and novel in-situ rock mass characteriza-tion methods, ranged between 65% and 70%. This is considerably higher than response rates for the already planned implementation of new methods, as assessed in the previous questions. This should be understood as an indication that by explaining the specific methods and their associated benefits in detail, the potential for implementation for the proposed methods could be increased considerably.
The question was set to assess whether there is a general willingness to implement changes in the stope design process, and which conditions and requirements would be associated with these changes. In addition, the acceptable timeframe for possible improve-ments was identified. The general willingness to implement changes in the stope design process was very high, reaching a value of 87% (Figure 15). However, respondents noted that changes must be proven in feasibility studies and implemented into the software. Other requirements identified were realized benefits, reliability, predictability, faster pro-cess, and new personnel. Potential changes to stope design were not only limited to ge-otechnical methods but other methods, such as geophysical methods, were also desired.
Figure 14. Interest in new rock and ore classification methods (a) and rock mass characterization methods (b).
65%
35%
Would you be interested in applying new rock/ore classification
methods (such as LIBS) in your mine?
Yes
No
a)
70%
30%
Would you be interested in applying new in-situ rock mass
characterization methods?
Yes
No
b)
Figure 14. Interest in new rock and ore classification methods (a) and rock mass characterizationmethods (b).
The question was set to assess whether there is a general willingness to implementchanges in the stope design process, and which conditions and requirements would be asso-ciated with these changes. In addition, the acceptable timeframe for possible improvementswas identified. The general willingness to implement changes in the stope design processwas very high, reaching a value of 87% (Figure 15). However, respondents noted thatchanges must be proven in feasibility studies and implemented into the software. Otherrequirements identified were realized benefits, reliability, predictability, faster process, andnew personnel. Potential changes to stope design were not only limited to geotechnicalmethods but other methods, such as geophysical methods, were also desired.
Energies 2022, 15, x FOR PEER REVIEW 13 of 22
Figure 15. Willingness to implement changes in the stope design process (a) and the acceptance conditions to implement new methods (b) (other requirements identified were realized benefits, reliability, predictability, faster process, and new personnel).
The timeframe for the availability of additional geotechnical data to be acquired was identified as a potential key issue for the implementation, utilization, and ease of use of the new technology. Therefore, the tolerable timeframe for obtaining additional measure-ment data to be used in stope design was assessed (Figure 16). It was found that data from additional measurements available within three days would satisfy the needs of more than 70% of the respondents. However, a considerable number of responses stated that the timeframe for obtaining the data could be extended if the data added substantial value to the stope design process.
Figure 16. Number of responses on the tolerable time for measurement data to become available for stope design.
3.8. Hypothesis Analysis To achieve a deeper level of understanding of survey responses, the results can be
analyzed using either correlational or hypothesis analysis [128]. In this study, correla-tional analysis was not implemented due the limited availability of quantifiable values. Therefore, a hypothesis analysis was performed as it is of value in surveys with a large number of free-text answers and where there is elaborated complexity in the question-naire [129]. Two hypotheses related to the surveyed subject were defined and evaluated by assessing the responses from the survey. The first hypothesis tested assumed that the more challenging the geological conditions, the more rock mass and ore investigation methods would be applied for stope design. To test this hypothesis, it was necessary to
87%
13%
Would you consider implementing changes in
your stope design process?
Yes Noa)
44%
40%
16%
At what conditions would you implement changes in your stope design process?
Proven feasibilityImplementation in SoftwareOtherb)
Figure 15. Willingness to implement changes in the stope design process (a) and the acceptanceconditions to implement new methods (b) (other requirements identified were realized benefits,reliability, predictability, faster process, and new personnel).

Energies 2022, 15, 240 12 of 20
The timeframe for the availability of additional geotechnical data to be acquired wasidentified as a potential key issue for the implementation, utilization, and ease of use of thenew technology. Therefore, the tolerable timeframe for obtaining additional measurementdata to be used in stope design was assessed (Figure 16). It was found that data fromadditional measurements available within three days would satisfy the needs of more than70% of the respondents. However, a considerable number of responses stated that thetimeframe for obtaining the data could be extended if the data added substantial value tothe stope design process.
Energies 2022, 15, x FOR PEER REVIEW 13 of 22
Figure 15. Willingness to implement changes in the stope design process (a) and the acceptance conditions to implement new methods (b) (other requirements identified were realized benefits, reliability, predictability, faster process, and new personnel).
The timeframe for the availability of additional geotechnical data to be acquired was identified as a potential key issue for the implementation, utilization, and ease of use of the new technology. Therefore, the tolerable timeframe for obtaining additional measure-ment data to be used in stope design was assessed (Figure 16). It was found that data from additional measurements available within three days would satisfy the needs of more than 70% of the respondents. However, a considerable number of responses stated that the timeframe for obtaining the data could be extended if the data added substantial value to the stope design process.
Figure 16. Number of responses on the tolerable time for measurement data to become available for stope design.
3.8. Hypothesis Analysis To achieve a deeper level of understanding of survey responses, the results can be
analyzed using either correlational or hypothesis analysis [128]. In this study, correla-tional analysis was not implemented due the limited availability of quantifiable values. Therefore, a hypothesis analysis was performed as it is of value in surveys with a large number of free-text answers and where there is elaborated complexity in the question-naire [129]. Two hypotheses related to the surveyed subject were defined and evaluated by assessing the responses from the survey. The first hypothesis tested assumed that the more challenging the geological conditions, the more rock mass and ore investigation methods would be applied for stope design. To test this hypothesis, it was necessary to
87%
13%
Would you consider implementing changes in
your stope design process?
Yes Noa)
44%
40%
16%
At what conditions would you implement changes in your stope design process?
Proven feasibilityImplementation in SoftwareOtherb)
Figure 16. Number of responses on the tolerable time for measurement data to become available forstope design.
3.8. Hypothesis Analysis
To achieve a deeper level of understanding of survey responses, the results can beanalyzed using either correlational or hypothesis analysis [128]. In this study, correlationalanalysis was not implemented due the limited availability of quantifiable values. Therefore,a hypothesis analysis was performed as it is of value in surveys with a large number offree-text answers and where there is elaborated complexity in the questionnaire [129]. Twohypotheses related to the surveyed subject were defined and evaluated by assessing theresponses from the survey. The first hypothesis tested assumed that the more challengingthe geological conditions, the more rock mass and ore investigation methods would beapplied for stope design. To test this hypothesis, it was necessary to analyze the correla-tion between the geological conditions and the current and planned implementation ofrock mass and ore investigation methods. The results of this analysis are represented inFigure 17. There was a clear trend towards an increase in the utilization of rock mass andore investigation methods with increasingly challenging geological conditions. It can beconcluded that the first hypothesis holds true and was confirmed.
Energies 2022, 15, x FOR PEER REVIEW 14 of 22
analyze the correlation between the geological conditions and the current and planned implementation of rock mass and ore investigation methods. The results of this analysis are represented in Figure 17. There was a clear trend towards an increase in the utilization of rock mass and ore investigation methods with increasingly challenging geological con-ditions. It can be concluded that the first hypothesis holds true and was confirmed.
Figure 17. Correlation of the current (left) and planned (right) utilization of rock mass and ore char-acterization methods with geological conditions.
The second hypothesis that was tested assumed that the more challenging geological conditions result in lower utilization of empirical methods for stope design. For analysis, the geological conditions were compared to the preferred stope design method type. The results are presented in Figure 18. The only clear trend that could be extracted from ana-lyzing the comparison between these two factors was that under varying and unchalleng-ing geological conditions the utilization of personal expertise in stope design showed an increase. However, these geological conditions were reported by only a very limited pro-portion of the survey population and, therefore, this hypothesis was rejected.
Figure 18. Correlation of geological conditions and the applied stope design method.
0% 50% 100%
Not Challenging
Challenging
Very Challenging
Varying
Current utilization of rock mass/ore investigation methods
Geo
logi
cal C
ondi
tions
Yes No
0% 50% 100%
Not Challenging
Challenging
Very Challenging
Varying
Planned utilization of of rock mass/ore investigation methods
Geo
logi
cl C
ondi
tions
Yes No
VeryChallenging
ChallengingNot
ChallengingVarying
Numerical 8 11 1 2
Personal Expertise 6 11 3 4
Empirical 5 8 1 2
0%10%20%30%40%50%60%70%80%90%
100%
Shar
e of
stop
e de
sign
met
hod
Geological Conditions
Figure 17. Correlation of the current (left) and planned (right) utilization of rock mass and orecharacterization methods with geological conditions.

Energies 2022, 15, 240 13 of 20
The second hypothesis that was tested assumed that the more challenging geologicalconditions result in lower utilization of empirical methods for stope design. For analysis, thegeological conditions were compared to the preferred stope design method type. The resultsare presented in Figure 18. The only clear trend that could be extracted from analyzingthe comparison between these two factors was that under varying and unchallenginggeological conditions the utilization of personal expertise in stope design showed anincrease. However, these geological conditions were reported by only a very limitedproportion of the survey population and, therefore, this hypothesis was rejected.
Energies 2022, 15, x FOR PEER REVIEW 14 of 22
analyze the correlation between the geological conditions and the current and planned implementation of rock mass and ore investigation methods. The results of this analysis are represented in Figure 17. There was a clear trend towards an increase in the utilization of rock mass and ore investigation methods with increasingly challenging geological con-ditions. It can be concluded that the first hypothesis holds true and was confirmed.
Figure 17. Correlation of the current (left) and planned (right) utilization of rock mass and ore char-acterization methods with geological conditions.
The second hypothesis that was tested assumed that the more challenging geological conditions result in lower utilization of empirical methods for stope design. For analysis, the geological conditions were compared to the preferred stope design method type. The results are presented in Figure 18. The only clear trend that could be extracted from ana-lyzing the comparison between these two factors was that under varying and unchalleng-ing geological conditions the utilization of personal expertise in stope design showed an increase. However, these geological conditions were reported by only a very limited pro-portion of the survey population and, therefore, this hypothesis was rejected.
Figure 18. Correlation of geological conditions and the applied stope design method.
0% 50% 100%
Not Challenging
Challenging
Very Challenging
Varying
Current utilization of rock mass/ore investigation methods
Geo
logi
cal C
ondi
tions
Yes No
0% 50% 100%
Not Challenging
Challenging
Very Challenging
Varying
Planned utilization of of rock mass/ore investigation methods
Geo
logi
cl C
ondi
tions
Yes No
VeryChallenging
ChallengingNot
ChallengingVarying
Numerical 8 11 1 2
Personal Expertise 6 11 3 4
Empirical 5 8 1 2
0%10%20%30%40%50%60%70%80%90%
100%
Shar
e of
stop
e de
sign
met
hod
Geological Conditions
Figure 18. Correlation of geological conditions and the applied stope design method.
4. Discussion4.1. State of Stope Design Methods in the Industry
The general survey responses provided detailed insights on stope design methods.It must be noted that block-caving methods were not considered in this study, as theapproaches to stability and design in block caving are beyond the scope of stope designmethods. The sublevel stoping methods were dominant, and the geological conditionswere mostly challenging according to responses. The results demonstrated that a greatinterest in improvements for stope design exists. Many respondents highlighted the needto gather more geotechnical data as early as possible to allow for more optimal stope design.This would also limit the negative impact resulting from the limited-data issue of stopedesign and mine planning integration. Other challenges indicated by the participantswere the need for development and improvement of software packages for stope design,integration into general mine planning and automation of the design process to increase itsspeed and reduce human bias (Figure 11). This indicates that machine and deep learningapproaches for stope design (e.g., methods proposed by [93,94]) have the highest potentialto be implemented in stope design practice in mines due to their speed, automation, anddata utilization capabilities. The substantial interest in improvements in stope designprocesses should be considered by researchers. The timescale to effect stope design basedon measurements within a timeframe of three days should be considered as guidance forfuture development.
4.2. Survey Sample Size and Response Rate
The targeted sample size of 31 was estimated using Equation (1). Based on previousexperience of collecting survey data in the mining industry [90,130,131], it was anticipatedthat the response would be minimal. Therefore, a large number of invitations were sent toexceed the targeted sample size. The 36 responses received exceeded the estimated samplesize by 16%, and therefore the results are considered representative of the studied sectorcomprising a population of 250 mines.

Energies 2022, 15, 240 14 of 20
From the meta-data of the survey responses, the most successful approach for conduct-ing the survey, which also resulted in the best answer quality, was a direct message throughLinkedIn. The responses from the Mining Industry Professionals network forum werelimited, possibly because it was not possible to directly address the possible reader. Thebest answers were received mainly from unknown individuals, who most likely believedin the value of related research and this survey; thus, they filled in the questionnaire outof goodwill rather than feeling obliged to do so. Support for this assumption is providedby the increased quality of answers within this group. In general, it was interesting toobserve how much time people were willing to spend on responding to the survey andwhich kind of high-quality answers, allowing for valuable insights, were received. Someexcellent answers were created in only 20 min, though on average an excellent answerrequired 39 min to be created. It was fortunate that so many industry professionals fromdifferent fields of stope design replied. The high degree of internationality and differentpositions within the management hierarchy were adequately represented.
4.3. Questionaire Response Quality Assessment
During the results evaluation process, the responses were initially assessed for theirinformation value. Due to an identified high degree of variety in the answer complexity andquality, a response quality evaluation was performed. To minimize the subjective impact onthe evaluation process, response quality/complexity indicators (average free-text-answer-length, or total response time) were chosen. These indicators were then used to createa response quality classification system. As part of the system´s implementation, everyresponse was assigned to a single class and the responses were divided into four categories,as can be seen in Table 2. Table 3 shows the results from the response quality evaluationgrouped by the means of contact. The overall response quality of all participants wassatisfactory on average and the share of excellent responses was 28%. The responses fromparticipants contacted via LinkedIn showed the highest average response quality and thehighest share of excellent responses, while the forum responses showed the lowest quality.
Table 2. Response quality classification system.
Class Value Description
Disqualified 0 Disqualified response; due to unsatisfying response quality.
Low quality 1 Minimum standard, at least 80% of the questions answered,free-text answer length below 4 words on average or repetitive
Satisfying 2 Considerably complex answers for most part, multiple phrasefree-text responses in some parts but not consistently
Excellent 3Very complex answers, stretching over several phrases, respondent
shows effort to explain his point of view and allows forthorough understanding
Table 3. Overview of response quality results grouped by means of contact.
Class LinkedIn Message E-Mail Forum Total
Responses 16 13 7 36Average response quality 2.1 1.8 1.6 1.9
Share of excellent responses 31% 23% 29% 28%
5. Conclusions
This study analyzed the current state-of-the-art of stope design methods through anindustry survey distributed among mining professionals. The survey sought to assess thelevel of implementation of novel methods for stope design into stope design practice andto characterize current challenges. In total, 36 responses of satisfactory response qualitywere received, and an international audience was reached, adequately representing the

Energies 2022, 15, 240 15 of 20
diverse environment of the stope-based underground mines. Based on the survey results,stope design is considered an important focal point for improvements. The most importantchallenges are to increase the amount of geotechnical data for stope planning, to improvestope design software, and to integrate stope design into general mine planning to a largerextent. Other challenges identified in the survey are the development of software packagesfor stope design, integration into general mine planning, and automation of the designprocess to increase its speed. Therefore, machine and deep learning methods for thestope design process have strong potential for implementation in the industry as they can:(1) utilize a large amount of geotechnical data, (2) be automated and implemented into asoftware package, and (3) increase speed and reliability.
The survey showed a strong dominance of the sublevel stoping mining methodcurrently being applied as the primary mining method in underground stoping-basedmines. The results suggest that there is no dominant stope design method and in somemines stope design is still commonly based on personal expertise or empirical methods,even though this may yield very sub-optimal results. The reliability of personal expertiseor empirical methods as stand-alone approaches is not considered to be sufficient. On theother hand, a variety of numerical methods for stope design have been developed andmany different methods and algorithms exist and were applied in 37% of the mines.
The stope design process occurs either within mine planning or during the productionstage. The period of stope design varies from less than a week to more than a month. Theutilization of an iterative approach for stope design at multiple mining phases is not yetwell established.
The important factors in stope design are cut-off grades and ore dilution. Mostprofessionals consider the geological conditions of the mine they represent to be challengingor very challenging. Those who reported very challenging conditions suggest improvedmethods to gather more geotechnical data. The newly acquired data is desired to becompatible with the mine planning software. A time frame of three days to make newgeotechnical data available for stope design is sufficient for about 70% of the specialists.Changes in the mining method were reported in 69% of the responses due to variousreasons and the industry is ready to implement new and more efficient stope designmethods. The feasibility of the new method should be proven by case studies. New designprocesses do not have to substitute old design methods but can rather be seen as potentiallycomplementary actions.
The strong interest in improvements in stope design processes suggests great potentialfor incorporation of recent scientific findings into the current practice of stope design.However, the benefits must first be showcased by case studies.
Author Contributions: Conceptualization, M.J. and S.P.; methodology, S.P.; investigation and anal-ysis, S.P.; writing—original draft preparation, S.P. and M.J.; writing—review and editing, M.J. andM.R.; supervision and project administration, M.R. and M.J. All authors have read and agreed to thepublished version of the manuscript.
Funding: This research was part of GAGS project funded by the Academy of Finland under grant no.319798. The authors greatly appreciate the financial support.
Institutional Review Board Statement: Not applicable.
Informed Consent Statement: Not applicable.
Acknowledgments: The authors would like to kindly acknowledge the survey respondents whotook valuable time away from their jobs to participate in the survey.
Conflicts of Interest: The authors declare no conflict of interest.
References1. Mateus, A.; Martins, L. Challenges and opportunities for a successful mining industry in the future. Boletín Geológico Min. 2019,
130, 99–121. [CrossRef]2. Brady, B.H.; Brown, E.T. Rock Mechanics: For Underground Mining; Springer: Berlin/Heidelberg, Germany, 2013.

Energies 2022, 15, 240 16 of 20
3. Villaescusa, E. Geotechnical Design for Sublevel Open Stoping; CRC Press: Boca Raton, FL, USA, 2014.4. Dzimunya, N.; Radhe, K.; William, C.M. Design and dimensioning of sublevel stoping for extraction of thin ore (<12 m) at very
deep level: A case study of konkola copper mines (kcm), Zambia. Math. Model. Eng. Probl. 2018, 5, 27–32. [CrossRef]5. Ranjith, P.G.; Zhao, J.; Ju, M.; De SIlva, R.; Rathnaweera, T.; Bandara, A. Opportunities and Challenges in Deep Mining: A Brief
Review. Engineering 2017, 3, 546–551. [CrossRef]6. Vallejos, J.A.; Miranda, O.; Gary, C.; Delonca, A. Development of an integrated platform for stability analysis and design in
sublevel stoping mines—MineRoc. In Proceedings of the International Seminar on Design Methods in Underground Mining 2015,ACG, Perth, Australia, 17–19 November 2015; pp. 477–488.
7. Suorineni, F.T. Reflections on empirical methods in geomechanics–The unmentionables and hidden risks. In Proceedings of theAusRock 2014: Third Australasian Ground Control in Mining Conference, Sydney, Australia, 4–5 November 2014.
8. Starfield, A.M.; Cundall, P.A. Towards a methodology for rock mechanics modelling. Int. J. Rock Mech. Min. Sci. Geomech. Abstr.1988, 25, 99–106. [CrossRef]
9. Erdogan, G.; Yavuz, M. Application of Three Existing Stope Boundary Optimisation Methods in an Operating UndergroundMine. In IOP Conference Series: Earth and Environmental Science; IOP Publishing: Bristol, UK, 2017; Volume 95, p. 042077.
10. Mark, C. Science of empirical design in mining ground control. Int. J. Min. Sci. Technol. 2016, 26, 461–470. [CrossRef]11. Bieniawski, Z.T. Engineering classification of jointed rock masses. Civil. Eng. S. Afr. 1973, 15, 335–343.12. Barton, N.; Lien, R.; Lunde, J. Engineering classification of rock masses for the design of rock support. Rock Mech. 1974, 6, 189–236.
[CrossRef]13. Hoek, E.; Kaiser, P.K.; Bawden, W.F. Support of Underground Excavations in Hard Rock; CRC Press: Boca Raton, FL, USA, 1993.14. Laubscher, D.H. A geomechanics classification system for the rating of rock mass in mine design. J. S. Afr. Inst. Min. Metall. 1990,
90, 257–273.15. Laubscher, D.H. Cave mining—The state of the art. J. S. Afr. Inst. Min. Metall. 1994, 94, 279–293.16. Lunder, P.J.; Pakalnis, R.C. Determination of the strength of hard-rock mine pillars. CIM Bull. 1997, 90, 51–55.17. Milne, D.; Pakalnis, R. Advances in Methods of Empirical Stope Design. In Proceedings of the 46th US Rock Mechan-
ics/Geomechanics Symposium, Chicago, IL, USA, 24–27 June 2012.18. Mathews, K.E.; Hoek, E.; Wyllie, D.C.; Stewart, S.B.V. Prediction of Stable Excavations for Mining at Depths below 1000 Metres in Hard
Rock; CANMET Report DSS Serial No. OSQ80-00081, DSS File No. 17SQ.23440-0-9020; Department Energy, Mines and Resources:Ottawa, ON, Canada, 1981; pp. 802–1571.
19. Hoek, E.; Brown, E.T. Empirical strength criterion for rock masses. J. Geotech Eng. Div. 1980, 106, 1013–1035. [CrossRef]20. Hoek, E.; Marinos, V. A brief history of the development of the Hoek-Brown failure criterion. Soils Rocks 2007, 2007, 85–92.21. Lang, B.D.A. Span Design for Entry-Type Excavations. Ph.D. Thesis, University of British Columbia, Vancouver, BC, Canada, 1994.22. Wang, H.; Webber, T. Practical semiautomatic stope design and cutoff grade calculation method. Min. Eng. 2012, 64, 85–91.23. Potvin, Y. Empirical Open Stope Design in Canada. Ph.D. Thesis, University of British Columbia, Vancouver, BC, Canada, 1988.24. Suorineni, F.T. A critical review of the stability graph method for open stope design. In Proceedings of the MassMin 2012: 6th
International Conference & Exhibition on Mass Mining, Sudbury, ON, Canada, 10–14 June 2012; pp. 10–14.25. Suorineni, F.T. The stability graph after three decades in use: Experiences and the way forward. Int. J. Min. Reclam. Environ. 2010,
24, 307–339. [CrossRef]26. Potvin, Y.; Milne, D. Empirical cable bolt support design. In Proceedings of the International Symposium on Rock Mechanics,
Sudbury, ON, Canada, 16–19 June 1992.27. Nickson, S.D. Cable Support Guidelines for Underground Hard Rock Mine Operations. Master’s Thesis, University of British
Columbia, Vancouver, BC, Canada, 1992.28. Scoble, M.J.; Moss, A. Dilution in underground bulk mining: Implications for production management, mineral resource
evaluation, II. Geol. Soc. Sp. Publ. 1994, 79, 95–108. [CrossRef]29. Stewart, S.B.V.; Forsyth, W.W. The Mathew’s method for open stope design. CIM Bull. 1995, 88, 45–53.30. Hadjigeorgiou, J.; Leclaire, J.; Potvin, Y. An update of the stability graph method of open stope design. In Proceedings of the 97th
Annual General Meeting, CIM, Halifax, NS, Canada, 14–18 May 1995; pp. 154–161.31. Milne, D.M.; Pakalnis, R.C.; Lunder, P.J. Approach to the quantification of hanging-wall behaviour. Trans. Inst. Min. Metall. 1996,
105, A69–A74.32. Clark, L.M.; Pakalnis, R.C. An empirical approach for estimating unplanned dilution from open stope hangingwalls and footwalls.
In Proceedings of the 99th Annual General Meeting, Vancouver, BC, Canada, 27 April–1 May 1997.33. Germain, P.; Hadjigeorgiou, J. Influence of stope geometry on mining performance. In Proceedings of the 100th Annual General
Meeting, Montreal, QC, Canada, 3–7 May 1998; Canadian Institute of Mining, Metallurgy and Petroleum: Vancouver, BC,Canada, 1998.
34. Suorineni, F.T. Effects of Faults and Stress on Open Stope Design. Ph.D. Thesis, University of Waterloo, Waterloo, ON,Canada, 1998.
35. Suorineni, F.T.; Tannant, D.D.; Kaiser, P.K. Determination of fault-related sloughage in open stopes. Int. J. Rock Mech. Min. Sci.1999, 36, 891–906. [CrossRef]
36. Diederichs, M.S.; Kaiser, P.K. Tensile strength and abutment relaxation as failure control mechanisms in underground excavations.Int. J. Rock Mech. Min. Sci. 1999, 36, 69–96. [CrossRef]
Energies 2022, 15, 240 17 of 20
37. Trueman, R.; Mikula, P.; Mawdesley, C.; Harries, N. Experience in Australia with the application of the Mathews’ method foropen stope design. CIM Bull. 2000, 93, 162–167.
38. Mawdesley, C.; Trueman, R.; Whiten, W.J. Extending the Mathews stability graph for open–stope design. Min. Technol. 2001, 110,27–39. [CrossRef]
39. Trueman, R.; Mawdesley, C. Predicting cave initiation and propagation. CIM Bull. 2003, 96, 53–59.40. Henning, J.G.; Kaiser, P.K.; Mitri, H. Evaluation of stress influences on ore dilution: A case study. In Proceedings of the
Conference: 38th U.S. Rock Mechanics Symposium, Washington, DC, USA, 7–10 July 2001; ARMA-01-0409. Available online: https://onepetro.org/ARMAUSRMS/proceedings/ARMA01/All-ARMA01/ARMA-01-0409/116537 (accessed on 1 December 2021).
41. Bewick, R.; Kaiser, P.K. Influence of Rock Mass Anisotropy on Tunnel Stability. In Proceedings of the 3rd CANUS Rock MechanicsSymposium, 01/2009, Toronto, ON, Canada, 9–15 May 2009.
42. Mitri, H.S.; Hughes, R.; Zhang, Y. New Rock Stress Factor for the Stability Graph Method. Int. J. Rock Mech. Min. Sci. 2011, 48,141–145. [CrossRef]
43. Vallejos, J.A.; Miranda, R.; Burgos, L.; Perez, E. Development of New Design Tools for Open Stoping Underground Mines. InProceedings of the 51st US Rock Mechanics/Geomechanics Symposium; American Rock Mechanics Association, San Francisco,CA, USA, 25–28 June 2017.
44. Razavi, M.; Espley, S.; Yao, M. Open stope stability analysis of VRM stope in the vicinity of Creighton Fault by numericaland empirical methods. In Proceedings of the 45th US Rock Mechanics/Geomechanics Symposium, San Francisco, CA, USA,26–29 June 2011; American Rock Mechanics Association: San Francisco, CA, USA, 2011.
45. Vallejos, J. Stability graph using major geological structures. Fluid Mech. Res. Int. J. 2018, 2, 243–246. [CrossRef]46. Hoek, E.; Brown, E.T. The Hoek–Brown failure criterion—A 1988 update. In Proceedings of the 15th Canadian Rock Mechanics
Symposium, Toronto, ON, Canada, 1988; Curran, J.H., Ed.; pp. 31–38. Available online: https://www.researchgate.net/profile/E-Brown-2/publication/247896456_The_Hoek-Brown_failure_criterion_-a_1988_update/links/54da95b00cf2ba88a68d4bd5/The-Hoek-Brown-failure-criterion-a-1988-update.pdf (accessed on 1 December 2021).
47. Hoek, E.; Wood, D.; Shah, S. A modified Hoek–Brown criterion for jointed rock masses. In Proceedings of the Rock Characteriza-tion Symposium, ISRM, Eurock ′92, Chester, UK, 14–17 September 1992; Hudson, J., Ed.; pp. 209–213.
48. Marinos, P.; Hoek, E. GSI—A geologically friendly tool for rock mass strength. In Proceedings of the GeoEng 2000 InternationalConference on Geotechnical and Geological Engineering, Melbourne, Australia, 19–24 November 2000; pp. 1422–1440.
49. Hoek, E.; Carter, T.G.; Diederichs, M.S. Quantification of the Geological Strength Index Chart. In Proceedings of the 47th US rockMechanics/Geomechanics Symposium, San Francisco, CA, USA, 23–26 June 2013.
50. Hoek, E.; Brown, E.T. The Hoek–Brown failure criterion and GSI–2018 edition. J. Rock Mech. Geotech. Eng. 2019, 11, 445–463.[CrossRef]
51. Renani, H.R.; Cai, M. Forty-Year Review of the Hoek–Brown Failure Criterion for Jointed Rock Masses. Rock Mech. Rock Eng.2021, 1–23. [CrossRef]
52. Heidarzadeh, S.; Saeidi, A.; Rouleau, A. Assessing the effect of open stope geometry on rock mass brittle damage using a responsesurface methodology. Int. J. Rock Mech. Min. Sci. 2018, 106, 60–73. [CrossRef]
53. Napa-García, G.; Camara, T.; Navarro Torres, V. Optimization of room-and-pillar dimensions using automated numerical models.Int. J. Min. Sci. Technol. 2019, 29, 797–801. [CrossRef]
54. Alejano, L.R.; Arzúa, J.; Castro-Filgueira, U.; Malan, F. Strapping of pillars with cables to enhance pillar stability. J. S. Afr. Inst.Min. Metall. 2017, 117, 527–540. [CrossRef]
55. Carvalho, J.L.; Hoek, E.; Corkum, B.T. Phases Program; Department of Civil Engineering, University of Toronto: Toronto, ON,Canada, 1991.
56. Curran, J.H.; Corkum, B.T. Examine 2D Boundary Element Method Code User’s Manual; Rocscience Inc.: Toronto, ON, Canada, 1994.57. Shen, B.; Stephansson, O.; Rinne, M. Modeling Rock Fracturing Processes; Springer: Berlin/Heidelberg, Germany, 2014.58. Wiles, T.D. Rockburst Prediction Using Numerical Modelling—Realistic Limits for Failure Prediction Accuracy. In Proceedings of
the Sixth International Symposium on Rockburst and Seismicity in Mines, Australian Centre for Geomechanics, Perth, Australia,9–11 March 2005; Potvin, Y., Hudyma, M., Eds.; pp. 57–63. [CrossRef]
59. Curran, J.H.; Corkum, B.T. EXAMINE 3D Version 2.0 Users Manual: Three-Dimensional Excavation Analysis for Mines; DataVisualization Laboratory, Department of Civil Engineering, University of Toronto: Toronto, ON, Canada, 1993.
60. Jing, L.; Stephansson, O. Fundamentals of Discrete Element Methods for Rock Engineering: Theory and Applications; Elsevier:Amsterdam, The Netherlands, 2007.
61. Kleine, T.; La Pointe, P.; Forsyth, B. Realizing the potential of accurate and realistic fracture modeling in mining. Int. J. Rock Mech.Min. Sci. 1997, 34, 3. [CrossRef]
62. Elmo, D.; Stead, D. An Integrated Numerical Modelling–Discrete Fracture Network Approach Applied to the Characterisation ofRock Mass Strength of Naturally Fractured Pillars. Rock Mech. Rock Eng. 2009, 43, 3–19. [CrossRef]
63. Grenon, M.; Landry, A.; Hadjigeorgiou, J.; Lajoie, P.L. Discrete fracture network based drift stability at the Éléonore mine. MiningTechnology. Trans. Inst. Min. Metall. Sect. A 2017, 126, 22–33.
64. Grenon, M.; Hadjigeorgiou, J. Open Stope Stability Using 3D Joint Networks. Rock Mech. Rock Eng. 2003, 36, 183–208. [CrossRef]65. Esterhuizen, G.; Gearhart, D.; Klemetti, T.; Dfougherty, H.; Van Dyke, M. Analysis of gateroad stability at two longwall mines
based on field monitoring results and numerical model analysis. Int. J. Min. Sci. Technol. 2018, 29. [CrossRef]

Energies 2022, 15, 240 18 of 20
66. Amedie, B.; Savage, W.Z. Effect of Joints on Rock Mass Strength and Deformability. In Comprehensive Rock Engineering; Hudson, J.,Ed.; Pergamon Press: Ann Arbor, MI, USA, 1993; Volume 1, pp. 331–365.
67. Nasseri, M.H.B.; Rao, K.S.; Rammamurthy, T. Anisotropic strength and deformational behavior of Himalayan schists. Int. J. RockMech. Min. Sci. 2003, 40, 23. [CrossRef]
68. Heidarzadeh, S.; Saeidi, A.; Rouleau, A. Evaluation of the effect of geometrical parameters on stope probability of failure in theopen stoping method using numerical modeling. Int. J. Min. Sci. Technol. 2019, 29, 399–408. [CrossRef]
69. Jessop, J.A.; Friedel, M.J.; Jackson, M.J.; Tweeton, D.R. Fracture detection with seismic crosshole tomography for solution controlin a stope. In Proceedings of the Symposium on the Application of Geophysics to Engineering and Environmental Problems,Oakbrook, IL, USA, 26–29 April 1992.
70. Cichowicz, A.; Milev, A.M.; Durrheim, R.J. Rock mass behaviour under seismic loading in a deep mine environment: Implicationsfor stope support. J. S. Afr. Inst. Min. Metall. 2000, 100, 121–128.
71. Ferrero, A.M.; Godio, A.; Sambuelli, L.; Voyat, I.H. Geophysical and geomechanical investigations applied to the rock masscharacterization for distinct element modeling. Rock Mech. Rock Eng. 2007, 40, 603–622. [CrossRef]
72. Torres, C.A. Geometric Characterization of Rock Mass Discontinuities Using TERRESTRIAL Laser Scanner and Ground Penetra-tion Radar. Master’s Thesis, University of Twente, Enschede, The Netherlands, 2008.
73. Sturzenegger, M. Multi-Scale Characterization Rock Mass Discontinuities and Rock Slope Geometry Using Terrestrial RemoteSensing Techniques. Ph.D. Thesis, Simon Fraser University, Burnaby, BC, Canada, 2010.
74. Janiszewski, M.; Uotinen, L.; Baghbanan, A.; Rinne, M. Digitisation of hard rock tunnel for remote fracture mapping and virtualtraining environment. In Proceedings of the ISRM International Symposium—EUROCK 2020: International Society for RockMechanics and Rock Engineering, Trondheim, Norway, 14–19 June 2020.
75. Idris, M.A.; Basarir, H.; Nordlund, E.; Wettainen, T. Probabilistic Estimation of Rock Masses Properties in Malmberget Mine,Sweden. Electron. J. Geotech. Eng. 2013, 8, 269–287.
76. Monsalve, J.J.; Baggett, J.; Bishop, R.; Ripepi, N. A Preliminary Investigation for Characterization and Modeling of StructurallyControlled Underground Limestone Mines by Integrating Laser Scanning with Discrete Element Modeling. In Proceedings of theNorth American Tunneling Conference, Washington, DC, USA, 24–27 June 2018; pp. 49–57.
77. Heidarzadeh, S. Probabilistic Stability Analysis of Open Stopes in Sublevel Stoping Method by Numerical Modeling. Ph.D.Thesis, University of Quebec, Quebec, QC, Canada, 2018.
78. Gang, H.; Kulatilake, P.H.S.W.; Shreedharan, S.; Cai, S.; Song, H. 3-D discontinuum numerical modeling of subsidence incor-porating ore extraction and backfilling operations in an underground iron mine in China. Int. J. Min. Sci. Technol. 2017, 27,191–201.
79. Cepuritis, P.M.; Villaescusa, E. Back analysis techniques for assessing open stope performance. In Proceedings of the 2006Australian Mining Technology Conference, Hunter Valley, NSW, Australia, 26–27 September 2006; pp. 261–271.
80. Wagner, H. Deep Mining: A Rock Engineering Challenge. Rock Mech. Rock Eng. 2019, 52, 1417–1446. [CrossRef]81. Scoble, M.J.; Lizotte, Y.C.; Paventi, M.; Mohanty, B.B. Measurement of blast damage. Min. Eng. 1997, 49, 103–108.82. Dowd, P.A.; Xu, C.; Coward, S. Strategic mine planning and design: Some challenges and strategies for addressing them. Min.
Technol. 2016, 125, 22–34. [CrossRef]83. Sotoudeh, F.; Kakaie, R.; Ataei, M. Development of a computer program for underground mine stope optimisation using a
heuristic algorithm. In Proceedings of the First International Conference on Underground Mining Technology, Sudbury, ON,Canada, 11–13 October 2017; pp. 689–700.
84. Grieco, N.; Dimitrakopoulos, R. Managing grade risk in stope design optimisation: Probabilistic mathematical programmingmodel and application in sublevel stoping. Min. Technol. 2007, 116, 49–57. [CrossRef]
85. Villalba Matamoros, M.E.; Kumral, M. Underground mine planning: Stope layout optimisation under grade uncertainty usinggenetic algorithms. Int. J. Min. Recl. Environ. 2019, 33, 353–370. [CrossRef]
86. Bootsma, M.; Alford, C.; Benndorf, J.; Buxton, M. Cut-off Grade Based Sublevel Stope Mine Optimisation. Adv. Appl. Strat Min.Plan 2018, 537–557. [CrossRef]
87. Will, K.; Vendla, S. Underground Cut-off Grade Optimisation in Narrow Vein Deposits Based on an Innovative Mine DesignAlgorithm. Min. Rep. Glückauf 2018, 154, 452–459.
88. Hou, X.; Dowd, P. Integrated optimisation of stope boundary and access layout for underground mining operations. Min. Technol.2019, 128, 193–205. [CrossRef]
89. Hou, J.; Li, G.; Wang, H.; Hu, N. Genetic algorithm to simultaneously optimise stope sequencing and equipment dispatching inunderground short-term mine planning under time uncertainty. Int. J. Min. Recl. Environ. 2019, 34, 307–32519. [CrossRef]
90. Mishra, R.; Kiuru, R.; Uotinen, L.; Janiszewski, M.; Rinne, M. Combining expert opinion and instrumentation data usingBayesian networks to carry out stope collapse risk assessment. In Proceedings of the MGR 2019: Proceedings of the FirstInternational Conference on Mining Geomechanical Risk, Perth, Australia, 9–11 April 2019; Wesseloo, J., Ed.; Australian Centrefor Geomechanics: Perth, Australia; pp. 85–96. [CrossRef]
91. Mousavi, A.; Sellers, E. Optimisation of production planning for an innovative hybrid underground mining method. Resour.Policy 2019, 62, 184–192. [CrossRef]

Energies 2022, 15, 240 19 of 20
92. McGaughey, J. Artificial intelligence and big data analytics in mining geomechanics. In Proceedings of the Ninth Interna-tional Conference on Deep and High. Stress Mining, The Southern Africa Institute of Mining and Metallurgy, Johannesburg,South Africa, 24–25 June 2019; Joughin, W., Ed.; pp. 45–54.
93. Adoko, A.C.; Saadaari, F.; Mireku-Gyimah, D. A Feasibility Study on the Implementation of Neural Network Classifiers for OpenStope Design. Geotech. Geol. Eng. 2021, 1–20. [CrossRef]
94. Bazarbay, B.; Adoko, A.C. A Comparison of Prediction and Classification Models of Unplanned Stope Dilution in Open StopeDesign. In Proceedings of the 55th U.S. Rock Mechanics/Geomechanics Symposium, Virtual Event, 22 June 2021.
95. Bouzeran, L.; Pierce, M.; Jalbout, A.; Ruest, M. Stoping sequence optimisation at Eleonore Mine based on stress analysisthrough horizon scale numerical modelling. In Proceedings of the Ninth International Conference on Deep and High StressMining, Johannesburg, South Africa, 24–25 June 2019; Joughin, W., Ed.; The Southern Africa Institute of Mining and Metallurgy:Johannesburg, South Africa; pp. 253–266.
96. Topal, E. Early start and late start algorithms to improve the solution time for long-term underground mine production scheduling.J. S. Afr. Inst. Min. Metall. 2008, 108, 99–107.
97. Topal, E.; Sens, J. A new algorithm for stope boundary optimization. J. Coal Sci. Eng. (China) 2010, 16, 113–119. [CrossRef]98. Copland, T.; Nehring, M. Integrated optimization of stope boundary selection and scheduling for sublevel stoping operations. J.
S. Afr. Inst. Min. Metall 2016, 116, 1135–1142. [CrossRef]99. Ovanic, J.; Young, D.S. Economic Optimization of Stope Geometry Using Separable Programming with Special Branch and Bound
Technique. In Proceedings of the 3rd Canadian Conference on Computer Applications in the Minerals Industry, Montreal, QC,Canada, 22–25 October 1995.
100. Ovanic, J.; Young, D.S. Economic Optimization of Open Stope Geometry. In Proceedings of the 28th International APCOMSymposium, Golden, CO, Canada, 20–22 October 1999.
101. Cawrse, I. Multiple Pass Floating Stope Process. In Proceedings of the 4th Biennial Strategic Mine Planning Conference, TheAustralasian Institute of Mining and Metallurgy: Melbourne, Australia, 2001. Available online: https://www.researchgate.net/publication/287021836_Multiple_Pass_Floating_Stope_Process (accessed on 1 December 2021).
102. Ataee-Pour, M. A critical survey of the existing stope layout optimization techniques. J. Min. Sci. 2005, 41, 447–466. [CrossRef]103. Alford, C.; Brazil, M.; Lee, D.H. Optimisation in underground mining. In Handbook of Operations Research in Natural Resources;
Springer: Boston, MA, USA, 2007; pp. 561–577.104. Alford, C.; Hall, B. Stope Optimisation Tools for Selection of Optimum Cut-off Grade in Underground Mine Design. In Project
Evaluation Conference 2009; Australasian Institute of Mining and Metallurgy Publication, Curran Associates Inc.: Victoria, Australia,2009; pp. 135–143.
105. Bai, X.; Marcotte, D.; Simon, R. Underground stope optimization with network flow method. Comput. Geosci. 2013, 52, 361–371.[CrossRef]
106. Sandanayake, D.; Topal, E.; Asad, M. A heuristic approach to optimal design of an underground mine stope layout. Appl. SoftComput. 2015, 30, 595–603. [CrossRef]
107. Keane, S. Optimization Improvements in Whittle using Stope Optimization Software. In Proceedings of the Mine Planning andEquipment Selection (MPES) Conference, Fremantle, WA, USA, 1–3 December 2010; pp. 121–128.
108. Little, L. Simultaneous Optimisation of Stope Layouts and Production Schedules for Long-Term Underground Mine Planning.Ph.D. Thesis, University of Queensland, Queensland, Australia, 2012.
109. Nikbin, V.; Ataee-Pour, M.; Shahriar, K.; Pourrahimian, Y. A 3D approximate hybrid algorithm for stope boundary optimization.Comput. Oper. Res. 2018, 115, 104475. [CrossRef]
110. Amedjoe, C.G.; Agyeman, J. Assessment of effective factors in performance of an open stope using cavity monitoring systemdata: A case study. J. Geol. Min. Res. 2015, 7, 19–30.
111. Riddle, J. A Dynamic Programming Solution of a Block Caving Mine Layout. In Proceedings of the 14th International APCOMSympo-sium, New York, NY, USA; 1977. Available online: https://www.onemine.org/document/abstract.cfm?docid=32802&title=A-Dynamic-Programming-Solution-Of-A-BlockCaving-Mine-Layout (accessed on 1 December 2021).
112. Jalali, S.; Ataee-Pour, M. A 2D dynamic programming algorithm to optimize stope boundaries. In Proceedings of the 13thSymposium on Mine Planning and Equipment Selection, Wroclaw, Poland, 1–3 September 2004; p. 13.
113. Jalali, S.; Ataee-Pour, M.; Shahriyar, K.; Elahi, E.�@A Computer Program to Optimize Stope Boundaries Using Probable Stope
Algorithm. Iran. J. Min. Eng. (IRJME) 2007, 2, 7–14.114. Jalali, S.; Ataee-Pour, M.; Shahriyar, K. Rigorous algorithms to optimise stope boundaries: Capabilities, restrictions and applica-
tions. In Proceedings of the 7th International Scientific Conference-SGEM2007, Varna, Bulgaria, 11–15 June 2007.115. Jalali, S.E.; Ataee-Pour, M.; Shahriar, K.; Elahi-Zeyni, E.; Nikbin, V. Computer based optimisation of underground mining area. J.
Civ. Environ. Eng. Sci. Technol. 2016, 48, 475–489.116. Alford, C. Optimisation in underground mine design. In Proceedings of the 25th International APCOM Symposium, Brisbane,
Australia, 9–14 July 1995; pp. 213–218.117. Ataee-Pour, M. A Heuristic Algorithm to Optimise Stope Boundaries. Ph.D. Thesis, Faculty of Engineering, University of
Wollongong, Wollongong, Australia, 2000.118. Bai, X.; Marcotte, D.; Simon, R. A heuristic sublevel stope optimizer with multiple raises. J. S. Afr. Inst. Min. Metall. 2014, 114,
427–434.
Energies 2022, 15, 240 20 of 20
119. Nikbin, V.; Ataee-pour, M.; Shahriar, K.; Pourrahimian, Y.; MirHassani, S.A. Stope boundary optimization: A mathematical modeland efficient heuristics. Resour. Policy 2019, 62, 515–526. [CrossRef]
120. Cheimanoff, N.; Deliac, E.; Mallet, J. GEOCAD: An alternative CAD and artificial intelligence tool that helps moving fromgeological resources to mineable reserves. In Proceedings of the 21st Application of Computers and Operations Research in theMineral Industry: 21st International Symposium Papers, Las Vegas, NV, USA, 27 February–2 March 1989; p. 471.
121. Erdogan, G.; Cigla, M.; Topal, E.; Yavuz, M. Implementation and comparison of four stope boundary optimization algorithms inan existing underground mine. Int. J. Min. Reclam. Environ. 2017, 31, 389–403. [CrossRef]
122. Fowler, F.J., Jr. Improving Survey Questions: Design and Evaluation. In Applied Social Research Methods Series; SAGE Publications:Thousand Oaks, CA, USA, 1995; Volume 38.
123. Regmi, P.; Waithaka, E.; Paudyal, A.; Simkhada, P.; Van Teijlingen, E. Guide to the design and application of online questionnairesurveys. Nepal J. Epidemiol. 2016, 6, 640–644. [CrossRef] [PubMed]
124. WebRoPol. Available online: https://webropol.com/ (accessed on 9 September 2021).125. Mining Intelligence. Available online: https://www.miningintelligence.com/ (accessed on 9 September 2021).126. Suresh, K.P.; Chandrashekara, S. Sample size estimation and power analysis for clinical research studies. J. Hum. Reprod. Sci.
2012, 5, 7–13. [CrossRef] [PubMed]127. Pontow, S. Evaluation of Methods for Stope Design in Mining and Potential of Improvement by Pre-Investigations. Master’s
Thesis, Aalto University, Aalto, Finland, 2019.128. Friedman, J.; Alm, E.J. Inferring correlation networks from genomic survey data. PLoS Comput. Biol. 2012, 8, e1002687. [CrossRef]129. Lynn, P. Hypothesis Testing Using Complex Survey Data. A Short Course Presented by Peter Lynn, University of Essex in
Association with the Conference of the European Survey Research Association. 2007. Available online: https://www.restore.ac.uk/Longitudinal/surveynetwork/documents/PragueCourseNotesPLv3.pdf (accessed on 1 December 2021).
130. Szydlowska, M. Systematic Review of Georisk in Underground Hard Rock Mines. Master’s Thesis, Aalto University, Espoo,Finland, 2016.
131. Mishra, R.K.; Janiszewski, M.; Uotinen, L.K.T.; Szydlowska, M.; Siren, T.; Rinne, M. Geotechnical Risk Management Concept forIntelligent Deep Mines. Procedia Eng. 2017, 191, 361–368. [CrossRef]