Indonesia Policies for Growth and Employment
262
Report No. 5597-IND Indonesia Policies for Growth and Employment Part I -Economic Performance and Policv Priorities Part is-Employment Trends and Outlook April 23, 1985 EastAsia and Pacific Regional Office FOR OFFICIAL USE ONLY Document of the World Bank This report has a restricted distribution and may be used by recipients only in the performance of their cfficial duties. Itscontents may not otherwise be disclosed without World Bankauthorization. Public Disclosure Authorized Public Disclosure Authorized Public Disclosure Authorized Public Disclosure Authorized Public Disclosure Authorized Public Disclosure Authorized Public Disclosure Authorized Public Disclosure Authorized
-
Upload
khangminh22 -
Category
Documents
-
view
1 -
download
0
Transcript of Indonesia Policies for Growth and Employment

Report No. 5597-IND
IndonesiaPolicies for Growth and Employment
Part I -Economic Performance and Policv PrioritiesPart is-Employment Trends and Outlook
April 23, 1985
East Asia and Pacific Regional Office
FOR OFFICIAL USE ONLY
Document of the World Bank
This report has a restricted distribution and may be used by recipientsonly in the performance of their cfficial duties. Its contents may not otherwisebe disclosed without World Bank authorization.
Pub
lic D
iscl
osur
e A
utho
rized
Pub
lic D
iscl
osur
e A
utho
rized
Pub
lic D
iscl
osur
e A
utho
rized
Pub
lic D
iscl
osur
e A
utho
rized
Pub
lic D
iscl
osur
e A
utho
rized
Pub
lic D
iscl
osur
e A
utho
rized
Pub
lic D
iscl
osur
e A
utho
rized
Pub
lic D
iscl
osur
e A
utho
rized

CURRENCY EQUIVALENTS
Before November 15, 1978 USgl.00 = Rp 415
Annual Averages 1979-84
1979 USg1.00 = Rp 6231980 USt1.00 = Rp 6271981 USS1.O0 = Rp 6321982 US$1.00 = Rp 6611983 USg1.00 = Rp 909 /11984 US$1.00 = Rp 1,026
April 23, 1985 USg1.00 = Rp 1,106
FISCAL YEAR
Government April 1 to March 31Bank Indonesia April 1 to March 31State Batks January 1 to December 31
/1 On March 30, 1983 the Rupiah was devalued from USg1.00 = Rp 703 toUS$1.00 = Rp 970.

FOR OFFICLAL USE ONLY
TITE : INDONESIA: POLICIES FOR GROWTH AND EMPLOYMENT
COUNTRY : INDONESIA
REGION : EAST ASIA AND PACIFIC
SECTOR : COUNTRY ECONOMIC
REPORT TYPE CLASSIFICATIONS MMIY LANGUAGE
5597-IN) CEM Official Use 04/85 English
PIUBDATE : Apr il 1985
ABSTRACT : Part I of this report reviews recent economic performanceagainst the backgrouad of the adjustment measures effectedower the past three years; assesses the country's economicprospects in the context of a ten year framework; andidentifies some of the policy areas that are of keyimportance in meeting Indonesia's development goals. Part IIfocuses on the outlook for employment over the next decade,and analyzes the impact of alternative growth and policyscenarios on labor absorption and incomes.
I This document has a restricted distnbution and may be used by recipients only in the performance oftheir offial duties. Its contents rnay not otherwise be disclosed without World Bank authorization.

INDONESIA
POLICIES FOR GROWTH AND EMPLOYMENT
Table of Contents
Page No.
OVERVIEV viii
SUMMARY AND CONCLUSIONS ix to xix
PART I - ECONOMIC PERFORMANCE AND POLICY PRIORITIES
CHAPTER 1-RECENT ECONOMIC DEVELOPMENTS . . . . . . . . . . . . . . . . 1
A. The External Setting and Adjustment: An Overview . . . 1
B. General Economic Trends . . . . . . . . . . . . . . . . 3Availability and Use of Resources . . . . . . . . . 3Growth of Domestic Output . . . . . . . . . . . . . 5Inflation . . . . . . . . . . . . . . . . . . . . . 9
C. Management of Government Finances . . . . . . . . . . . 10The 1984/85 Budget and Its Outcome . . . . . . . . . 10The Tax Reform and Its Implementation . . . . . . . 12The 1985/86 Budget: A Shift in Expenditure Policy 13Measures to Improve Project ImplementationPerformance . . . . . . . . . . . . . . . . . . . 16
D. External T-rade and Payments . . . . . . . . . . . . . . 17Reduction in the Current Account . . . . . . . . . . 17Export Performance . . . . . . . . . . . . . . . . . 18Decline in Imports . . . . . . . . . . . . . . . . . 21Rising Import Restrictions . . . . . . . . . . . . . 22Capital Inflows . . . . . . . . . . . . . . . . . . 22
E. Monetary and Credit Developments . . . . . . . . . . . . 23Deposit Mobilization . . . . . . . . . . . . . . . . 24Credit Availability . . . . . . . . . . . . . . . . 25Interest Rate Developments . . . . . . . . . . . . . 27Monetary Control and Management . . . . . . . . . . 29
This report was prepared in the World Bank's Jakarta Office under thedirection of Javad Khalilzadeh-Shirazi. The contributors to Part I wereFrederick Kilby, V!kram Nehru, Para Suriyaarachchi (Resident Staff inIndonesia) and Mark Baird (Indonesia Division). Part II was prepared byMichael Walton, Ho-Shik Kim (Indonesia Division) and Chris Manning(consultant). A drafL -,f tiae report was discussed with the Government inApril 1985.

- i: -
Page No.
F. Progress Towards Deregulation . . . . . . . . . . . . . 30Simplification of Investment Procedures . . . . . . 31New Customs Regulations . . . . . . . . .a. . . . . 31Improvements in Ports and Shipping. . . . . . . . . 32
CHAPTER. 2 - DEVELOPMENT OBJECTIVES AND PROSPECTS . . . . . . . . . . . 33
A. The External Environment and Its Implications forMacroecono mic Manegemtnt . . . . . . . . . . . . . . . 33
Introduction . . . . . . . . . . . . . . .. . . . . 33The External Setting . . . . . . . . . . . . . . . . 34External Terms of Trade Prospects . . . . . . . . . 37
B. Medium Term Prospects . . . . . . ... . . . . . . 38The Base Case Scenario .. . . . . . . . . . . . . . 38The Low Case Oil Scenario and the Impact of Lower
Non-oil Export Growth . .. . .. . .. . .. 44
C. External Trade . . . . . . . . . . . . . . . . . . . . . 47Export Prospects . . . . . . . . . . . . .. .a. .a. 49Import Needs and Composition . . . . . . . . . . . . 52
D. External Financing Requirements and Borrowing Strategy . 54Projections of Debt and Debt Service . . . . . . . . 58
CHAYTER 3 - SELECTED POLICIES FOR GROWTH AND STRUCrURAL TRANSFORMATION 60
A. introduction . . . . . . . . . . . . . . . . . . . . . . 60
B. Industrial Development and Trade Policy . . . . . . . . 61Emerging Problems in the Manufacturing Sector . . . 61Recent Developments in Trade Policy and Industrial
Strategy . . . .. . . . . . . .. . . . 62The Costs Associated with the Present Policy
Environment: Some Evidence . . . . . . . . . 66The Need for Change in Industrial and Trade Policy 69Some Elements of Trade Policy Reform . . . . . . . . 71
C. Issues in Financial Intermediation . . . . . . . . . . . 73Cost of Credit . . . . . . . . . . . . . .. . .. 73Long Term Lending . . . . . . . . . . . . . . . . . 74Institutional Development . . . . . . . . . . . . . 75
D. Public Investment: Issues and Priorities . . . . . . . 76Resource Availability for Public Investment . . . . 76Public Investment Priorities . . . . . . . 77Investmpnt Planning . . . . . . . . . . . . . . . . 83

- {ii -
Page No.
PART II - EMPLOYMENT TRENDS AND OUTLOOK . . . . . . . . . . . . . . . 86
Summary and Conclusions . . . . . . . . . . . . . . . . . . 86
CHAPTER 4 - THE EMPLOYMENT PROBLEM .. .. . .. ..... . .. . .. . 91
A. The Current Situation . . . . . . . . . . . . . . . . . 91The Nature of the Problem . . . . . .. . . .. . . 91Growth in Employment and Labor Productivity -The Past Experience . . . . . . . . . . . . . . . 93
Past Government Policy and Employment . . . . . . . 97
B. Future Prospects for Employment . .. . . . . . . . . a 98Labor Force Projections . . . . . . . . . . . . . . 99Overview of Potential Labor Absorption underAlternative Policies . . . . .. . . . . . . . . . 100
Lower Oil Prices and Employment . . . . . . . . . . 104
CHAPTER 5 - SELECTED POLICY ISSUES AND EMPLOYMENT . . . . . . . . . . . 106
A. Agriculture . . . . . . . . . . . . . . . . . . . . . . 106
B. Manufacturing . . . . . . . . . . . . . . . . . . . 109
C. Public Expenditures . . . . . . . . . . . . . . . . 114
D. Transmigration . . . . . . . . . . . . . . . . . . . . . 117
E. Policy Towards the Urban Labor Market . . . . . . . . . 121
APPENDICES TO PART II
APPENDIX 1 - PAST PATTERNS OF EMPLOYMENT AND INCOME CHANGE . . . . . . . 125
APPENDIX 2 - POPULATION AND LABOR FORCE PROJECTIONS . . . . . . . . . . 152
APPENDIX 3 - STATISTICS ON EMPLOYMENT AND INCOMES . . . . . . . . . . . 158
ANNEXES
I. ANALYSIS AND PROJECTION TABLES . . . . . . . . . . . . . . . . . . 172
II. HISTORICAL DATA . . . . . . . . . . . . . . . . . . . . . . . . . . 181

- iv -
Text Tables
Table No. Page No.PART I
Chapter I
1.1 Expenditure and Savings Ratios, 1981-1984 . . . . . . . . . . . 41.2 Growth in Sectoral Value Added, 1982-1984 . . . . . . . . . . . 61.3 Rates of Inflation, 1982-84 . . . . . . . . . . . . . . 91.4 Summary of Government Finances, 1982/83-1984/85 .li
1.5 The 1985/86 Budget . . . . . . . . . . . . . . . . . . . . . . . 141.6 Summary of Balance of Payments, 1982/83-1984/85 . . . . . . . . 191.7 Ncn-oil Export Performance, 1982/83-1984/85 . . . . . . . . . . 201.8 Non-oil Imports, 1982/83-1984/85 . . . . . . . . . . . . . . . . 211.9 Changes in Factors Affecting Money Supply and Liquidity,
1982:-84 ........................... 241.10 Growth of Bank Deposits, 1983-1984 . . . . . . . . . . . . . . . 251.11 Growth of Bank Credit, t81984-.984. . 261.12 Interest Rates of Commercial Banks, 1981-1984 . . . . . . . . . 28
Chapter 2
2.1 Selected Indicators of International Economic Activity,1984-95 . . . . . . .. 35
2.2 Indonesia's Terms of Trade under Alternative Scenarios,1981-1995 . . . . . . . . . . . . . . . . . . . 38
2.3 Growth and Composition of GDP under the Base Case,1984-1995 . . . . . . . . . . . . . . . . . . . . . . . . . . 39
2.4 Growth in GDP by Expenditure Category under the Base Case,1983-1995 . . . . . . . . . . . . . . . . . . . . . . . . . . 41
2.5 Summary Balance of Payments, under the Base Case, 1983/84-1995/96 . . . . . . . . . . . . . . . . . . . . . .. . . . . 43
-2.6 Selected Economic Indicators under Alternative Oil PriceScenarios, 1986-1995 . . . . . . . . . . . .. .. 45
2.7 Selected Economic Indicators under AlternativeExport Growth Scenarios, 1986-1995 . . . . . . . . . . . . . . 47
2.8 Projections of Merchandise Exports by Major CategoriesUnder the Base Case, 1984/85-1995/96 . . . . . . . . . . . . . 51
2.9 Projections of Merchandise Imports by Major CategoryUnder the Base Case, 1984/85-1995/96 . . . . . . . . . 53
2.10 External Capital Requirements and Sources, 1982/83-1987/88 . . . 552.U1 Commitments of Public Debt and Grants, 1980-84 .562.12 Projected Commitments of External Public Debt and Grants,
1985/86-1987/88 . . . . . . . . . . . . . . . . . . . . . . . 572.13 Disbursed and Outstanding Medium and Long Term Debt,
1981-95 . . . . . . . . . . . . . . . . . . . . . . . . . . 59

Table No. Page No.
PART I (cont.)
Chapter 3
3.1 Implicit Annual Subsidies per Worker ln Selected Industries,
1984 . . . . . . . . . . . . . . . . . . . . . . . . . . . . ..... 673.2 Domestic Resources Used in Saving or Earning us$1 . . . . . . . 683.3 Projected Performance Indicators under Alternative Trade
Policies, 1986-95 , . . . . . . . . . . . . . . . . . . . . 703.4 Sectoral Composition of Development Expenditure .' ....... 783.5 Import and Employment Coefficients. . . . . . . . . . . . . . . 793.6 Selected Development Indicators . . . .. ..... . . . . . .. . 81
Figures
Figure 2.1 Debt-Service Ratios, 1983/84-1995/96 . . . . . . . . . . . . 46Figure 2.2 Merchandise Exports, 1981/82-1995/96 ............ . 48
PART II
Chapter 4
4.1 Employment and Productivity, 1971-80 . . . . . . . . . . 944.2 Java and the Outer Islands: Patterns of Employment and
Productivity, 1971-80 . . . . . . . . 964.3 Regional Growth in Population and the Labor Force, 1986-95 . . . 1004.4 Employment and Productivity Growth Under
Favorable Policy, 1986-95 . . . . L a a . . . . . . a . . . . 1024.5 Potential Labor Absorption under a Low Oil Price Scenario,
1986-95 . . .. . . . . . . . . . . .... . . . . . . . . . .. . 105
Chapter 5
5.1 Alternative Scenarios for Manufacturing Growth, 1986-95 ... .l1l5.2 The Share of Small and Large Scale Firms in Employment
and Value Added in Manufacturing, 1979.... . . . . . 1135.3 Growth in Population and the Labor Force in Java and Bali
under Alternative Transmigration Scenarios . . . . . . . 1195.4 The Potential Impact of Transmigratioa on the Outer
Islands, 1990-2000 . . . . . . . . . . . . . . . . . . . . . . 120

-vi-
Table No. Page No.
PART II (cont.)
Appendix 1
1. Changes in Rural Employment, 1976-82.. ... ... . . . . . 32. Composition of Employment by Hours Worked, West Java
Villages, 1976 and 1983 ........ a.......... 43. Wages in Agricultural and Non-agricultural Activities,
Cimanuk Region, West Java, 1977-83 . . . . . . . . . . . . . . 54. Average Returns to Household Labor in Alternative
Activities, West Java Villages, 1976 and 1983 . . . . . . . . 65. Average Per Capita Income, West Java Villages, 1976 and 1983 . . 86. Household Income by Economic Class, West Java Villages,
1976 and 1983 . . . . . . . . . . . . . . . . . . . . . . . . 97. Sources of Income Change by Economic Class, West Java
Villages, 1976-83 . . . . . . . . . . . . . . . . . . . . . . 108. Price Indices and Terms of Trade for Javanese Farmers,
1976-83 ...... " * * ** .a119. Labor Income per Household from Farming, West Java Villages,
1976 and 1983 . .. . . . . . . . . . . . .. .. . . . . 1210. Average and Marginal Budget Shares, Rural and Urban Java, 1981 1311. Employment Effects of Average and Marginal Budget
Expenditure, Rural and Urban Java, 1981 . . . . . .. .. 1412. The Distribution of Non-agricultural Employment in Urban
Areas, 1976-82 . . . . . .. . . . . . . . . . . . . . . . . 1613. The Proportion of Urban Workers in the Formal Sector, by
Educational Attainment, 1980 and 1982 . . . . . . . . . . . . 1814. Overview of Civil Service Employment, 1969-84 . . . . . . . . . 1915. Average Household Income by Occupational Status in Urban
Indonesia, 1981 . . . . ...... . 2016. Indicators of Public/Private Salary Differentials . . . . . 2117. Minimum Wages for Three Provinces, 1977-84 . . . . . . . . . 2218. Growth in Average Salaries of Civil Servants, 1969-85 . . . 2319. Open Unemployment in Urban Indonesia by Educational
Attainment, 1976 and 1982 ... 2520. Job Seekers and Job Placements Recorded by the Labor
Enxchanges, Indonesia, December 1983 and September 1984 27
Appendix 2
1. Urban and Rural Population Growth, 1986-95 . . . . . . . . . . . 12. Estimated Actual and Projected Labor Force Participation
Rates, 1980 and 2000 . . . . . . . . . . . . . . . . . . . . . 23. Growth in the Urban and Rural Labor Force, 1986-95 . . . . 44. The Educational Composition of the Labor Force, 1971-90 . . . . 5

- vii -
LIST OF ABBREVIATIONS AND ACRONYMS
ASRRINDO - Asuransi Kredit Indonesia - State Credit Insurance AgencyBAPINDO - Bank Pembangunan Indonesia - Development Bank of IndonesiaBAPPENAS - Badan Perencanaan Pembangunan Nasional - National Development
Planning BoardBI - Bank IndonesiaBKPM - Badan Koordinasi Penanaman Modal - Investment Coordinating BoardBPS - Biro Pusat Statistik - Central Bureau of StatisticsBRI - Bank Rakyat Indonesia - People's Bank of IndonesiaBULOG - Badan Urusan Logistik - National Logistics AgencyDIP - Daftar Isian Proyek - Project Expenditure AuthorizationIGGI - Inter-Governmental Group on IndonesiaINPRES - Instruksi Presiden - Presidential Instruction (Local Public Works
Programs)IRRI - International Rice Research InstituteKEPPRES - Keputusan Presiden - Presidential DecreeKIC - Kiedit Investasi Kecil - Small Investment Credit-KMKP - Kredit Modal Kerja Permamen - Small Permaent Working Capital
Creditmm2 - Money Market SecuritiesPERTAMINA - Pertambangan Minyak Nasional - National Petroleum CorporationPIN - Perusahaan Umum Listrik Negara - State Electricity CompanyPERUMTEL - Perusahaan Umum Telekomunikasi - State Telecommunication CompanyPUSRI - Pupuk Sriwijaya - Fertilizer CompanyREPELITA III - Rencana Pembangunan Lima Tahun ke III - Third Development Plan -
1979180-1983/84REPELITA IV - Rencana Pembangunan Lima Tahum ke IV - Fourth Development Plan -
1984/85-1988/89SAKERNAS - Survey Angkatan Kerja'Nasional - National Labor Force SurveySBI - Sertifikat Bank Indonesia - Bank Indonesia CertificateSEKNEG - Sekretariat Negara - State SecretariatSUSENAS - Survey Sosial Ekonomi Nasional - National Household Income and
Expenditure Survey
Note: The report uses the convention of denoting Fiscal Years (FY) with a "Pwhile period averages are shown by a '--; i.e. 1983/84 refers toFY1983 and 1983-84 refers to the period 1983 and 1984.

- viii -
OVERVIEW
Over the past two years Indonesia has made major progress inadjusting to the weakenaing of the international oil market. The stabilizationand adjustment measures adopted in early 1983 have brought gains on a broadfront, including a stronger balance of payments, enhanced domestic resourcemobilization and reduced inflation. A particularly impressive achievement hasbeen the reduction of the current account deficit from 8.5X of GNP in 1982/83to an estimated 2.4% in 1984/85. At the same time, the adjustment hasentailed some costs, particularly the declJne in fixed investment, sluggishrecovery in manufacturing, and the faltering of the construction sector.However, a serious deterioration of the employment situation was prevented bya strong performance in agricultural incomes and non-oil exports.
In the years ahead, Indonesia faces the major challenge of generatinga pattern and pace of economic growth which would provide adequate employmentopportunities and earnings for a rapidly expanding labor force. Thischallenge iwut be met in a less favorable international environment: Indonesiais likely to face adverse shifts in external terms of trade, with slowlygrowing and possibly volatile oil revenues in the remainder of this decade.
There is a significant risk of a worsening of employment prospects,but the base case scenario of the report illustrates that the dual challengeof growth and employment could be effectively met, provided appropriatemacroeconomic and employment policies are pursued. The external constraint,however, mandates continued restraint in external borrowing in order to ensurethat the debt-service ratio remains within manageable limits. The medium termprojections of Indonesia's economic outlook also underscore the importance ofvigorous growth of non-oil exports.
The report identifies some of the policy areas that are of keyimportance In meeting Indonesia's development goals. From the point of viewof accelerating economic growth and structural transformation, ensuringexternal payments stability and enhancing employment prospects, it isessential to develop a broad-based and internationally competitive industrialsector through closer attention to efficiency issues on a broad front,including industrial and trade policy, the banking system and publicinvestment. Efficiency improvements in production and distribution wouldreduce costs, lower prices, and expand the domestic market. Without this, therequired growth of non-oil exports will be difficult to achieve. A key areadeserving immediate attention is project implementation -- where slippages canoften increase project costs and reduce benefits by delaying their realization.
In addition to appropriate general economic policies, policy areasthat can have a major impact on employment generation include: an appropriatepattern of public expenditure; continued priority for agricultural incomegrowth, both on and off Java; careful implementation of the transmigrationprogram, with close coordination of investments in resettlements, tree crops,irrigation and livestock to ensure sustainable incomes for transmigrantfamilies; and a supportive environment for urban informal sector activities.The report stresses that in terms of their implications for government policy,there is a basic consistency among the objectives of growth, emplovmentgeneration and external payments stability.

- ix -
SUMMARY AND CONCLUSIONS
Recent Economic Performance and Policies
The Background of AdJustment
I. Over the past two years, Indonesia has made major progress inadjusting to a less favorable resource position stemming from the weakening ofthe international oil market and the decline in oil prices. During 1983, itinitiated a set of decisive stabilization and adjustment measures, includingthe adoption of an austerity budget for 1983/84, a sharp reduction insubsidies, a drastic rephasing of its public sector investment program, a 28%devaluation of the Rupiah, a major reform of the financial sector, and anoverhaul of the tax system. The Government's actions, aided by the recoveryof industrial economies, brouglht about a remarkable improvement in economicperformance in 1983/84: non-oil exports increased by 37%; imports fell by 12%;the current account deficit was reduced to 6.0% of GNP (from 8.5% in 1982/83);and the overall fiscal deficit fell to 1.9% of GNP (from 6.3% in the previousyear).
Recent Performance
ii. This process of adjustment and consolidation was sustained during1984, and a successful effort was made to prevent backsliding on the majorreforms, particularly in the financial sector and in taxation. Performance inmost macroeconomic areas was impressive in 1984/85: the current accountdeficit fell further, to an estimated 2.4% of GNP; government savings rose by38%; and non-oil/LNG GDP increased by 4.4% (in 1981 prices). The inflationrate decelerated sharply after March 1984, to an annual rate of less than 4%.
iii. The improvement in the external payments position in 1984/85 tookplace mainly in non-oil transactions. The non-oil import bill wassignificantly reduced, primarily due to lower imports of capital goods andfood. While export earnings from oil and ING were essentially unchanged fromthe previous year's level, a $500 million increase in non-oil exports helpedto raise total export earnings above the previous year's level. This rise innon-oil exports was broad based. Amongst manufactured exports, most of theincrease originated from plywood (where substantial new capacity came onstream) and textiles. Total net foreign exchange reserves increased to about$10 billion, equivalent to over seven months' imports.
iv. The authorities adopted a cautious, mildly expansionary fiscal stancein the 1984/85 budget, with a programmed overall budget deficit equivalent toalmost 4% of GNP. However, World Bank staff estimates of the budget outcomeindicate that the overall budget was in approximate balance. Total revenuesare estimated to have exceeded the target by about 10% in nominal terms, butexpenditures fell short of the target by about 8%. In particular, public

investment outlays are estimated to have fallen due to project implementationproblems. Thus, government savings rose by 38%. However, the 1984/85budget's impact on the domestic economy was roughly the same as in theprevious year, as the Government's net domes tic expeaditures, as a perrent ofGNP, remained unchanged at 9.5%.
v. Overall GDP growth in 1984 is estimated at 6.5% (in 1931 prices) withmore than half of this growth stemming from oil, ING and refining. Thenon-oilWLNG GDP growth of 4.4X was equal to that in 1983, but still well belowthe average of 7.6% p.a. during the 1970s. There were continued impressivegains in agriculture, which grew at about 5%; rice production increased by 7%,.eading to self sufficiency - a milestone in Indonesia's agriculturaldevelopment. The growth rate of manufacturing (excluding ING and refining)rer-overed to 4.7%, although in several subsectors there was a decline in, orstagnation of, output. Activity in the construction sector stagnated.
vi. The stabilization and adjustment measures have caused some stressesin the economy, particularly in the manufacturing sector. Private fixedinvestment in manufacturing declined in 1984 for a variety of reasons,including widespread excess capacity and uncertainties associated with theimplementation of some of the new policies. Recent additions to productioncapacity, installed on the basis of earlier expectations of continued rapidgrowth in domestic demand, remained seriously underutilized. Moreover, profit=argins were eroded by cost increases and higher debt servicing associatedwith the 1983 devaluation, sharply higher domestic real interest ratesfollowing the June 1983 financial sector reform, and sluggish sales leading toan accumulation of inventories. In certain subsectors, the financial statusof some firms has been adversely affected. These developments have been asigaificant factor in encouraging further protectionist measures in Indonesia,Including new quantitative restrictions and total bans on certain imports.
vii. Despite the recent decline in overall economic growth relative to theperformance of the 1970s, the available evidence indicates that the employmentsituation has not worsened to any significant extent over the past two years,primarily because of a strong recovery in agricultural incomes and non-oilexports. As discussed in Part II of this report, there had been an extendedperiod of favorable employment absorption up to the early 1980s. Between 1971sad 1980, employment increased by 13 million, absorbing a 30% increase in thelabor force; and much of the labor force gained from shifts to higherproductivity work, and, around the end of the decade, rises in real wages.Open unemployment remained low at only 2% of the labor force and the incidenceof poverty was significantly reduced. This was facilitated by rapid GDPgrowth, a high degree of labor mobility between agriculture andnon-agricultural sectors, and government policies which helped laborabsorption through major public investments in irrigation, ruralinfrastructure and transmigration programs.
Viii. In an attempt to stimulate the economy, the 1985/86 budget adopts amoderately expansionary stance relative to the 1984/85 budget. Overallgovernmnst spending is budgeted to increase by 20% in nominal terms and net

- xi -
domestic expenditures to rise to lIZ of GNP. The budget involves a shift inexpenditure policy, with a larger share of resources allocated to currentexpenditures, particularly for increases in salaries. The budgeted growth ingovernment investment expenditures can only be achieved with sigaificantlyimproved project implementation performance.
ix. The implementation constraints on development budget expenditures,although partly related to limited capacity in the domestic construction andconsultancy industries, largely reflect continuing regulatory, procedural andinstitutional problems. The Government is well aware of these issues and hasundertaken several detailed internal reviews to identify and resolve them.Among the actions taken during the past year are measures to: ease proceduralbottlenecks affecting procurement decisions and the disbursement of funds;provide additional training in project management and budgetary procedures;and improve inter-ministerial coordination of major projects (such as BukitAsam) and programs such as transmigration and tree crop development. Otherinitiatives are underway to review the complex problem of land acquisition,and to assist in the development of the local consulting and contractingindustries. It is too early to assess the impact of these procedural changes,but it is clear thsat this intensive effort will have to be sustained, in orderto achieve the necessary improvements in project implementation performance.
x. Progress Towards Deregulation. The Government has recently announcedsimplifications in the regulatory framework for private investment licensing,and bold and far-reaching reforms to reduce excessive regulation and highcosts associated with customs and ports operations. With respect to privateinvestment licensing, effective April 1, 1985, the Government simplifiedprocedures for approval and implementation of investments and reorganized theInvestment Coordinating Board (BMPW). In regard to customs procedures, newmeasures announced on April 4, 1985 (through Presidential Instruction No. 4 onPorts and Shipping and subsequent instructions and decrees) reduced therequired import and export procedures to a bare minimum and provide for speedyrelease of cargo, with considerable savings in costs and time. The variousinstructions related to port operations seek to increase efficiency in cargohandling, ensure fair and equal treatment to all ocean-going vessels, simplifytariffs and reduce port charges. The implementation of these measures will bea major challenge; but given the Government's commitment to the reform, thereare good prospects for a major improvement in customs and port operations inthe near future.
Development Objectives and Prospects
Xi. 1-'Ith impressive progress made in stabilization, Indonesia new facesthe challenge of generating a pattern and pace of economic growth which wouldprovide adequate employment opportunities for a labor force expanding at 2.3%p.a. An estimated additional 17 million people will join the labor force inthe next decade. High priority will also need to be given to increasingproductivity and income levels of existing workers, particularly those inrural areas.

- xii -
xii. This challenge comes at a time when the external environment is besetwith uncertainty and likely to be less favorable than the 1970s. Indonesia'ssuccess in meeting the employment challenge depends crucially on the skillwith which it manages the transition from oil dependency to a more diversifiedsemi-industrialized economy. The economic strategy and policies pursued overthe next few years wlll have a significant bearing on the progress that may beachieved in bringing about the structural transformation to a more diversifiedpattern of growth, foreign exchange earnings and budgetary revenues that willbe necessary in the 1990s. Against this background, Indonesia's economicprospects for the next ten years are examined under a base case and twoalternative scenarios.
Medium Term Prospects
xiii. In the base case scenario, crude oil prices are expected to remainapproximately unchanged at their first quarter 1985 levels through the end of1986, increase in line with inflation in 1987, rise in real terms thereafterby about 1% annuially until 1990, and by 5% annually in the first half of the1990s. In nominal terms, the oil prices assumed are $40/bbl in 1990 and$65/bbl in 1995. It is assumed that oil production will rise to about1.63 mbd by 1990, but that the production rate will be reduced subsequently by2% annually as real oil prices rise, so that reserves can be conserved. Inthese circumstances Indonesia's terms of trade would deteriorate by nearly 5%between 1984 and 1990, but improve by over 3% p.a. during the first half ofthe 1990s.
xiv. In the next two years (1985-86), the GDP growth rate is likely to bebelow 4% p.a., given the demand prospects for oil . Combined with theanticipated decline in the terms of trade, gross national income (GNY) isanticipated to grow at about 3% p.a. in 1985-86. In the remainder of thedecade, overall GDP is projected to grow at an annual rate of 4.5%, withnon-oil/LNG GDP rising by 5% annually. Fixed investment growth is assumed toaverage about 5% p.a. in 1985-86 and rise to 5.6% p.a. during the rest of the1980s. Underlying this pattern of recovery is the assumption that projectimplementation would improve considerably, and that private investment wouldgradually pick up. However, in view of the external resource constraints, itis assumed that there would be no general shift in the composition ofinvestment toward relatively import intensive projects. A key assumptionunderlying this growth scenario is that non-oil exports (both from agricultureand manufacturing) would continue to increase rapidly (by about 7% p.a. inreal terms during 1986-1995).
xv. For the first half of the 1990s, overall GDP growth is maintained atabout 4.3% p.a. with the non-oil/LNG GDP growth rising to 5.6%. With theanticipated improvement in the terms of trade in the early 1990s, GNY wouldrise by nearly 1% p.a. faster than GDP. On the external side, the base caseimplies a continued decline in the current account deficit in relation to GNP,from 2.4% in 1984/85 to 1.9% in 1990/91 and 1.5% by the mid 1990s. Reducingthe deficit to the projected levels is essential for ensuring that thedebt-service ratio in the 1990s remains at a satisfactory level.

- xiii -
xvi. The maintenance of these rates of growth of GDP is essential to theeffective absorption of the growing labor force. Given the unfavorableprospects in the external environment, there is a risk of serious employmentproblems emerging, unless the Government makes a coucerted effort to foster alabor intensive pattern of growth in the economy. In many areas, there is ahigh degree of complementarity between employment needs and other developmentobjectives, notably the need for shifts in Industrial and trade policy infavor of a more efficient and export oriented pattern of growth and continuedpriority to agricultural growth. However, additional policy measures,specifically oriented toward employment will also be necesarry, as discussedin Part II.
xvii. on the other hand, if government policies were to be less favorableto employment generation, the employment situatioL would deteriorate. Suchpolicies would reduce employment opportunities in agriculture andmanufacturing by as much as 4-5 million over the next decade, force moreworkers to seek employment in residual services sectors, and create heavypressures on the urban informal sector. This, In turn, could lead to stagnantor declining productivity and incomes in those sectors and increased openunemployment. It is possible that both rural and urban income distributioncould worsen, and a significant proportion of the urban population couldsuffer a relative and absolute decline in their living standards.
xviii. As an illustrative exercise, the report analyzes the implications forthe Indonesian economy of a lower oil price scenario, i.e. with oil pricesdeclining by $2/bbl In 1985-86, followed by a slow recovery to reach t33/bbl(in current prices) by 1990 and $46 by 1995. The scenario illustrates that,in such an event, the external debt situation would remain manageable,provided a cautious borrowing policy is continued. The implications forgrowth would depend on Indonesia 's success in expanding non-oil exports. Withslightly faster non-oil export growth, and some additional restraints onimport intensive projects, the GDP growth rate need decline by less than 1% tomaintain a viable balance of payments position. The other alternativescenario, that of lower non-oil export performance, would have more seriousconsequences for growth and external payments stability over the longer termthan the lower oil price case. Slower economic growth would also make thetask of employment creation more difficult. Reduced resource availabilitywould constrain government investment and could slow down agricultural growthand diversification. An even greater effort would then be necessary toencourage a labor intensive pattern of production in agriculture andmanufacturing, combined with additional public expenditures in favor ofrelatively labor intensive and rural based activities.
xix. Recognizing the uncertain price prospects for oil in the medium term,REPELITA IV attaches particular significance to the promotion of non-oilexports. The prospects for Indonesia's non-oil exports will, in largemeasure, depend on the success of its manufactured exports. As noted earlier,Indonesia has substantially increased these exports, particularly plywood andtextiles, over the past two years. Unfortunately, textile products have

- xiv -
faced growing protectionism - in the form of both tariffs and non-tariffbarriers. A rollback in these barriers and a reduction in tariffs for plywoodwould provide an important measure of additional support for Indonesia'sadjustment efforts. At the same time, Indonesia should not lose sight of thefact that there is substantial scope for expansion in textile exports Incategor'es not subject to quotas, as well as in other manufactured goods.Clearly, the problems Indonesia is encountering in the international textileand plywood markets underscore the need for diversifying the mix of itsmanufactured exports.
xx. Given the uncertainty over oil prices, the projections highlight theneed for a cautious external borrowing strategy over the next few years, sothat future debt obligations remain manageable. In the near term, Indonesia'sdebt-service ratio wlll inevitably rise, given the recent fall in petroleumprices and market constraints on increasing oil exports. However, withcontinued prudent borrowing and further adjustment on the current account, thedebt-service ratio should improve before the end of the decade. The reportcautions against undertaking substantially more borrowing than is recommendedin the base case. With higher borrowing there would be a risk that thedebt-service ratio would deteriorate rapidly in the early 1990s, particularlyif the recovery in oil prices is delayed or is more sluggish than envisaged inthe base case.
Selected Policies for Growth and Structural Transformation
xxi. Prudent debt management in the near term needs to be supported bylonger term measures to stimulate the growth of incomes and employment. Inview of the uncertain and less favorable external environment facingIudonesia, there is a need for an even more careful husbanding of resources,and new measures to strengthen the production base of the economy throughefficiency improvements and judicious investments. In particular, a vitaltask will be to foster the development of a broad-based and internationallycompetitive industrial sector leading to a rapid and susrainable growth ofnon-oil exports. This is central to the objectives of improving the growthand distribution of income, creating employment opportunities and diversifyingsources of export earnings. The report examines some key areas of developmentstrategy and economic policy that can guide this process. It is argued thateconomic policies need to pay close attention to efficiency issues in industryand trade, in the banking system and in public investment. Additional areasof policy are also examined from the employment vantage. These includecontinued priority for agricultural income growth, an appropriate pattern ofpublic expenditures, careful implementation of the transmigration program, anda supportive environment for urban informal sector activities.
Industrial and Trade Policy
xxii. The problems of excess capacity and financial stresses in industryare in part a reflection of the past and present industrial policyenvironment. This environment leads to high cost industries because itshelters manufacturing activities from International, and often also domestic,

-xv-
competition. It should, of course, be recognized that efficiency in theindustrial sector, as In ;:he rest of the economy, depends not only ongovernment economic policies. Efficiency is also profoundly influenced by thecost and quality of physical infrastructure - ports, laud transport, power,telecommnmications; the level of entrepreneurial and managerial talents,scale of production and the technology employed; and the skill level of theworkforce. The Government's recent decisive measures on customs and ports,and the ongoing emphasis on education and management development, should helpimprove the efficiency of physical and human infrastructure. But an earlyrationalization of industrial and trade policy is also essential to thesuccess of the campaign to reduce costs in manufacturing, so as to enhance itscontribution to growth, incomes and export earnings.
xxiii. Under the present industrial and trade policy environment, largeimplicit subsidies are provided to several production activities for thedomestic market, the costs of which are borne by the domestic consumer. Insome cases, domestic value added, when measured in international prices, isnegative, indicating that in such activities the net contribution to thebalance of payments is negative. By contrast, export oriented industries aredisadvantaged by the present incentive structure, because they have to usehigher cost, locally produced inputs. Indonesia's recent accession to theGATT Code on Subsidies and Countervailing Duties reflects the full recognitionby the Government that unless the problem of high costs is tackled directly,Indonesia's non-oil export drive is unlikely to achieve the desired level ofsuccess.
xxiv. In response to excess capacity and slow manufacturing growth, recentGovernment policy statements emphasize the need to encourage exports ofmanufactures. In April 1985, the Government reduced both the level and therange of import dutic_. A reduction in the cost of imported inputs shouldimprove the competitiveness of a wide range of Indonesian industries. On theother hand, several other recent government actions are likely to becounterproductive to the export drive. In particular, quantitativerestrictions on the imports of an increasingly wide range of products, and thenature and pace of deletion programs to increase the local content of a numberof engineering goods, could encourage potentially costly and uneconomicupstream investments. Such investments create the risk of imposing a long runcost burden on downstream industries, thus jeopardizing the costcompetitiveness of exportable products.
xxv. During the 1970s, almost 90% of the growth of manufacturing outputwas sold in the domestic market, where domestic producers were protected fromforeign competition by tariff barriers. Import substituting industrialprojects can offer high economic rates of return and deserve high priorityprovided they are competitive rather than sheltered behind protectivebarriers. The overall thrust of industrial policy needs to emphasize a shifttowards a more cost-competitive industrial structure oriented towardsexports. This is important at this juncture for three reasons. First, asnoted above, it is the only way of sustaining a sufficiently rapid growth of

- rvi -
non-oil exports - without which either growth, or balance of paymentsstability, may have to be sacrificed over the longer run. Second, loweringproduct costs and prices is the best means of stimulating the growth ofdomestic demand for manufactures; this in turn would improve overall capacityutilization and growth performance. Third, the resulting broadening of themanufacturing sector is central to the provision of more employmentopportunities for the new entrants to the labor force. A clear enunciation ofa policy that new industrial investments would be required to be efficient byinternational standards would help set a better framework for both private andforeign investment.
xxvi. There are several industrial areas where Indonesia probably has astrong dynamic comparative advantage in international trade. One example isl-ight engineering products, which use relatively labor intensive techniques ofproduction. Existing firms in this subsector already exhibit potential forinternational competitiveness. The mastery of the technology used in thesesubsectors could provide the necessary base Indonesia needs to undertake morecomplex production processes. This indicates a need for a shift in emphasistowards light engineering goods. Accordingly, changes in the policyenvironment and incentive structure are required. In addition, activegovernment support is important for rationalizing existing industries so theycan compete more effectively with imports without requiring high protection.
xxvii. As noted earlier, the promotion of capital intensive producer goodsindustries, in addition to imposing immediate strains on the balance ofpayments, will substantially reduce the scope for creating gainful employmentopportunities. Greater emphasis, therefore, should be given to encouragingthe growth of industries which have a greater labor absorption potential, aswell as to increasing efficiency and export orientation in manufacturingproduction. These are not necessarily conflicting objectives; indeed therecan be a high degree of complementarity between an efficient, foreign-exchangeearning pattern of industrial growth and a relatively labor intensive one.The shifts in the composition of industrial output under a relatively exportoriented strategy can have significant employment benefits. Attention alsoneeds to be paid to the relative role of small scale, as against large,production units. The experience of other countries indicates that the bestway of sustaining the growth of small scale production units is to encourage abroadly dispersed pattern of demand growth and to remove favored treatment forlarge scale firms.
xxviii. Trade policy reform is one of the most difficult tasks facing anygovernment and the process must be carefully managed in order to minimize theproblems of adjustment. However, the longer present policies continue, themore difficult and costly becomes the task of improving the efficiency andinternational competitiveness of domestic industry. The present report doesnot provide a detailed prescription for future policy changes; instead itsuggests two areas which are fundamental to such an effort. First, it isimportant to refrain from introducing new bans and quantitative restrictionsand begin to replace existing ones with tariffs. With the recent lowering of

- xvii -
tariffs, there may well be pressures to grant new quantitative restrictions.It would be advisable to firmly resist such pressures. Second, over themedium term, it would be essential to effect a further reduction and greateruniformity in tariffs. During the transitional period to a less protectedenvironment, there would be a need for assistance to those industries whichhave the potential of becoming competitive in the medium term.
xxix. The banking system can play an important supportive role in reducinginvestment costs and increasing competitiveness. Given Indonesia's opencapital account and the close linkages between domestic interest rates andthose abroad, it is difficult to bring down domestic deposit rates. However,the present high cost of credit can be reduced by improving the efficiency ofbanking operations through more efficient organizational and operationalprocedures, and improved credit analysis and loan recovery efforts. Thebanking system can also support the process of industrial and trade policyreform in two other ways. First, it can assist those firms that need torestructure, modernize and adapt their production structure by providing themwith technical a sistance and financing. Second, banks can contribute to thedevelopment of an efficient industrial sector through sound appraisal ofprojects and the provision of technical assistance and advice especially tosmaller businesses and new entrepreneurs. To achieve these goals, it isnecessary that financial institutions themselves become more self-reliant, beable to operate independently, and strengthen their capacity for riskassessment.
Public Investment: Issues and Priorities
XXX. As half of all fixed investment in the economy is managed by thepublic sector, the planning and implementation of the public investmentprogram has a crucial bearing on the goals of efficiency and employmentcreation. The report takes the view that the public investment prioritiesproposed for REPELITA IV are broadly appropriate. The planned reallocation ofresources (compared to actual expenditures during REPELITA III), from industryand mining to the social sectors, should have a favorable impact an employmentgeneration and foreign exchange use. Every Rupiah invested in the socialsectors requires half as much imports, while generating three times as muchemployment as investments in industry, mines and energy. Given the overallresource constraints, care needs to be exercised to protect high priorityinvestments, especially in agriculture and the social sectors. Within thepriority sectors, some. shifts in spending would also be appropriate.. Forexample, the emphasis in education expenditures would need to shift fromprimary school construction to secondary and higher education development.Similarly, the nature of appropriate irrigation investment, especially inJava, needs to be reassessed, in view of recent success in rice production,while some reappraisal of the desirable and affordable level of powerinvestment may be necessary.
xxxi. The potential for altering the sectoral composition of publicexDenditures is severely constrained by differences in project implementation

- xviii -
capacity between sectors. For example, in the tree crops sector,implementation constraints have kept actual plantings below planned levels -
despite the sector's obvious importance to the domestic economy and exports.Similarly, implementation problems can adversely affect the optimal mix ofcompleted investments; for example, the expansion of PLN's distribution systemhas been held up by procurement delays, which in turn has contributed to hightransmission and distribution losses. The problems of project implementationcannot be solved easily, but they must be tackled if Indonesia is to succeedin meeting its sectoral investment goals. In the industrial sector, there isconsiderable scope for undertaking new projects. However, the uncertaineconomic outlook calls for a cautious attitude toward embarking on large, newinvestments (including those rephased in 1983). Their economic rates ofreturn and, especially, the implications of a possible slowdown in the growthof domestic demand, would need to be carefully scrutinized. Particular caremust be exercised concerning projects that would commit the country to highimport requirements and additional external borrowing at a time when it facesuncertainty over resource availabilities.
xxxii. Good investment planning based on sound project appraisal requires astrong central framework for ensuring intersectoral and macroeconomicconsistency. BAPPENAS already plays a major role in this regard, but there isa need for better coordination and monitoring of line agency programs, andappropriate mechanisms and criteria ror adjusting the investment programs inthe light of changing conditions of demand, implementation capacity andresource constraints. In addition, increased attention needs to be given tothe recurrent cost implications of past and new investment. There is a casefor financing more of these recurreat expenditures through cost recovery inpublic services. Cost recovery can also be improved by increases in interestrates for several credit programs (e.g. smallholder tree crops). Major publicutilities, such as PLN and Perumtel, should be able to finance a moresignificant portion of their investment costs from internally generated fundsand reduce their reliance on the government budget. In the case of PLN, thereis also considerable scope for increasing revenues through improvements inefficiency, for example by reducing the presently high transmission anddistribution losses.
xxxiii. As noted above, the composition of public investment also has asignificant impact on employment. Relative shifts toward less importintensive sectors, as reflected in REPELITA IV allocations compared withREPELITA III realizations, increase direct and indirect employment effects.There are many expenditure options with high economic rates of return that arerelatively labor intensive: for example, construction and rehabilitatioa oftertiary canals, rural roads, as well as regular maintenance ofinfrastructure. While the employment objective should not be the soledeterminant of sectoral investment priorities, care should be taken to protectlabor intensive activities in the event of resource constraints or a worseningof the employment situation. It would also be desirable to subject investmentproposals that require high investment resources per new job to specialscrutiny to ensure that they are economically justified. Public expenditures

- xix -
on transmigration programs have a significant impact on the employmentsituation. The sponsored transmigration program, together with associatedspontaneous flows, could provide employment for about 20% of the increase inthe labor force in Java. However, to prevent destabilizing second roundmigration flows, careful site selection and design of economic activity andclose co-ordination of investments in resettlements, tree crops,water-resource and livestock development are needed, in order to generatesustainable incomes for transmigrant families. This could lead todifficulties in achieving current targets.
External Capital Requirements and Borrowing Strategy
xxsiv. Under the base case scenario, Indonesia would require, on average,$5.2 billion annually in new commitments over the next three years to meet itspublic sector borrowing requirements. Official assistance (primarilyconcessional bilateral loans and grants and multilateral loans and grants frommembers of the Inter-Governmental Group on Indonesia - IGGI) has been the mostimportant source of external finance for Indonesia. Loan commitments fromthese sources amounted to about $2.1 billion in 1984, comprising $0.5 billionin bilateral concessional loans and $1.6 billion in multilateral loans. Inaddition, Indonesia received an estimated $110 million in grants from the IGGImembers. It is essential that IGGI members continue to provide a substantialshare of Indonesia's external financing requirements in the years ahead. Thisis particularly important because, given the expected deterioration in theexternal environment over the remainder of the decade, it would be inadvisablefor Indonesia to increase substantially its reliance on commprcial borrowing,in view of current real interest rates and maturities. It is, therefore,recommended that the level of IGGI assistance to Indonesia be at least $2.4billion in 1985/86 (the same level as recommended and pledged for 1984/85),and that the level of commitments over the next three years average at least$2.5 billion annually.
sxxv. A public sector borrowing program as outlined above implies anaverage growth of about 9% annually in the nominal value of outstanding publicdebt between 1984 and 1990, and a 7% increase during the first half of the1990s. Medium and long term private debt is expected to rise more slowly, sothat its overall share in Indonesia's total external debt would decline. Atthe projected levels of borrowing under the base case scenario, Indonesia'stotal debt-service ratio, including private debt, would peak at 24% in 1989.It would then stabilize and decline to 22% by 1995. Even under thealternative low oil price scenario, tighter macro economic management couldhold the total debt-service ratio to a peak of 26% in 1989 with a decline to23% by 1995. While debt service levels of these magnitudes are manageable forIndonesia, the uncertainties of the external environment mandate continuedrestraint in external borrowing. With prudent borrowing, maintenaance of acomfortable level of external reserves to guard against temporary strains onliquidity, concerted efforts to sustain a rapid growth of non-oil exports, andcontinued discipline in the public investment program, Indonesia should beable to retain its present high standing in international capital markets.

CHAPTER 1
RECENT ECONOMIC DEVELOPMEWTS
A. The External Setting and Adjustment: An Overview
1.1 Developments in the Indonesian economy in 1984 need to be viewedagainst the background of the previous two years, which were dominated byadjustment to the effects of the 1980-83 international recession. Therecession severely affected the Indonesian economy in two ways. First, theweakening of the demand for oil in 1982 - which led to the price and quotareductions of March 1983 - reduced Indonesia's gross oil and LNG exportearnings from nearly $19 billion in 1981/82 to $14.7 billion in 1982/83.Second, the demand for and the prices of the country's traditional non-oilexports (essentially agricultural commodities) declined, thus leading to afall In non-oil export receipts from over $6 billion in 1979/80 to less than$4 billion in 1982/83. The sharp reduction in total export earnings createdsubstantial pressures on the balance of payments, resulting in a currentaccount deficit of $7.1 billion (equivalent to 8.5X of GNP) in 1982/83,compared to a surplus of $2.2 billion two years earlier.
1.2 The Government rapidly perceived that (a) the underlying weakness ofthe international oil markets was not a temporary phenomenon, and (b) currentaccount deficits of the order experienced in 1982/83 could not be sustained.Accordingly, beginning in late 1982 the authorities initiated a set ofdecisive measures to cope with the immediate external payments difficultiesand to address the longer-term structural weaknesses of the economy. Thestabilization and adjustment measures included the adoption of an austeritybudget for 1983/84 (embodying a sharp reduction in subsidies, especially forpetroleum products); a major "rephasing" of the public investment program withanticipated foreign exchange savings of some $10 billion; and a 28Zdevaluation of the Rupiah vis-a-vis the US Dollar in March 1983. While thedevaluation was also expected to contribute to longer-term structuralimprovements in the economy, the authorities endeavored to increase domesticresource mobilization through a drastic overhaul of the tax system /1 and amajor reform of the financial sector, which freed up deposit and lending ratesof the state banks and removed credit ceilings. The Government also announcedits intention to simplify the regulatory environment, so as to increaseeconomic efficiency in both the public and private sectors.
1.3 These measures constituted a far-reaching response to the problem athand. Their effectiveness was significantly aided by the recovery in the U.S.and Japanese economies which got underway during the latter half of 1983 andgathered considerable strength in 1984. The gains were impressive on a broad
/1 The new income tax law went into effect in April 1984, but theimplementation of the value added tax (VAT) was delayed until April 1985 toallow for the completion of the necessary preparatory work - paras. 1.26-1.31.

- 2 -
front. Non-oil exports increased by about 37% to nearly $5.4 billion in1983/84. With stabilized oil and LNG earnings and total imports down by some12%, the current account deficit was reduced to $4.2 billion (6.0% of GNP) in1983/84. The overall fiscal deficit was reduced from 6.3% of GNP to 1.9% overthe same period. The financial sector reform and the restoration ofconfidence in the Rupiah following the March 1983 devaluation contributedsignificantly to financial savings mobilization. Time deposits in the bankingsystem increased rapidly by about 56% in the nine months following the June1983 reform which triggered a significant portfolio adjustment by individualsand businesses. GDP, aided by favorable performances in agriculture and thepetroleum/LNG sector, grew by an estimated 4.7% in 1983; inflation, asmeasured by the Consumer Price Index, was contained to an annual rate of 12%despite the sizeable devaluation and significant upward price adjustments forpetroleum, power and public transport.
1.4 Broadly speaking, 1984 has been a year of continued adjustment andconsolidation. The emphasis was on carrying through the difficult adjustmentmeasures initiated in 1983 and preventing backsliding on the major structuralreforms in the financial sector, taxation, and exchange rate management. Theperformance of most macroeconomic indicators was remarkably good. With stronggrowth in agricultural production, non-oil/LNG GDP is estimated to haveincreased by 4.4% in 1984 11, while domestic inflation moderated to 9%. Thecurrent account deficit was further reduced to $1.9 billion (2.4% of GNP) andIndonesia's net foreign exchange reserves rose to nearly $10 billion (7 monthsof imports). Government savings increased from 8.4% of GNP in 1983/84 to anestimated 9.8% in 1984/85. The impact of the budgetary operations was lessexpansionary than originally intended. While growth in rur2l incomes wasstrong, demand for manufacturing output was modest and construction activityfaltered in 1984.
1.5 The stresses caused by the stabilization and adjustment measures weremost evident in the manufacturing sector. Additions to production capacity,installed in earlier expectations of continued rapid growth in demand, layseriously underutilized. In addition, increases in input costs and debt-service obligations (in local currency) associated with the 1983 devaluation,and sharply higher domestic real interest rates fopiowing the June 1983reforms, eroded profit margins and inventories accumulated. These factors anduncertainties associated with the implementation of some of the new policies'for example, the tax reform) also affected private fixed investmentadversely. Further softening of oil prices and the strengthening of the USDollar in international financial markets created new uncertainties toward theend of 1984.
1.6 The remainder of this chapter reviews the recent economicdevelopments and policies in greater detail, while highlighting some of thenear and longer term issues which would need to be addressed to ensure thatthe momentum of development can be strengthened.
/1 On the basis of 1981 prices. The growth rate estimate for non-oil/LNG GDPon the basis of 1973 prices is 4.3%.

B. General Economic Trends
Availability and Use of Resources
1.7 Official data on income and expenditure for 1984 are not available.However, preliminary estimates have been prepared by World Bank staff, whichform the basis of the assessment that follows. Indonesia's gross nationalIncome (GNY) increased by an estimated 7.0% in 1984, reflecting a 6.52increase in GDP (in 1981 prices) and some modest improvement in the terms oftrade (para. 1.46). As noted below, over half of the growth of GDP in 1984stemmed from oil, LNG, and refining operations (para. 1.11). While this helpedto increase government revenues over budgeted levels, the authorities, in viewof the continued need for prudent macroeconomic and foreign exchange reservesmanagement, increased government financial savings with the banking system.Concomitantly, the external current account also improved by the equivalent ofover 3Z of GNP during the year (para. 1.41). Thus, total resourceavailability increased by only about 3.8%, reflecting the reduced net flow ofresources from abroad (Table 1.1). Effective domestic demand in real terms,as measured by aggregate expenditure flows (consumption and fixed investment),increased even less rapidly at the modest rate of 1.1 over 1983. The slowgrowth of effective demand was in part due to a substantial decline in privateinvestment; also the Government's net domestic expenditures as a ratio of GNPremained unchanged at their 1983184 level, with the result that there was norise in the stimulus to the economy, as had been intended by the budget.Government fixed investment expenditures increased slightly (by less than 1%)during 1984. At the same time, its current expenditures in real termsdeclined by 4X (Table 1.1). Although private consumption is estimated to haveincreased at 5.32 , this increase mainly took place in the rural economy(para. 1.8). Given the slow growth in demand in urban areas, particularly formanufacturing output, a substantial, largely involuntary, build-up ofinventories took place.
1.8 Total consumption increased by an estimated 3.82 in 1984 withdivergent movements in government and private consumption. Governmentconsumption expenditures fell, in large part because of reduced subsidies foroil. This reflected price increases (noted above) and a welcome reduction inPertamina's operating losses. On the other hand, private consumption grewabout one percent faster than in 1983. Given the rapid growth of agriculturalincomes (para. 1.13), this increase in consumption is likely to have takenplace mainly in the rural areas, while consumption in urban areas appears tohave stagnated or increased little. This is not surprising because: (a) theprice adjustments made over the past few years generally affected basic goodsand services which are consumed more in urban areas; and (b) incomes in thenon-oil economy outside agriculture grew rather slowly in 1984, as compared toboth 1982 and 1983. Moreover, profit margins in the industrial and tradingsectors were generally squeezed due to sluggish sales, high interest costs andmarket resistence to higher output prices. In the manufacturing sector, realwages remained under pressure due to low profitability and measures taken toavoid lay-offs through reductions in shifts, working hours and overtime; and,although a 15% wage increase was given to civil servants as of April 1984,this increase only compensated them partially after two years of erosion oftheir real incomes.

Table 1.1: EXPENDITURE AND SAVINGS RATIOS, 1981-1984
1981 1982 1983 1984 1982 1983 1984X of GNY in 1981 prices annual growth
rate (X)
Gross national income (GNY) 100.0 100.0 100.0 100.0 -1.3 2.4 7.0
External balance /a 3.3 9.1 5.4 2.3 - - -
Aggregate resourceavailability 103.3 109.1 105.4 102.3 4.2 -1.1 .3.8
Consumption 79.0 81.8 82.7 80.2 2.2 3.5 3.8Government 15.1 ;: D i4. -6.7 -1.1 -TiPrivate /b 63.9 67.5 68.9 67.8 4.3 4.4 5.3
Gross Investment 24.3 27.3 22.7 22.1 10.7 -14.7 4.0Changes in stocks .1 2. 0 3 3.7 -. 53T;!Fixed investment 22.2 24.4 22.2 18.9 8.5 -7.0 -9.0
Government (11.1) (13.5) (10.4) (9.7) (20.0) (-21.3) (0.5)Private /b (11.1) (10.9) (11.8) (9.1) (-3.0) (10.6) (-17.3)
Memo items (in percent):Domestic savings/GDY 23.9 22.1 23.0 25.0National savings/GNY 21.0 18.2 17.3 19.8
/a Current account balance, adjusted for terms of trade effect.7b Includes expenditures by public enterprises financed from sources outside
the Government budget.
Source: World Bank staff estimates. The estimates for 1984 are preliminary.
1.9 Available data suggest that fixed investment by the Governmentincreased slightly (less than 1Z) in 1984. Planned public sector investmentover the past two years was drastically reduced through the rephasing ofseveral major public sector projects. In addition, as discussed in Section Cbelow, the execution of the 1984/85 development budget fell short of thetarget (para. 1.25).
1.10 The quality of available data on private fixed investment is not verygood; but, a review of major subsectors in industry suggests that while weakmarket demand in the urban economy may have contributed to the decline inprivate investment, an even more important cause was the existence ofsubstantial excess capacity in many manufacturing subsectors (such as cement,automobiles, motorcycles, tires, various textiles, etc.) due to heavyinvestments made over the past decade, particularly since the 1979 oil price

increase. Clearly, past demand projections on which these investments werebased were overestimated; and the slackening of domestic demand exposed theweaknesses in these forecasts, and caused the overextension of theseindustries. A further deterrent to private investment was the rise ininvestment costs and funding difficulties experlenced by investors. As noted,the 1983 devaluation substantially increased the costs of imported capitalequipment and inputs and debt-service obligations on foreign currency loans,while the rising real costs of domestic borrowing strained the financialposition of many business firms. In addition, the availability of longer termfunds for invest mfent through the state banks, the development banks and thecapital market appears to hawe been reduced (paras. 1.57-1.60). Finally,uncertainties emanating from the implementation of new tax legislationevidently led to some postponement of investment decisions, as investorsadopted a 'wait and see- attitude pending the clarification and interpretationof the new tax laws./l
Growth ol- Domestic Output
1.11 Non-oilILNG GDP is estimated to have grown at an annual rate of 4.4.%(in 1981 prices) in 1984, or at about the same rate as in the previous year(Table 1.2). The agricultural sector recorded impressive gains, while outputin the Industrial sector as a whole recovered significantly, with aparticularly sharp increase in oil refinig operations. However, as noted inpara. 1.8, in mny industrial subsectors sluggish dome tic demand appears tohave been a major constraint to the absorution of increased output. (Givencontinued excess capacity and the lack of competitiveness of many products inexport markets, these developments raise important questions with regard toindustrial development strategy which are discussed in Chapter 3.) Activityin the construction sector stagnated (para. 1.18). In contrast, the oil/LNGsector grew rapidly, paced by a sharp expansion in LNG production. Thecompletion of the refineries at Cilacap, Ba^ikpapan and Dumal alsosubstantially expanded domestic refining capacity. Consequently, overall GDPis estimated to have grown by 6.5% (in 1981 prices) in 1984, with about 53% ofthis growth originating from oil/LNG/refining operations.
1.12 Growth in the agricultura' secto- in pr..isionally estimated to havebeen about 5%, mainly due to significant production increases in food crops,particularly rice, smallholder cash crops and the fisheries subsector. Therice crop is estimated at a record 2.5.8 million tons, i.e. 7% more than the1983 (previous peak) level. Compared to the situation ten years ago, thisrepresents an impressive increase of 68% - clear evidence that the Government'sstrategy of achieving self-sufficiency in rice has been rewarded.Availability and expanding use of key inputs (fertilizer, insecticides andgood quality seed), incentives provided through support prices, subsidies andbank credit for the purchase of inputs, and favorable climatic conditions
/1 The Government subsequently took actions to clarify these rules and reducethese uncertainties; and the simplification of the tax code and the reductionof tax rates should help to encourage investors in the future; see paras.1.26-1.31.

-6-
Table 1.2: GROWTH IN SECTORAL VALUE ADDED, 1982-1984(in percent p.a. at 1981 prices)
1982 1983 1984 Sectoral Share ofPrelim. shares increase inEst. in 1984 GDP in 1984
(Z of GDP) (in Z)
Agriculture 2.1 4.8 5.0 25.5 20.0Mining and quarrying -12.1 5.9 5.0 20.8 16.3
Oil (-15.7) (6.0) (5.6) (18.0) (WP'.8)Non-oil (3.5) (5.0) (1.0) (2.8) (3.5)
Manufacturing 3.1 3.1 24.4 12.8 41.3ING (9.2) (5.1) (52.6) (5.5) (_1.2)Refining (-2.9) (-10.5) (30.0) (1.3) (5.9)Other (0.8) (2.5) (4.7) (6.0) (4.2)
Construction 5.2 5.5 0.0 5.8 ('.0Services 5.5 4.3 4.0 35.2 22.3
Gross domestic product -0.2 4.7 6.5 100.0 100.0
Nou-oil/LNG GDP 3.8 4.4 4.4 76.5 52.9
Maeno item:GDP at constant
1973 prices /a 2.2 4.3 5.0
Non-oil/LNG GDP at constant1973 prices /a 3.6 4.2 4.3
/a Official statistics use 1973 as the base year for real GDP growthcalculations. The most important difference is the relative weightattached to the oil sector, which is much higher in 1981 than in 1973.As a consequence, changes in the level of oil output have a largerinfluence on overall growth at 1981 prices.
Source: World Bank staff estimates and BPS data.
contributed to the increase in rice production. Timely rains helped toincrease acreage under rice by about 5%, while average rice yields increasedby about 2% during the year. Favorable weather and support policies alsohelped to increase the production of secondary food crops such as corn, soya-bean and cassava. The production of cash crops by smallholders -
particularly tea, coffee, rubber and sugar - increased significantly during

the year; the first three export commodities continued to benefit from thestimlus of the 1983 devaluation and generally favorable export prices./l
1.13 As a result of the bumper rice crops of the past two years, BULOG -the state logistics board which operates the farm support price schemes - washolding rice stocks of nearly 2.5 million tons at end December 1984. Presentindications are that the 1985 rice crop will also be good. Given BULOG'spresently high stock levels, its capacity to procure and store substantialadditional quantities may be strained; and physical losses and financial costsof such operations are likely to be considerable. Large scale export of riceis not an economic proposition for Indonesia given the relatively high costsof production and low quality. However, with iuvestments aimed at improvingrice milling and grading facilities, it may be possible to export modestamounts of rice.
1.14 In the manufacturing sector, value added in activities other than LNGand oil refining recorded a 4.7Z increase, representing a significantimprovement over the growth rates realized in the preceeding two years.However, several subsectors performed poorly. As discussed below, therelatively weak performance of these subsectors is reflected in widespreadexcess capacity and poor financial results. There was a 302 increase in valueadded in the oil refining subsector, following substantial expansion ofdomestic refining capacity in 1984. When oil refining is included, valueadded in the manufacturing sector is estimated to have increased by about9% /2 in 1984.
1.15 As noted earlier, excess capacity in several industries is the resultof the recent completion of a large number of public and private investmentswhich were primarily directed at the domestic market and based on optimistic&-amand forecasts, coinciding with a sharp decline in economic activity. As aresult, capacity in some industries far exceeds domestic demand. Someexamples are: cement, where production capacity has risen from 5.8 milliontons in 1980 to an expected 17.4 million tons in 1985, compared with expecteddomestic sales of slightly above 10 million tons in 1985; and car tiremanufacturing, where installed capacity has risen from 2.7 million umits in1978 to an expected 6.7 million units in 1985, compared with anticipateddomestic demand of only about 4 m1ion units in 1985. Estimates by theMinistry of Industry show that in several other industries (for example,televisions, air conditioners, kraft paper, steel slabs, hot-rolled coils
/1 In the case of rubber, export prices reached a peak in early 1984 anddeclined thereafter.
/2 Excludes LNG.

- 8 -
and hand tractors) production ranged from 25-70% of capacity. Industriesparticularly affected by slack demand have been consumer durables, notablymotor vehicles and home electronic products. The building and constructionmaterials industry has been severely affected by the slowdown in constructionactivity. As a result of low capacity usage and continued sluggishness in thedomestic market, many manufacturers have begun to look abroad for markets, forexample in yarn, garments, steel rods, cement, tires and fertilizer.
1.16 Apart from the impact of excess capacity on unit costs, several otherdevelopments in 1983 and 1984 also contributed to rising production costs.These included the March 1983 devaluation, increases in domestic energy pricesand the sharp rise in real lending rates. Coupled with the inability ofmanufacturers to pass on cost increases to consumers given present marketconditions, this has weakened the financial position of some firms in a numberof industries. There are also indications of widespread lengthening ofmaturities for receivables which is proving costly to finance. These factorshave led to some failures in the textile and food processing subsectors, whilethe financial position of several firms in other subsectors is reported to beweak.
1.17 In contrast, several industries . particularly in the non-durableconsumer goods sector (such as matches, kretek cigarettes and batik)experienced good growth in 1984. In addition, the fertilizer and basicchemicals subsectors fared well with the recent completion or expansioa ofpublic enterprise plamts and increased demand from the agricultural sector forfertilizer and pesticides. Finally, the plywood and sawmilllng subsectorsregistered new export gains; but fierce competition among exporters of plywoodthreatened the survival of sereral small mills and prompted a governmentinitiative to organize joint marketing boards to protect the financialviabillty of the Industry and the country's foreign exchange earnings.
1.18 Growth in the construction sector was adversely affected by thedecline In Investment spending, although there were continued high levels ofactivity in building construction in Jakarta. Perform-nce in the servicessector (on which concrete data are not available) reflected the trends in themajor sectors noted above. The modern services sector comprising transport,communications and banking did well, the latter benefiting from the recentfinan cial sector reform. The traditional services sector also experiencedsome growth; however, weak domestic demand, slow growth in the industrialsector and the red-ction in non-oil imports adversely affected the tradingsubsector.
1.19 Oil and LNG value added, which accounted for about 23% of overallGDP, rose by 14% in 1984, mainly due to a 53% increase in LNG output. Two newtrains at Bontang, East Kalimantan were completed in 1983 with an additionaltwo trains at Arun In 1984. These raised LNG production to about 753 millionMMBTU in 1984 from 494 million MMBTU in 1983.

-9-
Inflation
1.20 Domestic inflation as measured by the Consumer Price Index for17 cities (CPI) abated in 1984; other indicators, such as the Wholesale PriceIndex (WPI) and the Essential Commodities Index for rural areas, also confirmthis trend (Table 1.3). On the supply side, increased agriculturalproduction, particularly the excellent rice crop, played a major part in thisimprovement; on the demand side, tight demand management policies alsocontributed. As noted below, the money supply (Ml) increased by 13% duringthe year, adding little to price pressures.
Table 1.3: RATES OF INFLATION, 1982-84(in percent p.a.)
CPI /a WPI /b Rural /cJakarta 17 Agri- Manufac- General Java & Outer
cities culture turing excl. Madura Islandsexports
1982 9.0 10.0 9.5 11.7 10.5 25.6 21.61983 11.1 12.0 18.2 17.5 19.8 10.0 11.01984 11.2 9.0 8.6 9.8 8.3 4.2 6.9
/a Consumer Price Index.75 Wholesale Price Index.TcW Combined index of wine essential commodities.
Source: Biro Pusat Statistik.
1.21 The rate of inflation during most of 1984 was in fact much lower thanthat suggested by the fizures in Table 1.3. Most of the rise in all threeprice indices took place in the first two months of 1984. The dominant causeof this spurt was the substantial (37%) increase in domestic oil prices InJanuary, and associated adjustments in electricity tariffs and transport fareswhich generally raised manufacturing, transport, and 'housing' costs in theseindices. In all three cases, as the bumper rice crop was marketed inApril/May, the food/agriculture components of the indices began to stagnate oreven decline; at the same time, the manufacturing components of the priceindices increased little as producers and traders, faced with weak demand andlarge inventories, refrained from raising prices and trimmed their margins.Thus, the point-to-point inflation rate from April to December 1984 was onlyabout 3% for the WPI and about 2-3% for the essential commodities index forrural areas. In the case of the CPI, the increase in the index for the twelvemonth period from end-March 1984 to end-March 1985 was only 3.6%.

- 10 -
C. Management of Government Finances
The 1984/85 Budget and Its Outcome
1.22 Given the major efforts by the authorities to adjust to adverseexternal developments in 1983, the budget was viewed as the most importantinstrument for further stabilization in 1984185. Thus, although Indonesia'sbalance of payments position had begun to improve and the external environmentappeared to be more promising, the Government adopted a cautious, mildlyexpansionary fiscal stance. The overall fiscal deficit was budgeted to risefrom 1.9% of GNP in 1983184 to 3.8% in 1984/85 and provide a modest stimulusto the domestic economy, with net domestic expenditures Increasing from 9.5%of GNP to 10.3% (Table 1.4)./1l A strong domestic tax effort and restraint oncurrent expenditures were expected to help prevent a sharp reduction in publicsavings over the 1983/84 levels.
1.23 However, the implementation of the 1984/85 budget fell short of thetarget. The budget outturn, as estimated by World Bank staff, indicates thatthe overall budget was in approximate balance. Government investment /2 roseby about 10% in nominal terms to an estimated Rp. 7.8 billion (compared to abudgeted Rp. 8.5 billion), whereas government savings increased by about 38%in nominal terms, from 8.4% of GNP in 1983/84 to 9.8% in 84185. As a result,government savings with the banking system are estimated to have increased byRp. 2.5 trillion in 1984/85. As a percent of GNP, net domestic expendituresamounted to 9.5% in 1984/85, largely unchanged from the level in 1983/84, butlower than the budget target of 10.3%. Thus, the 1984/85 budget's impact ondomestic economic activity was roughly the same as in the previous year, butless than had been intended by the budget.
1.24 The sharp rise in government savings was essentially the result ofthree factors. First, oil and LNG revenues are estimated to have been 19%above the 1983/84 levels. Second, non-oil revenues are also estimated at i2Xabove the previous year's level. Third, domestic oil subsidies declined byabout 45% in nominal terms primarily due to efficiency improvements inPertamina's refineries; this helped to restrain the growth of currentexpenditures to only about 4X over the previous year's level despite higherpersonnel expenditures.
/1 Net domestic expenditures measure the excess of government rupiahexpenditures over government rupiah revenues, and indicate the net effect ofthe Government's budgetary operations on the domestic economy. It is definedas: Domestic content of current and investment expenditures less domesticnon-oil revenues.
/2 Government investment expenditures referred to here and in Table 1.4 arecalculated by adjusting budgetary development expenditures for changes ingovernment savings with the banking system, the fertilizer subsidy and for therecurrent component of the development budget.

Table 1.4: SUMMARY OF GOVERNMENT FINANCES, 1982/83-1984/85 /a(Rp. trillion at current prices)
1982/83 1983/84 1984/85 /b 1984/85Budget /c
Total revenues 12.6 15.3 17.9 16.2Oil aad ING ah; 6 10.4Non-oil revenues 4.2 4.9 5.5 5.8
Current expenditures /d -8.3 -9.5 -9.9 -10.8of which:Interest on debt -0.7 -1.2 -1.5 -1.4Domestic oil subsidy -0.9 -0.9 -0.5 -1.1Fertilizer subsidy -0.4 -0.3 -0.7 -0.5
Government savings 4.3 5.8 8.0 5.4
Goverment investment /e -7.8 -7.1 -7.8 -8.5
Qyerall balance C- = deficit) -3.5 -1.3 0.2 3.1
Financed by:Net project and program aid If 2.7 3.6 2.3 3.1Asset drawdown a 0.8 -2.3 -2.5
Memo items (in percent):Total revenues/GNP 22.8 22.1 22.1 20.0Total expenditures/GNP 28.9 24.0 20.6 23.8Overall balance/GNP (-- deficit) -6.3 -1.9 0.2 -3.8Net domestic expenditure/GNP /h 15.4 9.5 9.5 10.3
/a Excludes provincial government finances.7- Provisional estimate.77 Based on Nota Keuangan (the budget document).7_ To arrive at current expenditures, routine expenditures are adjusted to
exclude amortization payments and include both the fertilizer subsidy andthe recurrent component of development expenditures.
/e Government investment includes both direct government investment andtransfers to public enterprises.
/f Net disbursements of external debt.A negative sign implies asset accumulation with the banking system.
Jh Net domestic expenditures is here defined as domestic content of currentand investment expenditures less non-oil revenues. See footnote 1 topara. 1.22.
Source: World Bank staff estimates.

-12 -
1.25 Provisional results indicate that the shortfalls in governmentinvestment expenditures in 1984/85 were substantial, particularly oneducation, transmigration and housing and water supply. Cumulative unspentbudgetary allocations are also substantial./l Transfers to the regions andlocal governments appear to be on target. However, a substantial proportionof these 'expenditures' actually represented unspent disbursements tokabupaten and village accounts; to that extent, in the short rnm they weremerely financial transfers, and the impact of the budget as implemented isprobably less than suggested by the data in Table 1.4 above.
The Tax Reform and Its Implementation
1.26 In late 1983 the Government announced a major reform of the taxsystem comprising a new income tax law and a procedural law which came intoeffect in January 1984, and a value added tax law which went into effect inApril 1985./2 The main objectives of the tax reform wereto: (i) reduce the heavy dependence of government revenues on oil and INGcorporate taxes by diversifying domestic receipts; (ii) improve the efficiencyof the tax system in terms of coverage and collection rates, and streamlinethe tax administration; (iii) improve domestic resource mobilization and raisethe buoyancy of tax revenues in relation to income growth; and (iv) enhancethe elements of equity and social justice in the tax system.
1.27 The new income tax law is a drastic simplification of the earlier taxcode. It replaces a complex set of tax rates with just three tax rates (15%,25% and 35%) applicable uniformly to individuals and companies alike./3 Othermajor revisions include: a reduction of the average tax rate and higherexemption limits for individuals; the withdrawal of tax holidays, fiscalinvestment incentives and provisions for indefinite carry-forward of lossesincurred in the first six years of operations (investors now benefit fromlower marginal tax rates and more generous depreciation allowances); andceilings on the extent to which interest payments and bad-debt provisionscould be deducted from income. The new law also places considerable emphasison withholding as a means of tax collection./4
1.28 A principal feature of the new procedural law is self-assessment oftax liability by the taxpayer, with tax authorities auditing a small selectionof returns. Other important features of the new system include a system of
/1 In particular, cumulative unspent budgetary commitments are large foreducation, transport and transmigration.
/2 The value-added tax law was originally scheduled for July 1984 but wassubsequently postponed to April 1985.
/3 Under the old law, tax rates ranged from 5% to 50% with 17 interveningrates. These rates were applied subject to various adjustments and credits.Furthermore, the rates and allowable deductions were amended annually.
/4 Thus, corporations are required to withhold 15% of domestic payments ofdividends, interest, rents and royalties, and 20% of foreign payments.

- 13 -
appeals and refunds, with specific time limits for government action, andlegal procedures for punishments and convictions.
1.29 The authorities envisage that a broader tax base and higher yieldswill augment tax revenues. To broaden the tax base, the Government announcedthat taxpayers registering by June 1985 could apply for a tax pardon for allpreviously underreported and undeclared income. According to the authorities,an estimated 820,000 individual and corporate taxpayers had registered byend-March 1984 (as compared to only 550,000 at the end of the previous fiscalyear /1) and this number is expected to reach 1,000,000 by end-1985. TheGovernment's efforts are also proving successful in increasing tax collections;although the new income tax law is barely a year old, revenue collections fromthe income tax in 1984/85 have exceeded those of the previous year.
1.30 Implementing an overhauled tax system has inevitably created a numberof problems and ambiguities. Most of these have been resolved, but some stillrequire clarification and/or modification. For example, the maximum allowabledebt-equity ratio for the purpose of interest expense deduction was initiallyset at 3:1 for all types of businesses. This has now been rescinded anddifferential ratios will be set to take into account financing patterns invarious sectors. In addition, the application of the provisions of the incometax law to new contracts in the oil sector needs clarification. Finally,there appears to be a shortage of qualified tax personnel to quickly clarifyor resolve problems that have arisen during the early phases of implementationof the new laws.
1.31 The major remaining task confronting the Government in implementingthe tax reform is the successful implementation of the value added tax and thesales tax on luxury goods. This represents a major overhaul of the existingindirect tax system, and implementation difficulties will inevitably arise.Judging by the experience of other (developed and developing) economies whichhave adopted VAT, it will take some time for the Indonesian economy to fullyadjust to, and assimilate the procedures and implications of, the new system.To expedite the process, the authorities have been undertaking a majoreducational campaign.
The 1985/86 Budget: A Shift in Expenditure Policy
1.32 Against the background of the slow pace of activity in some areas ofthe economy, the 1985/86 budget seeks to provide a fiscal stimulus withoutjeopardizing the hard-won recent gains in stabilizing the economy. Overallgovernment spending is budgeted at Rp. 21.3 trillion, representing a 20%nominal increase over the 1984/85 projected outturn; but revenues areprojected to rise by only 5% (Table 1.5). Consequently the cverall fiscalbalance is projected to change from an estimated surplus of 0.2% of GNP in1984/85 to a deficit of 2.9%; and net domestic expenditures to rise from 9.5%of GNP in 1984/85 to 11.0%. If the budget is implemented in full, there wouldbe a sizeable stimulus to the domestic economy.
/1 In 1980/81, less than 200,000 income tax returns were filed, of which 5%were correct assessments. Furthermore, over 40% of taxpayers who filed areturn in one year failed to do so in the next year.

- 14 -
Table 1.5: THE 1985/86 BUDGET /a
/b /b /c1984fM3 1984/85 1985/8 1984185 - 1985/86Budget Estimate Budget Nominal Real
(Rp. trillion at Growth Growthcurrent prices) % p.a.--
Total revenues 16.2 17.9 18.7 4.5 -3.1Oil and LNG U02 1 1.2 -9.7 -Non-oil 5.8 5.5 7.5 36.3 26.3
Current expenditures /d -10.8 -9.9 -12.8 29.3 19.7of which:
Personnel -3.2 -3.1 -4.1 32.3 22.5Regional transfers -1.8 -1.9 -2.6 36.8 26.7Interest on debt -1.4 -1.5 -1.8 20.5 11.1Subsidies -1.6 -1.2 -1.2 - -
Gov.e-nment savings 5.4 8.0 5.9 -26.3 -31.7
Government investment le -8.5 -7.8 -8.5 9.0 0.9
Overall balance (- deficit) 0.21 -8.t -2.6
Financed by:Net project and program aid /f 3.1 2.3 2.6Asset drawdown /& - -2.5 -
Memo items (in percent):Overall balance/GNP (- - deficit) -3.8 0.2 -2.9Government savings/GNP 6.7 9.8 6.5Net domestic expenditure/GNP /h 10.3 9.5 31.0
/a Excludes provincial government finances.7T From Nota Keuangan (the budget document).TW Compares the budget for 1985/86 with the estimate for 1984/85. Real growth
rates were calculated using a deflator of 8%./d To arrive at current expenditures, routine expenditures are adjusted to
exclude amortization payments and include both the fertilizer subsidy andthe recurrent component of development expenditures.
/e Government investment includes both direct government investment andtransfers to public enterprises.
If Net disbursements of external debt.a Negative sign implies asset accumulation with the banking system.fh Net domestic expenditures is here defined as domestic content of current
and investment expenditures less non-oll revenues. See footnote 1 to para.1.22.
Source: World Bank staff estimates.

- 15 -
1.33 In comparison to the 1984/85 budget, the budgetary expenditureallocations in 1985/86 represent a shift in expenditure policy. In view ofthe perceived need to provide a fiscal stimulus to the economy and the weakproject implementation performance in 1984/85, the authorities have allocateda larger proportion of the budget to current expenditures. Thus, for thefirst time, investment expenditures are budgeted below the level for routineoutlays. This strategy also addresses the need to keep foreign borrowingwithin prudent limits. When compared to the estimated 1984/85 outcome, theallocations for current expenditures represent a 29% nominal increase, andinvestment expenditures a 9% nominal (or about 1% real) increase. Even thismodest increase in budgeted investment expenditures may be difficult toachieve, unless there is some improvement in project implementation (seeparas. 1.37-1.40 below).
1.34 Current expenditures include an average increase of 20% in net civilservants' salaries, a large increase in government pensions and a further risein teachers' salaries. These Increases are expected to help develop a 'clearand authoritative" state apparatus by improving government employees' salariesand to compensate them for declining real incomes over the past three years.Despite these increases, civil servants' salaries will still not be abovetheir 1982 levels./l There are two other noteworthy features in routineexpenditures. First, external debt-service payments are expected to rise by17.6% in nominal terms over the 1984/85 outcome. Second, the domestic oilsubsidy is budgeted at Rp. 532 billion, roughly equal to the outcome for1984/85.
1.35 With regard to development expenditures, /2 the sectoral prioritiesin the new budget are similar to those in last year's budget. In accordancewith REPELITA IV objectives, education, transport and agriculture continue toreceive the highest priority (over 40% of budgeted development expenditures),closely followed by industry, power and transmigration (25%). The healthsector, which accounts for a small share of development expenditures, is theonly sector to receive substantial additional funds. The fertilizer subsidy,normally included as a component of the agricultural budget, is also expectedto rise by over 20% /3, although the price of fertilizer was raised by 11%from Rp. 90 per kg to Rp. 100 per kg in November 1984. Allocations ofdevelopment expenditures to regional and local governments are budgeted torise by 8.4%, with general and sectoral INPRES programs rising by 8.6% and
/1 The average annual real growth of civil servants' salaries in the 1977-85period has been only about 2.0-2.5%.
/2 For differences between the Government's development expenditures andinvestment expenditures, see footnote 2 to para. 1.22.
/3 This compares the 1985/86 budget with the 1984/85 budget allocations.However the fertiliser subsidy in 1984/85 is estimated at Rp 732 billion or60% above the budgeted level. Thus, the Rp 558 billion budgeted for 1985/86actually represents a 24% decline in nominal terms from the estimated outcomefor i984/85.

- 16 -
8.0X respectively. Meeting these targets will require considerableimprovement in project implementation performance of line ministries and localgovernments.
1.36 An important feature in the new budget is its emphasis on domesticresource mobilization. Non-oil/LNG revenues are budgeted to increase bynearly 36% (in nominal terms) in part to compensate for an expected decline inoil and LNG revenues from their 1984/85 level. The introduction of VAT aloneaccounts for one third of incremental non-oil revenues. Of the Rp. 1,666billion VAT target, about Rp. 531 billion are expected to be derived fromdomestic oil sales with another Rp. 358 billion from imports. These arereasonable targets, but the remaining Rp. 777 billion to be collected from thedomestic manufacturing and construction sectors appears ambitious,particularly in the first year of the new tax. The Government also expects toincrease collections from individual and corporate income taxes by 40%compared to 1984/85. Domestic revenues are expected to finance 88% of plannedexpenditures, with the balance coming from project and program aid.
Measures to Improve Project Implementation Performance
1.37 The implementation constraints on development budget expenditures,although partly related to limited capacity in the domestic constructionindustry and consultancy services, largely reflect continuing regulatory,procedural and institutional problems./l A problem area that particularlyaffects externally aided projects is procurement. Efficiency in procurementis a generally acknowledged objective, the benefits of which are lower costs,speedier implementation and consequently earlier realization of investmentreturns. However, the desire to utilize local material and services to themaximum extent, which also has worthwhile benefits, has tended to result inprotracted delays in finalizing contract awards and, in some cases, to highercosts and delays in their execution. This has been reflected, for example, inthe choice of higher cost local steel instead of imported steel, in slowprocurement caused by the efforts to find local contractors and consultants,and in slow implementation due to the limited capacity of local contractors.
1.38 The Government is well aware of, and concerned about, theseproblems. This concern has been expressed at the highest levels and, as aresult, a number of actions were taken during the past year to help alleviatethese problems. The first category of actions focused on the revision andissuance of decrees to establish new procedures to ease some of the proceduralbottlenecks. These new procurement and fund utilization procedures provideclear guidance on government procurement policies (KEPPRES 29 and 30). InNovember, 1984, the Government issued instructions to project agencies toclear all important procurement parameters with the government committee whichoversees procurement (Team 10), before discussing them with lending agenciesand/or issuing tender documents. This change is intended to avoid
/1 These problems were discussed in last year's economic report; seeIndonesia - Policies and Prospects for Economic Growth and Transformation,World Bank Report No. 5066-IND, April 26, 1984.

- 17 -
delays later on in the procurement cycle. Secondly, the Government organizeda number of meetings, workshops and discussions at department andinter-department levels and between senior officials, multilateral andbilateral agencies and project agencies on various aspects of implementationproblems. These meetings undertook a project-by-project review ofimplementation problems, evaluated progress, proposed solutions, andinstituted an implementation monitoring system with monthly progress reportsto BAPPENAS. Immediate attention was given to critical procurement items, andwhere budgetary provisions were inadequate in priority projects,authorizations were increased. A third set of actions focused on proceduresat the working level, particularly in finance and budgeting, with a view tosimplifying complex interlocking structures of procedures and practices whichhave developed over time. Initiatives in this area include: reiteration andclarification of procurement procedures; the preparation and dissemination ofa manual on budgetary procedures, and a course on the subject for projectmanagers; greater flexibility in adjusting implementation targets and fundsutilization within DIPs; budgeting for early acquisition of land at projectsites; and the revision of procedures for disbursement of funds for approvedand signed contracts (SK 395).
1.39 Other initiatives to improve project implementation are in progress.A committee chaired by the Minister for the Utilization of the State Apparatusis examining the complex problems of land acquisition with a view to makingappropriate recommendations. Billing rates for foreign and local consultantsare under review and, in the interim, the existing guidelines are beingapplied flexibly. Preparation of standard contract documents is under way.Registration of local consultants and the strengthening of the LocalConsultants Association (INKINDO) is in progress, as well as training andother measures to strengthen the local contracting industry with support fromthe World Bank.
1.40 It is too early to assess the full impact of the procedural changesand instructions outlined above, because of difficulties experienced byproject agencies In receiving, correctly interpreting and assimilatingchanges, particularly for projects initiated under previous procedures. Thegreatest difficulties occur in those areas where the instructions require orresult in the creation of new or additional institutional structures. Forexample, a new decree (KEPPRES 30) requires the establishment of procurementcommittees in each department and agency, through which all tenders valuedbetween Rp. 2UO million and Rp. 500 million must be cleared; and publicenterprises ate also now required to clear the procurement of items withinthis range with these department-level committees.
D. External Trade and Payments
Reduction in the Current Account
1.41 A key objective of the adjustment strategy since late 1982 has beento strengthen the external payments position. As noted earlier, substantialprogress in this respect was made in 1984/85 (Table 1.6). The current account

- 18 -
deficit was reduced to an estimated 2.4% of GNP, while official reservesincreased significantly both in absolute terms and in relation to thecountry's import bill. The measures taken by the Government since 1983 torestrain aggregate demand, the postponement of public sector projects thatwould need large imports, the slowdown of Government's investment expendituresduring the past year, and actions to increase non-oil exports by improving therelative profitability of exporting and through promotional activities allcontributed to Indonesia's success in strengthening its external paymentsposition last year.
Export Performance
1.42 Although Indonesia's oil export earnings have fallen somewhat overthe past two years as a result of declining crude and product prices,Indonesia was able to slightly increase its total 1984/85 export earnings innominal dollars over the previous year's level. This was because earningsfrom LNG and non-oil exports increased substantially in volume and valueterms. LNG exports increased by 37%, or almost $900 million, and non-oilexports rose by an estimated $500 million.
1.43 The expansion of non-oil exports over the past two years has beenbroad based. Exports of manufactures, in particular, doubled in value between1982/83 and 1984/85, with a large number of new items, such as ferrous and1.nr"-ferrous metal products and rubber products entering the export market forthe first time. The existence of excess capacity helped to increase exportssuch as tires and cement. In the case of primary products, such as tea andcoffee, and metAls (copper), the devaluation and continuing strong exportprices made exporting more attractive. The Government has also acted to avoida sigaificant erosion of the 1983 devaluation through a managed floatingexchange rate policy. However, the task has been a difficult one given therise in the U.S. Dollar against other major currencies.
1.44 However, the sharp increase in manufactured exports in 1983/84 (over80% in constant prices) slowed down to an estimated ;5% - still an impressiverate -- in 1984/85. Much of the increase in the value of manufactured exportsover the past year stemmed from plywood (where substantial new capacity cameon stream) and textiles, despite tariff and non-tariff barriers in a number ofindustrial countries. As noted, plywood exporters are now facing difficulties(para 1.17). The rest of the manufacturing export bL.se is still quite small;and although several subsectors have substantial excess capacity, these arenot competitive in export markets due to their relat: :ely high cost structure(see Chapter 3). The Government has very recently taken major steps to reducesome of these high costs through an extensive reform of customs and portsprocedures (discussed in paras 1.70-1.73 below). As part of its non-oilexport drive, the Government has also recently sought to expand market outletsby entering into trade agreements with several Eastern European countries.However, the potential benefits of these initiatives are yet to be realized.

- 19 -
Table 1.6: SUMKARY OF BALANCE OF PAYMEtTS , 1982/83 - 1984185Ct billion at current prices)
1982183 1983/84 1984/85Est.
Gross merchandise exports 18.6 19.8 20.20O1 and LNG 14.7 14.4 14.3Noa-oil/LNG 3.9 5.4 5.9
Gross imports of goods (cif) -20.6 -18.0 -16.0Oil and LNG -4.8 -3.8 -3.1Non-oil -15.8 -14.2 -12.9
Trade balance -2.0 1.8 4.2
Net non-factor services -1.7 -1.6 -1.6
Resource balance -3.7 0.2 2.6
Ne't factor services and transfers -3.4 -4.4 -4.5
Current accouat balance -7.1 -4.2 -1.9(- indicates deficit)
Net disbursements of public ML debt 3.1 3.7 2.2Net other capital /a 0.7 2.1 0.6Change in net official reserves 3.3 -1.6 -0.9
(-indicates increase)
Memo items :Total net foreign assets /b 6.3 8.4 9.9Net offifcial reserves /b 3.0 4.6 5.5Current account balance as x of GNP -8.5 -6.0 -2.4
la Includes estimated oil and ING export credits, all debt transactionsassociated with LNG expansion, direct foreiga investment, all privatecapital flows, and errors and omissions.
/b Net of outstanding drawings from the IMF's Buffer Stock and CompensatoryFinancing Facilities. These are treated as current external liabilities.
Source: Bank Indonesia and World Bank staff estimates.
1.45 Over the past two years, non-oil exports have made a significantcontribution to the reduction in the current account deficit. Following anexceptionally strong performance in 1983/84, non-oil exports are estimated tohave risen by a further 10 per cent in value, or by about $50O million, to an

- 20 -
estimated $5.9 billion in 1984/85. Since average prices of Indonesia'snon-oil exports appear to have declined by 2% over 1983/84 levels, theincrease in real terms is about 12% (Table 1.7).
Table 1.7: NON-OIL EXPORT PERFORMANCE, 1982/83 - 1984/85
$ million at % change % changecurrent prices current $ constant 1981 $
1982/83 1983/84 1984185/a 1983/84 1984/85 1983/84 1984/85
Primary commodities 2,400 3,080 3,230 28.3 4.9 5.4 5.2Timber 580 580 480 - -17.2 -18.2 1.5Rubber 610 980 990 60.7 1.0 10.9 5.9Coffee 360 510 530 41.7 3.9 10.4 7.6other agriculture 850 1,010 1,230 18.8 21.8 14.4 5.6
Manufactured exports 850 1,480 1,650 74.1 11.5 82.5 15.3Plywood 320 580 660 83.3 13.8 79.0 23.7Textiles /b 180 360 500 100.0 38.9 111.0 41.1Elect. appliances 110 130 160 18.2 23.1 20.5 26.9Other mmnufactures 240 410 330 /c 70.8 -19.5 94.7 -18.8
Metals and non-oilminerals 680 800 1,020 17.6 27.5 18.1 27.3
f.ta. 3.930 5,360 5,900 36.4 10.1 23.6 12.
Memo item : Non-oil 93.9 103.8 101.9export price index(1981-100)
/a Preliminary estimates.7- Includes handicrafts.7T7 Decline in 1984/85 was mainly due to reduced re-exports of items with
little domestic value added.
Source: Bank Indonesia and World Bank staff estimates.
1.46 Despite the brisk expansion of OECD output and demand in 1984, worldcommodity prices did not improve significantly and the World Bank's weightedindex of non-energy commodity prices rose by only one percent (from 90 to91)./l The strength of the dollar led to declines in the prices of some of
/1 1979-80 - 100

- 21 -
Indonesia 's dollar-denominated exports. Average oil export prices fell byabout 2Z during the year. Prices of some of Indonesia's major export productssuch as plywood, rubber and tin, registered sharp declines. There were,however, some bright spots, as coffee, tea, sawnwood and nickel prices rose.On balance the index of Indonesia's non-oil export prices declined somewbat.However, because of declines In the dollar prices of its imports, Indonesia'snon-oil terms of trade improved slightly during 1984.
Decline in Imports
1.47 Over the past two years, non-oil imports have declined by about 18Zin dollar terms, largely as a result of the stabilization and adjustmentmeasures adopted since late 1982, most notably the rephasing of public sectorinvestmpnt, the depreciation of the exchange rate, and restralnts on imports.As Table 1.8 indicates, more than 85Z of the decline in total imports has beenin the capital goods category and the balance mainly in food imports. Therephasing of public sector investment in May 1983 resulted in considerableforeign exchange savings in 1984/85. Moreover, slortfalls in governmentinvestment expenditures in 1984/85 had a particularly pronounced impact oncapital goods imports, as project aid-financed imports were reduced. In thecase of food items, the decline in 1984/85 was due to a reduction in riceimports by about $200 mtllion, as increased domestic rice production obviatedthe need for imports. Although the dollar value of intermediate goods importsfell slightly In 1984/85, there was a small increase in real terms, mndicatingthat imported inputs for domestic production have not been as affected.
Table 1.8: NON-OIL IMPORTS, 1982/83 - 1984/85
$ million at Z change Z changecurrent prices current 5 constant 1981 $
1982/83 1983/84 1984/85 /a 1983/84 1984/85 /a 1983/84 1984/85 /a
Consumer goods 1,820 1,660 1,520 -8.8 -8.4 -11.0 -8.2(Food) (1,270) (1,130) (940) -(11.0) -(16.8) (-15.0) (-15.9)(Non-food) (550) (530) (580) -(3.6) (9.4) (0.7) (10.7)
Intermediate goods 4,860 4,660 4,600 -4.1 -1.3 0.1 1.5Capital goods 9,140 7,920 6,750 -13.3 -14.8 -9.5 -12.3
Total 15,820 14,240 12,870 -10.0 -9.6 -6.8 -7.3
Price index 96.0 92.8 90.4(1981=100)
/a Preliminary estimates.
Source : World Bank staff estimates.

- 22-
Rising Import Restrictions
1.48 There is some evidence to suggest that trade policy interventionshave also reduced imports in some product groups. Since 1982, the Governmentmade greater use of existing policies on import controls to protect themanufacturing sector from international competition in a slowly growingdomestic market. This has been particularly evident in two instances. First,there has been an increase in the number of categories of goods subject toquantitative restrictions and import licensing requirements. In 1983, theDepartment of Trade issued decrees requiring that some products (iron andsteel, paper, food and drinks, and road tires and tubes) could only beimported through state-owned trading companies; in addition, decrees wereissued imposing quantitative restrictions on a number of products. In 1984,the list of goods subject to import licensing requirements and quantitativerestrictions was further expanded./1 Second, the Government pressed aheadwith the promotion of several engineering industries by imposing quotas oanimports of assembled engLneering products and, with a view to Increasing localcontent, introducing a program of progressive reductions in component importsthrough import bans. This approach, which had earlier been applied toautomobiles and motorcycles, was extended in the past two years to dieselgenerating sets, heavy equipment parts, ear thmDving machinery, tractors and,more recently, machine tools. Thus, although the share of items subject toimport restrictions in Indonesia's imports has been small, recent events showa strong trend towards a greater number of controlled items./2 However, insharp contrast to these trends, the Government also introduced a major tariffchange in April 1985, which reduces the level of nominal tariff rates andnarrowed their dispersion (see Chapter 3).
Capital Inflows
1.49 Indonesia has enjoyed continued access to the international capitalarkets on favorable terms. In order to limit public sector borrowing abroadand protect Indonesia's creditworthiness, the Government in October 1984imposed a ceiling of $1.5 billion on total public sector export credits to becontracted in 1984185. Moreover, such financing will be available only forthose development projects which will be deemed eligible by the Government,and will be used to procure supplies in an effieient manner.
11 The additions include plastic basic materials, iron or steel pipe Joints,oriented polypropylene film, additional categories of heavy equipment andspare parts, a further 77 electronic products, steel sheets, hot and coldrolled coils and plates, cyclamate and explosives for commercial industries.
/2 in addition to the restrictions noted above, as part of the Government'spolicy of developing the domestic shipbuilding industry, imports of new orsecond-hand ships are now banned.

- 23 -
1.50 In 1984, Indonesia obtained $1.5 billion of new commitments forpublic sector borrowing from overseas commercial banks 'With commitments ofimport related credits (31.0 billion) and development assistance by the IGGI(*2.1 billion), total public sector commitments during the year amounted to$4.6 billion. In addition, Indonesia received about $110 million dollars ingrants from IGGI members. In 1984/85, gross disbursements declined to$3.8 billion compared with $5.0 billion in the preceding year, partly as aresult of slower than planned rates of project implementation, and thecontinued effects of project rephasing. In February 1985, Indonesia repaidSDER 115 million to the IMF under the ter= of the Buffer Stock and theCompensatory Financing Facilities.
1.51 In 1983, following the devaluation and ;'ncreased confidence in theRupiah, there was a significant reflow of private funds; the exact magnitudeof this reflow is difficult to gauge, given Indonesia's liberal foreignexchange policies. However, this reflow appears to have tapered off in 1984.Indonesia's net official reserves Increased by t0.9 billion during the fiscalyear to reach $5.5 billion at the end of March 1984. The net foreign assetsof the banking system as a whole rose to about *10 billion, or 7.4 months oftotal imports of goods.
E. Monetary and Credit Developments
1.52 The financial sector reform of June 1983 is an important elemnt ofthe Government's adjustment strategy. It is viewed as a major instrument forIncreasing financial savings and encouraging the evolution of an efficientfinancial system over the longer term. The reform has already had beneficialeffects on financial sector development. Nevertheless, several transitionalaspects, discussed below, need to be addressed further to enhance the sector'scoontribution to growth and development.
1.53 The improvement in the balance of payments, noted earlier, helped tosignificantly increase net foreign assets held by the banking system.However, the monetary consequences of this increase were almost c-apletelyoffset by a rise in net government depoqite with Bank Indonesia. Bank creditto the private sector increased sharply, at an annual rate of 34%(Table 1.9). But, since credit growth to public enterprises was kept down to42, and time deposits with banks increased rapidly following the reform, moneysupply (Ml) Increased at the rate of 13%, somewhat below the increase innominal GDP. Broad money (W2), however, increased by 22%.

- 24 -
Table 1.9: CHANGES IN FACTORS AFFECTING MONEY SUPPLY AND LIQUIDITY, 1982-84(Rupiah billion)
Annual Growth In ZChanges in 1982 1983/a 1984 1982 1983 1984
Net foreiga assets -1,528 3,031 2,767 -23.0 59.1 33.9Net government deposits 530 -1,293 -2,471 -11.7 32.3 46.6Credit to public enterprises 732 61 190 17.2 1.2 3.8Credit to private sector 2,218 2,371 3,646 36.4 28.5 34.1Net other assets -593 -582 -858 - - -Time & saviugs deposits /b -723 -3,140 -2,262 22.4 79.4 31.9
Money supply (MI) 636 448- 1,012 9.8 6.3 13.4Currency (377) (399) (379) (14.7) (13.6) (11.4)Demand deposits (259) (49) (633) (6.6) (1.2) (14.9)
Domestic liquidity (M2) 1,359 3,588 3,274 14.0 32.4 22.3
Memo item:M27GDP ratio 18.2 19.9 20.8
/a Includes changes resulting from the exchange rate adjustment on March 30,1983.
/b Includes foreign currency deposits.
Source: Bank Indonesia.
Deposit Mobilization
1.54 Considerable progress has been made in the past 18 months towards theobjective of increasing deposit mobilization by banks; rupiah time and savingsdeposits held by banks increased by 74Z in the year following the reform(Table 1.10). The sharp rise In nominal and real deposit rates, whichfollowed the reform (see below), led to a shift in the asset preferences ofindividuals and enterprises from demand deposits and currency to timedeposits. In addition, renewed confidence in the Rupiah (which led to somereflow of capital), the modest rate of domestic inflation, a strong foreignexchange reserve position and, finally, favorable tax treatment on interestincome /1 all helped increase time and savings deposits. As a result, theratio oTfbroad money to GDP, at current prices, increased from 18% in 1982 toabout 21Z in 1984 (Table 1.9).
/1 Interest income from time deposits with maturities of one nonth and longerare exempt from income taxes for an unspecified 'temporary- period.

- 25 -
Table 1.10: GROWTH OF BANK DEPOSITS, 1983-1984(Rupiah billion)
1983 1983 1984 1984 Nominal GrowthJune Dec. June Dec. Jun 83- Jun 84-
Jun 84 Dec 84-% p.a.-
Demand deposits 4,148 4,177 4,095 4,817 -1.3 35.3Time & savings deposits 3,344 4,694 5,831 6,387 74.4 19.1
State banks /a (1,531) (2,593) (3,132) (3,228) (104.6) (6.1)Private banks/a (780) (1,072) (1,421) (1,744) (82.2) (45.5)
Foreign currency deposics 2,044 2,289 2>398 2,944 17.3 45.5
Total deRosits - all banks 9536 1L160 123?4 14J48 29.2 2
/a Rupiah time deposits.
Source: Bank Indonesia.
1.55 In the last six months of 1984, the growth of rupiah time and savingsdeposits slowed down to an annual rate of about 19%, while growth of foreigncurrency (dollar-denominated) deposits accelerated sharply to an annual rateof 46%. Some slowdown in rupiah time deposits was to be expected as portfolioshifts are essentially completed. The pronounced shift from rupiah timedeposits to dollar-denominated deposits was, however, probably due toexpectations of continued depreciation of the Rupiah against the US Dollar,given the softening of oil prices and the strengthening of the Dollar abroad.
1.56 The changing pattern of deposit growth is a potential source ofpressure on bank liquidity and domestic interest rates. Indonesian banks, forreasons of risk aversion, generally redeposit foreign currency depositsabroad; therefore, these funds are not usually available for domesticlending. The slowdown on rupiah deposit growth may thus put pressure ondomestic lending rates; it may also make it difficult for private banks tomobilize additional resources to repay maturing liquidity credits and shortterm loans from Bank Indonesia. The authorities are aware of this problem andhave already taken some actions to deal with it (paras 1.64-1.67).
Credit Availability
1.57 The rapid growth of deposits following the reform enabled banks toincrease credit by 23% during 1984, with credit to the private sectorrecovering strongly (Table 1.11). Private and foreign banks, increased theircombined share of total bank credit from 15X in March 1983 to 22% in December

- 26 -
1984. However, the lending by state banks did not pick up from the previousyear's re-duced levels. The state banks now seem less disposed to provide termlending A1, given their reduced access to Bank Indonesia's liquidity credits.As a result, approvals aad disbursements of term loans for Investment havedeclined noticeably since June 1983 (Table 1.11). Finally, as state banksaccumulated excess liquidity in the early part of 1984, private banks borrowedthese funds to expand their lending and a sizeable inter-bank money marketdeveloped.
Table 1.11: GROWTH OF BANK CREDIT, 1981-1984(percent change per anmum)
1981 1982 1983 1984 1983 1984 1984June - Dec. /a Jan.-June Jul.-Dec.
Total bank credit 29.0 28.5 17.5 23.0 23.3 21.7 21.9State banks 36.7 36.6 Zl.9 ]2" =ii:T li.: 19.6Private banks 47.3 43.5 57.4 61.6 69.5 60.7 47.8Foreign banks 32.4 21.5 29.3 21.3 53.9 41.3 1.3
Investment creditDisbursed andoutstanding 37.4 42.7 33.9 22.0 26.7 21.2 20.5
New approvals 34.4 41.1 38.4 15.1 29.4 5.4 24.2
Memo items:Total bank credit to:Public enterprises 16.2 17.2 1.2 3.8 12.7 -9.2 17.5Private sector 40.4 36.4 28.5 34.1 25.4 37.2 26.0
/a Change over end-May 1983, as the financial sector reform became effective onJune 1, 1983.
Source: Bank Indonesia.
/1 State banks (including BAPINDO) provide almost all of the term lending at-present. As of December 1983, state commercial banks provided 76X of loanswith maturities of over 3 years and BAPINDO another 18%.

- 27 -
1.58 - The deceleration of the state banks' term lending may also in part bedue to depressed demand for term loans. As discussed above, private fixedinvestment has fallen (para 1.11). High real interest rates which emergedwith the rise in nominal rates and the deceleration in the domestic inflationrate over the past year have probably contributed to low investment activity.(Real interest rates on state banks' term loans are now about 10 p.a.compared to -6% in early 1983 and real interest rates on short term workingcapital loans now range from 10-15% p.a. for state banks and 15-20% forprivate banks - Table 1.12). In addition, state banks have become lesswilling to provide term loans, given the increased cost of funds and increasedexposure to loan risks in the current economic situation. Fi-idlly, it appears
.that the 18% term lending rate of the state banks is not sufficient to coverthe increased costs and risks of term lending.
1.59 Much of the recent credit growth has taken the form of short termworking capital loans to the industrial, trade and services sectors. A partof the credit growth has probably been used for financing involuntaryinventory accumulation and for additional working capital, in view ofincreasing delays experienced by many firms in the industrial and tradesectors in regard to repayments of trade credits by their customers. Inaddition, the sharp increase in interest rates (discussed below) has increasaddebt servicing requirements of borrowers. These developments call for closermonitoring of credit use and more effective banking supervision by theauthorities to avoid potential portfolio problems for weaker banks.
1.60 The developments in the financial sector since June 1983 have alsoaffected the availability of long term funds for investment from thedevelopment banks and the capital market. Development banks are now faced,with funding problems as they find it difficult to attract low cost funds fromthe market, given their portfolio problems and the high commercial bankdeposit rates. This last factor and the favorable tax treatment of bankdeposits have also eroded the attractiveness of the capital market. Sinceinterest and dividend income from capital market instruments are nottax-exempt, companies need to offer gross yields of at least 28-30% p.a. topotential holders of capital market instruments to provide returns comparableto those on bank deposit3; at these rates it is no longer attractive tocompanies to raise funds from the capital market. (These issues are discussedin Chapter 3 below.)
Interest Rate Developments
1.61 An important consequence of the financial sector reform has been therise in domestic deposit and lending rates. Initially there were someexpectations that deposit and lending rates would come down as state banksaccumulated more deposits and adjusted to the new competitive environment.However, this has not happened; indeed deposit and leLding rates in Indonesiaincreased further, particularly in the second half of the year (Table 1.12).

- 28 -
Table 1.12: INTEREST RATES OF COMMERCIAL BANKS, 1981-1984(percent per annum)
1981 1982 1983 1983 1984December December March December December
Nominal deposit rates /aState banks 10.2 8.6 9.5 14.8 17.1Private banks 17.4 17.1 17.4 17.4 20.7
Real deposit rates /bState banks 2.7 -1.3 -3.2 2.5 7.4Private banks 9.4 6.5 4.8 4.8 10.7
Nominal lending rates /cState banks 13.5-21 13.5-21 13.5-21 17-23 18-24Private banks 16-28 16-28 16-28 18-28 24-30
Real lending rates IdState banks 5-13 3-10 (-)6-1 (-)2-3 1D-15Private banks 8-20 5-16 (-)4-8 (-)2-8 15-20
/a Nominal rates on 3 month time deposits.7b Deflated by the Consumer Price Index for the relevant year.Tc Nominal rates on working capital and term loans.7d Deflated by the Wholesale Price Index for the relevant year.
Source: Bank Indonesia and World Bank staff estimates.
1.62 The June 1983 reform eliminated restrictions on domestic depositrates in Indonesia. As a result, and given the open capital account, domesticinterest rates are now more closely related to interest rates abroad and theexpected rate of depreciation of the currency. Generally domestic nominaldeposit rates were in line with interest rates abroad and the rate ofdepreciation of the Rupiah vis-a-vis the US Dollar until about mid 1984.However, in the second half of the year, the rapid appreciation of theUS Dollar against other currencies and the softening of oil prices appears tohave adversely affected domestic market expectations. This in turn seems tohave increased the premium required for holding rupiah deposits and thedifferentials between domestic deposit rates and those abroad (see below).Finally, given these high deposit rates, the relatively high intermediationcosts of Indonesian banks have raised domestic lending rates in Indonesiaabove international lending rates adjusted for the market operations currencydepreciation.
1.63. Against this background, the tightening of money market conditions inIndonesia due to domestic developments put further pressure on interest ratesin the second half of 1984. An unexpected build up of net Government depositswith Bank Indonesia of some Rp. 1.8 billion took place during March-August1984. This led to a tightening of reserve money (which declined by about 4%

- 29 -
over the same period) and bank liquidity, at a time when the private bankscontinued to expand credit rapidly, borrowing large amounts from the inter-bankmarket. At the same time the demand for funds in the inter-bank marketincreased sharply. The Indonesian authorities, in an effort to maintain thecompetitiveness of the Rupiah in view of the strengthening of the US Dollar ininternational aarkets, allowed the Rupiah to depreciate at a somewhat fasterpace during July-August than they did earlier in the year./l This, given thedevelopments discussed in para 1.62, heightened expectations of a sigtificantdepreciation of the rupiah and led to speculative portfolio shifts;consequen:ly, inter-bank rates rose to about 80-90 p.a., and in turn putpressure on deposit and lending rates. Although actions by the authorities(para 1.66) eased bank liquidity, domestic deposit and lending rates are stillabove their pre-August 1984 levels.
Monetary Control and Management
1.64 These developments have highlighted the need for continuedflexibility on the part of the authorities in managing the growth of reservemoney and bank liquidity, and for closer coordination of monetary and fiscalpolicies in order to ensure orderly market conditions. As the Septemberepisode in the inter-bank market demonstrated, the Government's fiscaloperations can lead to significant shifts in bank liquidity and put pressureon interest rates. Hence, offsetting actions by the monetary authorities arerequired. Bank Indonesia is aware of these needs and has already takenseveral steps during the past year to deal with the changing priorities ofmonetary management.
1.65 An initial concern of the authorities in early 1984 was how to mop upprevailing excess liquidity of banks, given the lack of government paper andother securities for conducting open market operations. Accordingly, inFebruary 1984 Bank Indonesia introduced Bank Indonesia certificates (SBIs)with 15-90 day maturities aimed at absorbing excess liquidity. Thesecertificates are issued weekly and carry interest rates determined on anauction basis. However with the tightening money market conditions later inthe year, the stock of SBI's reached only Rp. 369 billion by end 1984. BankIndonesia also introduced two new discount windows, at market rates, inFebruary 1984: a standard lender of last resort window with basic access for atwo-week period to assist banks in day to day management of funds, and a longterm window providing credit for two to four months to encourage termlending. These facilities, however, were little used, as the banks werestrongly encouraged to resort to the inter-bank market first beforeapproaching Bank Indonesia.
1.66 As market conditions tightened, Bank Indonesia set up a temporary"special facility' in September to provide liquidity to banks at market rates;this was used by several private banks who borrowed about Rp. 300 billion.Bank Indonesia also limited each private bank's borrowing from the inter-bankmarket to 7.5% of deposit liabilities; and to halt the speculation against theRupiah, slowed down the rate of managed depreciation of the currency.
/1 In 1984, the Rupiah depreciated by 8% against the U.S. Dollar.

- 30 -
These measures succeeded in improving bank liquidity and calming down theinter-bank market. Subsequently, as net government deposits with BankIndonesia continued to increase, Bank Indonesia increased its lending to banksto ensure adequate liquidity.
1.67 More recently, Bank Indonesia announced a new instrument - MoneyMarket Securities (MMS) - in order to inject liquidity into the banking systemby purchasing promissory notes -from banks and non-bank financialintermediaries (NBFIs). Under this new scheme, which became effective onFebruary 1, Bank Indonesia will buy MMS directly from banks and NBFIs orthrough designated security houses (presently FICORINVEST only). Three typesof MMS are eligible for discounting: promissory notes issued by banks andN4BFIs in borrowing from the interbank market; those issued by customers ofbanks and NBFIs based on lines of credit from such institutions; and tradebills based on underlying transactions issued by third parties and endorsed bybanks and NBFIs. The MMS have a maturity range of 30-90 days, while thediscount rate is set by Bank Indonesia according to market conditions; (atpresent, the discount rate on MMS is 20.5% p.a.). There is evidence that thenew scheme has already had a major salutary effect on money market conditionsby providing banks and NBFIs access to Bank Indonesia resources at marketrates and by encouraging direct trading among banks themselves. As ofend-March 1985 total net purchases of MMS made by Bank Indonesia andFICORINVEST stood at Rp 205 billion, mainly from private banks and foreignbanks.
1.68 As discussed, monetary and credit developments during the past yearhave highlighted a number of issues, some of which have been already addressedby the authorities. Others, such as the high real cost of credit and thereduced availability of term lending, could be ameliorated throughinstitutional and efficiency improvements discussed in Chapter 3 below. Inaddition, the authorities will need to monitor closely the monetary impact ofthe Government's fiscal operations and developments with regard to the growthof rupiah time deposits of banks noted earlier, in view of their possibleimpact on bank liquidity and interest rates.
F. Progress Towards Deregulation
1.69 While the Government's macroeconomic strategies have met withconsiderable success, it has recognized the need for actions at the sectoraland subsectoral levels as key elements of the adjustment process over thelonger term. In particular, significant improvements in the regulatoryframework and reductions in the structure of domestic costs are essential tothe development of an efficient, competitive and dynamic industrial sector inthe medium to long term. The use of extensive, and often contradictory,licensing and regulatory requirements has impeded private sector activity inthe past, particularly in the manufacturing sector. Similarly, complexregulations which govern customs procedures have entailed considerable delaysin the clearance of imported goods through the ports, impeded the flow ofnon-oil/ING exports and generally added to costs. In addition, transport

- 31 -
costs, which are currently high in Indonesia, have been an important elementof high costs. The maritime transport system is particularly costly owing tothe cumbersome port and customs precedures noted above, regulations governingshipping services, the system of shipping route allocation, limited managerialmanpower for port operations, underutilization of available ship capacity mnddeteriorated port structure. These problems have been long-standing anddeep-rooted, given the large and powerful bureaucracies which have evolved inthe customs and port operations. The Government is fully cognizant of theseproblems, and has taken major steps very recently to deal with them.
Simplification of Investment Procedures
1.70 With respect to private investment licensing, effective April 1,1985, the Government simplified procedures for approval and implementation ofinvestments. First, in the case of new investment projects, it is no longermandatory to obtain temporary approval. Applications which are complete cannow be considered for "permanent approval" (in the case of new domesticinvestments) and for "Presidential approval" (in the case of new foreigninvestments) without first requiring temporary approval. Second, the maximumperiod within which BKPM approval has to be given to such projects has beenreduced to six weeks, compared to a minimum of three months earlier. Third,the application forms for new investment, as well as for expansion, projectshave been simplified and reduced in scope. Finally, a number of requirementswhich had to be fulfilled earlier before submission of an application to theInvestment Coordinating Board (BKPM) or for obtaining temporary approval havebeen eliminated. These changes are expected to simplify the approval process,reduce the frequency of communications between BKPM and potential investors inobtaining investment approvals, and expedite the approval process. Underliningthe increased focus on the promotion of investment, a major internalreorganization of BKPM has recently been effected.
New Customs Regulations
1.71 In order to reduce excessive regulation and bring down costsassociated with customs and ports operations, on April 4, 1985 t1.e Governmentannounced, through the Presidential Instruction No. 4 on Ports and Shipping,bold, far-reaching and sweeping reforms. This decision was followed shortlythereafter by a full set of implementing instructions/decrees/regulations.These reforms profoundly affect all aspects of foreign trade procedures,particularly customs, ports and shipping operations.
1.72 In regard to customs, the new measures drastically reduce therequired import and export procedures to a bare minimum (i.e. importcertification report by a Government appointed surveyor, bills of lading andproof of payment of duty). Export goods are no longer subject to regularcustoms inspection; exports subject to export certificates, however, will beinspected by Government-appointed surveyors at the ports of destination.Imports, on the other hand, will be inspected at points of origin byGovernment-appointed surveyors, who would also certify type, quality andvolume of goods, prices at points of origin, tariff category and appropriateimport tariffs. Under the new procedures, the involvement of the Indonesian

- 32 -
customs will be limited to ensuring that documents noted above are completed,and cargo wlll be promptly released from Indonesian ports. Assessment ofimport duties and other taxes will now be made by importers/exportersthemselves (on the basis of surveyors' certification), who will make dutypayments to designated banks. The new regulations thus provide for speedyrelease of cargo, simplification of document processing and improved valuationprocedures, and should result in savings of cost and zime.
Improvements in Ports and Shipping
1.73 The various instructions related to port operations seek to ensurefair and equal treatment to all ocean-going vessels, simplify tariffs andreduce port charges. With res,pect to port charges, a multiplicity ofprevailing charges (e.g., piloting, mooring, stowing, small-boat,harbour-master fees) are to be simplified or eliminated, while other chargessuch as loading and destination port charges and storage charges at portwarehouses are to be reduced. To improve cargo-handling, responsibility forunloading/loading operations on a three shift 24 hour basis will betransferred, within one year, from shipping companies to firms established forthis purpose. Port labor wages will be increased and stevedoring feesreduced. To facilitate foreign trade, the General Agency certificate requiredfor foreign flag vessels to call at Indonesian ports has been abolished andother related procedures greatly simplified and reformed. To facilitateinter-islands goods transport, the various requirements imposed oninter-island freighters such as inter-island freight documents, fiscalstatements and tax-payment receipts in respect of such vessels are also beingremoved. To improve handling of goods and documentation, such functions nowcan be undertaken not only by appointed clearing agents but also by forwardingcompanies, importers and exporters themselves. Finally, the PresidentialInstruction also vests more authority in the newly established PortAdministrators who are expected to coordinate and improve port operations. Inthe main ports, the Administrators will be responsible for all port-relatedservices and report directly to the Minister of Communications.
1.74 The drastic and far-reaching nature of the reforms proposed are aclear indication of the Governments 's determination to remove administrativeand procedural impediments to achieving a smoother flow of goods (imports aswell as non-oil/LNG exports), reducing costs and increasing efficiency inmaritime operations. The implementation of these measures will be a majorchallenge; but given time and the Government's commitment to the reform, thereis little reason to doubt that significant progress is likely to be achievedin improving customs and ports operations.

- 33 -
CHEPTER 2
DEVELOPMENT OBJECTIVES AND PROSPECTS
2.1 This chapter presents the main elements of the macroeconomicframework employed in the report for assessing Indonesia's immediate andmedium term prospects. The analysis begins with an overview of the externalenvironment confronting Indonesia and its implications for macroeconomdcmanagement in the medium term. Section B examines the medUum term prospects,against the background of these external conditions. Section C discusses theimplications of the analysis for Indonesia's external trade. Finally, thechapter concludes with a discussion of Indonesia's external capitalrequirements, in the light of the preceding analysis.
A. The External Environment and its Implicati4:ns for Macroeconomic Management
Introduction
2.2 Indonesia's ability to achieve its goals of sustainable growth withequity in the coming years will depend crucially on the skill with which itmanages its transition from oil dependency toward a more diversifiedsemi-industrialized economy. The current magnitude of Indonesia's reliance onoil and LNG resources means that only modest progress can be expected in thePresent decade. Nevertheless, the economic strategy pursued over the aextfive years will in large measure determine its ability to make significantProgress in this area in the 1990s. In order to bring out these issues moreclearly, the present chapter explores the prospects for the economv in thecontext of a ten-year horizon.
2.3 The current uncertainties in the oil market again underscore thevulnerabiMlty of the Indonesian.economy to changes in international oilprices. This factor has to be taken into account, particularly in terms ofexternal debt management. Borrowing strategy over the next few years has torecognize that there is only limited scope for increasing externalindebtedness. Providing bo--rowing levels - particularly in the next few years- are kept within prudent levels, Indonesia could maintain a reasonablyhealthy growth rate even with substantially lower oil prices.
2.4 From the point of view of longer term plannilng - on the basis ofknown oil reserves - it is prudent to assume that Indonesia's exportable oilsurplus will eventually begin to decline. The assumption made in the presentreport is that oil producticn would reach a plateau during the present decade,and may e-en decline somewhat during the l990r. Even with a vigorous programto promote energy diversification and its efficient use, rising domestic oilconsumption would, therefore, gradually cut into export volumes. Thus, whilemany observers agree that in the longer term oil prices are likely to rise inreal terms, Indonesia cannot rely exclusively on such an increase to fuel itslong term growth. Consequently, as the Government recogaizes, concertedefforts will be required to accelerate the growth of non-oil exports, not only

- 34 -
to ease the immediate foreign exchange constraints facing Indonesia duringREPELITA IV, but to provide a stable alternative source of income andemployment growth in the longer term.
2.5 The simultaneous pursuit of external adjustment and domes tic growthis not aa easy course, as recent experience in Indonesia clearlydemonstrates. As noted in last year's report, however, it is possible to meetthese objectives given appropriate domestic policies. First, a high rate ofgrowth of non-oil exports is essential. This will require continuedinvestment and timely implementation of projects in traditional exportingactivities such as rubber, palm oil and other commercial tree crops, whereIndonesia has a clear comparative advantage. But Indonesia must also seek outnew export opportunities. Perhaps the most difficult task facing Indonesiatoday is to shift to a more export oriented pattern of industrial growth.Second, Indonesia must continue to be selective in its investment policy bygiving greater encouragement to labor intensive and less import dependentinvestments. In this context, public enterprise investment (which is lesssensitive to market signals) needs to be carefully managed. Moreover, theincentive system for private investment should not be undermined by selectivemeasures of protectionism that encourage uneconomic forms of importsubstitution. As discussed in Chapter 3, this will require a continuousreassessment of trade policy to ensure that it provides both sufficientincentives for export growth and rewards for international standards ofefficiency.
The External Setting
2.6 Indonesia's economic fortunes have become increasingly tied toconditions in the world economy. Of particular importance is the situation inthe world oil market, since oil and ING currently account for 71% of thecountry's exports and 69% of budget revenues. While the outlook for oilprices dominates any projection of the economy, Indonesia's longer termprospects will also be conditioned by the price prospects for other primarycommodities, the growth of world trade and real interest rates. Accordingly,the present section provides a brief overview of the key external assumptionsemployed in this report as a basis for the analysis of Indonesia's economicprospects.
2.7 During 1984, the OECD area as a whole experienced its bestperformance in some years, largely as a result of the vigorous growth of theUS and Japanese economies. Output growth (5%), and world trade growth (9%),were the most rapid since 1976, while inflation (at 5%) slowed to its lowestrate since 1972. For 1985, it is expected that the US economy will not growas strongly as in 1984, although the Japanese and European economies areforecast to continue to grow at about last year's rate, so that overall OECDgrowth should average about 3%. The outlook for 1986 is less clear, and willin large measure depend on the fiscal and monetary policy mix adopted by theindustrial economies in 1985. The outlook for interest rates is alsodifficult to gauge for the same reason. However, for the purposes of themedium term projection, it is assumed both real and nominal interest rateswill decline somewhat. Table 2.1 summarizes the key assumptions about thefuture growth of the world economy and certain other key variables whichunderlie the assessment of Indonesia's prospects.

- 35 -
Table 2.1: SELECTED INDICATORS OF INTERNATIONAL ECONOMIC ACTIVITY, 1984-95
1984 1985 1986-90 1991-95Estimate Projected
Growth and tradeOECD growth (Z p.a.) 4.8 3.0 3.0 3.5World trade (Z p.a.) Ia 9.0 5.0 4-5.0 5-6.0
1985 1990 1995Projected
Commodity prices (1981=100)Index of 33 commodities (excludingenergy) in constant dollars lb 92.8 89.8 95.9 96.9
Index of manufactured unit values 91.4 96.0 140.4 179.2
The oil marketWorld demand for oil (mbd) /c /d 46.1 46.7 49.5 53.6OPEC output (mbd) /d 18.5 18.5 21.5 27.0
I-nternational oil price C*/bbl) /eBase case - at 1981 prices 31.1 29.1 28.5 36.3
- at current prices 28.4 27.9 40.0 65.0Low case - at 1981 prices 27.1 23.4 25.8
- at current prices 26.0 32.9 46.3
Interest ratesLIBOR If 11.0 10.0 9.0 8.0
ia Total exports of goods and non-factor services are used as a proxy forworld trade.
/b Nominal price index deflated by the World Bank's Unit Value Index ofManufactured Goods (the MUV index).
/c Excluding centrally planned economies and China.7T[ Includes natural gas liquids and condensates.7W OPEC sales weighted by member country output.7f 6 Month London Interbank Offered Rate.
Source: World Bank staff estimates and projections.
2.8 There are considerable uncertainties about the evolution of the worldeconomy. For the longer term, the growth of the international economy willlargely depend on policies pursued by the OECD economies. While it ispossible that the pexformance of the industrial economies will not improveover past levels, the scenario adopted in the present report assumes thatthere will be a modest improvement in OECD growth over the rest of the decade,

- 36 -
and a continued improvement in the 1990s. The scenario adopted here liesbetween that of the high and low cases of the World Development Report 1984,with OECD growth averaging about 3% and world trade expanding by between4-6%. Exports of manufactures from developing countries are assumed to growby 8-9%. Given Indonesia's very small share in developing country exports,Indonesia should, with appropriate policies, be able to do significantlybetter.
2.9 Given the turbulence in the world oil markets in the past ninemonths, the course of international oil prices is extremely difficult topredict. OPEC's ability to defend its price structure came under severepressure during 1984. Changes in the pattern of crude oil demand upsettraditional differentials between different types of crude, and the strengthof the US dollar meant that the official OPEC price rose sharply in non-dollarterms during 1984. The impact of these forces was most readily apparent inthe spot market, where lighter crudes were traded at a discount. Thisprompted a revision in the OPEC price structure in January 1985.
2.10 While most observers do not expect a major change in oil prices, itis likely that the OPEC price structure will continually be tested over thenext few years. Looking to the longer term, world demand for oil is nowforecast to grow more slowly, as a result of continuing pressures towardconservation, and a slight downward revision in the OECD growth forecast. Oilprices could, therefore, fluctuate within a fairly wide band. Given thisuncertainty, in this report we examine the implications of two oil pricescenarios.
2.11 In the base case oil price scenario - which Is considered the mostlikely outcome - average crude oil prices are expected to remain approximatelyunchanged from their current levels until end 1986. In 1987, oil prices areexpected to increase in line with international inflation. From 1988 until1990, oil prices are projected to increase by 1% p.a. in real terms./l Usingthe World Bank's Unit Value Index of Manufactured Exports (the MUV i*dex) as ameasure of international inflation yields a nominal oil price of t40/bbl in1990 at current prices. In the 1990s, oil prices are expected to increasesignificantly, rising by 5% annually in real terms. Assuming a 5% annualinflation rate, this implies an oil price of $65/bbl in 1995. There is apossibility that oil price developments may be less favorable for Indonesiathan assumed under the base case. A conceivable scenario would be a dramaticbreak in oil prices, but, given the economics of the oil market, it is veryunlikely that oil prices would remain so depressed over a number of years.A more plausible low case scenario would be a further modest decline innominal oil prices at some point over the next two years, followed by real oilprices rising more slowly than in the base case. Under the low case scenarioemployed in this report, it is assumed that oil prices decline to t26/bblduriug 1985-86, remain constant in real terms in 1987, and rise by 2% in realterms for the remainder of the projection period. This implies an oil priceof t32.9/bbl in 1990 and $46.3/bbl in 1995 in current dollars.
/1 Accordingly, real oil prices (in 1981 dollars) are now projected todecline from $31.1/bbl In 1984 to $28.5/bbl by 1990, compared with an estimateof $31.3/bbl in 1990 employed in last year's report.

- 37 -
2.12 The outlook for non-energy commodity prices i6 mixed. The WorldBank's overall index of 33 non-energy commodities is projected to decline inreal terms in 1985 and 1986 before rising to about 3% above its 1984 level in1990. This is substantially less than the 13% rise projected a year ago forthe same period. Commodity prices are expected to remain unchanged in realterms between 1990 and 1995.
External Terms of Trade Prospects
2.13 The outlook for oil and non-oil commodity prices mea.ns thatIndonesia's terms of trade are expected to fluctuate markedly during the tenyear period analysed in this chapter. In the base case scenario, the terms oftrade are expected to deteriorate by about 3% annually (from 95.2 to 88.9)over the next two years, as Table 2.2 shows. This implies an annual loss inGross National Income (GNY) of nearly one percent during 1985 and 1986.Subsequently the terms of trade are expected to begin to impr owe from thislevel. The base case oil price projections imply a sharp improvement inIndonesia's terms of trade in the 1990s. Between 1990 and 1995 the terms oftrade are expected to improve by 3.5% annually. This is equivalent to anadditional 0.8% increase in GNY annually during this period. The uncertaintyower oil prices means that Indonesia's terms of trade outlook could be lessfavorable than these figures suggest. Under the low case, Indonesia's termsof trade would decline by 5% annually, over the next two years, and fallfurther over the rest of the decade. In the 1990s, Indonesia's terms of tradewould improve, but the low case projection for 1995 would still be worse than1984.
2.14 Given the high proportion of oil/LNG exports In Indonesia's totalexports, the country's terms of trade position is largely determined bymovements in oil prices./1 However, the outlook for non-oil commodity pricesis also important. Thi8will affect export revenues and the profitability ofexports and hence influence the pace at which Indonesia can diversify itsexport structure. During 1985 and 1986 non-oil export prices are expected togrow more slowly than import prices, so that the terms of trade for non-oilexporters would deteriorate. Moreover, during the second half of the 1980sthe prices of coffee, palm oil, sawnwood, metal and tin - which are all ofconsiderable importance to Indonesia - are expected to decline in real terms.Indonesia would only be partly sheltered from these declines by expectedincreases in plywood and rubber prices, as well as by a shift towardmanufactured exports in the composition of its exports. Overall, the non-oilterms of trade would deteriorate during 1985-90 by about 5%. In the 1990s,the terms of trade of non-oil producers would again improve, but would notreturn to their estimated 1984 levels before 1995.
/1 ING prices are linked to oil prices under long term supply contracts.

- 38 -
Table 2.2: INDONESIAS Ti;BH OF TRADE UnDER ALTERNATIVE SCEABRIOS, 1981-1995(Index: 1981 - 100)
1984 1985 1986 1990 1995Estimate Projections
The base caseOil/LNG export price Index 80.2 78.8 80.2 113.0 183.6Export price index 86.3 87.6 90.7 126.5 191.4Import price lndex 90.7 94.9 102.1 140.0 178.8Terms of trade index 95.2 92.3 88.9 90.4 107.1
The low caseOil/LNG export price Index 80.2 73.4 73.4 92.8 130.8Export price index 86.5 85.1 87.6 114.5 163.5Terms of trade index 95.3 89.7 &5.8 81.8 91.4
Memo items:Non-oilLDNG export price index 101.9 104.6 112.7 149.3 193.1Non-oil terms of trade Index (a 112.7 110.8 110.9 106.8 108.0
/a Non-oil export prices in relation to non-oil import prices.
Source: World Bank staff estimates and projections.
B. Medium Term Prospects
2.15 The present section provides an assessment of a feasible ten yeargrowth scenario for Indonesia, against the background of the key assumptionsabout the growth of oil prices and the world economy reviewed above. The basecase scenario shows a feasible growth path for the Indonesian economy,provided Indonesia implements the policy measures discussed in Chapter 3. Theimplications of two alternative scenarios - lower oil prices and lower non-oilexports - are examined subsequently.
The Base Case Scenario
2.16 Economic Growth. Under the base case, non-oil/LNG output is expectedto increase slightly faster in 1985 and 1986 than in 1984, as a result of thefiscal boost being given to the economy by the 1985/86 budget. However, realGDP is projected to grow more slowly overall, due to an anticipated decline Inthe volume of crude oil output in 1985. For the reminder of the decade, asTable 2.3 shows, real GDP growth is projected to expand at an annual rate of4.5% with non-oil GDP rising by 5.0% annually. For the first half of the1990a, real GDP growth is maintained at about this level, but a further shifttowards non-oil/LNG based growth is shown, with non-oil/LNG growth increasingto 5.6% p.a.

- 39 -
Table 2.3: GROWTH AND COMPOSITION OF GDP UNDER THE BASE CASE, 1984-1995(at 1981 prices)
Rates of Growth (X p.a.) Shares in GDP (X)1984/a 1985-86 1987-90 1991-95 1984 1990 1995
- Projected Est. -Projected-
Agriculture 5.0 3.7 3.7 3.7 25.5 24.7 24.0Mining and quarrying 5.0 -0.4 2.1 -1.5 20.8 17.5 13.1
Oil (5.6) (-0.8) (2.2) (-2.2) (18.0) (15.1) (10.9)Other mining (1.0) (2.5) (1.4) (2.5) (2.8) (2.4) (2.2)
Manufacturing 24.4 6.3 6.2 6.4 12.8 14.3 15.8ING (52.6) (6.6) (4.0) (1.8) (5.5) (5.6) (5.0)Other /b (9.2) (6.0) (8.0) (9.0) (7.3) (8.7) (10.8)
Construction 0.0 5.2 5.5 6.0 5.8 6.1 6.7Other services 4.0 5.0 5.5 6.0 35.1 37.4 40.4
___ _ 4.3 100.0 100.0 4.Memo items:
Non-olILNG GDP 4.4 4.6 5.0 5.6 76.5 79.3 84.1GDP growth at 1973prices 5.0 4.4 5.1 5.4
/a Provisional estimate.7,b Includes refiniug.
Source: World Bank staff estimates and projections.
2.17 The growth of value added in agriculture is projected at a trend rateof 3.7% per annum. As noted in Chapter 1, the sector has enjoyed twosuccessive bumper years with rice output reaching new peaks. However, thisvery success raises important questions for economic policymakers. Over thelast 18 months the financial and economic costs of holding substantial ricereserves have become more apparent. It would appear that if production growthremains on trend, rice stocks in Indonesia will continue to grow. Clearly oneimmediate question is whether it is desirable to increase domestic rice stocksto 5 million tons as programmed under REPELITA IV, or whether less costlyapproaches to the important goal of national food security are viable.A second, but related, question is the long term role of rice in Javaneseagriculture. Over the past 15 years, the expansion of irrigation systems, theadoption of improved strains of rice, and the greater use of fertiliser andpesticides have led to a dramatic increase in production and rural incomes.However, as noted in Part II of this report, with the likely gradual emergenceof demand constraints on rice, agricultural income growth in Java will dependon the successful expansion of other crops which can offer improved incomes tofarmers and supply Indonesia's emerging agro-industries with products for thedomestic market and exports. In some areas this may mean shifting from riceproduction to new higher valued crops, in others more diversification intosecondary crops. In both cases, however, the challenge wiU be to develop

- 40 -
efficient alternatives to rice monoculture. Clearly, an appropriate patternof input and producer prices will be a necessary element in such a transition.
2.18 Off Java, the challenges for agricultural policy are equallycomplex. Indonesia has a clear comparative advantage in tree crop productionand, as noted below, excellent export prospects, providing that new plantingcan be boosted. Here the Government faces multiple objectives. Smallholderdevelopment projects have been given top priority on equity grounds. Inestablished areas, the focus is on replanting and rehabilitation. In otherareas, tree crops programs are being used to provide opportunities fortransmigration. However, both types of schemes face implementation problems.They also place a heavy burden on the government owned estate crop enterprisesto provide assistance to smallholders, in addition to their otherresponsibilities. And while the schemes themselves offer high economic ratesof return, the credit system employed does not recover costs fully and isexpensive in financial and administrative terms. As the area covered by thetree crop program - currently the largest in the world - expands, thesestrains could intensify. In addition, the Government wishes to encouragegreater private sector investment in the tree crop sector. This will requirea satisfactory incentive framework for investors which will enable them toearn an adequate rate of return and provide a greater certainty in respect ofexport taxes and domestic marketing obligations. A major policy andinstitutional challenge will be to develop a clear definition of therespective roles of Government estates, extension services, rural financialinstitutions and private sector investors.
2.19 The non-oil/ING sector is likely to be the main source of growth ofoutput and employment in the coming years. Accordingly, the manufacturingsector (excluding ING) is given a particularly important weight in theprojections. For 1985 and 1986, manufacturing value added (excluding ING) isprojected to grow at an annual rate of 6% rising to 8% p.a. over the remainderof the decade and 9% p.a. in the 1990s. This will require a marked shift inIndonesia's industrial and trade policies, as discussed in Chapter 3, so thatthe projected orientation of the manufacturing sector towards exports can berealised. Finally, construction and other services are both projected to growat average rates of over 5% during the projection period, more rapidly thanthe rest of the economy. These two sectors are the least import dependentactivities in economy, other than agriculture. Balance of paymentsconsiderations are, consequently, less of a constraint than in the othersectors. Together, they accounted for 51% of employment in 1981, and, asdiscussed in Part II, they are likely to account for the bulk of the new jobscreated during the projection period.
2.20 For the oil sector, it is assumed that crude oil production will riseto about 1.63 mbd by 1990, but that the production rate is reduced in the1990s by about 2% annually as real oil prices rise, so that reserves can beconserved. It is estimated tnat, with a success ratio of 20%, over 250exploration and appraisal wells must be sunk annually in order to "prove up"sufficient reserves to replace the projected production. In 1984, however,only 204 wells were sunk and the agreed work program calls for 233 new wellsin 1985. Although the success ratio in the past two years has been about 30%,this pattern cannot be assumed to continue. Consequently, continued effortswill be required to stimulate exploration, and the development of new fields,

- 41 -
so that the projected production rate can be assured. Indonesia possessesvast natural gas reserves. These can help diversify Indonesia's energyexports, and it is assumed that additional LNG trains and Liquid Petroleum Gas(LPG) facilities can be brought into operation during the 1990s.
2.21 Investment and Savings. Table 2.4 sets out the expenditure side ofthe base case scenario. Fixed investment is estimated to have declined in1983 and 1984. But it is shown as rebounding during 1985 and 1986. Thiswould require a significant improvement in project implementation performance,and a modest revival in private investment activity. From 1987 onwards, fixedinvestment is assumed to pick up further, with a shift toward private sectorinvestment in manufacturing. The scope for increases in capital goods importsis very limited. Consequently, this revival in overall Investment activity ispredicated on the assumption that the future composition of investment followsthe pattern planned under REPELITA IV, and that there are no reallocations ofinvestment from the less import dependent sectors such as health, educationand other social sector activities, toward the more import dependeat sectors,such as industry (see Chapter 3).
Table 2.4: GROWTH IN GDP BY EXPENDITURE CATEGORY UNDER THE BASE CASE,1983-1995
(in percent at 1981 prices)
1983 1984 /a 1985-86 1987-90 1991-95Projected
Real growth ratesTX p.a. at 1981 prices)Consumption 3.5 3.8 4.4 4.2 5.0Fixed investment -7.0 -9.0 5.1 5.5 5.5Exports /b 14.2 3.5 3.9 3.4 1.0Imports 7' -8.6 -7.5 2.5 2.7 4.3GDP 4.7 6.5 3.8 4.5 4.3GNP 3.5 6.5 4.1 4.0 4.4GNY 2.4 7.0 3.2 4.8 5.2
1986 1990 1995- Projected -
Share of GNP(Z at current prices)Gross domestic investment 23.6 21.8 19.9 20.4 21.5Financed byForeign savings 6.2 2.4 3.1 1.9 1.5Gross national savings 17.4 19.4 16.8 18.5 20.0Private (9.7) (9.6) (9.6) (9.9) (10.4)Government (7.7) (9.8) (7.2) (8.7) (9.6)
/a Provisional estimate.T7 Includes goods and non-factor services.
Source: World Bank staff estimates and projections.

- 42 -
2.22 The pursuit of external balance of payments stability means that theshare of foreign savings available to support domestic investment will sharplydecline. Consequently, to meet its investment needs, Indonesia will have toplace greater emphasis on a domestic resource mobilization effort, to boostboth public and private savings. Government savings are projected to declinein the near term, but then grow faster than GNP for the rest of the scenarioperiod to reach almost 10 of GNP by 1995, as the impact of the new taxregulations will be to improve the buoyancy of fiscal receipts./l Thisincrease will, however, require successful implementation of the new taxlegislation as well as the gradual removal of domestic oil and fertilizersubsidies, and increased cost recovery on public services. Private savingswill need to rise from 9.6% of GNP in 1984 to 10.4% of GNP by 1995. Thefinancial sector reform of June 1983 is conducive to further strong growth infinancial savings. The distribution of these savings between bank deposits,shares and bonds will, as discussed in Chapter 3, largely depend cm tax policymeasures influencing the rate of return on these different types of investment.
2.23 Balance of Payments. As noted in para. 2.13, Indonesia's terms oftrade are expected to deteriorate over the remainder of this decade. ThiFmeans its export growth rate will have to exceed the growth of imports, ifcontinued progress is to be made in external adjustment. For 1985, oilexports are expected to remain flat (although there will be a rise in LNGexports) and the overall rate of growth of exports will, again, largely dependon the strength of non-oil exports. Oil exports are projected to increase involume in 1986. During 1987-90, total exports are projected to rise by 3.4%p.a. with non-oil exports rising at an annual rate of 6% annually and oilILXGexports increasing by 22 p.a. As discussed in section C, non-oil exportgrowth of this magnitude is well within the capabilities of the Indonesianeconomy, but will require vigorous efforts on the part of the Government tocreate the right climate for exporting in both agriculture and industry. Inthe 1990s, it is assumed that oil/LNG exports will decline by over 2%annually, so that even with an 8Z non-oil export growth rate, total exportswill increase at an annual rate of only 1X. In the base case scenario, importgrowth is projected at slightly less than 3% annually during 1985-90.However, the projected improvements in the terms of trade (associated withrising oil prices) will mean that Indonesia will be able to increase importsby over 42 annually in the 1990s whilst securing further reductions in thecurrent account deficit in relation to GNP.
/1 As noted in Chapter 1 the major factors underlying the high level ofrupiah public savings in 1984/85 were the unanticipated increase in oilrevenues, lower than expected oil subsidy payments, and lower currentexpenditures. On the assumption that this combination of circumstances isunlikely to repeat itself next year, and also given both the slow growth ofoil revenues and the sharp increase in current expenditures in 1985/86, puolicsavings would decline in 1985/86 before rebounding in 1986/87.

- 43 -
Table 2.5: SUMMARY BALANCE OF PAYMENTS UNDER THE BASE CASE,1983/84-1995/96
(t billion at current prices)
1983/84 1984/85 1985/86 1990/91 1995/96Est. - Projected --
Gross merchandise exports 19.8 20.2 20.8 36.3 57.5Oil and LNG 14.4 14.3 7 23.9 33.6Non-oil 5.4 5.9 6.5 12.4 23.9
Gross imports (cif) and NFS -19.6 -17.6 -19.1 -31.6 -49.7Oil and LNG -3.8 .1 -3.8 -6.5 _31.0Non-oil -14.2 -12.9 -13.6 -22.5 -34.9Net non-factor services -1.6 -1.6 -1.7 -2.6 -3.8
Resource balance 0.2 2.6 1.7 4.7 7.8
Net factor services and transfers -4.4 -4.5 -4.4 -7.2 -10.9
Current account balance -4.2 -1.9 -2.7 -2.5 -3.1(- iudicates deficit)
Net disbursements of public MIX debt 3.7 2.2 3.0 2.3 3.2
Net other capital /a 2.1 0.6 0.1 0.5 0.2
Change in net official reserves -1.6 -0.9 -0.4 -0.3 -0.3(- indicates increase)
Memo items:Total net foreign assets /b 5.6 7.4 7.1 5.7 4.5
(as months of imports oTfgoods)Current account balance as % GNP -6.0 -2.4 -3.3 -1.9 -1.5Debt-service ratio (gross) /c 17.8 21.1 21.1 23.8 22.1
/a Includes estimates of oil and LNG export credits, all debt transactionsassociated with LNG expansion, direct foreign investment, and all privatecapital flows.
/b Net of outstanding drawings from the IMF's Buffer Stock and CompensatoryFinancing Facilities. These are treated as current external liabilities.
/c The ratio of total debt service to gross exports of goods and services.
Source: World Bank staff estimates and projections.
2.24 Table 2.5 shows the balance of payments outcome of the abovescenario. Three important assumptions influence this projection. First, thatIndonesia's current account deficits do not increase significantly in nominalterms. This implies a continued reduction in the current account in both real

- 44 -
terms, and in relation to GDP. Second, it is assumed that Indonesia willstrengthen its non-oil export performance. Accordingly these exports areprojected to account for 42% of gross merchandise exports by 1995, comparedwith less than 30% in 1984/85. Lower non-oil export growth could lead to asignificant deterioration in Indonesia's debt-service ratios, as the lowernon-oil export growth scenario in the following section illustrates. Third,disbursements of public medium and long term debt are assumed to provide thebulk of the capital inflows necessary to finance the projected current accountdeficits and the build up in official reserves.
The Low Case Oil Scenario and the Impact of Lower Non-oil Export Growth
2.25 The base case presents a scenario for growth and external paymentsstability based on the asnumptions about the external environment outlinedabove and appropriate domestic policies. There are two main sources ofuncertainty in the analysis. The first concerns the trajectory for oil pricesboth in the near and longer term. The second relates to Indonesia's futurenon-oil export performance.
2.26 The Low Case Oil Scenario. As discussed in para. 2.9, there isconsiderable uncertainty over the future course of oil prices. Accordingly,it is essential for economic policymakers to take into account the possibilitythat oil prices may be lower than projected in the base case scenario. By wayof illustration Table 2.6 shows the implications of a lower oil price scenariofor Indonesia - the low case - in which the oil price declines to $26/bblduring 1985-86, increases in line with international inflation In 1987 andthen rises by 2% in real terms for the remainder of the projection period.Under such a scenario, the oil price in current dollars would reach $33/bbl in1990 and $46/bbl in 1995 compared with $40 and $65 respectively in the basecase (para. 2.11)./l
2.27 In these circumstances, Indonesia's total export earnings, and henceits debt-servicing capacity (in absolute terms), would be considerablyreduced. This, in turn, would reduce Indonesia's ability to import./2 It isestimated that the non-oil/LNG GDP growth rate would be about 1% lower than inthe base case. Provided Indonesia acted promptly to reduce investmentexpenditures and hence investment related imports, annual external borrowingover the next 3 years could be kept to the same level as in the base case, andover a longer time period gradually reduced. Thus, by 1990 the value of totaldebt outstanding and disbursed would be $0.6 billion less than under the basecase and debt would rise more slowly in the 1990s. Inevitably, in the nearterm the aggregate debt service ratios would rise more rapidly than in the
/1 In 1981 prices, the low price scenario assures an oil price of $23.4 in1990 compared with $28.5 in the base case; in 1995 the oil price would be$25.8 and $36.3 respectively.
/2 Lower oil prices would increase real aggregate demand in industrialcountries, thereby improving Indonesia's non-oil export prospects. Indonesiacould therefore partly offset the impact of the decline in oil prices byincreased exports.

- 45 -
base case; but the position would gradually improve. In 1990 the aggregatedebt-service ratio would reach 26% compared with 24Z in the base case but by1995 the debt service ratio would decline to 23% (compared with 22% under thebase case). Similarly, the difference between the ratio of total debtoutstanding and disbursed to total exports under the two scenarios would alsonarrow markedly in the 1990s.
Table 2.6: SELECTED ECONOMIC INDICATORS UNDER ALTERNATIVE OIL PRICESCENARIOS, 1986-1995
Average Real Growth (% per annum)Scenario I Scenario IIBase Case Low Case
1986-90 1991-95 1986-90 1991-95
GDP 4.6 4.3 3.9 3.3Non-oil/LNG GDP 5.0 5.5 4.0 4.4Exports of goods andnon-factor services 4.0 1.0 4.3 1.5Imports of goods andnon-factor services 2.6 4.4 1.1 4.2Non-oil exports 5.9 8.3 7.0 9.2
1990 1995 1990 1995Selected indicators
Oil price $/bbl /a 40.0 65.0 32.9 46.3Total debt ($ billion) /b 46.9 64.9 46.3 59.9Debt-service ratios (%)- Public (net) /c 29.8 27.1 32.9 27.7- Total (gross)T7d 23.8 22.1 25.6 22.8- Total DOD/Exports /e 117.9 104.9 125.5 108.7
Current account deficit(as % GNP) -1.9 -1.5 -1.6 -1.1
/a In current dollars.Th Public and private medium and long term debt outstanding and disbursed.7& The ratio of public debt service to net exports, i.e. total exports of
goods and services less imports of goods and services of the oil/LNGsector.
/d The ratio of total debt service to gross exports of goods and services.7T The ratio of total outstanding debt to gross exports of goods and services.
Source: World Bank staff projections.

- 46 -
2.28 Lower Non-Oil Exports. Scenario III employs the same oil price andoutput assumptions as the base case, but explores the implications if non-oilexport growth does not improve relative to Indonesia's actual performanceduring the past 10 years. For this scenario, non-oil exports are shown asgrowing by their historical rate of 4.5% during 1986-1995, rather than the 7%rate projected under the base case. This scenario indicates that, over thelong term, Indonesia's economic position could be more adversely affected bylower non-oil export growth than the lower oil prices assumed under the lowcase scenario. In the 1986-90 period, the impact on growth and the balanceof payments would be fairly modest, because of the currently small share ofnon-oil exports in total exports. However, over time, the shortfall in exportearnings relative to the base case scenario would rapidly climb. In currentdollars this would imply a drop ln exports of $1.2 billion in 1990 and $5.6billion in 1995. Over the period 1986-1995, the cumulative loss of exportearnings would amount to $23.6 billion. This would have serious implicationsfor the economy. Even with lower imports and GDP growth than in the base casescenario, the current account would not improve relative to GNP. Theaggregate debt-service ratio in the 1990s would exceed that under the low oilprice scenario and show no sign of improvement, as shown in Figure 2.1. Atthe same time, Indonesia would remain more heavily dependent on oil/LNG exportrevenues, and hence potentially more vulnerable to the adverse effects oflower than projected oil prices. To avoid such a scenario, the most criticalarea for policymakers is the expansion of manufactured exports, since thefuture growth of these exports will depend on further changes in trade policydiscussed in Chapter 3.
FIGURE 2.1DEBT-SERVICE RATIOS, 1981/82-1995/96
CALTERNATIVE SCENARIOS)
_-_____-SCENARIO m26- / r ~~.
> , __> ~~~~LOW CASE
BASE CASE
losise 1400i1 100S/rn

- 47 -
Tatle 2.7: SELECTED ECONOMIC INDICATORS UNDER ALTERNATIVE EXPORTGROWTH SCENARIOS, 1986-1995
Average Real Growth (% per annum)Scenario I Scenario II Scenario IIIBase Case Low Case Lower Non-oil Ewports1986-95 1986-95 1986-95
Non-oll exports 7.2 8.0 4.5GDP 4.5 3.6 3.7Non-oi!I.G r-GP 5.3 4.2 4.4Exports of goods andnon-factor services 2.5 2.9 1.5
Imports of goods andnon-factor services 3.5 2.7 2.6
1995
Selected indicators
Oil price $/bbl /a 65.0 46.3 65.0Total debt C$ billion) /b 64.9 59.9 71.3Debt-service ratios (Z)- Public (net) /c 27.1 27.7 34.5- Total (gross) 7d 22.1 22.8 26.4- Total DOD/Exports /e 104.9 108.7 127.0
Current account deficit(as Z GNP) -1.5 -1.2 -2.5
Total net foreign assets inmonths of imports of goods 4.5 4.5 4.5
/a In current dollars.Th Public and private medium and long term debt outstanding and disbursed.7-c The ratio of public debt service to net exports, i.e. total exports of
goods and services less imports of goods and services of the oil/LNGsector.
/d The ratio of total debt service to gross exports of goods and services.7;e The ratio of total outstanding debt to gross exports of goods and services.
Source: World Bank staff projections.
C. External Trade
2.29 The preceding section provided an overview of the macroeconomicframework employed in preparing the analysis of Indonesia's economicprospects. The present section reviews the implications of this analysis for

- 48-
the country's external trade. The analysis presented in this section suggeststhat a key macroeconomic question facing Indonesia is whether it will succeedln improving its trade performance, so as to permit sustained growth over thenext 10 years. This report takes the position that it can do so. However,this is not to deny that Indonesia faces an enormous challenge. As Figure 2.2shows, under the base case scenario, a major shift in the composition ofexports is projected, with non-oil/ING exports substantially increasing theirshare in total export earnings over the next ten year,-. Two tasks emerge forthe future. One is that Indonesia will have to substantially boost itsnon-oil export growth rate. Its traditional agricultural based exportscontinue to offer good prospects. But the projections above clearly indicatethat it is vital for Indonesia to promote its manufactured exports, which,given the appropriate policies (described in Chapter 3 below), have thepotential to become a major source of foreign exchange earnings. The second,related, challenge will be to expose its economy to greater competition fromimports, so as to create pressures to lower domestic production costs andenable exporters to compete more effectively in foreign markets.
FIGURE 2.2'MERCHANDISE EXPORTS. 1981/82-1995/96
CTHE BASE CASE)
4a NON-OI_a44 a
1S8tt2tS;9 SMTl1#D

- 49 -
Export Prospects
2.30 Oil and LNG. Since 1981 the share of oil and ING in Indonesia'sexpoit earnings has declined from over 80% to 71% in 1984/85. But even atthis reduced level, the economy's export base remains highly dependent onenergy revenues. Given the potential volatility of world oil prices discussedabove (para. 2.10), as well as the uncertain prospects for major additions tooil reserves, Indonesia will need to make substantial further adjustments inthe pattern of its export earnings to maintain the momentum of economic -growth. Nevertheless, Indonesia is expected to continue to derive more than60% of its foreign exchange receipts from the oil/LNG sector during theprojection period.
2.31 The base case oil export forecast assumes that crude and condensateoutput during 1985/86 will remain basically unchanged from the 1984/85 level.Oil production, including condensates, is then assumed to rise at an annualrate of 4% during the remainder of REPELITA IV to reach 1.6 mbd in 1988. Inorder to stretch reserves as far as possible, production is assumed to bemaintained at about this level In 1989 and 1990. For the 1990s it is assumedthat Indonesia reduces its oil output by about 2% annually, which, allowingfor modest increases in domestic consumption and the projected increase in oilprices, would enable it to maintain the value of oil export revenues in realterms.
2.32 Indcuesia has made significant strides in controlling domestic oilconsumption.. Since 1981 domestic oil prices have been substantially increasedeach year, and with the exception of kerosene and industrial, diesel oil,domestic prices have been aligned with international prices. It is estimatedthat as a result of this effort, oil consumption in the last fiscal year wasonly slightly higher than in 1981/82, despite an increase of 10% in real -DPduring this period. The imposition of VAT on fuel and products, together wi:tfurther reductions in budgetary subsidies, and efforts already underway towardfuel substitution should help to keep domestic oil consumption underreasonable control. Accordingly, domestic oil consumption is expected toincrease by only 2.5% over the remainder of REPELITA IV. The efficient use ofenergy is extremely important for the economy. For example, if domesticconsumption of oil were to rise 1X faster than assumed in the base case, withan unchanged OPEC quota cumulative oil exports during 1985/86 to 1990/91 woulddecline by $1.4 billion. Consequently, it is essential that the Governmenttake additional steps to promote efficient energy use over the longer term, soas to keep domestic oil consumption to a minimum. Without such an effort,domestic oil consumption will bite into oil earnings during the 1990s whenworld demand and real prices are expected to rise.
2.33 The role of LNG has increased significantly in Indonesia's overallenergy picture. Indonesia is currently the world's largest LNG exporter. Twonew trains at Arun began production during 1984/85, boosting LNG revenues byalmost $900 million or 37%. During 1985/86, LNG output - which is exclusivelyfor exports - is contracted to reach approximately 770 million MMBTU, anincrease of 1% over 1984/85. A sixth train is under construction at Arun forexport to Korea. It is scheduled to be completed towards the end of 1986.With the completion of this train, Idonesia's capacity will reach 900 millioaMOBTU. Other markets for LNG are being explored, and with the country's vast

- 50 -
reserves, LNG is expected to comprise a rising share of Indonesia's energyexports. Accordingly, it is assumed that a further round of LNG expansionwill take place during the 1990s, bringing Indonesia's production capacity toabout 1 billion MMNTU by 1995. At this level, LNG would account for about onequarter of oil/ING exports compared with about one fifth currently. From thepoint of view of technical production potentials, Indonesia is capable ofexporting a substantially higher volume. The major constraint it faces is toobtain secure long term markets for these valuable energy resources. Owerseasmarkets for LPG are also be ng actively explored.
2.34 Non-oil Exports. Recognizing that the price prospects for oil areunfavorable in the medium term, the REPELITA IV plan attaches particularsignificance to the promotion of non-oil exports. It sets an impressivetarget of $10.8 billion for non-oil exports in 1988/89 which would, on thebasis of the REPELITA IV projection, raise the share of non-oil exports intotal goods exports from 27% in 1983184 to 34.5Z. Given the outlook for theinternational economy outlined above, demand should not prove a constraint tothe achievement of this goal, providing that Indonesia does not encounter anincrease in protectionism. With the exception of plywood, where Indonesia isthe world's largest supplier, as well as tin and coffee (where Indonesia isbound by international marketing agreements), Indonesia's export sharegenerally constitutes a small fraction of total developing country exports.Consequently, it will be Indonesia's own ability to increase exports, ratherthan external demand considerations, which will determine its success inattaining these goals. The recent measures to deregulate customs, ports andshipping, discussed in Chapter 1, can be expected to significantly improveIndonesia's prospects in this regard.
2.35 As Table 2.8 indicates, non-oil exports are projected to growstrongly under the base case, rising to $12.4 billion in 1990 and reachingt23.9 billion in 1995. Indonesia's agricultural products - chiefly rubber,coffee, tea, palm oil and shrimp - which accounted for an estimated 46% ofnon-oil exports in 1984/85 - are expected to make a substantial contributiontowards this growth. It possesses a clear comparative advantage in theseproducts, due to its relatively low labor costs, a favorable climate, and theavailability of large tracts of land (off Java) suited to tree cropproduction. Consequently, with continued investment in this sector, theexport prospects are favorable for these commodities as a whole.Nevertheless, the projected growth of agricultural exports cannot be taken forgranted and will require strenuous efforts as part of the overall non-oilexport drive. The immediate outlook for tree crop exports is, of course,largely determined by past investment, since these plants have gestationperiods of 4-8 years. Indonesia's tree crop expansion program is the largestin the world, and wlll lead to significant increases In tree crop exports inthe 1990s. However, the very scale of the program has led to implementationdifficulties. As a recent Bank report notes, it is clearly important for theGovernment to address the institutional constraints which are impeding thesenew investments, so that the growth of output which will be needed in the1990s can be assured./l
/1 Indonesia - The Major Tree Crops: a Sector Review, World Bank ReportNo. 5318-IND, April 15, 1984.

- 51 -
Table 2.8: PROJECTIONS OF MERCHANDISE EXPORTS BY MAJOR CATEGORIESUNDER THE ASE CASE, 1984/85-1995/96
($ million at current prices)
Growth Rate(Z p.a. at 1981 prices)
1984/85- 1986/87- 1991/92-1984/85 1990/91 1995/96 1985/86 1990/91 1995/96
Est. - Projected -
Oil and products L1,050 17 ,800 22,800 -4.0 2.9 -4.6LNG 3,290 6 100 10 800 18.4 3.7 1.7Fo-Oil/ING products 5 900 23!900 9.8 5.9 8.3Agricultural products 5,200 9000 4.0 2 5.2Timber 480 700 1,400 -6.9 7.6 8.5Minerals and metals /a 1,020 1,700 2,500 15.7 2.7 2.8Manufactured goods /b 1,650 4,800 11,000 18.7 8.4 12.5(of which plywood) (660) (1,700) (4,098) 13.6 9.6 13.5
Total20,20 36,300 57,500 2.2 4.0
Capacity to import /c 22,890 26,800 33,300 1.7 3.5 4.5
it Iucludes aluminum.7b Includes plywood, textiles, handicrafts, electrical appliances, cement,
fertilizer and other manufactures.IC Exports deflated by the import price Index in 1981 prices.
Source: World Bank staff estimates and projections.
2.36 Timber exports - which consist of sawnwood and logs - are projectedto decline In 1985!86 due to a tightening of restrictions on log exports.Sawnwood exports are, however, projected to continue to rise, so that by 1990the value of sawnwood exports alone wlll exceed the combined value of log andsawuwood exports in 1984/85. The prospects for metal and mineral exports arenot particularly bright. World Bank projections indicate that the real pricesof tin, nickel and aluminum (which are of importance to Indonesia) are likelyto decline over the remainder of the decade. Consequently, Indonesia can onlyexpect modest increases in earnings from this subsector, until the worlddemand situation improves in the 19 90s.
2.37 Market Access. As the REPELITA IV plan correctly stresses,Indonesia's overall non-oil export prospects will, In large measure, depend onthe success of its manufactured exports. Between 1980/81 and 1984/85 thevalue of these exports virtually doubled - to reach an estimated t1.7 billionin the latter year. The task facing exporters is to more than double these

- 52 -
exports again by the end of the REPELITA IV plan. This will require concertedefforts on the part of the Goveranment, as well as by exporters themselves.The prospects for plywood, which accounted for almost 40X of manufacturedexports in 1984/85, are favorable and some rebound in plywood prices isforeseen during 1985. As stressed in last year's report, Indonesia faces hightariff barriers in Japan and Australia and, although exports to the EEC areentitled to enter duty free up to an amount set by a GSP quota, exports abovethis level face a tariff. (In 1984, for example, Indonesia's GSP quota forplywood exports to the EEC was used up in two months). Indonesia has investedvery substantial sums in recent years to Improve the quality and range of itsplywood exports. Reductions of plywood tariffs would provide a well deservedand very important measure of support for these efforts. Given favorabledemand conditions abroad, plywood export volume could increase by over lOXannually over the rest of the decade without hitting capacity constraints.
2.38 The textile and handicraft industry has also scored major successesin boosting exports from $180 million in 1982/83 to an estimated $500 millionin 1984/85. Honever, partly in response to this increase, Indonesia hasencountered an increase in non-tariff barriers. In particular, in the lastthree years Ireland, France and the United Kingdom have imposed newrestrictions, including specific limits, and bans of indirect imports viaother EEC countries, and surveillance on several textile items fromIndonesia. In 1983, the USA introduced additional criteria for protectiveactions in respect of textile imports not subject to quotas. So far 8 itemsfrom Indonesia have been affected by this legislation./l The MFA is scheduledto expire in 1986 and its future is still uncertain. Textile exports are asensitive matter but an agreement which takes into account the importance ofproviding market access to developing countries, such as Indonesia, which havea clear comparative advantage in textile production is to the advantage of alsides. At the same time, Indonesia should not lose sight of the fact thatthere is tremendous scope for expansion of textile exports in categories notsubject to quotas, as well as for other manufactured goods. Its ability to doso will depend on whether it can contlaue to improve the competitiveness andquality of its exports and develop new markets.
Import Needs and Composition
2.39 Indonesia's balance of payments prospects suggest that the growth ofimports needs to be restrained over the medium term. The current high levelof rice stocks means it should prove possible to reduce food imports furtherin real terms in the coming years. However, the very modest share of non-foodconsumpr goods in total imports suggests there is not much scope for furtherimport savings in this area. The forecast levels of oil and LNG imports aretied closely to the growth of output in this sector, and for both technical
/1 In November 1984 the GAIT Textile Surveillance body ruled that 2 of theseitlls should be withdrawn, one is justified and five require furtherconsultations.

- 53 -
and contractual reasons, this item is not amenable to reduction.Consequently, the major trade-off that Indonesia faces is between non-oilIntermediate and capital goods imports.
2.40 This trade-off has major implications for the conduct of economicpolicy. Capital goods imports are important, since they are essential forlong term growth. Intermediate goods, on the other hand, are necessary tomaintain existing production, and to provide vital inputs to new projects, asthese come on stream. This report takes the view that for the remainder ofthe decade the relative priority will be intermediate inputs. Accordingly,the base case projection assumes that capital goods imports will increase byonly 1% annually in real terms during this period. This implies that it willbe important to ensure that new investment projects are selected verycarefully. As discussed in Chapter 3, trade policy has aa important role toplay in this regard by ensuring that investment incentives reward projectswhich earn export revenues, or save foreign exchange, without raising costsfor other producers in the economy. And, as a corollary, public expendituresmust support such a pattern by concentrating investments in less importintensive sectors, thereby making more resources available to import inputsfor existing production activities.
2.41 In the aggregate, total imports of goods are projected to rise by2.4% p.a. in real terms during 1986-90, with an increase of 4.3% p.a.envisaged for the first half of the 1990s, as the foreign exchange constraintsfacing Indonesia begin to ease. The projections of merchandise imports underthe base case are shown in Table 2.9.
Table 2.9: PROJECTIONS OF MERCHANDISE IMPORTS BY MAJOR CATEGORY UNDERTHE BASE CASE, 1984/85-1995/96Ct million at current prices)
Growth Rate(% p.a. at 1981 prices)
1984/85 1990/91 1995/96 1984/85- 1986/87- 1991/92-Est. - Projected - 1985/86 1990/91 1995/96
Consumer goodsFood 940 1,500 1,600 -8.3 -1.6 -2.6Non-food 580 900 1,300 5.2 0.8 1.3Intermediate goods(non-oil) 4,600 8,800 15,300 1.5 4.2 6.3Capital goods(non-oil) 6,750 11,300 16,700 -5.6 1.4 3.0
Oil/LNG sector 3,130 6,500 ll,000 -1.5 3.3 5.7
Total 16,7000 29,000 45,900 2.4 4.3
Source: World Bank staff estimates and projections.

- 54 -
D. External Financing Requirements and Borrowing Strategy
2.42 Reduced Debt-servicing Capacity. The uncertain near term outlook foroil prices, coupled with the prospect of a deterioration In Indonesia'soverall terms of trade, implies that Indonesia will have to carefully manageIts borrowing profile in the medium term. Prudence dictates that Indonesia'sborrowing strategy must take full account of the uncertainty over oil prices.This implies a cautious approach to macroeconomic management, with particularemphasls on further external adjustment and careful debt marngemert. Thesimulation exercises undertaken for this report indicate that, whileIndonesia's debt-service ratios will rise sharply over the next few years inthe event of a decline in oil prices, this trend could be reversed over aslightly longer time period, providing that borrowing over the next few yearsis kept within the prudent levels showx under the base case. However, ifIndonesia were to undertake significantly higher borrowing than the levelsshown in the base case, the resulting debt service could prove unmanageable inthe event of lower oil prices. In order to keep the level of borrowing withinthis limit, it would therefore appear advisable to reduce the current accountdeficit from its present level to about 2Z of GNP before the end of REPELITAIV.
2.43 By pursuing such a strategy, Indonesia can minimize the adverseeffects of a possible decline in oil prices in the near term. And over thelonger term, by reducing its dependency on oil revenues, Indonesia will beable to maintain the momentum of development in the event of lower thanexpected growth in real oil prices. If oil prices are lower than assumedunder the base case this would, inevitably, call for lower growth in the nearterm. But, providing borrowing levels are contained, the country'sdebt-service obligations would remain manageable, and growth performancerespectable over the long term, even with considerably lower oil prices thanenvisaged under the base case scenario - as the low case scenario describedabove, illustrates (paras. 2.25-2.37).
2.44 External Capital Requirements. Table 2.10 sets out Indonesia'sexteral .rcquirzments in summary form for the next three years under the basecase assumptions. For the next three years the projected level of grossborrowing is approximately equivalent to the servicing of external debt.Indonesia will also need to provide for a build up in the value of reserves(although the projected increase represents a decline in the ratio of reservesto months of imports of goods). A similar picture emerges for the longerterm. For the 1985/86 - 1987/88 period $5.5 billion of gross disbursements ofmedium and long term public loans are required annually. Under the low case,the same average level of gross disbursements, i.e. $5.5 billion, is envisagedover the next three years.

- 55 -
Table 2.10: EXTERNAL CAPITAL REQUIREMETS AND SOURCES,1982/83 - 1987/88
($ billion at current prices)
Annual Averages
1982/83-1984/85 1985/86-1987/88 /a
Requirements 6.2 6.2Current account deficit T 2.7(of which interest) (2.0) (2.7)Amortization 2.0 2.8Change in official reserves -0.2 0.7
Sources 6.2 6.2Direct foreign investment (net) 0.3 0.3Short term and other capital (net) /b 1.6 0.4Public medium and long term loans /c 4.3 5.5
Official assistance (1.4) (2.2)Import related credits (1.8) (1.5)Commercial credits (1.1) (1.8)
/a Refers to the base case.7U Includes all flows in the oil and LNG capital account, and all net
private capital flows./c Gross disbursements.
Source: World Bank staff estimates and projections.
2.45 External Borrowing Strategy. To generate this level of disbursements,and to establish a pipeline for its future needs, the Indonesian Governmentwill require an average of $5.2 billion (including grants) in new commitmentsannually over the next three years. The projections also assume animprovement in project implementation performance so that the undisbursedoutstanding commitments ($9.6 billlon) are used more rapidly. Traditionally,Indonesia has met its external public borrowlng requirements from three mainsources: official assistance, import related credits, and internal borrowingsfrom the commercial markets. The historical pattern of these commitments isshown in Table 2.11.

- 56 -
Table 2.11: COMMITMENTS OF PUBLIC DEBT AND GRANTS, 1980-84($ million at current prices)
1980 1981 1982 1983 1984Est.
IGGI 2 417 1,871 2 125 2 337 2,197
. . . . * ,~~~~~p - ,
Multilateral concessional 189 - 58 __Multilateral nonconcessional 857 1,175 1,348 1,637 1,574-IBRD (572) (837) -(977) (1,210) (987)-ADB (285) (338) (371) (427) (587)
Bilateral concessional 1,141 548 555 557 513Grants 230 148 164 143 110
Import related credits 994 2,798 4,140 1,730 961Bilateral nonconcessional 453 749 637 259 :37Suppliers' credits 122 1,251 1,713 907 418Buyers' credits 419 798 1,790 564 186
Commercial credits 1 097 745 961 1,901 1,529Bonds 45 4 116 -
Syndicated loans and untiedborrowings 1,052 700 921 1,785 1,529
T.o__ _50 5,414 7,226 5,6 ,8
Source: Bank Indonesia and World Bank staff estimates.
2.46 Official assistance, primarily composed of concessional bilateralloans and grants as well as multilateral loans and grants from members of theInter-Governmental Group on Indonesia (IGGI), has been the most importantsource of external finance for Indonesia comprising 46% of public debtoutstanding at the end of 1984. Commitments in 1984 amounted to about $2.2billion, comprising i513 million in bilateral concessional loans, $1.6 billionin multilateral loans, and $110 million in grants. This support is making ahighly va:Lued contributioa to the Government's development efforts during aperiod of adjustment to a more difficult external situation.
2.47 It is essential that official assistance from IGGI members continueto provide the core of Indonesia's external financing requirements in theyears ahead. Given the expected reduction in Indonesia's terms of trade overthe remainder of the decade, it would appear inadvisable to seek substantialincreases in commercial borrowing at current real interest rates. It istherefore recommpnded that the level of IGGI assistance to Indonesia be atleast $2.4 billion in 1985/86 (the same level as recommended and pledged for1984/85), and that, as shown in Table 2.12, the level of commitments over thenext three years average at least *2.5 billion annually.

- 57 -
Table 2.12: PROJECTED COMMITMENTS OF EXTERNAL PUBLIC DEBT AND GRANTS,1985/86-1987/88
($ million at current prices)
1985/86 1986/87 1987/88
Official assistanee 2 410 2,520 2,600- Loans 2,40- Grants 110 120 125
Import related credits 1 300 1,300 1 300
Untied borrowing 1,200 1,300 1,700
a 4,910 5,120 5,600
Memo item:Private external borrowing 650 650 800
Source: World Bank staff estimates and projections.
2.48 Import related credits (IRCs) and commercial loans will both have animportant part to play in helping to meet Indonesia's external financing needsduring the remainder of the plan period. The terms on Import related creditshave improved markedly in recent years, as suppliers of capital goods haveprovided an increased grant element within these loans. There is, at present,some $2.1 billion outstanding in IRC commitments. Given the projectedcontinued shift away from import intensive public sector projects and theprojected slow growth of capital goods imports, these outstanding commitments,together with annual new committments of $1.3 billion, should prove sufficientfor the needs of the public investment program. In recent years, Indonesia'sborrowings from commercial sources have been used as a tool of balance ofpayments and reserve management, rather than to finance specific projects.This is a trend which can be expected to continue. In 1984 commercialsyndications and other commercial placements amounted to $1.5 billion. Thleseissues were well received by the market, indicating the confidence placed inIndonesia's macroeconomic policies and prudent debt management record.Indonesia can be expected to tap the commercial markets for additionalresources to meet its external financing needs. However, given the high levelof real interest rates which are expected to prevail during the life of theseloans, the extent of this borrowing will need to be carefully controlled witha view to its impact on the debt-service ratio. On balance, it would appearthat commercial borrowing over the next three years should not exceed a totalof $4.2 billion.

- 58 -
2.49 As a consequence of Indonesia's liberal foreign exchange system,which provides for full convertibility of the Rupiah, It is difficult toobtain a clear picture of the extent of private non-guaranteed debt. However,based on BIS data and other creditor country reports, external private debt tobanks abroad at the end of 1984 is estimated to have been about $6.5 billion.Of this, medium and long term debt is thought to amount to about *3.8billion. With the high levels of domestic interest rates - which on aninflation adjusted basis axe higher than those prevailing abroad - there couldbe substantial demand on the part of the private sector for additionalexternal borrowing. This should be carefully monitored, since theseborrowings are generally made on less favorable terms than public sectordebt. At the same time, it is important to recognise that this debtrepresents part of the total obligations of the country. Such borrowing mustbe kept within reasonable limits, and - as stressed in Chapter 3 - used foreconomically sound projects.
Projections of Debt and Debt Service
2.50 Indonesia has followed a very prudent debt management strategy overthe past decade. As a result it continues to enjoy favorable access to theinternational capital markets, despite the uncertainties in the oil pricesituation. The rate of growth of overall debt has been moderate and privatedebts constitute only a small proportion of its total outstanding externaldebt. The total level of outstanding and disbursed public external debt(including LNG expansion) is estimated at $24.6 billion at the end of 1984.An additional amount of *9.6 billion of previously committed external publicdebt remains to be disbursed. The average maturity of public medium and longterm (MLT) debt is estimated at 14 years, while debt at variable interestrates accounted for less than one quarter of the total.
2.51 The public sector borroving program outlined above implies an averageannual growth of about 9% annually in the nominal value of public debtoutstanding and disbursed between 1984 and 1990, and a 7% increase during thefirst half of the 1990s. Private MLT debt is expected to rise more slowly, sothat its overall share in Indonesia's total external debts will declineslightly. In terms of the composition of public MLT debt, as Table 2.13indicates, the share of official assistance and commercial credits areprojected to rise significantly over the rest of the decade, while importrelated credits will decline. In the 1990s, it is expected that the share ofimport related credits will continue to decline, while the share of commercialcredits will correspondingly increase.

- 59 -
Table 2.13: DISBURSED AND OUTSTANDING MEDIUM AND LONG TERM DEBT, 1981-95($ billion at current prices)
Total debt Shares (%)1981 1984 1990 1995 1981 1984 1990 1995
Projected Projected
Public debtOfficial assistance 9.3 11.4 21.5 29.3 47.7 40.1 45.8 45.2Import related debt oncommercial terms 3.4 6.2 7.8 9.3 17.4 21.8 16.7 14.3Eurocurrency and otheruntied borrowings 3.2 5.3 10.9 18.2 16.4 18.7 23.2 28.0
LNG expansion - 1.7 1.2 0.7 - 6.0 2.6 1.1
Subtotal 15.9 24.6 41.4 57.5 81.5 86.6 88.3 88.6
Private debt 3.6 3.8 5.5 7.4 18.5 13.4 11.7 11.4
Totl 28..446r.9 64.9 100.0 100.0 100.0
Memo item:Debt-service ratios (%)
- Public (net) /a 14.4 25.1 29.8 27.1- Public (gross)7b 8.2 14.9 19.1 17.6- Total public and
private (gross) 10.4 21.1 23.8 22.1
/a The ratio of debt service to net exports, that includes gross merchandisenon-oil exports and net oil and ING exports (i.e. gross exports lessimports of goods and services of the oil/LNG sector).
/b The ratio of debt service to gross exports of goods and services.
Source: World Bank staff projections.
2.53 Under the base case scenario, at the projected levels of borrowingIndonesia's total public and private debt-service ratio, on a gross basis,would peak at 24% in 1989. It would then gradually decline to 22% by 1995.The public debt-service ratio, on a gross basis, would rise steadily from 15%in 1984 to 19% in 1989. After 1990 it would decline continuously to less than18% in 1995. On a net basis, the public debt-service ratio would rise from25% in 1984 to nearly 30Z in 1989, before declining to 27% in 1995. Whiledebt-service levels of these magaitudes are manageable for Indonesla, itsborrowing policies will clearly require continued careful attention. Withcontinued prudent borrowing, maintenance of a comfortable level of externalreserves to guard against temporary strains on liquidity, concerted efforts atexport promotion, and continued discipline in the public investment program,Indonesia should be able to retain its present high standing in internationalcapital markets.

- 60 -
CHAPTER 3
SELECTED POLICIES FOR GROWTH AND STRUCTURAL TRANSFORMATION
A. Introduction
3.1 The preceding chapters have highlighted (i) the significant progressIndonesia has made over the past two years in adjusting to a less favorableinternational oil market, and (ii) the challenge It faces in generatingadequate economic growtlh and structural transformation over the next decade.As argued in Part II of this report, success on these fronts is essential forproviding employment opportunities for a rapidly growing labor force. Thechallenge that lies ahead comes at a time when the external economicenvironment is beset by uncertainty and is likely to be, at least for theremainder of the 198 0s, less favorable to Indonesia than it was in most of theprevious decade. In particular, as discussed in Chapter 2, the country isexpected to face adverse terms of trade as well as slowly growing and possiblyvolatile oil revenues. Under this postulated scenario, development strategyand policies would need to be carefully formulated with a long termperspective in mind. While it is beyond the scope of this report to provide acomprehensive discussion of the issues involved, in this chapter selected keyareas of development strategy and economic policy are examined. The principaltheme running throughout the chapter is efficiency. In an era of resourcestringency, this is a natural focus, for without considerable strengthening ofthe productive base of the economy through efficiency improvements andjudicious iuvestments, future growth is bound to be lower than under thescenarios developed in Chapter 2. It is with higher growth that equityobjectives - a cornerstone of social policy in Indonesia - can best be served.
3.2 Against this background, Section B focuses on the inter-relatedissues of industrial development and trade policy. The development of abroad-based and internationally compe' tive industrial sector is essential forraising incomes, contributing to employment creation and reducing theeconomy's dependence on a narrow and vulnerable source of foreign exchangeearnings. The recent major policy actions on customs and ports operations,discussed in Chapter 1, should contribute to reducing costs in the industrialsector, and indeed in the economy as a whole. However, without earlyrationalization of the industrial and trade regime, there are considerablerisks that the economy will become increasingly locked into a high coststructure and that the tasks of economic management and structuraltransformation will become exceedingly difficult. Section C deals withfinancial sector policies needed to reduce intarmedia.Lon costs and improvethe range of services offered to private investors so as to lower investmentcosts and increase competitiveness. The final section of the chapter examinesselected issues related to efficient utilization of public resources for highpriority investments in order to enhance their contribution to overaleconomic and social development.

- 61 -
B. Industrial Development and Trade Policy
3.3 As noted in Chapter 1, there has been a significant slowdown in thepace of private investment activity in Indonesia over the past year,particularly among medium and large scale enterprises in the manufacturingsector. Market saturation, sluggish domestic demnnd growth and high realinterest rates were cited as the principal contributory factors. These,coupled with uncertainty over oil prices, and hence the future growth rate ofthe economy, have created a mood of greater caution, and perhaps even somepessimism, amongst the business community. Policy responses to thissituation, however, are constrailed by tighter external resource avallabilityand greater uncertainty in the external env 5ronment. Consequently, it wouldnot be appropriate for the Government to encourage major new capital intensiveinvestment initiatives in the private sector or, for that matter, amongstpublic enterprises, in areas where there are doubts as to their economicviability. Nor would it be advisable to reactivate the major investmentprojects rephased or rescheduled in early 1983.
3.4 The task confronting the authorities, therefore, is to develop astrategy for influencing private investment decisions uhich reflects thecountry's comparative advantage and takes full cognizance of the difficult anduncertain external trade situation faciLj the country. In this respect therole of industrial and trade policy would need to be carefully eamined withthe objective of encouraging efficiency improvements in existing investmentsand guiding nev investments into areas of comparative advantage. This sectionreviews the emerging problems in the manufacturing sector and the costsassociated with current trade and industrial policies and then discusses theneed for reform of the present incentive structure for investment inmanufacturing. It should, of course, be recognized that efficiency in theindustrial sector, as in the rest of the economv, depends not only ongovernment economic policies. The cost and quality of physical infrastructure- ports, land transport, power, telecommunications - entrepreneurial andmanagerial talent, the scale of production and the technology employed, andthe skill level of the workforce also profoundly influence efficiency. TheGovernmet's recent decisive measures on customs and ports regulations, andthe ongoing emphasis on investment in education and training at all levelsshould help improve the efficiency of both physical and human Infrastructure.However, it is the argument of this section that a reform of industrial andtrade policy is essential to the success of the campaign to reduce costs inmanufacturing so as to enhance its contribution to growth, incomes and exportearnings.
Emerging Problems in the Manufacturing Sector
3.5 Indonesia'E manufacturing sector value added grew at an impressiverate of U1.5Z p.a. between 1967 to 1982. This growth occurred in essentiallytwo phases. In the first phase before 1975, relatively labor intensiveconsumer goods industry grew at a rapid rate of 16.5- p.a. As the -easy'possibilities of import substitution were steadily exhausted, the need tomaintain the growth momentum in the sector and to widen its base led to theimport substitution of technologically complex upstream products. In the

- 62 -
second phase after 1975, intermediate goods production increased at the rateof nearly 18% p.a. on the strength of domestic demand and protection fromforeign competition. Towards the latter end of the period, there were majorincreases in the productioa of capital goods. with the bulk of the outputdestined for the home market behind high levels of protection, productioncosts for many products were high by international standards. Accordingly,exports of manufactures were relatively narrow-based and did not growappreciably in the 1970s, although, as noted in Chapter 1, slack demandconditions in the domestic market in the past two years have led to theemergence of new export products.
3.6 As discussed in Chapter 1, excess capacity is particularly pervasivein the cement, steel, tires, televisions, automobiles, motorcycles, textilesand plywood industries. Most of these sectors bad developed rapidly under theprotection of import quotas or complete bans, but the unexpected slowdown indemand after 1981 compelled reductions in output. In several other cases,however, optimistic market forecasts also contributed to the present glut incapacity. For example, it is unlikely that cement demand in 1985 would havereached the capacity level of 17.4 million tons even with uninterrupted growthover the past few years./l Similarly, continued growth in the demand fortires would still not have been sufficient to raise tire sales to the presentcapacity level of 10.6 million units in 1985. In these two subsectors, as inothers with excess capacity, export prospects will be limited owing to highproduction costs and international market conditions./2 Consequently, excesscapacity is likely to remain a persistent problem until the end of REPELIT& IV.
Recent Developmeats in Trade Policy and Industrial Strategy
3.7 The pattern of industrialization that has emerged over the past twodecades in Indonesia has been profoundly influenced by a range of governmentpolicies. These policies have been introduced to serve a number ofobjectives, among which are the deliberate creation of a broad industrialbase, generation of cmployment, promotion of exports, regional development andprovision of support to the economically weaker sections of society. The twomost important policy instruments employed have been: Ci) the protection ofdomestic industry from foreign competition through tariffs, quantitativerestrictions, outright bans on some imports, local content regulations and,more recently, importer licensing 13; and (ii) the close regulation ofbusiness activity through a complex licensing system, and the promotion ofinvestment in government-designated priority sectors by recourse to a varietyof tariff exemptions and other concessions granted by the Investment
/1 Demand in 1985 is expected to be slightly higher than 10 million tons.
/2 In the case of cement, manufacturers are being encouraged to convert tocoal-fired systems which could reduce costs by upto 12%.
/3 Import check prices and, before the introduction of VAT, the import salestax were two additional measures used to provide protection to domesticindustries.

- 63 -
Coordinating Board (BKPM)./l With respect to the choice of protectioninstruments, while reportedly the Government has not had a preference forquantitative restrictions, it has often accepted the industry's argument thattariffs alone are not sufficient because of the ineffectiveness of the customsadministration. With the introduction of the recent reforms on this front,the rationale for quantitative restrictions should now be less compelling.
3.8 The Reduction in Import Tariffs. Recent goveranment policy statementsand actions continue to emphasize the need for increasing non-oil exports.The January 1982 export decree and the March 1983 devaluation went some waytowards increasing incentives to export. In March 1985 the Governmentannounced a major reduction in the range and level of nomi&al import tariffs.Nominal tariffs have been reduced from a range of zero up to 225%, to a rangeof zero to 60%,/2 and most products have had their nominal tariffs reduced bybetween 50, to 35Z. The reduction in the dispersion of nominal tariffs willalso introduce greater uniformity in production incentives across differentindustries. In addition, in an important step towards greater simplification,the number of tariff levels has been reduced from 25 to 11. The tariffchanges, coupled with the new customs, ports and shipping regulations, shouldenhance the cost competitiveness of a wide range of industries.
3.9 Quantitative Restrictions and the Deletion Program. However, anumber of other recent actions of the Government have served to promote somepotentially costly and uneconozic investments which could provecounterproductive to the export drive. There are two areas of such actionsparticularly worth noting: (i) the increase in the categories of pr-^ductssubject to importer licensing accompanied by quotas and/or baus; and(ii) regulations requiring increased local content in final productsaccompanied by a 'deletion program".
3.10 With the onset of international recession and the slowdown in theexpansion of the domestic market in the early 1980s, Indonesian producersfaced increased competition from imports. In respoase to this and thepressures on the balance of payments arising from the weakening of the oilmarkets, the Ministry of Trade issued a decree in late 1982 providing generalauthority to regulate the importation of a range of products through licensedimporters. New decrees have since been issued for an increasing number ofproduct categories limiting the number of importers to two or three, oftenstate-owned trading companies; the Ministry of Trade also retains theauthority to decide import quantities, which in the case of manufactures isbased on advice from the Ministry of Industry.
3.11 The expressed purposes of this scheme are to increase importerspecialization, save foreign exchange, prevent dumping from abroad and promote
/1 As discussed in Chapter 1, the admainistrative reauirements for investmentlicensing were simplified beginning April 1985. The 1984 tax reformeliminated the tax incentives which BKPM could previously offer.
/2 Except for 19 product groups, or less than 0.5% of the total number ofproduct groups, which still have tariffs above 60%.

- 64-
the use of domestic industrial products, particularly those for which there issubstantial excess capacity. Another stated rationale for the introduction ofthese policies is to promote domes tic interlinkages. Strengthening industrialinterlinkages, particularly backward linkages, can help transmit growth fromone sector to the rest of the ecouomy. However, interlinkages administrativelyforged by government policies can rua the risk of raising production costs andlowering competitiveness. In the presence of a widespread use of tradebarriers it is inevitable that industries with strong backward linkages, whilesupporting the growth of uncompetitive upstream industries, are bhadered intheir own development by having to pay higher costs than imports.
3.12 For example, steel imports are controlled by a few tradingcompanies./l This policy was introduced to increase capacity utilization insteel production but in effect gives very heavy protection to steelproducers. Tariffs on steel and steel products range between only 1% and5%,/2 yet domestic steel producers charge prices which are between 26% and 50%above landed international prices.
3.13 High steel prices, in turn, raise the costs of production indownstream industries. A conservative estimate suggests these high steelprices raise costs of production for structural metal products by 10%, metalfurniture and fixtures by 9%, and cutlery, handtools and hardware by 7%./3Many of these products are manufactured in small and medium firms byrelatively labor intensive methods. High steel prices penalize these firms byraising their costs. This not only lowers the level of domestic demand fortheir products, but also reduces their competitiveness in internationalmarkets and curbs the growth of employment in manufacturing.
3.14 A further example of the impact of quantitative restrictions ondomestic costs is provided by the television industry. The import ban confersabsolute protection to television production. The industry now comprises alarge number of small firms, served by 20 foreign brands, which cannot capturethe benefits of cost reductions from scale economies. Televisions and otherelectronic consumer goods are therefore between 20% and 50% costlier inIndonesia than in international markets, despite the fact that the industry iswell over a decade old in Indonesia. The import ban on televisions isaccompanied by a 30% tariff on knocked-down assembly kits (CKD) and 40% on
/1 P.T. Krakatau Steel, a public sector steel company responsible for theSilk of Indonesian steel production, is solely responsible for the import ofscrap, slabs, billets, hot rolled coils, wire rods and rerolled sheets;P.T. Giwang Selogam, a private sector company, has a monopoly over imports ofcold rolled sheets used extensively in the automotive sector; P.T. Timah, apublic sector company, Is the licensed importer of tin plates; and two publicsector trading companies, P.T. Kerta Niaga and P.T. Dharma Niaga, are licensedto import finished steel products.
_- Other than wire rods, which is protected by a tariff of 20%.
13 These are estimates made on the basis of input-output coefficients givenin the 1980 Input-Output Tables published by BPS.

- 65 -
electronic components./l This differential tariff structure has encourageddomestic producers to rely on CRD imports, rather than developing indigenoustechnology based on cheap components from alternative suppliers. In addition,electronic components can only be imported by a few licensed importers, addinganother step to the import procedure and raising component costs yet further.Instead of enabling a free flow of components at lowest possible costs tostimulate the development of the electronics industry, the differential tariffstructure has served to perpetuate the dependence of the industry on thetechnology embodied in high-cost CKD kits.
3.15 In a bid to accelerate the local manufacture of the component partsof completely knocked down (CKD) kits, the Government has, in severalinstances, introduced a deletion program designed to reduce gradually thenumber of parts that can be imported for assembly. Deletion programs havebeen a cornerstone of the Government's strategy for some time in theautomobile and motorcycle industries. More recently, the Governmentintroduced deletion programs for the production of tractors, heavy equipment,diesel generating sets, and machine tools.
3016 The diesel engine subsector is an example of how deletion programsadministered by the Government may affect production and investmentefficiency. The c.i.f. import price of CKD kits for diesel engines is oftenas high, if not higher than the c.i.f. import price of completely built-up(CBU) units. This is because international suppliers are not geared tosupplying CKD kits which require special packaging and handling, the cost ofwhich is higher than the assembling of the engine itself. As a consequence,assembly of diesel engines from imported parts does not appear to be aneconomically viable production activity, but owing to substantialdifferentials in tariffs for imported CKD kits and CBU units, the fivedomestic assemblers of diesel engines supplied 60% of total market demand by1982. The only way the industry could be made efficient is if low costcomponents could be produced domestically. This supplied the rationale forthe diesel engine deletion program. One third of the required parts fordiesel engine assembly are already produced in Indonesia as a result of thedeletion program, and the Ministry of Industry projects the domestic contentto increase to 80Z by 1990.
3.17 There are two problems that could arise from such a strategy. First,while there is little doubt that upstream integration is an essential aspectof the industrialization process, the manner in which it is implemented iscritical to the final result. Thus, upstream integration in the diesel engineindustry may be appropriate for Indonesia, but scale considerations suggestthat this need not translate itself to upstream integration in every firm.Yet, given the difficulties of new investors in acqulring investment licences,the implementation of the deletion program has encouraged each manufacturer toset up captive component production facilities; this has discouraged theemergence of international-scale component manufacturers capable ofsimultaneously supplying a number of assemblers. This is compounded by the
/1 Under the new tariff regulations, the concept of CKDs for electronics hasbeen eliminated. Instead, the tariff rate on components is now 5%.

- 66 -
relatively small size of the Indonesian market by world standards (53,000diesel engines were produced in 1983). The cost-raising effects of lowproduction levels within each firm cannot be overcome without rationalizationof the existing Industry and the creation of export markets that can supportinternational scales of production. The second problem arising from adeletion program is that its forced pace has the effect of significantlyraising costs of production, particularly as more and more complex parts, orparts requiring large scale production, are mandated to be produceddomestically. However, production could proceed for several component partsthat can already be produced cost effectively in Indonesia, and several morecould be added to these after a reasonable learning period. The failure toincrease production efficiency wili lead to the creation of a potentially highcost, low volumse diesel engine industry which rims the risk of imposing a costburden on downstream users of the equipment. Greater attention, therefore,needs to be given in advance to the ultimate economic viability and timing ofnew investments, the optimal scale of production, and the level of localcontent that can economically be supplied from domestic sources. In essence,premature import substitution should be avoided, particularly when it imposescost penalties on downstream industries.
The Costs Associated with the Present Policy Environment: Some Evidence
3.18 Government policies designed to protect the manufacturing sector havecontributed to the developmpnt of many inefficient industries which producegoods at higher cost than comparable imports. The extra cost to domesticconsumers amouats to an Implicit subsidy to producers. In last year'seconomic report we cited the example of a few products (cement, steel, colorTVs) for which the implicit subsidy per worker employed was very high./ITable 3.1 provides additional evidence indicating the implicit subsidy perworker for a number of other products. The wide range of productionactivities receiving implicit subsidies through the incentive system raisesthe important issue of whether Indonesia, given its present ard-- foreseeableresource constraints, can afford to continue such subsidies over a prolongedperiod without incurring a heavy penalty in terms of overall economicperformance.
3.19 As important is the wide disparity in assistance provided todifferent industries. For example, the implicit subsidy per unit of valueadded in the production of non-alcoholic beverages is 23 times as much as thatprovided to wood and rattan furniture, and 40 times greater than finishedtextile products. Export oriented industries are disadvantaged by theincentive system because, though they obtain high-cost inputs from domesticsuppliers, they have to sell their products on the international market on acompetitive basis. This amounts to a tax on the production of these items,which in the case of garments can be as high as 20% for every unit of value
/1 Indonesia - Policies and Prospects for Economic Growth and Transformation,World Bank Report No. 5066-IND, April 26, 1984, page 101.

- 67 -
added./l Potential exporters are consequently either uncompetitive ininternational markets or find it financially more rewarding to sell theirproducts in the domestic market behind high protective barriers. Indonesiaacceded to the GATT Code on Subsidies and Countervailing Duties in March 1985and, in accordance with GATT provisions the Government has announced itsintention to phase out certain types of export incentives. This underscoresthe Government's determination to improve the efficiency of the industrialsector and supporting services. Specifically, within the next two years,Indonesia will replace the export certificate scheme with a formal dutydrawback system which would ensure that duty exemptions or rebates areprovided only for the actual duties paid on imported Inputs. In addition, theGovernment has announced that preferential interest rates provided toexporters for short term export financing will be phased out over the nextfive years.
Table 3.1: IMPLICIT ANNUAL SUBSIDIES PER WORKER IN SELECTED INDUSTRIES, 1984
Industry Total implicit Implicit annualannual subsidy /a subsidy per worker
(Rp. billion) (Rp. million)
Motorcycles 53.2 5.9Cosmetics 67.1 4.7Motor Vehicles 134.4 4.1Glass 37.5 3.1Sugar 137.6 1.6
/a The volume of output multiplied by the difference in value added atdomestic and international prices.
Source: World Bank staff estimates.
3.20 In addition to substantial transfers from consumers to producers, thehigh protection of manufactures also tends to encourage uneconomic productionactivities. Table 3.2 presents estimates of the value of domestic resources(labor and capital) used in saving one US Dollar (for imports) or earning oneUS Dollar (for exports) for selected manufactures./2 In the case of somemanufactures (e.g. AC generator sets, color TVs and shock absorbers), theimport cost of components is greater than the import price of the completelybuilt up unit. The domestic production of these items actually results in
/1 Other manufacturing activities which are taxed in this menner by thepresent incentive system include the production of some textile products, someindustrial chemicals, meat canning and chocolate.
/2 The estimates of domestic -esource costs used here suffer from datalimitations, and hence should be viewed as broad orders of magx2itude.

- 68 -
foreign exchange losses to the economy in addition to the domestic resourcesused in their production. In the case of other selected manufactures shown inTable 3.2, efficiency In the use of domestic resources varies considerably.At an exchange rate of US$1 - Rp. 1,100, about US$5 worth of domesticresources go into the production of sheet glass and tires to save Ustl inimports, a loss of US$4 to the economy. Similarly, for motorcycles, US$2worth of domestic resources are used to save US$1 in imports, a loss of US$1.These estimates provide prime facie evidence of the high social cost of suchactivities. On the other hand, the two export oriented activities in thesample, palm oil refining and rubber processing, earn foreign exchangeefficiently.
Table 3.2: DOMESTIC RESOURCES USED IN SAVING OR EARNING US$1(FOR SELECTED MANUFACTURES, 1985)
Production Sector /a Domestic resources used Implicit subsidyof (IS-Import substitute) in saving or earning per unit of
CEO-Export oriented) US$1 (in Rp) value added /b
AC generator set IS .. NVA /cColor TV IS .. NVAShock absorber IS .. NVASheet glass IS 5,370 3.87Tires IS 4,720 0.92Bajaj IS 3,390 0.62Motor cycle IS 2,100 0.65Polyester cloth IS 1,770 0.60Shirt IS 1,370 0.17Refined palm oil ED 870 -0.36Processed rubber ED 762 -0.49
Not applicable/a Export orieated Industries are defined as those which export more than 5%
of their output./b The figures are the effective rates of protection expressed as a ratio.
They are net of taxes and any other transfer payments./c Negative domestic value added at international prices. This indicates
that the cost of imported components is greater than the internationalprice of the final product. Hence, the contribution of the activity tothe balance of payments is negative.
Source: World Bank staff estimates.
3.21 It must be stressed, however, that import substitution activitiespr se need not be uneconomic, provided they are competitive with comparableimports, after allowing for a reasonable learning period. But the assurederection of high protective trade barriers tends to encourage investments

- 69 -
which are not internationally competitive and utilize domestic resourcesuneconomically. The evidence presented in Table 3.2 tends to support theconclusion that the more the protection accorded to a manufacturing activity(measured as the implicit subsidy per unit of value added), the greater arethe domestic resources required in earning or saving one US Dollar.
The Need for Change in Industrial and Trade Policy
3.22 The macroeconomic framework in Chapter 2 projects the mnnufacturingsector to grow at 8% p.a. between 1985 and 1995 compared to 4% p.a. in thefirst four years of the 1980s and 14% p.a. in the 1970s. Unlike the 1970s,future industrialization would now need to be achieved in an environment ofresource stringency. As a consequence, not only would new investments in themanufacturing sector need to be more efficient, but greater efficiency wouldneed to be achieved from existing investments. In the short run, providingdemand conditions permit, the efficiency of existing investments wouldincrease as capacity utilization rises. However, even at full capacity, manyfirms in various industries would not be capable of reaching internationallevels of competitiveness owing to problems of scale, old technology or otherinefficiencies. On the other hand, cost reductioas would lead to lowerprices, thereby effectively expanding the domestic market as well as enhancingexport coylpetitiveness.
3.23 Rapid industrial development in the coming years will also need to beachieved in an environment of slower growth in incomes and domestic demandthan In the past. Achieving high manufacturing growth in the face of lowerdomestic absorption requires a shift in emphasis towards exports. The basecase projections in Chapter 2 indicate that to achieve a 5% non-oil GDP growthrate, the manufacturing sector would need to grow by 8-9% p.a. over the nextten years. The narrowing scope for efficient import substitution implies thatexports of manufactures would need to rise by almost 11% p.a. (in real terms)to meet this target. Given Indonesia's low base of exports of manufactures,and provided that the mix is diversified, a rate of expansion of this order isunlikely to face external demand constraints.
3.24 During the 1970s, only about 10% of the growth in manufacturingoutput on average was accounted for by export expansion; for the period1986-90 this would need to rise to 12%, and thereafter to 14%./l Such a shiftin the patteru of demand is deemed essential for achieving the growth targetsfor manufacturing and (YDP as a whole. Generating the requisite export growthcalls for a policy environment which induces domestic manufacturers to acceptthe challenge of selling their products in the international as well as thedomestic market.
/1 The sources of growth are measured as the percentages of the increment inmanufacturing gross output, and add up to 100%. Other than export expansion,the sources of growth are domestic demand expansion, import replacement -andtechnological change.

- 70 -
3.25 The recent government initiatives in streamlining customs procedures,reducing port costs and lowerlig nominal tariffs are important steps in thisdirection. But, as noted earlier, the growing importance of quantitativerestrictions on imports, and a rigid application of local contentrequirements, run counter to the thrust of these important measures.Continuation of these trade barriers will adversely affect Indonesia's exportperformance, GDP growth and the external payments position. By way of anillustration, we have explored the implications of a lower export growth (i.e.5% p.a.) of manufactures. In such a situation, total export earnings in 1995would be $5.6 billion lower than in the base case. If confronted with thisprospect, Indonesia has two possible options. First, the Government couldseek to maintain balance of payments stability by reducing the growth rate;this was depicted as Scenario III in Chapter II. Lower growth wouldnaturally have adverse implications for employment and incomes, a subject morefully explored in Part II of this report. In- this scenario, the debt-serviceratio, though manageable, will also be higher than indicated by prudent debtmanagement standards. Second, in order to attain a GDP growth rate of 4.5%p.a., the Government could borrow more from international capital markets tocompensate for the export earnings shortfall. The consequences of such astrategy are depicted as Scenario IV in Table 3.3. It indicates that totalexternal debt would rise to over $83 billion by 1995 compared to $65 billionin the base case, and that the total debt-service ratio would consequentlyrise steadily reaching a high level of 28% compared to 22% in the base case.It is unlikely that such levels of borrowing and debt servicing could bereasonably managed without affecting Indonesla's international creditworthiness.
Table 3.3: PROJECTED PERFORMANCE INDICATORS UNDERALTERNATIVE TRADE POLICIES, 1986-95
Base Case Scenario III Scenario IV1986-95 1986-95 1986-95
Growth (in percent)GDP 4.5 3.7 4.5Manufacturing GDP /a 8.0 6.2 8.0Exports of manufactures 10.4 5.0 5.0Gross investment 5.1 4.5 5.1
Other indicators 1995 1995 1995
Debt-service ratio (Z) /b 22.1 26.4 28.0Total external debt ($ billion) 64.9 71.3 83.5
/a Excludes LNG.7% The ratio of total debt service to gross exports of goods and services.
Source: World Bank staff estimates.

- 71 -
3.26 Both scenarios III and IV are unattractive outcomes for Indonesia andemphasize the importance of achieving rapid expansion of exports ofmanufactures. No doubt, there are marketing risks associated with anexport-based growth strategy, particularly those arising from the increasinglyprotectionist measures adopted by industrial nations. But the presentinward-oriented approach runs the more insidious risk of promoting a range ofhigh cost industries that will impose a progressively heavier burden on thecountry's resources and make it increasingly difficult to accelerate theexport of manufactures. The longer the present policies continue, the moredifficult and costly becomes the task of improving efficiency and realigningdomestic industry with the country's resource availability and dynamiccomparative advantage.
Some Elements of Trade Policy Reform
3.27 The previous paragraphs have argued that further Industrialdevelopment through increased protection and intervention would not beconsistent with the objectives of promoting efficiency and growth. Futurepolicies need to ensure that new investments are channelled into economicallyviable activities requiring little or no assistance in the form of protectionor subsidies. There is also a need to render existing investments moreefficient so that their contribution to economic growth could be steadilyenhanced. The transition from the present system to one which places apremium on efficiency aad competitiveness iu both export oriented and importsubstituting Industries will require time and careful management. It isbeyond the scope of this report to offer a detailed blueprint for thechangeover; rather, some broad considerations with regard to trade policyreform are outlined below.
3.28 First, as we noted earlier, import bans /1, deletion programs, andquantitative restrictions have been an important contributory factor in raisingproduction costs in manufacturing. The reduction of these costs will not onlyhelp to increase the competitiveness of non-oil exports, but also, by reducingdomestic prices, help to expand domestic demand for mnnufactures. In the shortrun, refraining from the introduction of new bans and replacing the existingones with tariffs should, therefore, have the highest priority. In shiftingfrom bans and quantitative restrictions to tariffs, anti-dumping laws and asystem of countervailing duties would need to be established to ensure thatIndonesian manufacturers are not seriously affected by dumping from abroad.
3.29 Second, in the medium term, to reduce the bias against exports and topromote efficient investments (both public and private), it is essential toreduce the existing high levels of protection. A step in this direction hasalready been taken with the recent lowering of tariff rates. However, thetariff reductions may generate pressures to introduce new quantitativerestrictions; such pressures should be firmly resisted. Moreover, inencouraging private investment activity, it would also be advisable to resist
/1 Including the negative list used by BKPM which itemizes those capitalgoods that cannot be imported but must be procured lot-ally.

-72-
the temptation of offering a protected domestic market as an inducement topotential private and foreign investors. In the medium to long term this willonly serve to promote and sustain inefficient indostrial investments andfrustrate efforts at improving the efficiency of existing industries. Thefirst priority, therefore, should be to improve efficiency in the industrialsector. An efficient industrial sector, in turn, could provide a strongincentive for foreiga investors to invest in Indonesia. Such investments, ifmade judiciously, would help to promote growth, diversify the structure ofexports, and increase export earnings. Care should, however, be exercised toensure that foreign investment is attracted to ecoaomically viable activitiesand areas. In addition, disparities in the rates of protection would need tobe further reduced. The realignment of tariffs will impact differently onvarious industries and firms. Some subsectors wlll benefit but others will benegatively affected. In some negatively affected subsectors, firms will beable to adjust to the new circumstances with improvements in efficiency. Inothers, the short term effects could prove disruptive to production andemployment; but, if their longer term viability caa be established, there is acase for providing temporary and time-bound government support for theadjustment process. The kind of government intervention required may differfrom subsector to subsector and would need to be the subject of specialstudies on each. For example, in the pulp and paper subsector, restructuringwould need to take the form of fewer, larger and more energy-efficient firms.Government assistance could be in the form of providing long term finance andtechnical assistance, particularly to help manufacturers adjust to a newprodact mix and new markets.
3.30 The engineering sector provides a useful focus to examine how tradeand industry policies can be applied to promote efficient and dynamicdevelopment. It is a sector which holds significant development potential inIndonesia, but where strategic mistakes can also prove very costly. Until nowthe development of the engineering sector has closely followed the incentivestructure that governs investment and production in the industry as a whole.High protection, often supported by import bans, has encouraged largeinvestments in the manufacture or assembly of complex products such as motorvehicles, heavy plant equipment and large ships. The expectation has beenthat this would lead to the formation of a supplier network and generateupstream employment. On the other hand, unsupported by the policyenvironment, light machinery and equipment /1 production contribute a verysmall share of engineering sector output and comprise a large share of capitalgoods imports. Yet Indonesia appears to have a potential dynamic comparativeadvantage in these products, as they require fairly straightforwardmanufacturing and product technologies, and use relatively labor intensivetechniques of production. Existing firms in this subsector already exhibitpotential for international competitiveness. The mzastery of the technologyused in these subsectors could provide the strong technological base Indonesia
/1 For example: cables, springs, gears, engine cams, metal containers,cu lery, building products, simple fabrications, hand tools, water valves,bearings, sheet metal products, simple plate products, industrial pumps,industrial valves, light cranes, hoists, light agricultural machinery, lightconstruction machinery, etc.

- 73 -
needs to enter more complex production processes. This argues for a shift inemphasis towards light engineering goods. Not only does this require changesin the policy enwir iment and incentive structure, but also active governmentsupport to rationalize existing industries so they can compete moreeffectively with imports without requirlug high protection.
C. Issues in Financial Intermediation
3.31 The financial system has an Important role to play in supporting thechanges in trade and industrial policies discussed above, and facilitating thestructural transformation of the economy. Firstly, the financial system willneed to mobilize and provide financial resources to the industrial sector aswell as other borrowers efficiently and at reasonable cost. As noted, thecost of credit in Indonesia is quite high and this is causing considerablestress on the financial position of many firms; these costs will need to bereduced through increased efficiency of banks (see below). Secondly, theprocess of industrial and trade policy reform will inevitably hurt someindustries, and force others to restructure, modernize and adapt theirproduction structure in order to become competitive. The financial systemwill1 need to assist such industries to become competitive and efficient byproviding technical assistance and financing packages to enable suchenterprises to undertake financial restructuring as well as new iuvestmentdesigned to restructure and adapt their physical production capacity.Thirdly, financial institutions can contribute to the development of anefficient industrial sector through sound appraisal of projects and theprovision of technical assistance and advice, especially to smaller businessesand new entrepreneurs. To achieve these goals, it is necessary that financialinstitutions become more viable and self-reliant, are able to operateindependently and have the capacity to assess risks and make good creditjudgements. In addition, the development of institutions in the financialsector needs to be encouraged, so as to provide more financing sources andoptions to potential investors than is presently available.
3.32 As discussed in Chapter 1, the June. 1983 reform has cleared the wayfor the evolution of more self-reliant inscitutions in the financial sectorand greater competition. As noted, however, a number of issues have alsoemerged. Among those which require further attention are: Ca) how to reducethe presently high cost of credit evem after adjustment for inflation; (b) howto increase the flow of term lending through commercial banks; and (c) how tostrengthen institutions, particularly the development banks and the capitalmarket.
Cost of Credit
3.33 Given Indonesia's open capital account, the close linkages betweendomestic interest rates and those abroad and the complex factors influencingthe formation of exchange rate expectations in Indonesia, particularlyuncertainties with regard to future oil price movements, it is difficult forthe Government to bring down domestic deposit rates. On the other hand,intermediation costs of state banks (which account for the bulk of term

- 74 -
lending in Indonesia) are relative Ly high; and actions by these banksthemselves to improve their effici3ncy and reduce their intermediation costscould provide an important means of reducing lending rates over the mediumterm. This is an important task: if these high interest rates cannot bereduced, they could impede the structural transformation of the economy.
3.34 Intermediation costs of state banks presently average about 7-8percentage points of the interest rates charged. They malnly reflect highadministrative overheads and large write-offs. There is considerable scopefor reducing intermediation costs through improvements in the organizationalstructure and operating procedures of the state banks and reduciugwrite-offs. In general, organizational restructuring, improving managementcontrols, rationalizing personnel use, and improving credit review procedurescould lead to a significant reduction in the banks' costs.
3.35 The state banks are keenly aware of these needs. They have begun totake steps to improve their operational efficiency in many of these areas;some have embarked on major organizational Improvements. But more needs to bedone. Given the magnitudes of arrears and high write-offs, banks will alsoneed to launch aggressive collection efforts to collect past due loans, and tostrengthen their loan collection and recovery capabilities. In addition, inorder to induce banks to Improve their loan collection efforts, present creditinsurance arrangements /1 should be improved by reducing insurance coverageprovided by ASKRRINDO and raising the premia paid by banks to reflect thenature of risks covered.
3.36 The high cost of credit could be also brought down somewhat bylowering the cost of funds of banks. Towards this end, banks will need toexpand their base of low cost (particularly demand) deposits, for example bypromoting the banking habit through such measures as opening of branches inurban residential and rural areas, setting up special rapid service windowsfor cashing checks, improving the quality of services and environment in bankoffices and creation of savings accounts with unrestricted withdrawal rights.The banks' costs of funds could also be reduced somewhat if Bank Indonesiawere to pay interest to banks (for example, close to the average costs ofdeposits of banks) on banks' reserves held with BI. At present these reservesearn no interest; and this adds about 1-1.5% p.a. to the effective cost offunds of banks.
Long Term lending
3.37 On the supply side, state banks appear to be less inclined thanbefore to provide long term loans, due to increases in their deposit rates andrisks after the financial sector reform, informal restraints on lending rates,and the shortening of their deposit mix (see Chapter 1). In order to inducebanks to increase term lending, long term lending rates of state banks willneed to rise to reflect their costs and risks of lending. This would
/1 At present, 75S of aUl priority loans of banks are automatically insuredby the state credit insurance agency - ASKRINDO; the responsibiLlity ofcollecting bad loans is generalUy left to ASKRINDO and the governmentcollection agency which is heavily overburdened.

- 75 -
initially raise costs to borrowers. But, if banks lend at variable rates, asinterest rates decline, the average cost to borrowers could be reduced overtime as compared to the cost under the present fixed long term rates. Inaddition, by capping debt-service payments, and if necessary, by extending thematurity of loans, it is possible to protect borrowers and match theirdebt-service payments with the cash flow of projects. In order to improvetheir deposit mix, banks will need to diversify the range of instrumentsoffered to depositors and promote longer term CDs; the latter however,requires greater differentiation of deposit rates than is presently paid an 12and 24 month deposits, particularly by state banks./l Secondly, if theGovernment were to continue to run surpluses with Bank Indonesia, the lattercould place such funds as CDs with banks aad help improve their deposit mix;however, the extent to which this could be done wlll depend on the growth ofgovernment deposits and considerations of liquidity management.
Institutional Development
3.38 An important area requiring the Government's attention Is thestrengthening of development banks. These banks are already a major source ofinvestment fimance; and they should be retained as a major source of termfinance. These banks could also play an important developmental role throughthe appraisal and supervision of projects and technical assistance to smallerand new entrepreneurs. It is also desirable to strengthen these banks asspecialized longer term financing institutions, since the commercial banksalready provide an adequate supply of short term loans.
3.39 In order to make development banks more effective, it is necessary tobuild up their institutional capabilities and make them financially viable.A particularly serious problem facing these banks is the poor quality of theirportfolios. qowever, this problem is not confined to the development banks.There are some signs that the por-folios of the commercial banks have alsodeteriorated in the past 12 months. To improve portfolio quality,(a) action plans should be drawn up to deal with problem loans (by writing offbad loans, rescheduling those which are likely to become delinquent, andmaking adequate provision for possible losses), and special loan recoveryunits should be set up to improve loan recoveries; (b) appraisal qualityshould be improved by consolidating operations, strengthenIng creditdepartmeats at head offices and inproving quality control and screeningmecbanisms; (c) the quality and size of staff in loan appraisal andsupervision work should be improved through hiring additional staff and stafftraining; (d) subsector restructuring programs, with government assistance,should be started to assist projects which have become delinquent due tochanges in government policies concerning subsectors; and (e) finally, thelegal system for recovery of loans and foreclosures should be streamliued.
3.40 To encourage the development banks to reduce their reliance ongovernment funding over time, a three-pronged approach could be adopted:(a) long term lecding rates should be allowed to find their marketequilibrium. This would enable the development banks to match their lending
/1 Most state banks' deposit rates for 2 year deposits are currently belowtheir rates for 12 month deposits.

- 76 -
rates with their risks and collateral and differentiate between borrowersaccording to such risks; Cb) the Government's equity contributions should beincreased in order to build up the capital base of development banks, toenable them to keep down their average costs of blended funds and to borrowfrom the market; (c) encourage development banks to raise funds directly fromthe market.11 While such steps should enable development banks to cover thecosts of their normal operations, the additional costs involved in providingtechnical assistance and promotional work to smaller borrowers should befinanced by the Government.
3.41 While improvements in the efficiency of the banking system are theclear priority, givem the importance of bank debt financing in the economy,the capital market should be developed as an alternative source of investmentfinance. In particular this would also help improve the financial strength ofenterprises by increasing their equity base and reducing their relanace ondebt. Among the measures which are needed to revive the capital market themost urgent is the removal of discriminatory tax treatment. This could bedone either by removing the tax exemption of time deposits, or by extendingthe same concession to capital market instruments. Given the risk of capitalflight, the practical option may be to exempt interest and dividend incomefrom capital market assets from income and withholding taxes. This isunlikely to lead to sigaificant revenue losses. Reform of the prevailingregulatory framework, and encouraging the growth of new financial instrumentsand institutions could also help to increase capital market activity levels.
D. Public Investment: Issues and Priorities
3.42 The preceding section has stressed the importance of creating anenvironment which is conducive to improving efficiency and more judiciousinvestment decisions in the industrial sector. Efficient utilization ofscarce public resources for high priority investments is also essential forimproving overall economic performance. In this section, we discuss theimplications of this outlook for both the levels and composition of publicinvestment. The discussion is organized around the following issues:(i) appropriate levels of public investment, given the projected availabilityof investible resources; (ii) key considerations that should guide publicinvestment priorities over the medium term; and (iii) proposals forstrengthening investment planning and project appraisal.
Resource Availatility for Public Investment
3.43 The macroeconomic projections developed in Chapter 2 suggest that theavailabiLity of foreign exchange resources for investment will remain tight.Against this background, we have projected total investment to remain ataround 2OZ of GDP through 1990 and then to gradually rise in later years. TheGovernment is keen to harness the private sector to this investment effort.
/1 Through time deposits and CDs at competitive ratee, direct placements withpension funds and insurance companies at market rates and bond issues in thecapital market.

- 77 -
However, for the time being the response is likely to be sluggish, given theexisting business conditiocs of excess capacity and high real Interest rates.Public investment will therefore have to be sustai-ad at about 1OZ of GDP,roughly the average over the past decade.
3.44 The REPELITA IV public investment target only covers expenditures bythe Central Government./1 Hovever, in projecting total public investment, wehave taken account of the Government's commitment to move a larger share ofpublic investment off the budget, by financing more projects from the internalfunds of public enterprises aad domestic bank borrowing. On balance, we haveprojected such off-budget financing to account for about one qutater of publicinvestment over the next few years. This share is somewhat higher than theestimate for 1985 but in line with historical expu rience.
3.45 In principle, a staller share of public enterprise investmentfinanced through the budget is desirable: it helps encourage publicenterprises to become more commercially viable and to be more selective intheir choice of projects. Some public utilities, such as PLN and PERDMIEL,shouLd be able to finance a substantially larger share of their investmentsfrom internal funds. However, given the weak financial position of manypublic enterprises, especially those in the industrial sector, there is adanger that some public enterprises -ill be tempted to borrow beyond prudentlimits. Continued caution will therefore have to be exercised, to ensure thatthe projects undertaken have adequate economic rates of return, and thatoverall levels of public investment and related import requirements remainwithin affordable limits.
Public Investment Priorities
3.46 In the following paragraphs we explore some of the considerationswhich should guide public investment priorities over the next few years.Particular attention is paid to the following concerns: Ci) the impact of thetight and uncertain balance of payments outlook on public investmentpriorities; (ii) the need to provide productive employment to a growing andincreasingly educated labor force; (iii) the importance of relatinginvestments to prudent estimates of existing or emerging demands in theeconomy; and (iv) the constraints imposed by project implementation capacity.
3.47 In the light of these considerations, this report takes the positionthat the sectoral composition proposed for REPELITA IV is broadlyappropriate. The proposed reallocation of resources (compared to actualexpenditures during REPELITA TiI) from industry and mining to the socialsectors - shown in Table 3.4 - should bave a favorable impact on the import
/1 Development expenditures include two important components of publicinvestment (direct government investment and budgetary transfers to publicenterprises), as well as some recurrent expenditures (such as the fertilizersubsidy). The recurrent expenditures are deducted In deriving the publicinvestment series used in this report. Development expenditures authorised butnot spent, as reflected in the Government's cash balance with Bank Indonesia,are also deducted.

- 78 -
intensity of investment and employment generation, as well as make a majorcontribution towards human resource development. Indeed, given the overallresource constraint discussed above, additional efforts to protect highpriority investments, especially in agriculture and the social sectors, maywell be justified. However, at best, broad sectoral al locations can onlyhighlight the major issues and trade-offs the Government will face ininvestment planning over the next few years. In the final analysis,investment decisions wil have to be taken in the context of well-form-flatedsectoral programs and based on sound project appraisals.
Table 3.4: SECTORAL COMPOSITION OF DEVELOP.MNT EXPENDITURE(in percent)
REPELITA III REPELiTA IVSector plan Actual Plan Budget /a
Productive sectors 15.9 27.1 17.6 19.5Agriculture /b 6.9 7.9 6.8 8.5Industry Ic 7.1 12.0 7.5 8.4Mines 1.9 7.2 3.2 2.6
E-onomic infrastructure 34.1 25.5 30.8 28.0Irrigation 7. 4.5 5.9 5.0Energy (Udc. Power) 11.6 7.9 12.2 9.7Communications & Tourism 15.5 13.1 12.6 13.3
Social sectors 16.6 15.9 22.9 22.3Education & Culture 1. a2F3 14.7 7T3Health & Population 3.8 3.5 4.5 3.9Housing & Resettlement 2.4 2.5 3.8 4.1
Other sectors 33.4 31.5 28.7 30.2
Total 100.0 100.0 100.0 100.0
/a For 1984/85 and 1985/86.7% Includes fertilizer subsidy.7W Includes government equity participation.
Source: REPELITA III and IV, and Ministry of Finance.
3.48 Impact on imports and employment. The analysis presented in thisreport emphasizes the importance for Indonesia to follow a relatively laborintensive development path. Public investment plays a major role in thisstrategy, both through its influence on the pattern of growth (e.g., bypromoting crop diversification in agriculture and the development of exportoriented industries) and through its requirements for imports and labor. Tohelp calculate the latter, we have estimated sectoral import and

- 79 -
employment coefficients for development expenditures. These coefficients,summarized in Table 3.5, take into accomt the direct impact of publicinvestment on imports and employment, as well as the import and employmentcontent of domestically produced goods used for public investmentJ1l
Table 3.5: IMPORT AND ENPLOIMERT COEFFICIENTS /a
Imports /b Employment /c
Productive sectors 0.71 0.14Agriculture 0.45 0.22Industry 0.87 0.09Mines 0.91 0.06
Economic infrastructure 0.69 0.23Irrigation 0.50 0.31Energy 0.79 0.16
Social sectors O. 0.45
___________- 0.57 0.33
/a Aggregations are based on the plan allocations for REPELITA IV.7h Coefficients shov the import requirements (in rupiah) per rup. h of
development expenditures.,c Coefficieats show the labor requirements (in man-years) per million rupiah
of development expenditures (in 1980 prices).
Source: World Bank staff estimates, using the 1980 Input-Output Tables andexpenditure/final demand relationships developed by the ILO Employmentand Income Distribution Project in the Ministry of Manpower.
3.49 As would be expected, there is a marked variation in the coefficientsamong sectors. Every rupiah invested in the social sectors, for example,requires half as much imports and generates three times as much employment as asimilar investment in industry, mines or energy. Similarly, the coefficientssuggest that government expenditures in the agricultural and irrigation sectorswould have a greater employment effect and result in fewer imports than if asimilar amount were invested in the industrial or mining sectors. The overallimpact of alternative patterns of public investment on employment creation isdiscussed further in Part II of this report.
11 This is still a very partial analysis, which does not allow for themultiplier effects of investment expenditures, nor the impact of alternativeproject choices on sectoral coefficients. Nevertheless, the results areinstructive.

- 80 -
3.50 Ultimately, of course. all public investment projects should besubjected to thorough economic analysis at the appraisal stage, and onlyundertaken if the rate of return on full ecoaomic cost is consideredsatisfactory. For example, some capital intensive projects, such as therecently completed LNG projects, can have a very positive impact on both netforeign exchange earnings and income generation over the medium term. Butthere is still considerable scope for improving the import and employmentimpact of public investment through appropriate project selection and design.There is also a concern that large capital intensive projects can preempt anundue share of future resources, thereby making adjustments to changes in theexternal environment that much more difficult. In addition, there iscompelling evidence to suggest that labor intensive techniques are oftenappropriate under Indonesian conditions.
3.51 Demand issues. The previous section noted the scope available forgenerating employment and conserving foreign exchange by varying the patternof public investment. But changes in the sectoral distribution of publicinvestment must also take into account the pattern of demand for economic andsocial infrastructure. As shown in Table 3.6, there are a number of key areasof economic and social infrastructure where Indonesia's development still lagsbehind other countries in the region, even allowing for income differentials.The relatively low ratios for electrification, secondary school enrollment andhealth services are particularly striking. These are all areas where publicinvestment will continue to play an important role. In some cases, the levelof achievement reflects the relatively low historical priority given to thesector in resource allocations. Education, for example, accounted for only10% of development expenditure during REPELITA III; for other countries in theregion, this ratio has been around 20% in recent years. Given the pressingneed for skilled manpower, as well as the strong social demand for education,the case for relatively higher allocations to the education sector (as plannedfor REPELITA IV) would seem to be strong. Even so, care has to be exercisedln deciding on the use of these funds. At the primary level, for example,universal enrollment has almost been attained. As a result, the country's newprimary school construction requirements are minimal, with investments duringREPELITA IV being limited mainly to school rehabilitation and teacher housingfor schools in remote areas. Demand for new primary teachers will also falldramatically, such that many teacher training high schools will becomeredundant. Therefore, both facilities and resources couLd be freed up for anexpanded program of secondary and higher education development.
3.52 More generally, demand assumptions for public services need to becarefully considered, with due consideration for cost recovery. A case inpoint is irrigation. Largely as a result of the major irrigation investmentsundertaken over the past decade, rice production has risen on average by 5.8%per annum since 1975. As noted in Chapter 1, net domestic production exceededconsumption in 1984 and stocks are at record levels. Barring unfavorableweather, it would appear that rice self sufficiency can be sustained (providedmeasures are taken to protect recent gains in yields). This implies are-examination of the nature of appropriate irrigation investments, especiallyin Java.

- 81 -
3.53 Another relevant example is provided by the power sector. As supplyconstraints are eased, the Government is expecting electricity sales tocontinue to grow rapidly. But recent trends suggest that the projectedexpansion of demand per consumer, in both the industrial and residentialsectors, could be overstated. A lower sales growth rate of two to tbreepercentage points could save up to 15% in the planned investment costs. Themajor impact on the composition of the investment program would be to delayconstruction on the Muang hydro-station and other new steam-coal plants.
Table 3.6: SELECTED DEVELOPMENT INDICATORS /a
Indicator Indonesia Thailand Philip. Malaysia Korea
GNP per capita (US $) 580 790 820 1,370 1,910
PowerConsumption per capita (kwh) 99 355 390 676 1,204Electrification ratio (%) 12 41 43 61 95
TeleconmmnicationsTelephone density (per 100) 0.4 1.1 1.2 6.3 n.a
EducationGross enrollment ratios (Z)
- Primary 97 96 84 96 99- Secondary 27 29 55 65 84-Higher 4 4 21 4 22
HealthInfant mortality rate (per '000) 102 51 51 29 32Population per physician ('000) 11.5 7.1 8.0 7.9 1.4
/a Most indicators are for 1981 or 1982. Otherwise, tie latest available data areused.
Source: World Bank staff estimates.
3.54 Project implementation capacity. The potential for altering thecomposition of public investments is limited by problems in projectimplementation. As documented in last year's economic report, these problemsInclude delays in procurement and consultancy approvals, complex budget andfinance procedures, difflculties in land acquisition and shortages of skilled-nnpower. Resultant implementation slippages often increase project costs anddelay the realization of benefits, thereby reducing rates of return andpossibly undermining the economic justification for the project. A case inpoint is the tree crops sector, where Indonesia has a clear comparative

- 82 -
advantage in expanding production for both domestic consumption andexports./l The potential benefits in terms of employment and regionaldevelopment are also recognized by the Government. Yet, for the three majortree crops - rubber, oil palm and coconut - implementation constraints keptactual plantings to only 0.5 million hectares during REPELITA III, about 30Xbelow planned levels. The Government is presently working on an actionprogram to address existing problems in a number of areas affecting the treecrop development program: land acquisition, manpower training, thecoordination of government agencies, particularly agriculture andtrans migration, and the management/planning capacity of public estates.
3.55 Similar arguments apply to the telecommunications sector. HerePERUNTEL had originally proposed to add more than one million exchange linesduring REPELITA IV. However, once again the binding constraint isimplementation capacity. As a result, BAPPENAS has adopted a lower target of750,000 new lines and, without substantial strengthenIng of implementationcapacity, actual performance could be significantly lower. PERUMTEL is,however, fully aware of the need to improve its implementation capacity andhas made this a key objective for REPELITA IV. Some recent actions, such asthe introduction of turnkey contracts and a program of technical assistancefor project impLementation and contracting arrangements, coupled with revenueraising measures (including tariff Increases), should considerably improvePERUMTEL's implementation capacity over the medium term.
3.56 Implementation and financial constraints can also adversely affectprogram composition. A case in point is PLN's investment program duringREPELITA III, when 69Z of the planned generating capacity was added but only36% of the planned extension of the distribution network was completed. Twofactors account for the relatively large shortfall on distributioninvestments: (a) their smaller size and shorter implementation schedule makesthem more vulnerable to budget cuts; and (b) they are subject to greaterprocurement delays due to the emphasis given to using local suppliers./2These tendering delcys harTe contributed to the recent increase in PLN'stransmission and distribution losses.
3.57 As discussed in Chapter 1, the Government is fully aware of the needto effect rapid improvements in project implementation and has initiatedseveral measures. Two classes of actions need to be stressed. First, themethod and pace of implementation of worthwhile objectives, such as theincreased utilization of domestic products, need to be carefully examined toensure that there are few deleterious, unintended effects, and that thesubstitution of domestic for foreign products is economical, and contributesto the objective of developing efficient domestic industries and contractors.
/1 See Indonesia - The Major Tree Crops: A Sector Review, World Bank ReportNo. 5318-IND, April 15, 1984.
/2 The extent of these delays is illustrated by the implementation profilesfor power distribution investments in the West Java Region during the finalthree years of REPFLITA III, when the ratio of actual to planned tenders fellfrom 89Z-92% (in 1982/83) to zero to 5% (in 1984/85).

- 83 -
For instance, local inputs priced above international levels put Indonesiancontractors and suppliers at a disadvantage in international tendering;similarly, delays in procurement and implementation in order to increase localcontent, although not always easily assessed, are, nevertheless, oftencostly. Second, it is important to con:inue to examine the regulationscarefully, prune unnecessary and counterproductive procedures, institutesimpler and more efficient systems, and improve management and monitoring ofprojects. We understand the Government is considering the formation of aStanding Inter-Agency Committee to direct and oversee the development andexecution of the measures necessary for speeding up implementation. Thesecretariat of the committee would be located in BAPPENAS, and staffed byindividuals from BAPPENAS, SEKNEG and major line agencies.
Investment Planning
3.58 The previous discussion focused on considerations which should guidethe sectoral allocation of public investment. However, the key to goodinvestment planning is sound project selection and design. In Indonesia,greater use of project appraisal techniques, with adequate provision forcentral review and quality control, could help to strengthen investmentplanning in three areas. First, the economic justification of projects couldbe subjected to closer scrutiny. For REPELITA IV, there are a number ofinvestment proposals that warrant more careful analysis regarding their size(e.g., the program of primary school construction) and timing (e.g., theproposed introduction of mobile car radio telephones). Other investments,such as the proposed mining projects in tin and bauxite, may simply not bejustified given present world market conditions. Second, there are areaswhere investment proposals could be better designed and possibly expanded.A case in point is the health program. Compared to REPELITA III, thesubsector share for health centers falls from 31% to 17%, while only a meagerallocation is provided for communicable disease control. The size of theseprograms would seem to be inconsistent with the priority given in the plan toreducing infant mortality. Third, cost estimates - including overall costs,time phasing and the breakdown of local and foreign costs - could beimproved.l/
3.59 Sound project appraisal is the key to good investment planning.However, without a strong central framework for ensuring intersectoral andmacroeconomic consistency, the effort is unlikely to bear fruit. BAPPENASalready plays a major role in the preparation of the five year plan and annualbudget decisions on development expenditures. However, decisions are notalways made on the basis of comprehensive and up-to-date sectoral investmentprograms, detailing specific project proposals, multi-year cost projectionsand total (not just budget) financing requirements; while the links to annualbudget decisions are weak. This is an area where BAPPENAS could usefullyguide and support the efforts of line agency planning units. BAPPENAS also
/1 A Bank review of the REPELITA IV irrigation program, for example,indicated that total costs are expected to be only Rp. 4.5 trillion, 30% lessthan allocated in the plan. A major factor in this discrepancy is the recentsharp decline in world bids for civil works contracts.

- 84-
needs to establish clearer mechanisms and criteria for adjusting theinvestment program in response to a changing resource environment. Decisiveaction was taken in mid-1983, when a number of large and import intensiveprojects were cancelled or rephased to keep the import bill within manageablelimits. However, a more continual monitoring and adjustment process is alsorequired. One mechanism for doing this, as suggested in last year's economicreport, would be to identify a core program of high priority projects, to beprotected against resource shortfalls and implementation delays. TheGovernment has already adopted this approach in the power andtelecommunications sectors. However, preparation of a broader core program,reflecting intersectoral priorities as well, would be desirable.
3.60 Finally, increased attention needs to be given to the impact of pastand new investments on recurrent financing requirements. For budgetarypurposes, guidelines should be agreed between BAPPERAS and the line agencieson appropriate unit costs for recurrent items such as salaries, materials andoverheads, in relation to the existing capital stock (e.g. per hectare ofirrigated land or per primary school)./l BAPPENAS should also examine closelythe recurrent cost impact of new proJects. This can often be substantial,especially in the social sectors. For example, World Bank staff estimatessuggest that for every Rp. 100 invested in education during the 1980s, anadditional Rp. 31 should be added to annual requirements of recurrentexpendttures./2 This is almost double the actual budgetary impact ofeducation projects implemented during the late 1970s. Increasingly, theserecurrent costs could be covered by user charges at both the central and locallevels. However, given the backlog of underfunding that already exists, it isinevitable that further real increases in budget allocations, whether asroutine or development expenditures, will be required. At the margin, thismay mean sacrificing some new investments. But the benefits, in terms ofimproved utilization of existing assets and the provision of higher qualityservices, is likely to be well worth the costs.
3.61 There is also a case for financing more of these recurrentexpenditures through cost recovery on public services. There are of coursevalid social reasons for wanting to limit the burden of cost recovery,especially on the poorer segments of society. Yet the potential benefits,both for resource mobilization and to avoid waste, cannot be dismissed lightly.
3.62 In the irrigation sector, direct cost recovery through land tax(IPEDA) and water charges is very low (generally around 10%-15X of farmers'net profits and 5% of the incremental earnings from irrigation investments).Higher water charges may not always be appropriate, given that manybeneficiaries are close to the absolute poverty level. One alternative
/1 The Directorate of Irrigation has proposed such guidelines for operationand maintenance expenditures on main irrigation systems. However, these normshave not as yet been approved by BAPPENAS and actual budget allocations havebeen substantially lower.
/2 See Oey Meesook, Financing and Equity in the Social Sectors in Indonesia,World Bank Staff Working Paper No. 703, 1984, p. 14.

- 85 -
approach would be to modify the present IPEDA system, to provide for betterland valuations and to earmark a portion of the revenues for operation andmaintenance expenditures on irrigation system./l General Increases in IPEDAare also appropriate for improving municipal finances and funding thedevelopment of urban services.
3.63 Direct cost recovery can also be improved in certain subse_tors, suchas housing, and increases in interest rates for other credit programs (e.g.smallholder tree crops) would also seem to be justified on "ability-to-pay"grounds. Major public utilities, such as PLN and PERUMTEL, should be able tofinance a more significant portion of their investment costs from internallygenerated funds, while also contributing to general revenues. For example, inthe case of PLN there is considerable scope for reducing transmission anddistribution (TMD) losses. Although F4N's T&D losses decreased from 24.1% in1974/75 to 18.7% in 1982/83, they were much higher than those in neighboringcountries (Malaysia 7.6%, Thailand 9.9%, and Korea 6.8%, all in 1982/83).Moreover, the declining trend of PLN's T&D losses was reversed in 1983/84 whenthey rose to 21%, mainly due to increases in unauthorized/unaccounted forconsumption and shortfalls in the implementation of distribution projects.
/1 The Government is planning to study alternative institutional arrangementsfor such a scheme in the West Tarum irrigation area.

- 86 -
Part II - 'MPLOYMENT TRENDS AND OUTLOOK
Surmary and Conclusions
I. The second part of the report is devoted to the employment problem inIndonesia, with the primary focus on the labor absorption issue. Althoughthere have been significant improvements in the past, the employment problemis still serious. The absorption of an expanding labor force in a period oftighter resource constraints presents a difficult challenge for the country inthe next ten years. The analysis indicates that a serious deterioration inthe employment situation could occur, unless the Government makes a concertedeffort to implement policies conducive to a labor intensive pattern ofgrowth. This will involve both the appropriate macroeconomic policiesdiscussed in Part I, and additional policies with a specific employmentorientation.
The Employment Problem
ii. The employment problem currently manifests itself in two forms: inlow return work for a significant proportion of the workforce, and in openunemployment. Low returns to labor, and associated household poverty, aremost extensive in rural Java, especially amongst the landless and smallfarmers. But low incomes are also a feature of the rural Outer Islands andurban Indonesia. Open unemployment is almost exclusively an urban phenomenon,and is primarily a problem for first job seekers, the young and the educated.
iii. Past trends in employment and productivity suggest a favorableprocess of change between the early 1970s and the early 1980s. There was asignificant shift in the composition of employment from low productivity foodcrops to higher productivity activities in other agriculture, manufacturing,trade, and other services. The available evidence also indicates significantwage increases in both agricultural and non-agricultural activities since theend of the 1970s. The process of change has been most rapid in Java, whereemployment in agriculture declined during this period. This does not meanthat agriculture was unimportant: rapid growth in agricultural incomes,supported by buoyant public expenditures, was central to a quite favorablepattern of rural development. Village level studies suggest that economicdiversification by households, and a reasonable degree of labor mobility,facilitated a fairly wide participation in this income growth. In the OuterIslands, both rural and urban wages and incomes are higher, but the economiesare comparatively less diversified than Java. The agricultural sector hasplayed a much larger role in the direct absorption of labor than in Java.
iv. Aggregate trends in open unemployment have also not been unfavorable:the national unemployment rate of 2%, and the urban unemployment rate of about6X, have been stable. However, there were some worrisome signs in the 1976-82period: unemployment rates for general upper secondary school leavers (in
Part II draws upon background work by Yusuf Saefudin, M. Husein Sawit (Centerfor Agro Economic Research, Bogor) and Ray Byron (consultant).

- 87 -
the 20-24 age group) rose from 32-33% to 37-38% in this period, andunemployment rates also rose for most categories of women and for new entrantswith tertiary educational qualifications.
v. The overall trends in employment and incomes were good, but thisoccurred in a period of rapid economic growth. National income and non-oiloutput grew at 8-10% p.a. in the decade or so to 1982. Government policy hasin the past played an important role in supporting a favorable pattern ofgrowth for employment - agricultural income growth was given high priority,public spending was both sectorally and spatially diversified, and thetransmigration program was beginning to provide land and employment forsignificant numbers of the rural poor in Java. The financial sector reform ofJune 1983 also led to the removal of most subsidized interest rates in thesystem, that constituted a significant bias in favor of capital intensiveinvestments prior to this. However, where employment concerns did notcoincide with other aims, the latter were often given priority, for example inthe preferential treatment for large industry, restrictive policies on theinformal sector in some cities, and, amongst the range changes in the 1984 taxreform, the introduction of accelerated depreciation appears to have a biastoward capital intensive choices. Since 1983, the Government has, ofnecessity, given first priority to short term stabilization, and a seriousdeterioration in the employment situation was probably only prevented by asignificant recovery in agricultural and non-oil export incomes. As overallgrowth prospects are expected to be favorable than in the 1970s, particularattention will now be needed to ensure an adequate growth in employmentopportunities.
Future Prospects
vi. The labor force is projected to grow at about 2.3% p.a. between 1985and 1995, with no slowdown in growth until the second half of the 1990s. Thisimplies an increase of almost 1.7 million people a year over the next decade.Growth of the labor force by region will be heavily influenced by migration,and with moderate to high levels of transmigration, over half of the incrementwill be on the Outer Islands. There are some uncertainties over future laborforce participation rates, and the Government's projection involves a higherlabor force growth, with a rising share of women. If this were to occur, theconclusion of this report on the urgency of the employment problem would applywith even greater force.
vii. If a deterioration of the employment situation is to be prevented,the key requirement is substantial labor absorption in the commodity producingsectors, I.e. only moderate increases in the capital intensity of production.A projection corresponding to the base case of Part I indicates that theeconomy has the potential to absorb the growth in the labor force, and sustainsteady growth in productivity and incomes in all sectors of the economy.However, this will require both appropriate macroeconomic and sectoralpolicies, notably for industry and agriculture, and specifically employmentoriented measures, including policies on agricultural mechanization, publicexpenditure, transmigration and the urban informal sector. As in the past,the service sectors would be important sources of employment growth. Arelatively labor intensive pattern of growth can also help ease the foreign

- 88 -
exchange constraint, since the spending of lower income households ischaracteristically biased toward domestically produced goods. Sharp contrastsare likely between Java and the Outer Islands: on Java a continued gradualdecline in agricultural employment, but a much larger role of manufacturing,is projected; in most of the Outer Islands, agricultural employment will haveto expand significantly to absorb the rapid growth of the rural population,especially in destination areas of transmigration.
viii. Two less favorable scenarios were also explored. The first,corresponding to the low non-oil export case of Part I, shows the potentialrisks of less supportive policies, and of a failure to correct some existingbiases in policy. This assumes the same external environment - and so thesame level of resources from oil and LNG - but a less labor intensive patternof growth. Slightly slower agricultural growth, combined with excessive ratesof substitution of capital for labor in agriculture and manufacturing, couldlead to substantial labor displacement, especially of the landless, in ruralJava and insufficient growth of agricultural employment in the Outer Islandsand of industrial jobs on Java. Over the next tan years, this could result inthe need for 4-5 million more jobs in other sectors of the economy. Thiswould mean either a fall in returns to labor in the urban informal sector andthe low wage end of the formal sector, or higher unemployment, or both. Thiswould present a very difficult employment problem, with risks of worseningurban poverty and social dislocation. The second scenario examines theimplications of slower growth as a consequence of lower oil prices. Theemployment problem again worsens, and presents a more difficult challenge overthe medium term.
Selected Policy Issues
ix. The scenarios developed in this report are only indicative ofalternative pattens of future growth and labor absorption. There are,however, a number of policy areas in which the Government can significantlyincrease the probability of realizing the more favorable scenario.
x. The continued growth of agriculture will be central to a favorableevolution of the employment situation both on and off Java. On Java, growthin aricultural incomes will be essential to the overall state of the ruraleconomy, and in particular to the continued expansion of the non-farm sector.The two main ingredients for this are the maintenance of expenditures inagricultural infrastructure and a favorable pricing environment. However,because of the apparent emergence of demand constraints for rice in 1984,agricultural diversification will be necesary to continued growth, and highpriority should be given to the analysis of options in this area. Policytowards agricultural mechanization wil also be important. Agriculturalmechanization can be significantly labor displacing, and current evidencesuggests that the economic case for it is weak, at least for tractors inJava. In this context, a cautious approach would be appropriate, with no useof subsidized credit. The encouragement of domestic production by small scaleproducers is likely to be particularly beneficial to fostering the appropriateadaption of techniques and local repair maintenance facilities. Similarprinciples on agricultural policy apply to the Outer Islands, but here thescale of required agricultural labor absorption wlll necessitate more

- 89 -
extensive investment in agriculture. The effective implementation of twomajor programs, in tree crops and water resource development, will be centralto meeting the demand for additional jobs. Fiually, in view of the relativescarcity of labor in most area, a more rapid rate of agriculturalmechanization would be expected, but there is still not a case for subsidizedcredit.
id. The most important role for the maufacturng sector in the next tenyears will need to be the provision of foreigm exchange earnings or savings tofinance the overall growth of the economy. However, there is a high degree ofconsistency between an efficient, relatively export oriented manufacturingsector and a labor intensive pattern of future growth. Scenarios ofmanufacturing growth show that. under an export oriented policy (thouga stillwith some import substitutioa) the sector could absorb 20% of the increment tothe labor force in the early 1990s (and over 30% on Java), but that with abias toward import substitution in producer goods this drops to below 10%.This provides strong support for the argumenats in Part I on industrialpolicy. Also important is the relative role of small scale firms, since thesenow accouat for the bulk of manufacturing employment. Past growth has beengood, despite a bias in past government policies towards large scale firms.The experience of other countries iudicates that the best way of sustainingthis growth is to encourage a broadly dispersed pattern of demnd growth andto remove favored treatment for large scale firms. Special schemes, such ascredit for small scale enterprises in both industry and service sectors, canalso play a useful supportive role.
xii. Public expenditures have a dual role: in supporting a labor intensivepattern of growth in the commodity producing sectors, for example throughinvestmeats in rural infrastructure, and through the provision of direct andindirect employment in the implementation phase. For public expenditures tocontinue to provide an autonomous source of income and employment growth,there is a case for sustaining a moderate rate of growth in the domesticcomponent of the budget. This is affected by the share in total expendituresof sectors and projects with a high domestic content. As discussed in Part I,the shift in composition from the REPELITA III realization to REPELITA IVplans favors such sectors, though if the employment situation were todeteriorate, further shifts could be justified. Although some of theseprograms, such as INPRES Sekolah Dasar, are not likely to grow as rapidly inthe future, there is good evidence of extensive productive investmentopportunities in relatively labor intensive activities, such as rural roadsand local irrigation. Increased allocations to regular maintenance, insteadof periodic rehabilitation, of economic infrastructure can also increaseemployment effects aad reduce imports. A balanced investment program shouldcontinue to have both capital and labor intensive activities. However, inview of their much larger use of scarce resources, it would be appropriate tosubject projects with unusually high investment costs per job to more rigorousproject appraisal to ensure they effectively contribute to the country'seconomic development.
xiii. Policy on transmigration will have a large influence on thedistribution of the growth in the rural labor force; this program can make a

- 90 -
major contribution to the central welfare issue of reducing rural povery onJava. The geographic orientation of the program is having to change fromSumatra and Sulavesi, that are rapidly running out of new sites, towardKalimsm tan and Irian Jaya. This not only makes implementation more difficult,but also raises costs. Preliminary analysis of farm models in these arssuggests that transmigration can have an adequate economic rate of return tothe country and provide reasonable incomes to the farmers, provided that thereis some form of second stage agricultural development, in tree crops,irrigation or livestock. This is of importance for the labor market, sincerelatively unsuccessful rural development in transmigration areas could leadto destabilizing second round migration flows, and, for example, unmanageableurban growth in areas such as Kalimantan and Irian Jaya. To realize such afavorable outcome, the linkages with the tree crops and water resourcedevelopment programs are essential. Owing to implementation (and resource)constraints for these programs, and the competing claims of existing lowincome farmers in the Outer Islands, there may be difficultiles in achievingthe Government's current targets for trAns igration.
xiv. Finally, although most of the poor will continue to be ruraldwellers, the urban labor market will be particularly sensitive to changes inthe aggregate employment situation. Youth and educated unemployment is 3ikelyto persist, and may worsen with the rapid growth of secondary school leavers.Specific policies oriented toward the unemployed, such as improving the laborexchanges and vocational training, are not likely to have much impact onunemployment rates, though they are valuable in their omn right. Policiestoward the informal sector could have a much wider impact in urb> - aas.Present trends toward a more restrictive attitude, especially in Jakarta,could have major costs in employment, for limited benefits. Other cities,notably in East and Central Java, have been more supportive of the informalsector. A tolerant attitude in the short run, and a supportive policy in themedium term, for example through planning enough space for informal sectoractivities in public areas, will be important if this sector is to continue toplay its role In the macro picture of labor absorption. Apart from this, twoareas of general policy wllU influence the evolution of the urban labormarket: the degree of success of rural development, through its impact onrural-urban migration rates, and the labor intensity of manufacturing, throughthe impact oc the growth in urban wage employemnt and wage differentials.With a favorable policy environment in these areas, only moderate increases inurban unemployment and continued growth in incomes amongst poorer urbanhouseholds appear to be feasible. without such a supportive environment,there is a risk of a serious deterioration in the urban labor market, withpotentially high social costs.

- 91 -
CHAPTER 4
THE EMPLOYMENT PROBIEM
4.1 Over the past fifteen years, employment has received increasing.emphasis in policy statements by the Government. While REPELITA I and IIplaced most weight on the maintenance of stability and support for economicgrowth, both REPELITA TTT and IV place great emphasis on the equitabledistributioa of employmeat opportunities. Since the slowdown In economicgrowth in 1982, the issue of the provision of employment for a growing laborforce has had a high profile in public debate. In this chapter we firstpresent a summary analysis of the current employment situtttion and then fouson the labor absorption problem over the next ten years, both in relation togovernment policy choices, and to alternative views oan the state of theinternational oil market.
A. The Current Situation
The Nature of the Problem
4.2 Two specific issues drive the current concern with employment: thepressure on land and the associated rural poverty in Java; and the highunemployment rates amongst the young, and especially the educated young, inurban areas. A significant proportion of the 65 million members of the laborforce now in Indonesia are working in such low return work that theirhouseholds are living in absolute poverty. 11 Over the next ten years thelabor force will increase by about 17 mllion people. The employment problemfaced by the Government in this period involves both increasing theproductivity of those now in the labor force and the effective absorption ofnew entrants into work.
4.3 Rural areas account for a large part of the problem of low returnwork. About 80% of the labor force, and a higher proportion of householdsliving in poverty, are rural dwellers. The bulk of these are involved inagriculture, but non-farm activities are also important, often as a secondarysource of income and employment. Access to land is the primary determinant ofeconomic class, and on Java over a third of rural households lack access tosawah land, but poverty is as extensive amongst smallholders as amongst rurallaborers. Average incomes in urban areas are much higher than in rural areas
/1 The definition of absolute poverty is always somewhat arbitrary. In thisreport we use a standard based on calorie requirements aad observed householdbudgets. The latest systematic assessment is for 1980; it is estimated thatalmost 40Z of the total population fell below the poverty line, of vhich over60% lived in rural Java in that year. See Indonesia - Policies and Prospectsfor Economic Growth and Transformation, World Bank Report No. 5066-IND, April26, 1984, Chapter 5. Preliminary results for 1981 indicate a somewhat lower,but stili significant, poverty incidence. See Appendix 3, Tables 5-7, forestimates of incomes and the distribution of poverty in 1981.

- 92 -
- by 70% in Java in 1981 - but many households still suffer from low incomes.Poor urban households appear to be roughly equally divided between thosedependent on wage labor and those working in self-employed activities orfamily enterprises in the informal sector.
4.4 Open unemployment is primarily an urban phenomenon. It is onlyweakly related to poverty in Indonesia, since poor households can rarelyafford to be unemployed. Although the overall urban unemployment rate, ofabout 6%, is not high by developing country standards, it is highlyconcentrated amongst young new entrants to the labor force, and especiallyrecent graduates of secondary schools. Men and women with upper secondaryschool qualifications in the 20-24 age range experience unemployment rates of30-40%. For this group unemployment is predominantly associated with betterpaying wage employment in the formal sector: it reflects an imbalance betweenthe supply and demand for such jobs. and a wlllingness to wait in the queuefor preferred employment.
4.5 Underemployment, in the sense of low hours of work per week, is moreextensive than unemployment. About 352 of the total labor force works lessthan 35 hours per week. This is much more pronounced in rural areas, and isespecially associated with agricultural workers. However, it is of lessimportance than the general problem of low productivity work, since only about7% of rural workers appear to be underemployed against their will. There arealso large numbers in the work force who work long hours. /1
4.6 The view taken on the workings of the labor market has an importantimpact on the interpretation of the present and future employment problem. /2The following is a brief summary of the conception used in this report. Thereis a hierarchy of both wages and labor productivity levels in Indonesia, thatstretches from very low return activities in rural Java to high wage urbansector employment in large industrial and other corporations. This isassociated with a hierarchy of labor market segments, with varying degrees ofmobility between segments. Within rural areas, and between rural areas andboth the urban informal sector and low wage formal sector employment, there isa reasonably high degree of mobility: workers can, over a period of time, movebetween these segments, and wage differentials are not excessive. However,movement into relatively high wage employment in the formal sector is not
/1 About 35% of the total (rural and urban) work force works more than 45hours a week. See Appendix 3, Tables 9 and 10 for underemploymentstatistics. 43% of the rural work force worked for less than 35 hours perweek in 1982, but only 16% of these should probably be classified as wantingto work longer hours. This gives a figure of 7% of the total rural work forcethat were underemployed against their will.
12 The conception of the labor market is largely based on the previous WorldBank report on employment, with the exception that recent evidence nowindicates a higher degree of mobility within the rural labor market in Javathan was concluded in that report. See Indonesia - Wages and Employment,World Bank Country Study, 1985, and Appendix 1 paras. 2 and 23.

- 93 -
free: significant wage differentials are maintained and total employment inthese sectors is largely determined by other factors, including production orservice technology in the case of industry and finance, and policy and budgetconsiderations in the case of public employment. There is also imperfectinter-regional mobility; this is of particular importance for moves betweenrural areas in different islands.
Growth in Employment and Labor Productivity - the Past Experience
4.7 The employment experience from the early 1970s to the early 1980s wasgood, and this appears to have had a significant impact on the welfare of lowincome households throughout the country. Table 4.1 summarizes the pattern ofchange between 1971 and 1980./1 In this period the total labor forceIncreased by 30%, or about 13 million people, almost entirely as a consequenceof increases in the size of the working age population - there was no changeof significance in the overall labor force participation rate.
4.8 Food crops form the largest single sector of employment in both 1971and 1980, and also has the lowest labor productivity./2 Households that aremainly dependent on this sector for work constitute the largest single povertygroup. The most promising development in the period was the combination of arapid increase In productivity growth within the sector, and a sharp reductionin its importance in providing new employment. The children of manyhouseholds in the food crops sector, as well as other new entrants to thelabor force, were able to find employment in other, relatively highproductivity sectors. The most important of these were other agriculture (18%of the incremental labor force) manufacturing (18%) and trade (17%), followedby other services, transport and construction. All services accounted forover 40% of the employment of the increaental labor force. However, the storyon productivity growth was mixed for these expanding sectors. Manufacturingand other services enjoyed reasonable productivity growth, but all the othermajor recipient sectors experienced stagnant or declining productivity.
4.9 Table 4.1 shows that the overall unemployment rate was low and stablein the 1970s. Analysis of the more recent 1976-82 period confirms thispicture: the more important urban unemployment rate remained at 6%. However,a more detailed review of trends in this period presents a less sanguinepicture, with an increasing concentration of unemployment amongst the youngand educated, and rising unemployment amongst women./3 Graduates of upper
/1 The comparisons of sectoral employment between 1971 and 1980 in the reportare based on the Input-Output Tables for these two years, adjusted to make theassumptions on aggregate employment consistent with each other. The primarysource for the employment data used in the Input-Output Tables is thepopulation census of the same year.
/2 Throughout this chapter labor productivity is defined as value added perworker in a specific sector.
/3 See Appendix 1, paras. 37 to 41, for an account of unemployment trendsfrom the national household surveys in 1976 and 1982.

- 94 -
secondary schools accounted for 40% of all urban unemployed in 1982; and theunemployment rate for both male and female graduates of academic uppersecondary schools in the 20-24 age group rose from 32-33% in 1976 to 37-38% in1982. There is also a general rise in the rates for graduates of tertiaryeducational institutions. The proportion of women amongst all unemployedincreased from 23% to 36%, with a more than doubling in the absolute number inthe six year period. Finally, unemployment rates are also significant (at 10%or more) amongst the less educated young (in the 15-24 age range), five to tenyears after most would have left school. For all categories, une-mploymentrates decline sharply amongst older groups in the labor force, -.n both 1976and 1982, indicating a process of slow absorption of new labor fot_e entrantsinto works. However, the rise in rates amongst the key groups suggests thatthe queue for jobs was growing longer in this period, despite the high rate ofeconomic growth in urban areas.
Table 4.1: EMPLOYMENT AND PRODUCTIVITY, 1971-80
Employment Labor productivity /eShare of
Composition increment Increase Average1971 1980 1971-80 1971-80 level, 1980
_ - X (Z p.a.) (Rp'000/worker)
Agriculture 66 57 28 3.6 370Food crops (60) (49) (11) (3.9) (230)Cash crops (3) (4) (7) (-1.2) (1,027)Other /a (3) (5) (11) (-3.4) (1,343)
Maaufacturing 7 9 18 3.9 940Construction 2 3 6 1.8 1,669Trade U 12 17 0.3 992Transport 2 4 7 -2.0 1,121Public admin. 3 4 4 7.6 1,245Other services /b 7 8 13 5.7 518Miscellaneous Ic 0 1 4 -3.4 2,086
Total employment /d 98 98 98 4.1 663
Unemployed 2 2 2 n.a. 0
Total labor force 100 100 100 n.a. n.a.
/a Livestock, forestry and fisheries.7T Social, community, household and personal services.7E Non-oil mining, electricity, gas and water and finance.7d Ex-luding oil and LNG.Th Annual value added per worker (at 1980 prices.)
Source: World Bank staff estimates based on the reports on the 1971 and 1980Input-Output Tables and Population Ceasuses by BPS.

- 95 -
4.10 There are important differences between the various regions ofIndonesia. Even with Indonesia divided simply between Java and the OuterIslands, significant contrasts emerge. These are summarized in Table 4.2.The relative labor abundance in Java leads to lower average labor productivityin almost all aectors, but the structural shift in employment out ofagriculture is more advanced than in the Outer Islands and has been proceedingmore rapidly. There was a decline in the numbers of people employed inagriculture, /1 while manufacturing (at 24X), trade (26%) and other services(34%) accounted for the bulk of the incremental labor force in this period.The rising importance of non-farm activities is as much due to changes withinrural areas as to rural-urban migration, and became even more marked in the1976-82 period. Evidence from villages in West Java (see Appendix 1, paras. 6to 14), suggests that it was part of a positive process of income growth.Many households were becoming more diversified, and while incomes from ricecultivation continued to be an important source of household income growth formany, non-rice agriculture and non-agricultural incomes were of risingimportance. These income gains were widely distributed in the villagesstudied: farm laborers were major gainers from the growth in non-agriculturalincomes, and small scale farmers (with initial cultivation areas of less than0.25 ha) gained especially from agricultural income growth. As a consequence,the overall distribution of income appears to have remained stable, and theincidence of poverty was significantly reduced in this period of rapidgrowth. In urban Java the distribution of employment was fairly stable:manufacturing accounted for around a fifth of both average and incrementalemployment, and trade, transport and other services accouated for about threequarters.
4.11 In the Outer Islands, growth in non-agricultural employment has alsobeen rapid, but most regions continue to be both less urbanized and lesseconomically diversified than Java. Agriculture accounted for over two thirdsof total employment and three quarters of rural employment at the beginning ofthe 1980s, and has been the largest single source of new employment.
4.12 There are three principal factors behind the broadly favorablepattern of labor absorption up to 1980. First, there was rapid growth inagricultural incomes, especially in the rice sector, associated with theexpansion of irrigation, intensification and technical innovation, as well assome increase in cultivated area in the Outer Islands. Second, there was veryrapid modernization of the economy, in particular in Java, with buoyant growthin the secondary and tertiary sectors - over 10% p.a. - and a large increasein the flow of manufactured and other consumer goods within the economy. Someof this can be linked to multiplier effects of spending by households in bothrural and urban areas. Third, there appears to have been a reasonably highdegree of labor mobility, between the agricultural sector and low wage andself-employed non-agricultural activities, in both rural and urban areas.This was facilitated by the 'transport revolution- - the major increase intransport services, especially in Java, in the 1970s.
/1 This refers to the primary sector of employment of labor force members: asdiscussed in Appendix 1, para. 6, there was, at least in some areas, anincrease in total agricultural employment in terms of hours worked, but thiswas largely taken up by the existing farming population.

-96-
Table 4.2: JAVA AND THE OUTER ISLANDS: PATTERNS OF EHPILOBENT ANDPRODUCTIVITY, 1971-80
Java Outer IslandsEmployment Labor pro- Employment Labor pro-
ductivity ductivityCompo- Share of Level, Campo- Share of Level,sition increment 1980 sition increment 19801980 1971-80 (Rp. '000/ 1980 1971-80 (Rp. '000/
(Z) (X) worker) (Z) (Z) worker)
Agriculture 51 -8 324 68 29 433Manufacturing 11 24 889 6 12 1,102Construction 4 12 1,880 2 8 1,193Trade 15 26 893 8 18 1,290Transport 3 6 773 3 4 1,906Public admin. 4 34 1,193 4 24 1,225Other services U1 413 6 833Miscellaneous /a 1 6 2,100 1 6 2,065
Total /b 100 100 628 100 100 724
/a Non-oil mining, electricity, gas and water, and finance.WE Excluding oil and LNG.
Sourte: World Bank staff estimates, derived from reports on the provincialproduction accounts, the 1980 Iaput-Output Tables, and the 1971 and1980 Population Censuses, by BPS.
4.13 The pattern of development outlined above clearly continued until1982. There is no aggregate information since then, but the 1983 oil pricereduction, the need for major stabilization measures and the sharp slowdown ingrowth in the non-oil economy, have proavided a much less favorable enviroamentfor employment growth in the past two years. Fortunately the general slowdowncoincided with good agricultural performance, notably in the rice sector, bothon and off Java, and the micro evidence from Java indicates that rural wageshave so far maintained the real gains of the 1980-81 period. Agriculturalproducers in the Outer Islands, and, to some extent, manufacturers in Java,also benefited from the major improvement in the market for non-oil exports In1983/84. In other sectors the picture is less good, though not yet serious;the principal change compared with the past appears to have been a much weakercontribution to labor absorption by the manufacturing sector - if past ratesof labor productivity growth were maintained, this sector accounted for anegligible proportion of incremental labor absorption between 1980 and thepresent. This put greater pressure on the service sectors, especially in theurban informal sector, to absorb the growing labor force. The limitedavailable macro and micro evidence suggests there was sufficient growth in

- 97 -
employment opportunities to prevent significant declines in incomes in thesesectors. In the formal sector, wages appear to have held up in real termsfollowing the devaluation, partly because of a low inflation rate in the pasttwo years.
Past Government Policy and Employment
4.14 How far has the Government's expressed concern resulted in policiesthat are favorable to employment creation? Indonesia enjoyed substantialbenefits from the two oil windfalls of 1973-74 and 1979-80. The Government'suse of these resources was conducive to diversified growth, and comparesfavorably with many other oil exporters. Good general economic policy oftensupported the favorable pattern of employment creation described in theprevious section. First, high priority was given to agricultural development,in the form of a favorable pricing environment, major investments in improvedwater availability, the dissemination of new varieties, and the encouragementof fertilizer aad pesticide usage. This supported the growth in output andproductivity in food crops shown in Table 4.1. Moreover, the buoyant growthin agricultural incomes, and especially rice incomes in rural Java, wascentral to the expansion in non-farm incomes and employment and the positivepattern of rural-urban linkages. Second, the distribution of publicexpenditures has had beneficial direct and indirect effects. Developmentspending was expansive, and its distribution was both sectorally and spatiallydiversified. Some public investment was, of course, capital intensive. Butthe emphasis on irrigation, local roads, kampung improvement, primary schoolsand health centers led to a major increase in construction throughout theeconomy; in Java and Bali this made use of the pre-existing tradition oflabor-intensive construction methods. Although the overall role ofconstruction as a source of permanent employment was not large (6X ofincremental employment between 1971-80, shown in Table 4.1), it became awidespread source of supplementary employment and incomes and accounted for ahigh fraction of incremental employment in rural Java since the mid-1970s. Aswith agricultural incomes, the multiplier effects of the income increases wereimportant to the expansion of non-farm employment. There was also a speciallabor intensive public works program, Padat Karya, but this was small relativeto overall expenditures. Third, the Government has given high priority tosupporting the transmigration of households from rural Java to the OuterIslands. It is toe early to form an overall assessment of this program (seeChapter 5), but it has clearly made a contribution to relieving the pressureon the labor market in Java through the provision of land and agriculturalemployment to the landless or near landless.
4.15 In the area of industrial policy, however, the record is more mixed.The protection of domestic industry certainly helped the major increases inoutput in the 1970s, but the sectoral biases within the sector were notfavorable to employment. The structure of protection favored relativelycapital intensive sectors, and the system of regulations and preferentialcredit terms from the formal financial system was largely oriented towardproviding favored status to medium and large scale firms. The InvestmentCoordinating Board (BKPM) has guidelines to encourage labor intensiveindustries, but there is little evidence that these have been effective.

- 98 -
Fortunately, the small scale sector proved quite resilient and grew rapidly inresponse to the high and dispersed growth in demand. But this was in spite ofthe general thrust of government policy./l In the case of financial policy,the system prior to the June 1983 reforms, that included the extensive use ofsubsidized credit facilities, was biased in favor of capital intensiveinvestments. While the 1983 reform had many objectives, the removal of thisdistortion was clearly beneficial from the viewpoint of employment. Finally,there have been moderate interventions in the area of labor policy, includinglegislation on conditions of employment and a minimum wage that has generallyfollowed market conditions in the formal sector. This has provided someprotection to the workforce in medium and large scale firms, but has not had amajor impact on the overall employment situation.
4.16 While the overall impact of medium term policy on employment wasquite good, this appears to have been largely a consequence of generaleconomic performance. Where employment considerations have come into conflictwith other objectives, the latter have often received priority. Examples arepreferential treatment for large scale industry, restrictive policies on theurban informal sector in some cities, and support (in principle) foragricultural mechanization. Amongst the range of measures in the 1984 taxreform, the introduction of accelerated depreciation appears to provideunwarranted incentives for capital intensive investment choices. In theperiod since 1983, the Government has, of necessity, given first priority toeconomic stabilization and adjustment, as discussed in Part I. Despite theless favorable macroeconomic envorinment than in the past, it appears that theemployment situation did not deteriorate to a sigaificant extent, primarily asa consequence of the rapid growth in agricultural incomes and the recovery innon-oil export incomes in this period (see para. 4.13).
B. Future Prospects for Employment
4.17 The pattern of growth over the next decade will have a significantimpact on the employment situation. There is considerable uncertainty overboth macroeconomic resource availabilities and the actual impact of governmentmeasures on the pattern of growth, but it is important to have some frameworkfor analyzing future options. In this section we use a simple framework ofintersectoral allocation of the labor force, both to develop a picture oflikely medium term changes in the structure of employment and to illustratethe potential impact of government policies in selected areas.
4.18 The framework used is based upon the conception of the national labormarket outlined in para. 4.06. Employment absorption in the commodityproducing sectors is treated as being predominantly determined bytechnological choices in the production process. Similarly, employment inboth public administration and finance is expected to follow an independentunderlying rate of growth, a function of recurrent budget availabilities andthe size of the financial system. This leaves a residual increase in the
/1 The Government has introduced some measures to encourage small scaleindustries - see para. 5.15 - but these were of minor significance relative tothe general thrust of industrial policy.

- 99-
labor force that is assumed to enter service employment, in trade, transport,social and personal services. Aggregate income in these sectors is projectedto be a function of growth in the commodity producing sectors, so that theeffect of new entrants is to spread the available income over a larger numberof workers. There is a high degree of simplification here, but it isconsistent with both the macro evidence of past developments discussed inSection A and various micro studies on Java. It also provides a useful indexof the degree of pressure in the overall labor market in the form of thegrowth in labor productivity (i.e. total income per worker) in these servicesectors: the greater the growth in employment relative to total income theslower the growth in productivity. Stagnant or negative growth inproductivity indicates a serious employment problem, that would be expected tobe reflected in lower labor incomes and wages. A crucial assumption in thisconception is reasonably free entry to these sectors: if this does not hold,the residual labor force would be forced into open un.mployment or marginalactivities in both urban and rural areas. This possibility is also examined.
Labor Force Projections /1
4.19 The growth in the labor force is determined by the growth in thepopulation and changes in the age structure and labor force participationrates. Population growth slowed in the second half of the 1970s, and isprojected to continue to decline in the future, as fertility rates come downin response to the spread of family planning, growth in incomes, and Increasededucation; the demographic assumptions used here are close to those used bythe Government. As a consequence, the overall population growth rate declinesfrom 2.3% p.a. in the 1970s to 2.1% p.a. in the 19808 and 1.8% p.a. in thefirst half of the 1990s. As shown in Table 4.3, the decline occurs throughoutIndonesia, but some inter-regional variation in demographic assumptions ismaintained. The regional distribution of population is also influenced bymigration, and government policy is a major factor here. Table 4.3 reportsthe results under the intermediate transmigration scenario (see para. 5.27).This leads to significantly higher rates of population growth in the OuterIslands than in Java and Bali. By way of comparison, if there were nomigration at all, population growth in Java and Bali would be 1.7% p.a.,instead of 1.3% p.a., in 1986-90, and that in Kalimantan would be 2.3%,instead of 4.4% p.a., in the same period.
4.20 Although the new entrants to the labor force over the next ten yearsare all already born, there is some uncertainty over the future evolution oflabor force participation rates. The analysis that underlies this reportindicates a decline in the overall labor force participation rate (on thebasis of the population aged ten and over) from 53.5% in 1980 to 52.5% in1990, followed by a small rise to 52.9% in the year 2000./2 The implications
/1 Appendix 2 presents a summary of the methodology and results for thedemographic projections.
/2 The approach differs Rwn-awhat from that used by the Government, thatprojects more rapid overall growth in the labor force - of 2.8% p.a. in thesecond half of the 1980s - and a larger share of women, as compared with thisreport. See Appendix 2 for a brief discussion of the alternative assumptions.

- 100 -
are summarized In Table 4.3. This shows two important results. First, afterdeclining from 2.7% p.a. in the first half of the 1980s, the rate of growth ofthe labor force is constant, at 2.3% p.a., in the next ten years; the effectsof the decline in population growth are not felt until the 1996-2000 period.Second, as a consequence of migration, the annual increment to the labor forceis higher for the combined Outer Islands than for Java and Bali, and it risesfor all areas in the 1990s. If migration were to continue at the 1971-80pace, the situation would be reversed, and the growth in the labor force inJava and Bali would be 1.9% p.a. between 1986 and 1995, with an annualincrement of 850,000, over half the all Indonesia total.
Table 4.3: REGIONAL GROWTH IN POPULATION AND THE LABOR FORCE, 1986-95 /a
Labor ForcePopulation Annual growth Annual increment
1986- 1991- 1991- 1986- 1991-1990 1995 1990 1995 1990 1995-- Z p.a. - -- % p.a. - ---- '000
Java-Bali 1.2 1.0 1.5 1.5 640 680
Sumatra 3.1 2.7 3.5 3.2 480 540Kalimantan 4.8 4.4 4.9 4.5 180 210Sulawesi 2.9 2.4 2.9 3.0 120 140Eastern Islands 3.1 3.2 3.2 3.6 140 200
Outer Islands 3.3 3.0 3.6 3.4 920 1,090
Indonesia 2.0 1.8 2.3 2.3 1,560 1,770
/a This is under the intermediate scenario for transmnigration, see para. 5.27and Appendix 2.
Source: World Bank staff projections.
Overview of Potential Labor Absorption under Alternative Policies
4.21 Projections of potential labor absorption over the next ten yearsshow that the current employment problem could worsen, with adverse effects onthe distribution of income and potentially serious social consequences, unlessthe Government makes a concerted effort to adopt policies that support a laborintensive pattern of growth. Unlike the past period of buoyant income growthin the economy, it is unlikely that employment will take care of itself in thefuture. However, with the combination of appropriate macroeconomic policies

- 101 -
that underly the base case of Part I, plus some additional measuresspecifically oriented toward labor absorption, the employment problem ispotentially manageable./l
4.22 Two scenarios were developed to illustrate the impact of the policyenvironment on labor absorption and productivity. The first is based on a setof policles favorable to employment. It falls within the macro policy andgrowth framework of the base case of Part I. The achievement of sustainedgrowth rates over the medium term, through the implementation of policies thatwill ensure the efficient use of scarce resources in both the public andprivate sectors, is essential to a favorable outcome for employment. Inparticular, the required shift in industrial and trade policy, to encouragethe development of an efficient and more export oriented industrial sector,will also help foster a more labor intensive pattern of production. However,additional measures, specifically oriented toward employment, will also berequired. These include a cautious approach to agricultural mechanization onJava, the avoidance of excessively capital intensive public expenditures, anda tolerant attitude towards urban informal sector activities. Transmigrationalso plays an important role in providing employment for the poorer segmentsof the Javanese labor force. Each of the policy areas is discussed inChapter 5.
4.23 Table 4.4 summarizes the consequences of favorable policy. Underthis scenario agriculture absorbs a significant proportion of additionallabor, but the share of the sector in total employment declines to below 50%by 1995. This is consistent with continued productivity growth in the sectorand a reduction in poverty amongst smallholders. Owing to slower growth inoutput than in the past, there is little scope for raising the share ofmanufacturing employment in the short run, but it accounts for 16% of newemployment over the ten year period (and 20% in the early 19909). Theresidual service sectors would have to provide over 40% of new employment inthe 198 0s, but this is consistent with moderate growth in productivity (andaverage incomes), of almost 2% p.a. in the remainder of the 1980s and 3% p.a.in the 1990s.
4.24 While appropriate macroeconomic policies are essential if theemployment problem is to be manageable, it is also worth stressing that alabor intensive pattern of growth can also support macroeconomic objectives.Growth in incomes amongst poorer segments of the population tends to be spenton home produced rather than imported goods. It is expected that thestructure of dempnd amoagst both rural and urban households will shift awayfrom staple foods toward relatively preferred foods, manufactured consumergoods and services /2, but these sectors still have relatively low importrequirements, and will be the main sources of non-oil output growth over thenext decade, supplemented, of course, by rising exports.
/1 The conclusion on the urgency of the employment problem is based upon aprojected growth in the labor force of 2.3% p.a. If the Government'sprojection of higher labor force growth were to occur, the labor absorptionproblem would be even more difficult, especially for women.
/2 See Appendix 1, paras. 19 to 21.

- 102 -
Table 4.4: EMPIWYMENT AND PRODuCrIVrTY GROWTHUNDER FAVORABLE POLICY, 1986-95
Employment ProductivityShare of
Composltion increment Growth Levels /d1980 1995 1996-lW5 1§86-1995 1985 31995-- Z -- -7 - Z p.a. - Rp.'O000worker
IndonesiaAgriculture 58 48 24 2.6 430 550Manufacturing 10 10 16 4.2 1,150 1,740Constructiom 3 4 7 1.2 1,750 1,970Services /a 24 30 41 2.5 870 1,110Miscellaneous /b 5 8 12 1.4 2,010 2,320
Total /c 100 100 100 3.2 760 1,030
Java-BaliAgriculture 51 40 -15 3.0 390 520Manufacturing 11 13 27 4.0 1,090 1,620Constructio 4 5 11 1.0 1,980 2,180Services /a 29 35 60 3.0 780 1,050Miscellaneous /b 5 7 16 2.3 2,110 2,640
Total /c 100 100 100 3.8 740 1,080
Outer IslandsAgriculture 68 58 47 2.0 480 580Manufacturing 6 6 9 4.2 1,350 2,050Construction 2 3 4 2.0 1,310 1,590Services /a 18 24 29 1.4 1,060 1,210Miscellaneous /b 6 8 10 0.3 1,880 1,940
Total /c 100 100 100 2.3 770 970
/a Trade, transport, social and personal services.7i Non-oil mining, electricity, gas and water, finance and public
administration./c Excludes oil and ING.7;r At 1980 prices
Source: World Bank staff estimates and projections.

- 103 -
4.25 The regional distribution of growth is also important to theevolutioa of the employment situation. Table 4.4 also provides the resultsfor Java (aCd Bali) and the Outer Islands, based upon the pattern of growth inthe labor force shown in Table 4.3./i Sharp differences are projected:agriculture sheds labor on Java, but provides a high fraction of newemploymeat on the Outer Islands; mufacturing is of muh greater relativeImportance is Java, and accounts for over 30% of all ne employment in thefirst half of the 1990s, but is relatively unimportant in the Omter Islands;residual services are also much more Importaat in Java, but this is consistentwith productivity growth of 3.0Z p.a. in these sectors. As a consequencethere is a significant narrowing in the gap between sectoral laborproductivities between Java and the Outer Islands over the ten year period.
4.26 A second scenario was developed to examine the consequences ofunfavorable policy. Thds clearly shows the potential seriousness of theemployment problem. It corresponds to the low non-oil export case of Part I.The most sigifLant differences from the previous scenaio apply to thecommodity producing sectors. Agriculture grows slightly more slowly (at 3.2Zp.a.): in the short rua as a consequence of a less favorable investeat andpricing environment, and more genera.Uy a failure to tackle the difficultproblen of agricultural diversifcation; iu the longer term also as aconsequence of slower aggregate growth reducing the growth in deumd forfood. This is compounded by somewhat faster capital-labor substltutiontbrough excessive Incentives to mechanize agricultural production. Themaufacturing sector also follows a more capital intensive and less exportoriented path, as a consequence of a failure to correct existing biases in theincentive environmet and investment policy./2 These effects would beexacerbated by an iusufficiemtly rural bias to public expenditure policy, andexcessive share of relatively umeconomic, capital intenive investments.Lower export growth, and l-ager resource requiremets for inestmet, alsoleads to a slowdown in the growth of manufacturing output and employment.
4.27 The pattern of labor absorption would be very different from thefavorable policy scenrio. By 1995, there would be about 2.6 million lesspeopl e working in agriculture and 2.1 million less in maumfacturing than underthe favorable scenario. Although the higher average labor productivity growthin agrictlture would have some beneficial effects for farmers, the mainbeneficiaries would be those that could afford to mechanize, predominantlylarger farmers. The loss In potential employment opportunities wouldprimarily affect the households, and especially the children, of landlesslaborers and small farmers with inadequate access to land to provideemployment. There could thus be 4-5 million additional people looking for
/1 In the projection model Java-Rali and the Outer Islands are actually thepojection units, and Indonesia an aggregation. The results In Table 4.3 arebased on the intermediate tran ation scenario described in Chapter 5,para. 5.27.
/2 See Chapter 5, paras. 5.10 and 5.11 for a description of the alternativemanufacturing scenarios.

- 104 -
work in the residual service sectors over the ten year period, with heavypressure on the urban informal sector. If these sectors could absorb thesenumbers, this would lead to stagnant or declining labor productivity (andaverage incomes) for most of the period. The situation would be exacerbatedif the Government Implemented restrictive policies on relatively good informalsector work (such as street vending), as is now occuring in Jakarta. Underthese circumstances many new entrants would be forced into open unemploymentor more marginal service activities.
4.28 Under this scenario there is a high probability that incomedistribution and poverty would worsen, in both rural and urban areas. Inrural areas slower agricultural growth and more rapid labor displacement wouldtend to lead to lower agricultural wages and Incomes of small farmers, with ahigher proportion of any gains accruing to larger farmers. In urban areas thecombination of slow growth in wage employment in manufacturing and relativelylimited access to higher return informal sector activities ;,ould lead to muchgreater downward pressure on labor incomes at the lower end of the informalsector and in low wage activities. Since it is possible tiat this wouldco-exist with faster growth in wages at the upper end of tie formal sector,owing to the shift toward more capital intensive (and higber laborproductivity) techniques here, overall disparities in incomes could risesubstantially. The employment situation would be a nstter for serious concernuader these circumstances, and this provides a compelling case for adoptingpolicies that could increase the probability of realizing 'he favorablescenario.
Lower Oil Prices and Employment
4.29 The above discussion focused on the impact of alternative policiesunder the same external environment. We now look at the implications of aworsened external environment, using the low oil price scenario developed inPart L Lower resource availability reduces the secular growth rate ofnon-oil GDP to close to 4.2% p.a. and of manufacturing to 7.3% p.a., and,because of demand constraints, feasible agricultural growth is reduced to3.2% p.a. Since the GDvernment's resource situation would be tighter, it isassumed that the affordable size of transmigration would also be reduced (tothe low case described in para. 5.27). If labor productivity growth were thesame as in the favorable policy case, there would be a significant reductionof future employment in the commodity producing sectors: agriculture audmanufacturing would together employ 2.3 million less in 1995 than under thatscenario. This would lead to a difficult employment situation - eitherstagnant or declining incomes in the residual service sectors or a sharpincrease in unemployment. If this were also combined with policiesunfavorable to employment the situation could be very severe. To avoid thisoccuring even higher priority would need to be given to employment.
4.30 Table 4.5 presents the results of a scenario in which the employmentsituation would remain manageable, through the maintenance of a higher degreeof labor intensity in agriculture and manufacturing. This would be moredifficult to achieve than in the favorable policy scenario, though the areas

- 105 -
for policy intervention wuld be the sam as dicussed above. The maintenanceof a supportive environment for agriculture would again be crucial, but it mynow be necessary to introduce stronger dlsincentives to mecbani e and to aimfor the widest possible participation in new investment programs (such asrubber development). In public expenditure, deeper cuts in the capitalintensive sectors would probably be necessary to protect expenditures insocial and local economic lnfrastructure. There would also be a case for anexpansion in Special labor intensive programs, such as the Padat Karyaprogram, without changLng the policy of geographic targeting of itsactivities, since there may be many local areas with a severe lack ofemployment opportumities. Whlle the same overall policy stance onmanufacturlng would be appropriate, there would be a case for a uore carefulreview of the relative role of small and large scale production, since thecosts of displacement of household and suan enterprise production would beproportionately greater with lower overall growth of the sector. Table 4.5shows that with such a concerted effort to spread growth evenly, the increasein the labor force could be absorbed into employment with a gradual rise insectoral labor productivities. This resut Should not be interpreted asimplying that the employment problem could be easily tackled in an environmentof low oil prices. It would probably require a major effort on the part ofthe Government in the above areas to realize such a scenario.
Table 4.5: 2OTENTIAL IABOR ABSORPTION UNDER A IOW OIL HRICE SCENARIO,1986-95
Employment Iabor productivityShare of
Composition increment Growth Levels /d1980 1995 1-986-1995 1986-1995 1985 1995- Z - - Z - - Z p.a. - Rp.'OO0/worker
Agriculture 58 51 37 1.6 430 500Manufacturing 10 10 15 3.3 1,150 1,590Construction 3 3 4 1.4 1,750 2,010Services /a 24 29 32 1.5 870 1,010Miscellaneous /b 5 8 12 0.5 2,010 2,110
Total /c 100 100 100 2.0 760 930
/a Trade, transport, social and personal services.7i Non-oil mining, electricitv, gas and water, finance and public
administration./c Excludes Oil and ING.7T At 1980 prices.
Source: World Bank staff estimates and projections.

- 106 -
CHAPTER 5
SELECTED POLICY ISSUES AND EMPLOYMETI
5.1 The previous chapter concluded that there is a potentially seriousemployment problem, but with a concerted effort to support a labor intensivepattern of growth, the problem is potentially manageable. There will be aneed both for the effective absorption of new entrants into the labor forceand a continued rise in labor productivity and incomes of exi stig members ofthe workforce. The general economic policies to sustaln growth through theefficient use of resources in both the public and private sectors, that werediscussed in Part I, are essential to this, but there will also be a need forspecifically employment oriented measures. In this chapter we survey theimpact of five areas of government policy on employment. This is not acomprehensive review of policies related to the labor market, but covers thekey areas that can influence the fundamental labor absorption problem.
A. Agriculture
5.2 Although the relative role of agriculture in total employment isexpected to continue to decline, growth in agricultural incomes is stillcentral to a favorable employment picture, both on and off Java. To avoidexcessive rates of rural-urban migration, there will need to be continuedgrowth of jobs for rural households. The growth of the rural labor force islikely to be relatively high in the Outer Islands - around 3% p.a. under theintermediate transmigration scenario (para. 5.27) - but some growth in ruralemployment on Java, of the order of 1S p.a., will also be necessary. Theperformance of agriculture will be crucial to this scenario and to thecontinued improvement of the rural labor market both on and off Java.
5.3 In Chapter 4 we sa that the process of structural change was mostadvanced in Java. The numbers of people primarily dependent on agriculturedeclined in the 1970s, to about half of the total workforce at the beginningof the 19 8 0s. However, agricultural income growth has been buoyant rightthrough to 1985, as a consequence of favorable movements of the terms of tradefor farmers and significant productivity increases. There have beenparticularly beneficial links between agricultural income growth, theexpansion of the non-farm rural economy, and rural-urban flows of people andgoods./l This pattern of growth would be threatened by worse agriculturalprospects. Neither public spending nor rural manufacturing are likely to besufficiently large sources of autonomous income growth to compensate for amajor slowdown in agricultural income growth. Even if agriculture continuesto shed labor on Java, the growth in agricultural incomes will be essential tofurther increases in non-farm employment. On the Outer Islands the role ofagriculture will be even more important, since it will have to directly absorb
/1 For an account of past patterns of agricultural and non-agriculturalincome growth, see Appendix 1, paras. 8 to 21.

- 107 -
a significant proportion of the growth in the labor force if the employmentsituation is to improve. This will require somewhat higher agriculturalproduction increases and some shift in relative priorities in favor of theOuter Islands, though not to the neglect of the agricultural sector on Java.With respect to policy, two of the essential ingredients are a favorablepricing environment, i.e. no, or only gradual, shifts in the terms of tradefor agriculture /1, and continued improvements in agriculturalinfrastructure. The major opportunities for new water resource developmentare In the Outer Islands, but even in Java there is still scope for increasedcropping intensity through modernization of traditional irrigation systems,improved operation of existing schemes, and investments in water storage. Theother major agricultural investment program is in the tree crops subsector andthis is primarily oriented toward the Outer Islands.
5.4. Continued agricultural growth could, however, be threatened by theemergence of domestic demand constraints for food. As noted in Part I, thereis evidence of supply exceeding demand for rice in 1984. The scope forcontinued growth in production of rice and other staples is likely to be muchmore limited than in the past. Agricultural diversification Into productswith better demand prospects will be essential on Jarva. The Government isproposing to shift its priorities toward support for other agriculturalactivities, such as coru and soya, vegetables and livestock. Micro evidencef-rom West Java indicates that this process of diversification was alreadytaking place in the 1977-1983 period, in response to rising demand (seeAppendix 1, paras. 13 to 17). However, support for this process could be amuch more complex matter than the government measures supporting riceproduction in the 1970s. An appropriate policy package is as yet unclear, andpriority should be given to analysis of this issue In the near future.
5.5. The other agricultural issue relevant to employment is the pace oftechnological change.,/2 Existilng agricultural practices are highly laborintensive, especially in Java, and there is the technical potential forsubstantial labor displacement through tractorization and other forms ofmechanisation. The existing stock of agricultural machinery is very low, but
/1 In practice this implies only a gradual increase in real fertilizerprices, as argued in Indonesia - Policy Options and Prospects for Major FoodCrops, World Bank Report No. 3686b-IND, April 4, 1983, though there may be aneed to reappraise the difficult trade offs in this area if a significant ricesurplus emerges.
/2 The results in this section are mainly based upon papers collected inFaisal Kasryno et al, ed., Consequences of Small Farm Mechanization inIndouesla, 1984; see in particular Yusuf Saefudin, The Comparative Advantageof Mechanized Rice Production. The data is largely for 1979-80. Forpreliminary analysis of more recent data (from less mechanized villages) seeFaisal Kasryno, Efficiency Analysis of Rice Farming in Java, 1977-83 (draft),Center for Agro Economic Research, Bogor, March 1984. This suggests someeconomic advantages of tractorization, but this does not change the argumentin the text on an appropriate Incentive policy, in view of the potentialemployment effects.

- 108 -
it has been increasing rapidly, with a fourfold increase in the numbers oftractors, and even larger increases in threshers, pumps and dryers between1978 and 1981. Studies in West Java, where ownership of hand tractors hasbeen growing most rapidly, indicate that farmers using tractors forcultivation use about 20% less labor per season in wet rice cultivation.Similar results were found for South Sulawesi. These micro studies suggestthat the main effect is to reduce the share of labor and increase the share ofcapital in value added. Yield effects were negligible, and there were littleor no additional economic gains from tractorization./l Even the directfinancial effects were limited, partly because of high tractor prices(significantly above international prices) and inadequate repair andmaintenance facilities. There were, however, significant advantages to largefarmers, who were the main purchasers, through the reduced effort anduncertainty over organizing labor and the high premium on speed ofcultivation. The limited available evidence suggests that threshers anddryers can have economic benefits, brLt again at the cost of some labordisplacement.
5.6 In this context a cautious policy on mechanization is appropriate, atleast for Java. Tractor prices are high now, owing to high production anddistribution costs, but there is a risk that a sharp reduction in the cost tothe farmer of purchasing tractors could lead to an acceleration of theexisting process of change, for limited economic benefits. In particular,this implies that there should be no use of subsidized credit facilities:tractors are attractive to lenders since they provide their own collateral andinvolve large loans. Tractors may form a useful part of BRI's portfolio, butthere is no economic case for the use of special programs, such as KIK, forthis purpose./2 Under these conditions the very moderate rate of decline ofthe agricultural workforce on Java shown in the favorable policy case ofChapter 4 is plausible. More rapid mechanization, or slower agriculturalproduction growth, could lead to the release of far more landless laborersthan the rural non-farm economy or the urban informal sector could effectivelyabsorb. It should be stressed that this is a complex area, and there is astrong case of additional studies of the situation to update our knowledge.
5.7 In the Outer Islands the situation is somewhat different. In mostareas there are shortages of labor and draught animals, and this suggests astronger case for mechanization than on Java. Conditions vary from area to
/1 An economic analysis at efficiency prices showed that rice productionmakes good economic sense with both mechanized and manual land cultivation,but that there were no additional benefits from mechanization, see YusufSaefudin, 22. cit. The phenomenon of negligible yield effects ofmechanization is a general one, see Hans Binswanger, AgriculturalMechanization - A Comparative Historical Perspective, World Bank Staff WorkingPaper No. 673, 1984.
/2 Tractors have been financed by the KIK program in the past, but thevillage evidence indicates that the bulk of past purchases have been financedby suppliers' credit and own resources.

- 109 -
area. In South Sulawesi the impact of tractorization appears to have beencomparable to West Java, with a reduction in labor use, but limited economicadvantages. However, in West Sumatra there has been a rapid and successfulgrowth in the use of locally produced threshers, and to a lesser extent, handtractors, that has been to the benefit of both equipment producers andusers.fl In Aceh it is reported that the costs of manual cultivation havebecome so high (three to four times that on Java) that farmers are movingdirectly to the use of large four wheel tractors; this may be because of thelack of availability of or information on small tractors. Given thisdiversity the Government's current policy of selective mechanization inspecific geographic regions is appropriate. There is still no case forsubsidized credit facilities, and the main instruments of this policy shouldbe extension advice to farmprs and provision of information to producers.
5.8 Appropriate industrial policy is also of importance to agriculturalmechanization. Although sharp price reductions (of hand tractors, at least)could have undesirable effects on employment, a gradual decline in real pricesthrough increased efficiency of production and distribution would bebeneficial. This is best fostered by the encouragement of domestic andinternational competition. The development of small scale productioa in theregion of use is also important. Appropriate agricultural implements varysubstantially according to local economic and agronomic conditions.International experience indicates that small producers can be a major sourceof innovation and adaptation, since the engineering requirements are low.12The encouragement of local producers and relatively simple technologies, as inthe Government's pilot schemes in West Sumatra, is likely to be much moreeffective in this regard than attempts to replace existing imported modelswith large scale production. This approach has the additional importantbenefit of facilitating the development of local repair and maintenancefacilities.
B. Manufacturing
5.9 The manufacturing sector has both a direct and indirect impact on theemployment situation. The most valuable macroeconomic contribution of thesector in the next ten years could be the provision of incremental foreignexchange, througgh an efficient pattern of growth, to compensate for therelative decline in oil earnings. This is essential to the consistency of theoverall growth path with macroeconomic resource constraints. The sector'smajor contribution to employment could be through this indirect mechanism, anddirect employment creation should not take priority over measures to fosterthe efficient industrial production that is a prerequisite to the performanceof its macroeconomic, foreign exchange earning role. However, as indicated inTable 4.4, manufacturing does have the potential to become a major source ofnew employment in its own right, at least on Java. If achieved, this wouldput Java closer to the pattern of long term growth and structural change that
/I See the Sam H. Johnson et al., Evaluation of IRRI-DITPROD Small ScaleAgricultural Equipment Extension Project, January-February 1985.
/2 See Hans Binswanger, op. cit.

- 10 -
other major East Asian rice economies have passed through./l Moreover, therecan be a high degree of complementarity between an efficient, foreign exchangeearning pattern of industrial growth and a relatively labor intensive one.
5.10 Government policies can have a major influence on employment inmanufacturing in Indonesia through the impact on the composition of industrialoutput and the relative role of large and small scale production. There is awide variation in the degree of labor intensity of different subsectors, andpolicies that encourage faster growth in labor intensive sectors raise totalindustrial employment. This is closely related to a more export orientedpolicy. The employment implications of the alternative scenarios forindustrial growth discussed in Part I are summarized in Table 5.1./2 Thefirst scenario corresponds to the base case of Part I. It assumes a shift inindustrial and trade policy to support the growth of an efficient and moreexport oriented industrial sector (see Chapter 3). There is relativelygradual import substitution (the overall share of imports in final demand formanufactures declines from 35% in 1980 to 27% in 1995), but with aproportionately higher reduction in consumer goods. Manufactured exports growat 11% p.a. in the 1986-95 period and value added at about 8% p.a. Under thisscenario, that forms part of the favorable policy case of Chapter 4, totalemployment in the sector increases by almost 50%, or by 2.5 million peopleover the ten year period, and accounts for 16% of national incrementalemployment. This scenario is particularly beneficial to Java, that is thenatural location for labor intensive industries. By the early 1990s, theindustrial sector could account for over 30% of new jobs created each year onJava.
5.11 The other scenarios explore the implications of the continuation ofthe present industrial policy framework, with a bias toward importsubstitution in relatively capital intensive producer goods sectors. Toisolate the effects of varying labor intensity, the second scenario assumesthat growth in manufacturing value added could still be about 8% p.a. Theshare of imports in final demand drops from 35% in 1980 to 22% by 1995, butexports only grow at 5% p.a. As a consequence, total employment only rises by26% over the ten year period, and there are 1.3 million fewer workers in thesector in 1995 than in the labor intensive scenario. These workers would beforced to look for work in the residual services sectors, leading to aworsening employment situation, especially in urban areas, as outlined in
/1 See Chapter 4 of Indonesia - Wages and Employment in Indonesia, 22. cit.This would be closer to the Japanese pattern of an extended period of change,rather than the rapid shifts in employment from agriculture to manufacturingin countries such as Korea.
/2 The analysis was conducted on the basis of the 1980 Input-Output Tables,at the 66-sector disaggregation, that has 24 manufacturing subsectors. Thesame elasticities of domestic final demand with respect to national incomewere assumed for all scenarios, and only minor differences in laborproductivity growth at the subsector level. Thus, the main differences aredue to different patterns of subsectoral growth.

- ill -
Chapter 4. However, even this is probably too optimistic. Lower exportearnings, combined with the higher investment costs of the capital intensiveinvestment would tend to lower the affordable rate of growth, if the debtservice burden is to remain manageable (see para. 3.25). The third scenarioillustrates the consequences of a growth in industrial value added of 6X p.a.in 1986-95, as in the low non-oil export scenario of Chapter 2. In this casethe sector makes a very small contribution to labor absorption, and by 1995there are 2.1 million le6s industrial jobs than under the labor intensivescenario.
Table 5.1: ALTERNATIVE SCENARIOS FOR MANUFACTURING GROWTH, 1986-95
Share of nationalGrowth in value incremental
added Total emplo ent employment1986-95 l985 995 1986-95X p.a. - '000 -- --- %
Labor intensive /aConsumer goods 7 3,900 5,600 11Producer goods 10 1,400 2,200 5
Total 8 5,300 7,800 16
Capital intensive/high growthConsumer goods 6 3,900 4,500 4Producer goods 11 1,400 2,000 4
Total 8 5.3OO 6,500 8
Capital intensive/low growth /bConsumer goods 5 3,900 4,200 2Producer goods 7 1,400 1,500 1
Total 6 5,300 5,700 3
/a This correponds to the base case of Chapter 2, and the favorable policyscenario of Chapter 4.
/b This corresponds to the low non-oil export case cf Chapter 2 and theunfavorable policy scenario of Chapter 4.
Source: World Bank staff estimates and projections.

- 12 -
5.12 In addition to the varying direct effects shown in Table 5.1, thelabor intensive scenario is likely to have more beneficial indirect effects.First, demand linkage effects would be stronger under this scenario - therelatively faster expanding sectors have a higher share of wages in valueadded, and expenditure analysis of the use of incremental income indicatesthat this could be a significant source of demand for domestically producedgoods and services./l Second, if past patterns of wage determinationcontinue, a relatively labor intensive pattern of industrial production wouldbe associated with lower wage differentials. This would tend to reducedisparities within the urban labor market, and would thereby lead to a lowerrate of unemployment.
5.13 The degree of labor intensity of individual subsectors is oftenclosely related to the share of small scale firms in production. The abovescenarios assume that there will not be a major shift in the degree of laborintensity of individual subsectors; a continued role for the small scalesector will be important to this. Small scale production can usefully bedivided into household (cottage) and small enterprise activities./2 As shownin Table 5.2 the small scale sector accounted for the bulk of employment, buta fraction of value added, at the end of the 1970s. Productivity is very low,especially for the household sector. However, the growth experience was good,with both the household and small enterprise sectors growing slightly fasterthan the large scale sector. Micro studies of two major industries in Java,rice milling and weaving, do indicate some displacement of existing smallscale activities (and labor) with the introduction of new technologies, but,In both the subsectors studied, the traditional highly labor intensiveproduction technique was not the appropriate economic choice, despite the loweconomic cost of labor in Java./3 In neither case is the new preferredtechnique very capital intensive. Moreover, the loss in employment in thesespecific areas appears to have been more than compenAted by the generalexpansion in non-farm employment in this period.
/1 Analysis of the 1981 SUSENAS shows that the bulk of incrementalconsumption is allocated to housing, education, health, transport,domestically produced manufactures and a variety of foodstuffs, in both ruraland urban areas. See Appendix 3, Tables 10 and 11.
/2 BPS defines the sectors by number of employees: household (cottage) 1-4;smnll 5-19; medium 20-99; large 100 and above.
/3 See Peter Timmer, 'Choice of Technique in Rice Milling in Java", Bulletinof Indonesian Economic Studies, Vol. IX, No. 2, July 1973, and Hal Hill,The Economics of Recent Changes in the Weaving Industry', idem, Vol. XVI,
No. 2, July 1980.

- 113 -
Table 5.2: THE SHARE OF SMALL AND LARGE SCALE FIRMS IN EMPLOYMENT ANDVALUE ADDED IN MANUFACTURING, 1979
No. of Shares in 1979 Growth in valueemplovees Value added Employment added 1974-79 /a
% ---- (% p.a.)
Household 1-4 12 63 11.9Small 5-19 7 18 11.9Medium and large 20 + 81 19 11.6
Total n.a. 100 100 11.6
/a There was a change in the definiton of employment between 1974 and 1979 toexclude part-time workers, rendering employment comparisons unreliable.
Source: Census of Industry 1974/75 and Survey of Small Scale Industries,1979, BPS.
5.14 The pattern of the 1970s was similar to that in many other Asianeconomics. At Indonesia's stage of industrial development other countriesexperienced the parallel expansion of small and large scale enterpriseproduction, as well as a decline in the relative importance of householdproduction./l This experience also s"ggests that the most effective way ofsustaining this increase is through general rather than specificpolicies. Two factors have a dominant influence: first, a spatially dispersedpattern of growth of final demand, especially in rural areas; and second, theavoidance of preferential treatment, through credit subsidies, licensing,etc., to large scale firms. In Indonesia the set of policies designed tomaintain agricultural income growth on the one hand, and to increase thecompetitiveness of industry (outlined in Part I) on the other, can alsosupport the expansion of the small scale sector.
5.15 Is there an additional role for special measures to support smallscale industries? The Government has introduced a program to encouragesubcontracting by large to small firms under the bapak angkat system. This isof particular relevance to the engineering sector. An overall assessment ofthis policy is not feasible in this report, but some results on the issues areavailable for the vehicles industry, where one of the instruments for
/1 See Dennis Anderson, Small Industry in Developing Countries, World BankStaff Working Paper No. 518, 1982. Although the results in Table 5.2 suggesta buoyant growth in value added in the household sector, micro evidence fromWest Java indicates a decline in importance of some categories of very lowreturn household industries, such as mat or string weaving.

- 114 -
effecting the policy is mandatory subcontracting for specific parts./I Therehave been a few cases of successful partnerships developing, notably in theproduction of hand tractors, but for most firms surveyed, subcontracting haspredominantly been with other large scale firms, on the grounds that this waseasier and more efficient for the parent company. While the program couldhave beneficial effects, it would be unwise to have high expectations of itsimpact on employment creation in manufacturing. Companies may often considerit disadvantageous, because of technical difficulties of supervison and therisk of higher production costs.
5.16 Finally, in the area of credit policy, there is a potential role forspecial credit programs (though not at subsidized interest rates), since bankstend to be excessively risk averse in their dealings with small scale firms.The KIK/KMKP program is the most important example in Indonesia. Althoughexperiencing some problems of management and poor collection performance, itis, in two respects, well designed: it lets market demand largely determinethe shares of working capital and investment loans, and it does not precludeservice sector firms. The provision of credit to the small scale tradingsector is an effective way of facilitating the transmission of final demandfor manufactures to small scale producers.
C. Public Expenditures
5.17 The level and distribution of public expenditures has a powerfulinfluence on the demand for labor tlrough the growth effects of productiveiuvestment and the direct and indirect impact of investment demand onemployment in the implementation phase. Certain expenditures are relativelyfavorable to labor demand, and, although employment may not be the primaryobjective of public expenditures, it is important that it also enter theanalysis of intersectoral and project choices.
5.18. The primary focus here is on the expenditure phase of publicinvestments. There are three effects: direct employment in developmentprojects; employment in other sectors whose production increases as aconsequence of the public investment demand; and demand-side multipliereffects from the increased household income, especially labor income, createdby the public expenditure. All three were significant to the past favorablepattern of growth in output and employment, and there is a case for themaintenance of a moderately expansionary domestic component of publicexpenditure over the medium term, to support the continuation of thispattern. Demand-side multiplier effects are discussed further for rural Javain Appendix 1 (paras. 19 to 21). They are probably at least as important asthe other two effects.
11 See Thee Kian Wie, Subcontracting in the Engineering Subsector inIndonesia, A Preliminary Survey, preliminary draft report, LEKNAS-LIPI,September 1984.

- 115 -
5.19 As discussed in Part I, the composition of investment can influenceboth the import bill and total employment creation since import and employmentcoefficients vary by sector (see Table 3.5). To the extent that theGovernment can effectively switch the composition of investments in favor ofless import intensive activities, a higher aggregate level of investment canbe implemented. Programs in sectors with low import intensity, for example inthe social sectors, regional development (local infrastructure) andtrausmigration, are less costly in terms of the overall foreign exchangeconstraint. Employment considerations nicely complement the objective ofminimizing import requirements, since investments with a high domestic contentcharacteristically have relatively large direct and indirect employmenteffects.
5.20 In REPELITA III it is estimated that the direct and indirect effectsof development expenditure provided the equivalent of permanent employment forat least 1.9 million people. It was concluded in Part I that the changedsectoral composition in REPELITA IV (compared with the REPELITA IIIrealization) was reasonable and that this would lead to a somewhat more laborintensive pattern of expenditure. This would generate a growth in direct andindirect employment from development spending roughly in line with the growthof the labor force. The relative emphasis on agriculture and localinfrastructure in Repelita IV is also supportive of a more labor inteusivepattern of growth in the longer term. From the viewpoint of employment, it isof great importance that the Government maintain the composition ofexpenditure planned for REPELITA IV and resist any pressures to increase therelative allocation to capital intensive sectors. This will probably requirea major effort to improve the implementation performance of the less capitalintensive programs, notably in the education sector anr. amongst the INPRESprograms. Some increase in support to lower levels of Government may benecessary to achieve this. The institutional capability of local governmentis often weak, yet, in the oil boom period, kabupaten offices demonstratedtheir ability to handle sharp increases in the size of construction programsreasonably effectively. In the event of a worsening in the employmentsituation, it would be appropriate to consider the case for furtherexpenditure switching away from capital intensive sectors to ensure themaintenance of a moderate growth in employment intensive expenditures,especially in rural areas, when this is economically justified and can beeffectively implemented.
5.21 The overall intersectoral composition of expenditure is only oneaspect of the employment effects of public expenditure. There are alsosignificant variations in labor intensity of expenditures within sectoralprograms, and even for the same activity. A systematic analysis of this issueis beyond the scope of this report, but some examples can show the importanceof evaluation of the labor intensity of alternative expenditure choices. Inthe irrigation sector, both rehabilitation and tertiary canal construction aremore labor intensive activities than primary canal construction, and much morethan dam construction. They also have high economic rates of return. Thisneed not imply that the composition of irrigation expenditure should beadjusted primarily to increase employment; the current program appears to befairly well balanced. However, in the event of a tighter resource constraint,

- 116 -
or a worsenaing employment situation, there may be a case for protection of therehabilitation and tertiaries programs. In the transport sector, investmentsin rural roads are much more labor intensive than for highways or maritimedevelopments. They also make good economic sense./l A balanced investmentprogram will again include the whole range of activities, but it is importantthat some priority to rural road development is maintained, both in budgetallocations and in efforts to improve implementation. A further area ofrelevance is the level of recurrent expenditures on infrastructure: in bothroads and irrigation the most appropriate technique for regular maintenance ismore labor intensive than for periodic rehabilitation, and much more than forreplacement investment. It is again beneficial to choose the first option.Although this may require higher fiscal resources in the short run, it usuallyleads to lower demands on the budget in the medium term.
5.22 In view of the seriousness of the omnzlTyment situation, the impact onemployment should also be one of the factors in the assessment of individualpublic investments. On the basis of the projected &vailability of resourcesfor investment in the base case and the projected rise in the labor force, theaverage investment resources per new job will be of the order of US$12,500 (in1985 prices) in the 1986-90 period. The choice of individual projects should,in the final analysis, depend on an evaluation of their economic contributionto the country's development, and there will be both capital and laborintensive pro4ects in a balanced investment program. However, because oftheir greater usage of scarce resources, there is a case for subjecting largescale and capital intensive projects to special scrutiny. Currently, fulleconomic analyses of projects do not appear to be carried out in a systematicfashion. It is suggested that projects requiring investment resources per jobsubstantially in excess of the indicative figure of US$12,500 be morecarefully evaluated for their overall contribution to the country, through therigorous use of techniques of economic appraisal.
5.23 Finally, there may be alternative choices of technique in the designof an individual project, and a relatively labor intensive constructiontechnique may be an economic option for the same task. Unlike many othercountries, there is no general evidence to suggest that the choice oftechnique in construction is excessively capital intensive. Java and Bali inparticular hav2 a tradition of labor intensive construction methods, and laborproductivity is considered to be high by international standards./2 However,there are pressures for project manageric to get tasks done quickly and withminimal use of rupiah budget resources, and this could encourage the use ofequipment intensive methods: in some areas there may be scope for changingexisting practices. One example is the use of labor intensive techniques forland clearing; the Government is now shifting towards this approach intransmigration sites. This requires dif-arent organizational arrangements,and in particular the transport of transmigrants prior to land clearing, butcase studies suggest that this is an eca -mic choice.
/1 For Java economic rates of return for rural roads investments of the orderof 25% have been estimated. See Indonesia - Rural Roads Development ProjectWorld Bank Report No. 3585-IND, December 10, 1981.
/2 See Basil Coukis, ed., Labor-based Construction Programs, World Bank, 1983.

- 117 -
D. Trasrmigration
5.24 The government sponsored transmigration program involves the movementof poor, landless or near landless households from Java and Bali to land richareas In the Outer Islands. The Government finances economic and socialinfrastructure in the transuigration site, as well as transport, initialsubsistence supplies and agricultural Inputs. In addition to the sponsoredprogram, there are substantial flows of 'spoataneous' transmigrants. Some ofthese flows are independent of the sponsored program, but there is alsoevidence of quite significant spontaneous flows that follow in the wake of theGovernment's program. Migrants frequently follow the path of relatives, whocan provide informatiom on economic prospects and some initial support, aswell as a more comfortable social envirnoment in a strange land. This meansthat the impact of sponsored transmigration on total population flows can belarger than the initial program. Site evaluation and investment planningneeds to take account of this. Transmigration has the potential to reapsubstantial benefits. It can provide employment and land ownership to some ofthe poorest members of the labor force in Java. It also brings underutilizedland into intensive cultivation, raises agricultural production andcontributes more broadly to economic development in the Outer Islands.
5.25 Transmigration has played a large role in the total picture ofinter-island population movement in the past. The impact on provincialpopulation in 1980 is shown in Appendix 3, Table 4. 220,000 households weremoved between l999 and 1978, and, by 1980, 3% of the total population in theOuter Islands were there as a consequence of sponsored transmigration. If weexclude the two special cases of Lampung and North Sunatra, this was almosthalf of the total population of Inner Islands' stock living in the CuterIslands./l In REPELITA, III the program accelerdted, with a total of 320,000households moving under the sponsored program./2 The Government estimatesfrom registration statistics that an additional 150,000 families movedspontaneously in RE3MIITA. III, but this probably uaderestimates the truenumber. This implies that total migration to the Outer Islands has beenproviding employment to of the order of 170,000 people p.a., equivalent to 20Xof the total increment to tie labor force in Java and Bali (and about 30Z ofthe increment to the rural labor force). To a large extent it is providingmore productive employment to existing members of the labor force, but this isan equally valuable objective on welfare grounds.
/1 There was a transmigration program to Lamptmg in the colon' l period, andthere have been major moverments of Javanese labor to the North Sumatra treecrop estates - again government sponsored.
/2 This excludes officially recorded local transmigrants within Lampung, anda number from the REPELITA II program that moved in 1979. There is also someuncertainty over the extent of local movement in the figure of 320,000. TheGovernment is now aiming for a figure of 10% of transmigrants coming fromwithin the province: in the projections below, the REPELITA InT level wasreduced by this proportion, for consistency with the treatment of REPELITA IVtargets.

- 118 -
5.26 The program does, however, carry risks for the evolution of the labormarket. It results in a large increase in the population and labor force inparts of the Outer Islands and also potentially increases the mobility of partof the labor force. If living conditions and incomes do not match the needsor expectations of transmigrants, there is a possibility of significant secondround flows of either the original transmigrants, or, after a period, theirchildren. This could involve either a reflow back to Java or to urban centersin the Outer Islands. Either could be destabilizing for the labor market -but because of their relatively small initial size, urban centers in the OuterIslands could face the greater difficulty in labor absorptioa. To avoid apotentially difficult labor market problem, it is essential that the programbe designed to ensure adequate permanent incomes for transmigrant households.Of course, some increase in rural-urban migration in the Outer Islands isunavoidable; indeed, an expansion of the urban economy to complement the rapidrural growth is a desirable development. This implies that, over time,increased emphasis should be given to investment in both urban facilities andproductive (especially industrial) investment in these rapidly growing regions.
5.27 An overall assessment of the transmigration program is not feasiblenow. The two key ingredients for this are evidence on actual householdincomes in established transmigration areas, and detailed evaluations of theagronomic and economic potential of likely future sites, and neither are nowavailable.1l However, it is possible to form reasonable alternative views onthe future size and direction of flows, and to assess the likely impact on thepattern of growth of the population and the labor force. In Repelita IV theGovernment plans to move 500,000 houeeholds under the sponsored program, andprojects that a further 250,000 households will move spontaneously. Theplanned program represents an increase over achievements in REPELITA III ofabout 55%. In addition, there is a major change in the direction ofmovement. The bulk of feasible sites in traditional transmigration regions inSumatra and Sulawesi have been filled, and the province of Lampung wasdeclared closed to all new transmigration in 1980. Apart from some potentialfor flows directly associated with tree crops investments on land alreadyearmarked for estate development in Sumatra, the majority of newtransmigration sites will be located in Kalimsatan and Irian Jaya. Such sitesare more remote, costs of movement and infrastructural investment arehigher 12, and the logistics of implementation more difficult. TheGovernment t s target appears to be at the upper end of what could feasi ly beimplemented given managerial constraints - it is termed the high case here -and a lower figure of 400,000 households uader the sponsored program in
/l BPS is mounting a household income and expenditure survey intransmigration areas in mid-1985, financed from a World Bank loan fortransmigration.
/2 The World Bank estimates that the basic costs for on-site development inte REPELITA IV program will be at least $7,000 and quite possibly more perhousehold, compared with t5,700 in REPELITA III (both figures in 1985 prices).

- 119 -
REPELIrA IV has been used as an intermediate case. /1 The implications ofthese two scenarios, as well as a low case of 300,000 sponsored transmigranthouseholds in REPELITA IV, were explored through use of a demographicprojection model 12. In each case it was assumed that the program wouldcontinue in REPEXIIA V and VI, and that there would be significant associatedspontaneous flows.
5.28 The impact of the various scenarios on Java are summarized inTable 5.3. The effect on the labor force is relatively large sincetransmigrants usually come from groups with higher labor force participationrates. Under the Intermediate case total migration (including flows quiteindependent of transmigration) could provide employment for 30Z of theIncrease in the labor force between 1985 and 1995. The overall effects of thetransmigration program account for 20X alone./3 Under the low case the totalcontribution of migration to employment creatlon falls to 15Z of the growth in
Table 5.3: GROWTH IN POPULATION AND THE LABOR FORCE IN JAVA AND BALIUNDER ALTERNATIVE TRANSMIGRATION SCENARIOS, 1986-95
Annual Increment to thePopulation growth labor force
1986-90 1991-95 1986-90 1991-95Z p.a. '000
No migration 1.7 1.5 900 980Past trends /a 1.6 1.4 810 900
Low case 1.6 1.4 750 860Intermediate case 1.2 1.0 640 680High case 1.1 0.8 590 540
/a This assumes migration continues at the same absolute levels as between1971 and 1980.
Source: World Bank staff projections.
/1 As noted above, the transmigration program total includes some localsettlers who join the program; it is projected that actual interprovincialflows would be 10Z below these aggregate figures.
/2 See Appendix 2. The model takes account both of the direct effect ofmigration and of the impact on subsequent population growth.
/3 This includes both transmigrants directly sponsored by the Government, andassociated spontaneous flows.

- 120 -
the labor 4 s-,ce. Despite the large size of the initial population, migrationwould have a significant impact on total population and labor force levels.As a consequence of migration since 1980, the 1990 population is 4% below whatit would otherwise have been in Java and Bali under the intermediate case.This is equivalent to 4.7 million people, of which 4.1 million would be due tothe direct and indirect effects of the transmigration program. By the year2000 the reduction is 8%, equivalent to U1.8 million people, of which 10.6million would be due to the program.
5.29 There is a much larger relative effect on the recipient areas in theOuter Islands, owing to the smaller initial population levels. This is givenfor the various scenarios in Table 5.4. This again only covers the effects ofmigration since 1980. The actual distribution of transmigrants betweenprovinces is based on World Bank estimates of future land potential. Therelative shift in favor of Kalimantan and Irian Jaya is clear, and it wasassumed that any cutback in the program, as under the low case, would falllargely on these islands. The growth rate of the population risessignificantly with transmigration (and of the labor force even more so), andeven by 1990 a high proportion of the population is due to migration - 18%in Kalimantan and 26Z in Irian Jaya for the intermediate case. These wouldcontinue to rise in the 1990s if the program were maintained at the levelsassumed. Under the intermediate case, migration would account for 32% ofKalimantan's and 55% of Irian Jaya's population by the year 2000.
Table 5.4: THE POTENTIAL IMPACT OF TRANSKIGRATION ON THE OUTER ISLANDS,1990-2000
Proportion ofPopulation due to
Population growth rates, 1990-2000 migration, 1990No Past Inter- Inter-
migration treads Low mediate High Low mediate High% p.a. X
Sumatra 2.1 2.4 2.2 2.5 2.7 6 7 7Kalimantan 2.1 2.4 2.6 4.0 4.8 13 18 20Sulawesi 2.1 2.1 2.1 2.3 2.3 2 3 4Irian Jaya 2.4 2.6 4.9 7.5 8.6 22 26 28Other /a 2.2 2.2 2.2 2.3 2.3 2 2 3
Total /b 2.1 2.3 2.3 2.9 3.2 6 8 9
/a East Nusa Tenggara, East Timor and Maluku.7h Excludes Bali and West Nusa Tenggara - source regions for transmigrants.
Source: World Bank staff projections.

- 121 -
5.30 The above figures show the potentially major contribution of thetransmigration program to the key welfare issue of reducing rural poverty onJava. However, it would also involve a major commitment of public resources -at an estimated average cost of $8-10,000 per family, the intermediate casewould require of the order of $3.5 billion at 1985 prices over a five yearperiod./l If the program is to be viable, and if destabilizing second roundmigration flows are to be avoided, it is critical that the selection of sitesand the desiga of economic activity be such that the settlers can generateadequate ouput and incomes. Preliminary analysis of farm models suggests thattransmigration might only be justified to sites that also involve second stageagricultural development: either tree crops, wetland agriculture orlivestock. The implementation capacity for this type of investment is lowerthan for a rainfed/subsistence package while the investment required ishigher. Owing to these implementation and resource constraints, and thecompeting claims of existing low income farmers in other parts of the OuterIslands, there may be difficulties in achieving the level of transmigration incurrent government targets. However, even under the low case developed here,the employment impact is significant, though this would place a greater shareof the reponsibility for job creation and income formation on rural and urbandevelopment within Java.
E. Policy Towards the Urban Labor Market
5.31 There are two aspects of the urban employment problem: relativelyhigh unemployment rates, especially amongst the young and educated; and lowincomes in parts of the informal sector and the low wage end of the formalsector. These generally involve different households, since the openlyunemployed are characteristically those who can afford the long waiting timesfor a preferred formal sector job. But both unemployment and low incomes willbe quite vulnerable to the pattern of urban growth in the future.
5.32 A major influence on the urban labor market will Le the overall paceof urbanization, and, in particular the rate of rural-urban migration. Themost important determinant of rural-urban migration over the next ten years islikely to be the degree of success in rural .developmeat and the extent ofabsorption of labor into both farm and non-farm rural employment. Thepriority to agricultural growth, and supportive public expenditures are thekey policy areas here as discussed above. The population and labor forceprojections (see Appendix 2) assume fafrly moderate levels of rural-urbanmigration in the future, but tnis still implies rates of urban populationgrowth of about 2.5% p.a. on Java and 4.9% p.a. in the Outer Islands (underthe intermediate transmigration scenario)./2 This is associated with somewhathigher rates of urban labor force growth (3% in Java, rising to over 6% in the
/1 This Includes the costs of second stage agricultural development.
/2 Since lack of data makes explicit treatment of rural-urban migration flowsexceedingly difficult, a steady differential between rural and urbanpopulation growth was assumed as a proxy for this relationship.

- 122 -
fastest growing island of Kalimantan). Java is projected to account for over55% of the annual increment to the urban labor force of 600,000 over the nextten years, compared with 30Z of the growth in the rural labor force.
5.33 Both the formal and informal sectors wlll play a role in theabsorption of this labor force growth in urban areas. A gradual increase inthe share of the formal sector in urban employment would generally be expectedin the process of development, but it is not at all clear that this will occurin the next few years, given the probability of slow growth in public sectorand manufacturing employment in the near term. Thus the capacity for theinformal sector to absorb new entrants to the labor force will be ofparticular importance.
5.34 Although there are constraints on the growth in formal sectoremployment in the short term, there is much greater potential over a ten yearperiod As discussed in Chapter 4 and Appendix 1 (paras. 37 to 41), access toformal sector employment is central to the rate of unemployment amongst schoolleavers. The main area in which policy can infllence the level of employmentis in the manufacturing sector. As discussed in Section B above, if Indonesiafollows a relatively labor intensive pattern of growth in this sector, thereis scope for a substantial increase in employment, of the order of 2.5 millionnew jobs over ten years, and many of these would be in urban areas.
5.35 The level of compensation in the upper segments of the formal sectoris also a significant determinant of the rate of unemployment - this affectsthe incentive to wait for a better job. Unlike many other developingcountries, government legislation on labor policy does not appear to be amajor factor behind high wages at the top of the formal sector. Minimumwages, where they are regularly updated (as in Jakarta), appear to follow thebottom of the market in the medium and large scale sector and aresubstantially below the top of the market. They perform a useful role In thisregard. Trade unions operate within the framework of tripartite discussionson working conditions, especially in negotiations over Collective LaborAgreements-, but these do not usually include wage rates. The explanation forhigh wages appears rather to lie in the perceived advantages to large scalefirms of achiering a reliable, low turnover work force (see Appendix 1, para.33). A relatively labor intensive pattern of growth within the formalmanufacturing sector should help limit any tendency for a widening ofdifferentials.
5.36 Even with a good employment performance by the manufacturing sectorthere is a risk of a rising disparity between the supply of and demand forformal sector jobs, and so increasing unemployment. Is there scope forspecific interventions aimed at getting the unemployed into work? There aretwo relevant areas of current government policy: the improvement of laborexchanges and the extension of vocational education. However, in neither caseis policy likely to have much impact on unemployment rates. First, theevidence on the workings of labor exchanges suggest that they are alreadycapturing a substantial proportion of both the urban unemployed (andespecially the educated) and vacancies in the formal sector, and a highproportion of vacancies are filled each month (see Appendix 1, para. 42). Thekey problem is not weak job matching or lack of information, but a shortage of

- 123 -
good formal sector jobs relative to the expectations of the unemployed.Second, the formal vocational training system does not now have the capacityto implement a broad based effort to upgrade the skills of the unemployed.The key problem is of low and variable quality, especially for the vocationaltraining centers, and the Government has quite correctly decided to focus onupgrading the quality of existing establishments. This is, of necessity, along term task. In any case, despite the existence of shortages of industrialskills, the potential demand for skilled manpower is small relative to thenumbers of unemployed (or even the numbers of educated unemployed).
5.37 The urban informal sector currently has little relationship toeducated unemployment, but it will continue to play a major role in laborabsorption of less weli educated entrants to the urban labor force, especiallyfrom rural households. Although this is recognized in REPELIT& IV, someaspects of current government policy could limit this role. This is mostevident in Jakarta, where informal sector activities have most frequently comeinto conflict with other objectives of urban development. Currently the twomost important cases are becak (cycle rickshaw) drivers and street vendors,though these are only examples of a potentially more widespread issue.
5.38 Becak-free zones have been established for a number of years - andwhere this eases serious traffic congestion, it is often justified. Howeverthe DKI Jakarta government recently took the more drastic step of declaringthat all of DKI Jakarta must be becak-free by 1985. This would affect about40,000 becaks, that provide employment, through day and night shifts, for atleast 60,000 drivers. Most are seasonal migrants who rent becaks from smallscale urban entrepreneurs, and so rural households will bear the brunt of theincome and employment loss./l Alternatives proposed by the DKI govervwent -joining the transmifration program, vocational training, rural works programs- are either less .. ttractive to drivers or would involve reduced opportunitiesfor other job seekers. The costs could be significant and, since becaks arealready excluded from all arterial roads, it is not clear that there would bemajor benefits in faster traffic flow.
5.39 Similar issues apply to street vendors, who form the largest informalsector group in Jakarta.l2 The DII government banned operations of vendorsand hawkers from 142 'protocol' roads as early as 1972, and has selectivelyexpanded the restricted areas since then, with varying degrees of success.Displaced traders are sometimes offered an alternative locale in new shoppingcomplexes, but have in practice often been precluded from these by highcosts./3 As with becak drivers, these restrictive regulations can lead both
/1 See Nurul Fazrie, Sekitar Penghapusan Becak DKI Modernisasi MerenggutKesempatan Operasi Mereka in Beca-Beca Coba Bawa Saya, Lembaga StudiPembangunan, Jakarta 1984.
/2 See Hazel Moir, The Jakarta Informal Sector, IEKNAS, 1977.
/3 In one case monthly pre-payments of Rp 100-250,000 were required duringthe construction phase. See Kompas, February 2, 1982.

- 124 -
to a direct loss of income and employment, and indirect costs through the lossof a highly efficient service for low income consumers.
5.40 Policy in support of the informal sector can take two forms. Firstthere is a strong case against an excessively restrictive policy. Indeed amore supportive environment has been characteristic of other cities, notablyin East and Central Java. Any disruption to the modern sector economy islikely to be greatly outweighed by the employment and income benefits, and thegains from the efficient provision of goods and services by the informalsector, especially since a high proportion involve single circular migrantswith relatively small demands on urban resources. In the longer term, thiscan be complemented by a more active urban planning policy, for example in thelayout of roads, pavements and markets, that provides adequate space for theseactivities. A good example of effective urban planning in this area is JalanMalioboro in Yogyakar a.
5.41 With favorable policies on rural development, manufacturing and theinformal sector, a serious deterioration in the urban employment situationappears avoidable. A combination of reasonable prospects at the lower end ofthe market and little or no widening of wage differentials are important tofacilitate the required adjustment in expectations of the better educated partof the labor force. Some rise in the overall urban unemployment rate couldoccur, especially in the next few years, but this would be relatively moderate(say to the 8-10% range at most). This scenario is also consistent with agradual growth in incomes of low income urban households.
5.42 Under unfavorable policy there is a high risk of an exacerbation ofthe problem. Less successful rural development could increase rural-urbanmigration, and this effect could have the most severe consequences for thelandless on Java and unsuccessful transmigrant households. If relatively goodinformal sector opportunities are restricted, these people would be forcedinto increasingly low return urban activities, depressing wages at the bottomof the wage sector (e.g. in small scale enterprises or domestic service) andreducing incomes in those parts of the informal sector still open to newentrants. A slgnificant proportion of the population in the low paid part ofthe services sector could suffer stagnant or declining incomes. A morecapital intensive pattern of manufacturing growth would be associated withboth low growth in wage employment and, if the past pattern of wagedetermination continues, higher wage rates at the top of the market. Thiscombination of effects would widen the differential between good formal sectorjobs and alternative employment opportunities. In addition to worse prospectsfor poor urban households, a substantial rise in open unemployment (say toabove 10%), would then be a distinct possibility. The two most vulnerableareas under this scenario would be Jakarta, where the open uaemployme-at rateis already relatively high (and which would be hard hit by slower civilservice growth) and certain areas in the Outer Islands, notably Kalimantan andIrian Java, where there is the potential for sharp increases in the alreadyhigh rates of urban growth if rural development is weak. Although a majorityof poor households would continue to live in rural areas under this scenario,the social costs of a deterioration in the urban labor market could be severe.

- 125 - Appendix 1Page 1
PAST PATTERNS OF EMPLOYMENT AND INCODME CHANGE
1. The analysis and policy conclusions in Part II of the report are, toa large extent, based upon a more detailed analysis of past developments inemployment in Indonesia. Some of this is covered by the previous World Bankreport on employment: in particular, much of the conception of the workings ofthe labor market is taken from that report./l However, the bulk of theanalysis of changes in employment, productivity and incomes is based on newprimary sources of data: the 1981 and 1982 national household budget surveys(SUSENAS) conducted by the Central Bureau of Statistics (BPS) and a series ofsurveys of the same households in six villages in West Java between 1976-77and 1983-84, conducted by the Agro Economic Survey in Bogor./2 This Appendixpresents a summary account of past developments from these and other sources.
A. Labor Absorption, Wages and Incomes in Rural Areas
2. Rural areas accounted for 78Z of the population, 81X of the workforceand 85X of households living in poverty in 1980./3 The bulk of rural dwellersare involved in agriculture, but manufacturing and service activities are alsoimportant, often as a secondary source of income and employment. Theprimary7determinant of economic class is access to land, and especiallywetland or sawah in Java. It is estimated that 37X of rural households had nooperational holdings of sawah in Java in 1973./4 Although there is a widerange in returns to labor in rural areas, there appears to be a fairly highdegree of mobility between alternative activities for similar kinds of labor;this appears to better represent the condition of the rural labor market inthe early 1980s than the view of significant segmentation between differentactivities.
3. The analysis focuses on the period from the mid-1970s to the early1980s. At the beginning of the period the outlook was not bright, especiallyin Java. The rural economy had recovered from the drought, rice shortages and
/1 Indonesia - Wages and Employment, World Bank Country Study, 1985. Themajor difference in our analysis from the interpretation of the labor marketin the previous report concerns the relationship between the rice and otherparts of the rural labor market. More recent information, summarized inparas. 8-9 below, suggests that there is less general segmentation of therural labor market than was previously concluded.
/2 The 1983 resurvey was largely funded by the Ford Foundation, with somesupport from the World Bank.
/3 Results of the 1980 Population Census, BPS, and Bhanoji Rao, Poverty inIndonesia, 1970-80, World Bank mimeo, January 1984.
14 See Ben White and Gunawan Wiradi, Pola-pola Penguasaan Tanah DAS Cimanuk:Beberapa Catatan Sementara, Working Paper No. 11, Agro Economic Survey, Bogor,1981.

- 126 - Appendix 1Page 2
escalating prices of 1972-73, but prospects were not good - the new highyielding varieties had proved highly susceptible to the wereng pest and mostvillage based researchers had concluded that poor rural households were notparticipating in the process of economic growth. The following years saw thewithdrawal of the wereng in the face of new resistant varieties, a 60%increase in the rice crop between 1976 and 1983, and a major influx ofgovernment expenditures after the second oil windfall. The rural economy grewand changed rapidly in this period, and in Java, some village levelresearchers were observing significant increases in real agricultural wagesand non-farm employment./l
4. The following presents a summary analysis of this process of change, basedmainly on the new data sources listed in para. 1. The West Java case studiesinvolved a series of surveys of the same households in 1976-77 and again in1983-84. The villages are all predominantly wet rice communities and includeboth lowland and upland cases. They are quite characteristic of Java andprovide invaluable complementary information to the macro statistics, thoughany implications for macro trends from a small sample have, of course, to betreated with caution. No comparable study is available for the Outer Islands,and so the focus here is on Java. This is a good focus, since this is wherethe changes were both more rapid and complex; it is also where the core of thepoverty problem lies.
Changes in Employment
5. Table 1 summarizes the overall changes in rural employment between 1976and 1982 on the basis of the national labor force surveys. On Java thechanges are dramatic. They represent an accentuation of the trends observedbetween the censuses (summarized for all Java in Table 4.2). Agriculturedlearly declines as an employer (though the extent may be partly due tochanges in the definition of urban areas /2). The main new development inthis period is the much larger relative importance of industry andconstruction - increased employment in mining, manufacturing and constructionwas equivalent to almost 90% of the increase in the labor force.
11 See William Collier et. al., "Acceleration of Rural Development in Java',Bulletin of Indonesian Economic Studies, Vol. XVIII, No. 3, 1982.
/2 BPS changed to a (superior) definition of urban areas in 1980 - seeIndonesia - Urban Services Sector Report, World Bank Report No. 4800-IND, June25, 1984. Both an intercensal and inter labor force comparison show asharper decline in agricultural employment in rural areas than in rural andurban areas combined. For some reason urban areas capture a higher proportionof the agricultural labor force with the new definition (3% in 1982, comparedwith 1% in 1976).

- 127 - Appendix IPage 3
Table 1: CHANGES IN RURAL EMPIDYMENT, 1976-82
Java Outer IslandsShare
Annual Compo- Share of Annual Compo- of in-growth sition increment growth sition crement1976-82 in 1982 1976-82 1976-82 in 1982 1976-82(% p.a.) (Z) (M) (% p.a) (%} (Z)
Agriculture -0.8 60 -42 4.8 75 70Manufacturing 5.7 11 45 7.1 7 9Construction 18.7 4 35 24.9 2 6Trade 1.6 14 18 2.7 7 4Transport 5.3 2 9 5.9 2 2Other services 4.2 9 28 6.1 7 7Miscellaneous /a 17.7 1 8 /b 27.3 1 2
Total 1.2 100 100 5.3 100 100
/a Mining, electricity, water and gas and finance.7-b Predominantly in mining.
Source: SAKFRNAS 1976 and SUSENAS 1982.
6. The results from the West Java villages are broadly consistent withthe national survey results, but the more detailed information suggests, insome areas, a different interpretation of macro trends. A summary is given inTable 2. This portrays a picture of economic diversification, and risingimportance of non-farm activities, especially in construction and transportlabor. The main additional conclusions are as follows. First, mostIndividual households were economically diversified in 1976, and became moreso by 1983./1 The vast majority of households (about 95% in both years)devoted some time to on-farm work, but a high and rising proportion (62% in1976, 70% in 1983) also spent time on non-agricultural activities. Second,total agricultural employment in these villages, in term of hours worked perhousehold, actually increased, by 2.5% p.a., over the seven year period. Muchof this was associated with agricultural diversification into non-rice crops,fishponds and livestock. However, this increase was largely picked up byexisting farming households and coexisted with a decline in agricultural wagelabor. An increase in total employment time in agriculture can be quiteconsistent with a decrease in the number of people declaring agriculture astheir primary occupatien, as shown in the macro data; therefore it would bewrong to infer from the latter that agriculture as a whole is of declining
/1 The phenomenon of households being involved in a -multiplicity' ofoccupations was already observed in the early 197 0 s. See Ben White,"Population, Involution and Bnployment in Rural Java-, Development and Change,1976. In the national censuses and labor force surveys the sector of employ-ment of an individual refers to the primary activity in the previous week.

- 128 - Appendix IPage4
significance. Third, there is a sharp reduction in hours worked in householdindustry. This is also consistent with the macro data, since most householdIndustry in the sample is a secondary and low return activity. The reductionof labor use here was actually a reflection of better alternative activities.The main industry in this sample is string weaving from bamboo in Malausma;this activity absorbed a very large amount of time for very low returns in1976. Manufacturing activities with a higher return (and so more likely to bea primary source of employment) increased their relative importance between1976 and 1983.
Table 2: COMPOSITION OF EMPLOYMENT BY HOURS WORKED,WEST JAVA VILLAGES, 1976 AND 1983
Average hours per household per annum
S-ccLoral share Change1976 1983 1976-83CX) (Z) (Z p.a.)
Agriculture 52 54 2.5On-farm (28) (35) (5.4)Farm labor (24) (19) (-1.5)
Non-agriculture 48 46 1.7Manufacturing (21) (12) (-4.5)Trade (13) (13) (1.8)Non-agricultural labor /a (14) (21) (9.5)
Total 100 100 2.3
MemoAverage number of hours 1,909 2,216
/a Mainly construction and transport.
Source: Rural Labor Market Surveys, West Ja-va, 1977 and 1984.
7. In the Outer Islands, growth in non-farm employment was even morerapid than in Java, with a very similar pattern of growth rates - construction,manufacturing and mining were again particularly buoyant. But initialemployment levels were much lower, and these increases were swamped by a rapidgrowth in agricultural employment. This is related to another significantdifference: the employed in rural Java work much longer hours than in theOuter Islands, an average of 45 hours per week in 1976 compared with 29 hoursin the Outer Islands. This is partly a function of higher croppingintensities on Java (so less extreme seasonality of agricultural labordemand), but it is also consistent with less developed activities in thesecondary and tertiary sectors, even as a supplementary source of employment.

- 129 - Appendix 1Page 5
Table 3: WAGES IN AGRICULTURAL AND NON-AGRICULTURAL ACTIVITIES,CIMANUK REGION, WEST JAVA, 1977-1983 /a
Hoeing Planting Unskilled Skilled(male) (female) construction construction
(male) (male)
Hours worked per day 6-8 4-5 8-10 8-10
Daily wage (Rp)1977 229 115 369 6961980 411 220 709 1,2541983 665 370 1,196 2,138
Daily wage index (hoeing - 100)1977 100 50 161 3041980 100 45 173 3051983 100 56 170 322
Average increase, 1977-83 (Z p.a)Money wages 15.2 16.7 16.8 16.0Real wages:Killed rice 5.3 6.6 6.5 5.8deflator /bCost of living 1.8 2.8 2.7 1.9index deflator /c
/a All data based *,n monthly observations.7n Milled rice price in each village.7c Cost of nine basic commodities in each village weighted by the shares in
total rural consumption from SUSENAS 1980.
Source: Agro Economic Survey, Village Data, 1977-1983.
Wages and Returns to Household Labor
8. Previous work on agricultural wages in Java found no trend in realrice wages during the 1970s, despite rising agricultural productivity./I Thevillage wage data from 1976 to 1983 suggest a significant change in the late1970s and early 1980s./2 A summary is provided in Table 3. The data suggest
/1 See Indonesia - Wages and Employment, op. cit., Chapter 3.
/2 The source of information is the reported market wage (adjusted forin-kind payments) in the survey villages. The results are based on a detailedanalysis in Dipak Mazundar and M. Husein Sawit, Trends in Rural Wages 1977-83:A Study of the Villages of West Java, draft, January 1985.

- 130 - Appendix 1Page 6
three conclusions. First, real wages of both agricultural and non-agriculturallabor increased over the period. The bulk of this increase was concentratedin the 1980-81 period, in which a sharp increase in rice production coincidedwith a major expansion in public expenditure. Second, non-agricultural wagesare above agricultural wages (even after allowing for longer hours of work),with a slight widening of differentials over the period. Third, there can besigaificant fluctuations, including sharp drops, from season to season.
9. The wage labor market is only part of the story. Table 4 presentsthe results on returns to household labor in all activities, including familyenterprises. Both agriculture (family enterprise) and farm labor recordedsmall decline in returns to labor, but this is due to changes in thecomposition of labor. In the case of agriculture it reflects an increasedshare of family labor in total agricultural labor use. Labor productivity inindividual activities increased, as expected from the macro and wage data. Infarm labor, it is due to a relatively large decline in labor time for betterpaid male workers in pre-harvest activities; this is again consistent with theobserved wage increases. Outside agriculture, the rapid rise in returns tolabor is clear and in 1983 earnings per hour for non-agricultural labor were40Z above earnings for farm labor. The very rapid increases in theproductivity of household industry were due to a decllne in hours worked inlow return secondary activities, notably in string weaving in one village.
Table 4: AVERAGE RETURNS TO HOUSEHOLD LABOR IN ALTERNATIVEACTIVITIES, WEST JAVA VILLAGES, 1976 AND 1983
Labor income per hour worked /aLevel Real increase1983 1976-83
CRp/hour) (% p.a.)
Agriculture /b 386 -0.9
Farm labor 173 -0.4
Non-agricultureHousehold industry 78 8.9Trade 354 -0.4Non-agricultural labor 244 2.4
Average 225 3.6
/a This is the average for households participating in the sector in question.7T This is calculated as net household cash returns per hour of family labor
input; the reason it is higher than for farm and non-agricultural labor isbecause of the inclusion of returns to land and management in this figure.
Source: Rural Labor Market Surveys, West Java, 1977 and 1984.

- 131 - Appendix 1Page 7
Changes in Iacomes by Household and Economic Class
10. How were the chamges in production and employment distributed amongsthouseholds? Ihis is central to an assessment of the welfare benefits of thechanges, and in particular to the fundamental objective of reducing ruralpoverty. This issue can be eramined for the six West Java villages. Sincethe same households were involved in both the 1976-77 and 1984 surveys, it ispossible to trace the experiences of Individual households during this periodof rapid econumic change. The general picture is of substantial overallincreases in household income, but very wide inter-household differences.Table 5 presents some results. The average increase in village income percapita mas 33% over the seven year period, but, owing to much higherproportional increases among relatively poor households, the unweightedincrease in household income per capita was llOZ This was associated with asignificant reduction in poverty incidence, from 50% in 1976 to 30% in1983./1 This overal pattern masks major differences between households.About 30X of all households more than doubled their per capita income, while aslightly smaller proportion recorded a decline. There was a high (negative)correlation between initial income and changes in income - poor householdswere disproportionately represented in the group that enjoyed major gains andvice versa. However, the losers were by no means solely iu upper incomegroups, and 9% of the whole sample actually moved into absolute povertybetween 1976 and 1983. Overall, the patterns of upward and downward mobilityappear to have broadly offset each other, since the distribution of income isstable. In both 1976 and 1983 the bottom 40% of households received 14% oftotal income, while the top 20% received 532 In 1976 and 52% in 1983.
U. The large inter-household variation is in part because of the effectof transitory income. Households that are poor in any year are partly sobecause of their long term income and partly because of temporary occurrencessuch as harvest failure, sickness of key earners, windfall gains or losses innon-agricultural pursuito and so on. Whether the explanation lies in changesin transitory or permanent income, the pattern of mobility is, in one respect,reassuriag: it suggests that in this period of rapid growth in agriculturalincomes and labor demand, poverty uas only a temporary phenomenon for manyhouseholds. Not for all, of course: over 20% of all households were poor inboth periods, but even this group experienced a 17% increase in per capitaincome.
/1 This uses the estimated cost in 1983 of 30 kg. of milled rice per capitaas a cutoff income, in line with the criterion used in Bhanoji Rao, 22. cit.

- 132 - Appendix 1Page 8
Table 5: AVERAGE PERt C&PITA IN1C)HE, WEST JAVA VILLAGES, 1976 and 83 /a
Mean per capita income Mean per capita income by groupIlevel in 1976 % change, 1976-1983 Bottom 20%, 1976 Top 20%, 1976(Rp '000) Per house- Per vil (Rp '000) (Rp '000)
hold /b lage /c 1976 1984 1976 1983
lowlandWargabinangun 97 93 11 26 93 242 151Ianjan 121 166 68 40 167 297 300
UplandSukaambit 189 146 6 28 140 612 362Gunungwaagi 131 84 44 47 146 272 306Malausma 83 117 50 29 119 170 127Cwangi 133 59 35 33 72 357 459
Allvillages 125 111 33 30 113 373 327
/a All 1976 income data is expressed in 1983 prices (data adjusted usingindex of nine basic commodities, rural Java).
/b Unweighted mean of percent change for each household.,c Weighted mean calculated from village income totals 1976 and 1983.
Source: Rural Iabor Market Surveys, 1977 and 1984.
12. Analysis of the sources of change in per capita income shows thatchanges in labor and enterprise income were the principal determinants ofoverall changes, though for some households changes in dependency ratios andother income (gifts, remittances, earnings from land) were also important. Toassess how changes In labor income were distributed between different economicclasses, the survey households were divided by size of operational holding ofsawah in the wet season of 1976; those with no holdings were divided accordingto primary source of Income, between farm laborers and non-agriculturalhouseholds. Average incomes are given in Table 6. Farm laborers are thepoorest group, with an income 40% below that of small farmers in 1976; averageincomes of farmers rise substantially with size of holding, whilenon-agricultural households have, on average, comparable incomes to mediumsized farmers. The average change in incomes between 1976 and 1983 is fairlyuniform, though farm laborers, non-agricultural households and medium sizedfarmers did better than either small or large farmers. The large overallvariatiom in the experience of individual households is also true of eacheconomic class: every group had some large gainers and some losers in thisperiod.

- 133 - Appendix 1
Page 9
Table 6: HOUSEHOID INCOME BY ECDNONIC CLASS, WEST JAVA VILLAGES,1976 and 1983/a
Share of Average householdhouseholds income /b Average growthin survey 1976 1983 1976-83
(Z) (Rp '000 p.a.) (X p.a.)
Landless /cFarm laborers 10 224 310 4.7Non-agricultural 5 461 642 4.8
FarmersSmall (less than G.25 ha) 40 402 498 3.1Medium (0.25-0.5 ha) 23 421 610 5.5Iarge (greater than 0.5 ha) 23 710 884 3.1
All households 100 464 602 3.8
/a Excludes 21 extreme values.Tb All 1976 data are in 1983 prices.7c Classified by major source of household Income.
Source: Rural labor Market Surveys, West Java, 1977 and 1984.
13. The above pattern suggests that highly diverse household experiencesoverlay more gradual secular changes, in which general economic developmentsaffected the fortunes of the different economic classes. It is the latterthat is of primary policy concern. Table 7 gives the sources of income changefor the various groups. It shows that the general picture of economicdiversification into non-rice agriculture and non-agricultural activities wasa phenomenon for all classes. Almost 90% of the farm income gains accrued tohouseholds with sawah holdings. Within this group, small farmers didrelatively well; although they accounted for only 20% of total farm income in1976, they secured 40% of the total increase. Inadequate size of holding wasclearly not a constraint to agricultural growth in this period. Farmemployment declined In absolute terms, and this was especially marked amongstthe two groups most dependent on this income source in 1976 - landless farmlaborers and small farmers. As already seen, for small farmers this was morethan compensated by increased agricultural income; farm laborers, on the otherhand, experienced a major shift into non-agricultural wage labor. FinaUyboth medium and large farmers also moved significantly into non-agriculturalwork: for large farmers this represented a continuation of the 1976 pattern,while for medium farmers it marked a major change from the pattern of themid-1970s.

- 134 -Page 10
Table 7: SOURCES OF INCOME CHANGE BY ECONOMIC CLASS, WEST JAVA VILLAGES, 1976-83(in percent)
Landless FarmersFarm Non- All
laborers agricultural Small Medium Large Households
Composition of 1976 incomeFarming 17 6 29 67 66 48Farm laboring 77 11 21 17 7 17Non-agriculture 6 83 50 16 27 35
Total 100 100 100 100 100 100
Composition of incrementalincome 1976-83Farming 57 43 83 42 46 55
Sawah rice (68) (38) (46) (16) (-12) (21)Other sawah/drylaad (-18) (2) (li) (27) (26) (18)Home gardens (1) (2) (10) (-14) (16) (3)Fishponds C-) (1) (5) (3) (5) (4)Livestock (6) (-1) (U) (10) (11) (9)
Farm laboring -69 25 -18 4 6 -7Non-agriculture 114 32 35 56 48 52
Trade (27) (-57) (-8) (38) (-1) (8)Home industry (9) (-9) (-7) (-4) (27) (5)Wage labor (78) (98) (50) (22) (22) (39)
Total 100 100 100 100 100 100
Source: Rural Labor Market Surveys, West Java, 1977 and 1984.
14. The above is a highly sumury account of a complex picture, but itdoes provide additional support for the positive assessment of the process ofdevelopment in rural Java in this period. All of the main economic classesappear to have participated in the process of income growth anddiversification in the survey villages. The overall income distributionremained stable and the extent of poverty was reduced. Amongst poorerhouseholds, agricultural income growth was particularly important to smallfarmers, while improved non-farm opportunities were central to the improvedwelfare of landless farm laborers.
Causes of Changes in Incomes and Employment
15. These beneficial developments in employment and returns to laborappear to be related to two factors: rapid increases in autonomous sources ofincome from agriculture and public expenditures, and mechanisms that channeleda high proportion of the multiplier effects to the benefit of rural households.

- 135 - Appendix IPage 11
16. Agricultural Incomes. The success story on rice is familiar. Outputincreased by two thirds on Java between 1976 and 1983; comparable increaseswere achieved in the Outer Islands. This was due to the continued spread ofnew varieties, the extension of irrigation systems, increased use ofagrochemicals, and favorable policies on output and input pricing./l A highlysubsidized fertlLizer price (the domestic price of urea was estimated to be44Z of the economic price in 1982 /2) has been perceived by the Government tobe central to the maintenance of inTcentives and incomes for farmers in thepast. For Java the net effects of this and other price developments between1976 and 1983 are given in Table 8. The extent of change varies by province,but there is a common pattern of significant terms of trade gains. Lowincreases in fertilizer prices kept the production cost index dowa, butequally important were high price rises in non-rice crops, especially infruits and vegetables. The rice price index is consistently below theconsumer price index in 1983, but the overall index of producer pricesreceived is consistently above it.
Table 8: IRICE INDICES AND TERMS OF fADE FOR JAVANESE FARMERS, 1976-1983
1983 Price Indices, 1976 100West Java Central Java Yogyakarta East Java
Prices ReceivedFood crops 258 344 320 351
Rice (233) (260) (210) (238)Palawija (255) (373) (295) (353)Vegetables (277) (599) (906) (1,010)Fruit (326) (375) (267) (366)
Commercial crops 214 279 354 292
General index 255 335 323 339
Prices PaidHousehold consumption 253 264 265 288Cost of production 205 245 221 285
Intermediate input (152) (170) (161) (184)Factor payments (230) (281) (254) (339)Capital formation (203) (250) (269) (253)
General Index 238 259 256 287
Terms of Trade 107 130 126 118
Source: Indikator Ekonomi, BPS, September 1984.
/1 See World Bank, Indonesia - Policy Options and Strategies for Major FoodCrops, Report No. 3686b-IND, April 4, 1983.
/2 Ibid, p. 57.

- 136 - Appendix 1Page 12
17. The effect on farm incomes of this favorable production and pricesituation is clearly seen in the village data. Some further results are givenin Table 9. Rice income increased significantly in this period and stillaccounted for over 60% of total farm income, but the more striking results arethe sharp increases in income from non-rice crops, fisheries and livestock(mainly poultry). Agricultural diversification was already an importantsource of agricultural income growth in this period.
Table 9: LABOR INODHE PER HDUSEHOID FROM FARMING, WEST JAVAVILLAGES, 1976 AND 1983
Share of totalfarm income Income growth
1976 1983 1976-83(Z) (Z) (Z p.a.)
Savah rice 68 61 2.5Other sawah/dryland 7 14 14.4Home gardens 17 14 1.6Fishponds 2 3 9.9Livestock 5 8 11.9
All farming 100 100 4.3
Source: Rural Labor Market Survey, West Java, 1977 and 1984.
18. Public Expenditures. This second source of autonomous income growthin rural areas is less easy to analyze, since there is no rural-urbanbreakdown of government spending. However, there is good indirect evidence ofthe buoyancy of rural based spending. A nimber of programs in Indonesia'shighly diversified development budget involve construction activity in ruralareas or smnall towns: irrigation, primary schools, health centers, rural roadsand, to some extent, inter-city roads. One good index of the increases inspending with an influence in rural areas is provided by the INERES programs.Estimated real spending increased by 14% p.a. on average between 1976 and1983, though with a clear levelling off after 1981. This was an importantsource of the increased employment in construction shown in Table 1, and ofthe increased wages for non-agricultural labor shown in Table 3. (Investmentin private housing was probably an additional significant source of risingconstruction work.)
19. Multiplier Effects. Increases in autonomous income can also havesignificant demand-side multiplier effects. To analyze this sytematically, weneed to know how households allocate incremental income. A picture of longterm trends can be obtained from a cross-sectional analysis of thedistribution of household expenditures from the national household expendituresurveys (SUSENAS). The patterns of average and marginal budget allocations in

- 137 -AppendiIPage 13
1981 are given in Table 10 for both rural and urban Java. They show a majorshift ost of food into non-agricultural goods and services for incrementalbudget allocations. In rural areas the preferred sectors for new expendituresare personal and household manufactures (especially vehicles and durables),health and education, and transport. In urban areas housing is also ofiportance.
Table 10: AVERAGE AND MARGINAL BUDGET SHARES,RURAL AND URBAN JAVA, 1981 /a
Average budget Marginal budgetshares (X) shares (%)
Rural Urban Rural Urban
Food 42.3 41.7 22.1 31.4Rice (14.8) (10.7) (2.9) (4.9)Other staples (1.2) (0.5) (-0.1) (0.4)Meat and fish, dairy (6.5) (9.1) (5.7) (10.5)Vegetables (8.6) (6.8) (4.3) (4.4)Fruits, oils, spices, etc. (6.2) (7.8) (5.5) (5.7)Prepared foods (4.1) (5.8) (3.2) (4.5)Other (0.9) (1.0) (0.6) (1.0)
Beverages, tobacco 7.4 5.0 4.3 2.9Housing 5.4 13.5 4.8 16.2nnergy 8.8 5.7 3.5 4.0Health and education 6.0 10.5 10.1 13.3Transport 2.3 5.1 4.3 6.9Clothing, footwears, etc. 8.6 9.1 14.6 10.1Household durables 3.8 3.1 6.8 4.2Vehicles, other durables 7.8 4.5 27.3 7.6Recreation & others 0.5 1.8 1.2 2.2
Total 100.0 100.0 100.0 100.0
/a Obtained from econometric analysis of changes in expenditure for differentincome groups.
Source: Analysis of SUSENAS 1981.
20. These changes in expenditure at the margin created the demandconditions for the expansion in non-farm production and employment. Althoughproduction accounts for Java are unavailable, the differential impact ofincremental as against average expenditure can be illustrated by the use ofthe national Input-Output Tables. This is shown for rural and urban Java inTable 11; it presents the employment effects of the average and marginalcomposition of expenditures given in Table 10. As expected, there is a majorshift toward manufactures of consumer goods, and services, though non-riceagricultural products continue to account for a high fraction of incremental

- 138 - Appendix 1Page 14
expenditure. Total employment creation is less at the margin, as aconsequence of the higher labor productivity of non-agricultural activities,but household expenditure is still strongly biased toward home produced goodsand services.
Table 11: EMPLOYMENT EFFECTS OF AVERAGE AND MARGINAL BUDGETEXEENDITURE, RURAL AND URBAN JAVA, 1981
Expenditures with Expenditures withaverage shares marginal shares
Rural Urban Rural Urban
Total employment effect /a 1.52 1.35 1.22 1.21
Share of Enployment Effects (X)Agriculture 75.0 68.3 50.3 57.1
Rice (19.8) (16.0) (6.2) (8.8)Other good crops (45.3) (43.8) (34.8) (39.5)Cash crops (4.7) (3.6) (3.8) (2.8)Idvestock and others (5.2) (5.4) (5.5) (6.0)
Manufacturing 15.4 14.2 28.7 17.7Consumer goods (14.2) (13.2) (24.9) (16.1)Producer goods (1.2) (1.0) (3.6) (1.6)
Services 9.6 17.5 21.0 25.2Trade (2.5) (2.9) (4.0) (3.4)Transportation (1.6) (3.2) (4.0) (4.9)Public and social services (4.8) (9.7) (11.7) (14.8)Other services (0.7) (1.7) (1.3) (2.3)
Total 100.0 100.0 100.0 100.0
/a Man-years of employment generated by expenditure of one mlllion rupiah.
Source: World Bank staff estimates, based on SUSENAS 1981 and theInput-Output Tables, 1980, BPS.
21. The above analysis assumes that production will increase in responseto increased demand. The evidence on rapid production and employmentincreases in Java provides support for this. Not all of this occurred withinrural areas. In particular, the increased consumption of manufacturescharacteristically involves urban produced goods. Rural households were stillmajor beneficiaries of this increased production and employment, both throughactual increases in rural value added (notably via trade and transport marginsassociated with the consumption of manufactures) and through temporarymigration to urban areas. Rural-urban linkages became much stronger during

- 139 - Appendix 1Page 15
this period, in terms of flows of both goods and people. This was facilitatedby the 'transport revolution" - the vast expansion in transport servicesthroughout Java since the early 1970s. A precondition for this was the majorimprovement in roads, through increased public expenditures in the transportsector. Equally important is the unusually high population density in Java,that greatly reduces transport times between villages and urban centers.These results are, of course, based upon limited statistics, but they doprovide some important quantitative backing for the view taken in the mainbody of the report on the process of rural production growth and itsemployment effects.
B. Iabor Absorption, Wages and Incomes in Urban Areas
22. The employment situation in urban areas is quite different from thatin rural areas. The urban labor force is currently a small fraction of thetotal labor force (19% in 1980), but it is growing rapidly. It also has amuch higher rate of unemployment. The structure of employment is dominated bythe service sectors, with a subsidiary but important role for the manufacturingsector. Most sectors involve both "modern" activities, with regular salaryanad wage employment, and large numbers of self-employed workers or very smallscale enLerprises, of'-n termed the "informal' sector. Household incomes arecharacteristically higheL than in rural areas.
23. The framework for the analysis of the urban labor market follows thatof the previous World Bank report on employment./l There is a wide range ofproduction and service activities in urban areas, from small scale,self-employed ventures to large scale modern firms. Within this theformal/informal sector division is a useful abstraction. The dividlng line isblurred, but roughly half of total urban employment is in each sector. Ehtryto the informal sector is relatively easy and it has quite close links withthe rural labor market via circular migration. As a consequence, thedetermination of returns to labor is quite competitive. Ehtry into formalsector employment is not free: wages for unskilled labor rise significantlywith the size of firm and there is queueing for good jobs in public andprivate sector employment. Although government intervention Is much moreextensive than either in rural areas or for informal sector activities, thesedo not appear to be the source of relatively high wages in large formal sectorfirms. The primary reason is rather that firms are prepared to pay for theadvantages of a stable and known work force, with some acquired skills.
Current Patterns of labor Absorption
24. Between 1971 and 1980 the population of urban areas increased atabout 4% p.a., with roughly half of the Increase coming from natural growth ofthe 1971 population, and half from rural-urban migration./2 There was a widevariation by island, with Kalimantan and Sumatra growing much faster than
/1 See Indonesia - Wages and Employment, 2p. cit.
/2 See Indonesia - Urban Services Sector Report, op. clt., Chapter 1.

- 140 - Apendix IPage 16
Java, as a consequenace of higher apparent rural-urban migration rates./l Onthe other hand there is considerable micro evidence of high and increasinglevels of temporary migration in Java during this period, that explain itsrelatively low pace of urbanization.
25. The past experience in absorbing this rapid expansion in the laborforce into employment has been good. The buoyant growth in public expenditureand the rapid modernization of the economy (in particular with respect to thelarge increase in the flow of manufactured goods) had a particularlybeneficial effect on the demand for labor in urban areas. Overall openunemployment rates have remained low and stable at about 6% of the urban laborforce (there was actually a small decline in the rate between 1976 and 1982).Table 12 shows the change in the sectoral distribution of non-agricultural
Table 12: THE DIST RIBUTION OF NON-AGRICtJLTURAL EMPLOYMENT IN URBAN AREAS,1976-82 /a
Composition, 1982 Share of increment, 1976-82Java Outer Indonesia Java Outer Indonesia
Islands Islands- z -_ _ _ _ _ _ _ _ _~~~~~_ _ _- _ __ _ _ _ _
Manufacturing 18 l1 16 22 9 20Construction 6 9 7 7 22 9Trade 32 34 32 32 27 32Transport 8 9 9 6 8 7Other services 34 35 34 32 29 31Miscellaneous /b 2 2 2 ' 3 2
Total 100 100 100 100 100 100
/a In 1982, agriculture accounted for 6% of employment in Java, and 10% inthe Outer Islands. It has been excluded because the change in urbandefinition between 1976 and 1982 apparently changed the coverage ofagricultural activities, and so distorts the pattern of incrementalemployment.
/b Mining, electricity, gas and water, and finance.
Source: SARERNAS, 1976 and SUSENAS, 1982.
!i Since the 1980 Population Census only recorded Inter-provincial movementsof migrants and the rural/urban character of the present, and not the previousresidence, there are no firm estimates of rural-urban migration rates forIndonesia.

- 141 - Appendix 1Page 17
employment between 1976 and 1982. In contrast to rural areas, the employmentstructure is quite stable: manufacturing is relatively more important in Java,while employment in the urban construction sector was very buoyant in theOuter Islands in this period, but other differences and changes are verysmall. The service sectors accounted for around three quarters of bothaverage and incremental employment.
26. The formal/informal division of the urban labor force cuts acrossproduction sectors. This division is actually an abstraction from a continuumof patterns of enterprise organization, but it is useful in analyzing thelabor market. The employment structure -n 1980 is shown in Appendix 3,Table 3, using employers and employees as a proxy for formal sectoremployment. On this basis, 60% of total employment is in the formal sector,but with some small scale enterprises being closer to informal sectoractivities and the inclusion of temporary migrants, the proportion would dropto about half. Other services (that includes most civil service employment,health, education and domestic service) accounted for almost half of formalsector employment, while trade accounted for almost half in the informalsector. Women play a relatively large role in informal trade, householdIndustry and other services, and form a significant part of the work force inall sectors apart from construction and transport.
27. Educational attainment makes a difference to the sector ofemployment. For the production sectors these differences are not large,though workers with some education are more likely to be working in otherservices (including the civil service). Services accounted for 43% of totalemployment of those with secondary education in 1982, compared with 34% forthe whole work force. The differences are more marked with respect to theformal/informal sector distinction. As Table 13 shows, 80% or more uppersecondary and tertiary graduates are in the formal sector (wage earners, plusa few employers). It is slightly higher for vocational than generalschooling, but with little difference between the sexes. This is an importantfeature of the labor market. It suggests that the availability of wageemployment will be central to the prospects of the large number of newentrants to the labor force with secondary and tertiary education.
28. The civil service plays a special role in the formal sector. It hastraditionally been the aspiration of the higher classes, and now of theeducated, in Indonesia. A 1980 survey of students in general upper secondaryschools found that almost half hoped or expected to become civil servants, ascompared to less than a tenth with their eyes on the private sector; and ifthose looking to the army or teaching are also included, the share of studentsaspiring to public sector employment rises to over two thirds./l
/1 See Waskito Tjiptosasmito and William Cummings, The Status of Deploymentof Teachers in Indonesia, mimeo, August 28, 1981.

- 142 - Appendix 1Page 18
Table 13: THE PROPORTION OF URBAN WORKERS IN THE FORMAL SEC70R,BY EDUCATIONAL ATTAINMENT, 1980 and 1982 /a
1980 1982Educational Attainment Male Female Total Male & Female
Up to primary 50 40 47 48Lower secondary
General 67 55 65 63Vocational 74 56 71 72
Upper secondaryGeneral 80 79 80 79Vocational 87 90 87 88
Tertiary 92 91 92 94
All workers 60 48 57 59
/a This is the ratio of the number of employers and employees to totalemployment.
Source: Results of the 1980 Population Census, Series S, No. 2, andSUSENAS 1982, BPS.
29. Table 14 presents some summary statistics on levels of civil serviceemployment. There are currently almost three million public employees inIndonesia, about a quarter of whom are women./l After very rapid growth inthe first half of the 1970s, growth slowed in the second half (to about thelevel of the total labor force growth) but then rose significantly in theearly 1980s. Only about 40% of public employees work in central governmentoffices, but many employees in local governmqnt are either seconded from orfinanced by the center; central government spending has fueled much of therecent expansion in employment. The share of total employment is low - only4% for all Indonesia - but the expectations of students clearly have somebasis in reality: of those in employment, a third of upper secondary schoolgraduates and a half of the graduates of tertiary educational institutions hadgovernment jobs in 1980. For women the proportions are even higher. Finally,apart from some concentration of employment in Jakarta, where 12% of theworkforce is in government employment, there is a fairly wide dispersion ofemployment throughout the country; overall, the share of the civil service inaggregate employment is somewhat higher in the Outer Islands than in Java(excluding Jakarta).
/1 Roughly half of these employees are either teachers or health workers.

- 143 - Appendix 1Page 19
Table 14: OVERVIEW OF CIVIL SERVICE EMPIDYMENT, 1969-84
Share of civilNo. of service in
civil service aggregateEducational employees, Rate of growth employmentAttainment March 1984 1980/81
('000) 1969-75 1875-81 1981-84 Male Female Total___- Z p.a. -----
Up to primary 605 n.a. -3 4 2 0 1lower secondary 386 n.a. -1 3 13 18 14Upper secondary 1,479 n.a. 10 16 29 46 33Tertiary 277 n.a. 9 11 48 54 49
Total /a 2,784 22 3 11 5 3 4
/a Includes those for whom educational status was unknown.
Source: BAKN/BPS for civil service employment, Results of the 1980Population Census, BPS for aggregate employment.
Wages, Incomes and Poverty in Urban Areas
30. Wages and incomes in urban Indonesia are characteristically aboverural levels, as in most developing countries. The household budget surveysindicate an overall average per capita income differential of about 70% inJava and 40% in Sumatra in 1981 J1, but this masks an enormous diversity inincome levels, especially in urban areas. Very little of this variation isdue to the sector of primary activity, at least for the major sectors ofmanufacturing, construction, trade, transport and other services /2, but cleardifferentials are apparent by occupational status. Table 15 indicates thatfor the professional classes, incomes in Java are higher than in Sumatra,while for production and service workers they are lower. This is aconsequence of Indonesia's relatively unusual spatial structure: Java is thecenter of Government and has been the recipient of much of the oil income andmodern sector investment, but lower rural incomes has to some extent kept downthe wages of urban unskilled workers.
/1 See Appendix 3, Table 5.
/2 Ibid.

- 144 - Appendix 1
Table 15: AVERAGE HOUSEHOLD INCOME BY OXCUPATIONAL STATUSDN URBAN INDONESIA, 1981
(Rp. per capita per month)
Java Sumatra
Professional 26,200 24,200Administrative 64,200 35,400Clerical 24,200 21,200Sales 17,600 23,600of which street vendors 16,900 n.a.
Service workers J.3,900 15,900Farmers 10,900 12,900Production workers 15,100 17,400
Average /a 16,400 18,500
/a This differs from the average reported in Appendix 3,Table 5, owing to slightly different samples.
Source: SUSENAS 1981.
31. The existence of a wide range of urban wages makes generalizations ontheir behavior difficult. The one good long term data series, forcoustruction workers, indicates a similar pattern to that observed in ruralJava: no clear trend in wages until the end of the 1970s, and then a risearound 1980-81. Appendix 3, Table 8, presents some detailed data on wage ratesfor unskilled workers in formal sector manufacturing and services. In allsectors and regions real wages increased, in some cases quite substantially,between early 1981 and late 1983 - despite the sharp slowdown in growth in thelatter year. Regional differentials provide a similar picture to incomes.Manufacturing wages in late 1983 were of the order of Rp. 1,000-1,200 per dayin Central Java and Jakarta, compared with Rp. 1,300 a day in South Sumatra,over Rp. 2,000 in North Sumatra and Rp. 2,500 and above in West Kalimantan.These rates apply to only one segment of the market. The characteristicpattern is of a wage ladder within individual subsectors, ranging from smalllocally owned firms up to large scale joint ventures. Research in CentralJava in the mid-1970s found differentials of several times in the cigarette,kretek and weaving industries./l
32. The high wage segment of the formal sector covers both the public andprivate sector. Both are viewed as preferred sources of employment for newentrants to the labor market, especially amongst the educated. As Table 16
/1 See Chris Manning, Wage Differentials and Labor Market Segmentation InIndonesian Manufacturing, Doctoral Thesis, Australian National University,October 1979.

- 145 - Appendix 1Page 21
shows, there are substantial differentials between private aad official publicsector salaries. Differentials within the private seitor are also muchlarger, both for different skill categories and, as noted above, for differentcategories of firms for unskilled labor.
Table 16: INDIC&TORS OF PUBLIC/PRIVATE SALARY DIFFERENTTATS(Rp. per month)
Civil service la Private sector Private to publicLevel 1984/85 1985/86 large companies /b differential,
1984 1984-1985
I 61,000 73,000 67,000 /c 0.9II 107,000 129,000 290,000 7T 2.2III 159,000 191,000 630,000 7T 3.3IV 254,000 305,000 1,330,000 7T 4.4
/a This is the estimated average salary for a civil servant with ten yearsexperience and a wife and three children.
/b This is an estimate of the average salary, including allowances, forexperienced workers in large private companies.
/c Average of rates for semi-skilled workers, from firm visits tomanufacturing firms.
/d Average of rates for file clerks, drivers and clerk-typists.Te7 Average of rates for typists, supply clerks, teletype operators, motor
pool supervisors, account clerks, executive secretaries and referencelibrarians.
,f Rates for an architect, library director and civil engineer.
Source: World Bank staff estimates, based on data from the Ministry ofFinance, firm visits and the American Enbassy in Jakarta.
33. The process of wage determination at the upper end of the privatesector is important to understanding the urban labor market. Skilled manpowershortages are a factor, but do not explain why the whole wage structure isabove the level at the bottom of the market. Previous analysis has concludedthat the explanation lies in the advantages to firms of having a known andreliable workforce with low turnover. To achieve this, firms in effect sharepart of their returns with the workforce./l The resultant wages are alsocharacteristically higher than minimum wag-es. This varies by region and bysector, since minimum wages are currently set by province and for differentsectors. Table 17 gives the regional minimum wages for three provinces. The
/ See Indonesia - Wages and Enployment, 2p. cit.; Chris Manning, 2p. cit.

- 146 - Appendix 1Page 22
general policy is to base the rate on market survey information. Where thisis frequently updated, as in Jakarta, the result is a market-following floorwage for the large scale sector: this provides a useful fuaction in protectingworkers at the lower end of the market without distorting the overall wagestructure./l In provinces where there is no systematic updating, the minimumwage can bear little relation to market conditions. The minimum wage is notcurrently enforced in the small scale sector: this is appropriate, since thisvould have excessively high adm-inistrative costs, and, if successful, couldreduce employment and/or put smaU1 scale firms out of business.
Table 17: MINIMUI WAGES FOR THREE ROVINCES, 1977-84
DKI Jakarta Central Java North SumatraRp/day Index /a CPI /b Rp/day Iadex /a CPI lb Rp/day Index /a CPI lb
n977 435 100 100 175 100 100 431 100 1001980 600 128 150 265 151 162 540 125 1561981 600 138 163 325 186 183 540 12.5 1751982 750 172 177 625 357 203 700 162 1861983 1,050 241 196 625 357 226 700 162 2091984 1,250 287 224 625 357 247 700 162 237
/a 1977 = 100.b Consumer Price Index for Jakarta, Semarang and Medan, respectively.
Sources: Statistical Pocketbook Indonesia, BPS, 1983, Buletin Ringkas, BPS,December 1984, Department of Manpower, Pelaksanaan, lebij!aksaaaanPemerintah Menzenai Penetapan Upah Minimu di Seluruh Indonesia,Jakarta (1982, 1984).
34. The Government directly sets the wages and benefits for workers ingovernment employment. In the draft 1985/86 budget, it was announced that thesalaries of civil servants were to be raised so as to improve their net(after-tax) income by 20X, with higher increases for teachers and healthworkers. Some context for the recent increase is given in Table 18, thatsummarizes changes in official civil service salaries over the past fifteenyears. This includes official supplements, but excludes both the riceallowance and any paymen--s for specific activities. Year to year changes havebeen highly variable - characteristically a substantial increase in one yearhas been gradually eroded, in real terms, in the ensuing years. The majorincrease of the past decade occurred in 1977/78, and subsequently real
/1 It is possib e that rises in the floor wage can push up the wholestructure, but there is no evidence of this in Indonesia.

- 147 - Appendix 1Page 23
salaries have peaked in 1981/82 and now in 1985/86. The overall increasesince 1977/78 has been quite moderate, and, as seen in Table 16, differentialswith the private sector remain large for higher grades. The issue of civilservice compensati_i is Mpl- bt to zo.e extent, these differentials arecompensated by the security and prospect of specific payments for studies,etc. in the civil service.
Table 18: GROWTH IN AVERAGE SALARIES OF CIVIL SERVANTS, 1969-85
Average real increase la
Level 1969-76 1976-77 1977-81 1981-85Z p.a.
I 16.1 98.4 4.7 4.3II 11.4 66.2 2.0 1.6
III 11.5 42.9 -0.2 1.6IV 11.4 66.4 -1.0 1.6
Average 12.0 66.0 2.0 2.6
/a The nominal salaries were deflated by the Indonesia Consumer Price Indexafter 1977/78, and the Jakarta Cost of Living Index prior to 1977/78. Allyears are fiscal years, i.e. 1985 is FY1985/86.
Source: World Bank staff estimates, based on information provided by theMinistry of Finance.
35. Incomes within the informal sector also sary greatly. Members ofthis sector can be broadly divided into three categories. The highest incomegroup are small scale entrepreneurs, often working by themselves or withfamily members. The best example is established street vendors, for whommicro stuaies indicate average earnings of Rp. 4,000-5,000 per day in Java,with some earning substantially more. Second, there are individuals who areessentially tmskilled workers, with earnings comparable to or higher thanwages at the lower end of the urban wage ladder. Becak drivers and refusecollectors are good examples, with inoDmes in Java of the order ofRp. 1,000-3,000 per day. The third group are iuvolved in lower returnactivities, and include people such as kulis (market porters) or cigarettescavengers, with daily incomes of the order of Pp. 1,000 or less. These areall average incomes and an important characterimtic of informal sector work isa high variability in incomes from day to day and, in some cases, betweenseasons.

- 148 - Appendix 1Page 24
36. Higher incomes and wages also lead to much lower poverty incidence inurban than rural areas. It bas been estimated that in urban Java 30% ofhouseholds had an expenditure level below an estimated subsistence requirementin 1980, compared with over 50% in rural Java, and 20% in urban Sumatra./lFurthermore, rising incomes led to a significant reduction In incidence overthe course of the 1970s. But urban poverty does exist and could become a moreserious problem with slower growth. Poverty occurs in al the majorproduction sectors, and, for Java at least, households in poverty are roughlyequally divided between those dependent on wage and informal sector employment.
Unemployment
37. In this section the structure of unemployment and the pattern ofchange between 19:6 and 1982 is examined. This is an interesting period forthe unemployment situation, since high formal sector growth coincided with thebeginning of a large influx of secondary school leaders into the urban laborforce. Overall urban unemployment rates are not high by developing countrystandards, but unemployment is becoming increasingly concentrated amongst theyoung and the secondary educated. As there appears to be reasonably freeentry into informal sector activities, unemployment is predominantlyassociated with the formal sector: it reflects an imbalance between the supplyof and demand for formal sector jobs. It is thus very much a function of thelabor market structure outlined in the introduction to this appendix. Theexistence of Limited numbers of preferred jobs, whether due to high wagedifferentials within the private sector or the other attractions of publicsector employment, provides incentives for waiting.
38. The statistics suggest the unemployed are largely new entrants to thelabor force looking for their first job C70% of unemployed males and over 80%.of unemployed females in 1982) and are often single. Workers with dependentscan rarely afford to be unemployed. There is also a heavy concentrationamongst the educated and the young. Table 19 presents data on unemploymentrates and the composition of unemployment by completed level of schooling for1976 and 1982. Unemployment rates in both periods, standardized for varyingage structures among schooling groups, rise with educational level, reaching apeak ameng upper secondary school leavers. Graduates of general (academic)secondary schools experience slightly higner rates than vocational graduates,especially at the upper secondary level. Overall unemployment rates arefairly stable over this period. There are, however, two less positivetrends. First, unemployment rates of females increased for all categoriesexcept lower secondary academic school graduates. The data, consistent with1971-80 census trends, suggests that recent increases in urban female laborforce participation rates since 1971 have been matched by increasingdifficulty for women to fiad jobs./2 The proportion of females among allunemployed increased from 23% to 36% over the period, with the absolute numberof recorded female unemployed more than doubling in the six year period.
/1 See Bhanoji Rao, op. cit. Preliminary analysis of SUSENAS 1981 suggests asomewhat lower poverty incidence, see Appendix 3, Table 6.
/2 The unstandardized rates by educational category indicate this trend moreclearly and suggest younger, educated females are especially finding it harderto obtain employment in recent years.

- 149 - Appendix 1Page 25
Second, the absolute numbers looking for work has become increasinglydominated by upper secondary leavers, contributing in 1982 over 40% of allurban unemployed in 1982. For males the proportion of unemployed in 1976 didnot differ substantially from the proportioa of the labor force In eachschooling category, but by 1982 those with primary education or less,accounting for 60% of the labor force, amounted to only 41% of all unemployed(see Appendix 3, Table U).
Table 19: OPEN UNEMPLOYKENT IN URBAN DNDONESIA BY EDUCATIONAL ATTAINMENT,1976 AND 1982
(in percent)
Completed Male Female Both sexeseducation 1976 1982 1976 1982 1976 1982
Age-standardized open unemployment rates
Below primary 5.0 3.3 2.1 2.6 3.9 3.3Primary 6.2 4.2 3.6 4.8 5.8 4.4lower secondary
General 7.8 6.0 10.1 7.7 8.3 6.6Vocational 7.7 9.5 6.2 6.3 7.4 7.6
Upper secondaryGeneral 11.8 11.4 16.6 17.3 12.9 13.1Vocatioaal 10.8 9.5 13.2 13.5 10.8 11.0
Tertiary 8.0 8.3 6.3 7.5 7.4 7.9
All levels 6.9 5.6 4.9 6.5 6.4 6.0
Distribution of the unemployed
Below primary 24.9 16.2 19.0 16.7 23.5 16.4Primary 33.0 24.7 22.5 19.9 30.6 23.0Iower secondaryGeneral 14.1 13.4 18.5 11.4 15.1 12.7Vocational 4.1 4.0 2.5 2.1 3.7 3.3
Upper secondaryGeneral 12.7 21.6 16.7 22.4 13.6 21.9Vocational 9.6 17.3 17.8 23.3 11.5 19.5
Tertiary 1.6 2.8 3.0 4.2 1.9 3.3
Total 100.0 100.0 100.0 100.0 100.0 100.0
Memo itemUnemployment level
('000s) 359 422 109 238 467 660
Source: SAKERNAS 1976 and SUSENAS 1982 (special tables prepared by BPS).

- 150 - Appendix 1Page 26
39. Unemployment rates by age and education are given In Appendix 3,Table 12. About 40% of the total unumployed fall in the 20-24 age group, withvery high unemployment rates, of 30-40%, amongst male and female graduates ofgeneral upper secondary schools and female graduates of vocational schools.The specific changes between 1976 and 1982 follow the broad pattern describedabove: umemployment rates undergo a moderate decline for most categories ofmales and a moderate rise for most females in the 15-19 aad 20-24 age groups.However, there are two important exceptions: first there was a sigaificantrise in the unemployment rate for both male and female graduates of generalupper secondary schools in the 20-24 age group, from 32-33% in 1976 to 37-38%in 1982; and, second, there is a general rise in the rate for those withtertiary education in the 25-29 age group, and a dramatic increase, from 14%to 31%, for females. Finally, while the primary focus is on educatedunemployment, the data also shows high unemployment rates (10% and above)amongst the less educated (primary and below) in the 15-19 and 20-24 agegroups, five to ten years after most of these young people left school.
40. Overall, a detailed review of unemployment presents a less sanguinepicture than the low aggregate unemployment rate indicates. The generalpattern is of peaks in unemployment amongst young school leavers followed bymajor declines in the 25-29 and 30+ age ranges. The stability of this patternbetween 1976 and 1982 suggests a slow process of absorption of new labor forceentrants into work. A tracer study of secondary school leavers in the late1970s concluded that long working periods paid off in terms of better paidjobs./l However, the rise in unemployment rates amongst key groups (andespecialy amongst females) suggests that the queue for preferred jobs isgetting longer, and is now also affecting tertiary graduates.
41. There is some regional variation in unemployment, summarized inAppendix 3, Tables 13-14. the higher rates in Jakarta stand out: no doubt aconsequence of higher migration, especially of the better educated, to thecapdtal city and more attractive formal sector job opportunities in the publicand private sectors. Unemployment rates are somewhat lower for the rest ofurban Java, and fall in between the two in urban areas in the Outer Islands.However, the structure of unemployment is quite uniform throughout Indonesia,and inter-regional differences are much less marked than between age andeducation categories.
42. Labor Exchmnges and the Registered Unemployed. The Governmentreactivated the labor exchanges in 1983 and official data suggest that a largenumber of the unemployed have been registerinh, since then. Between 26,000(March 1983) and 107,000 (September 1984), with a mean of 46,000, registeredeach month throughout the country between January 1983 and September 1984./2The number of unemployed registered with the Department of ML-npower has rangedfrom 300,000-400,000 per month over the same 21 month period, equivalent, on
/1 See David Clark, How Secondary School Graduates Perform in the laborMarket: A Study of Indonesia, World Bank Staff Working Paper No. 615, 1983.
/2 The large month to month variations are closely related to the number ofschool leavers entering the labor market, peaking in August and September eachyear.

- 151 - Appendix 1Page 27
average, to over half the total of 660,000 unemployed recorded by SUSENAS 1982.Table 20 gives figures on the composition. This shows the disproportionately highshare of upper secondary school leavers - the group experiencing the highestunemployment rates. New vacancies registered each month were about 10,000 for theperiod January 1983 to September 1984, and official figures record that animpressive average of 40% were filled each month, declining to slightly below 30%in the later months of 1984. Just for this 21 month period 144,000 new jobs werereportedly found in labor exchanges in Indonesia, a figure which comparesfavorably, for e-ample, with an approximate increase in urban wage workers outsideagriculture of about 100,000 per annum in the 1970s (or even of all wage workersoutside agriculture of approximately 275,000 a year)./I However, there is a largeimbalance between the numbers of registered unemployed and vacancies, and the ratioof placements to registered unemployed is low - never above 4% per month anddeclining in 1984 to below 2%.
Table 20: JOB S EERS AND JOB PLACEMENTS RE0DRDED BY THE LABOR EXCHANGES,INDONESIA, DECEMBER 1983 AND SEPTEMBER 1984.
December 1983 September 1984New job Stock at New job Place- Stock at
Level of seekers Placements end of month seekers ments end of monthschooling Male Female Male Female Hale Female (Both sexes)
Primary or less 16 10 32 49 12 4 8 32 UlLower secondary 12 6 19 12 15 8 14 14 10Upper secondary 61 70 45 31 68 80 71 49 74
- Academic (26) (30) (18) (19) (30) (37) (41) (23) (38)- Vocational (16) (2) (15) (1) (20) (2) (9) (11) (13)- Economic (10) (19) (8) (9) (11) U28) (12) (9) (12)- Other (9) (19) (4) (2) (7)/a (13)/a (9) (6) (11)
Tertiary 11 14 6 7 5 8 9 5 5
Total 100 100 100 100 100 100 100 100 100
Number ('000) 23 10 3 2 193 53 107 4 538 /b
la An error in the raw date for subgroups of upper secondary education is presumedto be derived from the 'other SNA" category.
/b The large increase in absolute numbers compared with December 1983 is mainly aconsequence of large numbers of school leavers registering in August-September.
Source: Department of Manpower statistics (unpublished) and Department of Manpower,Berita Pasar Xerja, No. 11, March 1984, pp. 57-70.
/1 The calculations are based on the 1971 and 1980 censuses. The data onplacements are likely to be reflected in much lower employment growth, sincemany new employees would replace previous employees.

- 152 - Appendix 2Page 1
POPULATION LND LABOR FORCE PROJECTIONS /1
1. The demographic projections that underlie the analysis of this reportwere rum on spatially d'saggregated projection models in the World Bank. Thisinvolved assumptions in four areas: underlying demographic parameters,especially fertility and death rates; interprovincial migration; the pace ofurbanization; and labor force participation rates by age-sex category. Thedemographic assumptions are close to those used by the Government /2, but theother three areas go beyond existing work and are briefly summarized here.
2. There are two sources for the assumptions on interprovincialmigration. For the underlying trend, the observed pattern between 1971 and1980 was taken, with a slowdown in the 1990s and some modification forspecific provinces (notably Lamputg) where the potential for additionalimmigratiom was known to be limited. The sponsored transmigration programsubsequent to 1980 was treated as being additional to these underlying flows.A number of alternative scenarios were developed to reflect different levelsof the whole program; these are discussed in Chapter 5. For the distributionacross source provinces in the Inner Islands the historical pattern fromtransmigration statistics was taken, while the distribution across destinationprovinces was based upon a very preliminary World Bank assessment of theabsorptive capacity of different regions. The age-sex composition oftransmigrants is based on past experience, and households that migrate areassumed to have the fertility and mortality rates of destination areas. Ineach scenario it was assumed that there would be additional spontaneous flowsfollowing the sponsored movement - this was made a function of the totalprevious transmigrant population (net of estimated backflow).
3. Some uncertainty surrounds the likely future rate of urban growth,both because of our weak understanding of the determinants of rural-urbanmigration in Indonesia and the changed economic situation. As a simplifyingassumption, we took a stable differential between rural and urban growth, butwith a downward adjustment in the historically high differential in Kalimantanand Sulawesi to the level prevailing in Sumatra - otherwise implausibly highrates of urban growth would occur in the former two provinces. Summaryresults for urban and rural population growth under two of the migrationscenarios are given in Table 1. These should be treated as reasonable, butonly indicative, scenarios. As discussed in the text, the realization of therelatively moderate implicit rates of rural-urban migration will, in part,depend on successful rural development.
/1 The demographic projections were conducted by Sulekha Patel (Population,Health and Nutrition)
/2 See Proyeksi Penduduk Indonesia, 1980-2000, BPS.

- 153 - Appendix 2Page 2
Table 1: URBAN AND RURAL POPULATION GR0WrH, 1986-95
Population growth, 1986-95Low Intermediate
Urban share transmigration transmigration1980 1995 Urban Rural Urban Rural- - % Z p.a.
Java-Bali 25 33 2.9 0.8 2.5 0.5
Sumatra 20 27 4.3 2.1 4.7 2.4Kalimantan 21 30 5.0 2.7 6.4 2.4Sulawesi 16 22 4.2 2.0 4.4 2.2Eastern Isles 12 16 4.3 2.6 4.6 2.9
Outer Islands 18 25 4.4 2.2 4.9 2.7
Indonesia 22 30 3.4 1.4 3.3 1.4
Source: World Bank staff estimates and projections.
4. Labor force participation rates were projected by age-sex andurban-rural category for each island. In the past, recorded rates have beensystematically higher for the labor force surveys than for the censuses. Thebaseline rates were obtained by adjusting the 1980 Population Census toreflect the better coverage of the surveys./l Then for the future, a gradualdecline was assumed for the 10-14 and 15-19 age groups, with the spread ofeducation, and for the 64+ group in urban areas. An Increase in urban femalelabor force participation was also assumed on the basis of observed trends inthe 1970s. For all other age-sex categories there is insufficient evidence ofsystematic changes, either within the labor force survey series or between the1971 and 1980 censuses, to warrant the projection of changes in labor forceparticipation rates in the future. A summary of the resultant assumed ratesfor all Indonesia in 1980 and 2000 is given in Table 2. The demographicprojection models did not project aa age-sex composition separately for urbanand rural areas - current data make this a very difficult task. Instead itwas assumed that the urban share of the labor force will move in line with theshare in population. This could slightly underestimate the growth in theurban labor force, if there are further relative shifts in the working agepopulation in favor of urban areas. The resulting patterns of growth in thelabor force for two of the migration scenarios is given In Table 3.
/1 For a description of the methodology, see Zainab Bakir and Chris Manning,Partisipasi Angkatan Kerja, Kesempatan Kerja dan Pengaugguran di Indonesia,Universitas Gadjah Mada, Yogyakarta, 1983.

- 154 - Appendix 2Page 3
Table 2: ESTIMATED ACTUAL AND PROJECTED LABOR FORCE PARTICIPATIONRATES, 1980 AND 2000 /a
(in percent)
Urban male Urban female Rural male Rural femaleAge 1980 2000 1980 2000 1980 2000 1980 2000
10-14 3.3 0.0 4.6 0.0 18.4 9.2 17.5 8.815-19 29.0 14.5 30.2 15.1 56.7 45.4 36.2 28.920-24 75.4 n.c./b 34.7 41.6 92.5 n.e. 42.2 n.c.25-29 93.5 n.c. 32.9 39.5 98.1 n.c. 41.2 n.c.30-34 98.0 n.c. 32.2 38.6 98.8 n.c. 44.6 n.c.35-39 98.4 n.c. 34.1 40.9 98.9 n.ce. 47.3 n.c.40-44 97.7 n.c. 38.7 46.4 98.5 n.e. 50.6 n.c.45-49 93.9 n.c. 38.9 46.7 98.0 n.c. 52.7 n.ec.50-54 86.4 n.c. 37.2 44.6 95.7 .ce. 52.3 n.c.55-59 70.5 n.c. 29.1 34.9 88.3 n.c. 43.9 n.e.W0-64 59.9 n.ec. 23.8 28.6 80.5 n.e. 35.0 u.c.65+ 37.2 18.6 13.2 6.6 56.8 n.c. 20.4 n.c.
Total /c 62.5 59.0 28.0 28.6 74.4 71.1 38.4 36.0
/a This presents the aggregate results and assumptioas; the labor forceprojection was actually developed for the five major island groups.
lb n.c. - no change from the 1980 estimated rate.,' As a proportion of the population aged ten and over. The 2000 averages
given are for the 1980 age-sex structure, to isolate the effects ofassumed changes in the labor force participation rates.
Source: World Bank staff estimates and projections based upon the Results ofthe 1980 Population Census, BPS.
5. As noted in the text, the Government's projection has an overall rateof growth of the labor force of 2.8% p.a. in the 1986-95 period./l Theunderlying projection involves the extrapolation of age-sex labor forceparticipation rates on the basis of fitted trend lines from the censuses andsurveys between the 1961 Population Census and SUSENAS 1981. In our view thisis somewhat biased upwards, especially for females, in part as a consequenceof different labor force concepts between the censuses and surveys, and anunusually high result for 1981. While some uncertainty surrounds future labor
/1 See Proyeksi Angkatan Keria Indonesia, 1983-2001, BPS.

- 155 - Appendix 2Page 4
force participation rates (that will, amongst other things, depend on futureeconomic growth) we consider the more gradual rise in female labor forceparticipation in the 20-64 age range given in Table 2 to be the more likelyprospect. The initial results of SUSENAS, 1982 also suggest a somewhat moremoderate overall rate of growth of the labor force.
Table 3: GROWTH IN THE URBAN AND RURAL TABOR FORCE, 1986-95
Low transmigration Intermediate transmigrationGrowth Increment Growth Increment
Urban Rural Urban Rural Urban Rural Urban Rural- % p.a. - - '000 - - Z p.a. - -'000
Java-Bali 3.3 1.3 381 432 3.0 1.0 340 327
Sumatra 4.8 2.6 127 313 5.1 3.0 139 360Kalimantan 5.2 3.0 40 94 6.5 4.3 53 144Sulawesi 4.5 2.4 35 90 4.9 2.6 36 99Eastern Isles 4.5 2.9 26 123 4.9 3.2 29 139
Outer Islands 4.8 2.7 228 621 5.2 3.1 258 742
Indonesia 3.7 1.9 608 1.053 3.7 1.9 597 1,068
Source: World Bank staff projections.
6. The final element of importance to the analysis is the educationalcomposition of the labor force. An approximate projection was developed basedon projected school enrollments and estimated labor force participation rates;the results are given in Table 4. In 1990 the labor force will be much bettereducated than in 1980. The proportion of the labor force with secondary ortertiary education doubles, and there are rapid rates of growth in thesecategories - around 10X p.a. These results are for the total labor force, butit is likely that urban areas will account for a high proportion of the growthin the educated labor force, if past patterns are maintained.

- 156 - Appendix 2Page 5
Table 4: THE EDUCATIONAL COMPOSITION OF THE LABOR FORCE, 1971-90
Share ofComposition Growth rates urban areas
1971 1980 1990 1971-80 1980-90 1980-- % - - p.a. -- -%
Leas than primary 71.2 67.0 46.9 2.0 -0.9 12Primary 21.8 21.3 28.3 2.4 5.3 23Junior high 4.0 5.2 10.0 5.2 9.5 48Senior high 2.5 5.8 13.4 12.4 11.6 57Tertiary 0.5 0.8 1.4 8.5 8.0 77
Total 100.0 100.0 100.0 2.5 2.6 19
Source: Results of the 1971 and 1980 Population Censuses, BPS and World Bankstaff projections.

- 157 -
INDONESIA
COUNTRY ECONOMIC MEMORANDUM
Appendix 3: STATISTICS ON EMPLOYMENT AND INCOMES
List of Tables
1. Sectoral Employment and Productivity, 1971 and 1980
2. Total Employment by Sector, Java and the Outer Islands, 1976 and 1982
3. The Distribution of Urban Employment Between the Formal and InformalSectors, 1980
4. Migrants in the Outer Islands as a Result of Sponsored Transmigrationbetween 1950 and 1978 and Associated Population Growth
5. Average Household Income by Sector in Urban and Rural Indonesia, 1981
6. The Distribution of Poverty in Urban Areas, 1981
7. The Distribution of Poverty in Rural Areas, 1981
8. Average Daily Wages for Specific Unskilled Jobs in Selected Industriesand Provinces, 1981 and 1983
9. Indicators of Underemployment, 1980
10. Reasons for Low Work Hours, Both Sexes, Rural Indonesia, 1982
11. The Distribution of the Labor Force and Unemployed by Education, UrbanIndonesia, 1976 and 1982
12. Youth Unemployment Rates by Age and Education, Urban Indonesia, 1976 and1982
13. Unemployment by Education and Region, Both Sexes, Urban Indonesia, 1980
14. Unemployment by Age and Region, Both Sexes, Urban Indonesia, 1980

- Appendix 3
NDONESIA
OOUNIRY EODNOMIC MEURANDUN
Sectoral DEployment and Productivity, 1971 and 1980
Growthin Elasti-
Employment Productivity value- city ofLevels la Growth Levels Growth added employ-('000) (2 p.a) tRp2 OOO/worker) (2 p.a) (% p.a) uent
1971 198F 1971-80 1971 1950 1971-80 1971-80 1971-80
AgricultureFood crops 26,121 27,500 0.6 163 230 3.9 4.5 0.13Cash crops 1,206 2,134 6.6 1,149 1,027 -1.2 5.2 1.25Livestock 348 1,200 14.7 2,194 992 -8.4 5.1 2.90Forestry 135 502 15.6 4,008 2,815 -3.9 11.2 1.39Fishery 602 827 3.6 1,139 958 -1.9 1.6 2.22
Subtotal 28,413 32,164 1.4 268 370 3.6 5.1 0.27
MiningPetroleum lb 46 28 -5.4 119,776 421,115 15.0 8.8 -0.62Other 46 333 24.7 4,500 1,883 -9.2 13.2 1.86
Subtotal 92 361 16.4 62,471 34,401 -6.4 8.9 1.84
ManufacturingFood processing 615 1,187 7.6 1,050 1,474 3.8 11.7 0.65Textiles 933 1,235 3.2 230 467 8.2 11.6 0.27Wood & products 455 1,071 10.0 80 312 16.3 28.9 0.36Paper & products 54 81 4.6 1,408 1,550 1.1 5.7 0.81Chemicals 150 185 2.4 2,428 3,343 3.6 6.1 0.39Non-metallic 244 411 6.0 445 593 3.2 9.4 0.64Iron A steel 14 52 15.5 4,082 4,223 0.4 15.9 0.97Eaglneering 328 777 10.1 1,212 1,337 1.1 11.3 0.89Other 86 288 14.4 141 216 4.9 19.9 0.72
Subtotal 2,879 5,289 7.0 664 940 3.9 11.2 0.63
Electricity, gas & water 40 62 4.9 402 373 -0.8 4.1 1.21Construction 728 1,547 8.7 1,418 1,669 1.8 10.7 0.82
ServicesTrade 4.574 6,793 4.5 970 992 0.3 4.8 0.94Transport .021 1,972 7.6 1,346 1,121 -2.0 5.4 1.40Financial & business 100 282 12.2 8,339 8,341 0.0 12.2 1.00Public administration 1,423 1,982 3.8 643 1,245 7.6 U.7 0.32Other 2,998 4,688 5.1 314 518 5.7 11.1 0.46
Subtotal 10,116 15,717 5.0 840 1,031 2.3 7.4 0.68
igal 42.2,68 S5.140 &I Z A Z 0
/a Sectoral employment levels were obtained by a proportionate adjustment In the estimates-tn the Input-Output Tables to reflect a revised aggregate employment level. The latterwas calculted on the basls of an adjusted labor force participation rate for 1980 (seeAnnex 2) and an estimated employment rate.
lb Includes INC.
Source: World Bank staff estimates, based upon the 1971 and 1980 Input-Output Tables, BPS.

- 159 - Appendix 3Table 2
INDONESIA
COUNMY ECONOMIC MEKORANDLM
Total Employmet by Sector, Java and the Outer Islands, 1976 and 1982(in thousands)
1976 1982°ndo- Indo
Sector Java Other nesia Java Other nesia
Urban: Male & FemaleAgriculture 197 539 736 503 291 794Mining 9 13 22 24 33 56Manufacturing 670 204 874 1,341 267 1,608Electricity, gas and water 14 6 20 26 8 34Construction 239 86 325 439 237 676Trade 1,341 672 2,014 2,340 858 3,198Transport 415 180 594 612 235 847Finance, insurance, etc. 50 14 64 64 16 80Other services 1,550 688 2,23d 2,521 887 3,408
Subtotal 4,486 2.401 6.887 7,870 2,832 10,702
Rural: Wale & FemaleAgriculture 18,395 9,986 28,381 17,545 13,255 30,799Mini8g 71 20 91 211 123 334Manufacturing 2,287 807 3,094 3,194 1,220 4,414Electricity, gas and water 6 1 7 16 12 28Construction 393 98 491 1,099 371 1,471Trade 3,711 1,090 4,800 4,078 1,278 5,356Transport 498 192 690 679 270 949Finance, insurance, etc. 17 13 30 25 8 33Other services 1,992 818 2,809 2,553 1,164 3,717
Subtotal 27,370 13,023 40,394 29,401 17,700 47,100
Urban & Rural: Male & FemaleAgriculture 18,593 10,525 29,117 18,048 13,546 31,593Mining 81 33 113 235 155 391manufacturing 2,957 1,011 3,968 4,535 1,487 6,022Electricity, gas and water 20 7 27 42 20 62Construction 631 184 815 1,538 608 2,146Trade 5,052 1,762 6,814 6,418 2,136 8,554Transport 913 371 1,284 1,291 505 1,796Fimance, insurance, etc. 68 27 94 89 24 113Other services 3,541 1,505 5,047 5,074 2,051 7,125
Source SARN 6and S 19 4280 378270 20,532 57,802
Source: SAKh3NAS 1976 and SUSENIAS 1982, BPS.

-160- Appendi 3Table3
INDONESIA
COUlNTRY ECONOMIC MEMORANDUM
The Distribution of Urban Employment Between the Formaland Informil Sectors, 1980
Formal/enterprise /a Informal/household /bShare Share
Compo- of Compo- ofTotal sition women Total sition women('000) (Z) CZ) ('000) (Z) CZ)
Agriculture 341 6.2 24.9 549 13.6 21.7Industry /c 1,177 21.4 29.4 317 7.8 38.2Construction 394 7.2 2.3 145 3.6 1.4Trade 416 7.6 21.9 1,976 48.9 44.8Transport 461 8.4 2.8 268 6.6 0.7Finance 200 3.6 17.0 10 0.2 10.0Other services 2,500 45.5 31.4 776 19.2 32.7
Total /d 5,489 100.0 24.8 4,041 100.0 34.2
/a Employers and employees.7b Self-employed, self-employed with family members and family workers.ic Includes iuding, maufacturing and utilities.7d Excludes 'others" and 'unstated".
Source: Results of the 1980 Population Census, Series S, No. 2, BPS.

- 161 -A dir 3Table4
DDONES.T
ODUNTRY EC(NDMIC MafORANDUN
Nigrants iu the Outer Imlands as a Remlt of SponsoredTransmigration between 1950 and 1978 and Associated PoPulation Grovth
Sponsored Javanese, SundaDese Proportion oftransaigration Nadurese and Balinese migrants in
ludividuals Expected speakers, 1980 total populationmaved population Proportion in 1980
1950-78 In 1980 Number of sponsored -Sponsored Totl lbProvInce -'000 '000 z z
Aceh 8 9 175 5 0 7North Sumtra 16 26 1,768 1 0 21Rian 17 23 190 12 1 6Went Sumatra 27 38 56 68 2 3Jatibi 58 69 255 27 5 18Bencu1u 29 36 135 27 5 18South Sumatra 259 427 635 67 9 14Lamg 220 348 3,401 10 8 74
Subtotal 634 976 6.615 15 3 24
West Kalhlantan 31 42 198 21 2 8Central Kalimantan 12 18 63 28 2 7South- Klizantan 46 66 U16 57 3 6Fast alaUmantn 40 58 126 46 5 10
Subtotal 130 183 503 36 3 7
North Sulawesi 15 22 31 72 1 1South Sulawesi 39 51 54 96 1 1Central Sulawesi 51 63 72 88 5 6Southeast Sulawesi 27 35 46 75 4 5
Subtotal 131 171 202 85 2 2
East Nusatenggara 0 0 3 8 0 0Maluku 4 7 16 44 1 1Irlan Jaya /a 4 6 4 138 0 0
Subtotal 4 13 24 56 0 0
Excluding NorthSumatra and Lampung 664 969 2,175 45 3 6
/a There appears to be an error In the irian Jaya figures, either due to an utdercount ofJavauese In the 1980 Census, or because migrants vere actually moved after the Cenmsus Wscompleted.
lb Inner Island langpage speakers.
Source: Ministry of Transmitgration, Results of the 1980 Population Census, BPS and WorldBank calculations.

- 162 - ~~~Apnedix 3Table 5
INDONESIA
COUNINTY ECONOMIC MEMORANDUM
Average Household Income bz Sector in Urban and Rural Indonesia, 1981 /a(Rp '000 per capita per month)
OtherJava Sumatra Indonesia
Sector lb Urban Rural Urban Rural Urban Rural
Agriculture 1l.3 9.4 13.0 13.4 16.0 12.3Mining 32.9 9.2 29.3 16.8 20.9 16.0Manufacturing 18.3 10.1 17.7 16.5 19.6 13.8Electricity, gas and water 23.4 n.a. 17.7 n.a. 23.9 n.a.Costruction 17.7 10.3 17.1 15.4 18.1 14.7Trade 17.6 11.7 23.5 17.0 22.7 16.8Transport 15.8 12.0 17.4 17.1 18.2 31.5Fiwace 30.4 n.a. 39.0 na. 33.4 n.aoOther services 19.7 16.1 19.8 18.0 21.2 19.4
Average 17.7 10.3 19.9 14.2 20.2 13.5
Index (rural Java - 100) 172 100 193 138 196 131
Urban-rural differential 1.7 1.4 1.5
/a This includes wage plus enterprise income, but excludes "other- income,Wth is entirely nonlabor income.
/b This is the priulary sector of activity of the hosehold head.
Source: SUSENAS 1981, BPS.

- 163 - dls 3Table 6
IDONNEIA
COUNTRY ECODNOMIC MEMORANDUM
The Distribution of Poverty In Urban Areas, 1981 /a(in percent)
Java SumatraShare of Households Share of Households
Sector Below the Above the Below the Above thepoverty line poverty line poverty line poverty line
Agriculture 21 7 31 10Ma=nfacturing 14 14 6 9Constructim 10 7 9 6Trade 23 27 24 32Transport 12 10 12 9Other services 19 33 17 31Other /b 1 2 0 3
Total 100 100 100 100
Formal 52 60 36 50Informal 48 40 64 51
Apparent povertyincidence 18 6
/a This is derived from a poverty line estimated on the basis of calorierequirements and observed household budgets. See Bhanoji Rao, Poverty inIndonesia, 1970-80, World Bank mimeo, January 1984.
/b MNiang, electricity and finance.
Source: SUSENAS 1981, BPS.

-164- Appendix 3Table 7
MNDONSIA
0UNTRY EODNOMIC MEMORANDUM
The Distribution of Poverty in Rural Areas, 1981 /a(in percent)
Java SumatraShare of Households Share of Households
Sector Below the Above the Below the Above thepoverty line poverty line poverty line poverty line
Agriculture 79 66 90 75Manufacturing 5 6 3 3Construction 4 4 1 2Trade 6 11 2 8Transport 2 3 0 2Other services 4 10 3 9Other /b 1 1 0 1
Total 100 100 100 100
Household enterprises 70 70 88 81Wage labor 30 30 12 19
Apparent povertyincidence 38 16
/a This is derived from a poverty line estimated on the basis of calorierequirements and observed household budgets. See Ehanoji Rao, Poverty inIndonesia, 1970-80, World Bank m.ieo, January 1984.
/b Mining, electricity and fianmce.
Source: SUSENAS 1981, BPS.

INDONESIA
COUNIY EC,oN0OIC I4R4ImNDUN
Average Daill Wages for Specific Uinskilled Job. in Selected Industriesand Provinces, 1981 and 1983
Hotel Transport ManufacturL h (room (drivers Food Textlles Chemicals Savwlil furnitureboy) assistant) Occupation Rp, Occupatlon Rp. Occupation Rp. Occupatlon Rpi
North SumatraFebruary 1581 1,069 1,544 Ice 1,856 Yarn 706 Chemicals 1,262 Wood 1,367November 1983 1,423 2,000 maker 2,287 spinner - proceasor 2,054 cutter 2,067% (real) increase /a (14) (19) (4) - (43) (32)
South SumatraFebruary 1981 1,450 983 Ice 648 Spinning 1,624 Rubber 983 Veneer 525November 1983 2,021 1,986 maker 1,318 mach. op - extrude op. 1,323 mach. op. -S (real) Increase /a (16) (79) (33) - (38) (46)
IDKI Jakarta
February 1981 1,927 1,224 Noodles 844 Weaver 800 ChemLcals 938 Lathe 724November 1983 2,488 2,927 maker 1,241 (clothing) 999 processor 1,487 operator 1,202X (real) increase /a (9) (119) (26) (5) (38) (46)
Central JavaFebruary 1981 824 994 Noodles 525 Cutting 6 528 Cheaicals 732 Processing 486November 1983 1,383 1,794 maker 1,090 tailoring 999 processor 1,180 mach. op. 563S (real) increase /a (42) (57) (84) (66) (38) (-8)
West KallmmntanFebruary 1981 - - Bread 857 - - Rubber proc. 1,189 Processing 1,860November 1983 - - maker 1,642 - - macho op. 2,561 mach. op. 3,080S (real) increase /a (67) (91) (41)
South SulavesiFebruary 1981 1,023 - Ice 828 Dyer 963 - - Sawmill 653 INovember 1983 1,508 - maker 947 1,584 - - mach. op. 1,081 1 lt (real) Increase /a (25) (-8) (42) (43)
/a Deflated by the CPI for the major cities In each region.
Sources Survai Upah 1981, 1983, BPS.

- 166- Appeudix 3Table 9
INDONESIA
COUNTRY EODNOMIC MEMORANDUM
Indicators of Underemployment, 1980
Mean hours worked Proportion working lessper week than 35 hours per week
(x)
UrbanBoth sexes 46.8 17.6
RuralMale
Agriculture 36.7 39.3Other 4. 23.6All sectors 39.1 34.4
FemaleAgriculture 28.9 62.8Other 38.4 42.1All sectors 32.4 55.1
Both sexesAgriculture 34.3 46.8Other 42.2 30.5All sectors 36.9 41.3
Source: Results of the 1980 Population Census, Series S, No. 2, BPS.

INDONESIA
COUNTRY ECONOMIC MEMORANDUM
Reasons for Low Work Hours, Both Sexes, Rural Indonesia 1982(in percent)
Underemployed Part-time worker Other /bProportion Looking Dis- Not capable
of total for cou- of looking Sub- Unne- At House- Sub- Sub- .
Hours worked employees /a work raged for work Total cessary school wife total Other total 2
1 - 9 3.2 5.2 0.7 8.0 13.9 15.6 16.7 31.0 63.3 22.8 10010 - 24 21,6 6.7 0.9 9.6 16.6 23.8 9.0 24.0 56.8 26.6 10025 - 34 18.2 6.9 1.2 7.3 15.4 33.1 1.6 14.2 48.9 33.7 100
Sub-total 43.0 6.4 1.0 8.6 16.0 27.4 6.5 20,5 54.5 29.5 100
All employees 100.0 6.2 1.0 8.8 16.0 36.3 2.8 12.9 52.0 32.0 100
/a Excluding those temporarily out of work.71 No breakdown available of this category.
Source: SUSENAS 1982, BPS. II

- 168 - Appendix 3Table 11
INDONEIA
0DUNTRY E0NOMIC MEIORANDUM
The Distribution of the Iabor Force and Unemployed by Education,Urban Indonesia 1976 and 1982
(In percent)
Male Female1976 1982 1976 l982
Completed Iabor Unem- Labor Unem- Labor Unem- Labor Unem-education force ployed force ployed force ployed force ployed
Below prinry 33.5 24.9 29.1 16.2 54.7 19.0 49.5 16.7Primary 31.7 33.0 30.4 24.7 22.9 22.5 22.1 19.9Loer secondaryGeneral 12.2 14.1 12.5 13.4 6.8 18.5 7.4 11.4Vocational 3.5 4.1 2.0 4.0 2.4 2.5 2.2 2.1
Upper secondaryGeneral 9.1 12.7 11.7 21.6 4.4 16.7 6.5 22.4Vocational 6.2 9.6 10.3 17.3 7.2 17.8 10.0 23.3
Tertiary 3.8 1.6 4.0 2.8 1.6 3.0 2.3 4.2
Total 100.0 100.0 100.0 100.0 100.0 100.0 100.0 100.0
Number ('000) 5,218 359 7,565 422 2,207 109 3,649 238
. Source: SAKERNAS 1976 and SUSENAS 1982, BPS.

- 169 - Apppendix 3Table 12
INDONESIA
COUNTRY ECONOMIC MEKORANDUM
Youth Unemployment Rates by Age and Education,Urban Indonesia, l976 and 1982
(in percent)
Age and completed education Male Female1976 1982 1976 1982
15-19Below primary 22.3 11.4 6.5 7.1Primary 26.2 20.3 7.5 10.2Lower secondary
General 31.4 25.5 26.3 20.3Vocational 35.3 19.6 24.0 15.1
All levels 26.3 20.4 9.9 12.9
20-24Below primary 11.5 9.9 3.0 4.1Primary 13.9 9.3 8.3 10.0Lower secondaryGeneral 19.9 16.9 23.4 24.0Vocational 18.1- 16.3 9.7 17.2
Upper secondaryGeneral 32.2 37.1 33.4 38.0Vocational 27.6 25.1 21.9 32.9
All levels 18.2 17.6 14.4 18.8
25-29Below primary 3.0 3.2 2.0 3.3Primary 4.7 3.4 3.4 5.9Lower secondary
General 7.9 4.0 12.4 5.0Vocational 7.1 6.4 6.0 1.0
Upper secondaryGeneral 8.4 7.2 5.9 11.8Vocational 5.8 7.2 9.1 6.7
Tertiary 7.4 9.4 13.6 30.5
All levels 5.8 4.9 5.5 6.9
Source: SARERNAS 1976 and SUSENAS 1982, BPS.

-170- ApjcndLz 3Table 2.3
DNDONMI
ODUMRY ECODNOIC MEHORANDUH
Unemployment by Education and ReRion, Both Sexes, Urban Indonesia, 1980(In percent)
Unemployment rates Proportion of unemployedCoampleted DKI Other Outer DKI Other Outerschooliug Jakarta Java Islands Indonesia Jakarta Java Islands Iudonesia
Below primary 2.7 1.4 1.9 1.7 22.8 26.5 26.0 25.3Primary 4.0 2.4 2.4 2.7 26.5 25.8 23.3 25.4Lower secondary
General 5.0 3.4 2.8 3.6 15.5 12.5 12.6 13.4Vocational 3.3 3.0 2.6 3.0 1.7 3.6 2.5 2.8
Upper secondaryGeneral 5.0 4.6 4.6 4.7 18.0 12.4 17.0 15.1Vocational 6.0 5.3 4.7 5.3 13.0 17.2 16.7 15.9
Tertiary 1.7 2.0 1.6 1.8 1.4 2.1 2.0 2.1
All levels 3.8 2.4 2.7 2.8 100.0 100.0 100.0 100.0
No. unemployed 77 131 68 275('000)
Source: Results of the 1980 Population Census, Series S, No. 2, and provincial results,BPS.

-171 - Apendlz 3Table 14
INDONSIA
ODUNTRY ECONOMIC MIMORANDUM
Uoeuployment by Age and Region. Both Semes, Urban Indonesia, 1980(in prcent)
-Ueuploiuent rates Proportion of unmeployedDKI Other Outer DKI Other Outer
A8e group Jakarta Java Islands Indonesia Jakarta Java Islands Indonesia
10-14 8.3 4.3 5.1 5.2 2.8 2.9 2.4 2.815-19 9.7 5.9 7.1 7.0 27.8 24.1 22.3 24.720-24 8.8 5.8 6.6 6.7 42.6 37.9 41.2 4'0.025-29 2.8 2.1 2.4 2.4 13.2 13.8 15.6 14.130+ 1.0 0.5 0.9 0.9 13.6 21.3 18.5 18.4
All ages 3.8 2.4 2.7 2.8 100.0 100.0 100.0 100.0
No. ueuployed 77 131 68 275('000)
Source: Results of the 1980 Population Census, Series S, No. 2 and provincial results,BPS.

- 172 -
INDONESIA
COUNTRY EODNONIC MEHORANDUM
Annex I: ANALYSIS AND PROJECTIONS TABLES
List of Tables
1. Exports by Commodity, 1975/76- 1995/96
2. Imports by Category, 1975/76 - 1995/96
3. Balance of Payments, 1974/75 - 1995/96
4. Oil Sector Projection, 1984/85 - 1995/96
5. Projection of Crude Oil Refining Capacity, 1981/82 - 1995/96
6. ING Current Account, 1981/82 - 1995/96
7. Terms of Trade Index, 1973/74 - 1995/96
8. The Public Sector Capital Account, 1974/75 - 1984/85

.- 73-
Ai I
Acftmx -
1.t ~ ~ ~ ~ ~ ~ ~ ~ h _aI a
/. sW 96 3 1.110 2.6 1,.12 15 573 DSC 75 303 46 Su 09 1.3_3- 517 76 L . 1.038 23 6215 9m 1.591 1.267 1X.59 Z.1 3.32
c.eG. in2 308 3 SW 715 36 363 M0 530 563 a9 03 gm 1659
Pazl .41 142 1 Zt 221 257 7 9 3 2 213 IN 27 262 332 728mmso 122 13 91 97 96 121 15 232 2 236 269 316 53
40 1 59 so so 59 69 37 30 so 67 5 59 7 2 119Pulp- 25 55 QI 46 46 51 49 41 58 67 * 9 53 62 310cuo 195 248 278 36 69 50 4556 3 6as GU 704 43 1.113 1.333 2.194
bvmtl aw Z n 2_30 2.6 3-19 5115 *.23 2J0 2.3" 3. 3.2D 3S 3 M .J 5. 0.373
1,6 381 253 326 3 454 435 34 309 328 43 331 45 342 796
- _ _ - 95 165 1s 1" 1 206 21 228 295 in 4966 - - - 43 1s 293 29 313 337 376 562ZOC 7 9- 7 55 7£ 4 95 11 n2 ns 39 3 29 21 29 1" 26Oz 25 64 36 49 31 40 12 25 3 D9 10 3" 207 257 426
sab-mi aut1a e .s.-.1. 257 320 363 437 09 774 73 676 101 1I02 2 1.2 1 2072 1.676 53D
1 i I " - - - - 32 57 660 732 32 1.335 1.705 *.Oabwu 1" 196 265 360 £67 SW 346 530 3 05 19 143 1.59 2.251 3.013 6.386
S _btatal _ 1£ 196 265 360 47 56* S65 853 1.48 1. 2,133 2. 3.J5 _J2Q 10,
?O=Zh am-odl wt I-g 2.363 3.30 3 996 S_ 71 _57* 3.9273 5.365 2_5_ MO __3 223 _ 23,55J
0!1 6 PCDOS 5,10 6.350 7,192 6.t35 10.995 15.217 36,4M 1.=23 12.030 =.u5_ 10,714 U.769 15,023 7.7 22.802La - - in6 51 1.365 2,11 Z-53 2.461 2.3"9 3. 3._39 3*7U3 4.997 6.0*6 20.762
btul all md D ; 5.10 Z7, 7,374 12,340 2,P 28 147 ?4.49 16.?U 12,253 1 .20 2337
Tott exprt 7,28 9 213 lD.IIo 11.37D 22511 22 5S 22 9911 19.n 19. 12 20 2i1 20.769 22J8 29 4S2 35,235 5 J,
pri. lim (CL1ML/2-1O0)
49 55 62 63 134 10D 9 1o21 97 93 97 1D0 1I6 15453 70 74 89 21D6 230 10 so Ii in 117 130 158 18 250
C_ffi 51 112 187 229 235 21 20 97 123 123 134 140 176 2.3Od agrLea 1 -pn o 2 so 97 so 201 117 100 go 103 in 117 125 268 161 209
49 '1 76 91 109 119 200 91 91 a 94 20 113 26 1640b_ tala -od 2 76 74 76 77 99 111 10 5 95 96 10 l 206 1 12in 1i
_ _bmfsccmre s67 68 76 87 97 1D5 2D0 93 53 90 95 203 22 142 182Oll mumd *re6stme 36 36 38 33 66 93 100 93 S2 D so 95 1.13 186
- - 3J 3S 6 93 00 201 S5 a 90 91 lD9 129 209
MOOL1gm art Contint priceC31/92 - 1D0
12a6 lo 1.076 1.609 1.521 1.794 1.951 1.248 753 5S7 690 68 616 451 538 601 903719 3A g2 870 56 a" 768 765 869 8"9 936 92 1.051 1.170 1.529
coff_ 220 295 335 396 530 486 364 373 412 43 657 70 699 529 616Otb0w astwl1tairml *po 623 694 763 876 1.22 79 725 30 96 1.09 1.035 1.101 1.295 1.33!o 1.772Tin 322 3Q2 333 356 356 302 435 332 361 361 31 330 404 429 685Otb itala d o 2 130 1i 165 147 223 z83 283 365 517 732 776 73 61 1.D2
_ftwsfnctorea 215 238 331 616 4"1 516 65 870 1.537 1.830 2.238 2.30 2.701 3.349 6.045
?oatl saw-oil 0 * .24 .232 *. 4 569 S.5 4 * .17 4 . 5.17 51 6. 29 6 j2, 7.22 J2 9 9 12.369
0G1 4 FcoCa? 15.912 17.639 L.M 13.067 218.742 18.00 16.481 13.227 14.7e5 13.779 13.59S 14.6-4 13.785 15.725 2.425IC - - 426 1.358 2,102 2.269 2.363 2.66 2.810 3.914 3.939 *.092 4.60 6.731 5.161
Subtata OI1 aid D C 9 17.&1 19,330 191.W 20 S" 20 U9 23 15.571 17A 5 75 693 1 1 537 .21,7" 20,3 9 2D,6 17IJ3
yota'L amparts 19.2t2 t.37 23.532 24.256 26.64S3 15 9 19.353 22,746 D3.48 3 2 27.617 2.765 29
/a Zacladin plyanad matil I3W/8l.
Source 1.ld k ataif atta d wo34etiin.

INDONESI
COUwrm ECONOHIC HKI4MUZDUN
InEorts by Cate,gorz. 1975/76 - 1995/96MIS miUllin)
1975/76 1976/77 1977/78 1978/79 1979/80 1980/81 1981/82 1982/83 1983/84 1984/85 1985/86 1986/87 1988/89 1990/91 1995/96---- Actual -E-- Rut. - Pojacted-
At Current Prices
Food 565 693 1,106 946 1,393 1,485 1,637 1,270 1,L10 940 908 993 1,227 1,438 1,624Other consuser goods 200 260 281 344 365 s0 743 534 534 575 604 649 772 919 1,251Intermdiate goods 1,869 1,867 2,275 2,361 3,501 4,274 4,983 4,861 4,661 4,60 4,904 5,456 6,884 8,818 15,276Capital goods 2,456 3,347 3,579 3,692 3,769 5,538 7,198 9,139 7,921 6,150 7,200 7,800 9,320 11,263 16,702
Total non-oal Iports 5.090 6.67 7.241 7.543 9,04 11837 14A561 15.824 14.246 12.865 13A616 1a899 18,202 22.4:8 J4,533
0i1 and IXC sector 2,272 2,640 2,909 3;364 42,940 4,050 5,407 4,802 3,839 3,135 3,801 4,113 5,168 6,540 10,989Non-factor services (net) 345 490 536 586 1,237 1,702 2,602 1,713 1,570 1,611 1,650 1,772 2,145 2,608 3,822
Totl mnrt ed FRZ.ZLM 2fLM IXM JUAU ALM2 ALM U a.M~ U=~ LA" ALAMJ 9=~ ILZM ZL= ALM hUAW
Price index (1981/82 * 100)
Food 74 52 55 75 68 90 100 77 80 79 77 84 108 132 169Other consumr goods 60 62 66 77 87 96 100 98 94 91 96 103 120 140 179Intermedlate goods 61 61 64 77 87 99 100 98 94 91 96 103 120 140 179Capital goods 61 61 64 77 87 99 100 98 94 91 % 103 120 140 179
Total non-oil imports 61 61 64 77 83 97 100 96 93 90 94 102 119 140 179
Ol and LNG sector 48 49 53 60 74 93 100 98 94 91 96 103 120 140 179Non-factor services (net) 61 62 67 77 88 97 100 98 94 91 96 103 120 140 179
Te to nZ 57Z 3~ AZ 2* 96LA UL 2U 9L 2Q JQ j in AZ2
At constant 1981/82 prices
Food 746 1,333 2,011 1,261 2,048 1,650 1,637 1,658 1,410 1,186 1,186 1,186 1,140 1,093 959Other consumer goods 333 419 426 447 419 551 743 564 568 629 629 629 641 654 698lntermediate goods 3,155 3,011 3,447 3,326 4,024 4,361 4,983 4,951 4,954 5,031 5,108 5,286 5,718 6,280 8,523Capital goods 4,093 5,398 5,423 4,795 4,332 5,651 7,198 9,307 8,420 7,382 7,499 7,557 7,741 8,021 9,320
Total non-oil imports 5.305 10,161 11,307 9.829 1 2 12,213 1 16,479 j31 14,227 14 421 14 658 15,240 16,048 19,50C
Oil and 1MG sector 4,733 5,388 5,489 5,607 3,973 4,355 5,407 4,890 4,080 3,428 3,959 3,985 4,309 4,657 6,132Non-factor services (net) 566 790 800 761 1,406 1,755 2,602 1,745 1,669 1,762, 1,719 1,717 1,782 1,857 2,133 |.
Total Isei t and n eS and proj ec tion sA 22 5L0 £1421 1 L22 LUM 3 .ZZZ I# J
Sourcet Iorld Dadi staff eatietesa nd projections,

INDONISIA
COUNTRY ECONOMIC KFORANOUM
Daladce of Paynmnts. 1974/75 - 1995_96(US$ million)
1974/75 1975/76 1976/77 1977/78 1978/79 1979/80 1980/81 1981/82 1982/83 1983/84 1984/85 1985/86 1984/87 1988/89 1990/91 1995/96Actual E------------------- at. - Projected
1. Export. 6 581 7 283 9 213 10 861 11,370 18 510 22,885 22 994 184672 19 817 20 243 20 769 22 866 29 452 36235 57 457(a) oll and LG (groas) 7bt 50 9 -1R 173 TlZg=- 17Sfl7 1EIT TR715 W1 W4T TRj13 133J 20j02 2jP7 -T357(b) Non-oil 2,033 1,873 2,863 3,507 3,996 6,171 5,587 4,170 3,928 5,367 5,902 6,516 7,356 9,432 12,387 23,686
2. Imports (Including netUPS) -6,514 -7 707 -9 297 -10 686 -11 493 -13 205 -17 589 -22 570 -22 339 -19 655 -17 611 -19 067 -20 784 -25 535 -31,586 -49 644
(a) Oil and LNG aector 1,10 2 -299 -3364 -2 940 -4:050 -5407 -4I802 -3 839 -3o135 -3:1 -4:113 -5 10 989(b) Non-oil Imports -4,341 -5,090 -6,167 -7,241 -1,543 -9,028 -11,837 -14,561 -15,824 -14,246 -12,865 -13,616 -14,899 -18,202 -22,438 -i4,853(c) N"S (net) -263 -345 -490 -536 -586 -1,237 -1,702 -2,602 -1,713 -1,570 -1,611 -1,650 -1,772 -2,145 -2,608 -3,822
3. Resource balance 67 -424 -84 175 -123 5 305 5 296 424 -3 66? 161 2 632 1 703 2 085 3 917 4.649 7,7934. Factor marvices (not) -20! f-lf -m -1W! -CU5 -9M 3 _3 To -3572 4 J 1 4.3m Vitm - 1
-Z7[ le -(a) Interest on public debt t5 aI!S -31 8 57 :114 8 72 4 -1176(b) Other (net) /a -125 -265 -400 -424 -547 -2,471 -2,441 -2,214 -2,426 -3,219 -2,976 -2,929 -3,143 -3,993 -4,487 -7,070
5. Net transfers 75 75 61 66 46 52 76 67 105 95 100 110 120 130 150 lO0
6. Balance on current account -63 -779 -741 -624 -1,109 2.251 -2,207 -2,719 -7.134 -4.2lJ -1.864 -2.715 -2,790 -2.323 -2.488 3,053 -
7, Direct foreign inveatwent 538 454 287 285 271 217 140 142 311 193 250 250 275 325 375 4798. Public KLT loans
(a) Groae disbursements 1,120 2,152 2,332 1,956 1,638 1,939 2,864 2,673 4,192 4,965 3,828 4,988 5,428 6,159 6,692 10,062(b) Amorttration -212 -352 -437 -825 -977 -1,335 -987 -1,053 -1,102 -1,295 -1,628 -1,980 -2,137 -3,394 -4,603 -6,867(c) Net disburaements 908 1,800 1,895 1,131 660 604 1,877 1,620 3,090 3,670 2,200 3,008 3,291 2,764 2,290 3,195
9. Other capital (net) -1,392 -1,839 -440 -141 886 -1,382 -1,488 -31 383 1,974 287 -143 -103 24 132 -30010. Change in reserves
(- increame) 9 364 -1,001 -651 -708 -1,690 -2,736 988 3,350 -1,619 -873 -400 -673 -791 -309 -32011. Net official reserves 920 556 1,557 2,205 2,916 4,606 7,342 6,354 3,004 4,623 5,496 5,896 6,568 7,534 8,325 9,075
Mmooranduu item.Reservea in m-athe of
non-oil Imports e NPS 2.4 1.2 2.8 3.4 4.3 5.6 6.5 4.4 2,0 3,4 4,4 4.5 4.5 4,3 3.6 2.7Public debt ervice
as 2 of exports /b 6.3 10.3 11.7 15.9 18.4 16,0 11.5 14.4 19.4 19,4 25,1 27.4 27.1 29,3 29,8 27.1
Total net foreign aaaets (S billion) /c 10.6 6,3 8,4 9.9 10.3 11,0 12.8 13.8 17.1In months of imports
of goods 6.4 3.7 5.6 7,4 7.1 6.9 6.5 5.7 4.5Current accoutt
balance as I of GNP -3,3 -8.5 -6.0 2.4 -3.3 -3.1 -2.1 -1.9 -1.5
/a After 1980/81 includes e atimted interest an privata short-term debt.Th Oil exports on net baail.7; Includes net foreign assets of deposit sonay banks In addition to official reaervea.
Source: World Bank staff estimtam and projections.

INDONESIA
COUNTRY ECONOMIC MEMORANDUM
oil Sector Projection. 1984/85-1995/96(Volumes In million bareelo per year; values in US$ million)
1984/85 1985/86 1986/87 1987/88 1988/89 1989/90 1990/91 1995/96
Prices ($ per barrel)Crude 28.40 27,90 28,40 31.00 33.70 36.76 40.00 65,00Products (erports) 27.01 27,34 28.40 31.62 35.39 38.60 42.00 70.85Products (liports) 34,08 30,69 31,24 34,10 37.07 40.44 44.00 71.50
1. Crude production /a 533 518 SS1 569 588 588 595 528
2. Refini48 5ju (volume) 220 248 248 248 248 248 248 250A. Crude dinietic D7 Tff Tff Yfl Tfl flf fYf TITB. Crude imports (volume) 23 37 37 37 37 37 37 37
3. Domestic conaum tlon 159 162 166 17i 175 179 184 210A. Doesic refinries 131 T 15 U W m TXB. Imports (volume) 8 8 8 8 a a 8 8
(value) 273 246 250 273 297 323 352 572
4. Gross exports (value) 11 051 10 714 11 769 13 327 15 023 16 218 17,752 22 808A. Crude (volume) ="W = 03 =3f4 517[ =AW 7'Uw
(value) 9,548 8,560 9,646 11,095 12,676 13,827 15,338 20,443B. Products (volume) 56 79 75 71 66 62 57 33
(value) 1,503 2,155 2,123 2,232 2,347 2,391 2,414 2,366
5. Crude and productImports (2B + 3B) 934 1.264 1.287 1.404 1.527 1.665 1.812 2,945
6. A. Production-related Imports 1,967 2,250 2,598 2,978 3,417 3,939 4,560 7,840B. Non-factor service Imports 620 698 751 1ll 876 946 1,022 1,304C. Factor service payment. 1,664 1,510 1,599 1,;,3 1,997 2,148 2,331 3,259
7. O-l current accommt (4-5-6) A=. Q i2Z L=2 ALM IA,
Hemorandum itemsDomestic proceselng capacity 220 250 275 275 275 275 275 275Coats of production per barrel 4.34 5.43 5.89 6.54 7.27 8.38 9.58 18.56
/a Includes condensates.
Source: World Bank staff estimates and projections.

INDONESIA
COUNTRY EODONIC N(ORANDUM
ProlectLon of Crude Oil Rafinioo Cspacity. 1981/02 - 1995196(million barrelo per year)
1981/82 1982/83 1983/84 1984/85 1985/86 1986/87 1988/89 1990/91 1995/96
Reflanis Cacity /aaxtlng t lne rtieneries) 140 140 140 140 140 155 155 155 155
New refinerLesDalikpapan 40 55 60 60 60 60Cllacap 40 55 60 60 60 60
Subtotal 80 110 120 120 120 120
Total Domentic 140 140 140 220 250 275 275 275 275
/a Capacity for input of crude. Thse doea not include the new hydrocracker at Dunal, which will process LSWR (31 a. bbl. peryear), not crude, nor does lt Include the proposed but Indefinite Sorong/Jakarta/Batam Island refinery that could comeon stream ln the late 1980s or early l990o.
Sourcet Ministry of Nining and Energy.

INDONESIA
COUNTRY ECONOMIC MEMORANDUM
LNG Current Account, 1981/82 - 1995/96
1981/82 1982/83 1983/84 1984/85 1985/86 1986/87 1987/88 1988/89 1990/91 1995/96Actual Eet. -- ----- Projacted ---
Exports (f,o.b.) 2,343 2,461 2,399 3,290 3,539 3,743 4,494 4,997 6,095 10,762
Imports of goods andservices /a 960 1,084 1,044 1,338 1,591 1,682 1,940 2,112 2,190 3,806
Balance on currentaccount 1.382 1,377 1.355 1.952 1.948 2.061 2,554 2.884 3.906 6.956
He i tem.Price (SflH4TU) /b 5.12 5.15 4.37 4.30 4.60 4,68 5.11 5.55 6.59 10.71Rxport volume (miTlion
HHBTU) 458.0 477.8 549,4 765.5 770.0 800.0 880.0 900.0 * 925.0 1,005.0of whichExisting plants /c (458.0) (477.8) (549.4) (765.5) (770.0) (800.0) (800.0) (800.0) (800.0) (800.0)New plants /d - - - - - - ( 80.0) (100.0) (125.0) (205.0)
/a Includes factor service payments (contractors' shares for LNG plants and cost of gas recovery),7 FOB basis; price movements after 1983/84 are assumed to be lame in percentage term as for crude oll.7c Includes 5 trains at Arun and 4 traLns at Bontang. Assumes that exports In 1984/85 are limited to
sinimum volumeu under contract./d Assuaes that additLonal train for export to Korea comes on stream in 1987/88 and that a further
expansion of about 50 million MMBTU (1 mililon metric tons) is on stream In 1990/91.
Sources Bank Indonesia and World Dank staff eatimateo and projectlons.
1ii

- 179 -
ANNEX ITable 7
INDONESIA
COUNTRY ECONONIC MEMORANDUM
Terms of Trade Index, 1973/74 - 1995/96(1981/82 - 100)
Non-Oil Exports: /a Total Exports: /bNonr-Oil Imports (including NFS) Total Imports (includiug NFS)
1973/74 96.0 50.0
1974/75 90.0 60.0
1975/76 76.0 62.0
1976/77 95.0 70.0
1977/78 107.0 72.0
1978/79 107.0 50.0
1979/80 120.0 86.0
1980/81 108.0 97.0
1981182 100.0 100.0
1982/83 97.8 97.4
1983/84 111.8 93.7
1984/85 112.7 95.2
1985/86 110.8 92.3
1990/91 106.8 90.4
1995/96 108.0 107.1
/a Based on price indices of non-oil exports (Table 1) and non-oil imports,including net NFS (Table 2).
/b Based on price indices of total exports (Table 1) and imports, includingnet NFS (Table 2).
Source: World Ban-k staff estimates and projections.

INDONESIA
COUNTRY ECONOHIC KHEORANDU
The Public Sector CaDita1 Account. 1974/75 - 1984/85(Rp bilon)
1974/75 1975/76 1976/77 1977/78 1978/79 1979/80 1980/81 1981/82 1982/83 1983/84 1984/85 h
Coverneat aourcoa 928 1 492 1 547 1 522 1 888 2 047 3 403 5 763 7 788 7 107 7 787Public national savingts m T M 7 R 7Net foreign savings /b 429 830 865 701 677 895 1,275 1,543 2,639 3,609 2,310Cavernment borrowing7 c 48 3 -343 -351 -293 -1,218 -1,748 -137 822 -2,342 -2,500
Use 928 1,492 1 547 1,522 1,888 2,047 3,403 5763 7,788 7 107 7,787ransfers to public enterprises /d P0 '74Z IWf '111 639 '--61S 1 M- 2,13T I 7:113 49S6% :18wDirect governeent inventment /e 458 750 520 954 1,249 1,422 1,908 3,632 4,223 2,651 3,987
Public entercrise sources 768 1 221 1 346 749 989 1 773 2 093 2 730 4 143 4 761 4 910Transfers from CentralOovernmsnt 7X "W V',0W To Zh '1!3f t2,13 P,NT V.313 3iBW 1Interaal savings /f 198 217 196 227 250 275 300 312 365 401 450Domestic borrowing /8 100 262 123 -46 100 -873 298 287 213 -96 660
UsesuMiTsc enterprise investment 768 1,221 1.346 749 989 1.773 2.09- 2.730 4.143 4.761 4,914
/a Total government revenues (excluding regional governmeats) lesr current expenditures.b Gross disbursements of public debt lees amortization payments.71 Net changes In government savinge with the financial system.71 Include, budget and off-budget transfers to public enterprises.71 Calculated as a residual.7? Eatimate based oan 1974-77 public enterpriae capital account survey, BPS.7i Excludes Dulog; also exclude. Pertamina until 1978/79./h Preliminary.
Sourcel World Bank staff estimates based on budget data, Bank Indonesia financial statistice and the World BankDebtor Reporting System.
I!1

181 -
INDONESIA
ODUNTRY ECONOMIC MEMORANDUM
Annex II: HISTORICAL DATA
List of Tables
Population and Employment
1.1 Population 1930, 1961, 1971, 1980: Average Annual Growth Rates,1930-80 and Population Density, by Region and Province.
1.2 Distribution of Population by Age Group and Sex, 1961, 1971, 1980.
National Income Accounts
2.1 Gross Domestic Product by Industrial Origin at Current Market Prices,1967-83.
2.2 Distribution of GDP at Current Market Prices, 1971-83.2.3 Gross Domestic Product by Industrial Origin at Constant 1973 Market
Prices, 1971-83.2.4 Distribution of GDP at Constant Market Prices, 1971-83.2.5 Expeaditures on GDP at Current Market Prices, 1971-83.2.6 Expenditures on GDP at Constant 1973 Market Prices, 1971-83.2.7 Estimates of the Terms of Trade Effects, 1972-83.
International Trade and Balance of Payments
3.1 Balance of Payments, 1973/74 - 1983/84.3.2 Non-oil Exports, 1971/72 - 1982/83.3.3 Export Values by Country of Destination, 1971-84.3.4 Import Values by Country of Origin, 1971-84.3.5 Oil Balance of Payments, 1976/77 - 1983/84.3.6 LNG Balance of Payments, 1977/78 - 1983/84.
External Debt
4.1 External Public Debt Outstanding Including Undisbursed as ofDecember 31, 1983.
4.2 Service Payments, Commitments, Disbursements and Outstanding Amountsof External Public Debt.
4.3 External Public Debt by Country and Type of Creditor as ofDecember 31, 1983.
4.4 External Public Debt as of December 31, 1983 by Major Currency andCountry.
4.5 Loan Commitments by Country, 1975-83.4.6 IGGI and Nonr-IGGI Disbursements and Net Resource Transfers, 1975-83.4.7 Summary External Debt Data, 1975-83.

- 182 -
Public Finance
5.1 Central Government Budget Summary, 1973/74 - 1985/86.5.2 Central Government Receipts, 1973/74 - 1985/86.5.3 Central Government Expenditures, 1973/74 - 1985/86.5.4 Development Expenditures, 1973/74 - 1985/86.5.5 Development Expenditures by Sactor, 1975/76 - 1985/86.5.6 Project Aid by Sector, 1975/76 - 1985/86.
Monetary Statistics
6.1 Money Supply, 1975-84.6.2 Changes in Factors Affecting Money Supply, 1975-84.6.3 Consolidated Balance Sheet of The Monetary System, 1975-84.6.4 Consolidated Balance Sheet of The Monetary Authorities, 1975-84.6.5 Banking System Credits by Ecormouic Sector, 1975-84.6.6 Banking System Credits by Type of Bank, 1975-84.6.7 Small-Scale Investment Credits and Permanent Working Capital Credits
1975-84.6.8 Medium Term Investment Credits by Economic Sector, 1975-84.6.9 Time Deposits with State Banks, 1975-84.6.10 Interest Rates on Deposits at Commercial Banks, 1978-83.
Agricultural Statistics
7.1 Principal Agriculture Products by Subsectors, 1968-84.7.2 Agricultural Production of Major Crops by Type of Product, 1970-837.3 Rice - Area Harvested, Production and Yield, 1968-84.7.4 BULOG Rice Program, 1978/79-1983/84.7.5 Area Covered Under Rice Intensification Programs, 1969-83.
Other Sectors
8.1 Quarterly Index of Manufacturing Production for Selected IndustrialGroups, 1979-84 (3rd quarter).
8.2 Production of Minerals, 1973-84.8.3 Crude Oil Production by Company, 1969-1984 (July).8.4 Petroleum Products - Supply and Demand, 1970-84.8.5 Domestic Sales of Petroleum Products, 1971-84.
Prices
9.1 Indonesia Consumer Price Index, 1979 - February 1985.9.2 Wholesale Price Indices in Indonesia, 1975-84.9.3 Domestic Prices of Petroleum Products, 1972-85.
Investments
10.1 Approved Foreign Investment by Sector, 1977-83.10.2 Implementation of Foreign Investment by Sector, 1977-83.10.3 Approved Domestic Investment by Sector, 1977-83.

- 183 -
Tab 1.1
INDONESIA
couuMY zcowwic MDIOAIDUN
Populatlaz 1930, 1961, 1971 and 1980: Avere Aonual Growth Rat_. 1930-80and Pouaatlom D1ty. ab Reiuon md Proa ice
Deulty2930 -M-17Census Groorth rate tS) (tPer<"|/q km)
RegIon - 1971 la I 1930-61 696127. i972-m 1971 1980
Java 41 718 63 059 76 086 91 270 1.3 1.9 2.0 576 690OI Jakarta -171m- T 3 1 T455 ;T 7,71! l,lrfvest Java 10,586 17,615 21,624 27,454 1.7 2.1 2.7 467 593Central Java 13,706 18,407 21,877 25,373 1.0 1.7 1.7 640 742DI Yogyakarta 1,559 2,241 2,489 2,751 1.2 1.1 1.1 785 868Kat Java 15,056 21,823 25,517 29,189 1.2 1.6 1.5 532 609
Sumtra 8.255 15739 20.809 28.017 2.1 2.8 3.4 U 59Lempyag *511 ~ 1~77T 1i3n 31 I' 11Beankulu 323 406 519 768 0.7 2.5 4.5 25 36South Sumtra 1,378 2,773 3,441 4,630 2.3 2.2 3.4 33 45Rlau 493 1,235 1,642 2.169 3.0 2.9 3.1 17 23Jmbi 245 7U 1,006 1,446 3.6 3.1 4.1 22 32West Sumatra 1,910 2,319 2,793 3,407 0.6 1.9 2.2 56 68North Sumtra 2,542 4,965 6,622 8,361 2.2 2.9 2.6 94 118Aceh 1,003 1,629 2,009 2,611 1.6 2.1 3.0 36 47
Kalimntan 2 170 4 102 5 155 6 723 2.1 2.3 3.0 10 12,eat Na1±.nta T1U! !WJ Y C, ,,3 IT Central Kallmantan 203 497 702 954 2.9 3.5 3.5 5 6South Xallmntan 836 1,473 1,699 2,065 1.8 1.4 2.2 45 55ea-t KaIllumtan 329 551 734 1,218 1.7 2.9 5.8 4 6
Su--1ei 4 231 7 079 8 528 10 409 1.7 1.9 2.2 45 55Cenmtral Sulaveut -1 ' T.I u 1North Sula_el 748 1,310 1,719 2,115 1.8 2.8 2.3 90 111South Sulael 2,657 4,517 5,181 6,062 1.7 1.4 1.8 71 83Southast Sulawesl 436 559 714 942 0.8 2.5 3.1 26 34
Other Islands 4 219 7 106 8 630 11 071 1.7 2.0 2.8 1S 191rli 1;101 I711 TL- 2tm 470 -1;7 -1. Arl 7West Nma Teggara 1,016 1,808 2,203 2.725 1.9 2.0 2.4 109 135Mot Nana Tenggra 1,344 1,967 2,295 2,737 1.2 1.6 2.0 48 57Naltuk 579 790 1,089 1,410 1.0 3.3 2.9 15 19Irian Jay& 179 758 923 1,174 4.8 2.0 2.7 2 3Ent Tluor n.a. n.a. n.a. 555 u.a. n.a. u.n. U.S. 37
oSAl lando 60,593 97,08 11.0 147.490 AA, lal 2 zz
n.a. - not- available.
/a Includes adjuttent for the ezclusLon of rural Iria Jaya.
Sowrcea: BPS, Population Census Reports, 1961 and 1971, 1980 and Statistical Yearbook 1982.

INDONESIA
COUNTRY ECONOMIC MEMORANDUM
Distribution of Population by Age Group and Sex, 1961, 1971, 1980
1961 1971 1980Age Group Males Females Total Hales Females Total Hales Females Total
0-4 8,529 8,649 17,178 9,674 9,560 19,234 10,813 10,339 21,1525-9 7,745 7,700 15,445 9,593 9,302 18,895 10,891 10,480 21,37110-14 4,353 3,892 8,245 7,406 6,875 14,281 9,225 8,550 11,77515-19 3,865 3,905 7,770 5,627 5,779 11,406 7,637 7,866 15,50320-24 3,480 4,373 7,853 3,627 4,461 8,088 5,965 7,000 12,96525-34 7,392 8,610 16,002 7,722 9,226 16,948 9,587 9,832 19,419
35-44 5,765 5,406 11,171 7,062 7,119 14,181 7,846 8,119 15,96545-54 3,587 3,511 7,098 4,360 4,213 8,573 5,743 5,905 11,64855-64 1,913 1,865 3,778 2,224 2,373 4,597 3,312 3,412 6,724
65+ 1,183 1,245 2,428 1,450 1,539 2,989 2,269 2,667 4,936
Unknown 60 57 117 7 8 15 17 13 30
Total 47,872 49,213 97,085 58,753 (455 119,205 73,306 74,184 147,490to
-- … -- ---------- - ---- - - --- Percentsge distribution -
0-4 17.8 17.6 17.7 16.5 15.8 16.1 14.8 13.9 14,3
5-9 16.2 15.6 l5.9 16.3 15.4 15.9 14.9 14.1 14.510-14 9.1 7.9 8.5 12.6 11.4 12.0 12.6 11.5 12.1
15-19 8.1 7.9 8.0 9.6 9.6 9.6 10.4 10.6 10.520-24 7.3 8.9 8.1 6.2 7.4 6.8 8.1 9.4 8.8
25-34 15.4 17.5 16.5 13.1 15.3 14.2 13.1 13.3 13.2
35-44 12.0 11.0 11.5 12.0 11.8 11.9 10.7 10.9 10.845-54 7.5 7.1 7.3 7.4 7.0 7.2 7.8 8.0 7.955-64 4.0 3.8 3.9 3.8 3.9 3.9 4.5 4.6 4.665+ 2.5 2.5 2.5 2.5 2.5 2.5 3.1 3.6 3.3
Unknown 0.1 0.1 0.1 0.0 0.0 0.0 0.0 0.0 0.0
Total 100.0 100.0 100.0 100.0 100.0 100.0 100.0 100.0 1 100.0
Source: BPS 1961, 1971 and 1980 cenaus.
ii

INDOMSIA00UNrRY EWfOHIC KEM ANDUKM
Gross Domestic Product by Indu_trlal Origin at Current Market Prices, 1967-83(Rp. billion)
1967 1968 1969 1970 1971 1972 1973 1974 1975 1976 1977 1978 1979 1980 1961 1982 19831a
Agriculture 457 1,069 1 339 1 575 1.646 1.837 2.710 3,497 4,003 4 812 5,906 6,706 8 996 11 290 13 643 15 668 18 772Fare ood crops 75 726 -'1ff2 1 6i 961 1,071 1.573 2,095 2,54 3,660 3,9"2 =6! 61 35J1, 12 = 3U-!Farm nonfood cropa 46 133 199 214 196 226 323 386 358 481 762 802 1,201 1,304 1.327 1,227 1,496Estate crops 19 47 69 83 107 118 152 191 184 213 326 404 590 693 904 1,026 1,146Livestock products 33 53 89 103 124 135 173 223 303 346 305 462 690 991 1,251 1,418 1,521Forestry 6 35 59 102 142 173 355 423 413 513 525 653 1,048 1,142 1,140 983 1,040Fishery 54 75 101 112 116 114 134 179 191 215 328 393 575 803 912 1.053 1,188
Mining & quarrying 23 87 129 173 294 491 831 2,374 2,485 2,930 3,600 4,358 6,980 11,673 12,971 11,708 13,824Manufacturing 62 179 251 312 307 448 650 890 1,124 1,453 1,817 2,420 3,311 5,288 5,822 7,681 8,918Electricity, gSa & water 3 9 13 15 18 20 30 52 70 98 106 118 149 225 288 380 503Construction 14 45 75 100 128 174 262 406 590 813 1,023 1,242 1,790 2,524 3,U8 3,507 4,434Commerce, hotels, etc. 149 356 476 619 592 769 1,118 1,775 2,104 2,552 2,959 3,450 4,775 6,391 7i90 6 8,865 10,875Transport & coeammicatlon. 19 57 77 96 162 182 257 442 521 663 843 1,032 1,422 1,9S 2,352 2,795 3,325Banking, etc. 4 12 22 33 45 53 83 13 151 207 236 396 655 752 1,404 1,604 1,341Ownership of dwelling 17 41 53 66 85 103 143 194 258 319 542 671 914 1,200 1,439 1,703 1,962Public administration& defence 41 116 136 183 214 290 405 585 864 1,074 1,394 1,685 2,200 3,142 3,905 4,429 5,225
Other services 59 126 147 168 181 197 264 380 473 546 607 668 833 996 1,119 1,293 1,536
Gro,n dometic oroduct r l 2 ̂AL 3 3-672 Lfl2 6.7S 1,643 15.033
/a Preliminary.
Source: BPS.

INDONESIA
COUNTRY ECONOHIC NEKDRANDUM
Distribution of GDP at Current Market Price., 1971-83(In percent)
1971 1972 1973 1974 1975 1976 1977 1978 1979 1980 1981 1982 1983/-
Economic sectorsAgriculture, forestry and
fishery 44.8 40.2 40.1 32.7 31.7 31.1 31.0 29.5 28.1 24.8 25.3 26.3 26.4mining 8.0 10.8 12.3 22.2 19.7 13J.9 18.9 19.2 21.8 25.7 24.0 19.6 19.4Manufacturing 8.4 9.8 9.6 8,3 8.9 9.4 9.5 10D6 10.3 11.6 10.8 12.9 12.5Electricity, gas and water 0.5 0.4 0.4 0.5 0.6 0.6 0.6 0.5 0.5 0.5 0.5 0.6 0.7Construction 3.5 3.8 3.9 3.8 4.7 5.3 5.4 5.5 5.6 5.6 5.8 5.9 6.2Transport and co.runications 4.4 4.0 3.8 4.1 4.1 4.3 4.4 4.5 4.4 4.3 4.4 4.7 4.7Other services 30.4 30.9 29.8 28.5 30.5 30.4 30.1 30.2 29.3 27.5 29.3 30.0 30.1
Gross domestic product 100.0 100.0 100.0 100.0 100.0 100.0 100.0 100.0 100.0 100.0 100.0 100.0 100.0
Expenditures categoriesPrivate consumption 77.6 72.5 71.1 68.6 69,1 68.4 65.6 66.8 60.9 60.5 65.8 69.9 69.1Government consumption 9.3 9.1 10.6 7.9 9.9 10.3 10.9 11.7 11.7 10.3 10.7 11.5 10.9Gross domestic Investment 15.8 18.8 17.9 16.8 20.3 20.7 20.1 20.5 20.9 20.9 21.4 22.6 24.1Exports, net -2.6 -0.4 0.4 6.8 0.7 0.6 3.4 1 6.5 8.3 2.1 -3.9 -4.2
Gross domestic product 100.0 100.0 100.0 100.0 100.0 100.0 100.0 100.0 100.0 100.0 100.0 100.0 100.0
/a Prellainary.
Source: BPS.
I!1

INDONESIA
COUNTRY ECONOMIC MEMOMDUN
Gross Domestic Product by Industrial Origin at Constant Market Prices. 1971-83(Rp, bililon)
1971 1972 1973 1974 1975 1976 1977 1978 1979 1980 1981 1982 1983La
Agriculture 2 441 2 479 2 710 2 811 2 811 2 944 2 992 3 135 3 256 3 425 3 594 3 670 3 846Far f6ood crop. J. W5 ft. P tffl V w- i wParm nonfood crops 302 329 323 307 312 325 385 388 402 417 430 460 485Estate crops 154 160 152 174 183 188 201 210 231 233 244 285 388Livestock products 160 169 173 186 202 216 177 184 202 212 22 230 241Forestry 258 276 355 325 274 310 335 352 338 308 246 196 203Fishery 131 130 134 138 144 150 159 166 174 182 194 204 217
Mining and quarrying 551 674 831 859 828 952 1,070 1,049 1,047 1,035 1,069 940 957Manufacturing 490 564 650 755 848 930 1,058 1,236 1,395 1,705 1,878 1,901 1,943Electricity, gas and water 25 26 30 37 41 46 49 57 69 78 90 106 113Construction 171 222 262 320 365 385 464 529 563 639 720 759 805 00Commerce, hotels, otc, 924 1,028 1,118 1,224 1,294 1,351 1,438 1,530 1,681 1,852 2,043 2,159 2,240Transport and comatlcations 210 229 257 288 303 343 439 514 560 609 677 717 753Banking, etc, 64 75 83 88 102 117 151 165 180 208 231 258 277Ownership of dwelling 93 121 143 174 198 209 252 288 306 336 359 377 401Public administration and defence 326 393 405 443 564 596 689 768 . 805 972 1,076 1,115 1,176Other services 250 256 264 270 277 283 280 296 303 310 318 323 331
Otua.. dmestic tlaruct ^ ~ AaL~a, ~~aia L~A1& A41£ LL L5L 7 ~.d"269 LJL.a6 JL.§12-l55 ALM.3
/a Preliminary.
Source 3 BPS.
I W

INDONESIA
COUNTRY ECONOMIC HEMORANDUM
Distributlon of GDP at Constant Market Prices, 1971-83(In percent)
1971 1972 1973 1974 1975 1976 1977 1978 1979 1980 1981 1982 1983 /a
Economic sectorsAgriculture, forestry andfishery 44,0 40.9 40.1 38.7 36.8 36,1 33,7 32,8 32,0 30,7 29.8 29,8 29.9
Mining 9.9 11.1 12,3 11.8 10.9 11,7 12.0 11.0 10.3 9.3 8.9 7,6 7.5Manufacturing 8.8 9.3 9.6 10.4 11.1 11.4 11.9 12.9 13.7 15.3 15.6 15.4 15.1Electricity, gas and water 0.5 0.4 0.4 0.5 0.5 0.6 0,6 0.6 0.7 0.7 0.7 0.9 0.9Construction 3,1 3,7 3.9 4.4 4,8 4,7 5,2 5.5 5.5 5.7 6.0 6.2 6.3Transport and communications 3.8 3.8 3.8 4.0 4,0 4,2 4.9 5.4 5.5 5.5 5.6 5.8 5.9
Other services 29.9 30.9 29.8 30,3 31,9 31,3 31.6 31.8 32,2 32,9 33.4 34.3 34.5
Gross domestic product 100.0 100.0 100.0 100.0 100.0 100.0 100.0 100.0 100.0 100.0 100.0 100.0 100.0
ExpendLture cate8woriesPrivate consumption 73,7 71.3 71,1 75.7 74,7 75,5 72,1 71,9 77.4 79.4 85.9 86.8 89.6Government consuaptlon 9.3 9.2 10.6 8.8 11.0 11.0 11.8 12.8 13,2 13.3 13.6 14.4 13,7Gross domestic investment 15.6 17.0 17.9 19.8 21.6 21.4 22.8 24.4 24.0 25.9 26.7 29,5 30.5Exports, net 1.3 2.5 0.4 -4.3 -7.3 -7.9 -6.6 -9.1 -14.6 -18.7 -26,2 -30.7 -33,8
Gross domestic product 100.0 100.0 100.0 100.0 100.0 100.0 100.0 100.00 100.0 100.0 100.0 100.0 100.0
/a Preliminary.
Sources BPS.
NH|
8$.

INDONESIA
COUNTRY ECONOHlC MEHORANDUH
Expenditures on GDP at Current Market Prices, 1971-83(Rp. billion)
1971 1972 1973 1974 1975 1976 1977 1978 1979 1980 1981 1982 1983/a
Private consumption 2,848 3,309 4,804 7,344 8,732 10,572 12,481 15,184 19,514 27,504 35,560 41,671 49,231Government consumption 341 414 716 841 1,254 1,591 2,077 2,659 3,733 4,688 5,788 6,832 7,791Gross domestic investment 580 857 1,208 1,797 2,572 3,205 3,826 4,671 6,704 9,485 11,553 13,467 17,188Export of goods and non-factor
services 527 762 1,356 3,044 2,897 3,621 4,513 4,974 9,629 13,849 14,928 13,345 17,733Less Import of goods and
non-factor services 624 778 1,331 2,318 2,812 3,522 3,864 4,742 7,555 10,080 13,802 15,682 20,728
Groas domestic product 3,672 4,564 6,753 10,708 12,643 15A467 19.033 22,746 32,025 45446 027 59633 71,215 ,0
Net factor from income abroad -68 -144 -245 -499 -557 -483 -678 -867 -1,484 -2,011 -1,925 -1,958 -3,036GNP 3,604 4,420 6,508 10,209 12,086 14,984 18,355 21,879 30,541 43,435 52,102 57,675 68,179ODS 483 841 1,233 2,523 2,657 3,304 4,475 4,903 8,778 13,254 12,679 11,130 14,193ONS 415 697 988 2,024. 2,100 2,821 3,797 4,036 7,294 .11,243 10,754 9,172 11,157GDI/GDP (2) 15.8 18,8 17,9 16,8 20,3 20.7 20,1 20.5 20.9 20.9 21.4 22.6 24.1GDS/GDP (2) 13.2 18.4 18.3 23,6 21.0 21.4 23.5 21.6 27.4 29.2 23.5 18.7 19.9GNSIGNP (2) 11.5 15.8 15,2 19,8 17.4 18.8 20.7 18.4 23.9 25.9 20.6 15.9 16.4
/a Preliminary.
Sources BPS.
Ng-4
1~ 4

INDONESIA
COUNTRY ECONOMIC MEKORANDUM
ExpendLtures on GDP at Constant 1973 Karket Prices, 1971-83(Rp. billion)
1971 1972 1973 1974 1975 1976 1977 1978 1979 1980 1981 1982 1983/a
Private consumption 4,088 4,324 4,804 5,502 5,699 6,154 6,400 6,880 7,866 8,867 10,350 10,698 11,501
Government consumption 518 561 716 641 836 896 1,044 1,288 1,345 1,490 1,641 1,775 1,759
Gross domestic Investment 867 1,032 1,208 1,440 1,650 1,749 2,027 2,333 2,436 2,896 3,219 3,637 3,921
Export of goods and nonfactorservlces 943 1,143 1,356 1,445 1,410 1,650 1,806 1,824 1,822 1,719 1,678 1,444 1,535
Less Import of goods andnonfactor services 871 993 1,331 1,759 1,964 2,293 2,395 2,698 3,304 3,803 4,833 5,229 5,874
Gross domestic product 5,545 6,067 6,753 7.269 7,631 8,156 8,81!2 9,567 10,165 11,169 12,055 12325 12,842
Net factor income abroad -95 -184 -245 -378 -389 -314 -420 -493 -649 -759 -674 -653 -835
Terms of trade effect -211 -170 0 861 616 701 997 1,002 2,383 3,507 3,542 3,004 3,489
ODY 5,334 5,897 6,753 8,130 8,247 8,857 9,879 10,569 12,548 14,676 15,597 15,329 16,331
GNP 5,450 5,883 6,508 6,891 7,242 7,842 8,462 9,074 9,516 10,410 11,381 11,672 12,007
GNY 5,239 5,713 6,508 7,752 7,858 8,543 9,459 10,076 11,899 13,917 14,923 14,676 15,496
GDS 728 1,012 1,233 1,987 1,712 1,807 2,435 2,461 3,337 4,319 3,606 2,856 3,071
GNS 633 828 988 1,609 1,323 1,493 2,015 1,968 2,688 3,560 2,932 2,203 2,236
GDI/GDP (2) 15.6 17.0 17.9 19.8 21.6 21.4 22.8 24.4 24.0 25.9 26.7 29,5 30.5
GDS/GDY (2) 13.6 17.2 18.3 24.4 20.8 20.4 24.6 23.3 26.6 29.4 23,1 18.6 18.8
GNS/CNY (2) 12.1 14.5 15,2 20.8 16.8 17.5 21.3 19.5 22.6 25.6 19.6 15.0 14.4
/a Prellolnary.
Source: BPS.
0g1

INDONESU
COUNTRY ECONOMIC HNBCANDUH
Estimate of the Term of Trade Effects. 1972-803(Rp. billion)
1972 1973 1974 1975 1976 1977 1978 1979 1980 1981 1982 19831.
Exports In current prices 762 1,356 3,044 2,897 3,621 4,513 4,974 9,629 13,849 14,928 13,345 17,733Exports in 1973 constant prices 1,143 1,356 1,445 1,410 1,650 1,806 1,824 1,822 1,719 1,678 1,444 1,535Export price Index 67 100 211 205 219 250 273 528 806 890 924 1,155
Imports In current peices 778 1,331 2,318 2,812 3,522 3,864 4,742 7,555 10,080 13,802 15,682 20,728Imports In 1973 constant prices 993 1,331 1,759 1,964 2,293 2,395 2,698 3,304 3,803 4,833 5,229 5,874Import price Index 78 100 132 143 154 161 176 229 265 286 300 353
Exports (import capacity) 973 1,356 2,306 2,026 2,351 2,803 2,826 4,205 5,226 5,220 4,448 5,024
Terma of trade index 85 100 160 144 143 155 155 231 304 311 308 327Term of trade effect -170 - 861 616 701 997 1.002 2.383 3507 3,542 3.004 .3.489
Net factor Income from abroad In current prices -144 -245 -499 -557 -483 -678 -867 -1,484 -2,011 -1,925 -1,958 -3,036Net factor income from abroad In 1973 prices -184 -245 -378 -389 -314 -420 -493 -649 -759 -674 -653 -835
/a Preliminary.
Source: BP8.
*1-f

NDONESIA
COUNThY ECONOMIC KlMMUNDUN
Balance of Pazmnto, 1973/74 - 1983/84(ug* million)
1973/74 1974/75 1975/76 1976/77 1977/7B 1978/79 1979/80 1980/81 1981/82 1982/83 1983/84
1. met oil /a 641 2,638 3,138 3,710 4,352 3,785 6,308 9,345 8,379 5,788 6,016
2. N t LNG /a - - - - 93 225 667 1,256 1,382 1,378 1,355
3. Non-oil (net) -1 397 -2 776 -3 992 -4 512 -5 135 -5 165 -4 777 -8 470 -12 551 -14 205 -u 522Exports, FOD ti M 11i7 7 t . - T T17im 4,170 3 928 5W367Imports, CIF -2,938 4,341 -5,090 -6,167 -7,241 -7,543 -9,028 -11,837 -14,561 -15,824 -14,346Servicem (noufveight) -364 -468 -755 -1,208 -1,401 -1,601 -1,920 -2,220 -2,160 2,309 -2,543
4. Current account (1+2+3) -756 -138 -854 -802 -690 -l,lSS 2,198 2131 -2,790 -7,039 -4,11
5. iDR. - - - - - 64 65 62 - *- -
6. Official capital 643 660 1 995 1 823 2 106 2 101 2 690 2 684 3521 5 011 5 793IGCI mUn 46T7 E
Program aid 281 180 74 147 157 94 239 118 50 21 84Project aid 275 333 871 1,449 1,537 1,473 1,998 2,288 2,365 2,884 4,171
ODA (275) (333) (482) (513) (661) '(814) (1,106) (1,299) (996) (1,356) (1,902)Non-ODA (H) (-) (389) (936) (876) (659) (892) (989) (1,369) (1,528) (2,269)
Non-ICCI 87 147 1,00S 227 412 534 453 278 1,106 2,106 1,538
7. Official debt repayment (principal) -81 -89 -77 -166 -761 -632 -692 -615 -809 -926 -1,010
8. Hiscellaneous pital 549 -131 -1 075 38 176 392 -1 315 -361 1 140 1 795 1 191Direct inveatment m 53 -- 217 5 7 1U 14I 14 2 Others 218 -669 -1,529 -249 -109 121 -1,532 -501 998 1,484 998
9. Total (4 through 8) 355 302 -11 893 831 770 2,946 3L9 0 1 1,062 -1,159 1,823
10, Errors and omissions 5 -311 -353 108 -180 -62 -1,256 -1,165 -2,050 -2,121 247
11. Monetary movements -360 9 364 -1,001 -651 -708 -1,6j00 -2,736 988 3,280 -2,070
/a Cross ezports of products less Imports of goods and services of the oil and ING sectors respectively.
Source: Bank Indonesia.

- 19- AM It
Ihfimma~ ~ ~ ~ ~~~~~~VWr-
or-all t,ca. 197V72 - 13/4
19717n 1773 19 A74 1974/75 19/76 1976/77 1977/78 1978179 1979/U 19D 0/8± 186182 19Om/3 1Ma//8a
V&T- De0 275 720 615 527 a5 943 1.130 2,16 1.672 952 a" 1.123ra 3.340 12,701 15.70" 12.436 11.33J 15.770 13.717 16,141 16,259 11.682 5.949 5.101 5.481
rmce 19 22 46 49 46 54 60 70 133 143 160 176 205
tobbrfai8 215 211 403 425 331 577 603 774 1.101 1.073 770 614 962TolR 309 8 26 02 843 S46 392 373 923 1,015 954 833 377 1,079Piee 266 255 535 505 450 647 697 S34 1.04 11.30 672 701 392
Pals oll45 42 89 2M 14 147 202 221 257 176 79 103 U 3
Ver 212 2a5 279 303 417 415 4N 415 440 376 13 315 244prime 21 171 319 607 341 354 4"I 533 584 472 434 327 342
coffeeVa-ln $4 *3 79 92 112 330 321 508 715 38B 343 363 469Vlol z2 11 96 105 142 143 179 232 23B 232 219 239 268
730 748 323 876 789 2.306 3.496 2,190 3.004 2.533 1.564 1.522 1.743
TimsVrnln 31 31 31 50 50 64 120 98 91 97 94 116 124Vole 46 46 46 51 61 6 60 65 69 77 8s 68 32price 674 674 674 90 8 20 996 2.007 1.503 1.319 1.259 1.075 1,711 1.,13
20 32 46 36 40 41 59 58 60 69 49 37 47Vole 19 27 35 26 23 21 27 27 24 31 26 19 26Pric 1.053 11185 1,314 1,335 1.756 1,954 2.294 2,130 2.300 2.252 1,857 2.018 1.328
21 21 31 22 25 55 62 66 46 51 49 41 55Vole 24 24 25 14 17 33 31 38 24 32 38 34 46Prim 375 375 1.240 1.571 1.434 1.6 2.012 1.729 1.937 1.627 1.291 1,19 1.214
VPotkso 5 4 6 a 4 4 5 2 12 7 4 1 4vole 59 51 37 3r 41 30 25 6 33 30 21 3 16Prie 85 78 162 267 93 14 213 333 354 221 195 193 237
da~ 20 20 22 22 29 36 33 34 65 *6 32 38 27Vole 303 364 245 236 363 375 301 323 381 390 300 368 261Pric 66 55 90 93 80 96 111 Ws 171 117 108 104 105
Value 14, 12 7 30 17 20 13 28 59 36 20 9 32Vole0100 434 304 17 455 3 133 181 435 565 334 266 206 300Prce 32 39 60 66 73 75 68 64 w0 109 76 86 107
Orbs feadectftevalue 28 26 49 47 37 52 48 65 79 99 71 50 9
7M U23 42 90 92 103 146 179 214 255 224 214 251 255
Tinvelue 66 70 9e 136 158 11 253 324 333 454 437 349 309Vole 20 21 22 24 22 27 25 26 27 30 31 27 24Price 3.200 3.333 4.455 6.917 7,541 6.707 10.110 12.454 14,370 14.874 14.037 12.931 12.715
WM - 13 56 102 74 95 74 64 95 111 120 115 soVole - 2S 126 189 230 in M1 17 184 207 209 154price - _ 44 439 392 413 395 382 508 600 580 550 320
Nw molm is 19 21 2s 25 4 36 49 126 205 187 212 373
"Ouammm. 56 76 77 114 1" l 96 245 361 656 570 623 730 1.167
Total va 786 977 1.905 2.033 1_73 2.S3 3.506 3.996 6.171 5.485 4 031 3923 5.235
la PreluesLay flae
Val_s: *000 t.prim: ut/ao/.
Source: Un la_dmrei (baee V /C qppl±Atiaa).

INDONESIA
COUNTRY ECONOMIC KEMNDU1
Expert Values by Country of DestinatiXo, 1971-84(In percent)
1971 1972 1973 1974 1975 1976 1977 1978 1979 1980 1981 1982 1983 1984,a
Japan 44.6 50,7 53.2 53,4 46.9 41.7 40.2 39.2 46.1 50.3 47.5 50.1 45.8 47.4ASEAN 17.7 9.7 11.8 8.7 10.3 8.9 10.6 12.7 14.3 12.7 13.6 15.7 16.4 10.9
Halaysia 2.5 1.7 1.1 1.0 0.9 0.3 0.2 0.2 0.4 0.3 0.3 0.3 0.3 0.5Philippines 2,1 0.5 - - 0.4 1.1 1.2 1.7 1.1 0,8 1.6 1.3 1i1 0.8Singapore 13.0 7.5 10.6 7.5 8.9 7.5 9.2 10.7 12.6 11.6 11,5 14.0 14.8 9.2Thailand - - - 0.1 - - - 0.2 0.2 0.1 0.1 0.1 0.2 0.4
Other Alal 3.6 4.7 5.2 3,8 4.3 4.3 5.8 5.8 5.8 3.9 3.7 4.9 4.7 6.8
USA 15,6 14.9 15.7 21.3 26.3 28.7 27.7 25.4 20.3 19.6 19,3 15,9 20.2 21,3Other America 0.5 4.2 2.2 6.1 5.5 7.6 5.4 6.9 3.0 4.1 7.9 4.3 4.9 4.7
EEC 13.6 11.9 10.3 5.3 5.7 7.3 8.5 7.5 7.5 5.8 4.2 4.0 4.5 4.6France 0.6 0.6 0.5 0.3 0.2 0.4 0,6 0.5 0.5 0.5 0.2 0.3 0.3 0.2West Germany 5.0 3.7 3.7 2.2 1.9 2.4 2.2 1.9 2.2 1.6 1.0 1.1 1.2 1.1Netherlands 5.8 4.4 3.1 1.9 2.5 2.7 3.4 3.0 2.6 1.7 1.4 1.2 1.4 1.4United Kingdom 1.0 1.3 1.0 0.3 0.4 0.5 0.6 0.5 0.6 0.6 0.5 0.6 0.9 0.8Other EEC 1.2 1.9 1.9 0.6 0.6 1.3 1.7 1.6 1.6 1.4 1.1 0.8 0.7 1.1
Other Europe 2.3 2.7 0.9 0.8 0.7 0.9 0.9 1.2 1.3 1.1 1.1 0.6 0.9 1.3Auatralia 2.0 0.8 0.5 0.3 0,3 0.4 0.6 0.9 1,2 1.4 1.8 3.0 1.0 1.4Other Oceania - 0.1 - - - - - 0.1 0.3 0.5 0.8 1.2 1.2 1.0Africa 0.1 0.3 0.2 0.3 - 0.2 0.3 0.3 0.2 0.2 0.1 0.3 0.4 0.6
Total 100.0 100.0 100.0 100.0 100.0 100.0 100.0 100.0 100.0 100.0 100.0 100.0 100.0 100.0
Lo January to October.
Source: BPS, Indlkator Ekonoul.
EI'-4

INDONESIA
COUNTRY ECONOMIC MEMORANDUM
Import Values by Cotmtry of OrlIgn, 1971-84(In percent)
1971 1972 1973 1974 1975 1976 1977 1978 1979 1980 1981 1982 1983 1984 /a
Japan 32.8 34.0 29.3 29.4 31.0 26.2 27.1 30.1 29.2 31.5 30.1 25.4 23.2 23.7ASEAN 7.7 9.3 8.7 9.3 8,6 14.0 14.3 9.7 11.6 12.5 12.8 19.6 23.9 12.8
Malaysia 0.4 0.5 0.5 0.3 0.4 0.3 0.3 0.3 0.5 0.3 0.4 0.3 0.4 0.6Philippines 0.2 0.3 0.5 0.3 0.3 0.3 0.3 1.1 0.7 0.8 1.9 1.4 1.1 0.1Singapore 6.3 6.5 4.9 6.5 7.2 9.7 8.6 6.8 7.4 8.6 9.4 16.7 21.2 12.0Thailand 0.8 2.0 2.8 2.2 0.7 3.6 5.1 1.5 3.0 2.7 1.1 1.2 1.3 0.9
Other Asia 11.7 11.8 17.4 16.4 14.4 12.8 17.0 17.0 18.7 19.7 15.5 15.0 14.0 18.4
USA 15.8 15.6 18.8 15.9 14.0 17.4 12.4 12.4 14.3 13.0 13.5 14.3 15.5 17.9Other America 0.5 0.7 0.9 1.4 1.8 1.3 2.3 2.3 1.8 1.9 2.8 1.8 1.9 2.9 WI
BBC 20.3 17.8 17.7 19.3 18.6 21.2 20.8 18.9 14.9 13.3 16.6 15.8 13.7 14.8France 1.5 1.3 1.7 1.9 1.9 3.5 3.0 2.5 2.0 2.2 2.6 3.4 3.6 3.1Went Germany 9.5 7.5 7.2 8.2 7.6 8.5 7.9 8.9 6.4 6.3 6.8 7.1 4.5 5.9Netherlands 4.6 4.3 3.3 2.7 2.8 3.1 4.2 2.2 1.7 1.1 1.5 1.1 1.6 2.0United Kingdom 4.2 4.1 3.8 3.8 3.5 3.1 3.8 3.1 2.7 2.4 4.1 2.6 2.2 2.1Other EEC 0.5 0.6 1.7 2.7 2.8 3.0 1.9 2.2 2.1 1.4 1.5 1.6 1.7 1.7
Other Europe 5.3 3.7 2.1 3.9 5.7 2.4 2.0 4.7 4.0 2.7 3.4 4.1 4.1 5.1Australia 2.9 3.3 3.3 3.4 3.3 3.3 3.0 3.3 3.1 3.5 2.7 2.2 2.5 2.6Other Oceania 0.1 0.3 0.2 0.4 0.3 0.4 0.5 0.6 0.6 0.7 0.7 0.6 0.4 0.5Africa 2.9 3.5 1.6 0.6 2.3 1.0 0.5 1.0 1.8 1.2 1.9 1.2 0.8 1.3
Total 100.0 100.0 100.0 100.0 100.0 100.0 100.0 100.0 100.0 100.0 100.0 100.0 100.0 100.0
/a January to October.
Source: BPS, Indikator Ekonodi.
a-}

INDONESIA
COUNTRY ECONOMIC MUI4RANDUM
oil Balance of Paymeate, 1976/77 - 1983/84(USS million)
1976/77 1977/78 1978/79 1979/80 1980/81 1981/82 1982/83 1983/84
1. EXports. FOB 6 349.7 7 191.7 6 857.9 10 994.5 15,186.6 16 481.5 12,283.1 12 050.4COW 2,880.5 2,576.2 2,628.2 3,302 -3 762.Production sharing (PS) 1,561.8 1,750.8 1,755.2 2,210.7 3,049.5 3,674.3 3,775.5 3,369.3Iu klad (COW + PS) 1,221.7 1,703.3 1,594.5 2,670.5 3,707.4 3,333.2 2,507.7 2,071.1PERtTAMIN 685,7 961.4 880.0 2,783.1 3,585.8 4,054.7 2,308.7 2,847.5
2. Imports -1,948.0 -1 640.0 -1,829,4 -2,844.8 -3.913.2 -5,278.0 -4,645.2 -3,601.2cow -111.0 -138.9 -1IT9 -146.6 -244.2 -Z22.7 -5765 -614.4PS -1,024.6 -720.3 -827.6 -683.0 -1,308.0 -1,486.0 -1,545.0 -1,028.1PERTAM1NA -812.4 -780,8 -889.9 -2,015.2 -2,631.0 -3,569.3 -2,523.7 1,958.7
3. Services -692.1 -1 200.0 -1 243.1 -1 841.9 -1,929.0 -2 824.8 -1,849.7 -2 ,433.0dow- _M".: -497.5 -472.2 -633.8 -55sG.0 -S90.0 -621.6 -887.8PS -92.4 -433.1 -422.3 -807.2 -540.5 -980.0 -850.8 -1,085.1PERTAHINA -161.1 -269.4 -348.6 -400.9 -480.5 -954.8 -377.3 -460.1
4. Current account (1+2+3) 3 709.6 4 351.7 3 785.4 6 307.8 9 344.4 8.378.7 5 788.2 6 016.2coy ~ ~ ~ ~ ~ ~ ~ wr i~~~~~~~777 ~~~~ 3,'6917 4,216.6' 2,4931COW 2,330.9 2 139,8 2 044,1 2!577.7 2,9. ;1.62431 t260.3
PS 444.8 597.4 505.3 692.6 1,471.0 1,298.3 1,379.7 1,256.1In kind (COW + PS) 1,221.7 1,703.3 1,594.5 2,670.5 3,707.4 3,333.2 2,507.7 2,071.1PERTAHINA -287.8 -88.8 -358,5 367.0 474.3 -469.4 -592.3 -428.7
5. Miscellaneous capital 710.3 -198.4 10.5 -904.3. -659.2 300.1 554.0 331.6Reisbursement LNG - T --5 Debt repayment -458.8 -278,5 -220,8 -169.3 -151,0 -127.0 -76.4 -59.2Short-term (-98.1) (-12.0) (-7.2) (-8.8) (-2.7) (-9.6) - -
HP/LT borrowing (-145.4) (-106.1) (-92.0) (-82,0) (-60.5) (-22.7) - -
Special projects (-34.8) (-28.2) (-32.1) (-14.4) H-) (-12.9) - -
Crude debt repayaments (-207.5) (-132.2) (-89.5) (-64.1) (-87.8) (-81.8) (-76.4) (-59.2)Project prefinancing -59.8 -8,7 -13,6 -3.0 - - - -Oil export credit -234.0 -73.4 244,9 -737.2 -508.2 427.1 630.4 390,8Paymenta due (4,177.5) (5,343.1) (5,179.3) (6,906.7) (10,760.9) (11,401.0) (9,243.2) (8,766.6)Receivables (-4,411.5) (-5,269.7) (-4,934.4) (-7,643.9) (-11,269.1) (-10,973.9) (-8,612.8) (-8,375.8)
6. Total (4+5) 2,999.3 4.153,3 3,795.9 5,403.5 8,685,2 8,678.8 6,342.2 6,347.8
7. Errors and osissions -50.3 15.0 39.2 182.6 -65.6 792.1 254.5 -121.5
8, Monetary movements -2,949.0 -4.168.3 -3,835.1 -5,586.1 -8,619.6 -9,470.9 -6,596.7 -6,460.3
Source: Bank Indonesia.

INDONESIA
COUNTRY ECONOMIC HEHQRANDUH
LNG Balance of Payxents, 1977/78 - 1983/84(USS million)
1977/78 1978/79 1979/80 1980/81 1981/82 1982/83 1983/84
1. Exports, FOB 161.7 516.2 1,345.3 2,110.5 2,342.6 2,461.1 2,398.9
C&v 188.9 604.3 1,511.0 2,320.4 2,587.8 2,689.3 2,622.0HMBTU (million) (71.2) (216.3) (373,1) (424,3) (458.0) (477.8) (549.4)H/T (million) (1.4) (4.1) (7.3) (8.2) (8.9) (9.3) (-)Price ($/KMBTU) (2.63) (2.79) (4.05) (4.98) (5.12) (5.15) (4.37)Freight -27.2 -88.1 -165.7 -209.9 -245.2 -228.7 223.1$/IMTV (0,42) (0.43) (0.45) (0.49) (0.54) (0.48) (0.50)
2. Importa CIP -17.0 -52.8 -95.4 -136,3 -129,1 -156.7 -237.4
3. Services -52.2 -238.8 -582.7 -718.6 -831.3 -926.9 -807.0
Coat of recovery -21.8 -122.8 -428.2 -221.3 -216.0 -300.2 -338.9Contractor's share -30.4 -115.8 -153,7 -495.6 -613.3 -624.7 466.2Other charges - -0.2 -0.8 -1.7 -2.0 -2.0 -1.9
4. Current account (1+2+3) 92.5 224.6 667.2 1,255.6 1,382.2 1,377.5 1,345.0
5. Hiscellaneous capital -79.0 -146.6 -334.8 -149.6 -190.4 -168,7 -227.2 1
Debt repayments (JILCOex-escrow account) -29.7 -96.7 -140.4 -238.0 -167.1 -172.6 -195.4(Net transfer to escrowand special account) -49.3 -49.9 -194.4 -88.4 -23.3 3.9 -31.8
6. Total (4+5) 13.5 78.0 332.4 1,106.0 1,191.8 1,208.8 1,127,3
7. Errors and omissions 13.9 1.5 -23.5 -102.6 -52.6 -49.3 -254.5
8. Monetary movements -27.4 -79,5 -308.9 -1,003.4 -1,139.2 -1,159.5 -872,8
BIN -11.9 -28.4 -263.1 -979.2 -1,112.8 -1,130.3 n.a.Pertamina -0.8 -2.5 -6.7 -24.2 -26.4 -29.2 n,a.Pertamina (to BI asdebt repayments) -14.7 -48,6 -39.1 - - - n.a.
Source: Bank Indonesia.
W14P1
'4

ANNEX II-198- al4.
Page 1 of 2
INDONESIA
COUNTR.Y ECONOMIC MEMNANDUM
Ezternal Public Debt outstanding Including Undisburmed as of December 31, 1983with Major Reported New Comitments throuth Deceber 31, 1954
Debt Repayable In Foreia Currency and Goods
Major reportedType of creditor/ Debt outstanding new corl toents
Creditor country Diaburwed Undlsburued Total Jan. 1-Dec. 31, 1984
Suppliers' creditcAustralia 1,659 85 1,744France 13,029 859 13,888Germany, Fed. Rep. of 37,892 - 37,892Japan 2,096,890 2,510,588 4,607,478 301,413Korea, Rep. of 91,778 31,421 123,199 -Netherlands 3,995 - 3,995Pakistan - 12,682 12,682Switzerland 747 - 747Unlted Kingdom 13,754 20 13,774United State. - 2,273 2,273 -USSR 1.323 305 1,628Yugoslavia 59 ,575 16 59,591
Total suppliers' credits 2,320,642 2,558,250 4,878.892 301.413
Financial institutionsAustria 23,129 2,374 25,503 35,647Belgium 70,669 52,507 123,176 -Canada 318,182 - 318,182France 379,541 577,965 957,506 36,338Cermany, Fed. Rep. of 389,344 62,133 451,477Hong Kong 734,269 - 734,269 7,597Italy 3,178 - 3,17BJapan 732,154 386,649 1,118,803 379,350Netherlads 172,666 203,583 376,249 20,005Noray 38,450 14,418 52,868 -Siugapore 455,109 3,145 458,254 -Sweden 44,208 139,050 183,258 _Switzerland 20,768 99,260 120,028United Kingdom 604,302 539,651 1.143,953 480,397Unlted States 2,366,246 422,269 2,788,515 2,791Multiple lenders - - - 750,000
Total finacialinstitutions 6,352,215 2,503,006 8,855,221 1,712,125
BondsGermany, Fed. Rep. of 73,426 - 73,426 -Japan 167,973 - 167,973Kuwait 19,141 - 19,141 -Netherlands 47,316 - 47,316Saudi Arabia 75,000 - 75,000Switzerland 226,912 - 226,912 -United Kingdom 250,000 - 250,000
Total bonds 859,768 - 859,768 -
NationallzationNetherld 116,561 - 116,561
Total nationalization 116,561 - 116,51

- 199 _ Table 4.1Pap Z of 2
INlONESIA
COUNTRY ECONOMIC MEMORANDUM
External Public Debt Oututandlng Includin Undibureed - of December 31. 1983with NIjor Reported New Cosmitmot. through December 31. 19a
Debt Repayable in Foreig!Currency and Goode
Major reportedType of creditor/ Debt outstandint new comintments
Creditor country Disbursed Undi.buraed Total Jan. 1-Dec. 31, 1984
Multilateral loansADB 568,078 1,491,302 2,059,380 790,000EEC 5,500 - 5,500 -IBRD 2,136.387 3,727,966 5,864,353 987,200IDA 762,589 164,575 927,164 -IFAD 5,083 71,450 76,533Islamic Development Bank - 8,376 8,376
Total multilateral loens 3.477.637 5,463.669 8.941,306 1,777,200
Bilateral loanAustrali - 7,671 55 7,726 43,525Austria 71,913 5,566 77,479Belgium 42,963 20,220 63,183Bulgaria 1,575 - 1,575Canada 226,152 245.991 472,143 26,892China 51,064 - 51,064Czechoslovakia 52.524 - 52,524Denmark 64,619 4,489 69,108Egypt, Arab Rep. of 2,548 - 2,548France 183,959 121,448 305,407 12,627Germny, Den. Rep. of 43,195 - 43,195Germny, Fed. Rep. of 855,427 464,476 1,319,903 138,564Hungary 13,101 - 13.101India 16,191 55,993 72,184Iran 73,660 24 73,684Italy 31,607 - 31,607 -Japan 2,952,514 1,190,010 4,142,524 359,534Kuwait 16,790 121,746 138,536Netherlands 352,362 121,983 474,345 50,070New Zealand 1,989 315 2,304Pakls tn 6,579 - 6,579 -Poland 73,775 - 73,775Romania 10,579 - 10,579Saudi Arabla 57,718 87,080 144,798 -Spain 212,574 6,584 219,158United Arab Emirate 12,242 1,733 13,975United Kingdom 7,473 69,048 76,521United States 2,312,361 732,405 3,044,766 262,164USSR 584,960 - 584,960 -Yugoslavla 94,454 4,320 98,774Multiple lenders 124,764 - 124,764
Total bilateral loans 8.559.303 3.253,482 11,812,785 893,376
Total externalpublic debt 21,686,126 13,778,407 35,464,533 4,684,114
Note: Only debts wlth an origlnal or extended maturlty of over one year are IncludedIn this table.
Source: IBRD Debtor Reporting System, based on data provided by Bank Indonesia.

ID0NESIA
ODUNTRY E0DNOHIC MNK(RANDUM
Service Payments, Commitments, Disbursezent. and Outstanding Aaounts of External Public Debt /a(USS 'W000
Debt outstanding atbeglnning of period Transactions during period Other changes
Dlsbursed Including Co dit- Disburse- Service payments Cancel- Adjuat-Y e a r only undisburmed ments ments Principal Interest Total latlons m_nt /b
Actual
1977 10,001,648 14,574,783 1,720,488 1,958,958 820,999 440,695 1,261,694 14,249 736,6871978 11,669,764 16,196,710 3,284,605 2,214,595 1,548,319 513,797 2,062,116 40,543 1,144,8591979 13,149,658 19,037,312 4,101,018 1,887,248 1,328,656 770,911 2,099,567 128,423 -478,8311980 13,277,847 21,202,420 4,277,370 2,550,504 935,337 823,134 1,758,471 118,261 25,6681981 14,971,338 24,451,860 5,266,296 2,672,846 1,052,836 994,322 2,047,158 163,286 -1,291,0141982 15,869,989 27,211,020 7,061,392 4,192,257 1,101,950 1,144,679 2,246,629 7,042 -947,4061983 18,515,124 32,216,014 5,622,011 4,965,184 1,294,859 1,255,900 2,550,759 179,341 -937,1661984 21,686,126 35,464,533 4,684,114 3,828,300 1,628,410 1,619,467 3,247,877 44,383 -1,639,438 8
ProJected
1985 22,863,311 36,836,416 - 3,624,047 1,980,216 1,597,316 3,577,532 - 833,4911986 24,461,097 34,022,709 - 3,078,317 2,093,412 1,707,845 3,801,257 - 361987 25,446,028 31,929,333 - 2,570,683 2,451,965 1,761,332 4,213,297 - 101988 25,564,753 29,477,378 - 1,771,986 2,897,171 1,729,506 4,626,677 - 181989 24,439,587 26,580,225 - 987,942 3,081,692 1,610;105 4,691,797 - 101990 22,345,850 23,498,543 - 513,373 2,900,134 1,433,116 4,333,250 - 411991 19,959,113 20,598,450 - 318,086 2,525,283 1,243,891 3,769,174 11992 17,751,920 18,073,168 - 224,333 2,326,388 1,094,294 3,420,682 - 201993 15,649,879 15,746,800 - 96,922 2,001,923 948,144 2,950,067 - 181994 13,744,895 13,744,895 - - 1,586,498 813,739 2,400,237 - 351995 12,158,432 12,158,432 - - 1,346,326 715,003 2,061,329 - 3
/a Based on debt outstanding including undisburaed an of December 31, 1983 and major transactions during 1984.
/b This column shows the amount of arithmetic Imbalance In the amount outstanding including undiabursed from one year to the next.The most common causes of imbalances are changes in ezchange rate. and transfer of debt. from one category to another ln thetable.
Source: IBRD Debt Reporting System, based on data provided by Bank Indonesia.
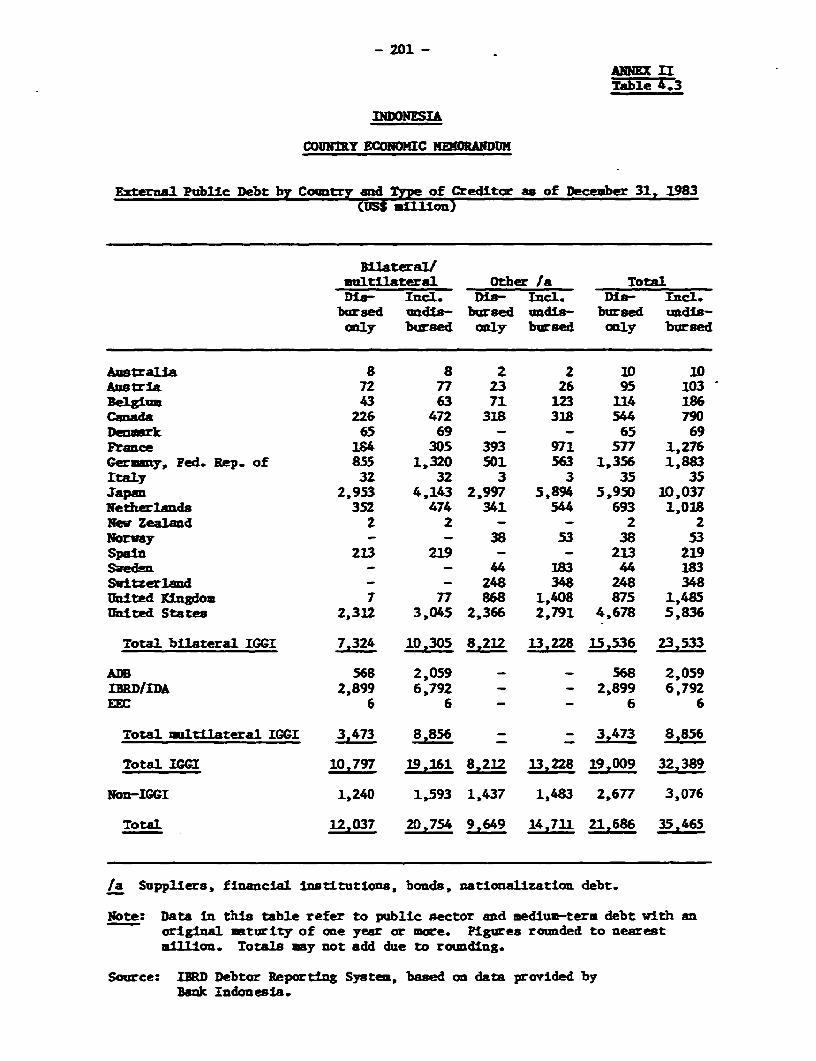
- 201 -
AU IITable 4.3
INDONESI&
COMELY ECONOMIC NEKORANDUM
External Public Debt by Coantry and Type of Creditor an of December 31, 1983CUSS mfIllI Ion)
Bilateral/mltilateral Other /a TotalDis- mci. Di- Incl. Din- Imcl.
bursed udln- bursed undis- bursed undis-only bursed only bursed only bursed
Australia 8 8 2 2 ID 10Austria 72 77 23 26 95 103Belgium 43 63 71 123 114 186Canda 226 472 318 318 544 790Denmrk 65 69 - - 65 69France 184 305 393 971 577 1,276Germamy, Fed. Rep. of 855 1,320 501 563 1,356 1,883Italy 32 32 3 3 35 35Japan 2,953 4,143 2,997 5,894 5,950 10,037Netherlands 352 474 341 544 693 1,018New Zealad 2 2 - - 2 2Norway - - 38 53 38 53Spain 213 219 - - 213 219Swed!n - 44 183 44 183Switzerland - - 248 348 248 348United Kingdom 7 77 868 1,408 875 1,485United States 2,312 3,045 2,366 2,791 4,678 5,836
Total bilateral IGGI 7.324 10,305 8,212 13,228 15,536 23,533
ADB 568 2,059 - - 568 2,059IBRD/IDA 2,899 6,792 - - 2,899 6,792EBC 6 6 - - 6 6
Total multilateral IGGI 3,473 8,856 = - 3,473 8,856
Total IG&I 10.797 19,261 8,212 13,228 19,009 32,389
Non-IGGI 1,240 1,593 1,437 1,483 2,677 3,076
Total 12,037 20,754 9J649 14,711 21.686 35.465
/a Suppliers, financial institutions, bonds, natlonalization debt.
Note: Data in thia table refer to public sector aad medium-term debt with anoriginal maturity of one year or more. Figures rounded to nearestmillioa. Totals may not add due to rounding.
Source: IBRD Debtor Reporting System, based on data provided byBank Indonesia.

- 202- ANNEX II
Table 4.4
INDONESIA
COUNTIRY ECONOMIC MEMORANDUM
Externals Public Debt as of December 31, 1983by Major Currency and Country
Amouot (t billion) Share (Z)Disbursed Total Disbursed Total
CurrencyUS dollar 9.14 U.7O 42 32Yen 5.03 7.9k 23 23DN 1.53 2.25 7 6NLG 0.69 1.02 3 3Rouble 0.58 0.58 3 2Fr. frarc 0.55 1.26 2 4Other 1.44 2.64 7 8?HLtiple 2.73 7.92 13 23
Total 21.69 34.66 1e0 100
countryJapan 5.95 9.04 27 26USA 4.68 5.84 22 17Germany, Fed. Rep. of 1.36 2.02 6 6Netherlands 0.69 1.02 3 3France 0.58 1.34 3 4USSR 0.58 0.58 3 2Other countries 4.36 5.87 20 17Multilateral organizatioms 3.48 8.94 16 26
Total 21.69 34.66 100 100
Source: IBRD Debtor Reporting System, based on data provided by BankIndonesia.

INDONESIA
COUNTRY ECONOMIC MEMORANDUM
Loan Comditnents by Country, 1975-83(US$ million)
Bilateral/Multilateral /a Other /b Total1975 1976-1977 1978 1979r 1980 1981 195Z2T§ 197S 1976 1977 1978 1979 1980 1961 1952 1983 197S-M976 1977 1978 1979 1980 19dl 1982 i9si
Australia - - - 6 3 2 - 4 - - - 6 - - - - - - - b 6 3 2 - 4 -Austria - - - - - 115 - - - - - - - - - 28 - 3 - - - - - 115 28 - 3Belgium 9 8 9 10 11 3 10 - 15 31 24 7 50 135 8 9 10 26 35 34 7 57Canada 14 224 5 61 11 - 149 40 17 - - -350 - - - - - 14 224 5 411 11 - 149 40 17Denmark - 57 - - 10 54 - - - - - - - - - - - - - 57 - - 10 54 - - -France 16 - 77 77 20 208 - 40 10 331 88 50 132 221 234 579 330 92 348 88 127 209 241 442 579 370 102Germany,Fed.Rep. of 126 13 76 86 240 162 209 272 170 3 470 - 77 396 177 79 39 60 129 483 76 162 635 339 289 311 229Italy - - - - - - - 4 - - - - - - - - - - - - - - - - - 4Japan 173 132 419 157 640 505 358 251 291 213 334 79 212 291 189 1275 933 1499 386 465 498 398 931 693 1632 1184 1790Netherlands - 89 41 - 55 113 2 95 4 310 1 - 9 37 6 40 78 214 310 90 41 9 92 119 42 173 219Nev Zealand 1 1 - - - - - - - - - - - - - - 1 1 - - - - - - -Norway - - - - - - - - - 90 - - - - - 8 - - 90 - - - - - 8 -Spain - - - - - - 316 17 24 - - - - - - - - - - - - - - - 316 17 24Sweden - - - - - - - - - - - 48 7 - - 176 - - 48 7 8 7 - - 176 -Switzerland - - - - - - - - - - - - - 153 45 - 200 4 _ _ _ - 153 45 - 200 4United Kingdom - - - - - - - 27 49 144 50 - 42 47 4 90 1045 432 144 50 - 42 47 4 90 1072 480United States 143 430 112 389 178 334 43 431 186 905 249 204 685 425 512 400 316 1009 1048 679 315 1074 603 846 443 747 1194
Total bilateralIGCI 483 953 738 816 1167 1496 1085 1176 762 2032 1281 338 1554 1592 1198 2516 3133 3362 2515 2234 1076 2369 2759 2694 3601 4309 4124
ADD 78 109 136 199 235 285 338 371 223 - - - - - - - - - 78 309 136 199 235 285 338 371 223IBRD/IDA 311 564 406 551 815 734 837 977 1210 - - - - - - - - - 311 564 406 551 815 734 837 977 1210EEC - - - - 6 - - - - - - - - - - - - - - - - - 6 - - - -
Total multilateral wICGI 389 673 542 750 1056 1019 1175 1348 1433 - - _ _ _ _ _ 389 673 542 750 1056 1019 1175 1348 1433
Total IGGI 871 1626 1279 1565 2223 2515 2260 2524 2195 2032 1281 338 1554 1592 1198 2516 3133 3362 2904 2907 1617 3119 3815 3713 4776 5656 5557Non-IGCI 200 72 103 23 28 125 212 74 54 175 154 - 143 258 440 279 1331 11 375 226 103 166 286 565 490 1405 65
Total 1071 1697 1382 1588 2251 2640 2472 2597 2249 2207 1435 338 1697 1850 1638 2794 4464 3373 3278 3132 1721 3285 4101 4277 5266 7061 5622
/a Specific loan and/or project agreements signed including official export credits. Amounts my, therefore, dtffer from donor's pledge or budgetallocation, general agreements, frame a&reements, exchange of notes and other foros of bilateral coaeitoent preceding specific comamtments. Grants areexcluded.
/b Suppliers, financial inatitutiona, bonds.
Note: Data In this table refer to public sector medium and long term loans with a maturity of one year or more. Figurea rounded to nearest million. *Totals my not add due to rounding.
Sourcel IdRD Debtor Reporting System, based on data provided by Bank Indonesia,

INDONISIA
COUNTRY ECONOMIC HNHORANDUI
1001 and Non-1G0I Disbureement, and Net Resource Transfers. 1975-83(US$ million)
Bilateral/multilateral /a Other /b TotalT975 1976 1-77 197d 1979 19o8 1981-192IT 1975 1976 1977 1975 1979 1980 1901 1982 1953 1975 1976 1977 1978 1979 1980 1981 1982 1983
Groas disbursementsBilateral IGGI 394 615 478 621 510 677 775 1061 983 1526 1323 1046 1192 852 1152 894 1955 2902 1919 1938 1524 1813 1362 1828 1669 3015 3885Multilateral IGOI 184 291 268 2 6 279 431 476 714 713 - - - - - - - - 184 291 268 216 279 431 476 714 713
Total IGGI 578 906 746 837 789 1108 1251 1775 1697 1526 1323 1046 1192 852 1152 894 1955 2902 2103 2229 1791 2029 1641 2259 2144 3730 4599
Non-IGGI - 15 122 98 37 22 112 61 49 24 89 46 88 210 269 417 401 317 24 103 168 186 246 291 528 462 367
Total groes'Ii5urseeients 578 920 867 935 826 1130 1363 1836 1746 1549 1412 1092 1280 1061 1421 1310 2356 3219 2127 2332 1959 2215 1887 2551 2673 4192 4965
Net disbursesants /cBilateral 10I 361 562 396 494 340 475 531 784 640 1300 1070 364 -114 -114 604 246 1364 2199 1661 1632 760 380 226 1079 776 2148 2839Multilateral IGCI 184 290 266 208 252 393 419 617 605 - - - - - - - - - 184 290 266 208 252 393 419 617 605
Total 10I 545 852 662 702 591 869 949 1401 1245 1300 1070 364 -114 -114 604 246 1364 2199 1845 1922 1026 588 477 1473 1195 2765 3444
Non-IWGI -31 -18 89 29 -32 -59 38 -30 -50 -36 -6 23 49 113 201 388 356 277 -66 -24 112 79 81 143 425 325 226
Total netdiT burel ents 515 834 751 731 559 810 987 1370 1194 1264 1064 387 -65 -1 805 633 1720 2476 1779 1899 1138 666 559 1615 1620 3090 3670
Net reaource transfers /dBilateral 1I00 27W 473 282 347 145 288 339 570 402 1197 875 92 -389 -562 135 -330 750 1528 1492 1348 374 -42 -417 422 9 1320 1930Multilateral ICLC 180 282 230 144 167 286 293 458 397 - - - - - - - - - 180 282 230 144 167 286 293 458 397
Total 1001 475 755 512 491 312 574 632 1028 799 1197 875 92 -389 -562 135 -330 750 1528 1672 1630 604 102 -250 708 301 1778 2327 g
Non-aICl -32 -21 79 15 -49 -75 20 -64 -77 -37 -38 14 36 87 159 304 232 164 -68 -59 93 51 38 84 325 168 87
Total net resourcetransfers 443 734 592 506 263 499 652 964 722 1160 837 106 -353 -475 293 -26 981 1692 1604 1572 697 153 -212 792 626 1946 2414
/a Excluding grants.7T Suppliers, financial inmtitutions, bonds7& Equals gross disbursement, stnus amortimation.73 Equals grose disbursements mlnus debt service.
Notet Data in this table refer to disburaements and resource transfers of public sector mdium and long term debt with a maturity of one year or more.Figures roumded to nearest million. Totals my not add due to rounding.
Sources ISRD Debtor Reporting System, based on data provided by Bank Indonesia.

- 20S -
UIX IITable 4.7
couur xCgauc IWUANDOI
S9v ht.xaal Debt Data. 2975U3 la
1975 1976 2977 1978 2979 1960 1981 192 293
- - ~~~(I DS S inf.mEtarual debt dats
iasbwreed end utatmdSln debt (DO3) lb 7 994 20 002 11 670 23 .W 13 278 -14 971 15 870 lll.SI 21 6865Jsera7zlwtturl e ?. 8 im 38 9 -w Y.w 1 . t7ff iZ 1,05 wOther Le 2990 4092 4.597 4,762 4,769 5,465 5,813 7,403 9.649
Tota debt atst atdh=. , ieladi%sdis_bbursed U_D_ lb 11 741 14 S7S 16 197 19 037 21 202 24452 27 211 32 226 35 465
DJilteraIJutiwoterel 10635 I!LU1 V W T1W lisw5 V7Other IC 4,622 5,747 5,562 6,202 7.003 7,777 9.246 12,667 14,711
Co Itumta 3 278 3 132 1 721 3 285 4 101 4 277 5 266 7 061 5 622DIil. rW eItatera1 0:Tg! ME iw BY ! IOther /e 2,207 1.435 338 1.697 1,850 1.636 2,794 4.464 3,373
Croe disbursment 2 127 2 332 1959 2 215 168B7 2 551 2 673 4 292 4 965BlaterU-ltrlal 71 7 1,83 6Other /c 1,549 1,412 1,092 1,280 1.061 1,421 1.320 2.356 3,229
Net diebursemente 1 779 1 899 1 138 666 559 1 615 1 620 3 090 3 670BilatealJilrtatellsttl 'e 'it 'Yr 7m 3W -=Ii -'Y i57R =15-Other c 1,264 1.064 387 -65 -1 805 633 1,720 2,476
Net resource transfora 1 604 1 572 697 253 -212 792 626 1 946 2 414DsI2arzen i ltEI3aEWA 1U! -l w73I p 3T 3 -zW 7w -31 :- JZ2other /c 1,180 837 206 -353 -475 293 -26 961 1,692
Puble debt *erwic 523 761 1262 2 062 2 00 1 758 2.047 2 247 2 551I_tL tSne t 7; 821 ,05 =6 2 1 29S_nter_et 157 327 441 514 7 A23 994 1,145 1,256
Public debt service 523 761 1 262 2.0 2 lD 1 758 2 047 2 247 2 551
Other le 386 574 966 1.633 1,537 1127 1,336 1,375 1,527
-lebarsemt f5(n preant)
Ir_1aboreed debtir7O lb 32 31 28 31 37 39 42 43 39miiateraijmz±iiareTh~ 17 1!t 31 ' -a ! -a 'aOthae /e 35 29 17 23 32 30 37 42 34
Cre_ diaburaemta tu 65 74 114 67 *6 60 51 59 88MlaterWilt±iatwrga 31 § -J W 17 'a 35 71 79Other /c l0 96 323 75 57 87 47 53 95
Croer daburremmta/mdlsberud debted oltJo 7d 36 34 31 28 19 21 18 23 26
iutr l/ altilrtl 21 24 20 ii 22 it IT iT itOther lc 48 46 55 48 32 37 26 30 37
_et_Sieburueita7roee 6 ua dsret 86 81 58 30 30 63 61 74 74Jlltet ra2/ltllaterml W 7 79 U I 7! 7 75 U Oter /c 82 75 35 -S - 57 48 73 77
Met r_eurce tranafarata" diabure_ants 75 67 36 7 -11 31 23 4 49BI.W LUtrL/amlrIlats£1er t7 ard 3= W ' 3Otber /c 75 59 20 -28 -45 21 -2 42 53
IS Deta In this table refer to iaul5c oector indis end lng ter lame. Loame with a mtority of legs tbhs ome yaran cr tn are not Included.
/b ftdof yar.
/C Sup1iero. flnAnetAl Inatitutiona, bonds. natlomallztlr debt.
/d Croe dlbrroeeata - a v-prentage of undlbor-ed debt (TMO-DOD) at beg,enarg of rer pla comitments drlng theyear.
Source: IfUD Debtor lap.rtfng Syata. based oc data pceordad by a n} Indoinla.

INDONESIA
COUNTRY ECONOMIC MEMORANDUM
Central Government Budget Sumar,. 1973/74 - 1985/86(Rp. b111ion)
Actual 84et1973174 1974175 1975/75 1976777 1977178 1978/79 1979/80 19B081 1951/82 1952/83 1983/84 l9B4/d5 198
1. Domestic revenue 967.7 1,753.7 2,241,9 2,906.0 3,534.4 4,266.1 6,696.8 10,227.0 12,212.6 12,418.3 14,432,7 16,149.4 18,677.9
2. Routine expenditures /a 713.3 1,016.1 1,332.6 1,629.8 2,148.9 2,743.7 4,061.8 5,800.0 6,977.6 6,996.3 8,411.8 10,101.1 12,399.0
3. Government saving (1-2) 254.4 737.6 909.3 1,276,2 1,385.5 1,522.4 2,635,0 4,427.0 5,235.0 5,422,0 6,020,9 6,048.3 6,278,9
4. Developuent expenditures 450.9 961.8 1,397.7 2,054.5 2,156.8 2,555.6 4,014.2 5,916.1 6,940.0 7,359.6 9,899.2 10,459.3 10,647.0
S. Balance (3-4) -196.5 -224.2 -488.4 -778.3 -771.3 -1,033.2 -1,379.2 -1,489.1 -1,705.0 -1,937.6 -3,878.3 -4.411.0 -4.368.1
Financed byt
6. Counterpart Eunds /b 89.8 36.1 20.2 10.2 35,8 48.2 64.8 64.1 45.1 15.1 14.9 39.5 70.9
7. Project ald 114.1 195.9 471.4 773.6 737.6 987.3 1,316.3 1,429.7 1,663.9 1,924.9 3,867.5 4,371.5 4,297.2
8. Change In balances
(- inerease) -7.4 -7,8 -3,2 -5.5 -2.1 -2.3 -1.9 -4.7 -4,0 -2,4 -4.1 0 0
/a Includes debt service payments.7E Program aid.
Source: Kinletry of Pinance.
II1

INDONIA
COUNTY ECONOMIC MEKXMNDUM4
Central Government Receipte, 1973/74 - 1985/86(Rp. M11l10a)
Actual Budnt1973174 1974175 1975176 1976/77 1977/78 1978/79 1979/80 1980181 1981/82 1982/83 1983/84 198418S 19356
Taxes an income 505.0 1 228.7 1,592.1 2,046.6 2.511.3 2'996.3 5.129.3 8,230.3 10,100.3 10,009.9 11,605,1 12 968.3 14.401.1Incom tax , 4 6,7 -42 104,6 122T . 1 164.2 207,2 28 .8 3988 577.6/e 797.3/eCorporate tax 44,2 91,2 128.2 127,2 169,5 226.5 297.1 447.6 559.1 674.5 757.4 1,873.5 Z,276.7Corporate taz on oil 344.6 473.1/a 1,249.1 1,619.4 1,948.7 2,308.7 4,259.6 7,019.6 8,627.8 8,170.4 9,520.2 10,366.6 11,139.7Withholding tax 56.8 83.3' 97.3 148.4 201,7 232,5 291.3 433.5 513.0 641,9 628.1 - -
IPEDA 19.5 28.0 34.6 42.2 52.5 63.1 71,4 87.2 94.5 105.2 132.4 150.6 167.4Other 5.5 9.8 21,2 25.2 34.3 43.3 61.8 78.2 98.7 129,1 168,2 /f /f
Taxes on domestic conuumption 165.4 158.6 231.3 319.6 397.8 491.4 537.2 732.9 888,0 16137.4 1 392.1 1.761.1 2,726,1Sales tax o19.2 in UT TW 1 U65.6 31. 476.6 575,2 95B,2 /f 1,666.Excises 61.7 74.4 97.3 130.7 181.9 252.9 326.4 437.9 544.2 620.1 773.2 727.5 963,3Other oil revenues 37.6 -15.9 -1.1 15.9 -/b -/b -/b -/b -/b -/b -/b -/b -/bMiscellaneous levies 11.5 15,2 15,9 10.7 12.r 17.Z 18.6 29.r 33., 40.7 43., 75X 96.r
Taxes on International trade 247.5 299.8 308.1 421.3 481.7 587.0 843,0 948.1 887.9 835.4 916.0 805.0 818.8Import dutieT 1 2. I; B737W UlZ 1W3 MlW7 44.0 T77 XT.9 37; THET 717.1Sales tax on Import. 50.7 68.9 72,5 102.2 114,6 125,5 137.2 195.1 223.3 231.0 255,0 -/ A/Export tax 68.6 70.3 61.6 61.7 80,2 166.2 389,1 305,0 128.4 82.5 104.0 123.6 101.7
Nontax receipt 49.8 66.6 110.4 118.5 143.6 191.4 187.3 315.7 336.4 435.6 519,5 615.0 731.9
domestic revenue 967.7 1,753.7 2,241.9 2,906.0 3,534.0 4,266.1 6,696,8 10,277,0 12,212,6 12,418.3 14,432.7 16,149.4 18.677.9
Devalopent funds 203.9 232.0 491.6 783.8 773.4 1,035,5 1,381,1 1,493.8 1,709.0 1,940 0 3 882.4 4 411.0 4,368.1Coutterpart ftmde /c fe, 0,2 10.2 358 48,2 64,8 64.1 45,1 15.1 14.9 '39 5 70.9Project aid /d 114.1 195.9 471.4 773.6 737.6 987.3 1,316.3 1,429.7 1,663.9 1,924.9 3,867.5 4,371.5 4,297..2
Total revenueo 1,171.6 1,985.7 2,733.5 3,689.8 4.307,R 5.301.6 8,077.9 11,720,8 13,921.6 14,358.3 18,313.1 20,560.4 23,046,0
/a Excludes underpayament of revenues, estimated at about Rp. 340 billion, due to the Governaent by PERTAMINA.7b Oil subsidies shown as goveranent expenditures (iee Table 5.3).7? Program aid.77 Includes commrcial bank and suppliers' credits for development programs/project.7e Since 1984/85 withholding tax neglected and combined with lncome tax,7f Clasification changed to other tax and included In mdicellaneous levies.7i Since 1984/85 clasification changed to value-added tax and tax on luxury goods.
Source: Ministry of Finance.A F

INDONESIA
COUNTRY ECONOMIC HEHORANDUM
Central Governxet ExeondLtures. 1973-74 - 1985/86(Rp. bllllon)
Actual BudRt1973/74 1974/75 1975/76 1976/77 1977/78 197837T 1979/80 1980/81 1981/82 1982183 198384 1984/35 1985/86
Personnel expenditures 268.9 420.1 593.9 636.6 893.2 1,001.6 1 419.9 2.023.3 2.277.7 2 418 1 2 757.0 3,189.5 4,117.3Wagea and salarles 17].i Xi0 'a". Tr". b7a 760.3 1',053.9 1,482.9 1,660.4 l,749.0 l,996.0 2,307.9 3,1L15,dRice allowance 50.6 59.5 111.9 114.9 126,2 132.8 179.9 252,0 253.3 289.9 346.1 415.7 482.5Food allowance 16.8 24.4 43.5 45.7 47.8 51.2 109.9 193.2 241.0 254.9 261.3 286.6 313.3Other 20.2 24.7 25.8 36.9 31.5 33.6 47,1 61.2 80.0 78.6 87.6 99.9 116.6External 7.4 9.8 12,7 14,3 14.8 23.7 29,1 34,0 43.0 45.7 66.0 79.4 89.1
Material expenditures 110.1 175,2 304.9 339,7 376.8 419.5 569.0 670,6 922.4 1 041.2 1 057.1 1 263.9 1 529.9Domestic WT B3ET 283. 3Z0,S 6 3W8.4 1z S 63-. lT1007.4 1' 007.0 1207.8 1 551.6External 11.8 16.8 21.8 18.9 18.2 21.1 29.4 32.8 31.9 33.8 50.1 56.1 78.1
Subsidies to regions 108,6 201.9 284.5 313.0 478.4 522.3 669.9 976.1 1,209.4 1 315.4 1,546.9 1 784.6 2 590.0West Irlan Jaya 16.75 W 187 1,7 21. 22.1 313,9 42,0 43,0 41, 48,2 / N2
Other regions 98.3 187.6 265.8 293.3 456,7 500.2 644.9 942.2 1,167,4 1,272.4 1,505.4 1,736.4 0
Debt 70.7 73.7 78,5 189.5 228.3 534.5 684.1 784.8 931.0 1,224.5 2 102.7 2 686.1 3 559.5Internal 198.2 6.4 6.5 24.4 7.4 8.8 3198 29,8 30.0 30.0Rxternal 62.5 67.3 71.7 165.1 220.9 525.7 647.6 754.0 915.0 1,204.7 2,072.9 2,656.1 3,529.5
Other expenditures 155.0 145.2 70.8 151.0 172.2 265.8 718.9 1 345,2 1 637.1 997.1 948.1 1,177.0 602.3Pood subsidy 153.0 !TriT 5. 39.0 - -AT. T23'. 281.6 224.0 --- T - - -Oil subsidy - - - - 65,1 197.0 534.9 1,022.0 1,316.0 962.0 928.1 1,147.0 532.3Others 2.0 4.2 20.8 112 /a 107,1 /b 25.3 59.1 /c 41.5 97.1 /d 34.1 20.0 30.0 70.0 k
Routine expenditures 713.3 1,016.1 1.332,6 1.629.8 2,148.9 2,743.7 4,061.8 5,800.0 6.977.6 6,996,3 8,411.8 10.101.1 12.399.0
Development expenditures /e 450.9 961.8 1,397.7 2,054.5 2,156,8 2,555.6 4,014.2 5,916.1 6,940.0 7.359.6 9,899.2 10,459.3 10,647.0
Total expenditures 1,164.2 1,977.9 2,730.3 3,684.3 4,305,7 5,299.3 8,076,0 11,716.1 13,917.6 14,355.9 18.311.0 20,560.4 23,046.0
/a Includes debt service transfer to PERTAMINA (Rp. 31 billion) and general election (Rp. 37 billion).7b Includes PERTAMINA subsidy (Rp. 86.4 billion).7; Includes PeRTANINA subsidy (Rp. 48.1 billion).77 Includes general electlon (Rp. 81.0 billion).7e For details, see Tables 5.4 and 5.5.7f Classification changed to wage/salary and nonwage/salary expenditures.78 Includes preparation of general election (Rp. 40,0 billion). c|
Sourcei Ministry of Finance, @|

INDONESIA
COUNTRY ECONOMIC HMKRANDUH
Development Expenditures. 1973/74 - 1985/86(Rp, bilflon)
Actual Budget1973174 1974/75 1975176 1976177 1977/78 1978)79 1979/80 1980/81 1981/82 1982/83 1953784 1984/85 19B5186
1. Departments 167.3 221.6 384.9 590.9 744.5 851.0 1,480.3 2,533.2 2,724.6 3,260.9 3,219.5 3,510.0 3,644.3
2. General INPRES programs 45.7 101.3 129.0 143,7 167.7 181.6 218.8 336.8 448.1 535,3 538.8 547.7 594.5Subsidies to provinces 20,8 T1 54,0 1.5 77 100.7 1KY 215. 23.0 YT1 Ti .0 !20.Subsidies to kabupatenn 19.2 42.5 59.1 62.4 69.1 70.9 87.1 119.4 162.6 193.9 194.1 215.9 21S.9Subsidies to Millages 5.7 11.4 15.9 19.8 23.2 23.9 31.0 50.7 70.5 88.4 91.6 92.8 98.6
3. Sectoral INPRES progran 19.2 25.0 65.1 94.1 137.0 176.0 252.0 377.2 584.5 444.2 771.2 809.7 872.8Primary schools T?T7 11:7 4. 5Us TIt. 155.8 9 374, 7TM. 549.3 I2" Wi7 5Health - 5.3 15.2 20.8 26.3 26.9 30.0 50.4 78.8 80.3 87.3 98.4 114.5Markets - - - - 1.2 1.3 12.4 2,5 6.0 4.5 10.6 10.6 11.5Replanting/afforestatten - - - 16.0 24.5 36.0 40.8 48.6 70.4 49.6 59.4 39,8 42.3Roads - - - - - - 13.0 25.9 54.8 42.4 64.6 80.1 87.5
4. IPEDA 19.5 28.0 34.6 42.2 52.5 63.1 71.4 87.2 94.5 105.2 132.4 150.6 167.4
5. Irian Jaya and East Timor 3.3 4.0 5.5 5.0 9.0 10.4 6.6 6.4 6.8 5.7 5.2 8.5 8.8
Subtotal of traasfers to 85.7 158.3 234.2 285.0 366.2 431.1 548.8 807.6 1,133.9 1,090.4 1,447.6 1,5'6.5 1.643.5 '
levels of government(2-5)
6. Fertilizer subsidy 33.0 227.2 134.5 107.3 31.8 82.6 125.0 283.6 371.4 420.1 324.2 458.7 557.8
7. Government capital 40.8 91.1 108.7 217.9 166.9 128.5 252.8 476.5 480.9 336.6 591.7 359.6 255.6participation (PMP)
8. Others 10.0 67.7 64.0 79.8 109.8 75.1 291.0 385.5 565.3 326.7 448.7 243.0 248.6
Total (1-8) 336.8 765.9 926.3 1,280.9 1,419.2 1,568.3 2,697.9 4,486.4 5,276.1 5,434.7 6,031.7 6,087.8 6,349.,
9. Project aid 114.1 195.9 471,4 773.6 737.6 987.3 1,316.3 1,429.7 1,663.9 1,924.9 3,867.5 4,371,5 4.297.2
Tsota (1-9) 4S0.9 2.37Q 2.054.5 ]. 2.555.6 .1 6.940.0 7.359.3 JfL6
Source, Ministry of Finance.
U. 1.
'.4

INDONESIA
COUNTRY ECONOKIC MZH(RANDUM
Development Expenditures by Sector, 1975/76 - 1985/86(Rp. billion)
Sector 1975/76 1976/77 1977/78 1978/79 1979/80 1980/81 1981/82 1982/83 1983/84 1984/85 1985/86Actual - Budget Budget
Agriculture and irrigation 257 356 380 450 508 929 954 931 913 1,402 1,430(of which fertilizersubsidy) (135) (107) (32) (83) (125) (284) (371) (420) (324) (459) (558)
Industry aud mlaing 124 195 139 205 356 491 827 913 2,153 926 931
Electric power 128 218 223 272 376 431 530 758 660 1,025 1,026
Transportation and tourism 312 429 355 413 466 780 807 876 1,527 1,392 1,425
Manpower and transmigration 12 27 61 95 162 326 417 436 456 675 677
Regional development 173 190 251 275 336 482 616 7U 749 810 868
Education 114 136 211 251 362 575 726 703 1,032 1,502 1,511
Health 38 48 71 79 142 218 286 259 279 253 255
l1ousing and water supply 13 30 90 56 117 191 166 151 221 433 438
General public services /a 72 114 123 225 473 700 800 785 8a" 940 971
Government capitalparticipation 115 225 190 162 466 389 389 281 234 227 229
Others /b 40 87 63 73 250 404 422 556 776 874 886
Total developmentexpenditures 1,398 2,055 2,157 2,556 4,014 5,916 6.940 7,360 9,899 10,459 10.647
Total (excludingfertilizer subsidies) 1.264 1.948 2.125 2.473 3.929 5,633 6.569 6.940 9.575 10,000 10.089
/a Law and order, defense and security, government apparatus.7b Trade and cooperatives, religion, information and science. Fros 1979/80 Includes natural resource development and
enviroment.
Sourcet Ministey of Finance.

INDONESIA
COUNTRY ECONOMIC HEMOLAMDUM
Project Aid by Sector. 1975/76 - 1985/86(Rp. billion)
1975/76 1976/77 1977/78 1978/79 1979/80 1980/81 1981/82 1982/83 1983/84 1984/85 1985/86------------ ---- -------- Actual - …--- ------ Budget Budget
Agriculture aid irrigation 43.0 106.7 145.5 135.2 154,5 223.0 135.9 101.0 155.0 529.6 472.5
Industry and mining 76.4 137.3 95,4 199.0 306.8 225.9 580.9 733.8 1,051.0 769.3 760.7
Electric power 89.7 165.2 163.9 207.8 257.2 264.9 308.2 506.0 1,182.0 729.7 826.2
Transportation and tourism 226.5 303.8 212.9 249.7 192.4 308.0 263.6 332.1 889.0 760.8 789.9
Manpower and transuigration 0.6 1.0 9.8 11.6 23.0 31.1 30.5 14.9 45.0 150.5 137.0
Regional development 0.4 1.5 7.9 7.9 18.2 23.6 16.7 2.6 7.0 42.3 25.9
Education 7.3 5.3 29.5 35.3 42.8 50.0 36.7 24.2 211,0 284.7 237.8
Health 6.9 5.9 14.8 21.7 34.4 36.2 33.6 23.7 37.0 75.5 65.4
Housing and water supply 2,8 2.9 28.1 18.3 28.1 33,0 21,7 21,2 51.0 198.8 163.8
General public services - - - 54.1 174.9 153.8 180.0 83.2 152.0 322.1 321.2
Government capitalparticipation 6.7 7.3 23.1 33.1 34.3 35.6 27.9 46.7 45.0 200.7 217.9
Others /a 11.1 36.7 6,7 13.6 49.7 44.6 28.2 35.5 42.0 307.5 278.9
Total project aid /b 471.4 773.6 737.6 987.3 1,316.3 1,429,7 1,663,9 11924.9 3,867.0 4,371.5 4,297.2
/a Since 1979/89 Includes natura resource development and environment.7T Includes commerclal credits for development programa/projects.
Sources Ministry of Finance.
U' -

- 212 -
ANNEX nTable 6.1
INDONESIA
COUNTRY ECONOMIC MEMORANDUM
Mone1 Supply, 1975-84(Rp. bllloio)
BEd of Money SuEy Curren Demand dep dteperiod Total Chnne Amount Share (Z) Amount Share Z()
k ount 2
1975 1,250 313 33 625 50 625 501976 1,603 353 28 781 49 822 511977 2,006 403 25 979 49 1,027 51
1978 482 24Qtr I 2,1U1 10 -T 1,036 49 1,075 51Qtr II 2,240 129 6 1,110 50 1,130 50Qtr III 2,370 130 6 1,156 49 1,214 51Qtr IV 2,488 118 5 1,240 50 1,248 50
1979 897 36*tr I 2,800 TE -;l 1,369 49 1,431 51Qtr II 3,005 205 7 1,493 50 1,512 50Qtr III 3,160 155 5 1,480 47 1,680 53Qtr IV 3,385 225 7 1,552 46 1,833 54
1980 1 610 48Qt I 3,797 412 12 1,774 47 2,023 53Qtr II 4,179 382 10 1,955 47 2,224 53Qtr III 4,682 503 12 2,130 45 2,552 55Qtr IV 4,995 313 7 2,153 43 2,842 57
1981 1 491 30tr I 5,214 WT 2,229 43 2,985 57
Qtr II 5,618 404 8 2,384 42 3,234 58Qtr III 5,997 379 7 2,451 41 3,546 59Qtr IV 6,485 489 8 2,557 39 3,928 61
1982 636 10Qtr I 6,775 290 17 2,541 38 4,234 62Qtr II 7,171 396 6 2,643 37 4,528 63Qtr III 7,593 422 6 2,826 37 4,767 63Qtr IV 7,121 -472 -6 2,934 41 4,187 59
1983 448 6Qtr I 7,379 25 T 3,000 41 4,379 59Qtr }I 7,505 126 1 3,284 44 4,221 56Qtr III 7,716 211 3 3,307 43 4,409 57Qtr IV 7,569 -147 -2 3,333 44 4,236 56
1984 1 012 13Qtr I 8,055 6 3,554 44 4,501 56Qtr II 8,183 128 2 4,047 49 4,136 51Qtr III 7,961 -222 -3 3,641 46 4,321 54Qtr rv 8,581 620 8 3,712 43 4,869 57
Source: Bank Indonesia.

- 213 -ANNEX IITable 6.2
INDONESIA
COUNTRY ECONONIC MEMORANDUM
Changes In Factors Affectlnx Money Supply. 197.5-84(Rp. billIon)
Claimson official
Net Net claims entities Claims on Time NetEnd of foreign on Central & public Blocked business & & savings otherperlod assets Government enterprises account individuals deposits /a items
1975 -588 162 926 -415 -298 -213 1431976 345 -334 450 -51 356 -30U -1131977 568 -274 34 67 284 -96 -1801978 678 -265 901 -77 587 -196 -1,1461979 1,655 -825 371 85 555 -516 -4281980 3,101 -1,916 488 -5 1,180 -859 -3791981 118 -560 593 36 1,756 -535 831982 -1,528 422 732 108 2,218 -723 -5931983 3,031 -1,305 61 12 2,371 -3,140 -582
1984 2.767 -2.595 190 124 3.646 -2,262 -858Qtr I 1,178 -103 -57 -3 911 -610 -830Qtr II 532 -828 -174 63 1,081 -563 17Qtr III 49 -901 287 -6 779 -514 64Qtr IV 1,008 -763 134 70 875 -575 -129
/a Includes foreign currency deposits held by residents.
Source: Bank Indonesia.

INONESIA
COUNTY ECONOIC KORANDUN
Consolidated Balance Sheet of The Monetary System, 1975-84(Rp. billion)
End of period 1975 1976 1977 1978 1979 1980 1981 1982 1983 1984
AssetaForein assets (aet) 72 417 985 1,663 3,318 6.419 6.657 5,129 8,160 10,928
Domestic credit 2 366 2 788 2,900 4 040 4 232 3 979 5 802 9,282 10.421 11.786Clam on public sector 99i 1 056 1073 - 36 -2 92 970 -262 -2 543Central govern ent ~ ;S -339 -g3! -878 - -3619 -4,179 -3,.7 -5,062 -7t657Official entities andpublic enterprises 1,411 1,861 1,895 2,796 3,167 3,655 4,247 4,979 5,040 5,230
Govervaent-blockedaccount -415 -466 -399 -476 -391 -396 -360 -252 -24U -116
Claims on private sector 1.376 1,733 2,017 2.604 3.159 4.339 6.094 8.312 10,683 14.329Loana 1,321 1,655 1,939 2,493 2,993 4,107 5,844 7,995 10,184 13,550Other claim. 55 78 78 111 166 232 250 317 499 779
LlaSll lec .ul
Liabilities
Imoort deposits 79 88 146 174 213 365 298 30u 242 218
Other items (net) 382 486 608 1,726 2,115 2,342 2,445 3,036 3,676 4,S59
Honey and Quasi money 1,978 2 631 3 131 3 809 5 222 7 691 9 716 11 075 14 663 17 937Money 1 2 4 8735i 7;3b 569 II
Currency 625 781 979 1,240 1,552 2,153 2,557 2 3 3,712Demand deposits 625 822 1,027 1,248 1,833 2,842 3,928 4,187 4,236 4,869
Quasi money 728 1,028 1,125 1,321 1.837 Z,t96 3,231 3,954 7,094 9,35O
Source: Bank Indonesia.
w 0

INDONESIA
COUNTRY ECONOIMC MOMORANZDU
Consolidated Balance Sheet of the Monetary Authorlties, 1975-84(Hp, billion)
End of period 1975 1976 1977 1978 1979 1980 1981 1982 1983 1984
AssetsForeign assets 246 620 1.057 1,652 2.62b 4,216 4,u33 3667 5,314 8JQif
Clales on Dublic sector 1 254 1 448 1,537 2,434 2.723 3,018 3,444 3,777 2 725 1.399Central governienut -2* 2539 312 509 5b0 604 86U 1,109 495 679Official entities and publicsector enterprises 886 1,209 1,225 1,9Z5 2,143 2,414 2,584 2,668 2,23U 720
Clalms on deposit money banks 565 640 81 846 1,129 1,722 2,548 3,742 4,35 6,931Other assets 80 94 25 70 158 289 536 2,068 2,379 3,464
Total assets/liabilities 2.145 2A802 3400 5,0U2 6.636 9,245 10,561 13,254 14,783 19,848
LiabilitlesReserve money 1,038 1,333 1.670 1,847 2.429 3.258 3,83b 3,997 4,888 5,473Currency outside banks andgovernaeat 625 781 979 1,240 1,552 2,153 2,557 2,934 3,333 3,712
Currency and deposlts ofbanks 382 523 623 551 780 1,058 1,199 1,010 1,496 1,709
Other deposlts 31 29 68 56 96 47 82 53 59 52
Covernmeat deposits 704 950 1,154 1,646 2,354 3,912 4,553 4,56b 5,284 7,494Other liabilities 448 518 476 1,547 1,853 2,075 2,170 4,691 4,611 6,881
Sources Bank Indonesia,
0'l

DMUSIA
COuuMY ECONOMIC MfhCmAiMM
Uukiu SYstm Credits by gemc Sector. 1975-84 Ia(Rp. bLIlicon)
Sectors 1975 1976 1977 1978/b 1979/c 1980 1981 1982 1983/d 1584
Asrlcdl,Tue 220 266 270 345 438 539 813 1 025 LA26 1.31-ili n rupih 3i 1,22E 1.3NSID. forelge -hae 8 10 5 1 2
741 1 036 1,062 1 699 1 893 1 84 1 693 1.472 800 384in rupih Ie i 176 197 2 i 3 1,8'I.7 17 -
In foreign ezchange 653 860 865 1,49 - - - - _ _
Menufacrurnlg industrY If 719 990 1.156 1 624 1,933 2.213 2.702 3.923 5.207 b66b7In rupith 31a T3i 904 t!ni;- 1,530 1,826 2,376 3.429 4.595in foreign exchange 211 251 252 359 397 387 386 494 612 402
Trade j 706 858 9131 1U4 133b 1976 3 062 4 129 5 132 ;34In rupiah 741 837 698 1.105 1,334 1,970 3,0 b, MIOIn forelCn exchange 25 21 13 9 4 6 lb 120 351 45
Servlce renderlng Industry /h 172 260 319 389 422 946 1.3S5 1.807 Z,277 3.1bIn rupiah lb -m ii 3U5 ]4W 93Y 1,38Z 1,800 Z.253 3.U88in for lgct exch - "e 6 7 8 4 4 7 3 7 24 a1
Other 132 156 219 223 244 333 444 bO 051 931-In ruplch flY 1i 218 mI 3ZI ] o3I OIn foreign ezchange 5 2 1 2 3 2 - - - 2
Total 2 750 3 566 3 937 5.394 6 268 7.874 10 159 13.022 15.299 3, 813In ruipU Id 1 , 8 §2 3 ,55U 747 .1-Z9,7 12.401 34.31Z tlS,ZZIz foreiu?zcsxne 907 1,251 1,144 1,844 410 402 405 b21 987 590
/a Credits otstandlng end of perlod. Inclndes investen credLts, flU and HUN. LIcdes interbank credits. credits toCentral Government and to no_reoldeurs, and foreign rchong compo_ent of project aid.
lb Includes foreign exchange revaluation (Rp. 681.8 bilUln).
/c Includes foreign exchange revalutio (Rp. 698.0 billion).
Id Includes foreiggL echan revaluatio (Up 251 bllin).
le Includes crdits to PEBNUhND for repayment of foreign borrowlng. Since March 1979. credit iu forelgn ezchange toEEmnAMiK has bIee cawerted to ruplh credits.
If Processing of agricultural products is cla ssfied into *anufactuxing induatry ccording to I3ternatoonal StandardIndustrial Clsaification (1SIC 2968). Starting 1980. credtts for constroction wh1ch were previously lncluded InsanufActuring industry are now Included ln wervice rendering industry.
/ Includes credits for food procurement and hotel projects.
lh Credits for elctriclty, g asd weter wupply Is ncluded ervice rendering industry sector.
Source: Bank Indonesia.

- 217 -
AM= II
COUNY ECOIEONC IOCANDUN
Bonklng Systes Credilts by Type of lank. 1975-64 /sURp. biJi_
Sectors 1975 1976 1977 1978Jb 19 7 9 /c 1980 1981 1982 1983/A 1984
Bank Indonesia (directcredltc) 7d 893 1.22 1229 1,935 2 163 2.454 2.649 2 771 2 356 870I- rupih 356 ,3 24454 2,649 z,77 M n 4In foreign exchange 649 861 864 1,469 - - - - - -
State com ercll banks (e 1 602 2 007 2 267 2 832 3.270 4 295 5 881 8.031 9.787 13.345In rupiab 743,958 S 7,7 8,910 I2,959In foreign exchange 204 233 209 283 312 341 358 557 877 386
National private banks /f 133 197 257 36S 493 71 1.081 1.554 2 3,552lu ruplab ]z[ 197 254 i 466 7U5 1,069 1,534 2,279 3,4e0In forelsgnexchange 2 0 3 6 27 6 12 20 15 72
ForeigL banks 122 150 184 r6Z 342 414 548 666 862 1.046In ruplih 70 93 116 176 271 359 5313 622 767 914In forelg exchange 52 57 68 86 71 55 35 44 95 132
Tota 2 2.750 3.5 3 937 5 394 6 268 7 874 10 159 13 022 15 29Y 1b,813in rupiah 1,843 2,415 2 73 0 S 8 9 754 , 1 18,223In forelgn exchange 907 1,151 1,144 1,844 410 402 405 621 987 590
/a Credits outstandin at end of period. Includes investment credits, EX and KInd. Excludes lnterbank credits,credits to Central Government and to non-residents, and foreign exchange component of project ald.
/b Inludes foreigz excbhnge revaluatlon (Rp. 681.8 billion).
/c Includes foreign exchange revaluation (Rp. 625 billion).
/d Excludes liquidity credits but ifcludes credits to Perctniaz for repayment of foreign borrowlag.
/e rcludes state development bank.
If Caombned national prlvate banks and local development banks.
Include foreign ebcange revaluatlon (Rp. 251 blln.
Source: Bank Indoneia.

- 218 -
ARME IITable 6.7
INDONESIk
COUNTRY ECONOMIC 0MORhNDUN
Small-Scale Invetatut Credits andPermanent Working Capital Credits, 197S84
(Rp. b i'lon)
Small-scale Permanent workinginvestmet credits la capital credits /a
Number of Approved Out- Number of Approved Out-applications value standing applications value standing
Year approved - (Rp billon) - approved (Rp billion)-('O00) ('0008)
1975 17 28 22 24 29 19
1976 28 50 36 166 67 41
1977 40 74 50 322 115 62
1978 55 106 65 420 177 84
1979 72 163 99 644 305 154
1980 115 314 210 890 569 321
1981 167 528 353 1,242 1,062 635
1982Qtr I 176 571 374 1,298 1,178 704Qtr II 184 608 387 1,342 1,300 770Qtr III 193 648 400 1,383 1,378 784Qtr IV 200 685 405 1,423 1,454 791
1983Qtr I 213 723 414 1,486 1,542 815Qtr II 218 749 409 1,531 1,627 845Qtr III 222 778 411 1,553 1,697 872Qtr IV 225 799 393 1,592 1,798 858
1984Qtr I 228 825 387 1,621 1,861 867Qtr II 231 882 380 1,658 1,961 865Qtr III 238 872 376 1,718 2,073 886Qtr IV 241 898 359 1,749 2,136 882
/a CuLrlative as of end of period.
Source: Bank Indonesia.

INDNESIA
COUNTRY ECONOMIC MIKOLUDUM
Medium-Ters Investbent Credits b Ecanomc Sector. 1975-84 /a(Rp. .1L ion)
1975 1976 1977 1978 1979 1980 1981 1982 1983 1984 /c
Credit *proved /b 255.066 320 002 352 324 438,353 566 233 879,743 1. 238 000 I 866 000 3.213 000 3.584.000A&riculture t34034 44,434 61,824 80,601 108U750 151,739 212,'000 277,000 S13:0i0 572,000HanufacturingIndustry 108,658 130,264 143,782 154,174 189,132 265,454 431,000 812,000 1,309,000 1,4600000#loin8 154 5,296 5,296 5,142 5,277 5,245 37,000 40,000 76,000 85,000Comunication endtourism 960763 125,465 125,920 177,271 248,320 4180018 503,000 656,000 1,165,000 1,300,000Others 15,137 14,543 15,502 21,149 14,754 39,287 55,000 81,000 l50,000 167,000
Credit outstandiog 177 788 246 156 278 180 332 492 396 987 554 834 816 000 1.227 000 1,740 000 21042 000Agricultute 26:95t 38:922 52;072 67T12i 73:179 92 299 143 000 Ig9;00 2'5:0T G -375;006manufacturingIndustry 78,306 94,066 105,754 115,190 140,247 176,889 256,000 505,000 669,000 785,000Hla a ag 143 4,278 3,277 2,122 1,222 219 25,000 31,000 43,000 51,000Ca _unleatlon andtourism 62,222 99,985 106,556 133,630 172,420 257,532 357,000 437,000 665,000 736,000Others 10,260 8,905 10,521 14,262 90919 28,892 36,000 55,000 78,000 95,000
/a Excludes uall-scale investment credits end permanent votking capital credits.
/b Cumulative as of end of period. Excludes repayments.
/c Provisional figures as of June 1984.
sources Dank Indonesia,

- 220 -
AmCI1I
COUNTY BCCNOiIC MUORAUDNh
Time Iepoitm vith State Baksn. 1975-84(Rp. million)
Non-tIterbank resident
3 time time24 18 12 m onths Total deposlts deposits
End of mouth *outbc Months mouths 4 la" Jl b lb
1975 335.476 1D,281 27,372 9,212 3,971 386,312 5,065 4691976 517,568 3,987 48.500 25,082 16,575 611,712 14,466 8621977 604,925 1,896 33,559 40,967 20,869 691,846 i3,480 974
1978qtr 1 615,913 S99 34,621 34.308 1,477 686,918 13,997 486Qtr II 622,049 45 39,000 44,632 1,865 707.591 13,615 451Qtr III 623.876 - 39,491 55,700 2,226 721,293 13,306 21bQtr IV 608,971 - 42,115 51,718 3,808 706,612 12,840 190
1979Qtr I 608.194 - 36,259 58,304 5,121 707,878 14,479 170Qtr II 616,609 - 30.191 55,489 5,811 708,101 15,441 156Qtr III 615,288 - 28,939 64,927 2,768 711.922 15,915 161Qtr iv 607.017 - 29,871 74,693 3,822 715.403 16,230 1,104
L980qtr I 610.360 - 31,726 75,312 7,106 724,504 19,589 1,012Qtr I1 616,849 - 34,086 72,020 2,639 725,594 19,379 628Qtr III 646,050 - 36,248 64,826 3,724 750,848 20,600 526Qtr IV e56.215 - 34,447 38,747 4,988 734.447 19,888 559
1981Qtr I 692,309 - 33,502 24.918 Z,918 753,647 16,149 5b5Qtr II '20,211 - 37,085 25,237 2,948 785,481 21,572 186Qtr III 748,100 - 38,900 23,300 3,500 833,800 -Qtr IV 765,200 - 42,800 18,500 2,700 829,200 - -
1982Qtr I 777,300 - 40,000 10,000 3,800 831,100 - -Qtr I1 811,900 - 36,400 8,000 2,800 859,000 - -Qtr III 819,400 - 38,500 9.100 5,900 872,900 - -Qtr IV 848,700 - 39,300 10,100 5,300 903,400 - -
1983Qtr I 848,300 - 42,300 11,600 3,600 905.800 - -Qtr II 763,200 - llL,900 119,300 129,600 1,124,000 - -Qtr III 655,800 700 417,000 210,500 297,700 1,581,700 - -Qtr IV 538,700 1,400 837,900 298,700 449,100 2,125,800 -
1984Qtr I 499,200 1,000 1,061,400 335,800 46U,500 2,357,900 - -Qtr II 374,700 1,700 1,368,800 665,500 494,200 2,905,900 - -Qtr III 292,900 1,800 1,596,400 673,000 356,400 2,920,500 - -Qtr IV 277,300 2,300 1,676,400 557,900 472,000 2,985,900 -
ls Excludes iaterbank time deposits and nonresident tlme deposits.
lb Not published after second quarter 1981.
Source: 1ak Indameia.

- 221 -
NAAI IXTable 0i.10
XNMDIUSXA
COUN!IX ICONWKIC MNDROUNIDU
Interest Rates on Deosits at Commercial lanka. 1978-83CZ p.a.)
State bank Private natlonl bank /aTADAN*S Cercf 1- time dopotots time deposits
Deand savings 18518 cats of Lan 6 24 Lesdeposits deposits vings deposits than 3 o. 32 mo. than 3 0 12 24
/b /c deposits /d 3 me. mos. /e mor. /f 3 or. Son. mor. mos. orn.
1978Hteh 3/1.8 15/6 9 6.1 6 9 15/12 10.5 13.3 16.2 18.6 20.8June 3/1.8 15/6 9 6.1 6 9 .5/32 10.8 13.3 15.8 18.0 21.2Sept-ber 3/1.8 15/6 9 7.6 6 9 15/12 12.0 13.1 15.2 17.6 21.1December 3/1.8 15/6 9 7.6 6 9 15/12 12.8 12.5 15.6 17.2 20.7
1979-arch 3/1.8 15/6 9 7.6 0 9 35112 13.9 14.8 36.0 17.2 20.3
June 3/1.8 15/6 9 7.6 6 9 35S12 12.9 15.8 15.9 17.7 19.9September 3/1.8 15/6 9 9.5 6 9 15112 13.2 lS.1 16.8 18.0 20.5Dacember 3/1.8 15S6 9 9.8 14.3 14.8 6 9 15112 16.2 16.7 18.3 19.6 19.6
3980.Mth 3/L8 15/6 9 10.0 7.0 8.8 6 9 15/12 14.3 17.2 18.5 19.5 19.8
Jime 3/1.8 15/6 9 11.6 7.0 8.8 6 9 15/12 14.2 lb. 17.8 20.1 19.3September 3/1.8 15/6 9 9.3 7.0 8.8 6 9 15/12 14.6 17.6 18.7 20.2 .9.5December 3/1.8 15/6 9 10.2 9.0 15.0 6 9 15/22 14.2 16.1 17.8 20.1 19.3
1961warh' 3/1.8 15/6 9 10.4 9.0 12.0 6 9 15/32 15.9 36.8 17.7 20.0 18.9Juna 311.8 15/6 9 10.9 13.1 15.0 6 9 15/32 16.4 18.0 18.8 20.4 19.4September 3-18 15/6 9 10.9 13.8 15.0 6 9 35132 16.2 17.2 17.8 19.5 19.4December 311.8 15/6 9 10.9 12.5 15.0 6 9 15132 15.4 17.4 LT .9 19.4 19.0
398Zmarch 3/1.8 15/6 9 31.3 22.0 12.0 6 9 15/32 15.9 10.8 18.1 19.3 38.6Jue 3/1L8 15/6 9 12.5 12.0 10.0 6 9 15)12 lb.7 17.4 18.3 19A* 27.9September 3/1.8 15/6 9 L2.5 9.0 9.8 6 9 l5/12 2b.7 17.7 18.5 19.4 18.8Deber 3/1.8 35,6 9 1Z.5 9.0 10.0 b 9 15132 1b.9 37.1 18.5 19.3 15.5
1983March 3/1.8 15/6 9 12.5 12.0 9.6 6 9 15/32 17.9 17.4 18.6 39.3 19.0Jme /a 3/1.8 15/12 9 14.5 15.5 16.5 17 38 17/h 10.3 17.4 18.8 19.5 I8.8
/a Averao rate of lnterest at selected banks. Based on daly averge for the last moth of the periodthroug Aprll 3983 for private blks and may 3983 for stte banks; and of period data used thereafter.
/b UntLil February 1978, 4.SZ for dd depositg excasing &p. 50 uIlI on, 3S for smller monts. From,Mrh 3978 3S for asmtot above Rp. 50 mlUion, 1.6S for Ip. 1-50 miLion, ad individually determinedfor amonts belowRp. I million.
Ic Up to Rp. 200.000 352, 6S above Rp. 200.000, 62 above Rp. 200,000.
Id Nidpoint of rae for six mth rate.
le Sice January 3978, banks ar free to set interest rates an deposits three anthu ad lena.
/f Effective Jary 1978, 5l for amouns up to Up. 2.5 mllion ed 3Z2 for amounts above Up. 2.5 milon.
A Ceilng on the deposit Interest rate celIng at state ceills remosd on June 1, 3983.
/h Starting in Jma W3 12S legal finimum rate.
Source: lank Indonesia.

1NDONESLI
COUNTRY ECONOHIC NEHORANDUM
Principal Agricultural Products by Subsectorm, 19b6-84P'000 tons)
Product 1968 1969 1970 1971 1972 1973 1974 1975 1976 1977 1978 1979 1980 1981 1982 1983 198 /a
Food Crop.Rice 11,667 12,249 .3,140 13,724 13,183 14,607 15,276 15,185 15,845 15,876 17,525 17,872 20,163 22,286 22,837 23,961 24,701Corn 3,166 2,292 2,825 2,606 2,254 3,690 3,011 2,909 2,572 3,143 4,029 3,6U6 3,991 4,509 3,235 5,095 5,412Cae ava 11,356 10,917 10,478 10,690 10,385 1,186 13,031 12,546 12,191 12,488 12,902 13,751 13,726 13,301 12,988 11,651 14,702Sweet potato 2,364 2,260 2,175 2,211 2,066 2,387 2,469 2,433 2,381 2,460 2,083 2,194 2,079 2,094 1,676 2,G44 2,257Soya beans (shelled) 420 389 498 516 518 541 589 590 522 523 617 680 653 704 521 568 783Groundauts (shelled) 287 267 281 284 282 290 307 380 341 409 446 424 470 475 437 469 535
FisherySaltvater fish 723 785 807 820 836 889 949 997 1,082 1,158 1,227 1,318 1,395 1,408 1,491 1,600 1,670Freuhwater fish 4,11 429 421 424 433 389 388 393 401 414 420 430 455 506 507 520 549
Heat and Poultrymeat 305 309 314 332 366 379 403 435 449 468 475 486 506 596 629 671 694Eggs 51 58 59 68 78 81 98 112 116 131 151 164 173 275 297 316 329Milk (ln ultero) 29 29 29 36 38 35 57 51 57 61 62 72 78 86 117 143 170
Cash CropsRubber 735 777 802 804 804 844 817 782 857 844 884 898 1,002 1,046 899 1,230 1,107Palo oil 181 189 217 248 269 290 348 397 431 473 532 642 701 748 884 907 1,038Coconut/copra 1,133 1,221 1,208 1,149 1,311 1,237 1,341 1,375 1,532 1,518 1,575 1,582 1,759 1,812 1,723 1,607 2,015Coffee 150 175 186 196 214 150 149 160 193 194 223 228 285 295 281 302 309Tea 73 62 64 71 61 67 64 69 73 79 91 125 106 110 93 113 116Cloves 17 11 15 14 15 22 15 15 20 41 21 35 39 40 33 45 b6Pepper 47 47 17 26 13 29 27 23 37 43 46 47 37 39 34 40 41Tobacco 54 84 78 76 79 80 79 82 89 84 81 87 116 118 106 120 121Cane sugar 752 922 873 1,041 1,133 1,009 1,237 1,227 1,321 1,438 1,516 1,601 1,831 1,700 1,618 1,693 1,769Cotton - 3 3 2 1 1 3 2 1 1 1 1 1 10 15 8 40
Forestry ('000 cu a)Teakwood 468 520 568 770 597 676 620 595 480 573 475 575 500 578 692 716 450Other tifber 4,783 7,587 11,856 12,968 17,120 25,124 22,660 15,701 20,947 22,366 25,781 26,256 21,240 15,376 12,323 8,986 754
/a Prelilinary figures.
Sources Supplemat to the President'. Report to Parllament, January 1985.
*J

- 223 -
HUfl IITable 7.2
INDONESIA
COUNTRY ECONOMIC IWIANDUM
Agricultural Production of Major Crone by Type of Product, 1970-83
('000 toes)
Product 1970 1971 1972 1973 1974 1975 1970 1977 1978 1979 1980 1961 1982 1983
SuallholdereRubber 571 572 559 599 371 536 610 584 612 616 705 740 586 910Coconut/copra 1,198 1,147 1,308 1,233 1,355 1,370 1,527 1,513 1,554 1,561 1.737 1,789 1,7U7 1,592Coffee 170 178 196 140 132 144 178 151 200 209 26b 276 202 285Cloves 15 14 13 22 15 15 17 37 21 35 39 40 32 44Tea 21 24 7 14 1S 14 13 14 17 17 21 22 17 25Sugar 196 211 247 199 250 223 267 352 485 498 749 1,304 1,373 1,339Tobacco 69 69 74 69 69 74 76 72 68 73 101 103 97 111Pepper 17 24 18 29 27 23 37 43 46 47 37 39 34 40Cotton 3.0 2.0 2.0 1.1 2.9 2.4 0.9 0.9 1 1 6 10 13 0Pain oia - - - - - - - - - - - - - -
Palm kernel - - - - - - - - - - - - -
Pritvte estatesRusbber 113 114 128 309 108 109 104 107 110 1i2 1in 114 125 124Cconut/copra 2 2 3 4 6 5 5 b 21 21 22 23 11 11Coffee 6 7 6 4 7 6 6 6 7 8 6 6 6 7Cloves .* . .. 0.1 01.2 0.1 0.2 1.6 0.2 0.2 0.2 0.2 0.2 0.2Tea 9 10 7 10 11 10 11 11 15 16 17 l 16 16Su r 74 122 130 118 127 326 152 162 71 73 114 116 72 72Tobacco - - - - -
Pepper - - - - - - - - - - - - - -Cotton - - - - - - - - - - - - - -Pa- oll 70 79 1 82 U 104 326 145 147 165 168 202 206 285 28bPa_ kernel 15 l8 17 18 21 24 27 29 22 23 36 37 47 47
Government estatesJabber 118 118 121 137 138 137 142 147 162 270 186 192 189 197coconutlcopra - - - - - - - - - - - - - -
Coffee 9 11 12 6 10 10 10 10 10 11 13 13 13 10Cloves - - - - - - - - ' ' - - - -
Tea 34 37 37 43 40 46 49 51 59 92 68 70 61 72Sur 603 708 756 693 860 878 902 924 960 1,030 968 220 152 176Tobecco 9 7 5 11 8 8 11 12 13 14 15 1S 9 UPepper - - - - - -Cotton - - - - - -Palm oil 147 170 189 207 244 271 286 338 367 474 499 542 599 b21Pal kernel 33 39 42 46 52 57 56 64 72 85 90 98 110 115
TotalREber 802 904 808 845 818 782 856 836 884 898 1,002 1,046 900 1,231Cococt/cpra 1,200 1,49 1,311 1,237 1,341 1,375 1,532 1,518 1,575 1,582 1,759 1,812 1,718 1.603Coffee 185 196 214 150 149 160 194 197 223 228 283 295 281 302Clo iS 14 13 22 15 15 20 39 21 35 39.2 40 32.2 44.2Tea 64 71 51 67 65 70 73 76 91 125 106 110 94 113Sugar 873 1,041 1,133 1,009 1,237 1,227 1,321 1,438 1,516 1,601 1,831 1,700 1,627 1,5b7Tobecco 78 76 79 80 77 82 87 84 81 87 116 118 106 119Pepper 17 24 18 29 27 23 37 43 40 47 37 39 34 40Cotton 3 2 2 3 3 2 3 2 1 1 6 10 13 6Pals oll 217 249 270 289 348 397 431 483 532 642 701 748 864 9U7Pal kernel 48 57 59 64 73 81 83 93 94 108 126 135 157 102
Sources: Department of Ariculture; Supplement to the President's Report to Parliament, agust 1984; and NotaKeuangau 1983/84.

- 224 -
ANNEX IITable 7.3
INDONESIA
COUNTRY ECONOMIC MEMORANDUM
Rice - Area Harvested, Production and Yield, 1968-84
Area Average Paddy RiceYear harvested yield output output
('000 ha) (tons/ha) ('000 tons) ('000 tons)
1968 8,021 2.17 17,413 11,667
1969 8,014 2.28 18,282 12,249
1970 8,135 2.41 19,612 13,140
1971 8,324 2.46 20,484 13,724
1972 7,987 2.46 19,676 13,183
1973 8,403 2.59 21,801 14,607
1974 8,509 2.64 22,464 15,276
1975 8,495 2.63 22,331 15,185
1976 8,368 2.78 23,301 15,845
1977 8,360 2.79 23,347 15,87b
1978 8,929 2.89 25,772 17,525
1979 8,850 2.97 26,283 17,872
1980 9,005 3.29 29,652 20,163
1981 9,382 3.49 32,774 22,286
1982 8,988 3.74 33,584 22,837
1983 9,162 3.85 35,303 24,006
1984 /a 9,636 3.94 37,978 2.S,825
/a Preliminary figures.
Source: BPS.

- 225 -
ANNEX IITable 7.4
INDONESIA
COUNTRY ECONOMIC MEMORANDUM
BULOG Rice Program, 1978/79 - 1983/84('000 tons)
1978/79 1979/80 1980/81 1981/82 1982/83 1983/84 /c
Beginning stock 459 708 886 1,192 1,594 911
Domestic procurement 881 431 1,635 1,953 1,933 1,208
Import: 1,268 2,580 1,213 437 506 1,115PL-480 (304) (353) (101) (46) C-) (65)Other food (15) (327) (198) (48) (-) (140)Commercial (949) (1,900) (914) (343) (506) (909)
Total availability 2,608 39719 3,734 3,582 4,033 3,234
Distribution 1,858 2,834 2,531 1,972 3,105/a 1,872Government (608) (666) (649) (806) (1,320) (1,373)State enterprises (106) (90) (89) (95) (95) (89)Market operations (1,032) (2,036) (1,646) (1,033) (1,529) (399)Other (106) (42) (147) (38) (1b1) (11)
Losses 46 8 1 16 17 28
End stock 708 886 1,192 1,594 911 1,334
Nemorandum item:Rice production /b 17,325 17,872 20,163 22,286 22,837 23,9b1
/a Since January 1982, all regions have received rice in kind; formerly,surplus regions received food allowance in money.
/b On calendar year basis.
/c Preliminary.
Source: BULOG.

- 226 -
ANNEX IITable 7.5
INDONESIA
COUNTRY ECONOMIC MEMORANDUM
Area Covered Uuder Rice Intensification Programs, 1969-83('000 ha)
Of which Of whichYear BIMAS INSUS INMAS INSUS Total
1969 1,309 - 821 - 2,130
1970 1,248 - 845 - 2,093
1971 1,396 - 1,393 - 2,789
1972 1,203 - 1,966 - 3,169
1973 1,832 - 2,156 - 3,988
1974 2,676 - 1,048 - 3,724
1975 2,683 - 1,957 - 3,640
1976 2,424 - 1,189 - 3,613
1977 2,059 - 2,181 - 4,240
1978 1,960 - 2,888 - 4,848
1979 1,571 - 3,452 - 5,023
1980 1,374 420 4,142 640 5,516
1981 1,384 587 4,802 1,119 6,186
1982 1,296 832 5,047 2,113 6,343
1983 1,401 955 5,222 2,484 6,623
Source: Supplement to the President's Report to Parliament, August 1984.

- 227 -
townsa ~ ~ ~ ~ ~ ~ ~ ~~~ani
COUINIY 2cuOIIC fOE*DVN
Quarterly ladx of kalmfctu-rl production for selected udustriel Cropss. 1979-1914 (111) /aurturly seraget 7V3- l)
wrsl *rF c 1902 tby qnrltlSU3 lb (bv qrt19e04 lbDescriptlo 1979 190 1 S1 IL 1 I III IV I 11 111
Dairy products (4) 201 234 235 197 229 202 247 244 275 281 246 221 216 1SS
Halt liquors and wlt (4) 111 129 147 IoU 149 175 177 I" 1lob n" zoU 212 aInY 2U2
Clove cigarettes (20) 120 131 LUO 1e3 107 W93 20U 175 197 200 214 2ft 2a2 219
White cigarettes (13) 131 13U 124 117 117 114 112 114 122 lUV 127 l1b lib 113
Yara and thrad (20) 111 110 126 129 124 113 11 117 113 111 117 S23 126 124
veaving except juts product. (193) 12in 12b W 137 133 123 in 110 ll1 o 18 1 *9 124 12b 1I
att C10) 117 117 99 iUo 115 111 107 104 1U2 110 lU L22 122 IlS
Ka!ttig producta C32) 77 go 89 8 82 70 79 77 02 03 4 e4 1h 2
Footwear (14) 112 130 123 124 L17 122 122 149 17* 144 145 1og 113 179
Plywood (b) ZZU 392 471 447 471 314 404 44b 439 429 439 362 374 47U
Paper Cll kinds) (8) 151 153 152 156 148 148 134 147 154 11* 109 103 1t2 lgb
Base chemcals except fertillzer (13) 124 120 127 l12 12e 129 143 132 13 137 13b IW 1Di 148
rertllixer (5) 336 400 492 510 482 201 489 554 504 571 552 @31 7uU 7e3
Paint. varnIshes. Lacquers (7) 98 115 15S 1e8 1"4 1be 172 132 141 11 ISa 150 1l5 175
Hatches (7) 139 179 18S 194 Z15 232 Z78 324 305 Z71 205 3jo 100 345
Tires sad tubes (12) 227 257 3U1 342 Zob 25b z20 30N ill 3 27 2b4 3U5 311
Classw md gis products (17) 171 200 257 234 220 19 1U 223 223 223 241 242 229 241
Cent (10) 314 307 392 407 421 42U 429 415 451 472 21 404 442 424
Iron snd *teal (15) 43 1.034 1.248 1,031 947 784 1,.11 1,127 1.11 1.117 1.223 1,232 1,1Z3 1,111
Structural metal products (24) 154 172 lUI 183 118 207 19b 2W0 195 20 203 217 Z12 17
Dry-c*lUbstteril (12) 180 220 231 236 247 255 331 341 343 285 343 315 3U2 306
Electroale And comm_lctlan equpment (1b) Z30 340 340 344 330 30e 345 338 37U 37U 3Z5 2e3 287 3UU
Motor vehileas Assembly (17) 117 194 n5 262 Zi 109 233 20 139 225 lO 112 152 1"
Notorcycleus and three-weel motor vehicles (5) 75 114 1l1 14 139 1b7 219 197 1ll 103 111 94 1u 7b
GeCral Index 158 194 214 213 2ll 210 220 217 223 224 22b 230 238 235
/s lmed on Laspeyxe formula.
/b PreIlAaIsry flgures.
Note: Figures withlI brackets in -flscriptioe colut indicate the number of astab.llhsents covered In that group.
Source: Biro PSit StatiatiL.

INDONESIA
COUNTRY ECONOMIC MEMORANDUM
Production of Minerals, 1973-84
Tin Copper ore Nickel Iron sand NaturalYear Petroleum concentrate concentrate ore Bauxite Coal concentrate Gold Silver gas
(mln bbls) -- - ('000 tons) -- (kg) (kg) (mcf)
1973 488.5 22.6 125.9 867.3 1,229.4 148.8 280.9 352.1 9,371.9 186.1
1974 501.8 25.7 212.6 878.9 1,290.1 156.2 365.2 265.3 6,464.6 202.2
1975 476.9 25.3 201.3 801.1 992.6 206.4 353.0 330.1 4,754.7 222.2
1976 550.3 23.4 223.3 828.9 940.3 182.9 292.3 355.2 3,397.5 312.1
1977 615.1 25.9 189.1 967.9 1,301.4 230.6 311.5 255.9 2,831.9 542.8
1978 596.7 27.4 180.9 1,206.7 1,007.7 264.2 233.3 253.9 2,506.4 820.1
1979 580.4 29.4 188.8 1,551.9 1,051.9 278.6 79.9 170.0 1,644.6 998.4
1980 577.0 32.5 186.9 1,537.6 1,249.1 304.0 62.9 247.9 2,196.0 1,045.7
1981 584.8 35.2 188.5 1,543.2 1,203.2 350.4 86.6 183.1 2,000.2 1,123.7
1982 488.2 33.8 223,7 1,640.9 700.2 481.0 144.5 222.7 3,057.9 1,111.9
1983 490.5 26.6 205.0 1,298.0 777.9 485.7 124.9 259.5 1,793.7 1,186.4
1984 /a 259.8 10.3 92.7 586.9 442.7 348.7 45.1 142.6 926.6 700.5
/a Up to second quarter.
Source: Department of Hines and Energy.
01-4

- 229 ANEX-
Table 8.3
DWCURESIA
COUNT ECONOMIC I0ORANUN
Crude Oil Productlon by Company. 1969-1984('000 bbl.)
Productlon AverageContract of vork sharing daily
P.ERTAHII LENIGAS CaLtex C&T Stanvac Subtotal contract Total output
1969 35,298 376 217,912 - 17,365 235,277 - 270,951 7421970 35,535 465 257,877 - 17,674 275,551 - 311,552 8541971 34,776 575 262,846 - 22,951 285,979 4,524 325,673 8921972 37,697 369 303,826 - 27,173 330,999 26,516 395,581 I,0l1973 38,543 431 351,528 1,035 22,768 375,331 74,231 488,530 1,3391974 40,143 362 329,907 1,959 16,626 348,492 112,840 501,838 1,3751975 32,590 306 300,879 1,944 13,889 316,712 127,247 476,855 1,3061976 31,333 268 304,616 1,803 12,787 319,206 199,512 550,319 1,5081977 30,706 285 292,950 2,459 11,974 307,383 277,812 616,186 1,6881978 31,273 195 275,349 2,266 11,853 289,468 275,762 596,698 1,6351979 30,316 213 266,048 1,856 10,811 278,715 271,203 580,447 1,5901980 29,891 205 258,325 2,046 11,577 271,948 274,971 577,015 1,5771981 29,515 176 255,515 1,799 13,141 27U,454 284,694 584,839 1,6001982 27,374 196 175,928 1,422 13,214 190,564 270,055 488,189 1,354
1983: 27,443 233 - - - 223,967 238,848 490,491 1,342January 2,306 21 12,376 65 1,064 13,505 22,089 37,921 1,223February 2,052 19 7,136 66 952 8,154 18,225 28,450 1,016Ntrch 2,285 22 13,711 80 1,083 14,874 19,367 36,548 1,179April 2,226 23 18,352 146 1,042 19,540 20,190 41,979 1,399maya /. 2,280 21 - - - 21,896 19,168 43,366 1,399June 2,281 20 - - - 20,890 18,877 42,068 1,402July 2,328 18 - - - 21,475 20,123 43,944 1,418August 2,294 17 - - - 21,913 19,479 43,703 1,410September 2,185 18 - - - 21,085 18,670 41,958 1,399October 2,245 18 - - - 21,763 19,875 43,901 1,416November 2,155 18 - - - 21,924 19,530 42,627 1,421December 2,805 18 - - - 17.948 23,255 44,026 1.420
1984:January /b 2,766 19 - - - 463 40,964 44,218 1,42bFebruarj 2,564 16 - - - 424 38,336 41,340 1,427March 2,692 16 - - - 4b6 41,314 44,490 1,435April 2,529 18 - - - 477 39,862 42,886 1,435may 2,619 19 - - - 489 40,834 43,961 1,418June 2,467 18 - - - 459 40,006 42,950 1,432July 2,458 17 - - - 476 40,499 43,45U 1,402
/a Since May 1983, contract of work data have been consolldated.
/b Since Znuary 1984, data of Caltex have been excluded from the contract of work and they havebeen Iciluded in the production sharing contract.
Source: BPS.

INDONESI
COUNmY ECONONIC HUIRANDUK
Petroleum Products - SuDPlY and Dennd. 1970-04(HillLon bble)
1970 1971 1972 1973 1974 1975 1976 1977 1978 1979 1980 1981 1982 1983 1984La
Production of crude 311,6 325,6 395.6 488.5 501.8 476.9 550.3 615,1 596,8 580,4 577.0 584.8 488,2 454.5 431.5Crude impoats 0.8 2.8 2.7 1.9 2.7 2.6 7.7 29.7 31.1 30.5 32.9 37,0 22,0 25.7 36,.
Subtotal 312.4 328.4 398.3 j90,4 504.5 479.5 558.0 644.8 27.8 610.9 609.9 621.8 510.2 450.2 408.3
Crude *xports 228.1 239.6 299.1 269.5 378.9 363,1 449.5 485.3 472,0 410,8 370,8 383.4 320.9 330.2 329.1Crude available for reflneries 84.3 88.8 96.2 120.9 125.6 116.4 108.5 159,5 155,8 200,2 231,2 238.4 189.3 150.0 139.2Changea In crude stocks(decrease - -) 0.6 -1.2 -4.3 1.0 0.7 2,9 -4.8 7.3 -5,0 14.2 38.3 44,7 6.7 48.2 42,4
Refinery inputs (including swaps) 83.7 90.0 100.5 119.3 124.9 113.4 113.7 153.8 159.5 186.0 192.9 193.7 182.6 198.2 181.6
Refinery consumption 7,5 7,6 7.7 8.0 7.7 6.7 6.4 11,2 9,4 13.0 13,5 6,5 6,5 7*2 7.2
Refinery output 76,2 82.4 92,8 111,8 117.7 106.7 107.3 142.6 150.1 172.0 179.4 187.2 170.1 191.0 174.4
Export of refined products 36.3 33.6 46,0 56.S 45,1 30,6 36.3 S1.4 40.3 49.4 53.4 49.9 39.0 43.3 57.9Waxy residues 27.2 32.5 39.7 53.8 41.3 32.6 35.2 42.1 36.3 48.9 51.0 77 M.7 40,5 -437Buinker fuel, avtur, etc. 9.1 1.1 6.4 2.7 3,8 4.1 6.b 9.3 4,U 0,4 2,4 2.0 5.3 2.8 14.2
Available for domestic conoumotlon 39.9 48.8 46.8 55.3 72.6 70.1 71.5 91,2 109.8 123.7 126.0 I3LWO 137.1 147.7 116.5
Product Import 2,1 4.2 8.6 11.9 12,8 15.0 30.4 18.3 10.9 15.0 22.0 42.6 28.0 23.5 2.5
Total supply 42,0 53.0 55.6 67.2 85,4 85,1 101.9 109, 126,7 138,7 148,0 179.9 165.1 171.2 119.0
Domestic consumption 39,2 44.2 50.7 58,6 67,9 77,5 87.7 98.5 113,0 134.3 141.8 156.0 161,1 159,9 143.5
Changae In refined *tocks 2.4 8.8 4.9 8.6 17,5 7.6 14.2 11.0 13,7 4,4 0.2 23.9 4.0 11.3 2,1
/a Up to November 1984.
Sources HIOA9.
UN

INDONES1A
COUNTRY ECONOH1C EWI0RANDUM
Domeatic Sales of Petroleum Products. 1971-84 /a('000 bDls)
1971 1972 1973 1974 1975 1976 1977 1978 1979 1980 1981 1982 1983 1984
Aviation as 144 118 123 139 139 143 128 134 134 130 110 1U3 85 72
Aviation turbo 961 1,200 1,658 2,150 2,579 2,758 2,913 3,494 3,656 4,355 4,869 4,899 4,424 3,800
Premium gasoline 100 201 359 496 661 706 710 728 b18 466 392 238 244 518
Regular gamoline 10,409 10,779 11,757 12,787 14,284 15,606 17,356 19,608 21,295 23,321 25,048 25,709 24,309 24,817
Kerosene 18,927 20,697 23,146 26,769 30,623 33,259 36,880 41,717 45,457 48,975 52,497 51,778 48,133 45,198
Rotor diesel 6,895 9,027 11,838 14,524 18,023 22,749 27,041 31,709 34,595 40,116 44,737 48,918 49,409 48,056 w
Industrial diesel 2,364 2,676 3,488 4,022 4,673 5,429 6,239 6,744 7,581 7,829 9,391 9,311 1U,U70 10,044
Fuel oil 4,095 5,379 7,924 8,755 7,844 8,222 10,296 11,061 13,626 15,739 17,587 19,341 22,293 21,587
Total 43.895 50.077 60,293 69,042 78,826 88,872 101,563 115,195 126,902 140,931 155,231 lbO.297 154,973 154,092
/a Excluding lubricating oil and other products.
Source: Department of Xines and Energy.
1U,

-232 -
AI=m iiTable 9.1
ADONSI -
aonm oainc D.umo
indonesi C Dmm Prie md 7. b79-rusE 395(IndeZ: April 1977MrCh 3978 - hIDU
Index I ChmaneFood lusing Cloth Other al Food lousin Clothing Other General
Welght a (46) (24) (31) (39) (100)
1.979 141.1 140.9 168.2 137.7 143.1 22.9 lb 22.1 lb 33.2 /b 20.8 lb 23.3 lb3980 165.6 168.7 390.8 lS9.1 167.6 19.1 U.0- 13.0 18.b - 18.51951 179.3 182.3 398.2 368.8 179.8 372 TT 3 3. 3
1982 January 184.5 194.9 200.0 181.9 188.3 2.9 6.9 0.9 7.8 4.7February 383.7 198.4 200.2 183.7 189.3 -0.4 1.8 U.1 1.0 0.5March 183.4 200.1 200.3 183.9 189.6 -0.2 0.9 0.1 0.2April 182.4 200.7 200.2 24.6 189.5 -0.5 0.3 - 0.4 -0.1May 182.8 201.3 200.9 184.8 189.9 0.2 0.3 0.3 0.1 0.2June 183.4 202.0 202.0 184.9 190.5 0.4 0.4 0.6 0.1 0.3July 186.5 203.0 204.1 186.4 192.6 1.7 0.5 1.0 0.8 1.1August 183.8 203.2 203.8 187.5 191.7 -1.5 0.1 -0.2 O.b -0.5September 816.3 205.0 204.5 187.1 193.4 -1.4 0.9 0.3 -0.2 0.9October 389.2 208.0 204.8 189.0 195.8 1.6 1.5 0.2 1.0 1.2November 390.4 208.9 205.1 189.3 196.7 0.6 0.4 0.1 0.2 0.4December 192.7 209.8 205.0 189.3 197.8 1.2 0.4 0 0 U.O
Total 7.3 14.3 3.4 11.8 9.7
1983 January 195.6 223.2 205.3 209.4 206.9 1.5 6.4 -0.1 10.0 4.6February 392.1 229.7 204.9 210.3 207.2 -1.8 2.9 -0.2 0.4 0.1March 189.7 228.8 204.6 220.6 204.0 -1.2 -0.4 -0.2 0.1 -0.oAprLl 294.8 233.2 207.8 216.6 211.0 2.7 2.0 1.6 2.8 2.4May 197.9 234.4 209.2 217.0 212.8 1.6 0.5 0.7 0.2 0.9June 205.2 234.9 220.2 217.2 216.2 3.7 0.2 0.5 0.1 1.6July 208.2 235.3 212.1 217.7 217.9 1.4 0.2 0.9 0.2 U.8August 207.2 235.4 212.4 219.4 217.8 -0.5 0.0 0.1 o.a -September 210.5 236.5 213.0 229.5 219.6 1.6 0.5 0.3 0.1 0.8October 209.7 237.1 223.2 220.1 219.6 -0.4 0.3 0.1 0.3 -November 209.7 238.0 213.7 221.4 220.2 0.0 0.4 0.2 0.6 0.3Decezber 212.7 238.1 214.0 221.5 221.5 1.4 0.0 0.2 0.0 0.6
Lotal 10.0 12.9 4.3 16.3 11.5
1984 January 219.8 250.6 214.5 227.2 229.1 3.3 5.3 0.2 2.5 3.4February 222.6 259.9 214.9 227.7 232.9 1.3 3.7 0.2 0.2 1.7March 220.5 263.9 225.1 229.8 233.4 -0.9 -1.5 0.1 0.9 0.2April 221.2 265.6 215.7 240.3 236.5 0.3 0.7 0.3 4.6 1.3May 224.3 265.9 216.0 240.9 238.0 1.4 0.1 0.1 0.2 0.7June 225.3 266.1 217.5 240.9 236.7 0.5 0.1 0.7 0.0 0.3July 225.9 267.3 218.8 241.7 239.6 0.3 0.5 0.6 0.3 0.4Anugst 223.2 267.9 239.7 244.1 239.2 -1.2 0.2 0.4 1.0 -U.2September 222.5 268.0 239.8 244.6 239.0 -0.3 0.0 0.0 0.2 -0.1October 221.5 268.5 220.3 246.0 239.1 -0.4 0.2 0.3 0.6 0.0November 220.9 269.5 220.5 246.4 239.1 -0.3 0.3 0.1 0.1 0.0December 226.4 270.0 220.6 246.5 241.6 2.5 0.2 0.0 0.0 l.u
Total 6.3 12.8 3.0 10.9 8.8
1985 January 227.1 272.4 220.8 247.2 242.8 0.3 0.9 0.1 0.3 0.5February 223.9 272.9 220.9 247.4 241.5 -1.4 0.2 0.0 0.1 -0.5March 224.3 273.5 221.1 248.1 242.1 0.2 0.2 0.1 0.3 0.2
/a Aritbmatlc average of weights for 17 cities.
lb March-December annualized rate.
Source: BPS.

INDONESIA
COUNTRY ECONOKIC MESOEANDUM
Wholesale Price Indices In Indonesia. 197S-84 /a(1975 100)
1975 1976 1977 1978 1979 1980 1981 1982 1983 1984 /b
Agriculture 100 123 144 162 213 262 302 336 382 430Food crops 100 125 142 154 201 257 304 361 430 492Commercial crops 100 130 167 195 251 268 285 289 331 380Livestock 100 115 133 152 201 268 315 330 349 384
Mlning & quarrying .100 113 130 144 175 218 266 311 339 370
Mhanufacturing 100 115 128 139 178 210 234 257 301 339 1
Imports 100 103 108 118 153 174 191 201 243 270 w
Exports 100 103 116 127 246 375 414 43U 514 580Nonoll exports 100 117 148 171 303 365 360 371 513 608
General Index 100 110 122 134 195 254 283 302 357 401
General Index excludingexports of petroleum 100 113 124 136 176 208 243 263 315 35S
/a Average for year.
/b Average January - November 1984.
Source: BPS, Indikator Ekonomi.
'.0

INDONESIA
COUNTRY ECONOMIC MFKORANDUM
Domestic Prlces of Petroleum Products, 1972-85(Rp. /liter)
1972 1973 1974 1975 1976 1977 1978 1979 1980/a 1981 1982/b 1983/b 1984/b 1985/c
Aviation gas 35 40 50 62 70 70 70 100 150 150 240 300 300 300
Aviation turbo 30 40 50 62 70 70 70 100 150 150 240 300 300 300
Premium gasoline 40 45 55 67 90 90 90 140 220 220 360 400 400 400
Regular gasoline 35 41 46 57 70 70 70 100 150 150 240 320 350 350
Kerosene 10 11.5 13 16 18 18 18 25 37.5 37.5 60 100 50 50
motor diesel (solar) 14 16 19 22 25 25 25 35 52.5 52.5 85 145 220 220
Industrial diesel 8.5 9 13 19 22 22 22 30 45 45 75 125 200 200
Fuel oil 6.5 7.5 12 19 22 22 22 30 45 45 75 125 200 200
/a From May 1980.
/b Prices increased In January.
Lc Excludes value added tax.
Source Kcas. USA

- 235 -
C IITable 10.1
ZINDOESIL
COUN7TR ECOOMIC NEORANDUH
Approved Foreign luveotuent by Sector, 1977-83 /a
TotalSector 1977 1978 1979 1980 1981 1982 1983/b 1977-83
Agriculture 21.4 3.0 16.2 55.9 25.0 15.9 13.0 150.4
Forestry 28.5 38.6 12.1 8.2 3115.2 57.2 8.7 268.5
Flobery 2.7 23.1 21.1 2.9 21.6 b.2 3.7 81.3
Minin & quarryng 200.5 38.1 65.5 3.0 28.5 22b.4 19.0 581.0
Naufacturlng 327.4 274.8 1,157.7 772.6 835.0 1.213.3 1,751.6 7.212.5
Food 8.3 5.5 60.7 14.2 40.5 6.0 11.9 147.2Teitiles & lecther 70.8 114.6 33.6 77.4 138.6 4b.1 112.4 593.5Wood & wood products - 1.0 6.0 10.8 123.6 5.7 12.9 100.0Laper & paper product. 9.7 0.4 11.2 2.3 48.5 - 724.0 796.1Chemical. & rubber 49.3 25.4 63.9 282.0 36.4 340.4 202.0 1,499.5Nonmetallic minerals 98.3 19.7 76.7 222.1 20.2 60.5 44.0 541.5Basmc metals 18.4 9.9 561.1 0.4 84.8 3.6 881.0 1,559.2Metal products 72.16 92.0 44.5 1.629 142.4 750.7 643.3 1,905.6Other - 6.2 - 0.7 - - - 6.9
Construction 0.8 5.4 0.5 7.7 48.8 39.3 73.4 175.9
Trade & Wholesale 7.0 9.7 3.0 38.6 - 19.2 77.9 155.4
Wbolesale trade - - - - - 2.2 - 2.2Hotels 7.0 9.7 3.0 38.6 - 17.0 77.9 153.2
Transport & Coamunication - - 0.2 25.1 - 17.9 0.3 43.5
Transport - - 0.2 25.1 - 17.9 0.3 43.5
Rea estate. buslness services andother services 20.2 4.4 43.9 18.2 204.9 1,086.0 400.3
L2ailLI IILI ].Jz j Ll^022.3 1-8UU4 2-SE26J2 9.o68.8
/a Intended Capltal Investment. Aaounts reprenent origlnal approval plus approved expansion minus cancellatilon.
/b Provisional figures.
Source: Bank Indonesia.

- 236 -
tatleo of rl,a vtuat br Sector. 1977-83
TotalSeetor 1977 1978 2979 1810 1981 2982 1983 /a 2977-63
ASicu.Lture 22.5 10.1 4.3 14.5 13.0 5.8 2.3 oa.5
Poreetry 22.1 15.0 19.2 26.2 34.9 11.0 2.6 131.0
Flabhry 2.8 13.5 10.5 7.9 0.4 9.0 - 44.1
indun and quarrying 20.1 57.3 47.5 49.4 70.0 32.2 17.7 294.2
AnSUf CturiDS 186.2 267.0 192.0 235.4 243.5 378.9 220.3 1,722.4
Food 3.1.9 14.9 7.1 7.4 15.8 7.1 1.2 65.4Txtila and leatber 27.9 3L4 41.7 78.7 102.5 69.7 14.1 366.0Wood and wood products 1.4 0.4 0.1 2.3 2.2 23.9 8.b 36.9Paper nd4 paper products 9.6 11.8 1.4 6.1 2.5 1.6 - 33.0Cbendcals and rubber 28.0 71.7 44.8 32.0 44.5 1b4.9 110.5 496.4Noometallc islurale 42.9 9.0 3.2 30.0 30.9 49.4 15.9 181.3JaJe metals 27.8 37.8 47.5 23.9 7.9 28.5 54.0 227.4Metal ptrducts 35.4 89.9 36.0 52.0 35.3 33.8 15.8 298.2Others 1.3 0.1 10.2 2.0 1.9 - 0.2 15.7
Coutructloa 3.0 1.4 12.0 0.8 0.6 6.9 - 24.7
Trade 4 Natal. 6.2 17.2 4.3 0.4 2.9 - 0.2 31.2
1hol0sale trade - 0.7 - - 2.5 - 0.2 3.4Hotels 6.2 16.5 4.3 0.4 0.4 - - 27.8
Tran- port & ComounIcatioR 2.0 4.7 21.9 4.6 1.3 = - 34.7
Trnsaport 1.8 L3 0.1 2.1 0.2 - - 5.5Con5eLcation 0.2 3.4 21.8 2.7 1.1 - - 29.2
Rea estate. busnes s ces and 3.9 19.0 6.9 7.2 22.4 6.1 3.8 59.3otbor *ezvsce
Z9t l ~ 254 318.6 346. 9~. *2 4
Ia PrelSolanry e*timtes.
Soure : lank Indonesia. cI!

- 237 -
ANN IITable 10.3
INDONESIA
COUNTRY ECONOMIC EORANDUI
Approved Domestic Investment by Sector. 1977-83 /a(Rp. billion)
1977 1978 1979 1980 1981 1982 1983
Agriculture, fisheriesand livestock 49 100 39 30 60 62 477
Forestry 80 59 80 115 175 93 106
mining 64 18 33 55 13 52 57
Manufacturing 392 522 580 1,093 306 1,419 4,552Textile 75 1 56 74 129 178 298Chemicals 99 103 141 162 193 205 733Other manufacturing 228 61 319 857 1,177 1,241 3,421
Construction - 5 4 8 16 198
Hotel 4 12 13 10 54 76 282
Real estate 35 15 6 16 5 74 169
Others 20 24 18 35 70 143 203
/a Intended capital investment, comprising original approvals plus approvedexpansions minus cancellations.
/b Preliminary estimate.
Source: Bank Indonesia.

THAILAND 10 nr
B.Id. Aomh0
BRUNEI " 'MALAYSIA BRUNEI
: S.bolsao0 / MALAYSIA )
SINGAPORE f-L _ /
-~~ -~ L,...~~ YmTping Pi.onu
, ~~~~~~~~~~~~~~~A^A iV 4f A N rACNA
JO-6 0~~,~ 0 P<d - -- -- '
Tanj a p' o / -
PROVINCES 0 bbMToNG / 2d
omD. ACEH. 2 SUMATERA UTARA o -
3 SUIATERA IARAT4 niAi 5 .in.'6 SIMATERA SELATAN7 SENGKULU
8 LAWPG OT_WP_Wu6 9 D.I. JKARTA
10 JAWA BARAT 911 JAWA TEN H T JJAKA 4,12 0.D. VOGYAKARTA W413 JAWA TAR OC°AU
14 BU mI 0 ; oh _ !
15 NUATIENGGARA KARAT16 NUSATENGGARA TiMuR17 iRIAN jAA y 14
1B MALUKU h2 '19 RJLAWESt UTARA 12 4 /20 SULAWESI TENGHAH 21 SJLAWESI TENGARA
22 SULASI SELATAN23 KALIMAAITAN TIMUR24 KALIAJTAN SELATAN25 KALIMANTAI TENGA26 KALIUNTAI .*RAT
27T RIOR TIMUR
100' loo 112

IBRD 1103BRIPCI174' 130 3
PHILIPPINES r I N DON ESI A
o CITI ES OR TOWNSRIVERSPROVINCIAL BOUNDARIES
- - INTERNATIONAL BOUNDARIES
:~~~~
HAIMAHERA
: I
\. z ( } 0a8I
S2U t A Wf S I ~> \ 18 \
SU2 A WESI KEPULAUAN SU SA Fok&oC0
0 Wag.,
22 - SERAM NobM no,atol|
UURU IRIAN(V0
JArA
Koke..@ W..k - ISO~~~~~~~~~~~~~~~~~~~~ N Ckeo Aeo0thO\
ooubou , fA 0
.1
p i ORES
./ I b Aio.buoa.;} 0 100 200 300 *00
s - ( *10 MILE I
SUAVA rW TAR MLaES
Kwang 0 100 200 300 *00 500
0 ~ ~ ~ 0TI, 1g. boo rw. b~ Tllr Wo0 R_.0 do .. o.. I,. U'. f-zr 0 I * I I
124' 130' 136b
APRIL 19.85