Individual Mediators of a School-based Social-Emotional Learning Intervention: Using Instrumental...
14
Individual Mediators of a School-based Social-Emotional Learning Intervention Society for Research in Child Development Biennial Meeting Philadelphia, PA. March 2015 Using Instrumental Variables Estimation to Examine Mechanisms of Change Andres Molano¹ Stephanie Jones² Joshua L. Brown 3 J. Lawrence Aber 4 1 Universidad de los Andes 2 Harvard University 3 Fordham University 4 New York University Andres Molano – Universidad de los Andes 1
Transcript of Individual Mediators of a School-based Social-Emotional Learning Intervention: Using Instrumental...
Individual Mediators of a School-based Social-Emotional Learning Intervention
Society for Research in Child Development
Biennial Meeting
Philadelphia, PA. March 2015
Using Instrumental Variables Estimation to Examine Mechanisms of Change
A n d r e s M o l a n o ¹ S t e p h a n i e J o n e s ²
J o s h u a L . B r o w n 3 J . L a w r e n c e A b e r 4
1 Universidad de los Andes 2 Harvard University3 Fordham University 4 New York University
Andres Molano – Universidad de los Andes 1
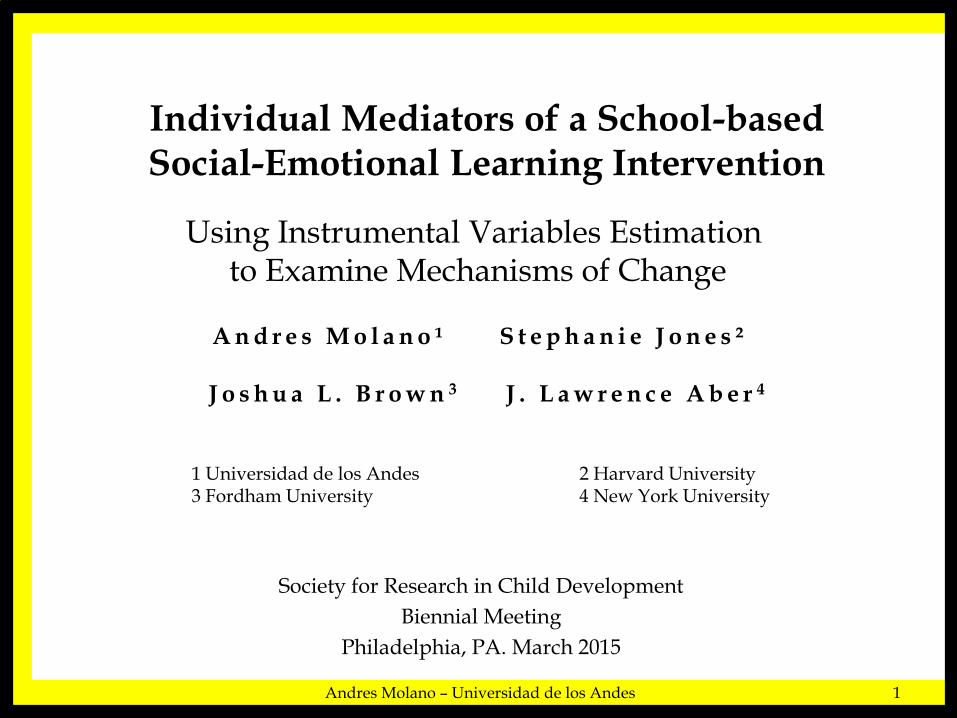
Rationale• Ecological and developmental mechanisms represent
processes whereby school-based interventions achieve their goals. – Classroom climate (VanderWeele, Hong, Jones & Brown, 2013)
– Peer processes (Osgood et al., 2013; Molano et al., 2013)
– Social-cognitive processes (Dodge et al., 1986; Jones et al., 2010, 2011)
• Consequences for how social-emotional learning interventions may spread:– Across levels of a nested system
– Among domains at the same level
– Across different systems or generations.
• Effects may be different for children with different characteristics – E.g., behavioral, socio-economic, and community risks.
These issues pose important challenges for the empirical identification of effects.
Andres Molano – Universidad de los Andes 2
Andres Molano – Universidad de los Andes 3
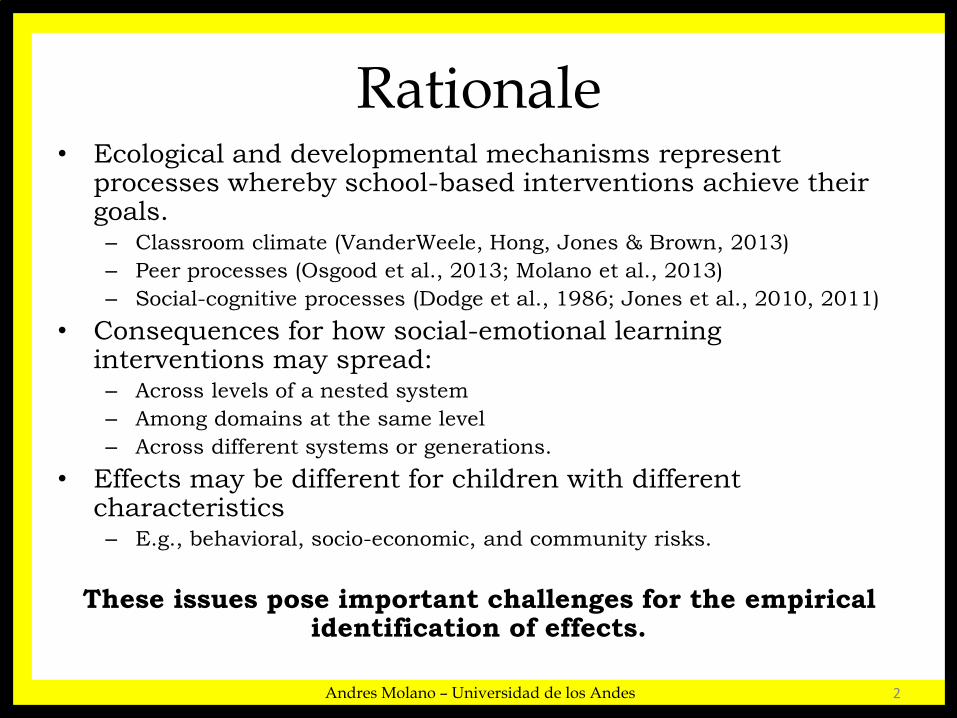
NYC Study of Social and Literacy Development (Jones, Brown & Aber, 2010, 2011)
4Rs
Experimental vs.
Control
Teacher
Development
Extended
Opportunities &
Supports
Social-Emotional
Skills &
Behaviors
Literacy Skills &
Academic
Achievement
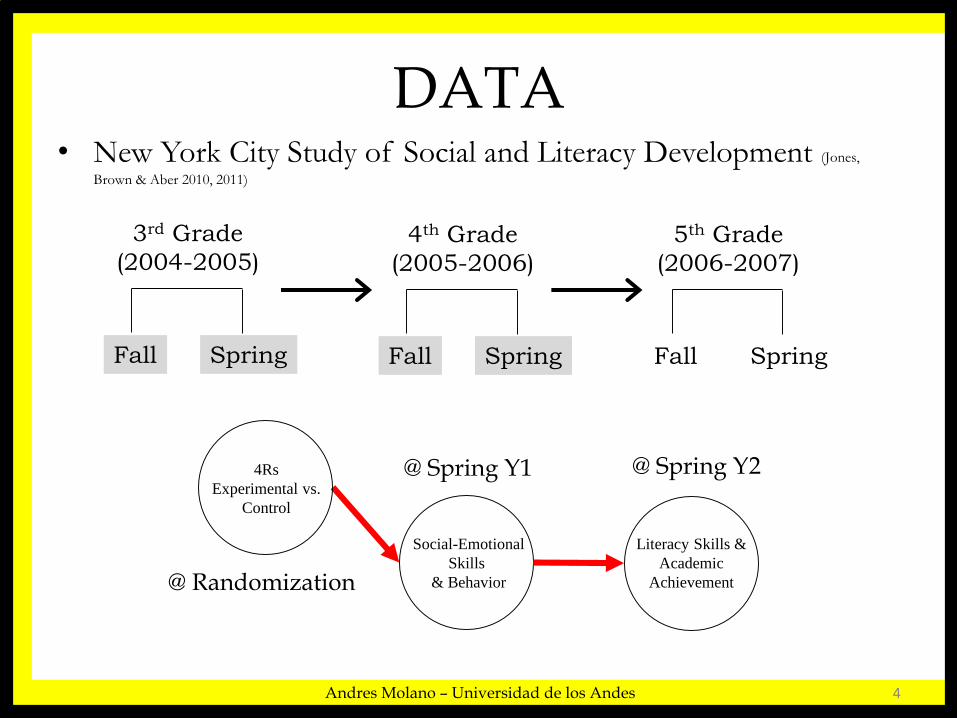
DATA
Andres Molano – Universidad de los Andes 4
• New York City Study of Social and Literacy Development (Jones,
Brown & Aber 2010, 2011)
3rd Grade
(2004-2005)
Fall Spring
4th Grade
(2005-2006)
Fall Spring
5th Grade
(2006-2007)
Fall Spring
4Rs
Experimental vs.
Control
Social-Emotional
Skills
& Behavior
Literacy Skills &
Academic
Achievement@ Randomization
@ Spring Y1 @ Spring Y2
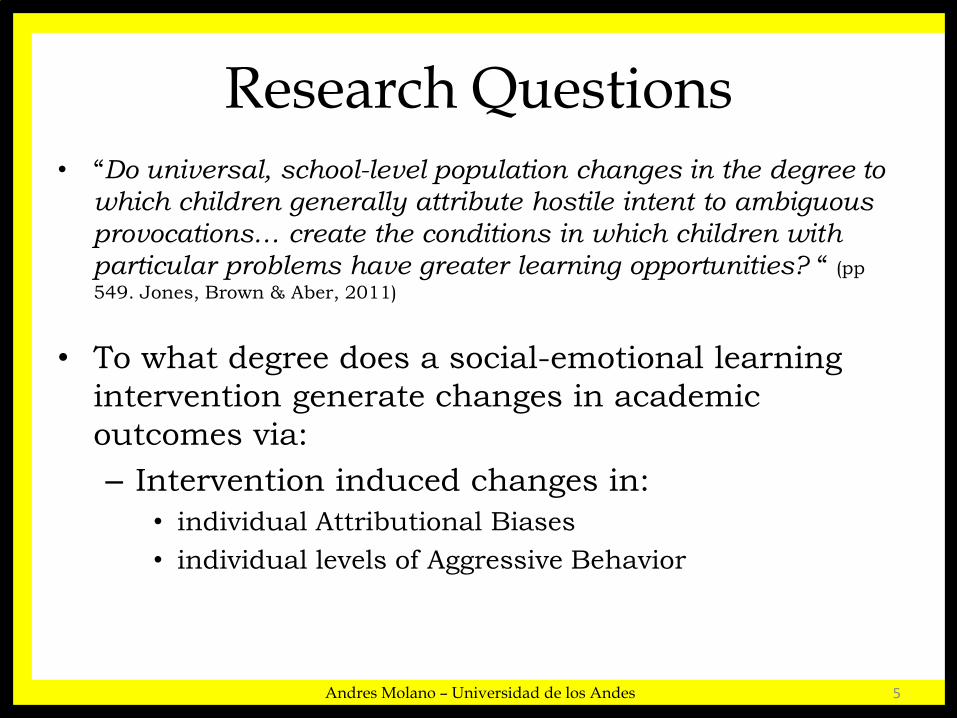
Research Questions• “Do universal, school-level population changes in the degree to
which children generally attribute hostile intent to ambiguous
provocations… create the conditions in which children with
particular problems have greater learning opportunities? “ (pp
549. Jones, Brown & Aber, 2011)
• To what degree does a social-emotional learning
intervention generate changes in academic
outcomes via:
– Intervention induced changes in:
• individual Attributional Biases
• individual levels of Aggressive Behavior
Andres Molano – Universidad de los Andes 5
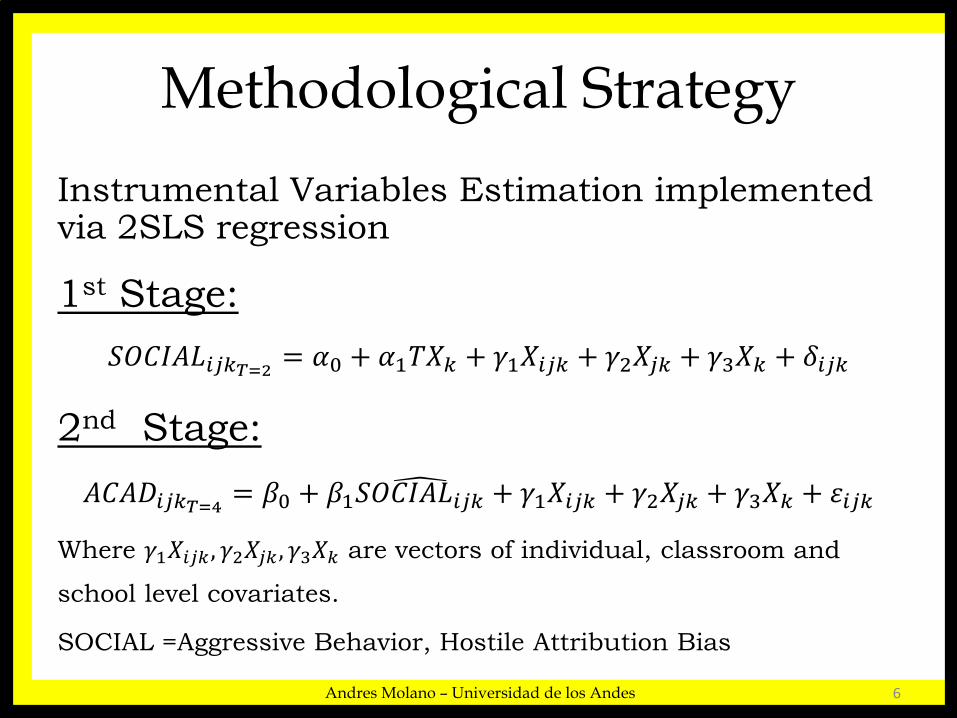
Methodological Strategy
Instrumental Variables Estimation implemented via 2SLS regression
1st Stage:
𝑆𝑂𝐶𝐼𝐴𝐿𝑖𝑗𝑘𝑇=2 = 𝛼0 + 𝛼1𝑇𝑋𝑘 + 𝛾1𝑋𝑖𝑗𝑘 + 𝛾2𝑋𝑗𝑘 + 𝛾3𝑋𝑘 + 𝛿𝑖𝑗𝑘
2nd Stage:
𝐴𝐶𝐴𝐷𝑖𝑗𝑘𝑇=4 = 𝛽0 + 𝛽1 𝑆𝑂𝐶𝐼𝐴𝐿𝑖𝑗𝑘 + 𝛾1𝑋𝑖𝑗𝑘 + 𝛾2𝑋𝑗𝑘 + 𝛾3𝑋𝑘 + 휀𝑖𝑗𝑘
Where 𝛾1𝑋𝑖𝑗𝑘 , 𝛾2𝑋𝑗𝑘 , 𝛾3𝑋𝑘 are vectors of individual, classroom and
school level covariates.
SOCIAL =Aggressive Behavior, Hostile Attribution Bias
Andres Molano – Universidad de los Andes 6
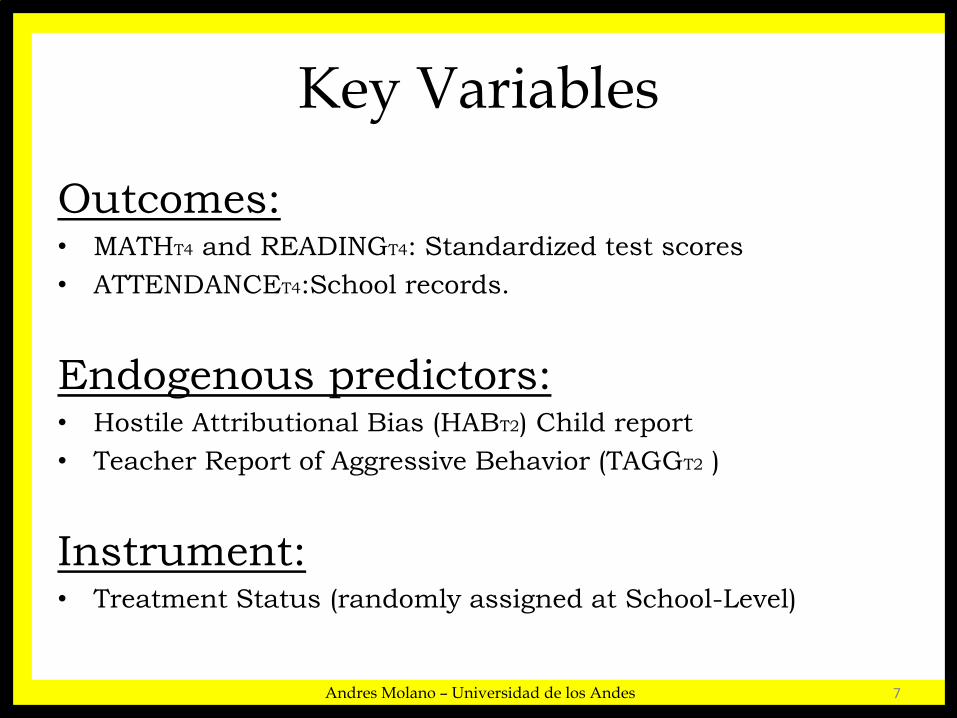
Key Variables
Outcomes:• MATHT4 and READINGT4: Standardized test scores
• ATTENDANCET4:School records.
Endogenous predictors:• Hostile Attributional Bias (HABT2) Child report
• Teacher Report of Aggressive Behavior (TAGGT2 )
Instrument:• Treatment Status (randomly assigned at School-Level)
Andres Molano – Universidad de los Andes 7
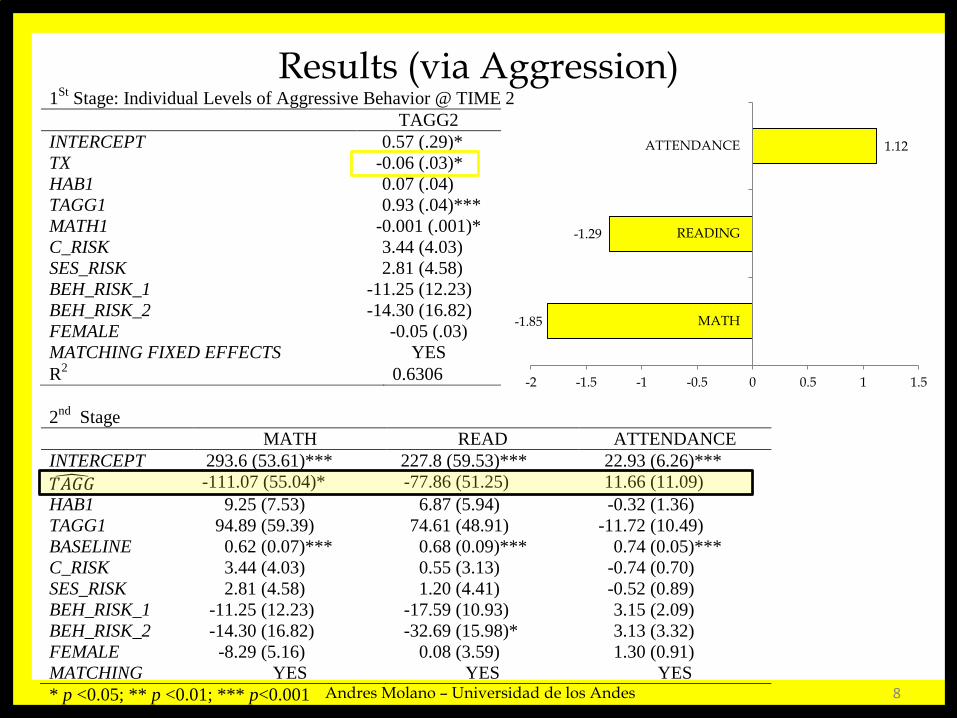
1St
Stage: Individual Levels of Aggressive Behavior @ TIME 2
TAGG2
INTERCEPT 0.57 (.29)*
TX -0.06 (.03)*
HAB1 0.07 (.04)
TAGG1 0.93 (.04)***
MATH1 -0.001 (.001)*
C_RISK 3.44 (4.03)
SES_RISK 2.81 (4.58)
BEH_RISK_1 -11.25 (12.23)
BEH_RISK_2 -14.30 (16.82)
FEMALE -0.05 (.03)
MATCHING FIXED EFFECTS YES
R2 0.6306
2nd
Stage
MATH READ ATTENDANCE
INTERCEPT 293.6 (53.61)*** 227.8 (59.53)*** 22.93 (6.26)***
𝑇𝐴𝐺𝐺 -111.07 (55.04)* -77.86 (51.25) 11.66 (11.09)
HAB1 9.25 (7.53) 6.87 (5.94) -0.32 (1.36)
TAGG1 94.89 (59.39) 74.61 (48.91) -11.72 (10.49)
BASELINE 0.62 (0.07)*** 0.68 (0.09)*** 0.74 (0.05)***
C_RISK 3.44 (4.03) 0.55 (3.13) -0.74 (0.70)
SES_RISK 2.81 (4.58) 1.20 (4.41) -0.52 (0.89)
BEH_RISK_1 -11.25 (12.23) -17.59 (10.93) 3.15 (2.09)
BEH_RISK_2 -14.30 (16.82) -32.69 (15.98)* 3.13 (3.32)
FEMALE -8.29 (5.16) 0.08 (3.59) 1.30 (0.91)
MATCHING YES YES YES
* p <0.05; ** p <0.01; *** p<0.001
Results (via Aggression)
Andres Molano – Universidad de los Andes 8
-1.85
-1.29
1.12
-2 -1.5 -1 -0.5 0 0.5 1 1.5
MATH
READING
ATTENDANCE
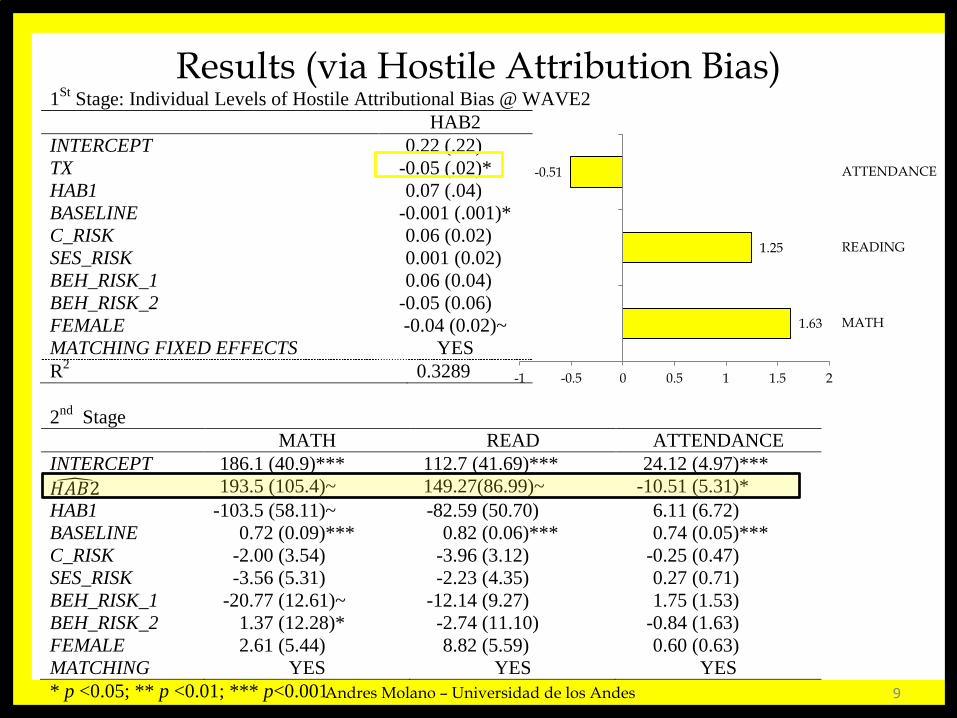
1St
Stage: Individual Levels of Hostile Attributional Bias @ WAVE2
HAB2
INTERCEPT 0.22 (.22)
TX -0.05 (.02)*
HAB1 0.07 (.04)
BASELINE -0.001 (.001)*
C_RISK 0.06 (0.02)
SES_RISK 0.001 (0.02)
BEH_RISK_1 0.06 (0.04)
BEH_RISK_2 -0.05 (0.06)
FEMALE -0.04 (0.02)~
MATCHING FIXED EFFECTS YES
R2 0.3289
2nd
Stage
MATH READ ATTENDANCE
INTERCEPT 186.1 (40.9)*** 112.7 (41.69)*** 24.12 (4.97)***
𝐻𝐴𝐵2 193.5 (105.4)~ 149.27(86.99)~ -10.51 (5.31)*
HAB1 -103.5 (58.11)~ -82.59 (50.70) 6.11 (6.72)
BASELINE 0.72 (0.09)*** 0.82 (0.06)*** 0.74 (0.05)***
C_RISK -2.00 (3.54) -3.96 (3.12) -0.25 (0.47)
SES_RISK -3.56 (5.31) -2.23 (4.35) 0.27 (0.71)
BEH_RISK_1 -20.77 (12.61)~ -12.14 (9.27) 1.75 (1.53)
BEH_RISK_2 1.37 (12.28)* -2.74 (11.10) -0.84 (1.63)
FEMALE 2.61 (5.44) 8.82 (5.59) 0.60 (0.63)
MATCHING YES YES YES
* p <0.05; ** p <0.01; *** p<0.001
Results (via Hostile Attribution Bias)
Andres Molano – Universidad de los Andes 9
1.63
1.25
-0.51
-1 -0.5 0 0.5 1 1.5 2
MATH
READING
ATTENDANCE
Robustness Checks
• Results for Aggression and Hostile Bias are consistent in
magnitude and direction when estimated for:
– child self-report of Aggression
– child self-report of Normative Beliefs about Aggression
• Results are different in magnitude (same direction) based on
different behavioral risk profiles at baseline
– High vs. Low Risk
• Internalizing behavior problems @ end of Y1 as an additional
“cognitive” channel
– first stage not statistically significant in these models
Andres Molano – Universidad de los Andes 10
Conclusions
• Effects on academic outcomes “move through” treatment-induced changes in behavior and social cognition. – Treatment induced reductions in aggressive behavior
observed at the end of Y1 of the study, “translate” into higher academic achievement.
– The opposite occurs for Hostile Attributional Bias. • TX reduces Hostile Attributional Bias, but
• In the second stage higher bias “translates” into higher academic achievement
– What portion of the variability in bias are we capturing? • TX predicted values in “bias”… could these be core skills that
facilitate academic skills development?
Social Behavior vs. Social Cognition?
In context
Andres Molano – Universidad de los Andes 11
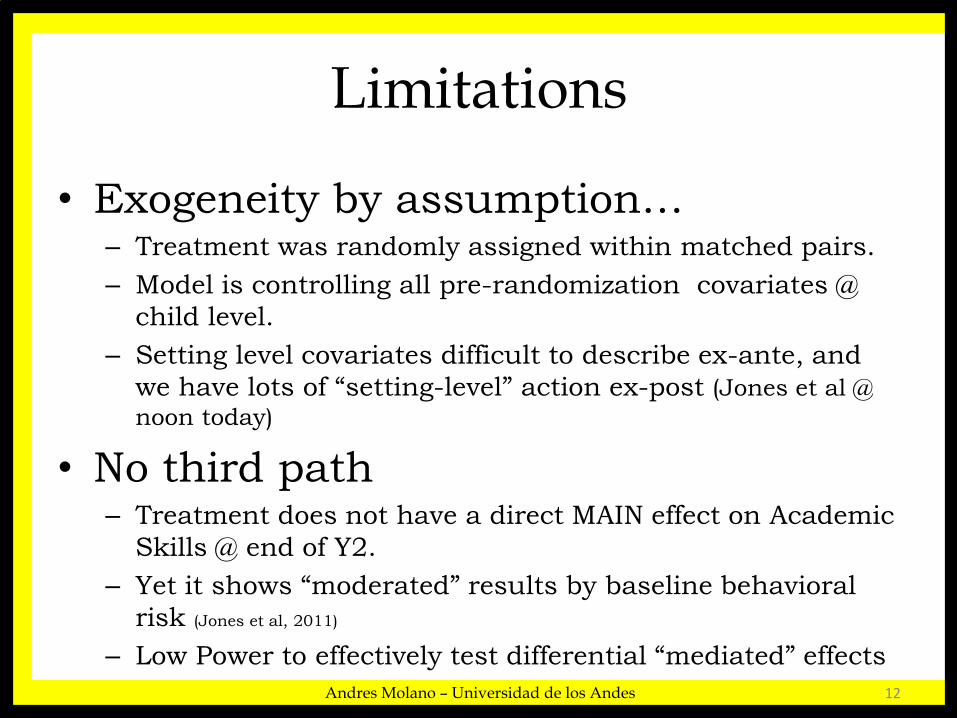
Limitations
• Exogeneity by assumption…– Treatment was randomly assigned within matched pairs.
– Model is controlling all pre-randomization covariates @
child level.
– Setting level covariates difficult to describe ex-ante, and
we have lots of “setting-level” action ex-post (Jones et al @
noon today)
• No third path– Treatment does not have a direct MAIN effect on Academic
Skills @ end of Y2.
– Yet it shows “moderated” results by baseline behavioral
risk (Jones et al, 2011)
– Low Power to effectively test differential “mediated” effects
Andres Molano – Universidad de los Andes 12
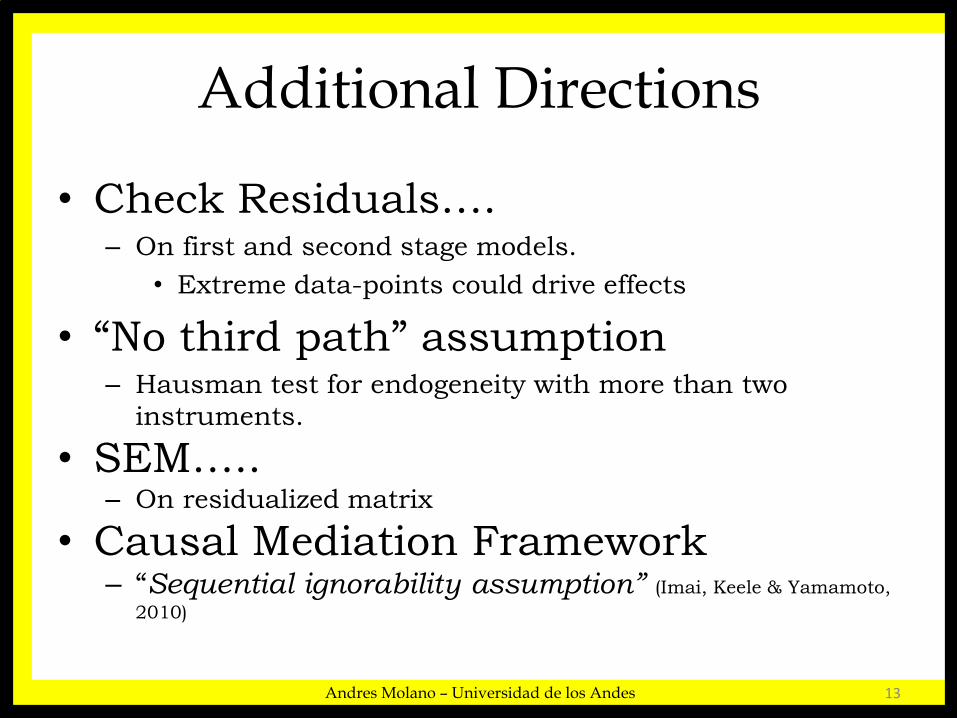
Additional Directions
• Check Residuals….– On first and second stage models.
• Extreme data-points could drive effects
• “No third path” assumption– Hausman test for endogeneity with more than two
instruments.
• SEM….. – On residualized matrix
• Causal Mediation Framework– “Sequential ignorability assumption” (Imai, Keele & Yamamoto,
2010)
Andres Molano – Universidad de los Andes 13
THANK YOU!
Andres Molano – Universidad de los Andes 14
www.andresmolano.com
www.cife.uniandes.edu.co
Andres MolanoAssistant Professor of Education