Individual evaluation of DEP, EP and AC-EOF effects on λDNA molecules in a DNA concentrator
27
Title Individual evaluation of DEP, EP and AC-EOF effects on λDNA molecules in a DNA concentrator Author(s) Yokokawa, Ryuji; Manta, Yoshihiro; Namura, Moriaki; Takizawa, Yusuke; Le, Nam Cao Hoai; Sugiyama, Susumu Citation Sensors and Actuators B: Chemical (2010), 143(2): 769-775 Issue Date 2010-01-07 URL http://hdl.handle.net/2433/95085 Right © 2009 Elsevier B.V. All rights reserved. Type Journal Article Textversion author KURENAI : Kyoto University Research Information Repository Kyoto University
Transcript of Individual evaluation of DEP, EP and AC-EOF effects on λDNA molecules in a DNA concentrator

Title Individual evaluation of DEP, EP and AC-EOF effects onλDNA molecules in a DNA concentrator
Author(s) Yokokawa, Ryuji; Manta, Yoshihiro; Namura, Moriaki;Takizawa, Yusuke; Le, Nam Cao Hoai; Sugiyama, Susumu
Citation Sensors and Actuators B: Chemical (2010), 143(2): 769-775
Issue Date 2010-01-07
URL http://hdl.handle.net/2433/95085
Right © 2009 Elsevier B.V. All rights reserved.
Type Journal Article
Textversion author
KURENAI : Kyoto University Research Information Repository
Kyoto University

Elsevier Editorial System(tm) for Sensors & Actuators: B. Chemical Manuscript Draft Manuscript Number: SNB-D-09-00800R1 Title: Individual evaluation of DEP, EP and AC-EOF effects on DNA molecules in a DNA concentrator Article Type: Research Paper Keywords: DNA concentrator, Micro Total Analysis Systems (MicroTAS), dielectrophoresis (DEP), electrophoresis (EP), AC electroosmotic flow (AC-EOF) Corresponding Author: Prof. Ryuji Yokokawa, Ph.D. Corresponding Author's Institution: Kyoto Univ. First Author: Ryuji Yokokawa, Ph.D. Order of Authors: Ryuji Yokokawa, Ph.D.; Yoshihiro Manta; Moriaki Namura; Yusuke Takizawa; Nam Cao Hoai Le; Susumu Sugiyama Abstract: Bio concentrators have been proposed to concentrate and detect tiny amount of cells, DNAs, or proteins in a microfluidic system. Concentrating processes have been experimentally studied and discussed as a result of concentration caused by multiple electrokinetic phenomena. Here, we have investigated individual electrokinetic phenomenon in a DNA concentrator to propose a design guide for a micro bio concentrator. Three dominant electrokinetic phenomena: dielectrophoresis (DEP), electrophoresis (EP), and AC electroosmotic flow (AC-EOF) are experimentally and theoretically evaluated. DNA mobility due to DEP was separately studied by utilizing quadrupole electrodes generating a uniform field gradient, which enables us to derive a DEP force on the order of 10-13 N acting on a single DNA molecule. Using the theoretical model the DEP force on the order of 10-12 N, close to the experimental result, was calculated. The EP force estimated from the average charge per base pair of DNA molecule was on the order of 10-9 N. Compared with these two forces, AC-EOF generating a flow velocity of 100~200 m/s, globally dominates the manipulation of DNA molecules throughout the concentrator. However, the three-dimensional observation of molecule distribution reveals that the EP force has a significant role in holding the DNA molecules at the electrode centre. The results not only support the proposal that the biomolecular concentrator should be designed to utilize AC-EOF and EP [1, 2], but also provide approximate estimates for the DEP and EP forces, and the AC-EOF velocity which will allow us to design a concentrator with a given experimental condition.

1
Individual evaluation of DEP, EP and AC-EOF effects on
DNA molecules in a DNA concentrator
RYUJI YOKOKAWA,1,2,3
YOSHIHIRO MANTA,4 MORIAKI NAMURA,
3 YUSUKE TAKIZAWA,
3 NAM CAO HOAI
LE4 AND SUSUMU SUGIYAMA
5
1Department of Microengineering, Kyoto University, Yoshida-honmachi, Sakyo-ku, Kyoto 606-8501, 5
Japan. Fax: 81 75 753 3559; Tel: 81 75 753 3559; * E-mail:[email protected]
2PRESTO/CREST JST, 4-1-8, Hon-chou, Kawaguchi, Saitama 332-0012, Japan
3Department of Micro System Technology, Ritsumeikan University, 1-1-1 Noji-Higashi, Kusatsu, Shiga
525-8577, Japan.
4Graduate School of Science and Engineering, Ritsumeikan University, 1-1-1 Noji-Higashi, Kusatsu, 10
Shiga 525-8577, Japan
5Ritsumeikan Global Innovation Research Organization, Ritsumeikan University, 1-1-1 Noji-Higashi,
Kusatsu, Shiga 525-8577, Japan
Keywords: DNA concentrator, Micro Total Analysis Systems (MicroTAS), dielectrophoresis (DEP), 15
electrophoresis (EP), AC electroosmotic flow (AC-EOF)
Bio concentrators have been proposed to concentrate and detect tiny amount of cells, DNAs, or proteins in a microfluidic
system. Concentrating processes have been experimentally studied and discussed as a result of concentration caused by
multiple electrokinetic phenomena. Here, we have investigated individual electrokinetic phenomenon in a DNA 20
concentrator to propose a design guide for a micro bio concentrator. Three dominant electrokinetic phenomena:
dielectrophoresis (DEP), electrophoresis (EP), and AC electroosmotic flow (AC-EOF) are experimentally and theoretically
evaluated. DNA mobility due to DEP was separately studied by utilizing quadrupole electrodes generating a uniform field
gradient, which enables us to derive a DEP force on the order of 10-13
N acting on a single DNA molecule. Using the
theoretical model the DEP force on the order of 10-12
N, close to the experimental result, was calculated. The EP force 25
estimated from the average charge per base pair of DNA molecule was on the order of 10-9
N. Compared with these two
forces, AC-EOF generating a flow velocity of 100~200 m/s, globally dominates the manipulation of DNA molecules
throughout the concentrator. However, the three-dimensional observation of molecule distribution reveals that the EP force
has a significant role in holding the DNA molecules at the electrode centre. The results not only support the proposal that
the biomolecular concentrator should be designed to utilize AC-EOF and EP [1, 2], but also provide approximate estimates 30
for the DEP and EP forces, and the AC-EOF velocity which will allow us to design a concentrator with a given
experimental condition.
ManuscriptClick here to view linked References

2
Introduction
A detector for biomolecules is a key component to achieve practical micro total analysis
systems (TAS). Biomolecules of nanometre scale cannot be easily manipulated by the same
scheme demonstrated at micrometre scales using dielectrophoretic force only. To achieve
highly sensitive biomolecule detection by manipulating target molecules, combination of
electrokinetic phenomena have been proposed by many researchers [1-4]. Dominant
phenomena are dielectrophoresis (DEP), electrophoresis (EP), and AC electroosmotic flow
(AC-EOF) [5, 6].
Dielectrophoretic force acting on a particle with an induced dipole moment is
generated by the inhomogeneous field [7]. The magnitude and direction of dielectrophoretic
force are defined by electrical properties of the particle and its surrounding medium. When
the particle is more polarizable than the medium, the force drives the particle to higher
electric field area (Positive DEP). On the contrary, when the relative polarizability is reversed,
the direction of moving particle is opposite, i.e. to the lower electric field (Negative DEP).
The time-averaged DEP force for a spherical particle is defined by
, (1)
where is the particle radius, the permittivity of the medium, the real part of
the Clausius-Mossoti factor, and the root mean square electric field.
Dielectrophoretic manipulations of micrometre and submicrometre particles have been
initiated by Washizu and coworkers [8, 9], and demonstrated for numerous applications in
recent years [10, 11]. Most of their work involves cell handling and sorting. For example,
parallel cell manipulation was achieved by an array of electrodes [12], quadrupole electrodes
[13], and spiral electrodes [14]. As cell sorting applications, cells are separated into living or
dead [15], cancerous or healthy [16], and labeled with antibody or not [17, 18]. More recently,
dielectric parameters for particles were characterized and controlled for manipulations [19,
3
20]. Particle size in such applications are in tens of micrometres in diameter, which provides
dielectrophoretic force in pN range. Such force is large enough to move each cell.
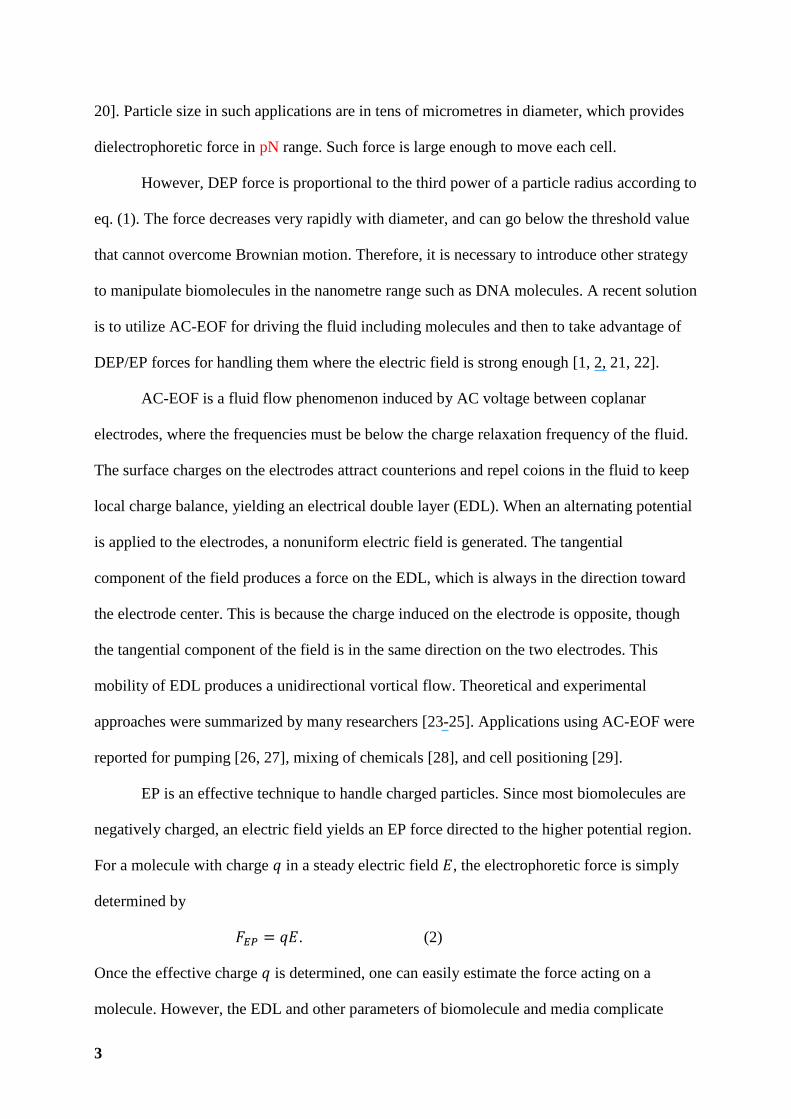
However, DEP force is proportional to the third power of a particle radius according to
eq. (1). The force decreases very rapidly with diameter, and can go below the threshold value
that cannot overcome Brownian motion. Therefore, it is necessary to introduce other strategy
to manipulate biomolecules in the nanometre range such as DNA molecules. A recent solution
is to utilize AC-EOF for driving the fluid including molecules and then to take advantage of
DEP/EP forces for handling them where the electric field is strong enough [1, 2, 21, 22].
AC-EOF is a fluid flow phenomenon induced by AC voltage between coplanar
electrodes, where the frequencies must be below the charge relaxation frequency of the fluid.
The surface charges on the electrodes attract counterions and repel coions in the fluid to keep
local charge balance, yielding an electrical double layer (EDL). When an alternating potential
is applied to the electrodes, a nonuniform electric field is generated. The tangential
component of the field produces a force on the EDL, which is always in the direction toward
the electrode center. This is because the charge induced on the electrode is opposite, though
the tangential component of the field is in the same direction on the two electrodes. This
mobility of EDL produces a unidirectional vortical flow. Theoretical and experimental
approaches were summarized by many researchers [23-25]. Applications using AC-EOF were
reported for pumping [26, 27], mixing of chemicals [28], and cell positioning [29].
EP is an effective technique to handle charged particles. Since most biomolecules are
negatively charged, an electric field yields an EP force directed to the higher potential region.
For a molecule with charge in a steady electric field , the electrophoretic force is simply
determined by
. (2)
Once the effective charge is determined, one can easily estimate the force acting on a
molecule. However, the EDL and other parameters of biomolecule and media complicate
4
direct derivation of the EP force, so the EP mobility, , of charged biomolecules
has been traditionally measured and the effective charge density then derived [30-32]. This is
because biomolecule separation by fractionating molecules according to molecular size is an
essential technique to purify target molecules. Even when the charge density was measured
using a nanopore, charge density fell in the similar range [33]. Therefore, EP force acting on a
DNA molecule can be estimated based on reported parameters. Details will follow in the
discussion section.
Due to the limited DEP effect on nanometre particles, TAS researchers have recently
developed biomolecular concentrators by AC-EOF and EP [1, 2]. Especially DNA molecules
and E. coli cells are well concentrated on a circular electrode by applying an AC potential
with DC offset. From experimental results on a DNA concentrator, Wong and Bown recently
concluded that the DNA molecules flowed to the center electrode by AC-EOF, and remained
on the electrode surface by EP force.
Such DNA concentrators have been developed based on experimental trial and error to
achieve the effective increase of fluorescent intensity. Bown and coworkers computed, by
experimental results but also by theoretical and numerical approaches, DNA mobility on the
center electrode. This represents a significant advance to help understand the concentration
phenomena, because it is important for TAS researchers to specify experimental parameters
from known material properties. For example, the concentrator dimensions, AC voltage,
frequency, media conductivity required must be specified to match the selected target
molecule. To contribute to such issues of design protocol, we separately measured DEP force
and AC-EOF velocity, and also calculated DEP and EP forces and AC-EOF velocity based on
simple theories. Such simple calculations make it possible to predict the mobility of given
biomolecules in a concentrator.

5
Material and methods
Device fabrication
Electrodes were fabricated on a glass coverslip (18 × 60 mm, No. 1: 0.12-0.17 mm in
thickness, Matsunami) by conventional photolithography processes. Indium Tin Oxide (ITO)
was spputtered to 50 nm thickness, and photoresist (S1818, Shipley) was spincoated (500 rpm
– 5 s, 3000 rpm – 30 s). After photolithography, the ITO layer was etched by an etchant (HCl:
HNO3: H2O=5: 20: 75) for 70 s using the photoresist as an etching mask. Following resist
removal by acetone, the coverslip was thoroughly washed by ethanol and deionized water
(DIW).
For DEP experiments, quadrupole electrodes were patterned to have a 10 m gap
between opposing electrodes as shown in Fig. 1a. This electrode gap is 13-fold smaller than
that reported by Watarai and coworkers [34] to yield enough DEP force on DNA molecules.
For a DNA concentrator to measure AC-EOF velocity and to achieve DNA concentration,
electrodes consisted of a centre electrode and an outer electrode, following Wong [1] and
Bown [2] (Fig. 1b). However, our experiments require smaller electrodes to visualize each
DNA molecule and to cover the whole electrode in the field of view under a 100x objective
lens. We have downsized the diameter of the centre electrode, the gap between the electrodes,
and width of the outer electrode to 55 m, 10 m, and 10 m, respectively.
Sample preparation
A blocking reagent was prepared by dissolving bovine serum albumin (BSA, A7906, Sigma)
powder in DIW. A DNA solution was prepared by mixing DNA (3010, Takara Bio Inc.,
Japan) and YOYO-1 (Y3610, Invitrogen Corp., USA). Their final concentrations were 3.8
pg/L for DNA and 0.6 nM for YOYO-1 in DEP and AC-EOF measurements, and 0.38
ng/L and 60 nM in the visualization of three dimensional DNA molecule distributions. In all

6
experiments, the buffer solution used was phosphate buffered saline (PBS) with 0.1% Tween
20, which was diluted to a conductivity of 2 mS/m.
Experimental setup
All coverslips with electrodes were coated with 1 mg/mL BSA solution before starting
experiments to prevent nonspecific adhesion of DNA molecules. DNA solutions were
confined above the electrodes by using a PDMS spacer and coverslip, providing a cylindrical
chamber 2 mm in diameter and 50 m in height. The device was placed on the stage of an
inverted microscope equipped with an oil immersion objective lens (IX71, UPLFLN 100× oil
objective, Olympus Corp., Japan). Compared with other DNA concentrators, the transparent
ITO electrodes enable us to focus on DNA molecules close to the electrode surface. In this
experimental setup we could distinguish each DNA molecule for particle tracking
velocimetry (PTV).
An AC potential was applied by a function generator (WF1943B, NF Corp., Japan)
and monitored by an oscilloscope (DPO4104, Tektronix Inc., Japan). The voltage applied was
always set to 5 Vpp between 10-m gap in both quadrupole electrodes and DNA concentrators,
resulting in a maximum field intensity of 2.5 kV/cm. Mobility of DNA molecules was
captured by an EM-CCD camera (iXon EM+ DU-897, Andor Technology PLC, Ireland).
Sequential images were analyzed with two PC-based softwares: Move-tr/2D (Library Co.,
Ltd., Japan) for tracking DNA molecules and Andor iQ (Andor Technology PLC, Ireland) for
fluorescent intensity analysis. In the fluorescent intensity measurement, data were obtained as
the average fluorescent intensity in a circular area (39 pixel=6.1 m2), where the highest
average fluorescent intensity was measured. In addition to such conventional fluorescent
imaging techniques, three dimensional distributions of DNA molecules on the center
electrode was also obtained by a confocal laser scanning system (CSU-X1, Yokogawa
Electric Corp., Japan).

7
Results and discussion
DEP in quadrupole electrodes
As proposed by Huang and Pethig [35], spatial variation of the field and DEP force factor
are derived for various electrodes. For the quadrupole electrode case, the DEP force
factor is defined as
(3)
where is the radial distance from the electrode centre, applied voltage (root mean
square), and the distance from the electrode centre (d=0~5 m in our quadrupole electrodes
shown in Fig. 1a) [34]. Polystyrene particles [36, 37], virus [38], and DNA [39] have been
handled for fundamental DEP study in the quadrupole electrodes. Assuming that the DEP
force and the Stokes drag force,
, (4)
are balanced in the quadrupole electrodes, the mobility coefficient, , is derived as [36]
. (5)
Here and are the fluid viscosity and the particle velocity, respectively. Therefore, the
velocity is found to be proportional to the particle position with proportionality constant , i.e.
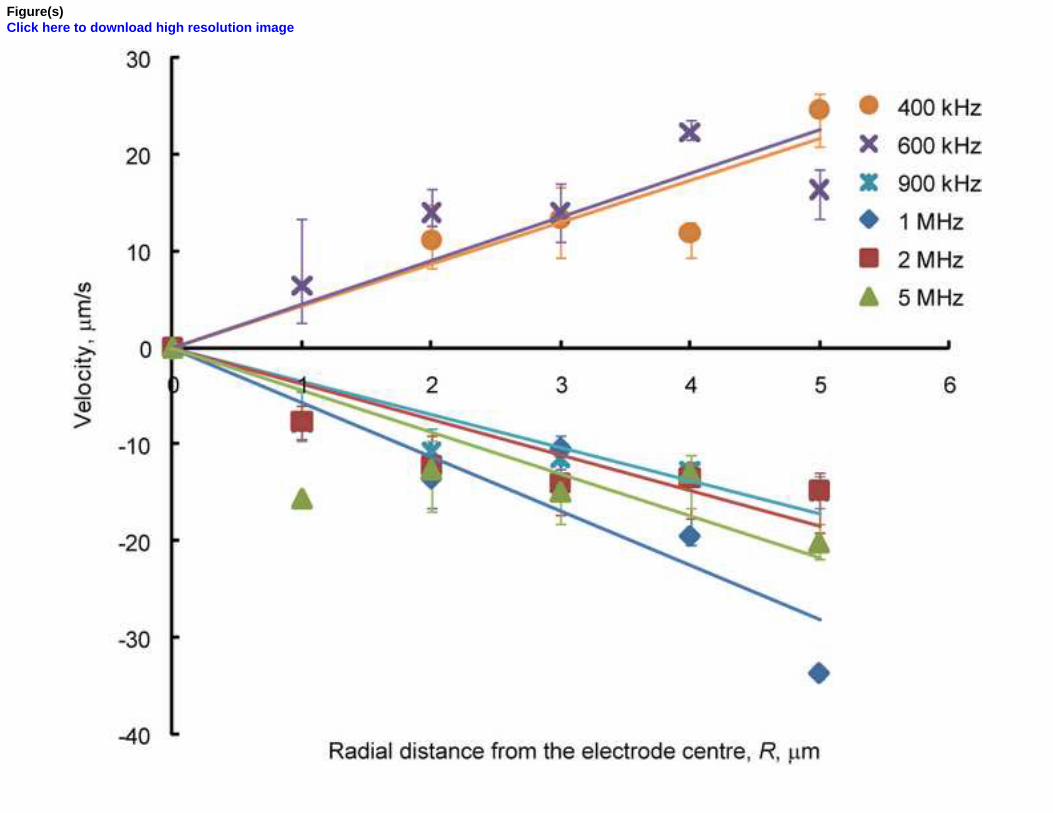
. The DNA velocity from experimental results are plotted against the particle position
in Fig. 2 depending on applied frequencies. From these values of , the time-averaged DEP
force can be obtained
(6)
which is derived by eqs. (1), (4) and (5). Experimentally obtained for are
plotted in Fig. 3. The force has the range of 5.8×10⁻¹⁴
~ 1.2×10⁻¹³
N and -1.4×10⁻¹³
~ 4.4×10⁻¹⁴
N for positive and negative DEP, respectively.
8
At the same time, we numerically estimated from eqs. (1), (3), with
defined by:
(7)
(8)
where is the permittivity of the particle, the conductivity of the particle and the
conductivity of the medium. Reported values for the constants in these equations for particle
(DNA) and media (diluted PBS) range widely depending on experimental conditions.
However, we tried to directly measure or estimate all constants necessary for the calculation
as follows. Constants for the diluted PBS, and , were measured to be 151 and 2 mS/m,
respectively, where is the vacuum permittivity (8.85×10⁻¹²
F/m). Compared to these
constants for continuous media, and for a DNA molecule are hard to define due to their
dependency on the EDL formation on the molecule surface. In early work, researchers studied
conductivities of a DNA strand in dry conditions, and obtained the very wide range of 10-
4~10
5 S/m [40-42]. More recently, the behavior of a DNA molecule in wet conditions, i.e.
with water molecules, was investigated [43, 44]. For TAS researchers, it is more appropriate
to adopt permittivity and conductivity as measured in solution to predict their mobility in
response to an AC potential. Accordingly, we used experimentally obtained values of 10-2
S/m and 80 for and , respectively [40]. Other parameters used in our calculation are:
=1.77 V (5 Vpp), =5 m, and =0.38 m. Here, was calculated from the Stokes-
Einstein equation:
(9)
(10)
where is the Boltzmann constant, the temperature, the diffusion coefficient and the
mean square displacement within time duration . The data set for and were obtained
9
from 10 DNA molecules over 10 s observation, and successive frames were analyzed to
avoid mistracking the moving DNA molecules.
Using all parameters mentioned above, we estimated ; these values plotted as
solid lines for in Fig. 3. The graph shows the DEP forces obtained from
experimental and numerical calculation together. For both positive and negative DEP, the
force range calculated from parameters is about one order of magnitude larger than that of the
experimental results from quadrupole electrodes. Similar values for the measured force have
also been reported in other experimental conditions [45]. On the other hand, the crossover
frequency calculated to be 880 kHz was consistent with the experimental value. Such
discrepancy in the force magnitude is mainly caused by the difference in field strength; which
is usually much weaker in the experiments than that used in the calculation. However, it is
shown that the DEP force of 10-13
~ 10-12
N and the crossover frequency can be estimated by
assuming appropriate parameters.
AC-EOF in a DNA concentrator
To compare with other electrokinetic phenomena, AC-EOF velocity has been measured and
calculated numerically for a large electrode [2]. For our DNA concentrator, we measured AC-
EOF velocity by tracking DNA molecules by PTV. Velocities versus frequency is plotted in
Fig. 4. Since the velocities depend on the distance from the electrode centre, we tracked
molecules at three different positions: r=5, 10, 15 m (r=0 m is the electrode centre). Each
plot was obtained by averaging velocities of over 10 molecules moving on the electrode
surface. The velocities were always maximal at 1 kHz for any given electrode position. At the
limits of both low and high frequency, velocities reached zero.
We estimated the time-averaged AC-EOF velocity by applying the following model
using a linear double-layer approximation, proposed by Green et al. [23],
(11)

10
where is the nondimensional frequency:
. (12)
For other variables, is the amplitude of the AC potential. The distance from the centre of
electrode gap, , is regarded as z=32.5-r (m) in our experimental setup. The reciprocal
Debye length, , is hard to define, since it depends on concentrations of ion spieces and
degree of their ionization. Following other references for dilute solutions with low
conductivity, Debye length of 100 nm was used in our calculation [46, 47]. The derived
velocities corresponding to each position (rth=5, 10, 15 m) where experimental results were
obtained are shown as solid curves in Fig. 4. The computed values were much larger than the
experimental results. Therefore, in Fig. 4 computed values were matched to experimental
results by dividing by 72, which was determined by focusing on the maximum computed
velocity of 17 mm/s for r=15 m. This discrepancy can be mainly explained by the difference
of the electric field distribution in the model and experiments. The discussion was also
reported and the computed velocity was larger by about two orders of magnitude in references
[2, 23]. Not only in the DNA concentrator but also in conventional AC-EOF measurements,
the velocity range is of the order of 10 mm/s for calculated results and 100 m/s for
experimental results [23]. In view of this discrepancy, it seems reasonable to estimate the
velocity of a few hundred m/s for our DNA concentrator.
Compared to the large discrepancy for the magnitude of velocity, the frequency
dependencies agreed very well. The maximum AC-EOF velocities were computed in the
frequency range of 0.5-1 kHz, which agrees with the peak experimental velocities at 1 kHz.
Therefore, the model proposed by Green et al. [23] appears valid to predict the dependency on
applied frequency for AC-EOF.

11
EP as bias voltage applied in a DNA concentrator
AC-EOF is a very powerful way to manipulate submicrometre particles which cannot be
handled by other forces directly acting on a particle. However, the phenomenon drives the
flow not the particles themselves. Accordingly, the DNA concentrator necessitates a force to
hold the moving molecules at a certain area for detection. Researchers have proposed a
combination of AC-EOF and EP, so-called biased AC-EOF, in which the bias DC voltage of
about 1 V was superimposed on AC voltage [1, 29]. Such a technique enhances the
accumulation of molecules in a designated area on the electrode after flowing them by AC-
EOF over the concentrator. In addition to the increase in conentrating power manifesting by
an increase in fluorescetn intensity, we have found that the bias voltage affects the duration of
molecular residence on the electrode centre.
We monitored the fluorescent intensity for two minutes since the voltage was applied,
and the time dependency of fluorescent intensity, , was fitted by:
(13)
for t=0~40 s since the fluorescent intensity saturates at about t=50 s. After t=60 s the
fluorescent intensity decreased with time. For comparison, fluorescent intensity for four
conditions with different bias voltages of 0, 1, 2 and 2.5 V was normalized with the amplitude
and plotted in Fig. 5. It shows the time dependency of , which reveals the decay of
from the maximum value. When no bias voltage was applied, decreased about 35% . On the
contrary, when a bias voltage of 2.5 V was superimposed, the decrease was less than 5%. We
observed electrolysis when over 3 V was applied. The results show that the bias voltage
resulting in the EP force is effective not only to attract molecules to the electrode centre but
also to retain them longer at the same position.
Based on these experimental results, we are able to explain the efficiency of the EP
effect. Deriving the EP force provides further insights into the comparison with DEP and AC-

12
EOF effects. The calculation can be simply achieved by applying reported characteristic
parameters for DNA molecules to eq. (2), which can be also expressed as:
. (14)
where is the effective charge per base pair, and is the number of base pairs of the
DNA molecule [48]. In contrast to conductivity and permittivity of DNA in buffer solutions,
electric charge for DNA molecules have been estimated from mobility measurements in
capillary electrophoresis, e.g. 0.12 e-/bp for 66 kbp plasmid [30], or 0.20~0.28 e
-/bp for 20 bp
double strand DNA [31]. These values derived from mobilities depend on the environment of
DNA molecule: in gel fiber structure, known as capillary gel electrophoresis, the effective
charge of DNA molecule tends to increase because the anchor force acting on the DNA
increases. It is caused by the lower mobility of the free counterions on the DNA which
decrease the drag force. On the other hand, in gel-free solution the effective charge tends to be
smaller than that measured in gel, e.g. Gurrieri and coworkers report 0.08 e-/bp in a buffer
solution and 0.32 e-/bp in 1.2% agarose gel [32].
In our experimental setup, the highest electric field is provided when the bias voltage
of 2.5 V is applied between 10-m gap ITO electrodes. Now we are able to calculate for a
single DNA molecule to be (0.16~1.2)×10-9
N using 48.5 kbp of DNA for n and 0.08~0.63
e-/bp for q [30-33, 49]. This EP force is four orders of magnitude larger than the DEP force, as
measured and calculated in the previous section. Such a comparison of DEP and EP force
reveals that the behavior of DNA molecules is mainly dominated by EP rather than DEP in a
high electric field, i.e. on the electrode edge and surface. The results imply that the DNA
concentrator attracts molecules to the electrode centre by EP as discussed in references [1, 2].
Therefore, one is able to design a similar DNA concentrator to ours to utilize AC-EOF and EP.
Moreover, for a different experimental setup, one can estimate DEP and EP forces and
compare them to determine a more dominant force between them near the electrode surface.
The dominant force works as a trapping force and AC-EOF defines a flow pattern. Therefore,

13
combining these two phenomena allows us to design a high concentration area in a DNA
concentrator. We note that the expected concentration procedure might be disturbed by a
repulsive force on molecules, because charge distribution on accumulated molecules or
electrode surfaces change after the concentration. However, we could not see a large
fluorescent intensity drop for a relatively short concentration duration, up to a few minutes.
Three dimensional DNA molecule distributions
Mobility of DNA molecules in our DNA concentrator has been discussed above; molecules
are attracted by the EP force when they approach the electrode centre by the fluid flow
induced by AC-EOF. Such concentration processes were investigated two dimensionally, and
only AC-EOF on a pair of coplanar electrodes was visualized three dimensionally. The three
dimensional distribution of molecules in the DNA concentrator has not been considered yet.
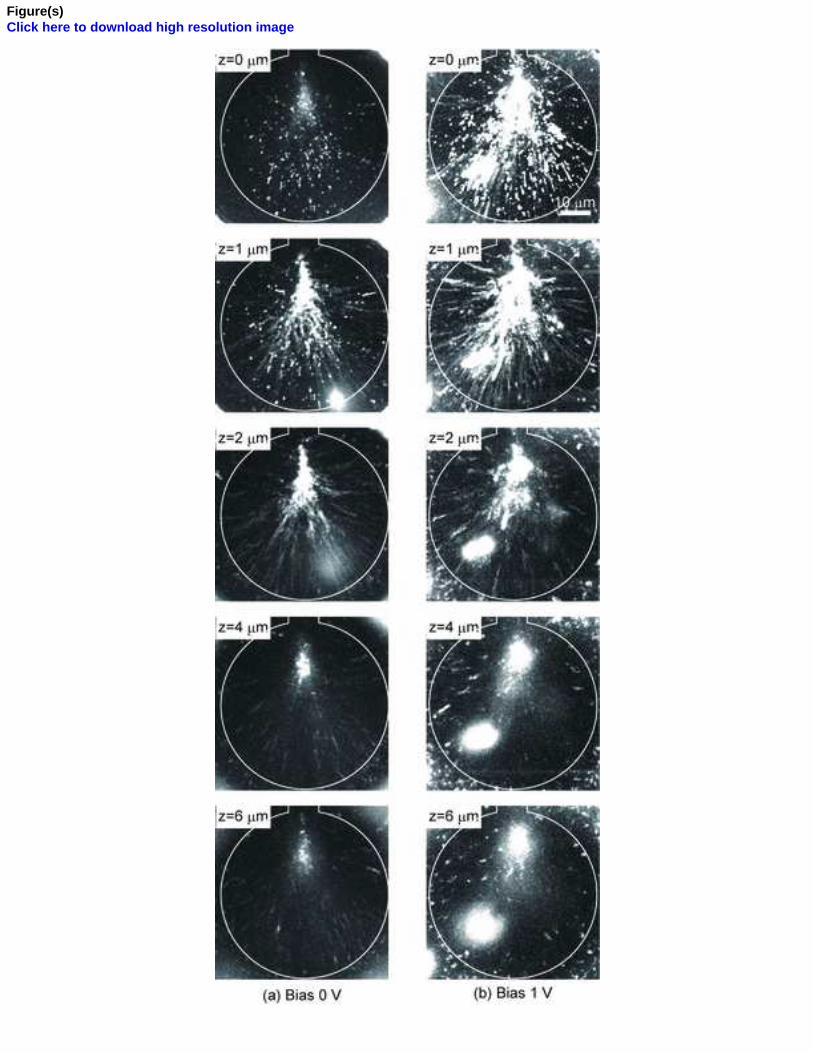
Here, we first monitored three dimensional DNA distributions on the electrode as
shown in Fig. 6. Images were captured by scanning confocally from the electrode surface
(z=0 m) into the bulk solution region where no AC-EOF was observed (z=30 m) with 1-
m step. Scanning was started after a 2 min concentration process and ended in 30 s, resulting
in 30 image frames. Only five images for z=0, 1, 2, 4 and 6 m are shown in Fig. 6; The
experiment was performed with no bias and 1-V bias voltage, as shown in (a) and (b),
respectively.
The effect of EP force is clearly seen in the two experimental conditions. At z=0 m,
more DNA molecules were attracted to the electrode surface when the bias voltage was
applied. Even in the upper location of the electrode, 1-V bias voltage yielded brighter and
larger fluorescent area than with no bias voltage applied up to z=6 m. It is probable that
fluorescence from molecules out of the focal plane may increase the fluorescent intensity at
each scanned position. Taking such phenomena into consideration, we are still able to
conclude the DNA molecules are attracted not only the electrode surface but also above the

14
electrode. Three dimensional accumulation of the DNA molecules at the electrode centre is
advantageous to obtain higher fluorescent detection intensity by epi-fluorescent illumination
in the depth direction. These DNA distributions have a good agreement with flow patterns
estimated by several numerical and experimental methods, though some of them have
different electrode patterns [2, 24, 29, 50]. Especially, our result shows the mobility of each
DNA molecule corresponding to the flow pattern and some molecules are stretched along the
electric field. It is achieved by our transparent ITO electrodes much smaller than other studies
to utilize the inverted microscope with a 100x objective.
Conclusions
We have investigated three major electrokinetic phenomena, DEP, EP and AC-EOF, in a
DNA concentrator focusing on the mobility of DNA molecules. The DEP force, , for a
DNA molecule is found to have a magnitude of 10-13
N range in both positive and negative
DEP from the velocity measurement using quadrupole electrodes. Based on the fundamental
DEP force formula, is estimated to be 10-12
N, which is one order of magnitude larger
than the experimental result. However, the crossover frequency of 880 Hz is consistent with
the experimental result. AC-EOF velocity measurements show a large discrepancy from the
magnitude of results computed by a theoretical model, roughly a factor of 1/72. However, the
frequency dependency of the flow velocity agree well; We find a maximum velocity at 1 kHz
and decrease at lower and higher frequency range. The resulting maximum velocity in our
concentrator was in the order of 100~200 m/s. A DC bias voltage superimposed on AC
voltage helps to retain DNA molecules. This is explained by estimating the EP force, ,
acting on the molecule; The resulting value of (0.16~1.2)×10-9
N is three to four orders of
magnitude larger than . Confocal laser scanning microscopy reveals that the bias voltage
attracts more molecules three dimensionally and increase fluorescent intensity at the electrode
centre.
15
Most studies reported on the DNA concentrator were mainly based on trial-and-error
optimization of these phenomena. However, our experimental and theoretical approach to
understand the DNA concentrator show that AC-EOF is totally dominant for bulk transport of
molecules. Comparing the two forces acting on a DNA molecule, the EP force works much
better than the DEP force for trapping molecules on the electrode in our experimental setup.
Moreover, several important parameters such as , and can be simply
calculated for the purpose of designing a concentrator. Threfore, a similar concentrator can be
designed based on our and reported results . When a designe parameter is modified, we are
still able to calculate DEP and EP forces to determine a dominant force. It will allow us to
expect a concentration area on a concentrator by the integration of the dominant force along
with an electroosmosis flow pattern. This methodology should help to understand how the
designed molecular concentrator works in TAS.
Acknowledgements
This study was partially supported by the Kyoto Nanotechnology Cluster and Cooperation of
Innovative Technology and Advanced Research in City Area Program in the Southern Area of
Lake Biwa (2007-2009) from the Ministry of Education, Culture, Sports, Science and
Technology, Government of Japan (MEXT). This research was also funded by PRESTO,
CREST and Research for Promoting Technological Seeds grant (09-043) from Japan Science
and Technology Agency (JST). We acknowledge Prof. K. Terao of Department of Intelligent
Mechanical Systems Engineering, Kagawa University, Japan, and Prof. H. Kotera of
Department of Microengineering, Kyoto Univeristy, Japan, for using the a confocal laser
scanning system. Authors also thank Prof. P. K. Wong of Aerospace & Mechanical
Engineering Department, The University of Arizona, USA, for discussion on results and Prof.
J. C. Wells of Department of Civil Engineering, Ritsumeikan University, Japan, for critical
reading of this paper.

16
References
[1] P. K. Wong, C. Y. Chen, T. H. Wang and C. M. Ho, Electrokinetic bioprocessor for concentrating cells and
molecules, Anal Chem, 76 (2004) 6908-14
[2] M. Bown and C. Meinhart, AC electroosmotic flow in a DNA concentrator, Microfluidics and Nanofluidics, 2
(2006) 513-523
[3] P. R. Gascoyne and J. Vykoukal, Particle separation by dielectrophoresis, Electrophoresis, 23 (2002) 1973-83
[4] J. D. Yantzi, J. T. Yeow and S. S. Abdallah, Multiphase electrodes for microbead control applications: integration
of DEP and electrokinetics for bio-particle positioning, Biosens Bioelectron, 22 (2007) 2539-45
[5] A. Ramos, H. Morgan, N. G. Green and A. Castellanos, Ac electrokinetics: a review of forces in microelectrode
structures, J. Phys. D: Appl. Phys., 31 (1998) 2338-2253
[6] M. P. Hughes, AC electrokinetics: applications for nanotechnology, Nanotechnology, 11 (2000) 124-132
[7] T. B. Jones, Electromechanics of Particles. Cambridge: Cambridge University Press, 1995.
[8] M. Washizu and O. Kurosawa, Electrostatic manipulation of DNA in microfabricated structures, IEEE Trans. Ind.
Applicat., 26 (1990) 1165-1172
[9] M. Washizu, O. Kurosawa, I. Arai, S. Suzuki and N. Shimamoto, Applications of electrostatic stretch-and-
positioning of DNA, IEEE Trans. Ind. Applicat., 31 (1995) 447-456
[10] J. Kentsch, M. Durr, T. Schnelle, G. Gradl, T. Muller, M. Jager, A. Normann and M. Stelzle, Microdevices for
separation, accumulation, and analysis of biological micro- and nanoparticles, IEE Proc Nanobiotechnol, 150
(2003) 82-89
[11] J. V. Peter R. C. Gascoyne, Particle separation by dielectrophoresis, Electrophoresis, 23 (2002) 1973-1983
[12] Jung and H.-Y. Kwak, Separation of Microparticles and Biological Cells Inside an Evaporating Droplet Using
Dielectrophoresis, Anal. Chem., 79 (2007) 5087-5092
[13] H. Morgan, M. P. Hughes and N. G. Green, Separation of Submicron Bioparticles by Dielectrophoresis, 77 (1999)
516-525
[14] X. B. Wang, Y. Huang, X. Wang, F. F. Becker and P. R. Gascoyne, Dielectrophoretic manipulation of cells with
spiral electrodes, Biophys J, 72 (1997) 1887-99
[15] M. Suzuki, T. Yasukawa, H. Shiku and T. Matsue, Separation of Live and Dead Microorganisms in a Micro-Fluidic
Device by Dielectrophoresis, Bunseki Kagaku, 54 (2005) 1189-1195
[16] P. R. C. Gascoyne, J. Noshari, F. F. Becker and R. Pethig, Use of dielectrophoretic collection spectra for
characterizing differences between normal and cancerous cells, Industry Applications, IEEE Transactions on, 30
(1994) 829-834
[17] M. P. Hughes and H. Morgan, Dielectrophoretic characterization and separation of antibody-coated submicrometer
latex spheres, Anal. Chem., 71 (1999) 3441-3445
[18] X. Hu, P. H. Bessette, J. Qian, C. D. Meinhart, P. S. Daugherty and H. T. Soh, Marker-specific sorting of rare cells
using dielectrophoresis, Proc Natl Acad Sci U S A, 102 (2005) 15757-61
[19] M. Castellarnau, A. Errachid, C. Madrid, A. Juaez and J. Samitier, Dielectrophoresis as a Tool to Characterize and
Differentiate Isogenic Mutants of Escherichia coli, Biophysical Journal, 91 (2006) 3937-3945

17
[20] S. P. Desai, M. D. Vahey and J. Voldman, Electrically addressable vesicles: tools for dielectrophoresis metrology,
Langmuir, 25 (2009) 3867-75
[21] P. K. Wong, T.-H. Wang, J. H. Deval and C.-M. Ho, Electrokinetics in Micro Devices for Biotechnology
Applications, IEEE/ASME Trans. Mechatron., 9 (2004) 366-376
[22] M. L. Y. Sin, Y. Shimabukuro and P. K. Wong, Hybrid electrokinetics for separation, mixing, and concentration of
colloidal particles, Nanotechnology, 20 (2009) 165701
[23] N. G. Green, A. Ramos, A. Gonzalez, H. Morgan and A. Castellanos, Fluid flow induced by nonuniform ac electric
fields in electrolytes on microelectrodes. I. Experimental measurements, Phys Rev E, 61 (2000) 4011-8
[24] N. G. Green, A. Ramos, A. Gonzalez, H. Morgan and A. Castellanos, Fluid flow induced by nonuniform ac electric
fields in electrolytes on microelectrodes. III. Observation of streamlines and numerical simulation, Phys Rev E, 66
(2002) 026305
[25] A. Ramos, A. Gonzalez, A. Castellanos, N. G. Green and H. Morgan, Pumping of liquids with ac voltages applied
to asymmetric pairs of microelectrodes, Physical Review E, 67 (2003) 056302
[26] A. B. D. Brown, C. G. Smith and A. R. Rennie, Pumping of water with ac electric fields applied to asymmetric
pairs of microelectrodes, Physical Review E, 63 (2000) 016305
[27] S. Debesset, C. J. Hayden, C. Dalton, J. C. Eijkel and A. Manz, An AC electroosmotic micropump for circular
chromatographic applications, Lab Chip, 4 (2004) 396-400
[28] N. Sasaki, T. Kitamori and H. B. Kim, AC electroosmotic micromixer for chemical processing in a microchannel,
Lab Chip, 6 (2006) 550-4
[29] J. Wu, Biased AC electro-osmosis for on-chip bioparticle processing, Nanotechnology, IEEE Transactions on, 5
(2006) 84-89
[30] S. B. Smith and A. J. Bendich, Electrophoretic charge density and persistence length of DNA as measured by
fluorescence microscopy, Biopolymers, 29 (1990) 1167-73
[31] T. M. Laue, T. M. Ridgeway, J. O. Wooll, H. K. Shepard, T. P. Moody, T. J. Wilson, J. B. Chaires and D. A.
Stevenson, Insights from a new analytical electrophoresis apparatus, J Pharm Sci, 85 (1996) 1331-5
[32] S. Gurrieri, S. B. Smith and C. Bustamante, Trapping of megabase-sized DNA molecules during agarose gel
electrophoresis, Proc Natl Acad Sci U S A, 96 (1999) 453-8
[33] U. F. Keyser, B. N. Koeleman, S. van Dorp, D. Krapf, R. M. M. Smeets, S. G. Lemay, N. H. Dekker and C. Dekker,
Direct force measurements on DNA in a solid-state nanopore, Nat Phys, 2 (2006) 473-477
[34] H. Watarai, T. Sakamoto and S. Tsukahara, In Situ Measurement of Dielectrophoretic Mobility of Single
Polystyrene Microparticles, Langmuir, 13 (1997) 2417-2420
[35] Y. Huang and R. Pethig, Electrode design for negative dielectrophoresis, Measurement Science and Technology, 2
(1991) 1142-1146
[36] S. Tsukahara, T. Sakamoto and H. Watarai, Positive Dielectrophoretic Mobilities of Single Microparticles
Enhanced by the Dynamic Diffusion Cloud of Ions, Langmuir, 16 (2000) 3866-3872
[37] Y. Zhao, U.-C. Yi and S. K. Cho, Microparticle Concentration and Separation by Traveling-Wave
Dielectrophoresis (twDEP) for Digital Microfluidics, Microelectromechanical Systems, Journal of, 16 (2007) 1472-
1481

18
[38] M. P. Hughes, H. Morgan, F. J. Rixon, J. P. H. Burt and R. Pethig, Manipulation of herpes simplex virus type 1 by
dielectrophoresis, Biochimica et Biophysica Acta (BBA) - General Subjects, 1425 (1998) 119-126
[39] S. Tsukahara and H. Watarai, Dielectrophoresis of microbioparticles in water with planar and capillary quadrupole
electrodes, IEE Proc. - Nanobiotechnol., 150 (2003) 59-65
[40] M. Hoeb, J. O. Radler, S. Klein, M. Stutzmann and M. S. Brandt, Light-induced dielectrophoretic manipulation of
DNA, Biophys J, 93 (2007) 1032-8
[41] H. W. Fink and C. Schonenberger, Electrical conduction through DNA molecules, Nature, 398 (1999) 407-10
[42] Y. Zhang, R. H. Austin, J. Kraeft, E. C. Cox and N. P. Ong, Insulating behavior of lambda-DNA on the micron
scale, Phys Rev Lett, 89 (2002) 198102
[43] P. Tran, B. Alavi and G. Gruner, Charge transport along the lambda-DNA double helix, Phys Rev Lett, 85 (2000)
1564-7
[44] T. Kleine-Ostmann, C. Jordens, K. Baaske, T. Weimann, M. H. de Angelis and M. Koch, Conductivity of single-
stranded and double-stranded deoxyribose nucleic acid under ambient conditions: The dominance of water, Applied
Physics Letters, 88 (2006) 102102-3
[45] C. F. Chou, J. O. Tegenfeldt, O. Bakajin, S. S. Chan, E. C. Cox, N. Darnton, T. Duke and R. H. Austin,
Electrodeless dielectrophoresis of single- and double-stranded DNA, Biophys J, 83 (2002) 2170-9
[46] S. Kumagai, S. Yoshii, K. Yamada, I. Fujiwara, N. Matsukawa and I. Yamashita, Nanopatterning of Vapor-
deposited Aminosilane Film using EB Lithography for Ferritin Protein Adsorption, J Photopolym Sci Technol, 18
(2005) 495-500
[47] Z. Stojek, Electroanalytical Methods: Guide to Experiments and Applications, in: F. Scholz and A. M. Bond
(Eds.), Electroanalytical Methods: Guide to Experiments and Applications, Springer, Berlin, 2005, pp. 3-8.
[48] H. J. Jung and Y. C. Bae, Theory for the capillary electrophoretic separation of DNA in polymer solutions, Journal
of Chromatography A, 967 (2002) 279-287
[49] I. Koltover, K. Wagner and C. R. Safinya, DNA condensation in two dimensions, Proc Natl Acad Sci U S A, 97
(2000) 14046-51
[50] K. F. Hoettges, M. B. McDonnell and M. P. Hughes, Use of combined dielectrophoretic/electrohydrodynamic
forces for biosensor enhancement, Journal of Physics D: Applied Physics, 36 (2003) L101-L104
19
Figure captions
Fig. 1 (a) Quadrupole ITO electrodes for DEP measurements. (b) Circular ITO electrodes for the DNA
concentrator. The centre electrode was always positive when the DC bias voltage was applied.
Fig. 2 Measured DEP velocity for DNA molecules depending on the radial distance from the electrode centre,
R.
Fig. 3 Comparison of the DEP forces, FDEP. Symbols referring to the left y-axis show FDEP obtained by the
quadrupole experiments. Solid lines referring to the right y-axis indicate FDEP calculated numerically.
Fig. 4 AC-EOF velocity on the DNA concentrator. Symbols with error bars connected by dotted line show the
measured velocity depending on the position on the centre electrode. Solid lines are derived numerically
and multiplied by a correction factor of 1/72.
Fig. 5 Normalized fluorescent intensity (FI) at the electrode centre. It was monitored with different bias voltages
0, 1, 2 and 2.5 V, and reached the maximum in 40 s in any condition. However, after 120 s the intensity decayed
35% when no voltage applied, but just 5% with a bias voltage of 2.5 V.
Fig. 6 DNA distribution in the depth direction on the electrode centre. (a) When no bias voltage was applied,
molecules are attracted near the electrode surface only: two dimensional concentration. (b) More molecules are
attracted three dimensionally with a bias voltage of 1 V. Centre electrodes are indicated by white circles
corresponding to the schematic illustration shown in Fig. 1b.

Figure(s)Click here to download high resolution image
Figure(s)Click here to download high resolution image

Figure(s)Click here to download high resolution image

Figure(s)Click here to download high resolution image

Figure(s)Click here to download high resolution image
Figure(s)Click here to download high resolution image