Individual differences in digital badging: Do learner characteristics matter?
26
Article Individual Differences in Digital Badging: Do Learner Characteristics Matter? Joseph R. Fanfarelli 1 and Rudy McDaniel 1 Abstract Badge use has rapidly expanded in recent years and has benefited a variety of appli- cations. However, a large portion of the research has applied a binary useful or not useful approach to badging. Few studies examine the characteristics of the user and the impact of those characteristics on the effectiveness of the badging system. This study takes preliminary steps toward that cause, examining the effectiveness of a badging system across two web-based university courses in relation to the individual differences of the learners. Individual differences are examined through the lens of Long–Dziuban reactive behavior types and traits. Results revealed differences in badge effectiveness that were dependent upon students’ Long–Dziuban categoriza- tion. Student engagement, intrinsic motivation, reflective and integrative learning, and higher order learning were the constructs most dependent upon categorization. Additional results and their implications are discussed within. Keywords badging, digital badges, engagement, individual differences, learning, Long-Dziuban, motivation, reactive behavior In response to the proliferation of distance learning and web-based academia, educators have sought complementary technologies. One such technology, digi- tal badging, is accelerating to the forefront of pedagogical interest (Carey, 2012; Khaddage, Baker, & Knezek, 2012; Mehta, Hull, Young, & Stoller, 2013; Rosewell, 2012). Digital badging systems promise increased granularity of Journal of Educational Technology Systems 2015, Vol. 43(4) 403–428 ! The Author(s) 2015 Reprints and permissions: sagepub.com/journalsPermissions.nav DOI: 10.1177/0047239515588165 ets.sagepub.com 1 University of Central Florida, Orlando, FL, USA Corresponding Author: Joseph R. Fanfarelli, University of Central Florida, 4000 Central Florida Blvd, Orlando, FL 32816, USA. Email: [email protected]
Transcript of Individual differences in digital badging: Do learner characteristics matter?

Article
Individual Differences inDigital Badging: DoLearner CharacteristicsMatter?
Joseph R. Fanfarelli1 and Rudy McDaniel1
Abstract
Badge use has rapidly expanded in recent years and has benefited a variety of appli-
cations. However, a large portion of the research has applied a binary useful or not
useful approach to badging. Few studies examine the characteristics of the user and
the impact of those characteristics on the effectiveness of the badging system. This
study takes preliminary steps toward that cause, examining the effectiveness of a
badging system across two web-based university courses in relation to the individual
differences of the learners. Individual differences are examined through the lens of
Long–Dziuban reactive behavior types and traits. Results revealed differences in
badge effectiveness that were dependent upon students’ Long–Dziuban categoriza-
tion. Student engagement, intrinsic motivation, reflective and integrative learning, and
higher order learning were the constructs most dependent upon categorization.
Additional results and their implications are discussed within.
Keywords
badging, digital badges, engagement, individual differences, learning, Long-Dziuban,
motivation, reactive behavior
In response to the proliferation of distance learning and web-based academia,educators have sought complementary technologies. One such technology, digi-tal badging, is accelerating to the forefront of pedagogical interest (Carey, 2012;Khaddage, Baker, & Knezek, 2012; Mehta, Hull, Young, & Stoller, 2013;Rosewell, 2012). Digital badging systems promise increased granularity of
Journal of Educational Technology
Systems
2015, Vol. 43(4) 403–428
! The Author(s) 2015
Reprints and permissions:
sagepub.com/journalsPermissions.nav
DOI: 10.1177/0047239515588165
ets.sagepub.com
1University of Central Florida, Orlando, FL, USA
Corresponding Author:
Joseph R. Fanfarelli, University of Central Florida, 4000 Central Florida Blvd, Orlando, FL 32816, USA.
Email: [email protected]

assessment (Abramovich, Schunn, & Higashi, 2013), elevated time on task(Blair, 2012), and more precise markers of academic success (Rosewell, 2012).
A digital badge can be considered a visual marker of achievement that isawarded in response to the completion of prespecified criteria and exists in avirtual space (Frederiksen, 2013). For the uninitiated, the digital badge can bestbe considered in relation to its forbearers. Like military ribbons and Boy andGirl Scout merit badges, digital badges represent what the earner has achieved.
Many of the benefits of digital badging systems are steadily gaining the atten-tion of educators and online systems designers. Consequently, badging hasundergone rapid implementation. For example, Mozilla (2014), creators of theFirefox web browser, have created the OpenBadges system, a nonproprietaryinterface that displays qualification-based badges issued by any organizationthat wishes to participate. Several universities have also begun incorporatingbadging systems, such as Purdue (2014) and UC-Davis (Stewart, 2013).
The large-scale adoption of such a technology necessitates the discovery ofoptimized methods of implementation. It is not enough to simply know thatbadges seem to improve pedagogy; a deep understanding of how they improve,why they improve, and for whom they improve facilitates the adoption of such asystem in a useful way.
Badging has primarily been treated as a one-size-fits-all possibility—Dobadges globally improve motivation? Do badges globally alter performance? Theanswers may be more complex than the questions. Perhaps it is the case thatbadges do improve motivation—sometimes, for some learners; but not always,for all learners. Research has begun examining the design aspects of badgingsystems, but, with some exceptions (Abramovich et al., 2013; Hakulinen &Auvinen, 2014), learner characteristics have largely been ignored. If the qualitiesof the learner impact the effectiveness of the system, implementation may requirealteration, using badging systems for students who benefit most and omittingthem where they discourage the desired results. This study seeks to advance theknowledge base on individual differences as they relate to badging systems, witha specific focus on reactive behavior types and traits (Long, 1975, 1985).
Background
Badging Effectiveness
The complete benefits of badges are still being established, but several studieshave already revealed positive results. In one large-scale experiment, badgessignificantly increased student contributions and time on task (Denny, 2013).Blair (2012) tested the effects of badges on participants playing a video game andshowed that well-designed achievements can improve motivation. Fitz-Walteret al. (2011) found that badges enhanced motivation in a cell-phone app meantto orient new students on campus. Additionally, Charleer, Klerkx, Santos, and
404 Journal of Educational Technology Systems 43(4)
Duval (2013) showed that badges improved awareness of the requirements forsuccessful completion of a human computer interaction course.
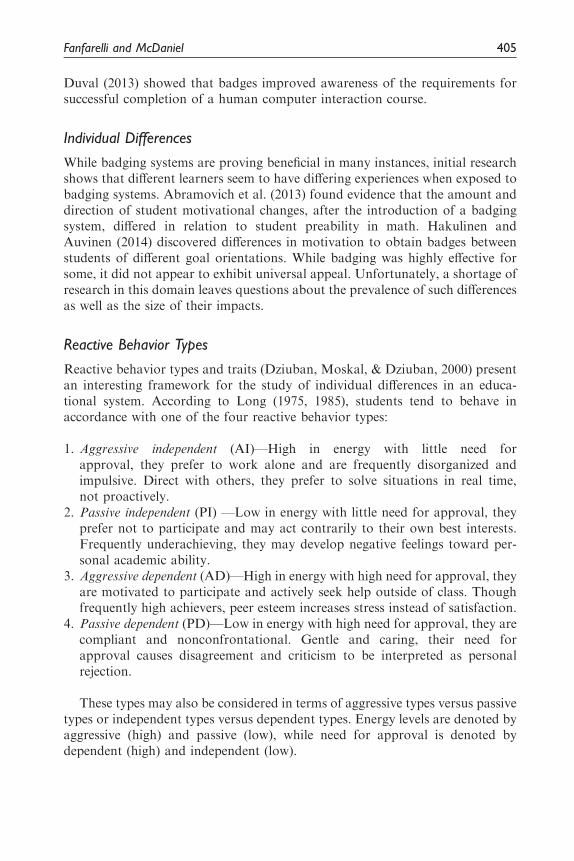
Individual Differences
While badging systems are proving beneficial in many instances, initial researchshows that different learners seem to have differing experiences when exposed tobadging systems. Abramovich et al. (2013) found evidence that the amount anddirection of student motivational changes, after the introduction of a badgingsystem, differed in relation to student preability in math. Hakulinen andAuvinen (2014) discovered differences in motivation to obtain badges betweenstudents of different goal orientations. While badging was highly effective forsome, it did not appear to exhibit universal appeal. Unfortunately, a shortage ofresearch in this domain leaves questions about the prevalence of such differencesas well as the size of their impacts.
Reactive Behavior Types
Reactive behavior types and traits (Dziuban, Moskal, & Dziuban, 2000) presentan interesting framework for the study of individual differences in an educa-tional system. According to Long (1975, 1985), students tend to behave inaccordance with one of the four reactive behavior types:
1. Aggressive independent (AI)—High in energy with little need forapproval, they prefer to work alone and are frequently disorganized andimpulsive. Direct with others, they prefer to solve situations in real time,not proactively.
2. Passive independent (PI) —Low in energy with little need for approval, theyprefer not to participate and may act contrarily to their own best interests.Frequently underachieving, they may develop negative feelings toward per-sonal academic ability.
3. Aggressive dependent (AD)—High in energy with high need for approval, theyare motivated to participate and actively seek help outside of class. Thoughfrequently high achievers, peer esteem increases stress instead of satisfaction.
4. Passive dependent (PD)—Low in energy with high need for approval, they arecompliant and nonconfrontational. Gentle and caring, their need forapproval causes disagreement and criticism to be interpreted as personalrejection.
These types may also be considered in terms of aggressive types versus passivetypes or independent types versus dependent types. Energy levels are denoted byaggressive (high) and passive (low), while need for approval is denoted bydependent (high) and independent (low).
Fanfarelli and McDaniel 405
Behavior type may be associated with zero to four supporting traits (Dziubanet al., 2000):
1. Phobic—Tend to fear negative outcomes, spending their energy in cautionwhile taking care to consider every possible outcome. Highly analytical.
2. Impulsive—Unpredictable and often energetic. These students tend to per-form on a whim, frequently engaging in tasks without careful considerationor prior experience.
3. Obsessive compulsive—Organized and methodical. These students tend tocomplete their tasks and be successful. While typically beneficial, theirunspontaneous work ethic can be exhausting.
4. Hysterical—Creative, empathetic, and openly emotional. When feeling posi-tive, their energy is contagious. However, they have an affinity for crisis,reacting in a strong negative manner if they perform poorly on a test orforget an assignment.
The Long–Dziuban (LD) Survey Instrument (Dziuban & Dziuban, 1998) is avalidated (Long, 1985) and reliable (Cioffi, 1995) instrument used to assess thesetypes and traits. As a short two question self-report instrument, its utility par-tially lies in its simplicity. The first question asks the reader to read four shortdescriptions and mark the one that they most identify with, thereby indicatinghis or her type. The second question asks the reader to read four more shortdescriptions and mark as many as he or she identifies with, thereby indicating hisor her traits. If Long’s types are influential in the effectiveness of badges, thesimplicity of this instrument will prove useful in efficiently deciding whether ornot to use badges with specific groups of students.
Existing research supports the instrument’s ability to differentiate betweenvarying levels of student performance. For example, reactive behavior typesand traits of students, as assigned by the survey instrument, have been influentialin academic achievement in mathematics (Cioffi, 1995; Junkins, 2000), real estateexamination performance (Combs, 2004), and student-desired instructor feed-back methodology in dance education (Salapa, 2000). This study will focus onthe interaction between these reactive behavior types and traits and a digitalbadging system in university-level courses.
Research Questions
The primary research question inquires whether or not individual differences existon the effectiveness of a digital distance learning badging system with regard toreactive behavior types and traits. If so, more specific research questions include:
1. How does aggressiveness impact badging effectiveness?2. How does dependence impact badging effectiveness?
406 Journal of Educational Technology Systems 43(4)
3. How does reactive behavior type impact badging effectiveness?4. How do LD traits impact badging effectiveness?5. To what extent and in which direction does number of badges earned correl-
ate with the various dimensions of badging effectiveness?
For this study, effectiveness is defined along several dimensions, includingengagement, intrinsic motivation, and the seven dimensions measured by theNational Survey for Student Engagement (NSSE): collaborative learning, reflect-ive and integrative learning, student faculty interaction, higher order learning,effective teaching practices, learning strategies, and student satisfaction.
Method
Participants
Participants in this study included 44 students (24 male and 20 female) from theUniversity of Central Florida (UCF). All participants were over the age of 18 andcurrently enrolled in one of the four web-based courses, two Web Design sections,and two Graphic Design sections. All course sections had the same instructor andwere offered as electives for students in UCF’s School of Visual Arts and Design.
In total, 89 students consented to participation in this study. However, all surveyswere provided online. Several participants elected to not complete any of the surveysor did not complete the entire set of surveys. Only complete data sets were retained,totaling 44 participants. No discernable patterns of differences were observed in theavailable data between complete and incomplete data sets. Participants were notoffered any incentives or penalties for participating in the study.
Course Structure
Both courses were completely web based with an equal emphasis on quizzes andexams and project-based assignments. The courses were structured to improveability in web and graphic design while preparing students for the AdobeCertified Expert exams in either Dreamweaver or Photoshop. For WebDesign, the course consisted of complementary projects in Dreamweaver thatbuilt into a complete website by the end of the semester. In Graphic Design,participants completed a series of projects in Photoshop, including digital imageediting, video editing, and various aspects of design.
Badging System
Two of the sections, one for each course, included a badging system. ^Originally, thebadging system contained a total of 22 badges (18 were present in Graphic Design, 19in Web Design). Four badges were never awarded. Top Gun, So Close, and ThirdWheel would have been awarded for the top three scores on each project. However, a
Fanfarelli and McDaniel 407

clear top three never emerged as multiple participants consistently occupied the topthree positions. Flawless victory would have been awarded for receiving a perfectscore on all quizzes, a feat which was not accomplished by any participants. ^Thus, atotal of 18 badges remained (14 in Graphic Design, 15 in Web Design; see Table 1).
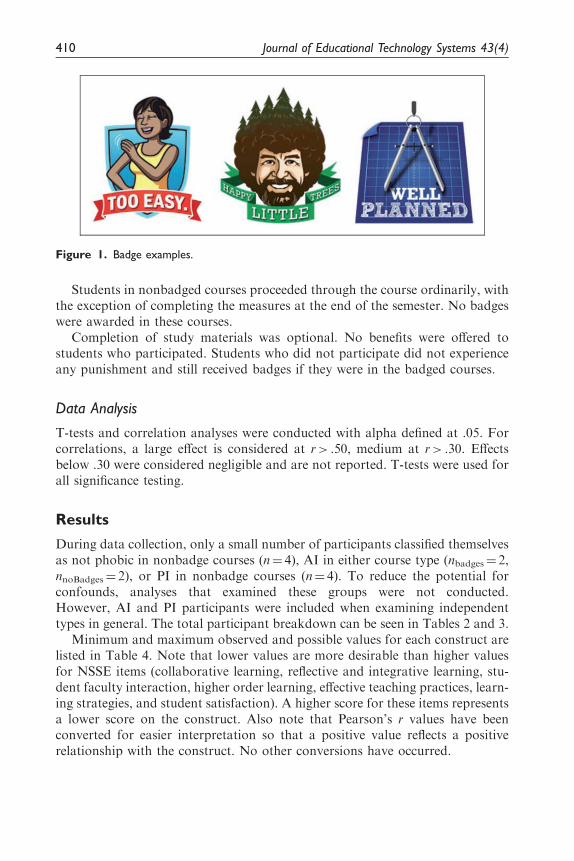
Badges were introduced by the “Let’s Play a Game” badge, which wasawarded to all students on the first day of class. Subtext accompanying thebadge indicated that many other badges were obtainable, but that studentswould not be told how to unlock them. In accordance with Blair (2012), asidefrom one introductory badge, all badges were skill based, requiring the demon-stration of advanced ability or exceptional effort to obtain the badges. Whilesome were awarded for achieving a perfect score, others were given for reasonssuch as performing well and submitting an assignment early, demonstratingexceptional creativity, or helping another student on the discussion board.Examples of badge designs are included in Figure 1.
Participants could view their earned badges at any time by clicking a linklabeled “Achievements” on the course website. Badges of other students werenot visible. Badges not yet acquired were not shown or mentioned anywhere onthe site. Clicking an earned badge revealed a description of the badge, the com-pletion criterion, and a larger image of the badge.
Materials
To measure reactive behavior type and associated traits, the Long–DziubanSurvey Instrument was used. This measure asks participants to read fourshort descriptions and select the one that best matches them, thereby indicatingtheir reactive behavior type. Next, they read a description of four traits andselect any number of traits that they feel describes them.
A modified version of the NSSE (2014) was used to assess collaborativelearning, reflective and integrative learning, student faculty interaction, higherorder learning, effective teaching practices, learning strategies, and student sat-isfaction. Modifications were made to better suit the structure of the course,removing responses that were irrelevant (e.g., asking whether student gave apresentation in the course. This was not an option for this web-based course).
Other measures included the Interest/Enjoyment Subscale of the IntrinsicMotivation Inventory (Ryan, 1982) to measure intrinsic motivation and theEngagement Measure (Charlton & Danforth, 2005; Jennett et al., 2008) to meas-ure engagement. Final grade and number of badges earned were also recorded.
Procedure
All participants proceeded through their respective course as any student would.Measures were disseminated online 3 weeks before the end of the semester tofacilitate higher completion rates.
408 Journal of Educational Technology Systems 43(4)
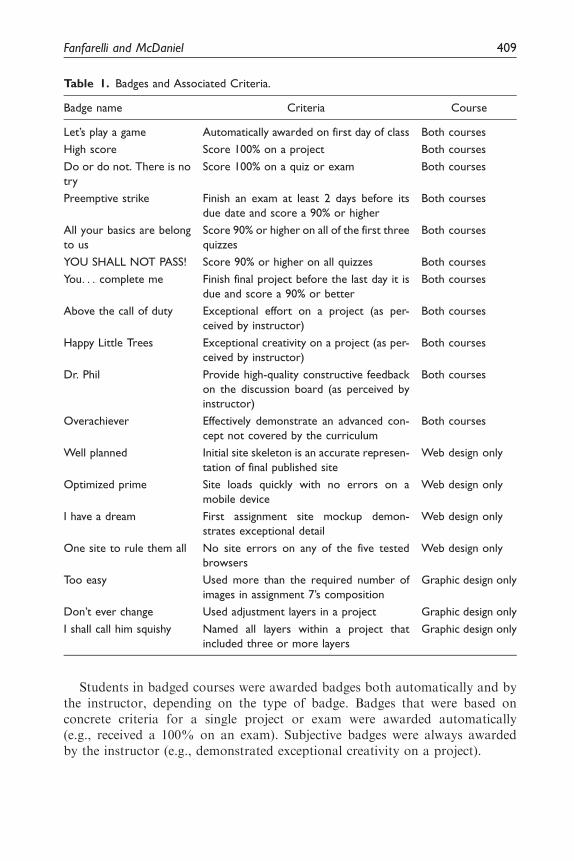
Students in badged courses were awarded badges both automatically and bythe instructor, depending on the type of badge. Badges that were based onconcrete criteria for a single project or exam were awarded automatically(e.g., received a 100% on an exam). Subjective badges were always awardedby the instructor (e.g., demonstrated exceptional creativity on a project).
Table 1. Badges and Associated Criteria.
Badge name Criteria Course
Let’s play a game Automatically awarded on first day of class Both courses
High score Score 100% on a project Both courses
Do or do not. There is no
try
Score 100% on a quiz or exam Both courses
Preemptive strike Finish an exam at least 2 days before its
due date and score a 90% or higher
Both courses
All your basics are belong
to us
Score 90% or higher on all of the first three
quizzes
Both courses
YOU SHALL NOT PASS! Score 90% or higher on all quizzes Both courses
You. . . complete me Finish final project before the last day it is
due and score a 90% or better
Both courses
Above the call of duty Exceptional effort on a project (as per-
ceived by instructor)
Both courses
Happy Little Trees Exceptional creativity on a project (as per-
ceived by instructor)
Both courses
Dr. Phil Provide high-quality constructive feedback
on the discussion board (as perceived by
instructor)
Both courses
Overachiever Effectively demonstrate an advanced con-
cept not covered by the curriculum
Both courses
Well planned Initial site skeleton is an accurate represen-
tation of final published site
Web design only
Optimized prime Site loads quickly with no errors on a
mobile device
Web design only
I have a dream First assignment site mockup demon-
strates exceptional detail
Web design only
One site to rule them all No site errors on any of the five tested
browsers
Web design only
Too easy Used more than the required number of
images in assignment 7’s composition
Graphic design only
Don’t ever change Used adjustment layers in a project Graphic design only
I shall call him squishy Named all layers within a project that
included three or more layers
Graphic design only
Fanfarelli and McDaniel 409
Students in nonbadged courses proceeded through the course ordinarily, withthe exception of completing the measures at the end of the semester. No badgeswere awarded in these courses.
Completion of study materials was optional. No benefits were offered tostudents who participated. Students who did not participate did not experienceany punishment and still received badges if they were in the badged courses.
Data Analysis
T-tests and correlation analyses were conducted with alpha defined at .05. Forcorrelations, a large effect is considered at r> .50, medium at r> .30. Effectsbelow .30 were considered negligible and are not reported. T-tests were used forall significance testing.
Results
During data collection, only a small number of participants classified themselvesas not phobic in nonbadge courses (n¼ 4), AI in either course type (nbadges¼ 2,nnoBadges¼ 2), or PI in nonbadge courses (n¼ 4). To reduce the potential forconfounds, analyses that examined these groups were not conducted.However, AI and PI participants were included when examining independenttypes in general. The total participant breakdown can be seen in Tables 2 and 3.
Minimum and maximum observed and possible values for each construct arelisted in Table 4. Note that lower values are more desirable than higher valuesfor NSSE items (collaborative learning, reflective and integrative learning, stu-dent faculty interaction, higher order learning, effective teaching practices, learn-ing strategies, and student satisfaction). A higher score for these items representsa lower score on the construct. Also note that Pearson’s r values have beenconverted for easier interpretation so that a positive value reflects a positiverelationship with the construct. No other conversions have occurred.
Figure 1. Badge examples.
410 Journal of Educational Technology Systems 43(4)

Research Question 1 Results—Aggressive Versus Passive Types
In badge courses, aggressive types scored significantly better than passive typesin intrinsic motivation, t(19)¼�2.90; p¼ .01, engagement, t(19)¼�2.95;p¼ .01, reflective and integrative learning, t(19)¼ 2.43; p¼ .03, and higherorder learning, t(19)¼ 4.03; p< .01 (see Tables 5–7).
Table 2. Participant Breakdown by Long Type.
AI PI AD PD Total
Badged 2 4 10 5 21
Nonbadged 2 6 9 6 23
Total 4 10 19 11 44
Note. AI¼ aggressive independent; PI¼ passive independent; AD¼ aggressive dependent; PD¼ passive
dependent.
Table 3. Participant Breakdown by Long Trait.
Phobic Obsessive compulsive Impulsive Hysteric None
Badged 13 14 5 6 3
Nonbadged 19 14 5 10 0
Total 32 28 10 16 3
Table 4. Minimum and Maximum Values by Construct.
Minimum
observed
Maximum
observed
Absolute
minimum
Absolute
maximum Mean SD
Final grade 63.90 98.20 0 100 86.35 8.77
Intrinsic motivation 10 47 7 49 37.30 9.31
Engagement 30 60 12 60 47.59 8.03
Collaborative learning 4 12 3 12 10.02 2.33
R&I learning 3 9 3 12 5.66 1.77
Student faculty interaction 7 16 4 16 13.95 2.39
Higher order learning 4 18 4 20 9.80 3.59
Effective teaching practices 5 17 5 25 9.93 3.45
Learning strategies 2 8 2 8 4.18 1.76
Student satisfaction 2 7 2 8 3.75 1.50
Note. SD¼ standard deviation; R&I¼ reflective and integrative.
Fanfarelli and McDaniel 411

Research Question 2 Results—Independent Versus Dependent Types
Dependent types had significantly higher student faculty interaction,t(28)¼ 2.06; p¼ .05, in badge courses than nonbadge courses. In nonbadgecourses, independent types had significantly lower engagement than dependenttypes, t(21)¼ 3.55; p< .01 (see Tables 8–10).
Table 5. Means and SDs for Aggressive and Passive Types in Badge Courses.
Maggressive SDaggressive Mpassive SDpassive
Final grade 86.24 6.81 85.04 13.03
Intrinsic motivation 41.58 4.60 32.00 10.24
Engagement 51.00 5.69 42.22 7.97
Collaborative learning 9.75 2.56 11.11 0.78
R&I learning 5.08 1.83 7.00 1.73
Student faculty Interaction 12.67 3.09 14.00 2.96
Higher order learning 7.92 2.75 12.44 2.24
Effective teaching practices 9.42 3.48 11.11 2.85
Learning strategies 3.92 1.73 5.11 1.05
Student satisfaction 3.17 1.19 4.22 1.39
Note. SD¼ standard deviation; R&I¼ reflective and integrative.
Table 6. Means and SDs for Aggressive and Passive Types in Nonbadged Courses.
Maggressive SDaggressive Mpassive SDpassive
Final grade 87.16 7.45 86.71 8.83
Intrinsic motivation 38.82 8.09 35.58 11.56
Engagement 50.00 6.56 46.00 9.47
Collaborative learning 9.55 2.16 9.92 2.94
R&I learning 5.00 1.10 5.83 1.80
Student faculty interaction 14.64 1.43 14.58 1.38
Higher order learning 8.36 3.14 11.00 4.13
Effective teaching practices 9.36 3.93 10.08 3.55
Learning strategies 3.45 1.51 4.42 2.19
Student satisfaction 3.55 1.44 4.17 1.80
Note. SD¼ standard deviation; R&I¼ reflective and integrative.
412 Journal of Educational Technology Systems 43(4)

Research Question 3 Results—Individual Types
AD and PD Types. PD types had significantly lower reflective and integrativelearning in badge courses than nonbadge courses, t(9)¼�3.00; p¼ .02.
Table 7. p Values for Research Question 1: Aggressive and Passive Types.
Aggressive vs.
passive badge
courses
Aggressive vs.
passive
nonbadge
courses
Aggressive
badges vs.
no badges
Passive badges
vs. no badges
Final grade 0.79 0.90 0.76 0.73
Intrinsic motivation **0.01 0.45 0.32 0.47
Engagement **0.01 0.26 0.70 0.35
Collaborative learning 0.14 0.74 0.84 0.25
R&I learning **0.03 0.20 0.90 0.15
Student faculty interaction 0.33 0.93 0.07 0.55
Higher order learning **<0.001 0.10 0.72 0.36
Effective teaching practices 0.25 0.65 0.97 0.49
Learning strategies 0.08 0.24 0.50 0.39
Student satisfaction 0.07 0.37 0.50 0.94
Note. R&I¼ reflective and integrative.
**Significant (p< .05).
Table 8. Means and SDs for Independent and Dependent Types in Badged Courses.
Mindependent SDindependent Mdependent SDdependent
Final grade 84.38 11.72 82.27 9.16
Intrinsic motivation 38.50 8.02 37.07 9.31
Engagement 48.67 8.76 46.67 7.84
Collaborative learning 10.67 1.03 10.20 2.40
R&I learning 5.33 1.63 6.13 3.13
Student faculty interaction 13.17 3.82 13.27 2.82
Higher order learning 9.50 4.68 10.00 2.90
Effective teaching practices 8.83 4.17 10.67 2.82
Learning strategies 4.50 1.64 4.40 1.60
Student satisfaction 3.33 1.21 3.73 1.44
Note. SD¼ standard deviation; R&I¼ reflective and integrative.
Fanfarelli and McDaniel 413

In badge courses, AD types had significantly higher intrinsic motivation,t(13)¼ 2.31; p¼ .04, engagement, t(13)¼ 2.60; p¼ .02, reflective and integrativelearning, t(13)¼�3.01; p¼ .01, and higher order learning, t(13)¼�3.13; p¼ .01,than PDs (see Tables 11–13).
Table 10. p Values for Research Question 2: Independent and Dependent Types.
Independent
vs. dependent
badge courses
Independent
vs. dependent
nonbadge courses
Badges vs.
no badges
independent
Badges vs.
no badges
dependent
Final grade 0.70 0.57 0.83 0.66
Intrinsic motivation 0.75 0.08 0.20 0.43
Engagement 0.62 **<0.001 0.10 0.08
Collaborative learning 0.65 0.23 0.33 0.32
R&I learning 0.42 0.48 **0.02 0.17
Student faculty interaction 0.95 0.12 0.55 **0.05
Higher order learning 0.77 0.37 0.15 0.47
Effective teaching practices 0.25 0.90 0.35 0.43
Learning strategies 0.90 0.46 0.53 0.27
Student satisfaction 0.40 0.06 0.53 0.54
Note. R&I¼ reflective and integrative.
**Significant (p< .05).
Table 9. Means and SDs for Independent and Dependent Types in Nonbadged Courses.
Mindependent SDindependent Mdependent SDdependent
Final grade 85.59 9.37 87.64 7.46
Intrinsic motivation 32.13 9.27 39.80 9.54
Engagement 41.13 6.92 51.53 6.59
Collaborative learning 10.63 2.13 9.27 2.69
R&I learning 5.75 2.19 5.27 1.10
Student faculty interaction 14.00 1.20 14.93 1.39
Higher order learning 10.75 5.04 9.20 3.12
Effective teaching practices 9.88 3.40 9.67 3.92
Learning strategies 4.38 2.39 3.37 1.67
Student satisfaction 4.75 1.58 3.40 1.50
Note. SD¼ standard deviation; R&I¼ reflective and integrative.
414 Journal of Educational Technology Systems 43(4)
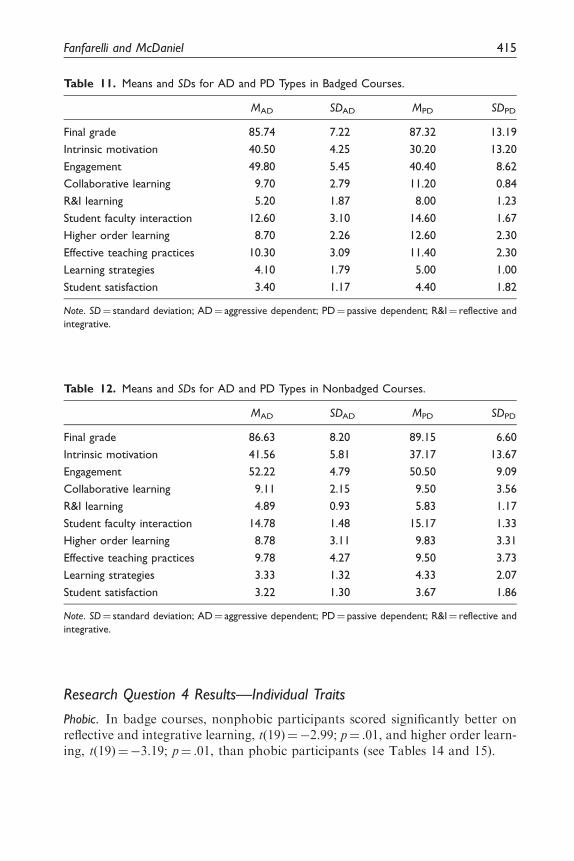
Research Question 4 Results—Individual Traits
Phobic. In badge courses, nonphobic participants scored significantly better onreflective and integrative learning, t(19)¼�2.99; p¼ .01, and higher order learn-ing, t(19)¼�3.19; p¼ .01, than phobic participants (see Tables 14 and 15).
Table 11. Means and SDs for AD and PD Types in Badged Courses.
MAD SDAD MPD SDPD
Final grade 85.74 7.22 87.32 13.19
Intrinsic motivation 40.50 4.25 30.20 13.20
Engagement 49.80 5.45 40.40 8.62
Collaborative learning 9.70 2.79 11.20 0.84
R&I learning 5.20 1.87 8.00 1.23
Student faculty interaction 12.60 3.10 14.60 1.67
Higher order learning 8.70 2.26 12.60 2.30
Effective teaching practices 10.30 3.09 11.40 2.30
Learning strategies 4.10 1.79 5.00 1.00
Student satisfaction 3.40 1.17 4.40 1.82
Note. SD¼ standard deviation; AD¼ aggressive dependent; PD¼ passive dependent; R&I¼ reflective and
integrative.
Table 12. Means and SDs for AD and PD Types in Nonbadged Courses.
MAD SDAD MPD SDPD
Final grade 86.63 8.20 89.15 6.60
Intrinsic motivation 41.56 5.81 37.17 13.67
Engagement 52.22 4.79 50.50 9.09
Collaborative learning 9.11 2.15 9.50 3.56
R&I learning 4.89 0.93 5.83 1.17
Student faculty interaction 14.78 1.48 15.17 1.33
Higher order learning 8.78 3.11 9.83 3.31
Effective teaching practices 9.78 4.27 9.50 3.73
Learning strategies 3.33 1.32 4.33 2.07
Student satisfaction 3.22 1.30 3.67 1.86
Note. SD¼ standard deviation; AD¼ aggressive dependent; PD¼ passive dependent; R&I¼ reflective and
integrative.
Fanfarelli and McDaniel 415

Obsessive compulsive. No significant results were observed for obsessive compul-sive participants (see Tables 16–18).
Impulsive. Impulsive participants had significantly lower learning strategies,t(8)¼�2.80; p¼ .02, in badge courses than nonbadge courses. Nonimpulsive
Table 13. p Values for Research Question 3: Individual Types—AD and PD.
AD vs. PD
badge courses
AD vs. PD
non-badge
courses
Badges vs.
no badges AD
Badges vs.
no badges PD
Final grade 0.77 0.54 0.80 0.77
Intrinsic motivation **0.04 0.40 0.66 0.42
Engagement **0.02 0.64 0.32 0.09
Collaborative learning 0.27 0.80 0.62 0.33
R&I learning **0.01 0.11 0.66 **0.02
Student faculty interaction 0.21 0.61 0.07 0.55
Higher order learning **0.01 0.54 0.95 0.15
Effective teaching practices 0.5 0.90 0.76 0.35
Learning strategies 0.32 0.27 0.31 0.53
Student satisfaction 0.22 0.59 0.76 0.53
Note. AD¼ aggressive dependent; PD¼ passive dependent; R&I¼ reflective and integrative.
**Significant (p< .05).
Table 14. Means and SDs for Phobic and Nonphobic Traits in Badged Courses.
Mphobic SDphobic Mnonphobic SDnonphobic
Final grade 85.28 11.65 86.45 5.85
Intrinsic motivation 35.69 10.18 40.38 5.24
Engagement 44.85 8.75 51.13 4.55
Collaborative learning 10.23 2.35 10.50 1.69
R&I learning 6.77 1.69 4.50 1.69
Student faculty interaction 14.00 2.92 12.00 2.98
Higher order learning 11.38 2.60 7.38 3.11
Effective teaching practices 10.23 2.56 10.00 4.38
Learning strategies 4.77 1.59 3.88 1.46
Student satisfaction 3.92 1.50 3.13 0.99
Note. SD¼ standard deviation; R&I¼ reflective and integrative.
416 Journal of Educational Technology Systems 43(4)

participants had significantly higher student faculty interaction, t(32)¼ 2.33;p¼ .03, in badge courses than nonbadge courses. In badge courses, nonimpulsiveparticipants scored significantly better than impulsive participants in intrinsicmotivation, t(19)¼ 2.11; p¼ .05, engagement, t(19)¼ 3.35; p< .01, reflective and
Table 15. p Values for Research Question 4: Individual Traits—Phobic and Not Phobic.
Phobic vs. not
phobic badge
courses
Phobic vs. not
phobic nonbadge
courses
Badges vs. no
badges phobic
Badges vs. no
badges not
phobic
Final grade 0.80 — 0.71 —
Intrinsic motivation 0.25 — 0.81 —
Engagement 0.08 — 0.46 —
Collaborative learning 0.78 — 0.56 —
R&I learning **0.01 — 0.06 —
Student faculty interaction 0.15 — 0.34 —
Higher order learning **0.01 — 0.32 —
Effective teaching practices 0.88 — 0.91 —
Learning strategies 0.21 — 0.17 —
Student satisfaction 0.20 — 0.83 —
Note. R&I¼ reflective and integrative.
**Significant (p< .05).
Table 16. Means and SDs for Obsessive Compulsive and Nonobsessive Compulsive Traits
in Badged Courses.
MOC SDOC Mnon-OC SDnon-OC
Final grade 85.46 8.13 86.26 13.00
Intrinsic motivation 39.00 7.21 34.43 11.33
Engagement 47.50 7.52 46.71 9.32
Collaborative learning 10.36 2.31 10.29 1.70
R&I learning 5.86 1.79 6.00 2.52
Student faculty interaction 13.29 2.87 13.14 3.58
Higher order learning 9.86 3.26 9.86 3.89
Effective teaching practices 9.64 2.90 11.14 3.93
Learning strategies 4.36 1.69 4.57 1.40
Student satisfaction 3.57 1.16 3.71 1.80
Note. SD¼ standard deviation; R&I¼ reflective and integrative.
Fanfarelli and McDaniel 417

Table 18. p Values for Research Question 4: Individual Traits—Obsessive Compulsive and
Not Obsessive Compulsive.
Obsessive
compulsive vs.
not obsessive
compulsive
badge courses
Obsessive
compulsive
vs. not obsessive
compulsive
nonbadge courses
Badges vs. no
badges obsessive
compulsive
Badges vs. no
badges not
obsessive
compulsive
Final grade 0.87 0.59 0.81 0.74
Intrinsic motivation 0.27 0.12 0.23 0.13
Engagement 0.83 0.07 0.50 0.22
Collaborative learning 0.94 0.59 0.38 0.87
R&I learning 0.88 0.98 0.52 0.58
Student faculty interaction 0.92 0.89 0.13 0.29
Higher order learning 1.00 0.54 0.85 0.67
Effective teaching practices 0.33 0.18 0.47 0.16
Learning strategies 0.78 0.32 0.93 0.10
Student satisfaction 0.83 0.64 0.45 0.96
Note. R&I¼ reflective and integrative.
**Significant (p< .05).
Table 17. Means and SDs for Obsessive Compulsive and Nonobsessive Compulsive Traits
in Nonbadged Courses.
MOC SDOC Mnon-OC SDnon-OC
Final grade 86.19 7.77 88.08 8.74
Intrinsic motivation 34.50 11.54 41.22 5.04
Engagement 45.43 8.54 51.78 6.52
Collaborative learning 9.50 2.71 10.11 2.37
R&I learning 5.43 1.70 5.44 1.33
Student faculty interaction 14.64 1.45 14.56 1.33
Higher order learning 10.14 4.40 9.11 2.93
Effective teaching practices 10.57 3.76 8.44 3.32
Learning strategies 4.29 2.27 3.44 1.13
Student satisfaction 4.00 1.75 3.67 1.50
Note. SD¼ standard deviation; R&I¼ reflective and integrative.
418 Journal of Educational Technology Systems 43(4)

integrative learning, t(19)¼�2.07; p¼ .05, and learning strategies,t(19)¼�3.06; p¼ .01 (see Tables 19–21).
Hysteric. No significant results were observed for hysteric participants (seeTables 22–24).
Table 19. Means and SDs for Impulsive and Nonimpulsive Traits in Badged Courses.
Mimp SDimp MnonImp SDnonImp
Final grade 85.98 11.28 85.65 9.54
Intrinsic motivation 30.80 12.19 39.56 6.61
Engagement 38.80 7.79 49.87 6.05
Collaborative learning 10.00 3.39 10.44 1.63
R&I learning 7.40 1.52 5.44 1.93
Student faculty interaction 14.20 3.49 12.94 2.93
Higher order learning 11.60 2.51 9.31 3.50
Effective teaching practices 10.80 1.64 9.94 3.64
Learning strategies 6.00 1.23 3.94 1.34
Student satisfaction 4.60 1.95 3.31 1.01
Note. SD¼ standard deviation; R&I¼ reflective and integrative.
Table 20. Means and SDs for Impulsive and Nonimpulsive Traits in Nonbadged Courses.
Mimp SDimp MnonImp SDnonImp
Final grade 82.74 6.18 88.09 8.23
Intrinsic motivation 35.20 9.12 37.67 10.36
Engagement 43.40 6.19 49.17 8.49
Collaborative learning 10.60 2.61 9.50 2.55
R&I learning 6.20 2.28 5.22 1.26
Student faculty interaction 14.20 1.64 14.72 1.32
Higher order learning 9.80 4.82 9.72 3.71
Effective teaching practices 8.00 2.55 10.22 3.84
Learning strategies 3.40 1.67 4.11 2.00
Student satisfaction 4.60 1.95 3.67 1.53
Note. SD¼ standard deviation; R&I¼ reflective and integrative.
Fanfarelli and McDaniel 419
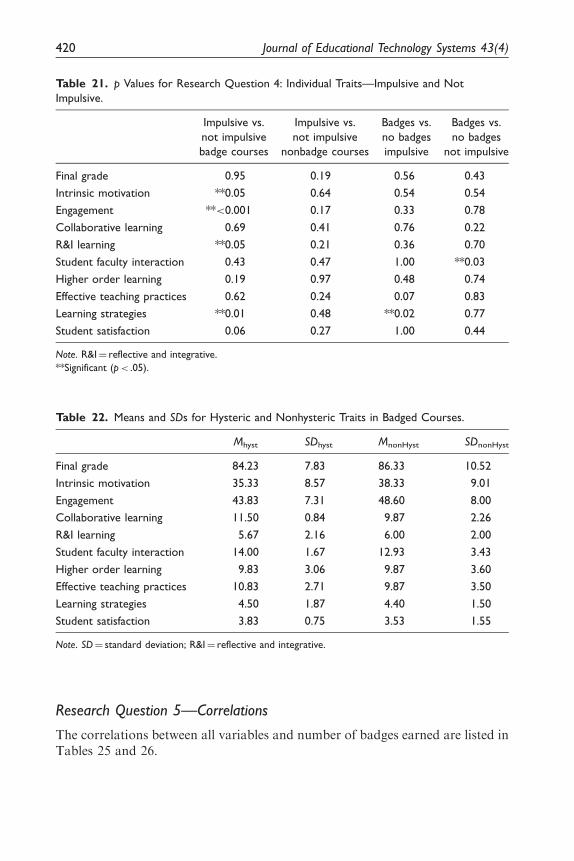
Research Question 5—Correlations
The correlations between all variables and number of badges earned are listed inTables 25 and 26.
Table 21. p Values for Research Question 4: Individual Traits—Impulsive and Not
Impulsive.
Impulsive vs.
not impulsive
badge courses
Impulsive vs.
not impulsive
nonbadge courses
Badges vs.
no badges
impulsive
Badges vs.
no badges
not impulsive
Final grade 0.95 0.19 0.56 0.43
Intrinsic motivation **0.05 0.64 0.54 0.54
Engagement **<0.001 0.17 0.33 0.78
Collaborative learning 0.69 0.41 0.76 0.22
R&I learning **0.05 0.21 0.36 0.70
Student faculty interaction 0.43 0.47 1.00 **0.03
Higher order learning 0.19 0.97 0.48 0.74
Effective teaching practices 0.62 0.24 0.07 0.83
Learning strategies **0.01 0.48 **0.02 0.77
Student satisfaction 0.06 0.27 1.00 0.44
Note. R&I¼ reflective and integrative.
**Significant (p< .05).
Table 22. Means and SDs for Hysteric and Nonhysteric Traits in Badged Courses.
Mhyst SDhyst MnonHyst SDnonHyst
Final grade 84.23 7.83 86.33 10.52
Intrinsic motivation 35.33 8.57 38.33 9.01
Engagement 43.83 7.31 48.60 8.00
Collaborative learning 11.50 0.84 9.87 2.26
R&I learning 5.67 2.16 6.00 2.00
Student faculty interaction 14.00 1.67 12.93 3.43
Higher order learning 9.83 3.06 9.87 3.60
Effective teaching practices 10.83 2.71 9.87 3.50
Learning strategies 4.50 1.87 4.40 1.50
Student satisfaction 3.83 0.75 3.53 1.55
Note. SD¼ standard deviation; R&I¼ reflective and integrative.
420 Journal of Educational Technology Systems 43(4)
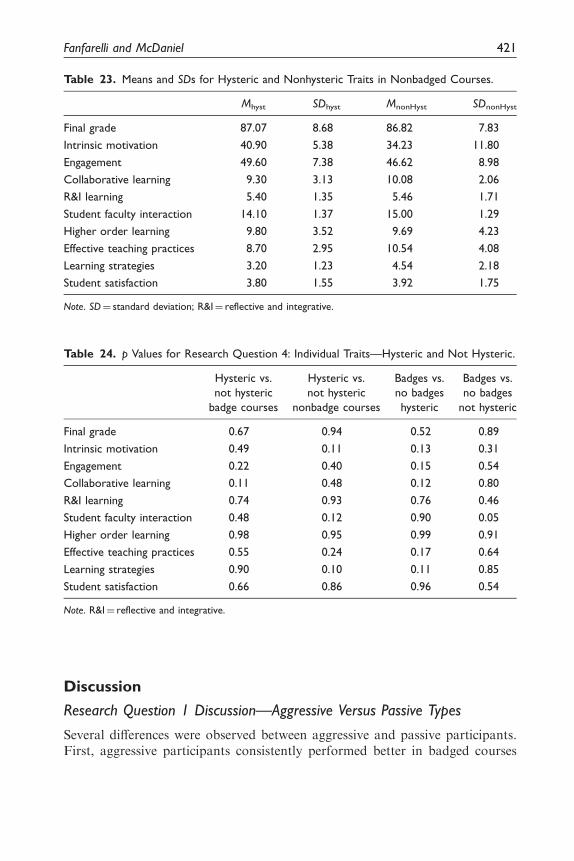
Discussion
Research Question 1 Discussion—Aggressive Versus Passive Types
Several differences were observed between aggressive and passive participants.First, aggressive participants consistently performed better in badged courses
Table 24. p Values for Research Question 4: Individual Traits—Hysteric and Not Hysteric.
Hysteric vs.
not hysteric
badge courses
Hysteric vs.
not hysteric
nonbadge courses
Badges vs.
no badges
hysteric
Badges vs.
no badges
not hysteric
Final grade 0.67 0.94 0.52 0.89
Intrinsic motivation 0.49 0.11 0.13 0.31
Engagement 0.22 0.40 0.15 0.54
Collaborative learning 0.11 0.48 0.12 0.80
R&I learning 0.74 0.93 0.76 0.46
Student faculty interaction 0.48 0.12 0.90 0.05
Higher order learning 0.98 0.95 0.99 0.91
Effective teaching practices 0.55 0.24 0.17 0.64
Learning strategies 0.90 0.10 0.11 0.85
Student satisfaction 0.66 0.86 0.96 0.54
Note. R&I¼ reflective and integrative.
Table 23. Means and SDs for Hysteric and Nonhysteric Traits in Nonbadged Courses.
Mhyst SDhyst MnonHyst SDnonHyst
Final grade 87.07 8.68 86.82 7.83
Intrinsic motivation 40.90 5.38 34.23 11.80
Engagement 49.60 7.38 46.62 8.98
Collaborative learning 9.30 3.13 10.08 2.06
R&I learning 5.40 1.35 5.46 1.71
Student faculty interaction 14.10 1.37 15.00 1.29
Higher order learning 9.80 3.52 9.69 4.23
Effective teaching practices 8.70 2.95 10.54 4.08
Learning strategies 3.20 1.23 4.54 2.18
Student satisfaction 3.80 1.55 3.92 1.75
Note. SD¼ standard deviation; R&I¼ reflective and integrative.
Fanfarelli and McDaniel 421

than passive participants, achieving significantly better scores in higher orderlearning, reflective and integrative learning, engagement, and intrinsic motiv-ation. Additionally, aggressive participants had significantly better student fac-ulty interaction in badge courses than nonbadge courses. One may consider thepossibility that passive participants did not have adequate drive to activelyengage in the hunt for badges. If this were the case, it would be expected thatpassive participants would have received fewer badges than aggressive partici-pants, which was not the case. Instead, the difference may be a reaction to otherpositive feedback received in response to additional work put in by aggressiveparticipants (e.g., grades, instructor praise, etc.), with badges playing only asupplementary role. Further research should be conducted to gain a bettergrasp on the underlying causes for the observed effects.
Research Question 2 Discussion—Independent VersusDependent Types
Significant differences were sparse between independent and dependent partici-pants. Dependent participants showed significantly higher engagement, but noother significant differences were observed between the two types.
Differences were also minimal between badge and nonbadge participantswithin each type. Dependent participants had significantly higher student facultyinteraction in badged courses than nonbadged courses, while independent par-ticipants showed no significant differences between the two course types.
The defining characteristic of dependents is that they require more approvalthan independents. Badges may seem like a great means of providing this
Table 25. Aggressiveness and Dependence Correlations.
AD PD Independent Dependent Aggressive Passive
Student satisfaction �.301 �.905 �.305 **�.557 �.253 **�.685
Learning strategies �.173 �.339 �.758 �.197 �.265 �.429
Effective teaching practices .113 �.125 �.387 .035 .06 �.14
Higher order learning .236 **�.979 �.128 �.174 .134 �.364
student faculty interaction .177 .122 �.471 .136 �.047 .136
Reflective and integrative
learning
.037 �.484 **�.904 �.091 �.136 �.211
Collaborative learning �.037 .385 **�.983 .015 �.108 .022
Engagement �.076 .321 .464 .104 �.007 .233
Intrinsic motivation �.272 .442 .546 .156 �.182 .407
Final grade **.723 .861 .506 **.778 **.724 **.725
Note. AD¼ aggressive dependent; PD¼ passive dependent.
**Significant (p< .05).
422 Journal of Educational Technology Systems 43(4)
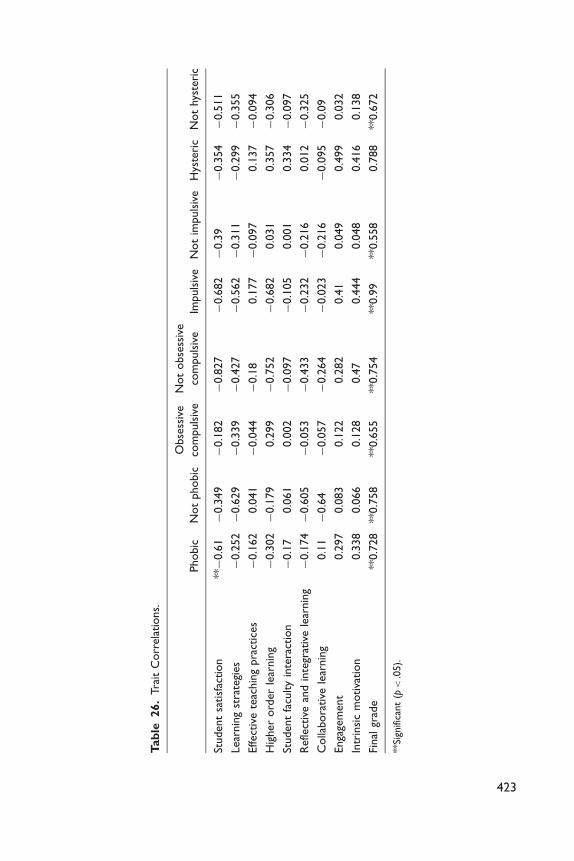
Tab
le26.
Tra
itC
orr
ela
tions.
Phobic
Not
phobic
Obse
ssiv
e
com
puls
ive
Not
obse
ssiv
e
com
puls
ive
Impuls
ive
Not
impuls
ive
Hys
teri
cN
ot
hys
teri
c
Student
satisf
action
**�
0.6
1�
0.3
49
�0.1
82
�0.8
27
�0.6
82�
0.3
9�
0.3
54�
0.5
11
Lear
nin
gst
rate
gies
�0.2
52�
0.6
29
�0.3
39
�0.4
27
�0.5
62�
0.3
11
�0.2
99�
0.3
55
Effect
ive
teac
hin
gpra
ctic
es
�0.1
62
0.0
41
�0.0
44
�0.1
80.1
77�
0.0
97
0.1
37�
0.0
94
Hig
her
ord
er
lear
nin
g�
0.3
02�
0.1
79
0.2
99
�0.7
52
�0.6
82
0.0
31
0.3
57�
0.3
06
Student
facu
lty
inte
ract
ion
�0.1
70.0
61
0.0
02
�0.0
97
�0.1
05
0.0
01
0.3
34�
0.0
97
Refle
ctiv
ean
din
tegr
ativ
ele
arnin
g�
0.1
74�
0.6
05
�0.0
53
�0.4
33
�0.2
32�
0.2
16
0.0
12�
0.3
25
Colla
bora
tive
lear
nin
g0.1
1�
0.6
4�
0.0
57
�0.2
64
�0.0
23�
0.2
16
�0.0
95�
0.0
9
Enga
gem
ent
0.2
97
0.0
83
0.1
22
0.2
82
0.4
10.0
49
0.4
99
0.0
32
Intr
insi
cm
otiva
tion
0.3
38
0.0
66
0.1
28
0.4
70.4
44
0.0
48
0.4
16
0.1
38
Final
grad
e**
0.7
28
**0.7
58
**0.6
55
**0.7
54
**0.9
9**
0.5
58
0.7
88
**0.6
72
**Si
gnifi
cant
(p<
.05).
423

approval, but they did not appear to adequately serve this role in this study. Ifbadged courses increased perception of approval, dependents would likely haveshown improved satisfaction in badge courses, probably accompanied by engage-ment. While dependents did show significantly higher engagement than inde-pendents, the effect was not seen between badge and nonbadge courses withinthe dependent group. It may be proposed that while receiving a badge was likelyviewed as a positive event which conveyed approval, submitting an assignmentand not receiving a badge for it could have been perceived as the opposite.Instead of being perceived as the mere absence of approval, it may have deliveredthe message that the assignment submission was insufficient to be awarded abadge (approval), thus discouraging dependent students. Further, student facultyinteraction was significantly higher in badge courses, which may have been aresult of student attempts to resolve this inner conflict by gaining counsel fromthe professor. Future research should reexamine these groups with a badgesystem that has skill-based badges available for all assignments to see if theconsistent potential for approval improves dependent outcomes. If increasingthe number and consistency of badges increases outcomes for dependent stu-dents, these modifications are expected to have widespread beneficial effects.
Research Question 3 Discussion—Individual Types
Dependents in this study were further categorized into ADs and PDs. ADsconsistently outperformed PDs in badged courses, scoring significantly betterin intrinsic motivation, engagement, reflective and integrative learning, andhigher order learning, while no significant differences between types wereobserved in nonbadged courses.
PDs performed significantly worse in badge courses than nonbadge coursesfor engagement and reflective and integrative learning. ADs suffered no similarill effects. ^Given these results, it seems as though the positive effects describedfor all dependents, in Research Question 2, were primarily applied to PDs. Whileboth ADs and PDs have a high need for approval, it seems likely that the higherenergy levels from ADs resulted in higher performance, resulting in greater levelsof positive feedback. PDs may not have had that experience and were unable tocounteract the effects of not receiving badges for all assignments. Deeper insightinto the effects observed for these two groups would be acquired through con-ducting research on badging systems that provide the opportunity to earnbadges along regular intervals.
Research Question 4 Discussion—Individual Traits
Obsessive compulsive and hysteric participants revealed no significant results.However, impulsive and phobic participants did show differences in comparisonto their counterparts and the presence or nonpresence of badges.
424 Journal of Educational Technology Systems 43(4)

While there were no significant differences between impulsive and nonimpul-sive participants in nonbadged courses, nonimpulsive participants showedimproved scores in three dimensions in badged courses, including intrinsicmotivation, engagement, and learning strategies. Additionally, nonimpulsiveparticipants scored significantly better on student faculty interaction inbadged courses than nonbadged courses, and impulsive students performed sig-nificantly worse in learning strategies in badged courses than nonbadgedcourses. While badges seem to have several clear benefits to nonimpulsive par-ticipants over impulsive participants, the cause is uncertain. Future studiesshould examine the underlying mechanisms for these results.
While there was an insufficient number of phobic participants to run analysesin nonbadged courses, differences were found between phobic and nonphobicparticipants in badged courses, with nonphobics performing significantly betterin higher order learning and, most interestingly, reflective and integrative learn-ing. This is particularly interesting because phobics are defined by their analytictendencies and careful considerations of possible outcomes. Despite this, pho-bics in badged courses performed less reflective and integrative learning thannonphobics. Looking deeper, the difference between reflective and integrativelearning in phobics in nonbadged courses and badged courses approached sig-nificance at p¼ .06. Badging may have had a negative impact on this type oflearning for phobics, but the reason remains unclear. Larger scale studies shouldbe conducted to more deeply examine the impact of badging systems on phobicsand their counterparts.
Research Question 5 Discussion—Correlations
Several relationships were observed, but a few, in particular, are highly remark-able. Student satisfaction showed a significant large positive relationship withnumber of badges earned, showing an increase in satisfaction as participantsearned more badges. This evidence extends the theory posited earlier in thisarticle, that dependents may have seen the absence of badges as proof of insuf-ficiency, not merely the absence of approval. This support provides further tes-tament to the need for future research examining the effects of badgingtechnologies with more badges available along consistent intervals on dependenttype learners. Additionally, independents showed medium or better positiverelationships for number of badges earned with nearly all of the tested variables.Thus, it is unlikely that a negative effect would be seen for independents if morebadges were included.
It was also proposed that the increased energy levels of AD partici-pants may have resulted in better quality work and thus higher levels ofapproval than their lower energy PD counterparts, protecting them from thenegative effects on perception of approval from not receiving badges. The cor-relational data for PDs seem to fit, showing medium or better positive
Fanfarelli and McDaniel 425

relationships between number of badges earned with final grade, intrinsic motiv-ation, engagement, collaborative learning, reflective and integrative learning,higher order learning, learning strategies, and student satisfaction. As numberof badges earned increased, so did these factors. Future research should undergofurther examination of approval as a potential mediating factor.
Conclusion
While the majority of badge research has been conducted withoutregard for individual differences, the findings from this study are indicativeof the importance of these factors. This study adds to the short butgrowing list of evidence for the existence of individual differences in the waystudents are affected by badges while providing specific points of focus for futureresearch.
In particular, PD learners warrant increased attention. They did not bene-fit to the same level as AD or independent learners. In response to theobserved data, it is proposed that dependent learners will benefit from bad-ging systems that offer badges more frequently, during regular intervals, toprovide a more consistent source of potential approval. While this type ofdesign is not expected to negatively impact non-PD learners, they should alsobe included in future experimentation to ensure negative effects are notintroduced.
Impulsiveness and phobia were also impactful in this study, with badgingshowing reduced scores on several dimensions for impulsive and phobic partici-pants over their counterparts. If a large percentage of learners for a specificcourse come from a population that is expected to have a high proportion ofimpulsiveness or phobia, a badging system may be undesirable. Future researchshould examine the underlying factors for this effect to see if it can be mitigatedthrough careful design.
As badge prevalence continues to escalate, increasing importancewill be placed on the knowledge of how students of varying characteristicsreact to various badging system designs. If optimization of a badging systemis desirable—and it is—badge studies should begin identifying the best imple-mentation methodologies for learners of varying characteristics. Given the dif-ferences observed in this study, the Long–Dziuban instrument may be aneffective starting point. Future research should take care to examine a rangeof learning styles and learner characteristics, including and beyond those men-tioned here.
Declaration of Conflicting Interests
The authors declared no potential conflicts of interest with respect to the research,authorship, and/or publication of this article.
426 Journal of Educational Technology Systems 43(4)

Funding
The authors received no financial support for the research, authorship, and/or publicationof this article.
References
Abramovich, S. J., Schunn, C., & Higashi, R. M. (2013). Are badges useful in education?
It depends upon the type of badge and expertise of learner. Education TechnologyResearch and Development, 61, 213–232.
Blair, L. (2012). The use of video game achievements to enhance player performance, self-
efficacy, and motivation (Doctoral Dissertation). University of Central Florida,pp. 1–30, Orlando, FL.
Carey, K. (2012). Show me your badge. The New York Times. Retrieved from http://www.nytimes.com/2012/11/04/education/edlife/show-me-your-badge.html?
pagewanted=all&_r=0Charleer, S., Klerkx, J., Santos, J. L., & Duval, E. (2013). Improving awareness and
reflection through collaborative, interactive visualizations of badges. Proceedings of
ARTEL ’13 (pp. 69–81). Paphros, Cyprus.Charlton, J., & Danforth, I. (2005). Distinguishing addiction and high engagement in the
context of online game playing. Computers in Human Behavior, 23(3), 1531–1548.
Cioffi, D. H. (1995). An Investigation of Reactive Behavior Patterns in AdvancedPlacement Students (Unpublished doctoral dissertation). Orlando, FL: University ofCentral Florida.
Combs, D. (2004). Predicting licensing examination performance with cognitive style and
reactive behavior pattern assessment (Doctoral dissertation). Retrieved from ProQuest,UMI Dissertations Publishing (3162088).
Denny, P. (2013). The effect of virtual achievements on student engagement. Proceedings
of the SIGCHI Conference on Human Factors in Computing Systems (pp. 763–772).New York, NY: ACM.
Dziuban, J. I., & Dziuban, C. D. (1998). Reactive behavior patterns in the classroom.
Journal of Staff, Program, and Organization Development, 15(2), 85–91.Dziuban, C. D., Moskal, P. D., & Dziuban, E. K. (2000). Reactive behavior patterns go
online. Journal of Staff, Program & Organization Development, 17(3), 171–182.
Fitz-Walter, Z., Tjondronegoro, D., & Wyeth, P. (2011). Orientation passport: Usinggamification to engage university students. Proceedings of the 23rd AustralianComputer-Human Interaction Conference (pp. 122–125). New York, NY: ACM.
Frederiksen, L. (2013). Digital badges. Public Services Quarterly, 9, 321–325.
Hakulinen, L., & Auvinen, T. (2014). The effect of gamification on students with differentachievement goal orientation. Proceedings of the International Conference on Teachingand Learning in Computing and Engineering (pp. 9–16). Kuching, Malaysia.
Jennett, C., Cox, A., Cairns, P., Dhoparee, S., Epps, A., Tijs, T., . . .Walton, A. (2008).Measuring and defining the experience of immersion in games. International Journal ofHuman Computer Studies, 66(9), 641–661.
Junkins, N. R. (2000). A study of the impact of long reactive behavior patterns on gradenine placement and academic achievement in mathematics (Doctoral dissertation).Retrieved from ProQuest, UMI Dissertations Publishing (9977816).
Fanfarelli and McDaniel 427
Khaddage, F., Baker, R., & Knezek, G. (2012). If not now! When? A mobile badge rewardsystem for K-12 teachers. In P. Resta (Ed.), Proceedings of the Society for Information
Technology&Teacher Education InternationalConference (pp. 2900–2905). Chesapeake,VA: Association for the Advancement of Computing in Education (AACE).
Long, W. A. (1975). Adolescent maturation: A clinical overview. Postgraduate Medicine,
57(3), 54–60.Long, W. A. (1985). The practitioner and adolescent medicine. Seminars in Adolescent
Medicine, 1(1), 85–90.Mehta, N. B., Hull, A. L., Young, J. B., & Stoller, J. K. (2013). Just imagine: New
paradigms for medical education. Academic Medicine, 88(10), 1418–1423.Mozilla (2014). Mozilla OpenBadges. Retrieved from http://www.openbadges.orgNational Survey for Student Engagement. (2014). Survey Instrument. National Survey for
Student Engagement. Retrieved from http://nsse.iub.edu/html/survey_instruments.cfmPurdue. (2014). Passport. Purdue University. Retrieved from http://www.itap.purdue.edu/
studio/passport/
Rosewell, J. (2012). A speculation on the possible use of badges for learning at the UKOpen University. Proceedings of the EADTU Annual Conference: The Role of Open andFlexible Education in European Higher Education Systems for 2020: New Models, New
Markets, New Media (pp. 1–15), 27–28 September 2012, Paphos, Cyprus.Ryan, R. M. (1982). Control and Information in the intrapersonal sphere: An extension of
cognitive evaluation theory. Journal of Personality and Social Psychology, 43, 450–461.Salapa, S. (2000). The relationship between student personality types and traits and instruc-
tor feedback in dance education (Unpublished doctoral dissertation). University ofCentral Florida, Orlando.
Stewart, M. (2013). Digital badges at the agricultural sustainability institute. The Wheel:
The Instructional Technology Blog of ATS at UC Davis. Retrieved from http://wheel.ucdavis.edu/2013/11/digital-badges-at-the-agricultural-sustainability-institute/
Author Biographies
Joseph R. Fanfarelli is Visiting Faculty of Digital Media for the School of VisualArts and Design at the University of Central Florida. He holds a PhD inmodeling & simulation, with a background in psychology. His primary researchinterest involves combining psychology and game-based methodologies toimprove education.
Rudy McDaniel is Associate Professor of Digital Media for the School of VisualArts and Design at the University of Central Florida. He received his PhD inTexts and Technology from UCF in 2004 and holds additional degrees in com-puter science, psychology, and technical communication. His research focuseson the integration of technology and the humanities as well as interactive story-telling and game-based learning. He currently serves as Assistant Dean ofTechnology and Research for the College of Arts and Humanities andDirector of the Texts and Technology doctoral program at UCF.
428 Journal of Educational Technology Systems 43(4)