Resting-state networks predict individual differences in common and specific aspects of executive...
10
Full Length Articles Resting-state networks predict individual differences in common and specific aspects of executive function Andrew E. Reineberg a, ⁎, Jessica R. Andrews-Hanna b , Brendan E. Depue a,b , Naomi P. Friedman a,c , Marie T. Banich a,b a Department of Psychology and Neuroscience, University of Colorado Boulder, Muenzinger D244, 345 UCB, Boulder, CO 80309-034, USA b Institute of Cognitive Science, University of Colorado Boulder, 344 UCB, Boulder, CO 80309-0344, USA c Institute for Behavioral Genetics, University of Colorado Boulder, 1480 30th St., Boulder, CO 80303, USA abstract article info Article history: Accepted 18 September 2014 Available online 2 October 2014 Keywords: Executive control rs-fcMRI Individual differences Behavior ICA The goal of the present study was to examine relationships between individual differences in resting state func- tional connectivity as ascertained by fMRI (rs-fcMRI) and performance on tasks of executive function (EF), broad- ly defined as the ability to regulate thoughts and actions. Unlike most previous research that focused on the relationship between rs-fcMRI and a single behavioral measure of EF, in the current study we examined the re- lationship of rs-fcMRI with individual differences in subcomponents of EF. Ninety-one adults completed a resting state fMRI scan and three separate EF tasks outside the magnet: inhibition of prepotent responses, task set shifting, and working memory updating. From these three measures, we derived estimates of common aspects of EF, as well as abilities specific to working memory updating and task shifting. Using Independent Components Analysis (ICA), we identified across the group of participants several networks of regions (Resting State Net- works, RSNs) with temporally correlated time courses. We then used dual regression to explore how these RSNs covaried with individual differences in EF. Dual regression revealed that increased higher common EF was associated with connectivity of a) frontal pole with an attentional RSN, and b) Crus I and II of the cerebellum with the right frontoparietal RSN. Moreover, higher shifting-specific abilities were associated with increased con- nectivity of angular gyrus with a ventral attention RSN. The results of the current study suggest that the organi- zation of the brain at rest may have important implications for individual differences in EF, and that individuals higher in EF may have expanded resting state networks as compared to individuals with lower EF. © 2014 Elsevier Inc. All rights reserved. Introduction When individuals are not engaged in an experimentally-directed task (i.e., are in a “resting state”), distinct networks of widely separated brain regions can be identified as sharing similar temporal patterns of functional activity (Fox and Raichle, 2007) — a phenomenon often re- ferred to as “resting state functional connectivity MRI” (rs-fcMRI). These “resting state networks” [RSNs] show strong correspondence with regions that tend to co-activate during performance of a class of tasks (e.g., language processing tasks; Smith et al., 2009). Moreover, the organization of such networks has been found to have behavioral and clinical relevance. A large body of literature indicates that RSNs are altered across a plethora of neurological and clinical populations, in- cluding Alzheimer's disease, schizophrenia, depression, attention deficit hyperactivity disorder, and others (for reviews see Greicius, 2008; Zhang and Raichle, 2010). More recently, research has focused on how individual differences in abilities among neurologically normal individuals are related to the or- ganization and extent of networks identified by rs-fcMRI. For example, patterns of rs-MRI are associated with fluid intelligence (Cole et al., 2012), attentional vigilance (Thompson et al., 2012), performance on the trail making test (Seeley et al., 2007), working memory (Hampson et al., 2006; Gordon et al., 2012), and the ability to maintain attentional control in the face of distracting information (Kelly et al., 2008). In gen- eral, however, there is a paucity of studies that examine the relationship between rs-fcMRI and individual differences in executive function (EF), the ability to engage in and guide goal-oriented behavior. Because EF is a broad umbrella term that encompasses a wide variety of specific func- tions and component processes (Miyake et al., 2000), our approach in the current study is to examine the relationship between RSNs and indi- vidual differences in both general and specific subcomponents of EF in a large sample of participants. Moreover, we take a novel approach of in- vestigating this issue by embedding our research within the framework NeuroImage 104 (2015) 69–78 ⁎ Corresponding author at: Muenzinger D244, 345 UCB, Boulder, CO 80309-0345, USA. E-mail address: [email protected] (A.E. Reineberg). http://dx.doi.org/10.1016/j.neuroimage.2014.09.045 1053-8119/© 2014 Elsevier Inc. All rights reserved. Contents lists available at ScienceDirect NeuroImage journal homepage: www.elsevier.com/locate/ynimg
-
Upload
independent -
Category
Documents
-
view
0 -
download
0
Transcript of Resting-state networks predict individual differences in common and specific aspects of executive...

NeuroImage 104 (2015) 69–78
Contents lists available at ScienceDirect
NeuroImage
j ourna l homepage: www.e lsev ie r .com/ locate /yn img
Full Length Articles
Resting-state networks predict individual differences in common andspecific aspects of executive function
Andrew E. Reineberg a,⁎, Jessica R. Andrews-Hanna b, Brendan E. Depue a,b,Naomi P. Friedman a,c, Marie T. Banich a,b
a Department of Psychology and Neuroscience, University of Colorado Boulder, Muenzinger D244, 345 UCB, Boulder, CO 80309-034, USAb Institute of Cognitive Science, University of Colorado Boulder, 344 UCB, Boulder, CO 80309-0344, USAc Institute for Behavioral Genetics, University of Colorado Boulder, 1480 30th St., Boulder, CO 80303, USA
⁎ Corresponding author at: Muenzinger D244, 345 UCBE-mail address: [email protected] (A.E.
http://dx.doi.org/10.1016/j.neuroimage.2014.09.0451053-8119/© 2014 Elsevier Inc. All rights reserved.
a b s t r a c t
a r t i c l e i n f oArticle history:Accepted 18 September 2014Available online 2 October 2014
Keywords:Executive controlrs-fcMRIIndividual differencesBehaviorICA
The goal of the present study was to examine relationships between individual differences in resting state func-tional connectivity as ascertained by fMRI (rs-fcMRI) and performance on tasks of executive function (EF), broad-ly defined as the ability to regulate thoughts and actions. Unlike most previous research that focused on therelationship between rs-fcMRI and a single behavioral measure of EF, in the current study we examined the re-lationship of rs-fcMRIwith individual differences in subcomponents of EF. Ninety-one adults completed a restingstate fMRI scan and three separate EF tasks outside the magnet: inhibition of prepotent responses, task setshifting, and working memory updating. From these three measures, we derived estimates of common aspectsof EF, as well as abilities specific to workingmemory updating and task shifting. Using Independent ComponentsAnalysis (ICA), we identified across the group of participants several networks of regions (Resting State Net-works, RSNs) with temporally correlated time courses. We then used dual regression to explore how theseRSNs covaried with individual differences in EF. Dual regression revealed that increased higher common EFwas associatedwith connectivity of a) frontal pole with an attentional RSN, and b) Crus I and II of the cerebellumwith the right frontoparietal RSN.Moreover, higher shifting-specific abilitieswere associatedwith increased con-nectivity of angular gyrus with a ventral attention RSN. The results of the current study suggest that the organi-zation of the brain at rest may have important implications for individual differences in EF, and that individualshigher in EF may have expanded resting state networks as compared to individuals with lower EF.
© 2014 Elsevier Inc. All rights reserved.
Introduction
When individuals are not engaged in an experimentally-directedtask (i.e., are in a “resting state”), distinct networks of widely separatedbrain regions can be identified as sharing similar temporal patterns offunctional activity (Fox and Raichle, 2007) — a phenomenon often re-ferred to as “resting state functional connectivity MRI” (rs-fcMRI).These “resting state networks” [RSNs] show strong correspondencewith regions that tend to co-activate during performance of a class oftasks (e.g., language processing tasks; Smith et al., 2009). Moreover,the organization of such networks has been found to have behavioraland clinical relevance. A large body of literature indicates that RSNsare altered across a plethora of neurological and clinical populations, in-cluding Alzheimer's disease, schizophrenia, depression, attention deficit
, Boulder, CO 80309-0345, USA.Reineberg).
hyperactivity disorder, and others (for reviews see Greicius, 2008;Zhang and Raichle, 2010).
More recently, research has focused on how individual differences inabilities among neurologically normal individuals are related to the or-ganization and extent of networks identified by rs-fcMRI. For example,patterns of rs-MRI are associated with fluid intelligence (Cole et al.,2012), attentional vigilance (Thompson et al., 2012), performance onthe trail making test (Seeley et al., 2007), working memory (Hampsonet al., 2006; Gordon et al., 2012), and the ability to maintain attentionalcontrol in the face of distracting information (Kelly et al., 2008). In gen-eral, however, there is a paucity of studies that examine the relationshipbetween rs-fcMRI and individual differences in executive function (EF),the ability to engage in and guide goal-oriented behavior. Because EF is abroad umbrella term that encompasses a wide variety of specific func-tions and component processes (Miyake et al., 2000), our approach inthe current study is to examine the relationship betweenRSNs and indi-vidual differences in both general and specific subcomponents of EF in alarge sample of participants. Moreover, we take a novel approach of in-vestigating this issue by embedding our researchwithin the framework

70 A.E. Reineberg et al. / NeuroImage 104 (2015) 69–78
of a prominent and well-grounded theoretical model of EF, known asthe unity and diversity model (for a review, see Miyake and Friedman,2012). This model, based on intercorrelated patterns of performanceacross individuals on multiple measures of EF, suggests that many im-portant aspects of EF can be reduced into at least three latent factors.The first is a common EF factor, representing the unity aspect of themodel, on which all measured EF tasks load. This factor is thought torepresent the general capacity to maintain a task goal, or “attentionalset,” and is thought to be a common feature of all EF tasks. The secondtwo orthogonal factors represent the diversity aspect of the model andare more specific processes above and beyond common EF. Statisticallyspeaking, these factors are residuals of the EF abilities once common EFhas been taken into account. One factor, the shifting-specific factor, cap-tures processes relating to flexibly shifting between different task ormental sets, while the other factor, the updating-specific factor, indexesthe process of rapidly adding or deleting information from the contentsof working memory.
Theoretical considerations, computational modeling, and empiricalresearch by our group and others suggest that these three EF factorsare likely to be supported by overlapping yet somewhat distinct brainsystems (Miyake and Friedman, 2012; Herd et al., 2013). The ability tostably maintain a task goal is thought to rely on areas of lateral prefron-tal cortex extending from BA 10 through mid-dorsolateral prefrontalcortex (Banich, 2009; Braver, 2012; Herd et al., 2006; Sakai, 2008), po-tentially including the anterior cingulate and frontal operculum aswell (Dosenbach et al., 2008). Set shifting involves changes in thefocus of attention andmay engagemore posterior regions of dorsolater-al prefrontal cortex (e.g., inferior frontal junction) as well as parietal re-gions (e.g., intraparietal sulcus;Wager et al., 2004;Derrfuss et al., 2005).Working memory updating has been suggested to involve fronto-striatal connections and requires input from the basal ganglia (Braveret al., 1997; O'Reilly and Frank, 2006; McNab and Klingberg, 2008).Using task-related fMRI across multiple EF tasks, Collette et al. (2005)found that regions commonly activated across EF tasks include the leftsuperior parietal gyrus and the right intraparietal sulcus, and to a lesserdegree, mid- and inferior prefrontal regions. Moreover, left frontopolarcortex (BA 10) activity was specifically associated with updating-specific EF, while activity of the left intraparietal sulcus was associatedwith shifting-specific EF.
Given the relatively limited scope of prior research on rs-fcMRI andEF, the current study had a number of major objectives. First, wewantedto determinewhether patterns of rs-fcMRI are associatedwith individualdifferences in both common and specific factors underlying EF. Second,given the research suggesting that these three EF factors may engagesomewhat different brain regions, we wanted to ascertain whether dif-ferent aspects of rs-fcMRI predicted individual differences for each ofthe three EF factors investigated (i.e., common EF, updating-specific EF,shifting-specific EF). Third, wewanted to disentanglewhether individualdifferences in these three aspects of EF are associated with activity inRSNs that are composed of regions commonly activated across individ-uals when performing EF tasks (e.g., the fronto-parietal network), and/or whether they are influenced by activity in RSNs outside those tradi-tionally thought to be engaged in EF (e.g., medial frontal/limbic net-work). Finally, we wanted to investigate how individual differences inEFmight predict alterations in either the degree to which specific subre-gions coactivate as part of a particular RSNs (e.g., more intense connec-tivity of DLPFC within the fronto-parietal network) or the compositionof particular RSNs (e.g., a greater spatial extent of the fronto-parietal net-work). Our hypothesis was that rs-fcMRI would be associated with indi-vidual differences in these three aspects of EF. However, based on thepaucity of prior research, our investigation was more exploratory withregard to how exactly such individual differences wouldmanifest. To in-vestigate these questions, we utilized dual regression to extract subject-specific versions of classic RSNs and then performed statistical tests todeterminehow individual variation in these RSNspredicted EF as charac-terized by the unity and diversity model.
Material and methods
Participants
Onehundred individuals aged 18 to 34 years (M= 22.3, SD= 9.92)from the University of Colorado Boulder participated for payment overtwo sessions. Participants were paid $25.00 per hour for the fMRI ses-sion and $10.00 per hour for the behavioral session. Session one in-volved the administration of behavioral tasks that measured EF ability.Session two involved the acquisition of anatomical and functionalbrain data via magnetic resonance imaging. The two sessions occurredwithin an average of 31.6 days of each other. Functional brain datafrom six participants were discarded due to excessive levels of move-ment during the scanning session (greater than 3 mm in a singledimension). Additionally, data from three participants were discardeddue to failure to comply with rules on one of more of the behavioraltasks. All presented results are from analyses of data from the remaining91 participants (48 females).
Procedures
In session one, three behavioral tasks were administered from thebattery of nine tasks typically used in studies that have provided evi-dence for the unity and diversity model of EF (see Miyake et al., 2000;updated in Miyake and Friedman, 2012): antisaccade, categoryswitching, and keep track. These three tasks were chosen becausethey load most highly on common EF, switching-specific, andupdating-specific factors, respectively, in a prior large scale study inwhich the full battery of EF tasks was administered (Friedman et al.,2012). A variety of self-report questionnaires (e.g., emotion regulationstyle, trait rumination, worry, distractibility) and genetic data were ac-quired during session 1. Analyses of questionnaire data are outside thescope of the current study. Analyses of genetic datawere not performeddue to lack of a replication sample.
In session two, participants were scanned in a Siemens Tim Trio 3Tscanner. During a 5.5 minute resting state scan, participants wereinstructed to relax and close their eyes.
Session 1: behavioral tasks
Antisaccade task (adapted from Roberts, Hager, & Heron, 1994)This task measures a person's ability to inhibit an automatic process
(an eyemovement). Participants were instructed to focus on a centrallylocated fixation cross (lasting 1.5–3.5 s). When the fixation cross disap-peared, an initial box cue flashed 10 cm either to the right or to the leftof fixation. The cue disappeared after a fixed interval (233, 200, or183 ms), after which the target (a digit, 1 through 9) appeared for150 ms before being masked with gray cross-hatching. Participantsnamed the number they saw aloud and the experimenter typed intheir response, triggering the next trial to begin. For some trials, thecue was helpful in that it indicated the location at which the target ap-peared (prosaccade trials). In other trials – antisaccade trials – the cueappeared on the opposite side of the screen as the target. The taskbeganwith a block of 18 prosaccade trials in which the cue disappearedafter 183 ms to establish that participants could perform the easyprosaccade trials within the most stringent time demands. Participantswere then given three blocks of 36 antisaccade trials (with 233, 200, or183 ms cue durations, respectively). Participants typically vary in theirability to identify the target on antisaccade trials because it is difficultto inhibit the automatic tendency to look towards an object, in thiscase the cue. The dependent measure was average accuracy for thethree blocks of antisaccade trials.
Category switch task (adapted from Mayr and Kliegl, 2000)This taskmeasures a person's ability to quickly and accurately switch
between different modes of categorization. Participants were asked to

preprocessed functional brain data
29 ICA components
classic resting-state
networks (n=15)
Dual Regression Results
FSL Melodic ICA
Correlations with classic
RSNs (Yeo et al. 2011)
FSL Dual Regression
Non-cortical, artifactual,
noise components (n=14)
Fig. 1. The data processing pipeline for resting state data in the current study.
71A.E. Reineberg et al. / NeuroImage 104 (2015) 69–78
categorize words (e.g., alligator, knob, coat, lion) either with regard toanimacy (living/non-living) or size (smaller/larger than a soccer ball)depending on a cue that appeared above the word (heart or crossed ar-rows). After two pure blocks of 32 trials each that involved categorizingitems along a single dimension (e.g., just on animacy), participants com-pleted two blocks of 64 trials each that contained a mixture of trials inwhich some trials required judgments regarding animacy and others re-quired judgments regarding size. The trials in these blocks were pre-sented in a fixed pseudorandom order such that the subtasks occurredequally often, and 50% of the trials involved a switch from one subtaskto the other. Participants were given unlimited time to respond oneach trial, but were instructed to respond as swiftly and accurately aspossible. The dependent measure was the switch cost: the differencebetween average reaction time for correct switch trials and correct re-peat trials during the mixed blocks for each subject. Trials following er-rors were eliminated because it was not clear that the correct set wasachieved (precluding categorization of whether the subsequent trialwas either a switch or repeat trial). Reaction times identified aswithin-subject outliers by the Wilcox–Kessleman trimming procedure(Wilcox and Keselman, 2003) were also removed before averaging.
Keep track task (adapted from Yntema, 1963)This task measures the ability to update working memory. A stream
of words is presented, one at a time. Thewords belong to six categories:relatives, countries, colors, animals, metals, and distances, with sixwords in each category. Participants were asked to keep track of themost recently presentedwords from two tofive given categories and re-port them verbally at the end of the trial. Sixteen trials were adminis-tered, with each trial containing a stream of 15–25 words. After twopractice trials with two categories to remember, there were four blocks,each with one two-, three-, four-, and five-category trials, for a total of16 trials. The order of the trials within each blockwas fixed in a pseudo-random order. Each trial began with the list of categories, whichremained at the bottomof the screen until thefinal recall. Eachword ap-peared for 2000ms, followed by the nextword. The dependentmeasurewas each participant's accuracy in recalling the target words.
EF scoresWe extracted three factors – common EF, shifting-specific, and
updating-specific – in accordance with prior research. The lack of aninhibition-specific factor reflects a recent update to the unity and diver-sity framework that highlighted the complete overlap of common EFand inhibition-specific variance in behavioral tasks in several samplesof adults and adolescents (Miyake and Friedman, 2012). Common EFwas calculated by taking the average of each subject's three tasks con-verted to a Z-value (across the group of 91 participants). Shifting-specificwas the residual variance in the category switch task, regressingout common EF. Updating-specific was the residual variance in the keeptrack task, regressing out common EF. This procedure left shifting- andupdating-specific orthogonal to Common EF; however, the shifting-and updating-specific residuals were significantly negatively correlated(r=− .61, p b 0.05). This method of calculating EF component scores issimilar to that performed in a recent related study from our laboratorydemonstrating that individual differences in these EF component scorespredict individual differences in gray matter volume and gyrificationindex of prefrontal regions as well as fractional anisotropy of specificneural tracts that connect prefrontal regions with posterior brain areas(Smolker et al., 2014). Shapiro–Wilk's tests confirmed that all three EFmeasures were normally distributed. Higher scores on three compositemeasures correspond to greater ability in that construct (i.e. maintain agoal, shift between task/mental sets, or update working memory).
Session 2: brain imaging
Neuroanatomical data were acquired with T1-weighted MP RAGEsequence (acquisition parameters: repetition time (TR) = 2530 ms,
echo time (TE) = 1.64, matrix size = 256 × 256 × 192, flip angle(FA)=7 deg., slice thickness=1mm). Resting state data was acquiredwith a T2*-weighted echo-planar functional scan (acquisition parame-ters: number of volumes = 165, TR = 2000 ms, TE = 29 ms, matrixsize = 64 × 64 × 33, FA = 75 deg., slice thickness = 3.5 mm, field ofview (FOV) = 240 mm).
Analysis of brain data was performed via a multi-step process (seeFig. 1 for summary). First, Independent Components Analysis (ICA)was used to identify networks of brain regions whose activity was cor-related across the group of participants. From these so-identified ICAcomponents, we selected those that were significantly correlated withthose of a reference study with a larger number of individuals (Yeoet al., 2011) and discarded those that were irrelevant to the current in-vestigation (e.g., atypical RSNs and artifactual components; see belowfor procedure). For the relevant networks, dual regression was used toderive subject-specificmaps of the group-identifiedRSNs. Finally, statis-tical analyses were performed to identify differences in the subject-specific RSN maps that predicted EF ability.
Preprocessing
All processing of brain data was performed in a standard install ofFSL build 5.06 (Jenkinson et al., 2012). To account for signal stabilization,the first four volumes of each individual functional scan were removed,yielding 161 volumes per subject for additional analysis. The functionalscans were corrected for headmotion usingMCFLIRT, FSL's motion cor-rection tool. Brain extraction (BET) was used to remove signal associat-ed with non-brain material (e.g., skull, and sinuses). FSL's FLIRT utilitywas used to perform a boundary-based registration of each participant'sfunctional scan to his or her anatomical volume and a 6° of freedom af-fine registration to MNI152 standard space. Finally, the scans were con-verted to 4 mm voxel size, smoothed (5 mm FWHM), and high-passfiltered (.01 Hz threshold).
Independent components analysis
To decompose the functional brain data into various independentspatiotemporal components, Independent Components Analysis (ICA)was performed on the preprocessed functional scans using MelodicICAversion 3.14 (Beckmannand Smith, 2004). A dimensionality estima-tion using the Laplace approximation to the Bayesian evidence of themodel order was performed (Beckmann and Smith, 2004). This

72 A.E. Reineberg et al. / NeuroImage 104 (2015) 69–78
procedure yielded 29 spatiotemporal components. While one commonapproach for identifying “classical” resting-state networks from a poolof ICA components is to have an expert subjectively label ICA compo-nents as signal (e.g., right frontoparietal network, and default network)or noise (edge effects, movement, etc.), we opted to use a different RSNidentification procedure to select RSNs for further analysis. We statisti-cally compared the spatialmap of each ICA component to a set of 7 pop-ular RSNs from analysis of resting-state data from approximately 1000participants (Yeo et al., 2011). We used FLS's “fslcc” tool to calculatePearson's r for each pairwise relationship and kept only those ICAcomponents that yielded a significant spatial correlation (Pearson'sr N .207) with one of the RSNs from Yeo et al. (2011). This procedureidentified and helped label 15 RSNs, and identified 14 ICA componentsthat did not significantly correlate with a reference network. ICA com-ponents that did not significantly correlate with a reference networkwere eliminated from further analysis. Further inspection confirmedthat the eliminated components were likely artifactual (e.g., edgeeffects) or were predominantly high frequency signal according to apower frequency distribution curve (i.e., physiological noise such asheartbeat-induced movement).
Dual regression
Dual regression is a method that uses unthresholded group-level in-dependent component maps to generate both subject-specific com-ponent time courses and subject-specific spatial maps as output(Beckmann et al., 2009). Here we focus on subject-specific spatialmaps to examine how EF influences the composition of the networks.Dual regression can be broken down into two steps: First, for each sub-ject, the group-average set of spatial maps is regressed (as spatial re-gressors in a multiple regression) on the subject's 4D spatio-temporaldataset (i.e., brain volumes across time). This process results in a set ofsubject-specific time series, one per group-level component. Next,those time series are regressed (as temporal regressors, again in a mul-tiple regression) into the same 4D dataset, resulting in a set of subject-specific components, one per group-level component. Subject-specificcomponents are whole brain images. Some subjects express a givenRSN that is very similar to the group level RSN while others have varia-tions of the group level RSN (e.g., have an expanded RSN or highconnectivity of a particular region of a given RSN). Statistical analyses(discussed below) are performed on these whole brain subject-specific RSNs to determine areas that covary with behavioral covariatesof interest, in our case, level of EF.
In the present study, the associations between EF measures andsubject-specific RSNs were analyzed using Randomise, FSL's nonpara-metric permutation testing tool (Jenkinson et al., 2012), with 5000 per-mutations and threshold free cluster enhancement (TFCE) to correct formultiple comparisons. Permutation testing was performed while con-trolling for between-subject differences in transient movementthroughout the scanning session in accordance with Van Dijk et al.(2012). Two summary motion regressors were created for each subjectand entered into Randomise as control variables: average motion in thex, y, and z planes (mean translation) and average roll, pitch, and yaw(mean rotation) across the resting state run. The permutation testingprocedure was run for each set of subject-specific RSNs (one for eachgroup-level RSN of interest), thus the resulting statistical images revealhow variation in RSNs predict differences in EF. For example, the per-mutation testing procedure could reveal that individuals with an ex-panded RSN (i.e., expanded to areas outside the areas included in thegroup-level RSN) have greater EF.
To account for the possibility that performance of EF tasks in sessionone could affect resting-state functional connectivity in session two, weperformed an additional series of dual regression analyses adding timebetween session one and two as a covariate in addition to EF andmotionvariables. We found no difference in the observed effects of EF after theaddition of this covariate and nomain effects of time between sessions.
For the sake of simplicity, only results from models that included EF,mean translation, and mean rotation are reported below.
Results
Behavioral data
We performed a check to ensure the data was suitable for the pro-posed analyses. As anticipated, there were no floor or ceiling effectsand scores varied considerably across the group of participants. Averageresults onmeasures of interestwere slightly higher than performance ina large (n = 735+) population sample of young adults (mean age of22.8 compared to 20.8 in the current study; Friedman et al., inpreparation): The mean antisaccade accuracy was 75.5% (SD = 31.4),the mean category-switch cost was 174.3 ms (SD = 123.9 ms), andthe mean keep-track accuracy was 76.1% (SD= 8.33).
Independent components analysis
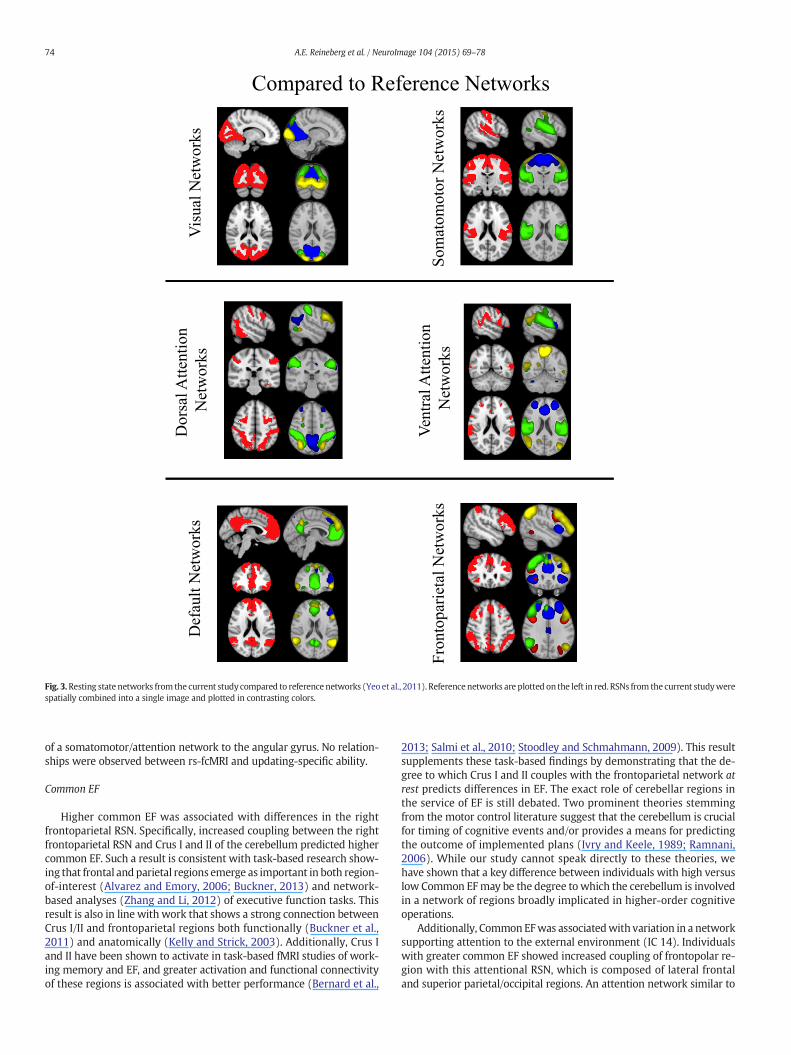
The 15 RSNs of interest in the present study were, with one excep-tion, subsets of the large seven major RSNs identified by Yeo et al.(2011): visual, somatomotor, dorsal attention, limbic, ventral attention,default, and frontoparietal networks (see Fig. 2). For all but Yeo's ventralattention and limbic network, there was more than a single RSN thatcorrelated significantly with themasks fromYeo et al. (2011). Addition-ally, five of the 15 RSNs from the current study significantly correlatedwithmore than onenetwork (e.g., to both the ventral attention networkand the frontoparietal network of Yeo et al. (2011)). In Fig. 2, we showthe independent component (IC) numbers from our Melodic outputunder the label of the reference networks from Yeo et al. (2011). InFig. 2, our independent components are thresholded at a level consis-tent with previous research (z = 5, compared to 3 b z b 9 (Rytty et al.,2013), 4 standard deviations above the mean (Allen et al., 2011), andp (signal N noise) N .5 (FSL default)). This threshold was also used fordetermining the parent network of any region later identified in theDual Regression analyses. Any IC that significantly correlated withmore than one template network is grouped in Fig. 2 with the templatenetwork with which it is most strongly correlated. The three networksthat correlated with Yeo's visual network were composed of regionsextending from occipital pole through cuneal cortex and lingual gyrus(ICs 1, 12, and 18). The three networks that correlated with Yeo'ssomatomotor network were composed of the superior pre- and post-central gyrus (IC 6), primary auditory cortex and superior temporalgyrus (IC 11), and post-central gyrus (IC 24). There was a single net-work that extended through orbitofrontal and ventromedial prefrontalcortex that correlated with Yeo's limbic network (IC 28). The three net-works that correlated with the Yeo's dorsal attention network werecomposed of dorsolateral frontal, parietal, and occipital regions (ICs14, 17 and 26). The single network that correlatedwith Yeo's ventral at-tention network was composed of a conglomerate of medial and lateralfrontal regions (IC 4). The two networks that correlated with Yeo's de-fault networkwere composed ofmedial prefrontal cortex, posterior cin-gulate cortex, and precuneus (ICs 10 and 15). Finally, there were twonetworks that correlated with Yeo's frontoparietal networks: classicright and left frontoparietal networks (ICs 5 and 9, respectively). InFig. 3, we show ICs from the current study (plotted in multiple colors)next to template networks of Yeo et al. (2011) (plotted in red).
Dual regression
Common EFIndividual differences in common EF were associated with varia-
tion of two RSNs. First, we observed that increased connectivity ofCrus I and II of the cerebellum within the right frontoparietalnetwork (IC 5) was associated with greater common EF ability(Fig. 4a; p(corrected) = 0.037). Second, we observed that expansion

Vis
ual
Net
wo
rks
So
mat
om
oto
r N
etw
ork
s
Lim
bic
Net
wo
rk
Do
rsal
Att
enti
on
Net
wo
rks
Ven
tral
Att
enti
on
Net
wo
rk
Def
ault
Net
wo
rks
Fro
nto
par
ieta
l N
etw
ork
s
*
* *
*
Fig. 2. Resting-state networks from the current study thresholded at z N 5. The RSNs are grouped into seven categories based on relation to reference networks — visual, somatomotor,limbic, dorsal attention, ventral attention, default, and frontoparietal. Independent components that significantly overlappedwithmore than one template are groupedwith the templatethey correlatemost strongly. In addition to thepictured groupings, independent components 11 and 14 significantly overlappedwith the ventral attention template network; independentcomponent 9 also significantly overlapped with the default template network; and independent components 4 and 26 significantly overlappedwith the frontoparietal template network.
73A.E. Reineberg et al. / NeuroImage 104 (2015) 69–78
of IC14, a dorsal attentional RSN, to two regions – the left frontopolarcortex (Fig. 4b; p(corrected) = 0.028) and right cerebellar regions(Fig. 4c; p(corrected) = 0.035) – was associated with greater commonEF. The frontopolar region is part of ICs 4 and 9.
Shifting-specificGreater shifting-specific EF was associated with increased coupling
of the left angular gyrus with IC 11, a network that correlated signifi-cantly with both the somatomotor and ventral attention template net-works. (Fig. 4d; p(corrected) = 0.007). The left angular gyrus is not partof IC 11 from the group level ICA analysis.
Discussion
Our findings indicate that aspects of the functional architecture ofthe resting brain are associatedwith variation among individuals in dif-ferent aspects of EF.While an abundance of studies has identified sets ofregions that consistently coactivate together during periods of rest, wehave shown that the composition of these networks varies based on in-dividual differences in EF. More specifically, higher common EF is asso-ciated with intensity differences within the right frontoparietal RSN,and the expansion of an attention RSN to the frontopolar cortex and cer-ebellum. Better shifting-specific ability was associated with expansion
Compared to Reference Networks
Vis
ual
Net
work
s
Som
atom
oto
r N
etw
ork
s
Dors
al A
tten
tion
Net
work
s
Ven
tral
Att
enti
on
Net
work
s
Def
ault
Net
work
s
Fro
nto
par
ieta
l N
etw
ork
s
Fig. 3.Resting state networks from the current study compared to reference networks (Yeo et al., 2011). Reference networks are plotted on the left in red. RSNs from the current studywerespatially combined into a single image and plotted in contrasting colors.
74 A.E. Reineberg et al. / NeuroImage 104 (2015) 69–78
of a somatomotor/attention network to the angular gyrus. No relation-ships were observed between rs-fcMRI and updating-specific ability.
Common EF
Higher common EF was associated with differences in the rightfrontoparietal RSN. Specifically, increased coupling between the rightfrontoparietal RSN and Crus I and II of the cerebellum predicted highercommon EF. Such a result is consistent with task-based research show-ing that frontal and parietal regions emerge as important in both region-of-interest (Alvarez and Emory, 2006; Buckner, 2013) and network-based analyses (Zhang and Li, 2012) of executive function tasks. Thisresult is also in line with work that shows a strong connection betweenCrus I/II and frontoparietal regions both functionally (Buckner et al.,2011) and anatomically (Kelly and Strick, 2003). Additionally, Crus Iand II have been shown to activate in task-based fMRI studies of work-ing memory and EF, and greater activation and functional connectivityof these regions is associated with better performance (Bernard et al.,
2013; Salmi et al., 2010; Stoodley and Schmahmann, 2009). This resultsupplements these task-based findings by demonstrating that the de-gree to which Crus I and II couples with the frontoparietal network atrest predicts differences in EF. The exact role of cerebellar regions inthe service of EF is still debated. Two prominent theories stemmingfrom the motor control literature suggest that the cerebellum is crucialfor timing of cognitive events and/or provides a means for predictingthe outcome of implemented plans (Ivry and Keele, 1989; Ramnani,2006). While our study cannot speak directly to these theories, wehave shown that a key difference between individuals with high versuslow Common EFmay be the degree to which the cerebellum is involvedin a network of regions broadly implicated in higher-order cognitiveoperations.
Additionally, Common EFwas associatedwith variation in a networksupporting attention to the external environment (IC 14). Individualswith greater common EF showed increased coupling of frontopolar re-gion with this attentional RSN, which is composed of lateral frontaland superior parietal/occipital regions. An attention network similar to

Common EF
Shifting-specific EF
= RSN/IC background = dual regression overlay
a. IC 5 b. IC 14
d. IC 11
)4,55,62-()04-,07-,73-(
(-58,-58,36)(21,-42,-40)
c. IC 14
Fig. 4. Dual regression analyses reveal that RSNs vary with common and switching-specific components of EF. The input RSN for dual regression is plotted in warm colors as backgroundimage. The dual regression result is plotted as an overlay in blue. Blue regions are regions that covarywith individual differences in EF. For all results within the input RSN (4a), increasedintensity of the highlighted region (thresholded at p(corrected) b .05) corresponds to higher EF construct scores. For outside-group-network results (4b, c), expansion of the input RSN to thehighlighted region corresponds to higher EF construct scores. Next to each dual regression result is a scatterplot of parameter estimates extracted from the voxels identified in the dualregression analysis for each participant's independent component plotted against each participant's EF score. For size of significant clusters identified in the dual regression analysis,see Table 1.
75A.E. Reineberg et al. / NeuroImage 104 (2015) 69–78
IC 14 has previously been linked to performance on the antisaccade task(Schaeffer et al., 2013), which is a task that loads strongly on the Com-mon EF construct (Miyake and Friedman, 2012). Notably though, the
Table 1Summarizes each dual regression result. Center of mass is provided for each cluster for thepurposes of anatomical localization. EF = executive function. IC = independent compo-nent. TFCE = threshold-free cluster enhancement.
Center of mass p-Value Cluster size
Executive function IC X Y Z (TFCE-corrected) 4 mm3 (2 mm3)
Common EF 5 −37 −70 −40 0.037 3 (24)Common EF 14 −26 55 4 0.028 3 (24)Common EF 14 21 −42 −40 0.035 3 (24)Shifting-specific 11 −58 −58 36 0.007 31 (248)
frontopolar region identified in the dual regression analysis has notbeen characterized as part of the dorsal attention network and is notcontained within the dorsal attention RSN that was identified at thegroup level of the current study. Rather, this frontopolar region is partof two frontoparietal RSNs — ICs 4 and 9. Importantly, this frontopolarregion has previously been linked to maintenance of goals and abstracttask sets (Ramnani and Owen, 2004; Vincent et al., 2008; Christoff et al.,2009; Dosenbach et al., 2008; Orr and Banich, 2014). As such, co-activation of regions implicated in the maintenance of abstract repre-sentation and/or goals with the attentional machinery to implementthose goals, characterizes individuals with high levels of common EF.
In summary, alterations in resting state networks associated withhigh common EF can be characterized as expanded compared to thosewith low common EF, encompassing both higher-order areas involvedin setting abstract goals (i.e., frontopolar cortex) and lower-level

76 A.E. Reineberg et al. / NeuroImage 104 (2015) 69–78
regions that could aid in implementing those goals more automatically(i.e., cerebellum).
Shifting-specific
Higher shifting-specific EF was associated with variation in asomatomotor/attentional RSN (IC 11), suggesting it is involved in senso-ry aspects of spatial processing. Specifically, individuals with higherEF had greater recruitment of the angular gyrus, which lies outside IC.Lateral parietal regions are frequently implicated in executive processes,and are especially important for shifting-specific aspects of EF (Colletteet al., 2005; Esterman et al., 2009), perhaps due to their ability to inte-grate multimodal information. Additionally, this particular region ofthe angular gyrus is characterized by a distinct pattern of anatomicalconnectivity to a variety of regions implicated in higher order cognitiveprocess, such as ventrolateral prefrontal cortex, among others (Uddinet al., 2010). Shifting-specific tasks depend not only on active abilitiesto move from one task set to the other, but also on the passive linkingbetween lower order centers of control and appropriate targets(e.g., motor regions). It may be that individuals with higher shifting-specific EF effectively utilize parietal regions to control the stimulus–response mappings that are required to perform different tasks.
Updating-specific
One unexpected aspect of our findings was a lack of a relationshipbetween individual differences in updating-specific ability and any rs-fcMRI network or region. On the basis of both theoretical and empiricalfindings regarding the neural substrates of updating (Frank et al., 2001),one might have predicted a priori that connectivity between the DLPFCand basal ganglia might influence individual differences in updatingability. However, we did not find such an effect. Our null resultsmay arise because of the qualitative differences between processessupporting updating-specific EF as compared to common EF andshifting-specific EF. Updating requires the contents of workingmemoryto bemanipulated, and as suchmay rely more on a more circumscribedbrain region, notably DLPFC, without connectivity to other regionsplaying as much of a role. In contrast, when switching between tasks,new task sets and stimulus–response mappings need to be loaded toperform the task, and hence switching may rely on a more distributednetwork (e.g., frontopolar regions for selecting the task set, and parietalregions for stimulus–response mappings). Of course one must be cir-cumspect when discussing potential reasons for a null result.
General discussion
One notable aspect of our results was that different RSNs were asso-ciatedwith different aspects of EF. As such, ourfindings support the ideathat EF represents a family of abilities. More importantly, however, itsuggests that these different abilities may preferentially recruit distinctneural substrates, at least with respect to individual differences in EF.
Although our findings clearly demonstrate a relationship betweenindividual differences in EF and rs-fcMRI, our study cannot speak direct-ly to the source of that relationship. On the one hand, a dominant themeemerging from prior literature is that patterns of rs-fcMRI reflect the in-trinsic functional organization of the brain (Fox and Raichle, 2007),sculpted by a history of coherent neuronal firing and anatomical wiringbetween distributed brain regions (Wig et al., 2011). Indeed, patterns ofrs-fcMRI are stable across time within individuals (Guo et al., 2012;Shehzad et al., 2009), relate to a variety of genetic factors (Glahn et al.,2010), and persist to somedegree under various stages of consciousnessand anesthesia (Boly et al., 2008; Greicius et al., 2008). From this per-spective, the findings of the present study may potentially reflect anindividual's biological heritage, such as genetic influences on EF thatmight influence the structural and/or functional connectivity of thebrain (see Friedman et al., 2008 for evidence of genetic influences on
EF). However, this does not preclude environmental influences alsoworking to sculpt brain activity, such as the amount of training/school-ing during childhood with regard to activities or tasks that require EF(Diamond, 2012), SES (Hackman and Farah, 2009), or other such fac-tors. The relationship between behavior-related RSN variability andspecific individual traits, whether they have genetic and/or experientialcauses, is an important direction for future work.
It is also possible that aspects of an individual's state at the time ofscanning may influence the patterns we observed. Several recent find-ings suggest that patterns of functional connectivitymay be partially in-fluenced by the participant's mental/task state (Andrews-Hanna et al.,2010; Doucet et al., 2012; Shirer et al., 2012), and can be modified ona rapid time scale (Lewis et al., 2009; Tambini et al., 2010; Stevenset al., 2010). Future research should also explore the possibility thatbehavior-related RSN variability is caused by differences in the cognitiveprocesses of high versus low EF individuals during resting-state scans(e.g., high EF individuals plan their day, while low EF individualsdaydream).
Although we believe our findings establish a strong groundwork forfurther exploration of neuropsychological correlates of executive func-tion as assessed during resting state, it will be important for future stud-ies to replicate our findings and examine their possible dysfunction inpsychiatric and neurological disorders. In addition to replication and ex-tension, future studies should consider genetic and behavioral variationthat could account for differences between high and low EF individuals'resting-state functional connectivity.
Conclusion
In a large group of individuals, we demonstrate that the resting statearchitecture of the brain is associated with individual differences in dif-ferent aspects of a theoretically motivated framework of EF— the unityand diversitymodel. The results are notable for providing a fine-grainedpicture of the relationships with specific regions within and outsideof well-known RSNs. In the case of common EF, individuals higherin EF had greater recruitment of cerebellar regions within a group-identified frontoparietal RSN, and increased coupling of a frontopolarregion to an attention RSN. Those individuals higher in shifting-specific EF had increased coupling of the angular gyrus and asomatomotor/attention network. The current study significantly ex-pands our knowledge of neural influences on EF, showing that variabil-ity in EF across individuals may be sculpted by patterns of resting-statefunctional connectivity within and between large-scale cognitive brainnetworks.
Acknowledgments
This work was supported by an NIMH-funded InterdisciplinaryBehavioral Science Center grant (P50 MH079485). The authors thankHarry Smolker and Amy Turner for assistance with data collection,Tim Curran and Randy O'Reilly for their discussion and feedback on anearly draft of themanuscript, and Jessica Bernard for valuable discussionrelated to this project.
References
Alvarez, J.A., Emory, E., 2006. Executive function and the frontal lobes: a meta-analytic re-view.Neuropsychol. Rev. 16 (1), 17–42. http://dx.doi.org/10.1007/s11065-006-9002-x.
Andrews-Hanna, J.R., Reidler, J.S., Huang, C., Buckner, R.L., 2010. Evidence for the defaultnetwork's role in spontaneous cognition. J. Neurophysiol. 104 (1), 322–335. http://dx.doi.org/10.1152/jn.00830.2009.
Banich, M.T., 2009. Executive function: the search for an integrated account. Curr. Dir.Psychol. Sci. 18 (2), 89–94. http://dx.doi.org/10.1111/j.1467-8721.2009.01615.x.
Beckmann, C.F., Smith, S.M., 2004. Probabilistic independent component analysis for func-tional magnetic resonance imaging. IEEE Trans. Med. Imaging 1 (23), 137–152.
Beckmann, C.F., Mackay, C.E., Filippini, N., Smith, S.M., 2009. Group comparison of resting-state FMRI data using multi-subject ICA and dual regression. OHBM http://dx.doi.org/10.1016/S1053-8119(09)71511-3.

77A.E. Reineberg et al. / NeuroImage 104 (2015) 69–78
Bernard, J. a, Peltier, S.J., Wiggins, J.L., Jaeggi, S.M., Buschkuehl, M., Fling, B.W., Seidler, R.D.,2013. Disrupted cortico-cerebellar connectivity in older adults. NeuroImage 83,103–119. http://dx.doi.org/10.1016/j.neuroimage.2013.06.042.
Boly, M., Phillips, C., Tshibanda, L., Vanhaudenhuyse, A., Schabus, M., Dang-Vu, T.T.,Laureys, S., 2008. Intrinsic brain activity in altered states of consciousness: how con-scious is the default mode of brain function? Ann. N. Y. Acad. Sci. 1129, 119–129.http://dx.doi.org/10.1196/annals.1417.015.Intrinsic.
Braver, T.S., 2012. The variable nature of cognitive control: a dual mechanisms frame-work. Trends Cogn. Sci. 16 (2), 106–113. http://dx.doi.org/10.1016/j.tics.2011.12.010.
Braver, T.S., Cohen, J.D., Nystrom, L.E., Jonides, J., Smith, E.E., Noll, D.C., 1997. A parametricstudy of prefrontal cortex involvement in human working memory. NeuroImage 5(1), 49–62. http://dx.doi.org/10.1006/nimg.1996.0247.
Buckner, R.L., 2013. The cerebellum and cognitive function: 25 years of insight from anat-omy and neuroimaging. Neuron 80 (3), 807–815. http://dx.doi.org/10.1016/j.neuron.2013.10.044.
Buckner, R.L., Krienen, F.M., Castellanos, A., Diaz, J.C., Yeo, B.T.T., 2011. The organization ofthe human cerebellum estimated by intrinsic functional connectivity. J. Neurophysiol.106 (5), 2322–2345. http://dx.doi.org/10.1152/jn.00339.2011.
Christoff, K., Keramatian, K., Gordon, A.M., Smith, R., Mädler, B., 2009. Prefrontal organiza-tion of cognitive control according to levels of abstraction. Brain Res. 1286, 94–105.http://dx.doi.org/10.1016/j.brainres.2009.05.096.
Cole, M.W., Yarkoni, T., Repovs, G., Anticevic, A., Braver, T.S., 2012. Global connectivity ofprefrontal cortex predicts cognitive control and intelligence. J. Neurosci. 32 (26),8988–8999. http://dx.doi.org/10.1523/JNEUROSCI.0536-12.2012.
Collette, F., Van der Linden, M., Laureys, S., Delfiore, G., Degueldre, C., Luxen, A., Salmon, E.,2005. Exploring the unity and diversity of the neural substrates of executive function-ing. Hum. Brain Mapp. 25 (4), 409–423. http://dx.doi.org/10.1002/hbm.20118.
Derrfuss, J., Brass, M., Neumann, J., von Cramon, D.Y., 2005. Involvement of the inferiorfrontal junction in cognitive control: meta-analyses of switching and Stroop studies.Hum. Brain Mapp. 25 (1), 22–34. http://dx.doi.org/10.1002/hbm.20127.
Diamond, A., 2012. Activities and programs that improve children's executive functions.Curr. Dir. Psychol. Sci. 21 (5), 335–341. http://dx.doi.org/10.1177/0963721412453722.
Dosenbach, N.U.F., Fair, D.A., Cohen, A.L., Schlaggar, B.L., Petersen, S.E., 2008. A dual-networks architecture of top-down control. Trends Cogn. Sci. 12 (3), 99–105.http://dx.doi.org/10.1016/j.tics.2008.01.001.
Doucet, G., Naveau, M., Petit, L., Zago, L., Crivello, F., Jobard, G., Joliot, M., 2012. Patterns ofhemodynamic low-frequency oscillations in the brain are modulated by the nature offree thought during rest. NeuroImage 59 (4), 3194–3200. http://dx.doi.org/10.1016/j.neuroimage.2011.11.059.
Esterman, M., Chiu, Y.-C., Tamber-Rosenau, B.J., Yantis, S., 2009. Decoding cognitive con-trol in human parietal cortex. Proc. Natl. Acad. Sci. U. S. A. 106 (42), 17974–17979.http://dx.doi.org/10.1073/pnas.0903593106.
Fox, M.D., Raichle, M.E., 2007. Spontaneous fluctuations in brain activity observed withfunctional magnetic resonance imaging. Nat. Rev. Neurosci. 8 (9), 700–711. http://dx.doi.org/10.1038/nrn2201.
Frank, M.J., Loughry, B., O'Reilly, R.C., 2001. Interactions between frontal cortex and basalganglia in working memory: a computational model. Cogn. Affect. Behav. Neurosci. 1(2), 137–160 (Retrieved from http://www.ncbi.nlm.nih.gov/pubmed/12467110).
Friedman, N.P., Miyake, A., Young, S.E., Defries, J.C., Corley, R.P., Hewitt, J.K., 2008. Individ-ual differences in executive functions are almost entirely genetic in origin. J. Exp.Psychol. Gen. 137 (2), 201–225. http://dx.doi.org/10.1037/0096-3445.137.2.201.
Friedman, N.P., Altamirano, L.J., Miyake, A., Young, S.E., Corley, R.P., Hewitt, J.K., 2012.Etiology of stability and change in executive functions from late adolescence toadulthood. Presented at the Annual Meeting of the Behavioral Genetics Association,Edinburgh, UK.
Friedman, N.P., Miyake, A., Altamirano, L.J., Corley, R.P., Young, S.E., Rhea, S.A., Hewitt, J.K.,2014. Stability and Change in Executive Function Abilities From Late Adolescence toEarly Adulthood: A Longitudinal Twin Study, (Submitted for publication).
Glahn, D.C., Winkler, a M., Kochunov, P., Almasy, L., Duggirala, R., Carless, M. a, Blangero, J.,2010. Genetic control over the resting brain. Proc. Natl. Acad. Sci. U. S. A. 107 (3),1223–1228. http://dx.doi.org/10.1073/pnas.0909969107.
Gordon, E.M., Breeden, A.L., Bean, S.E., Vaidya, C.J., 2012.Working memory-related chang-es in functional connectivity persist beyond task disengagement. Hum. Brain Mapp.http://dx.doi.org/10.1002/hbm.22230.
Greicius, M., 2008. Resting-state functional connectivity in neuropsychiatric dis-orders. Curr. Opin. Neurol. 21 (4), 424–430. http://dx.doi.org/10.1097/WCO.0b013e328306f2c5.
Greicius, M.D., Kiviniemi, V., Tervonen, O., Vainionpää, V., Reiss, A.L., Menon, V., 2008.Persistent default-mode network connectivity during light sedation. Hum. BrainMapp. 29 (7), 839–847. http://dx.doi.org/10.1002/hbm.20537.Persistent.
Guo, C.C., Kurth, F., Zhou, J., Mayer, E. a, Eickhoff, S.B., Kramer, J.H., Seeley, W.W., 2012.One-year test–retest reliability of intrinsic connectivity network fMRI in older adults.NeuroImage http://dx.doi.org/10.1016/j.neuroimage.2012.03.027.
Hackman, D.A., Farah, M.J., 2009. Socioeconomic status and the developing brain. TrendsCogn. Sci. 13 (2), 65–73. http://dx.doi.org/10.1016/j.tics.2008.11.003.
Hampson, M., Driesen, N.R., Skudlarski, P., Gore, J.C., Constable, R.T., 2006. Brain connec-tivity related to working memory performance. J. Neurosci. 26 (51), 13338–13343.http://dx.doi.org/10.1523/JNEUROSCI.3408-06.2006.
Herd, S.A., Banich, M.T., O'Reilly, R.C., 2006. Neural mechanisms of cognitive control: anintegrative model of Stroop task performance and fMRI data. J. Cogn. Neurosci. 18(1), 22–32.
Herd, S.A., O'Reilly, R.C., Hazy, T.E., Chatham, C.H., Brant, A.M., Friedman, N.P., 2013. NeuralMechanisms Underlying Individual Differences in the Task Switching Component ofExecutive Function.
Ivry, R.B., Keele, S.W., 1989. Timing functions of the cerebellum. J. Cogn. Neurosci. 1 (2),136–152. http://dx.doi.org/10.1162/jocn.1989.1.2.136.
Jenkinson, M., Beckmann, C.F., Behrens, T.E.J., Woolrich, M.W., Smith, S.M., 2012. FSL.NeuroImage 62 (2), 782–790. http://dx.doi.org/10.1016/j.neuroimage.2011.09.015.
Kelly, R.M., Strick, P.L., 2003. Cerebellar loops with motor cortex and prefrontal cortex of anonhuman primate. J. Neurosci. Off. J. Soc. Neurosci. 23 (23), 8432–8444 (Retrievedfrom http://www.ncbi.nlm.nih.gov/pubmed/12968006).
Kelly, A.M.C., Uddin, L.Q., Biswal, B.B., Castellanos, F.X., Milham, M.P., 2008. Competitionbetween functional brain networks mediates behavioral variability. NeuroImage 39(1), 527–637. http://dx.doi.org/10.1016/j.neuroimage.2007.08.008.
Lewis, C.M., Baldassarre, A., Committeri, G., Romani, G.L., Corbetta, M., 2009. Learningsculpts the spontaneous activity of the resting human brain. Proc. Natl. Acad. Sci.U. S. A. 106 (41), 17558–17563. http://dx.doi.org/10.1073/pnas.0902455106.
Mayr, U., Kliegl, R., 2000. Task-set switching and long-term memory retrieval. J. Exp.Psychol. Learn. Mem. Cogn. 26 (5), 1124–1140. http://dx.doi.org/10.1037//0278-7393.26.5.1124.
McNab, F., Klingberg, T., 2008. Prefrontal cortex and basal ganglia control access to work-ing memory. Nat. Neurosci. 11 (1), 103–107. http://dx.doi.org/10.1038/nn2024.
Miyake, A., Friedman, N.P., 2012. The nature and organization of individual differences inexecutive functions: four general conclusions. Curr. Dir. Psychol. Sci. 21 (1), 8–14.http://dx.doi.org/10.1177/0963721411429458.
Miyake, A., Friedman, N.P., Emerson, M.J., Witzki, A.H., Howerter, A., Wager, T.D., 2000.The unity and diversity of executive functions and their contributions to complex“Frontal Lobe” tasks: a latent variable analysis. Cogn. Psychol. 41 (1), 49–100.http://dx.doi.org/10.1006/cogp.1999.0734.
O'Reilly, R.C., Frank, M.J., 2006. Making working memory work: a computational model oflearning in the prefrontal cortex and basal ganglia. Neural Comput. 18 (2), 283–328.http://dx.doi.org/10.1162/089976606775093909.
Orr, J.M., Banich, M.T., 2014. The neural mechanisms underlying internally and externallyguided task selection. NeuroImage 84, 191–205. http://dx.doi.org/10.1016/j.neuroimage.2013.08.047.
Ramnani, N., 2006. The primate cortico-cerebellar system: anatomy and function. Nat.Rev. Neurosci. 7 (7), 511–522. http://dx.doi.org/10.1038/nrn1953.
Ramnani, N., Owen, A.M., 2004. Anterior prefrontal cortex: insights into function fromanatomy and neuroimaging. Nat. Rev. Neurosci. 5 (3), 184–194. http://dx.doi.org/10.1038/nrn1343.
Roberts, R.J., Hager, L.D., Heron, C., 1994. Prefrental Cognitive Processes:WorkingMemoryand Inhibition in the Antisaccade Task. Journal of Experimental Psychology: General123 (4), 374–393.
Rytty, R., Nikkinen, J., Paavola, L., Abou Elseoud, A., Moilanen, V., Visuri, A., Tervonen, O.,Renton, A.E., Traynor, B.J., Kiviniemi, V., Remes, A.M., 2013. GroupICA dual regressionanalysis of resting state networks in a behavioral variant of frontotemporal dementia.Frontiers in Human Neuroscience 7 (August), 461. http://dx.doi.org/10.3389/fnhum.2013.00461.
Sakai, K., 2008. Task set and prefrontal cortex. Annu. Rev. Neurosci. 31, 219–245. http://dx.doi.org/10.1146/annurev.neuro.31.060407.125642.
Salmi, J., Pallesen, K.J., Neuvonen, T., Brattico, E., Korvenoja, A., Salonen, O., Carlson, S.,2010. Cognitive and motor loops of the human cerebro-cerebellar system. J. Cogn.Neurosci. 22 (11), 2663–2676. http://dx.doi.org/10.1162/jocn.2009.21382.
Schaeffer, D.J., Amlung, M.T., Li, Q., Krafft, C.E., Austin, B.P., Dyckman, K. a, McDowell,J.E., 2013. Neural correlates of behavioral variation in healthy adults' antisaccadeperformance. Psychophysiology 50 (4), 325–333. http://dx.doi.org/10.1111/psyp.12030.
Seeley, W.W., Menon, V., Schatzberg, A.F., Keller, J., Glover, G.H., Kenna, H., Greicius, M.D.,2007. Dissociable intrinsic connectivity networks for salience processing and execu-tive control. J. Neurosci. Off. J. Soc. Neurosci. 27 (9), 2349–2356. http://dx.doi.org/10.1523/JNEUROSCI.5587-06.2007.
Shehzad, Z., Kelly, A.M.C., Reiss, P.T., Gee, D.G., Gotimer, K., Uddin, L.Q., Milham, M.P.,2009. The resting brain: unconstrained yet reliable. Cereb. Cortex 19 (10),2209–2229. http://dx.doi.org/10.1093/cercor/bhn256.
Shirer, W.R., Ryali, S., Rykhlevskaia, E., Menon, V., Greicius, M.D., 2012. Decoding subject-driven cognitive states with whole-brain connectivity patterns. Cereb. Cortex 22 (1),158–165. http://dx.doi.org/10.1093/cercor/bhr099.
Smith, S.M., Fox, P.T., Miller, K.L., Glahn, D.C., Fox, P.M., Mackay, C.E., Beckmann, C.F., 2009.Correspondence of the brain' s functional architecture during activation and rest.Proc. Natl. Acad. Sci. U. S. A. 106 (31), 13040–13045.
Smolker, H.R., Depue, B.E., Reineberg, A.E., Orr, J.M., Banich, M.T., 2014. Individual differ-ences in regional prefrontal gray matter morphometry and fractional anisotropyare associated with different constructs of executive function. Brain Struct. Funct.http://dx.doi.org/10.1007/s00429-014-0723-y.
Stevens, W.D., Buckner, R.L., Schacter, D.L., 2010. Correlated low-frequency BOLD fluctua-tions in the resting human brain are modulated by recent experience in category-preferential visual regions. Cereb. Cortex 20 (8), 1997–2006. http://dx.doi.org/10.1093/cercor/bhp270.
Stoodley, C.J., Schmahmann, J.D., 2009. Functional topography in the human cerebellum:a meta-analysis of neuroimaging studies. NeuroImage 44 (2), 489–501. http://dx.doi.org/10.1016/j.neuroimage.2008.08.039.
Tambini, A., Ketz, N., Davachi, L., 2010. Enhanced brain correlations during rest are relatedto memory for recent experiences. Neuron 65 (2), 280–290. http://dx.doi.org/10.1016/j.neuron.2010.01.001.
Thompson, G.J., Magnuson, M.E., Merritt, M.D., Schwarb, H., Pan, W.-J., McKinley, A.,Keilholz, S.D., 2012. Short-time windows of correlation between large-scale function-al brain networks predict vigilance intraindividually and interindividually. Hum.Brain Mapp. http://dx.doi.org/10.1002/hbm.22140 (00, May).
Uddin, L.Q., Supekar, K., Amin, H., Rykhlevskaia, E., Nguyen, D. a, Greicius, M.D., Menon, V.,2010. Dissociable connectivity within human angular gyrus and intraparietal sulcus:evidence from functional and structural connectivity. Cereb. Cortex 20 (11),2636–2646. http://dx.doi.org/10.1093/cercor/bhq011.

78 A.E. Reineberg et al. / NeuroImage 104 (2015) 69–78
Van Dijk, K.R.A., Sabuncu, M.R., Buckner, R.L., 2012. The influence of head motion on in-trinsic functional connectivity MRI. NeuroImage 59 (1), 431–438. http://dx.doi.org/10.1016/j.neuroimage.2011.07.044.
Vincent, J.L., Kahn, I., Snyder, A.Z., Raichle, M.E., Buckner, R.L., 2008. Evidence fora frontoparietal control system revealed by intrinsic functional connectivity.J. Neurophysiol. 100 (6), 3328–3342. http://dx.doi.org/10.1152/jn.90355.2008.
Wager, T.D., Jonides, J., Reading, S., 2004. Neuroimaging studies of shifting attention: ameta-analysis. NeuroImage 22 (4), 1679–1693. http://dx.doi.org/10.1016/j.neuroimage.2004.03.052.
Wig, G.S., Schlaggar, B.L., Petersen, S.E., 2011. Concepts and principles in the analysis ofbrain networks. Ann. N. Y. Acad. Sci. 1224, 126–146. http://dx.doi.org/10.1111/j.1749-6632.2010.05947.x.
Wilcox, R.R., Keselman, H.J., 2003. Modern robust data analysis methods: measures ofcentral tendency. Psychol. Methods 8 (3), 254–274. http://dx.doi.org/10.1037/1082-989X.8.3.254.
Yeo, B.T.T., Krienen, F.M., Sepulcre, J., Sabuncu,M.R., Lashkari, D., Hollinshead, M., Buckner,R.L., 2011. The organization of the human cerebral cortex estimated by intrinsic func-tional connectivity. J. Neurophysiol. 106 (3), 1125–1165. http://dx.doi.org/10.1152/jn.00338.2011.
Yntema, D.B., 1963. Keeping track of several things at oncce. Hum. Factors 5 (7), 7–17.http://dx.doi.org/10.1177/001872086300500102.
Zhang, S., Li, C.R., 2012. Functional networks for cognitive control in a stop signal task: in-dependent component analysis. Hum. Brain Mapp. 33 (1), 89–104. http://dx.doi.org/10.1002/hbm.21197.
Zhang, D., Raichle, M.E., 2010. Disease and the brain's dark energy. Nat. Rev. Neurol. 6 (1),15–28. http://dx.doi.org/10.1038/nrneurol.2009.198.