Indication of Density-Dependent Changes in Growth and Maturity of the Barndoor Skate on Georges Bank
11
BioOne sees sustainable scholarly publishing as an inherently collaborative enterprise connecting authors, nonprofit publishers, academic institutions, research libraries, and research funders in the common goal of maximizing access to critical research. Indication of Density-Dependent Changes in Growth and Maturity of the Barndoor Skate on Georges Bank Author(s): Karson CoutréTodd GedamkeDavid B. RuddersWilliam B. Driggers IIIDavid M. KoesterJames A. Sulikowski Source: Marine and Coastal Fisheries: Dynamics, Management, and Ecosystem Science, 5():260-269. 2013. Published By: American Fisheries Society URL: http://www.bioone.org/doi/full/10.1080/19425120.2013.824941 BioOne (www.bioone.org ) is a nonprofit, online aggregation of core research in the biological, ecological, and environmental sciences. BioOne provides a sustainable online platform for over 170 journals and books published by nonprofit societies, associations, museums, institutions, and presses. Your use of this PDF, the BioOne Web site, and all posted and associated content indicates your acceptance of BioOne’s Terms of Use, available at www.bioone.org/page/terms_of_use . Usage of BioOne content is strictly limited to personal, educational, and non-commercial use. Commercial inquiries or rights and permissions requests should be directed to the individual publisher as copyright holder.
Transcript of Indication of Density-Dependent Changes in Growth and Maturity of the Barndoor Skate on Georges Bank

BioOne sees sustainable scholarly publishing as an inherently collaborative enterprise connecting authors, nonprofit publishers, academic institutions, researchlibraries, and research funders in the common goal of maximizing access to critical research.
Indication of Density-Dependent Changes in Growth and Maturity of theBarndoor Skate on Georges BankAuthor(s): Karson CoutréTodd GedamkeDavid B. RuddersWilliam B. Driggers IIIDavid M.KoesterJames A. SulikowskiSource: Marine and Coastal Fisheries: Dynamics, Management, and Ecosystem Science, 5():260-269.2013.Published By: American Fisheries SocietyURL: http://www.bioone.org/doi/full/10.1080/19425120.2013.824941
BioOne (www.bioone.org) is a nonprofit, online aggregation of core research in the biological, ecological, andenvironmental sciences. BioOne provides a sustainable online platform for over 170 journals and books publishedby nonprofit societies, associations, museums, institutions, and presses.
Your use of this PDF, the BioOne Web site, and all posted and associated content indicates your acceptance ofBioOne’s Terms of Use, available at www.bioone.org/page/terms_of_use.
Usage of BioOne content is strictly limited to personal, educational, and non-commercial use. Commercial inquiriesor rights and permissions requests should be directed to the individual publisher as copyright holder.
Marine and Coastal Fisheries: Dynamics, Management, and Ecosystem Science 5:260–269, 2013C© American Fisheries Society 2013ISSN: 1942-5120 onlineDOI: 10.1080/19425120.2013.824941
ARTICLE
Indication of Density-Dependent Changes in Growthand Maturity of the Barndoor Skate on Georges Bank
Karson Coutre*Marine Science Center, University of New England, 11 Hills Beach Road, Biddeford, Maine 04005, USA
Todd GedamkeMER Consultants, 5521 Southeast Nassau Terrace, Stuart, Florida 34997, USA
David B. RuddersVirginia Institute of Marine Science, College of William and Mary,Post Office Box 1346, Route 1208, Greate Road, Gloucester Point, Virginia 23062, USA
William B. Driggers IIINational Marine Fisheries Service, Southeast Fisheries Science Center, Mississippi Laboratories,Post Office Drawer 1207, Pascagoula, Mississippi 39568, USA
David M. KoesterDepartment of Anatomy, College of Osteopathic Medicine, University of New England,11 Hills Beach Road, Biddeford, Maine 04005, USA
James A. SulikowskiMarine Science Center, University of New England, 11 Hills Beach Road, Biddeford, Maine 04005, USA
AbstractDrastic increases or decreases in biomass often result in density-dependent changes in life history characteristics
within a fish population. Acknowledging this phenomenon and in light of the recent biomass increase in BarndoorSkate Dipturus laevis, the current study re-evaluated the growth rate and sexual maturity of 244 specimens collectedfrom 2009–2011within closed areas I and II on Georges Bank, USA. Ages were estimated using vertebral band countsfrom skate that ranged from 21 to 129 cm TL. The von Bertalanffy growth function was applied to pooled age-at-lengthdata. Parameter estimates from the current study of L∞ = 155 cm TL and k = 0.10 represent a significant decreasefrom previously reported parameters of L∞ = 167 cm TL and k = 0.14. In addition to changes in growth parameters,age at 50% maturity for both males (based on clasper length, testes mass, and percent mature spermatocytes) andfemales (based on data from shell gland mass, ovary mass, and follicle diameter) increased by 3 years and 4 years,respectively. Based on our results and the 10- to 12-year gap in the collection of samples, it is likely that BarndoorSkate within this region have exhibited pliability in life history parameters.
Subject editor: Patrick Sullivan, Cornell University, Ithaca, New York
*Corresponding author: [email protected] January 21, 2013; accepted July 9, 2013
260
GROWTH AND MATURITY OF BARNDOOR SKATE 261
Batoids within the family Rajidae are thought to compriseat least 22% of the fishes within the subclass Elasmobranchii(Ebert and Compagno 2007). Like their cartilaginous relatives(sharks and rays), skate exhibit an equilibrium life history strat-egy (i.e., late sexual maturation, low fecundity), which makesthem vulnerable to direct and indirect fishing pressure (e.g.,Hoenig and Gruber 1990; Winemiller and Rose 1992; Su-likowski et al. 2003, 2007). In addition, these fishing pressureshave been coupled with the common practice of aggregatingskate abundance within a region rather than calculating species-specific biomass trends (Dulvy et al. 2000). As a result of fish-ing pressure and their life history strategy, skate populationsworldwide have experienced declines. Examples include the lo-calized extinction of the Common Skate Dipturis batis from theIrish Sea and the disappearance of four North Sea skate speciesfrom the majority of their distribution (Dulvy et al. 2000). Inthe United States portion of the northwest Atlantic Ocean, theNortheast Skate Complex (NESC) consists of seven species,five of which occur in the Gulf of Maine (GOM) and southernNew England: the Winter Skate Leucoraja ocellata, BarndoorSkate D. laevis, Thorny Skate Amblyraja radiata, Smooth SkateMalacoraja senta, and the Little Skate L. erinacea (McEachran2002; NEFMC 2007). Although in the past, skate within thiscomplex were primarily considered bycatch in the groundfish,monkfish, and scallop fisheries, several species have commercialvalue in the bait and wing industries (NEFMC 2003; Sulikowskiet al. 2005a; Sosebee 1998). These directed fisheries place a sig-nificant amount of stress on the populations (Casey and Myers1998; Gedamke et al. 2005; NEFMC 2007). For example, dueto declines in their abundance, three species (Thorny Skate,Smooth Skate, and Barndoor Skate) are currently prohibitedfrom commercial landing while the other two species within thecomplex (Winter Skate and Little Skate) have strict manage-ment regulations governing their harvest in accordance with aSkate Fisheries Management Plan (NEFMC 2011).
The Barndoor Skate is the largest skate within the NESC andcan reach sizes of over 150 cm TL (McEachran 2002). Withinthe U.S. portion of the northwest Atlantic Ocean, the distributionof this species is concentrated on Georges Bank and southernNew England where it can be found from the tide line to 750 mwith a depth preference of greater than 450 m (McEachran 2002;Gedamke et al. 2005). In the late 1960s, Barndoor Skate popula-tions declined to levels far below mandated biomass thresholds(NEFMC 2005). The biomass remained suppressed for the next30 years, causing speculation that the species was on the verge oflocalized extinction (Casey and Myers 1998). Although manyfactors may have contributed to the decline of the BarndoorSkate population, it has been hypothesized that both direct andindirect fishing pressure played a significant role reducing thebiomass of this species (Casey and Myers 1998; Gedamke et al.2005; NEFMC 2007). Survey indices remained at extremelylow levels throughout the 1990s indicating a lack of recov-ery, so managers prohibited retention of the species in 2003(NEFMC 2011). The NEFSC bottom trawl surveys from 2005
through 2012 suggested that Barndoor Skate populations wereno longer overfished, although they still remained below thetarget biomass level within U.S. waters (NOAA 2012). If themost recent trends in biomass continue, it is likely that the pro-hibited status will be removed, allowing for commercial harvestof Barndoor Skate to resume (NEFMC 2011). Although a pre-liminary life history study has been conducted on this species,specimens were collected prior to the biomass increase (1999–2001) and the sample size for age and growth estimates waslimited (total n = 118, female n = 51, male n = 67; Gedamkeet al. 2005). Results from that study suggest that life historycharacteristics of the Barndoor Skate are not typical of a largebatoid and that the population could be more resilient to fish-ing pressure than previously thought (Sulikowski et al. 2003;Gedamke et al. 2005).
Significant declines in biomass can result in density-dependent changes in life history characteristics within a fishpopulation (Rose et al. 2001; van der Lingen et al. 2006).Populations can respond to a biomass decline with increasedgrowth rates, earlier maturity, and increased fecundity due todecreased intraspecific competition (Sminkey and Music 1995;Rose et al. 2001). Conversely, an increasing population withan elevated density can respond with a reduced growth rateand increasing age and size at maturity (Rose et al. 2001). Al-though such density-dependent changes have been widely doc-umented in teleost fishes, they have been observed in only afew exploited shark species and never documented in a batoid(Sminkey and Music 1995; Carlson and Baremore 2003; Sose-bee 2005). Given the recent changes in the biomass of BarndoorSkate, this species offers a unique opportunity to investigatepotential density-dependent changes in life history characteris-tics in a skate species. In addition, information garnered fromsuch a study would subsequently contribute to a more thoroughunderstanding of potential long-term effects of population de-pletion in batoids as a whole. Thus, the objectives of the currentstudy were to re-evaluate age, growth, and maturity of the Barn-door Skate and determine whether compensatory changes inthese life history parameters have occurred within the sampledpopulation.
METHODS
SamplingBarndoor Skate were captured opportunistically in collabora-
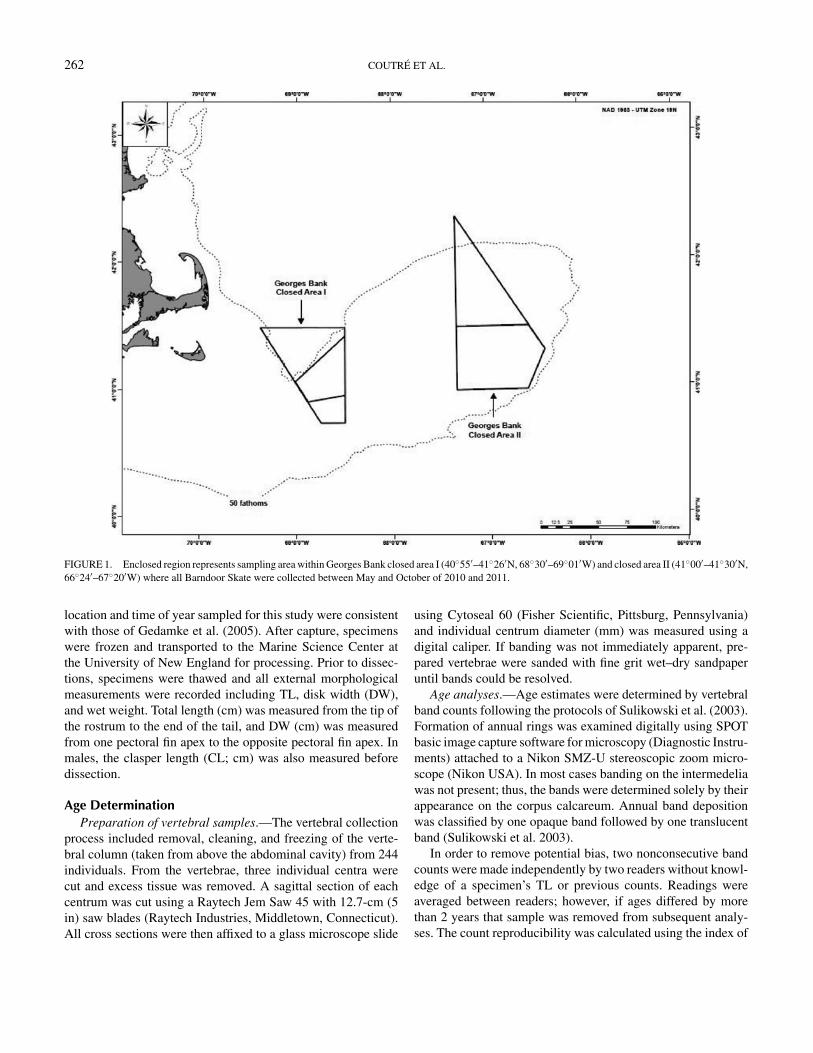
tion with the Virginia Institute of Marine Science (VIMS) duringindustry-based, cooperative scallop surveys. Samples were ob-tained aboard the FV Celtic and FV Endeavor using a NationalMarine Fisheries Service (NMFS) sea scallop survey dredge(2.4 m width with 5.1-cm rings) and a Coonamessett Farm turtledeflector dredge (CFTDD) (4.6 m width with 10.2-cm rings) intandem 15-min tows. Skate were collected within a portion of theGeorges Bank closed area I (40◦55′–41◦26′N, 68◦30′–69◦01′W)and closed area II (41◦00′–41◦30′N, 66◦24′–67◦20′W) betweenMay and October of 2010 and 2011 (Figure 1). The sampling
262 COUTRE ET AL.
FIGURE 1. Enclosed region represents sampling area within Georges Bank closed area I (40◦55′–41◦26′N, 68◦30′–69◦01′W) and closed area II (41◦00′–41◦30′N,66◦24′–67◦20′W) where all Barndoor Skate were collected between May and October of 2010 and 2011.
location and time of year sampled for this study were consistentwith those of Gedamke et al. (2005). After capture, specimenswere frozen and transported to the Marine Science Center atthe University of New England for processing. Prior to dissec-tions, specimens were thawed and all external morphologicalmeasurements were recorded including TL, disk width (DW),and wet weight. Total length (cm) was measured from the tip ofthe rostrum to the end of the tail, and DW (cm) was measuredfrom one pectoral fin apex to the opposite pectoral fin apex. Inmales, the clasper length (CL; cm) was also measured beforedissection.
Age DeterminationPreparation of vertebral samples.—The vertebral collection
process included removal, cleaning, and freezing of the verte-bral column (taken from above the abdominal cavity) from 244individuals. From the vertebrae, three individual centra werecut and excess tissue was removed. A sagittal section of eachcentrum was cut using a Raytech Jem Saw 45 with 12.7-cm (5in) saw blades (Raytech Industries, Middletown, Connecticut).All cross sections were then affixed to a glass microscope slide
using Cytoseal 60 (Fisher Scientific, Pittsburg, Pennsylvania)and individual centrum diameter (mm) was measured using adigital caliper. If banding was not immediately apparent, pre-pared vertebrae were sanded with fine grit wet–dry sandpaperuntil bands could be resolved.
Age analyses.—Age estimates were determined by vertebralband counts following the protocols of Sulikowski et al. (2003).Formation of annual rings was examined digitally using SPOTbasic image capture software for microscopy (Diagnostic Instru-ments) attached to a Nikon SMZ-U stereoscopic zoom micro-scope (Nikon USA). In most cases banding on the intermedeliawas not present; thus, the bands were determined solely by theirappearance on the corpus calcareum. Annual band depositionwas classified by one opaque band followed by one translucentband (Sulikowski et al. 2003).
In order to remove potential bias, two nonconsecutive bandcounts were made independently by two readers without knowl-edge of a specimen’s TL or previous counts. Readings wereaveraged between readers; however, if ages differed by morethan 2 years that sample was removed from subsequent analy-ses. The count reproducibility was calculated using the index of
GROWTH AND MATURITY OF BARNDOOR SKATE 263
average percent error (IAPE) equation (Beamish and Fournier1981) and an age-bias plot was used to evaluate bias betweenreaders (Campana 2001). The three-parameter von Bertalanffygrowth function (VBGF; von Bertalanffy 1938) was fit to size-at-age data using nonlinear regression in Statgraphics Centurion(StatPointTechnologies).
The marginal increment analyses (MIA) method was used toverify the annual periodicity of band-pair formation on 205 spec-imens, which included immature and mature Barndoor Skatecaptured in May, July, and October. For MIA, SPOT basic soft-ware (Diagnostic Instruments) was used to incorporate point-to-point distance measurements into the digital image spanningthe length of the final opaque band and the penultimate opaqueband from the edge of the centrum. The ratio of these two valueswas then calculated as the marginal increment (Sulikowski et al.2005b, 2007) and plotted by month of capture.
SEXUAL MATURITYFemales.—Sexual maturity in females was assessed by ex-
amining developmental changes in the gross morphology ofthe reproductive tract (Sulikowski et al. 2005b, 2006, 2007).The oviducal gland and ovaries were removed, blotted dry, andweighed to the nearest gram. The largest follicle diameter wasmeasured in millimeters using a digital caliper. Additionally, thepresence of egg cases within the uterus was recorded. Femaleswere considered reproductively capable of ovulation and encap-sulation, and thus mature, when the oviducal gland measured>30 g and maximum follicle size was >10 mm.
Males.—For each male specimen, the testes were removed,blotted dry, and weighed to the nearest gram. Clasper length(CL), defined as the distance from the posterior of the cloaca tothe posterior tip of the clasper, was recorded for each specimen.To further assess maturity, histological analysis of testes wasconducted following the protocol of Sulikowski et al. (2005b).After obtaining testes weight, a thin cross section was removedfrom the medial lobe of the testis and fixed in 10% bufferedformalin. Testis cross sections were stained with a standardhematoxylin and eosin staining procedure. Prepared slides wereexamined under a microscope to observe spermatogenic devel-opment. To determine male sexual maturity, the mean proportionof a testes occupied by mature spermatocytes along a straight-line distance across one representative full-lobe cross sectionof the testis was obtained. Mature spermatocytes were iden-tified by the organization of spermatozoa into tightly shapedpackets that were arranged spirally along the periphery of thespermatocytes. Male maturity was classified by specimens hav-ing calcified claspers >19 mm, developed testes >12 g, and>23% mature spermatocytes. We adopted these criteria fromprevious studies that reported similar characteristics for maturerajid species (Sulikowski et al. 2005b, 2006; Cicia et al. 2009).
Statistical AnalysisFor MIA, a multifactor ANOVA was used to test for dif-
ferences in the length of the marginal increment by sex and
maturity to ensure no ontogenetic changes occurred in banddeposition and data could thus be combined. Due to nonnor-mally distributed data with equal variances, a Kruskal–Wallisone-way ANOVA on ranks was then used to test for differ-ences in marginal increment by month (Sulikowski et al. 2003,2005a). To determine whether there were differences in VBGFparameters between sexes, a likelihood ratio test was employedusing Statgraphics Centurion (StatPointTenchnologies; Cerrato1990). In addition, this comparison was also made betweenmales and females in the Gedamke et al. (2005) study as wellas between the combined male and female VBGF parametersof the current study and those of Gedamke et al. (2005). To de-termine whether a relationship existed between morphologicaland histological variables, a Pearson correlation analysis wasperformed for both male and female reproductive parameters.Differences in morphological and histological variables amongage-groups were determined using an ANOVA, followed by aTukey’s post hoc test. To determine TL and age estimates at50% maturity, ogives were fitted to a least-squares nonlinearregression model following the methods of Mollet et al. (2000)and using Statgraphics Centurion (StatPoint Technologies). Allstatistical tests were considered significant at α = 0.05.
RESULTS
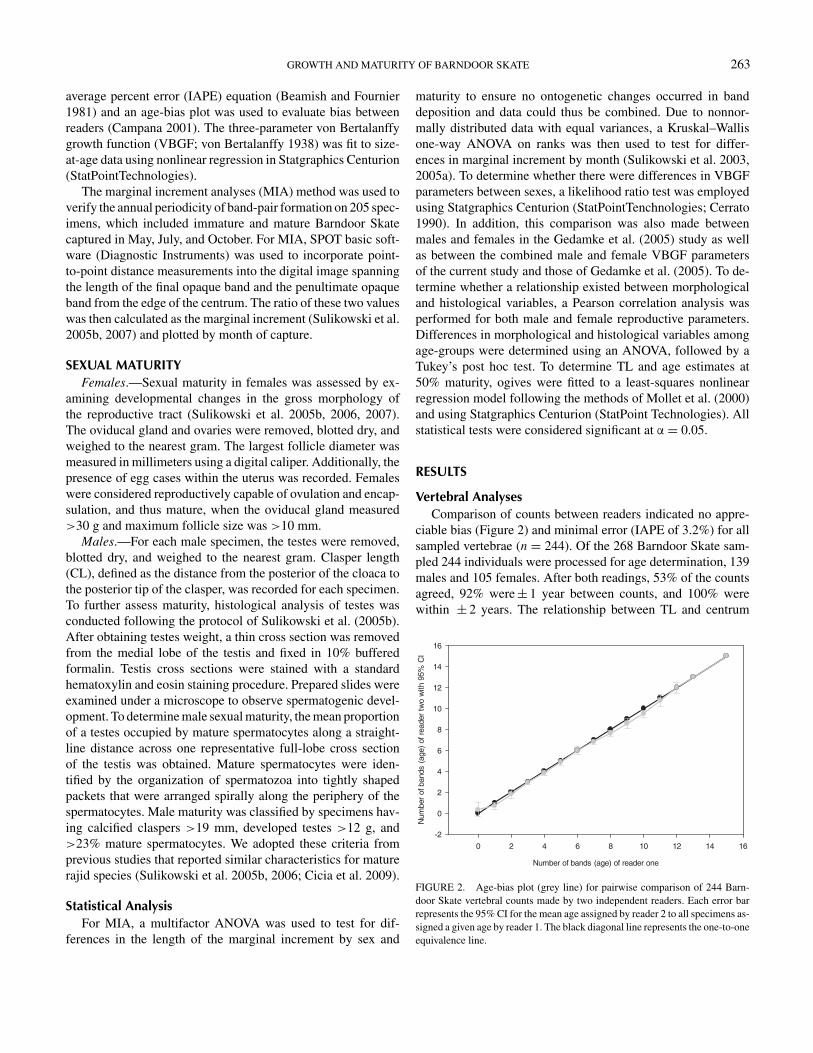
Vertebral AnalysesComparison of counts between readers indicated no appre-
ciable bias (Figure 2) and minimal error (IAPE of 3.2%) for allsampled vertebrae (n = 244). Of the 268 Barndoor Skate sam-pled 244 individuals were processed for age determination, 139males and 105 females. After both readings, 53% of the countsagreed, 92% were ± 1 year between counts, and 100% werewithin ± 2 years. The relationship between TL and centrum
Number of bands (age) of reader one
0 2 4 6 8 10 12 14 16
Num
ber
of b
ands
(ag
e) o
f rea
der
two
with
95%
CI
-2
0
2
4
6
8
10
12
14
16
FIGURE 2. Age-bias plot (grey line) for pairwise comparison of 244 Barn-door Skate vertebral counts made by two independent readers. Each error barrepresents the 95% CI for the mean age assigned by reader 2 to all specimens as-signed a given age by reader 1. The black diagonal line represents the one-to-oneequivalence line.

264 COUTRE ET AL.
FIGURE 3. Mean monthly marginal increments of opaque bands for 205sampled Barndoor Skate. Marginal increments were calculated for the sampledmonths May (n = 45), July (n = 130), and October (n = 30), including bothsexes and immature and mature skate. Error bars represent ± 1 SE. Significantdifference is represented by an asterisk (*) among months sampled (Kruskal–Wallis test: P < 0.05).
diameter was linear (R2 = 0.93, P > 0.05) and there were nosignificant differences in this relationship between males andfemales. A total of 205 skate ranging from 21 to 129 cm TLwere used for MIA. Since no significant differences in marginalincrement existed between sexes or maturity stage (multifactorANOVA: P >0.05), these data were combined. Marginal incre-ment analysis revealed a significant difference existed amongmonths sampled (Kruskal–Wallis ANOVA: P < 0.05). Theopaque growth band displayed an increasing trend from May toJuly with a sharp decline in October suggesting the deposition ofa new opaque band occurred during this time frame (Figure 3).
Age and Growth EstimatesCaptured males ranged between 0 and 15 years (21–129 cm
TL) and females between 0 and 11 years (30–126 cm TL).Whenthe VBGF were fitted to length-at-age data, model results indi-cated a reasonable fit for males (R2 = 0.96), females (R2 = 0.95)and sexes combined (R2 = 0.96). Von Bertalanffy growth param-eters between sexes had the same k value (0.10) but a slightlyhigher L∞ for females than for males (male L∞ = 158 cm;female L∞ = 167 cm). Although a significant difference wasfound between sexes (likelihood ratio = 12.41, chi-square P <
0.01), these data were combined to allow for a direct compari-son between the VBGF of the current study (L∞ = 155 cm, k =0.10, L0 = 28 cm) and the VBGF calculated from Gedamke et al.(2005: L∞ = 166 cm, k = 0.14, L0 = 27 cm). This comparisonrevealed a significant difference in the VBGF parameters existedbetween the two studies (likelihood ratio = 340.63, chi-squareP < 0.01) (Figure 4).
MaturityMales.—In males, as TL and age increased reproductive de-
velopment was observed in testis mass, CL, and percent maturespermatocytes (Table 1). In addition, all measured parameterswere strongly correlated with an increase in TL (all r2 val-
Age(years)
TL
(cm
)
0 1 2 3 4 5 6 7 8 9 10 11 12 13 14 15
025
5075
100
125
150
FIGURE 4. Von Bertalanffy growth curves (VBGC) generated from combinedBarndoor Skate vertebral data for the current study (black line) and Gedamkeet al. (2005) (grey line). Corresponding growth parameters for combined maleand female data resulted in L∞ = 155 cm TL, k = 0.10, and L0 = 28 cm (currentstudy, lower curve) and L∞ = 167 cm TL, k = 0.14, and L0 = 27 cm (Gedamkeet al. 2005, upper curve).
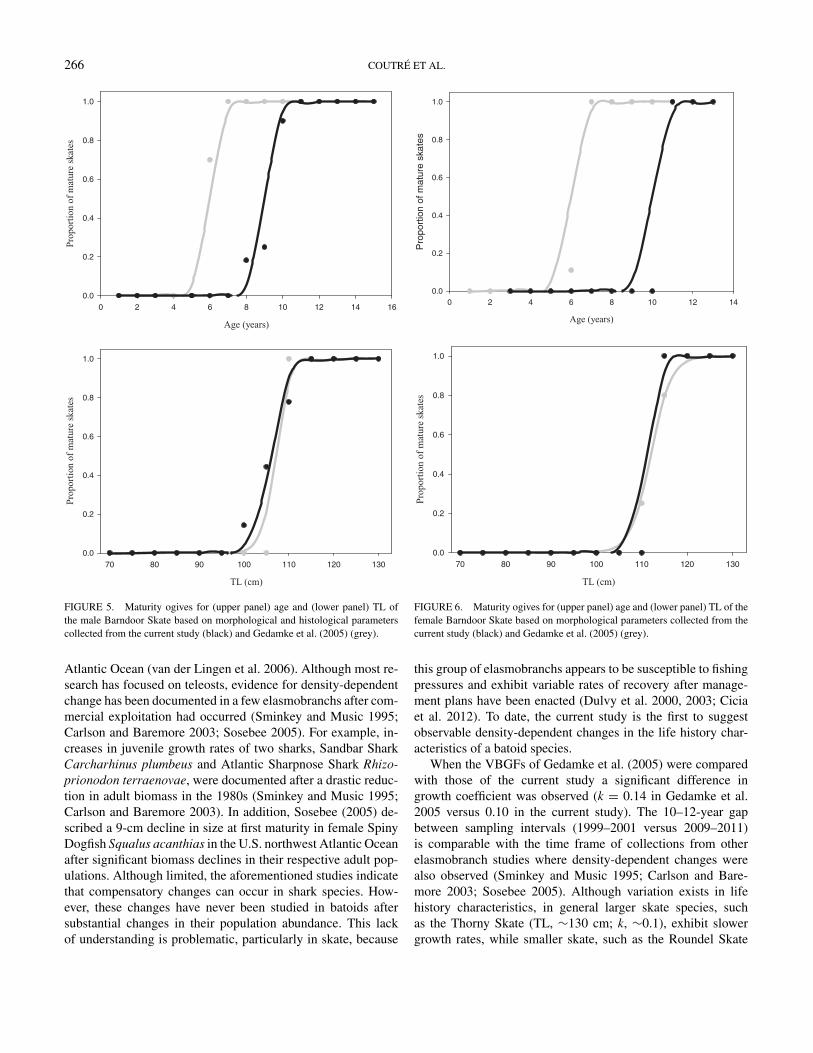
ues were greater than 0.75) over the course of maturation. Thepresence of mature spermatocytes was first observed in a 7-year-old, 98-cm-TL skate, and an abrupt increase in spermatocytesoccurred between ages 8 (9%) and 9 (20%). This correspondedwith testis development where a significant increase in testismass occurred during maturation between ages 8 and 9 yearsand again between 11 and 12 years (ANOVA: P < 0.05). Ad-ditionally, there was a significant increase in CL between ages10 and 11 years (ANOVA: P < 0.05). Maturity ogives predicted50% maturity occurs at a TL of 108 cm and an estimated ageof 9 years. This is in agreement with morphological measure-ments, which suggest maturity occurs at 9–10 years and a TLoccurs between 106 and 109 cm (Figure 5). The smallest sexu-ally mature male measured 102.5 cm TL and was 8 years old,and the largest immature male measured 109.5 cm TL and was10 years old. According to the observed data set, maturity inmales occurs at 84% of their maximum observed TL and 60%of their maximum observed age.
Females.—In females, the increase in TL and age corre-sponded with reproductive development in ovary mass, oviducalgland mass, and follicle size (Table 2). All measured reproduc-tive parameters were strongly correlated with TL (all r2 valueswere greater than 0.68) over the range of maturation. However,of the 131 females sampled only three were found to be mature.Follicular development (all follicles < 1 mm in diameter) wasnot observed until the onset of maturity at 7 years in age. Therewas a significant increase in ovary mass and shell gland massbetween ages 8 and 9 years, while significant increases in allof the measured reproductive parameters in females occurredbetween 9 and 11 years of age and 100–118 cm TL (ANOVA:P < 0.05). Maturity ogives indicated 50% maturity in females

GROWTH AND MATURITY OF BARNDOOR SKATE 265
TABLE 1. Morphological measurements and reproductive parameters for male Barndoor Skate. Values are given as mean ± SE; NA denotes no fish sampled inthis category; CL = clasper length. For each column an asterisk represents significant differences (ANOVA followed by a Tukey’s post hoc test: P < 0.05) betweenskates in consecutive age-groups.
Age % mature(years) n TL (cm) CL (cm) Mass (kg) Testes mass (g) spermatocytes
0 14 33 ± 6 2.19 ± 0.85 0.11 ± 0.08 0.09 ± 0.09 0 ± 01 11 45 ± 3 3.42 ± 0.70 0.42 ± 0.23 0.41 ± 0.21 0 ± 02 17 53 ± 3 4.54 ± 0.53 0.69 ± 0.17 0.73 ± 0.25 0 ± 03 17 61 ± 4 5.38 ± 0.84 1.08 ± 0.26 1.26 ± 0.25 0 ± 04 13 73 ± 4 6.58 ± 0.98 1.82 ± 0.65 2.77 ± 0.90 0 ± 05 6 85 ± 7 9.18 ± 3.25 5.05 ± 1.18 5.38 ± 3.02 0 ± 06 6 92 ± 14 13.66 ± 8.81 3.48 ± 0.73 9.32 ± 12.07 0 ± 07 11 98 ± 10 14.79 ± 6.16* 5.14 ± 1.73 11.31 ± 5.14 4 ± 108 11 100 ± 6 19.10 ± 7.50* 5.18 ± 1.28 14.86 ± 10.03* 9 ± 15*9 4 107 ± 8 23.38 ± 8.86 7.11 ± 2.324 22.43 ± 15.10* 20 ± 16*
10 10 113 ± 4 26.5 ± 4.71* 8.41 ± 1.13 25.46 ± 10.81 20 ± 1711 6 119 ± 6 32.18 ± 2.63* 10.58 ± 1.13 44.78 ± 7.44 32 ± 612 8 116 ± 5 31.80 ± 2.03 9.4 ± 1.30 46.99 ± 8.65 25 ± 1113 1 122 ± 0 34.70 ± 0 9.73 ± 0 51.0 ± 0 50 ± 014 1 128 ± 0 33.50 ± 0 11.36 ± 0 61.0 ± 0 NA15 1 129 ± 0 35.50 ± 0 10.86 ± 0 57.54 ± 0 35 ± 0
occurs at a TL of 100 cm and an age of 10 years (Figure 6).The smallest mature female measured 118 cm TL and was aged11 years, and the largest immature female measured 114.5 cmand was aged 9 years. According to the observed data set, ma-turity in females occurs at 79% of the maximum observed TLand 91% of their maximum observed age.
DISCUSSIONAge and maturity information is essential for the calculations
of growth rates, mortality rates, and reproductive productivity,making these two of the most important variables for estimat-
ing a population’s status and assessing the effects of overfishing(Cailliet and Goldman 2004; Walker 2005; Sulikowski et al.2007). Due to the plasticity of these and other life history pa-rameters, this information should be frequently revaluated andmonitored for subsequent changes if accurate stock assessmentsare to be conducted for commercially exploited species (Dulvyet al. 2000; Hutchings and Reynolds 2004). Density-dependentshifts in life history parameters have been widely observed incommercially important teleosts such as Haddock Melanogram-mus aeglefinus in the North Atlantic Ocean (Rose et al. 2001)and Pacific Sardine Sardinops sagax populations in the southern
TABLE 2. Morphological measurements and reproductive parameters for female Barndoor Skate. Values are given as mean ± SE. For each column an asteriskrepresents significant differences (ANOVA followed by a Tukey’s post hoc test: P < 0.05) between skates in consecutive age-groups.
Age Largest(years) n TL (cm) Mass (kg) Ovary mass (g) SG Mass (g) follicle (mm)
0 5 32 ± 2 0.22 ± 0.15 0.07 ± 0.10 0 ± 0 <11 8 45 ± 3 0.60 ± 0.46 0.30 ± 0.14 0.02 ± 0.02 <12 8 52 ± 4 0.76 ± 0.41 0.79 ± 0.58 0.03 ± 0.05 <13 21 62 ± 4 0.98 ± 0.43 1.30 ± 0.45 0.05 ± 0.05 <14 18 78 ± 6 2.40 ± 1.02 3.13 ± 1.34 0.17 ± 0.14 <15 3 92 ± 10 3.81 ± 1.50 5.93 ± 3.04 0.66 ± 0.80 <16 3 92 ± 1 4.71 ± 0.30 7.44 ± 2.57 1.08 ± 0.20 <17 11 97 ± 4 5.59 ± 1.05 11.50 ± 7.69 6.15 ± 15.18 3 ± 58 1 100 ± 0 5.18 ± 0 6.63 ± 0* 2.19 ± 0* 5 ± 09 10 110 ± 2 7.62 ± 2.27 18.48 ± 6.11* 15.27 ± 11.09* 9 ± 5*
11 3 122 ± 6 12.32 ± 6.03 42.85 ± 10.03* 37.97 ± 4.68* 24 ± 15*
266 COUTRE ET AL.
Age (years)
0 2 4 6 8 10 12 14 16
Pro
port
ion
of m
atur
e sk
ates
0.0
0.2
0.4
0.6
0.8
1.0
TL (cm)
70 80 90 100 110 120 130
Pro
port
ion
of m
atur
e sk
ates
0.0
0.2
0.4
0.6
0.8
1.0
FIGURE 5. Maturity ogives for (upper panel) age and (lower panel) TL ofthe male Barndoor Skate based on morphological and histological parameterscollected from the current study (black) and Gedamke et al. (2005) (grey).
Atlantic Ocean (van der Lingen et al. 2006). Although most re-search has focused on teleosts, evidence for density-dependentchange has been documented in a few elasmobranchs after com-mercial exploitation had occurred (Sminkey and Music 1995;Carlson and Baremore 2003; Sosebee 2005). For example, in-creases in juvenile growth rates of two sharks, Sandbar SharkCarcharhinus plumbeus and Atlantic Sharpnose Shark Rhizo-prionodon terraenovae, were documented after a drastic reduc-tion in adult biomass in the 1980s (Sminkey and Music 1995;Carlson and Baremore 2003). In addition, Sosebee (2005) de-scribed a 9-cm decline in size at first maturity in female SpinyDogfish Squalus acanthias in the U.S. northwest Atlantic Oceanafter significant biomass declines in their respective adult pop-ulations. Although limited, the aforementioned studies indicatethat compensatory changes can occur in shark species. How-ever, these changes have never been studied in batoids aftersubstantial changes in their population abundance. This lackof understanding is problematic, particularly in skate, because
Age (years)
0 2 4 6 8 10 12 14
Pro
port
ion
of m
atur
e sk
ates
0.0
0.2
0.4
0.6
0.8
1.0
TL (cm)
70 80 90 100 110 120 130
Pro
port
ion
of m
atur
e sk
ates
0.0
0.2
0.4
0.6
0.8
1.0
FIGURE 6. Maturity ogives for (upper panel) age and (lower panel) TL of thefemale Barndoor Skate based on morphological parameters collected from thecurrent study (black) and Gedamke et al. (2005) (grey).
this group of elasmobranchs appears to be susceptible to fishingpressures and exhibit variable rates of recovery after manage-ment plans have been enacted (Dulvy et al. 2000, 2003; Ciciaet al. 2012). To date, the current study is the first to suggestobservable density-dependent changes in the life history char-acteristics of a batoid species.
When the VBGFs of Gedamke et al. (2005) were comparedwith those of the current study a significant difference ingrowth coefficient was observed (k = 0.14 in Gedamke et al.2005 versus 0.10 in the current study). The 10–12-year gapbetween sampling intervals (1999–2001 versus 2009–2011)is comparable with the time frame of collections from otherelasmobranch studies where density-dependent changes werealso observed (Sminkey and Music 1995; Carlson and Bare-more 2003; Sosebee 2005). Although variation exists in lifehistory characteristics, in general larger skate species, suchas the Thorny Skate (TL, ∼130 cm; k, ∼0.1), exhibit slowergrowth rates, while smaller skate, such as the Roundel Skate

GROWTH AND MATURITY OF BARNDOOR SKATE 267
TABLE 3. Comparison of calculated VBGF parameters for male, female, and combined sexes, as well as male and female age (years) and TL (cm) at maturityestimates between the current study and that of Gedamke et al. (2005). Likelihood ratio comparisons were performed between males and females as well asbetween combined sexes of Barndoor Skate between the studies (Cerrato 1990).
Age at maturity TL at maturity LikelihoodSex Study k L∞ (years) (cm) ratio χ2 P-value
Male Current study 0.10 158.34 9 108 149.68 <0.001Gedamke et al. 0.12 184.61 6 110
Female Current study 0.10 167.20 10 110 115.10 <0.001Gedamke et al. 0.17 154.12 7 116
Sexes combined Current study 0.10 155.24 340.63 <0.001Gedamke et al. 0.14 166.60
Raja texana (TL, ∼70 cm; k, ∼0.30), typically display fastergrowth rates (Dulvy et al. 2000; Sulikowski et al. 2005a, 2007).The slower growth rate in our study is more characteristic oflarger batoid species, suggesting the barndoor skate may bemore susceptible to fishing pressure than previously thought(Dulvy et al. 2000; Gedamke et al. 2005; Cavanagh andDamon-Randall, 2009). Prior studies have suggested that afterdepletion and subsequent depression of a population’s biomass,resources become more readily available (Rose et al. 2001).An artifact of this depressed biomass is decreased competitionbetween the remaining individuals, which ultimately con-tributes to an increased growth rate exhibited by the populationas a whole (Lorenzen and Enberg 2002; Rose et al. 2001;Carlson and Baremore 2003). Additionally, laboratory-basedstudies corroborate the changes in life history observed in thefield. For example, under controlled laboratory conditions anincrease in individual growth rate was observed when a higherquantity of food was made available to juvenile Blacktip ReefSharks Carcharhinus melanopterus and juvenile Lemon SharksNegaprion brevirostris (Taylor and Wisner 1988; Cortes andGruber 1994). Based on the collective field and laboratorystudies, it is possible that the increased availability of food andother resources was a contributing factor in the higher growthrate observed by Gedamke et al. (2005) when compared with thecurrent study. While no elasmobranch studies have assessed thecompensatory changes associated with a population increase,elevated biomass levels in teleost species can cause density-dependent decreases in growth rates. For example, reductions ingrowth rates were observed in Brown Trout Salmo trutta, CohoSalmon Oncorhynchus kisutch, and steelhead O. mykiss afterpopulation densities were arbitrarily increased over a 3-monthtime period in riverine environments (Bohlin et al. 1994).The estimated biomass (NEFMC 2007) of the Barndoor Skatepopulation sampled by Gedamke et al. (2005) was far below theestimated biomass levels from which the current growth rateswere calculated (NEFMC 2011). The slower growth observedin the current study supports the hypothesis that the lower kvalues presented herein may be the result of increased com-petition for resources. However, further research is needed todetermine the mechanism responsible for the observed changes
in growth rates between Gedamke et al. (2005) and the currentstudy.
Comparisons of reproductive parameters between Gedamkeet al. (2005) and the current study revealed that the age at ma-turity for both male and female Barndoor Skate had increasedfrom 6 to 9 years and from 7 to 10 years, respectively. In males,due to opportunistic sampling in summer and fall, continuousproduction of sperm after the onset of sexual maturity was as-sumed based on previous skate studies (Sulikowski et al. 2005b;Cicia et al. 2009). It is important to note that only three maturefemale specimens were obtained, suggesting the largest and old-est females were not represented in this study. The small numberof large individuals within sampled females could result in anoverestimated growth rate for their population, causing a poten-tial further slowing of growth and age and size at maturity inBarndoor Skate that is not reflected in the current study (e.g.,Sulikowski et al. 2003). Although age at maturity increased, TLat maturity experienced very little change between studies, sug-gesting that the current population requires an additional 3 yearsto reach maturity at that size (Table 3). The maturation process ofBarndoor Skate reported in the current study is similar to thoseobserved in other large skate, such as the Alaska Skate Bathyrajaparmifera (TL ∼120 cm), which reaches maturity at approxi-mately 9 years in males and 10 years in females. Several studieson elasmobranchs have observed changes in size at maturityafter biomass depletion. For example, Carlson and Baremore(2003) observed that the Atlantic Sharpnose Shark experienceda decrease both in age and TL at maturity, while Sosebee (2005)reported a large decrease (9 cm) in size at sexual maturity inSpiny Dogfish. Although previous elasmobranch studies havenot addressed changes in maturity as a result of a biomass in-crease, several studies in teleosts have suggested that increasedcompetition for fewer available resources can result in delayedmaturation and lower reproductive potential, creating an overallcompensatory shift in the population (Rose et al. 2001). Forexample, the percentage of mature age-1 male Walleyes Sandervitreus in Lake Erie declined from 99% after drastic populationdepletion to 32% after the population had recovered in Lake Erie(Muth and Wolfert 1986). In addition, studies on Silver HakeMerluccius bilinearis in the northwest Atlantic Ocean suggest

268 COUTRE ET AL.
that sexual maturity can be delayed when stock abundance isincreased due to added competition (Helser and Almeida 1997).Based on the collective information of the aforementioned stud-ies, it appears that the onset of maturity in elasmobranchs can bealtered as a function of density-dependent changes in biomass.Thus, the delayed maturity observed in the current study sup-ports the notion that the observed phenomenon may indeed bethe result of increased competition for resources. However, fur-ther research is needed to determine the mechanism responsiblefor the observed changes in size at maturity between Gedamkeet al. (2005) and the current study.
Accounting for density-dependent changes is essential inmanagement measures that involve long-term predictions of fishpopulation dynamics (Rose et al. 2001). Due to opportunisticsampling, specimen collections were limited to trips in the sum-mer and fall for both studies. Although 268 skate were used toassess maturity, we lack data for the largest mature females. Itis also possible that observed changes in life history parameterswere influenced by other factors such as natural variability. De-spite these limitations, based on the results presented herein andthe 10- to 12-year gap between the collections of data it is likelythat the Barndoor Skate sampled within closed areas I and II onGeorges Bank have undergone significant changes in their lifehistory parameters. Historically, the closures on Georges Bankhave benefitted many benthic and demersal species, particularlythose exhibiting minimal movement in and out of the closedarea (Murawski et al. 2000). This appears to be the case forBarndoor Skate sampled in the current study. Thus, the life his-tory characteristics presented herein should be considered whennew management measures for this species are implemented.
ACKNOWLEDGMENTSWe thank the captains and crews of the FV Celtic and FV
Endeavor of New Bedford, Massachusetts, and William DuPaul,Jessica Bergeron, and Ryan Knotek for aid in the collection ofskate. We further show appreciation to the Sulikowski researchlaboratory for aid in dissections and transport of specimens. Thisproject was supported by the University of New England HonorsProgram and College of Arts and Sciences Summer ResearchStipend, Marine Science Department, Marine Science Center.
REFERENCESBeamish, R. J., and D. A. Fournier. 1981. A method for comparing the precision
of a set of age determinations. Canadian Journal of Fisheries and AquaticSciences 38:982–983.
Bohlin, T., C. Dellefors, U. Faremo, and A. Johlander. 1994. The energeticequivalence hypothesis and the relation between population density and bodysize in stream-living salmonids. American Naturalist 143:478–493.
Cailliet, G. M., and K. J. Goldman. 2004. Age determination and validation inchondrichthyan fishes. Pages 552–617 in J. C. Carrier, J. A. Musick, and M.R. Heithaus, editors. Biology of sharks and their relatives. CRC Press, BocaRaton, Florida.
Campana, S. E. 2001. Accuracy, precision and quality control in age determi-nation, including a review of the use and abuse of age validation methods.Journal of Fish Biology 59:197–242.
Carlson, J. K., and I. E. Baremore. 2003. Changes in biological parameters ofAtlantic Sharpnose Shark Rhizoprionodon terraenovae in the Gulf of Mexico:evidence for density-dependent growth and maturity? Marine and FreshwaterResearch 54:227–234.
Casey, J. M., and R. A. Myers. 1998. Near extinction of a large, widely dis-tributed fish. Science 281:690–692.
Cavanagh, M. F., and K. Damon-Randall. 2009. Status of the Barndoor Skate(Dipturus laevis). National Marine Fisheries Service, Northeast RegionalOffice, Gloucester, Massachusetts.
Cerrato, R. M. 1990. Interpretable statistical tests for growth comparisons usingparameters in the von Bertalanffy equation. Canadian Journal of Fisheriesand Aquatic Sciences 47:1416–1426.
Cicia, A. M., W. B. Driggers III, G. W. Ingram Jr., J. Kneebone, P. C. W. Tsang,D. Koester, D. M. Koester, and J. A. Sulikowski. 2009. Size and age estimatesat sexual maturity for the Little Skate Leucoraja erinacea from the westernGulf of Maine, U.S.A. Journal of Fish Biology 75:1648–1666.
Cicia, A. M., L. S. Schlenker, J. A. Sulikowski, and J. W. Mandelman. 2012. Sea-sonal variations in the physiological stress response to discrete bouts of aerialexposure in the Little Skate, Leucoraja erinacea. Comparative Biochemistryand Physiology 162A:130–138.
Cortes, E., and S. H. Gruber. 1994. Effects of ration size on growth and grossconversion efficiency of young Lemon Sharks, Negaprion brevirostris. Jour-nal of Fish Biology 44:331–341.
Dulvy, N. K., J. D. Metcalfe, J. Glanville, M. G. Pawson, and J. D. Reynolds.2000. Fishery stability, local extinctions, and shifts in community structurein skates. Conservation Biology 14:283–293.
Dulvy, N. K., Y. Sadovy, and J. D. Reynolds. 2003. Extinction vulnerability inmarine populations. Fish and Fisheries 4:25–64.
Ebert, D. A., and L. J. V. Compagno. 2007. Biodiversity and systematics ofskates (Chondrichthyes: Rajiformes: Rajoidei). Environmental Biology ofFishes 80:111–124.
Gedamke, T., W. D. DuPaul, and J. A. Musick. 2005. Observations on the lifehistory of the Barndoor Skate, Dipturus laevis, on Georges Bank (westernNorth Atlantic). Journal of Northwest Atlantic Fishery Science 35:67–78.
Helser, T. E., and F. P. Almeida. 1997. Density-dependent growth and sexualmaturity of Silver Hake in the north-west Atlantic. Journal of Fish Biology51:607–623.
Hoenig, J. M., and S. H. Gruber. 1990. Life-history patterns in the elasmo-branchs: implications for fisheries management. Pages 1–16 in H. L. Pratt Jr.,S. H. Gruber, and T. Taniuchi, editors. Elasmobranchs as living resources:advances in the biology, ecology, systematics, and the status of the fisheries—proceedings of the second United States–Japan workshop. NOAA (NationalOceanic and Atmospheric Administration) Technical Report NMFS (NationalMarine Fisheries Service) 90.
Hutchings, J. A., and J. D. Reynolds. 2004. Marine fish population collapses:consequences for recovery and extinction risk. BioScience 54:297–309.
Lorenzen, K., and K. Enberg. 2002. Density-dependent growth as a keymechanism in the regulation of fish populations: evidence from among-population comparisons. Proceedings of the Royal Society of London B 269:49–54.
McEachran, J. D. 2002. Skates: family Rajidae. Pages 60–75 in B. B. Colletteand G. Klein-MacPhee, editors. Bigelow and Schroeder’s fishes of the Gulfof Maine, 3rd edition. Smithsonian Institution Press, Washington, D.C.
Mollet, H. F., G. Cliff, H. L. Pratt Jr., and J. D. Stevens. 2000. Reproductivebiology of the female Shortfin Mako, Isurus oxyrinchus Rafinesque, 1810,with comments on the embryonic development of lamnoids. U.S. NationalMarine Fisheries Service Fishery Bulletin 98:299–318.
Murawski, S. A., R. Brown, H. L. Lai, P. J. Rago, and L. Hendrickson. 2000.Large-scale closed areas as a fishery-management tool in temperate marinesystems: the Georges Bank experience. Bulletin of Marine Science 66:775–798.

GROWTH AND MATURITY OF BARNDOOR SKATE 269
Muth, K. M., and D. R. Wolfert. 1986. Changes in growth and maturity ofWalleyes associated with stock rehabilitation in western Lake Erie, 1964–1983. North American Journal of Fisheries Management 6:168–175.
NEFMC (New England Fishery Management Council). 2003. Skate fisherymanagement plan. NEFMC, Newburyport, Massachusetts.
NEFMC (New England Fishery Management Council). 2005. Skate annualreview. NEFMC, Newburyport, Massachusetts.
NEFMC (New England Fishery Management Council). 2007. Stock status up-date for seven skate species based on NEFSC survey data through 2006.NEFMC, Newburyport, Massachusetts.
NEFMC (New England Fishery Management Council). 2011. Skate complexacceptable biological catch, annual catch limit and total allowable landings.NEFMC, Newburyport, Massachusetts.
NOAA (National Oceanic and Atmospheric Administration). 2012. Update ofskate stock status based on NEFSC bottom trawl survey results data throughautumn 2011/spring 2012. New England Fishery Management Council, New-buryport, Massachusetts.
Rose, K. A., J. H. Cowan Jr., K. O. Winemiller, R. A. Myers, and R.Hilborn. 2001. Compensatory density dependence in fish populations: impor-tance, controversy, understanding and prognosis. Fish and Fisheries 2:293–327.
Sminkey, T. R., and J. A. Musick. 1995. Age and growth of the SandbarShark, Carcharhinus plumbeus, before and after population depletion. Copeia1995:871–883.
Sosebee, K. A. 1998. Skates. Pages 114–115 in S. H. Clark, editor. Statusof fishery resources off the northeastern United States for 1998. NOAATechnical Memorandum NMFS-NE-115.
Sosebee, K. A. 2005. Are density-dependent effects on elasmobranchmaturity possible? Journal of Northwest Atlantic Fishery Science 35:115–124.
Sulikowski, J. A., S. B. Irvine, K. C. DeValerio, and J. K. Carlson. 2007. Age,growth and maturity of the Roundel Skate, Raja texana, from the Gulf ofMexico, USA. Marine and Freshwater Research 58:41–53.
Sulikowski, J. A., J. Kneebone, S. Elzey, J. Jurek, P. D. Danley, W. H. Howell,and P. C. W. Tsang. 2005a. Age and growth estimates of the Thorny Skate(Amblyraja radiata) in the western Gulf of Maine. U.S. National MarineFisheries Service Fishery Bulletin 103:161–168.
Sulikowski, J. A., J. Kneebone, S. Elzey, J. Jurek, W. H. Howell, and P. C.W. Tsang. 2006. Using the composite variables of reproductive morphology,histology and steroid hormones to determine age and size at sexual maturityfor the Thorny Skate Amblyraja radiata in the western Gulf of Maine. Journalof Fish Biology 69:1449–1465.
Sulikowski, J. A., M. D. Morin, S. H. Suk, and W. H. Howell. 2003. Age andgrowth estimates of the Winter Skate (Leucoraja ocellata) in the western Gulfof Maine. U.S. National Marine Fisheries Service Fishery Bulletin 101:405–413.
Sulikowski, J. A., P. C. W. Tsang, and W. H. Howell. 2005b. Age and size atsexual maturity for the Winter Skate, Leucoraja ocellata, in the western Gulfof Maine based on morphological, histological and steroid hormone analyses.Environmental Biology of Fishes 72:429–441.
Taylor, L., and M. Wisner. 1988. Growth rates of captive Blacktip ReefSharks (Carcharhinus melanopterus). Bulletin de l’Institut Oceanographique,Monaco, Special Issue 5:211–217.
van der Lingen, C. D., P. Freon, T. P. Fairweather, and J. J. van der Westhuizen.2006. Density-dependent changes in reproductive parameters and conditionof southern Benguela Sardine Sardinops sagax. African Journal of MarineScience 28:625–636.
von Bertalanffy, L. 1938. A quantitative theory of organic growth (inquiries ongrowth laws. II). Human Biology 10:181–213.
Walker, T. I. 2005. Reproduction in fisheries science. Pages 81–128 in W. C.Hamlett, editor. Reproductive biology and phylogeny of Chondrichthyes:sharks, batoids, and chimaeras, volume 3. Science Publishers, Enfield, NewHampshire.
Winemiller, K. O., and K. A. Rose. 1992. Patterns of life-history diversificationin North American fishes: implications for population regulation. CanadianJournal of Fisheries and Aquatic Sciences 49:2196–2218.