
Indian Tourism Industry : Exploring Opportuni es for ...
58
84 INDIAN TOURISM INDUSTRY : EXPLORING OPPORTUNITIES FOR ENHANCING GROWTH
-
Upload
khangminh22 -
Category
Documents
-
view
2 -
download
0
Transcript of Indian Tourism Industry : Exploring Opportuni es for ...

84
INDIAN TOURISM INDUSTRY : EXPLORING OPPORTUNITIES
FOR ENHANCING GROWTH
IND
IAN
TOU
RISM
IND
USTR
Y : EX
PLO
RIN
G O
PP
OR
TUN
ITIES FOR
ENH
AN
CIN
G G
RO
WTH
EXPORT-IMPORT BANK OF INDIA
WORKING PAPER NO. 84
EXIM Bank's Working Paper Series is an a�empt to disseminate the findings of research studies carried out in the Bank.
The results of research studies can interest exporters, policy makers, industrialists, export promo�on agencies as well as
researchers. However, views expressed do not necessarily reflect those of the Bank. While reasonable care has been
taken to ensure authen�city of informa�on and data, EXIM Bank accepts no responsibility for authen�city, accuracy or
completeness of such items.
© Export-Import Bank of IndiaFebruary 2019
INDIAN TOURISM INDUSTRY : EXPLORING OPPORTUNITIES FOR ENHANCING GROWTH

CONTENTSPage No.
3
Indian Tourism Industry : Exploring Opportuni�es for Enhancing Growth
List of Tables 5
List of Exhibits 7
List of Boxes 7
Execu�ve Summary 9
1 Introduc�on 13
2 Scenario of Global Tourism Industry 16
3 Scenario of Indian Tourism Industry 24
4 Trade in Travel Services 35
5 Challenges and Strategies 38
Annexure: Types and Descrip�on of Incen�ves provided by the Government of
U�ar Pradesh for Tourism Infrastructure Development 53
Project Team:
Ms. Jahanwi, Manager, Research and Analysis Group

LIST OF TABLES
Table No. Title Page No.
5
Indian Tourism Industry : Exploring Opportuni�es for Enhancing Growth
1. Interna�onal Tourist Arrivals (in Millions) 19
2. Interna�onal Tourism Receipts (USD Billions) 19
3. Direct GDP Contribu�on in 2017 (USD Billions) 20
4. Top Tourism Spenders (USD Billions) 20
5. Expected Growth in Direct GDP Contribu�on 2018-2028 23
6. Share of Top 10 States/UTs of India in Number of Domes�c Tourist Visits in 2017 27
7. Country-wise Foreign Tourist Arrivals in India (2017) 29
8. Share of Top 10 States/UTs of India in Number of Foreign Tourist Visits in 2017 31
9. Inbound Tourism Expenditure by Purpose of the Trip 32
10. Top Source Countries and Des�na�on States for Investment in India's Hotel and
Tourism Industry (Jan'03 to Jun'18) 32
11. FDI Flows from Top Ten Source Countries to Top Ten Des�na�on States
(Jan 2003- June 2018; Value in USD Million) in India's Hotel and Tourism Industry 33
12. Top Exporters and Importers of Travel Services (2017) 36
13. Countries registering Maximum Improvement in the Travel & Tourism
Compe��veness Index 2017 38
14. Comparison of India with other Asia-Pacific Countries in Various Travel and
Tourism Compe��veness Parameters 39
15. Hotel Category-wise GST Rates 41
16. Performance of the States on FDI-NRCA Index (2013-2017) 42
17. Classifica�on of Tourist Genera�ng Markets 44
18. Treatment Costs across Countries for Select Medical Procedures 45
19. Culinary Tradi�ons with UNESCO World Heritage Status 48
20. Impact of Food Tourism Marke�ng 49


LIST OF EXHIBITS
Exhibit No. Title Page No.
7
LIST OF BOXES
Box No. Title Page No.
Indian Tourism Industry : Exploring Opportuni�es for Enhancing Growth
1. Components of Direct, Indirect and Induced Tourism Contribu�on to GDP 14
2. Snapshot of Impact of Tourism on the Global Economy 16
3. Sectoral GDP Growth - 2017 (in Per Cent) 17
4. Region-wise Interna�onal Tourist Arrivals and Receipts (2017) 18
5. Outbound Tourism, Share by Region in 2017 (%) 18
6. Share of Foreign and Domes�c Spending in Direct Contribu�on of Travel and
Tourism to GDP 21
7. Share of Leisure and Business Tourism in Direct Contribu�on of Travel and
Tourism to GDP 21
8. Growth Forecast of Outbound Travel 2018 (in Per Cent) 22
9. Snapshot of Contribu�on of Tourism to Indian Economy 25
10. Compara�ve Real Growth Rates Adjusted for Infla�on in Travel and
Tourism (in Per Cent; 2018) 25
11. Number of Domes�c Tourist Visits to all States/ UTs during 2000-2017 (in Millions) 26
12. Number of Foreign Tourist Visits to all States/UTs (in Millions) 28
13. Foreign Exchange Earnings from Tourism in India 29
14. Change in Share of Top Ten Countries in Foreign Tourist Arrivals
in India (2015-2017) 30
15. Global Trade in Travel Services (Values in USD Bn) 35
16. India's Trade in Travel Services (Values in USD Bn) 36
17. Comparison of Growth in India's Exports in Travel Services vis-à-vis
Merchandise and Commercial Services Exports 37
18. Value and Number of New Investment Projects in Hotels and Tourism Sector 40
19. Type of Investment Opportunity in the Tourism Sector 41
20. Classifica�on of Tourist Genera�ng Markets 43
1. Calcula�on of Direct, Indirect and Induced Impact of Tourism 14
2. Case Study: Ci�es of Gastronomy, France 49
3. Strategies for Managing Overcrowding at Kaas Plateau 51

EXECUTIVE SUMMARY
9
Indian Tourism Industry : Exploring Opportuni�es for Enhancing Growth
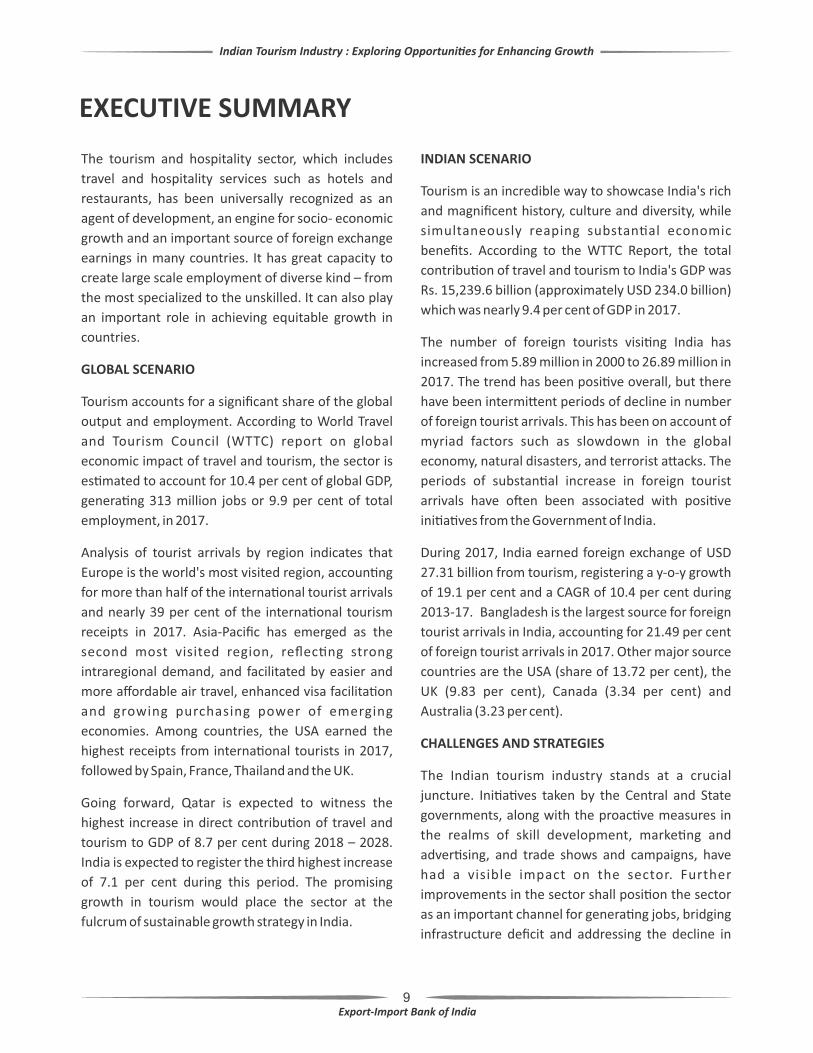
The tourism and hospitality sector, which includes
travel and hospitality services such as hotels and
restaurants, has been universally recognized as an
agent of development, an engine for socio- economic
growth and an important source of foreign exchange
earnings in many countries. It has great capacity to
create large scale employment of diverse kind – from
the most specialized to the unskilled. It can also play
an important role in achieving equitable growth in
countries.
GLOBAL SCENARIO
Tourism accounts for a significant share of the global
output and employment. According to World Travel
and Tourism Council (WTTC) report on global
economic impact of travel and tourism, the sector is
es�mated to account for 10.4 per cent of global GDP,
genera�ng 313 million jobs or 9.9 per cent of total
employment, in 2017.
Analysis of tourist arrivals by region indicates that
Europe is the world's most visited region, accoun�ng
for more than half of the interna�onal tourist arrivals
and nearly 39 per cent of the interna�onal tourism
receipts in 2017. Asia-Pacific has emerged as the
second most visited region, reflec�ng strong
intraregional demand, and facilitated by easier and
more affordable air travel, enhanced visa facilita�on
and growing purchasing power of emerging
economies. Among countries, the USA earned the
highest receipts from interna�onal tourists in 2017,
followed by Spain, France, Thailand and the UK.
Going forward, Qatar is expected to witness the
highest increase in direct contribu�on of travel and
tourism to GDP of 8.7 per cent during 2018 – 2028.
India is expected to register the third highest increase
of 7.1 per cent during this period. The promising
growth in tourism would place the sector at the
fulcrum of sustainable growth strategy in India.
INDIAN SCENARIO
Tourism is an incredible way to showcase India's rich
and magnificent history, culture and diversity, while
simultaneously reaping substan�al economic
benefits. According to the WTTC Report, the total
contribu�on of travel and tourism to India's GDP was
Rs. 15,239.6 billion (approximately USD 234.0 billion)
which was nearly 9.4 per cent of GDP in 2017.
The number of foreign tourists visi�ng India has
increased from 5.89 million in 2000 to 26.89 million in
2017. The trend has been posi�ve overall, but there
have been intermi�ent periods of decline in number
of foreign tourist arrivals. This has been on account of
myriad factors such as slowdown in the global
economy, natural disasters, and terrorist a�acks. The
periods of substan�al increase in foreign tourist
arrivals have o�en been associated with posi�ve
ini�a�ves from the Government of India.
During 2017, India earned foreign exchange of USD
27.31 billion from tourism, registering a y-o-y growth
of 19.1 per cent and a CAGR of 10.4 per cent during
2013-17. Bangladesh is the largest source for foreign
tourist arrivals in India, accoun�ng for 21.49 per cent
of foreign tourist arrivals in 2017. Other major source
countries are the USA (share of 13.72 per cent), the
UK (9.83 per cent), Canada (3.34 per cent) and
Australia (3.23 per cent).
CHALLENGES AND STRATEGIES
The Indian tourism industry stands at a crucial
juncture. Ini�a�ves taken by the Central and State
governments, along with the proac�ve measures in
the realms of skill development, marke�ng and
adver�sing, and trade shows and campaigns, have
had a visible impact on the sector. Further
improvements in the sector shall posi�on the sector
as an important channel for genera�ng jobs, bridging
infrastructure deficit and addressing the decline in

10
Indian Tourism Industry : Exploring Opportuni�es for Enhancing Growth
exports. This would entail allevia�on of challenges in
the sector which cast a shadow on the success of this
industry.
Tourism Infrastructure Development
One of the key challenges for the tourism industry in
India is the lack of adequate infrastructure facili�es.
Comparison of India with other Asia-Pacific countries
such as China, Singapore and Thailand in the Travel
and Tourism Compe��veness Index indicates that the
country fairs poorly on several key parameters such as
air transport infrastructure, ground and port
infrastructure, and tourist service infrastructure.
Hotel is one of the key suppor�ng visitor
infrastructure. One of the challenges for investments
in the higher segment of hotels is the imposi�on of
maximum rate of Goods and Services Tax (GST) in this
segment. Room rates of Rs. 7,500 and above entail a
GST rate of 28 per cent. This is in contrast to the 15 per
cent service tax which was payable earlier for room
tariffs exceeding Rs. 1,000. The GST rate could be
reconsidered to encourage investments in the high
end segment. Further, given the poten�al for revenue
genera�on and foreign exchange earnings in the
tourism sector, infrastructure status could also be
accorded to all hotel projects over Rs. 50 crore.
There is also need to encourage foreign investments
across various categories of tourism infrastructure.
There is need for ini�a�ves at the State level to a�ract
investments in tourism. States need to showcase
investors the value of inves�ng in their States and
should explore the digital channel to disseminate
success stories. States could also consider providing
fiscal incen�ves for promo�ng tourism.
Promo�onal Ac�vi�es
As resources for promo�onal ac�vi�es are limited,
iden�fica�on of target market forms an essen�al first
step for tourism marke�ng. Exim Bank analysis
indicates that marke�ng efforts should be intensified
in the markets of the USA, Australia, Brazil, Thailand,
Poland, Israel and Nigeria. These are the markets
where growth in outbound tourist expenditure has
been robust, but the Foreign Tourist Arrivals (FTAs)
from these countries to India have been less than the
growth in overall FTAs to India. These markets provide
the best opportunity for growth.
The markets of South Korea, Argen�na, and Indonesia
are established markets for India. Outbound tourist
expenditure in these markets has increased at a
growth rate faster than the world average, and FTAs
from these markets to India have also increased at a
faster pace than the growth in total FTAs to India. Past
marke�ng efforts in these markets have bode well for
FTAs to India, and should con�nue at a steady pace.
Strengthening Medical Tourism Sector
A major constraint for the medical tourism industry is
the limited number of hospitals with interna�onal
accredita�on in the country. Fiscal incen�ves could be
considered by Central and State governments in India
to encourage interna�onal accredita�on of hospitals.
Another major issue is the lack of insurance
portability. With growth in medical tourism,
insurance companies are increasingly offering
medical tourism insurance packages for specific
medical facili�es abroad, or extending coverage to
foreign loca�ons on a hospital-by-hospital basis.
Indian hospitals need to engage with global insurance
companies offering such coverage, and an
interna�onal accredita�on could be useful in this
pursuit.
There is also need for more facilitators in the medical
tourism space. Facilitators connect individual
consumers, businesses, insurance carriers and
agents, and third party administrators to affordable
and innova�ve medical travel op�ons. While several
U.S. based and interna�onal facilitators operate in the
Indian medical tourism market, there is need for
more domes�c companies in the segment. One such
Indian start-up in this space is Hospals, which has built
and scaled a pla�orm model enabling interna�onal
11
Indian Tourism Industry : Exploring Opportuni�es for Enhancing Growth
pa�ents to get these services and is already catering
to more than 200 pa�ents per month. There is need to
encourage more such ini�a�ves, possibly through the
Startup India scheme.
Tourist Insurance and Travel Assistance
The importance of good percep�on about the health
and sanita�on in context of tourism cannot be
overemphasized. While a general improvement in
healthcare infrastructure would be beneficial for
tourism, there is also a need to adopt innova�ve
mechanism for providing travel insurance to tourists.
In Thailand, for example, the State-owned Krungthai
Bank, offers tourists a debit card called the Miracle
Thailand Card, which offers some medical and life
insurance coverage in case of an accident. Similar
ini�a�ve could be undertaken in India.
There is also need to enhance focus on tourists
requiring special care as the popula�on in key tourism
genera�ng countries is aging. Accessibility of the
tourist sites is a major issue for the elderly, and it is
important to make the tourist facili�es accessible to
the physically challenged, as also provide reliable
informa�on about the accessibility of the tourist sites.
An important step in improving the accessibility of
public buildings and transport is the Accessible India
campaign. As part of the Accessible India Campaign,
accessibility of public buildings and transport were to
be made less challenging for the physically
challenged. Achievement of the deliverables of the
Accessible India campaign will significantly improve
the prospects for visitor exports.
Promo�on of Culinary Tourism
Since 2010, local food culture has also been included
as an intangible cultural world heritage by the
UNESCO. Currently, India does not have any culinary
item or tradi�on in the UNESCO intangible cultural
world heritage list. India needs to apply for UNESCO
world heritage status for its local cuisines and food
cultures as it would give a compe��ve advantage to
culinary tourism in the country.
The Ministry of Tourism could also organize contests
among various States to propose an idea for culinary
tourism project which embodies various cultural and
customary prac�ces of the local people. Such projects
can then be developed and promoted in an a�empt
to popularize culinary tourism in India. The
compe��on route for iden�fica�on of food tourism
projects has been used in several countries such as
France and Finland.
Marke�ng and promo�on of food tourism projects
would also be crucial. According to a survey
conducted by UN World Tourism Organiza�on (UN
WTO), nearly 59.5 per cent respondents reported
that food tourism promo�on led to an increase in
income from this kind of tourism. The Government of
India has already undertaken several food promo�on
campaigns in the past, including the 'Incredible Tiffin'
ini�a�ve. It could also a�empt adop�ng innova�ve
promo�on ini�a�ves taken up by other countries. In
Korea, for example, a group of young Koreans
undertook a promo�on campaign for a well-known
Korean dish, Bibimap. Known as the “Bibimbab
Backpackers”, this group travelled to over 20 ci�es in
15 countries on a 255-day trip to cook bibimbap.
Similar programme could be sponsored by the Indian
Government for Indian cuisines. Such an ini�a�ve will
also help in dissipa�ng the nega�ve percep�on about
Indian food being greasy, spicy and unhealthy.
Tapping the Chinese Outbound Travel Market
Recognizing the poten�al for visitor exports from
China, India has already taken several steps to a�ract
Chinese tourists. For example, the Government of
India has liberalised its visa norms for Chinese
na�onals. Recently, e-visa facility has also been
extended to Chinese na�onals for conference and
medical purposes.
While ease of visa procedure is a clear driver for
tourism growth, interna�onal direct flights are
another important factor for market growth. In case
of India-China route, carriers from each side are
12
Indian Tourism Industry : Exploring Opportuni�es for Enhancing Growth
allowed to operate 42 flights a week. According to
latest available es�mates, while the Chinese carriers
have used up to about 93 per cent of the quota, Indian
carriers have used only 12 per cent of the quota.
There is a need to encourage airlines to fly more
flights on these routes, given the increasing outbound
travel from the Chinese market.
Managing Overcrowding for Sustainable Tourism
India needs to adopt strategies which promote
sustainable tourism, with overcrowding emerging as
the major challenge on this front. The tourist
experience in several heritage sites of India is
deteriora�ng on account of long queues and
crowding. The infrastructure in several ci�es has also
not been able to keep pace with the tourism demand.
An essen�al star�ng point for sustainable tourism
would be establishment of data systems which go
beyond compila�on of standard informa�on
pertaining to airports and hotels. Technology could be
leveraged for providing live sta�s�cs on carrying
capacity of des�na�ons, traffic conges�ons, parking
and hotel availability, among others. Such a system
would help in iden�fica�on, realiza�on and
acknowledgment of the problem of overcrowding in
tourist des�na�ons.
Once the problem of overcrowding is iden�fied, there
are several strategies which could be adopted.
Tourism authori�es could use a daily cap for limi�ng
the number of tourists, or establish reserva�ons and
�cke�ng systems.
CONCLUSION
Indian tourism industry has witnessed consistent
growth in the recent period, which can be a�ributed
to the recovery in key tourism markets, posi�ve
ini�a�ves taken by the Central and State
governments, and the resultant improvement in
compe��veness of India's travel and tourism sector.
India is in fact expected to be among the top ten
fastest growing des�na�ons for leisure-travel
spending during the period 2016-2026. While the
growth in the sector is encouraging, several
challenges plague the domes�c tourism industry.
Allevia�on of these challenges will be essen�al for the
industry to realize its full poten�al.
13
1. INTRODUCTION
Tourism and hospitality sector plays an important role
in economic development of countries. The appeal of
the sector lies in the mul�tude of its impact on any
economy. The tourism and hospitality sector, which
includes travel and hospitality services such as hotels
and restaurants, has been universally recognized as
an agent of development, an engine for socio-
economic growth, and an important source of foreign
exchange earnings in many countries. It has great
capacity to create large scale employment of diverse
kind – from the most specialized to the unskilled. It
can also play an important role in achieving equitable
growth.
According to World Travel and Tourism Council
(WTTC) report on global economic impact of travel
and tourism, the sector is es�mated to account for
10.4 per cent of global GDP, genera�ng 313 million
jobs, or 9.9 per cent of total employment, in 2017.
Promo�ng tourism not only creates jobs, drives
exports, and generates prosperity across the world,
but also leads to several intangible benefits. It acts as
a cultural adhesive that can be wielded as a powerful
tool for global peace and integrity. It also helps
people of far flung areas to promote their culture and
norms, and provides opportunity for a country to
showcase various facets of its natural and cultural
heritage across the world.
Tourism also creates incen�ve for conserva�on and
preserva�on of natural and cultural heritage of
countries. Tourism can help meet the cost for
conserva�on of archaeological and historic sites and
prevent deteriora�on or disappearance of these sites.
Admission fees paid by tourists at some major
museums in the world, for example, provide
substan�al revenues to maintain those ins�tu�ons.
In mul�-cultural countries, regional tourism can also
help maintain the cultural iden�ty of minority cultural
groups that otherwise might be submerged into
na�on's dominant culture. It can be a major s�mulus
for conserva�on of important elements of the cultural
heritage of an area because their conserva�on can be
jus�fied, in part or whole, by tourism. In other words,
conserva�on of the cultural heritage acquires a
certain economic incen�ve through tourism.
The tourism sector also has significant backward
linkages and creates mul�plier effects which extend
to manufacturing sector in the form of demand for
souvenirs, handicra�s and mementos, as also to the
agriculture sector which supplies food products for
tourists.
IMPACT OF TOURISM
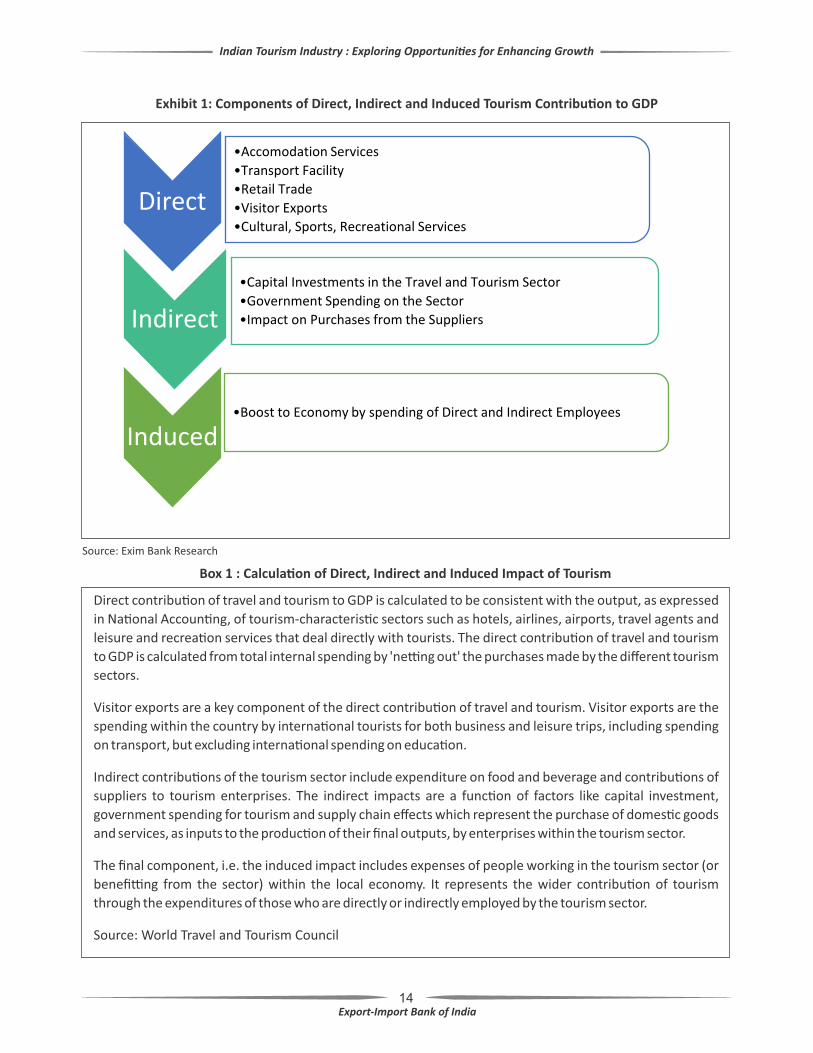
Tourism can have direct, indirect and induced impacts
on local economies. Direct impact represents the GDP
generated by ac�vi�es that directly deal with tourism
such as hotels, travel agents, airlines and tour
operators, as well as restaurants and other ac�vi�es
that cater to tourists. Indirect contribu�on includes
investment spending and the government 'collec�ve'
spending in this sector, the la�er referring to the
general government spending in support of general
tourism ac�vity and inclusive of spending on tourism
promo�on, visitor informa�on services, admini-
stra�ve services and other public services. Induced
impact reflects the contribu�on to GDP and jobs
supported by the spending of those who are directly
or indirectly employed by the travel and tourism
industry (Exhibit 1 and Box 1).
The direct, indirect and induced impacts can vary
across countries depending on how well tourism
linked ac�vi�es are amalgamated with the local
economy. Greater linkages generally translate into
higher levels of local economic ac�vity (and growth),
which tend to occur when tourism enterprises source
their goods and services (including labour) locally
whilst low levels of economic linkages occur where
tourism enterprises are dependent on imports
(including staff) to supply their demands.
Indian Tourism Industry : Exploring Opportuni�es for Enhancing Growth
14
Exhibit 1: Components of Direct, Indirect and Induced Tourism Contribu�on to GDP
Source: Exim Bank Research
Direct contribu�on of travel and tourism to GDP is calculated to be consistent with the output, as expressed
in Na�onal Accoun�ng, of tourism-characteris�c sectors such as hotels, airlines, airports, travel agents and
leisure and recrea�on services that deal directly with tourists. The direct contribu�on of travel and tourism
to GDP is calculated from total internal spending by 'ne�ng out' the purchases made by the different tourism
sectors.
Visitor exports are a key component of the direct contribu�on of travel and tourism. Visitor exports are the
spending within the country by interna�onal tourists for both business and leisure trips, including spending
on transport, but excluding interna�onal spending on educa�on.
Indirect contribu�ons of the tourism sector include expenditure on food and beverage and contribu�ons of
suppliers to tourism enterprises. The indirect impacts are a func�on of factors like capital investment,
government spending for tourism and supply chain effects which represent the purchase of domes�c goods
and services, as inputs to the produc�on of their final outputs, by enterprises within the tourism sector.
The final component, i.e. the induced impact includes expenses of people working in the tourism sector (or
benefi�ng from the sector) within the local economy. It represents the wider contribu�on of tourism
through the expenditures of those who are directly or indirectly employed by the tourism sector.
Source: World Travel and Tourism Council
Indian Tourism Industry : Exploring Opportuni�es for Enhancing Growth
Box 1 : Calcula�on of Direct, Indirect and Induced Impact of Tourism
15
SCOPE OF THE STUDY
Tourism industry in India can have a posi�ve impact
on the economy and society. The benefits include
genera�on of income and employment, poverty
allevia�on and sustainable human development. The
sector is also a catalyst for investment and contributes
substan�ally to foreign exchange earnings. By
enabling percola�on of economic benefits to less
developed areas, tourism can also act as one of the
channels to reduce interregional inequality. Tourism
could also help preserve natural and cultural heritage
of the country. Another key benefit of promo�ng the
tourism industry is the impetus it provides to the
development of mul�ple-use infrastructure that
benefits the host community, including various
means of transports, health care facili�es, and sports
centres, in addi�on to the hotels and high-end
restaurants that cater to foreign visitors. However, key
challenges like adop�on of regulatory frameworks,
mechanisms to reduce crime and corrup�on, etc.,
must be addressed if these benefits from the industry
are to be realized.
In order to provide impetus to the holis�c
deve lopment of the sector and to create
opportuni�es for investments, the Ministry of
Tourism in collabora�on with other ministries has
launched schemes such as Swadesh Darshan,
Na�onal Mission for Pilgrimage Rejuvena�on and
Spiritual Augmenta�on (PRASAD) and e-Tourist Visa
(e-TV). Further, the Union Budget 2017-18 had made
various provisions for the sector such as se�ng up of
five Special Purpose Vehicle driven Special Tourism
Zones and launch of the next phase of the Incredible
India campaign. In the Union Budget 2018-19, an
amount of Rs. 2,150 crore has been allocated to the
Ministry of Tourism, which is a 21 per cent jump from
the level of Rs. 1,776.4 crore during the last fiscal, and
indica�ve of the substan�al focus of the Government
on this sector.
To sum up, the tourism industry has vast poten�al for
genera�ng employment and earning foreign
exchange besides giving a fillip to the country's overall
economic and social development. Tourism in India
should be developed in such a way that it
accommodates and entertains visitors, is minimally
intrusive to the environment, and sustains and
supports the na�ve cultures. Since tourism is a mul�-
dimensional ac�vity, and basically a service industry,
it would be necessary that all wings of the Central and
State governments, private sector and voluntary
organisa�ons become ac�ve partners in the
endeavour to a�ain sustainable growth in tourism
sector of India. While there exists substan�al
opportuni�es in the sector, it will be important to
address the various challenges faced by the sector in
order to realise the full growth poten�al. The current
study aims to analyse the current scenario in the
sector, outline the challenges, and define a roadmap
for growth.
Indian Tourism Industry : Exploring Opportuni�es for Enhancing Growth
16
investment.
2. SCENARIO OF GLOBAL TOURISM INDUSTRY
The travel and tourism sector is expanding rapidly, on
account of the posi�ve growth trend in major
economies , improved d ig i ta l and phys ica l
connec�vity, and steady increase in tourism
spending. Across the globe, an increasing number of
des�na�ons have opened up and investment in
tourism has increased, turning the sector into a key
driver of socio-economic progress. The tourism sector
has been fuelling economic growth through the
crea�on of jobs and enterprises, export revenues, and
infrastructure development.
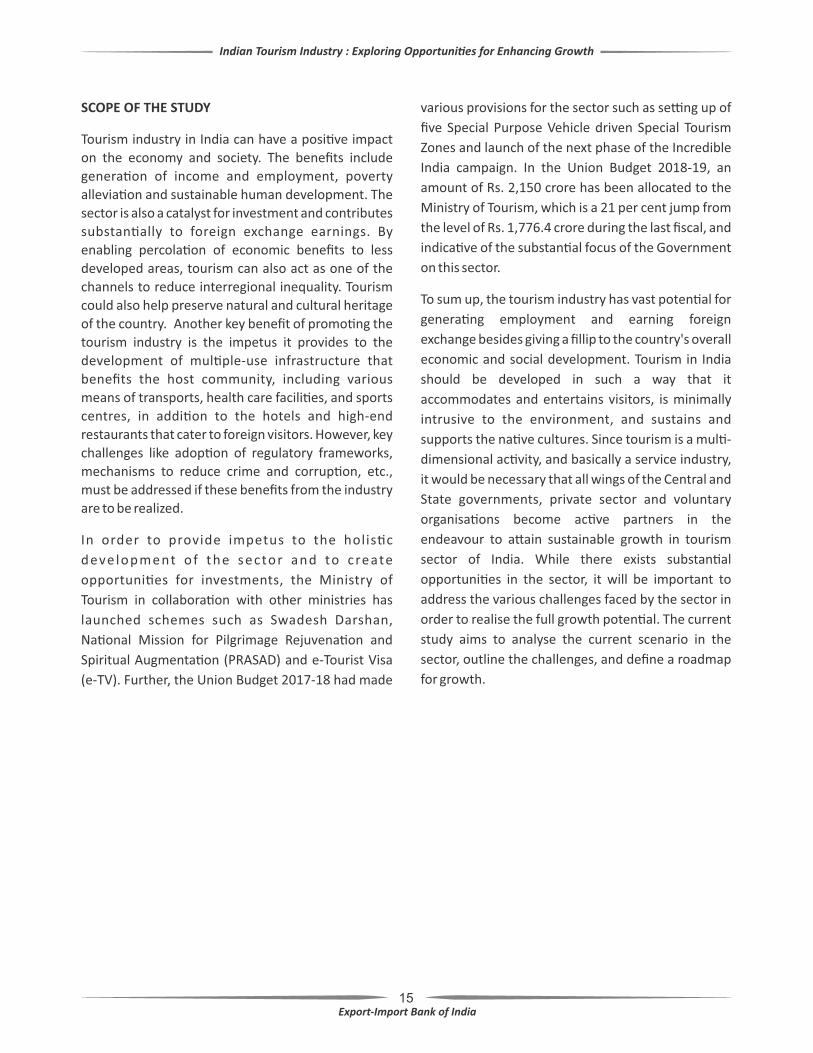
Exhibit 2: Snapshot of Impact of Tourism on the Global Economy
Source: WTTC Report 2018
As presented in Exhibit 2, tourism contributed to all
major aspects of global economy - GDP, employment,
investments and visitor exports. In 2017, the sector
contributed roughly USD 882 Billion to capital
investment, and accounted for nearly 10.4 per cent of
global GDP, 9.9 per cent of global employment and 6.5
per cent of global exports of goods and services.
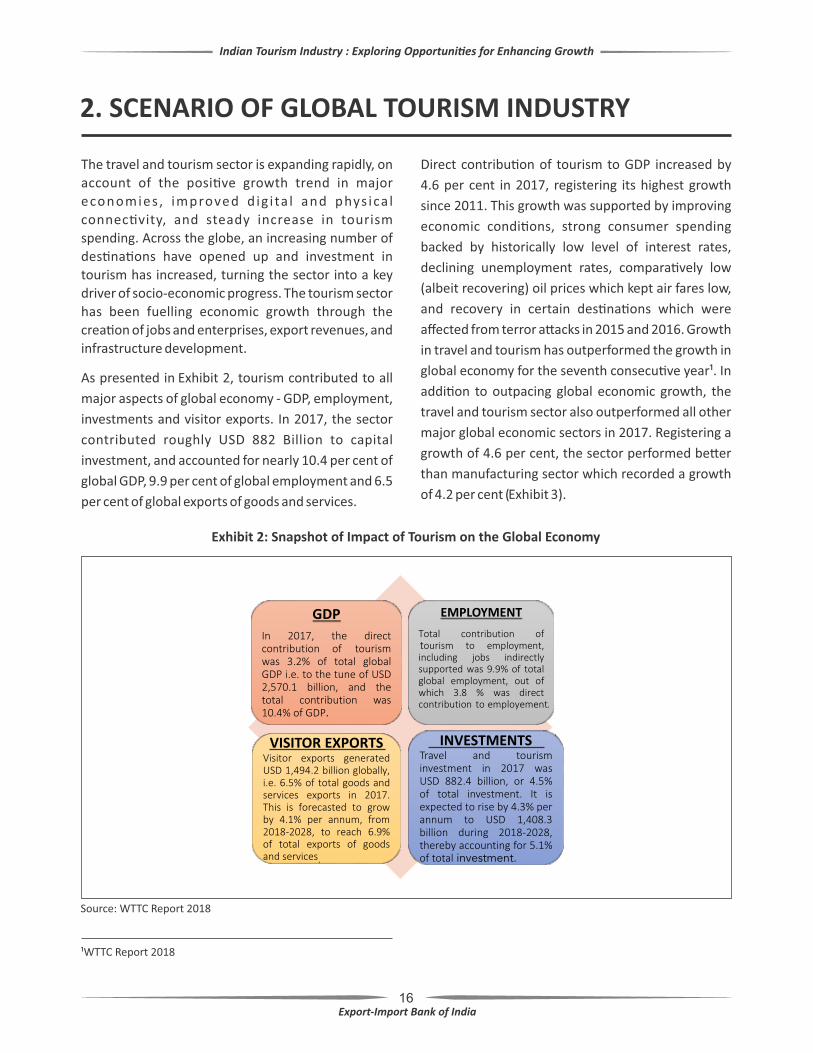
Direct contribu�on of tourism to GDP increased by
4.6 per cent in 2017, registering its highest growth
since 2011. This growth was supported by improving
economic condi�ons, strong consumer spending
backed by historically low level of interest rates,
declining unemployment rates, compara�vely low
(albeit recovering) oil prices which kept air fares low,
and recovery in certain des�na�ons which were
affected from terror a�acks in 2015 and 2016. Growth
in travel and tourism has outperformed the growth in
global economy for the seventh consecu�ve year¹. In
addi�on to outpacing global economic growth, the
travel and tourism sector also outperformed all other
major global economic sectors in 2017. Registering a
growth of 4.6 per cent, the sector performed be�er
than manufacturing sector which recorded a growth
of 4.2 per cent (Exhibit 3).
Indian Tourism Industry : Exploring Opportuni�es for Enhancing Growth
¹WTTC Report 2018
17
Exhibit 3: Sectoral GDP Growth - 2017 (in Per Cent)
Source: WTTC Report 2018
Tourism is also one of the leading job creators in the
world, with more than 118 million people directly
employed in the sector. This represents 3.8 per cent of
all employment. Including indirect and induced
impacts, the sector contributes to one in every 10
jobs worldwide. In fact, the share of world
employment in tourism is greater than that for auto
manufacturing and chemical manufacturing
industries combined, across every region of the
world. In 2017, more than 2 million net addi�onal
jobs were generated directly by the sector, and a total
of around 7 million new jobs were created as a result
of all the direct, indirect and induced ac�vi�es. During
the year, tourism accounted for around 18 per cent of
total net global job crea�on.
Visitor exports, which is the money spent by foreign
visitors to a country, amounted to nearly USD 1,494.2
billion in 2017. The significance of visitor exports can
be gauged from the fact that it accounted for nearly
27.3 per cent of the contribu�on of travel and
tourism to GDP in 2017. In 2018, the world is expected
to witness interna�onal tourist arrivals of nearly
1,395.7 billion, which is further expected to increase
to 2,094.2 billion by 2028 and generate expenditure
of nearly USD 2,311.4 billion.
TOP TOURISM DESTINATIONS AND SPENDERS
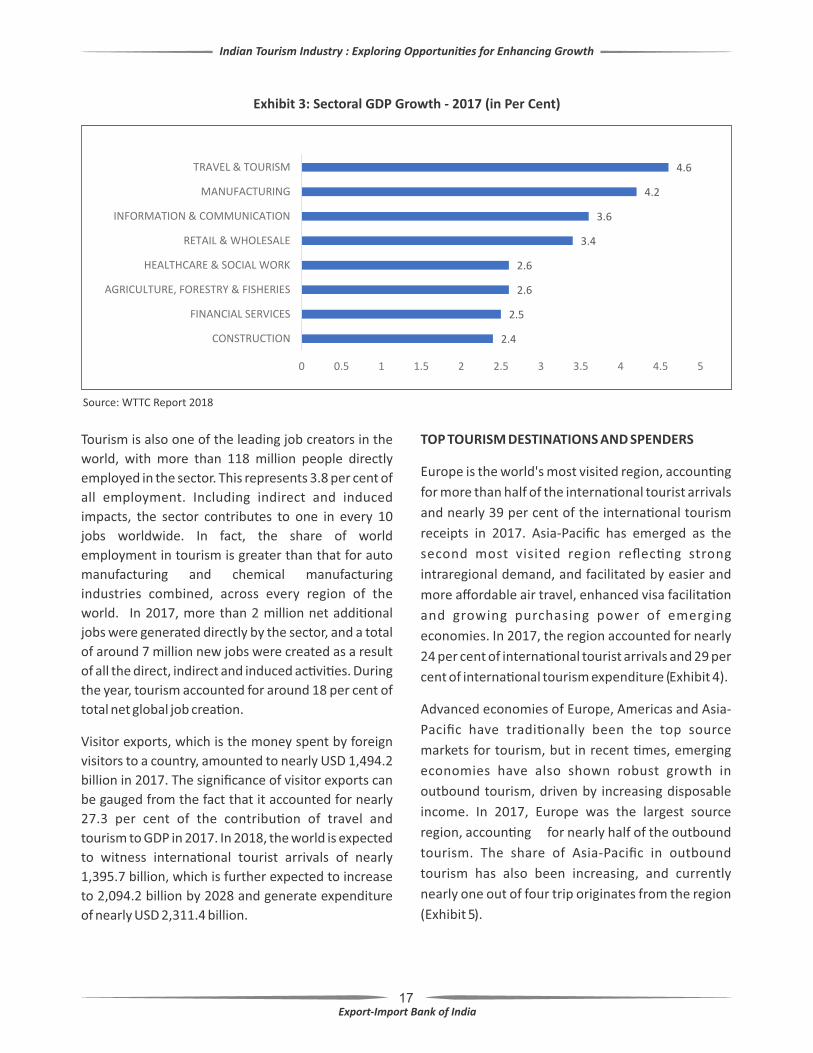
Europe is the world's most visited region, accoun�ng
for more than half of the interna�onal tourist arrivals
and nearly 39 per cent of the interna�onal tourism
receipts in 2017. Asia-Pacific has emerged as the
second most visited region reflec�ng strong
intraregional demand, and facilitated by easier and
more affordable air travel, enhanced visa facilita�on
and growing purchasing power of emerging
economies. In 2017, the region accounted for nearly
24 per cent of interna�onal tourist arrivals and 29 per
cent of interna�onal tourism expenditure (Exhibit 4).
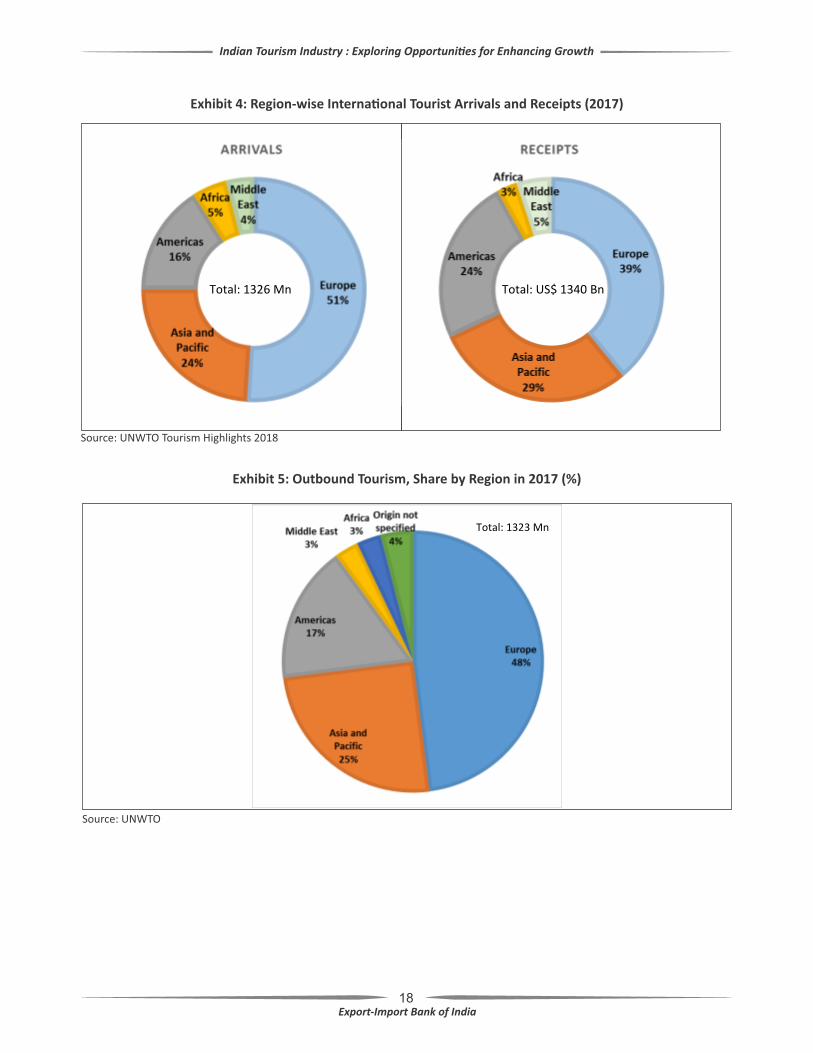
Advanced economies of Europe, Americas and Asia-
Pacific have tradi�onally been the top source
markets for tourism, but in recent �mes, emerging
economies have also shown robust growth in
outbound tourism, driven by increasing disposable
income. In 2017, Europe was the largest source
region, accoun�ng for nearly half of the outbound
tourism. The share of Asia-Pacific in outbound
tourism has also been increasing, and currently
nearly one out of four trip originates from the region
(Exhibit 5).
Indian Tourism Industry : Exploring Opportuni�es for Enhancing Growth
18
Exhibit 5: Outbound Tourism, Share by Region in 2017 (%)
Source: UNWTO
Indian Tourism Industry : Exploring Opportuni�es for Enhancing Growth
Exhibit 4: Region-wise Interna�onal Tourist Arrivals and Receipts (2017)
Source: UNWTO Tourism Highlights 2018
19
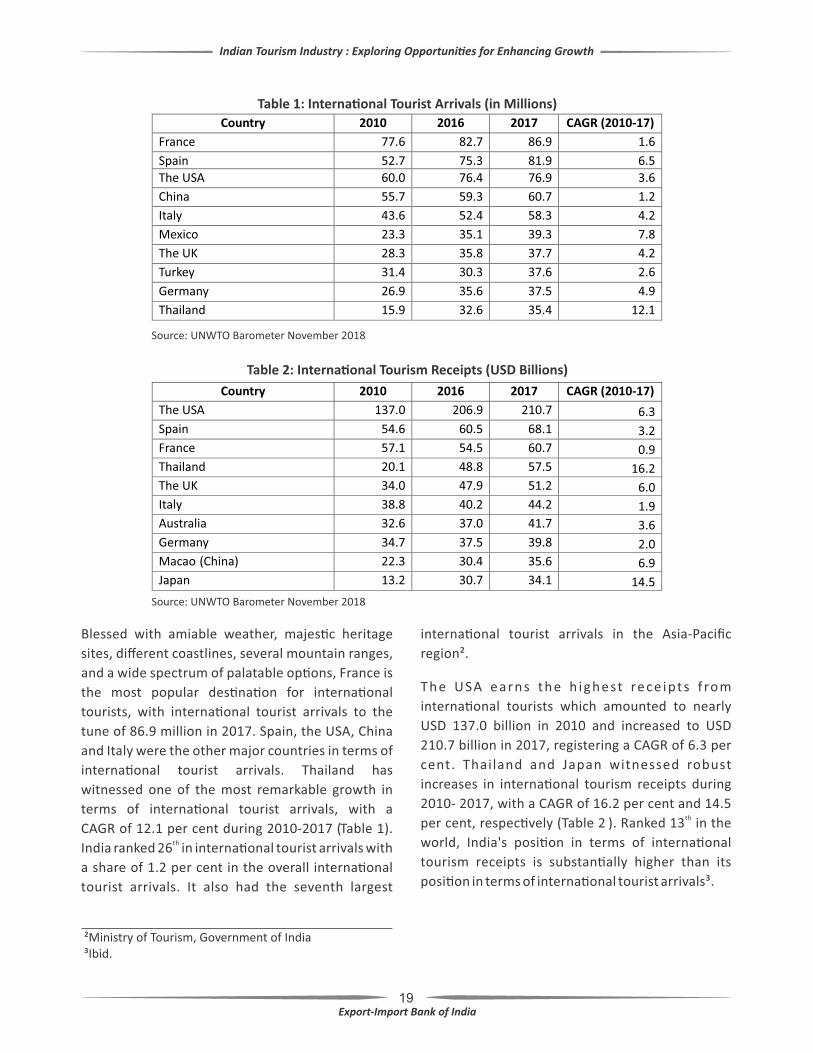
Blessed with amiable weather, majes�c heritage
sites, different coastlines, several mountain ranges,
and a wide spectrum of palatable op�ons, France is
the most popular des�na�on for interna�onal
tourists, with interna�onal tourist arrivals to the
tune of 86.9 million in 2017. Spain, the USA, China
and Italy were the other major countries in terms of
interna�onal tourist arrivals. Thailand has
witnessed one of the most remarkable growth in
terms of interna�onal tourist arrivals, with a
CAGR of 12.1 per cent during 2010-2017 (Table 1). th
India ranked 26 in interna�onal tourist arrivals with
a share of 1.2 per cent in the overall interna�onal
tourist arrivals. It also had the seventh largest
Table 1: Interna�onal Tourist Arrivals (in Millions)
Country 2010 2016 2017 CAGR (2010-17)
France 77.6 82.7 86.9 1.6
Spain 52.7 75.3 81.9 6.5
The USA 60.0 76.4 76.9 3.6
China 55.7 59.3 60.7 1.2
Italy 43.6 52.4 58.3 4.2
Mexico 23.3 35.1 39.3 7.8
The UK 28.3 35.8 37.7 4.2
Turkey 31.4 30.3 37.6 2.6
Germany 26.9 35.6 37.5 4.9
Thailand 15.9 32.6 35.4 12.1
Source: UNWTO Barometer November 2018
Table 2: Interna�onal Tourism Receipts (USD Billions)
Country 2010 2016 2017 CAGR (2010-17)
The USA 137.0 206.9 210.7 6.3
Spain 54.6 60.5 68.1 3.2
France 57.1 54.5 60.7 0.9
Thailand 20.1 48.8 57.5 16.2
The UK 34.0 47.9 51.2 6.0
Italy 38.8 40.2 44.2 1.9
Australia 32.6 37.0 41.7 3.6
Germany 34.7 37.5 39.8 2.0
Macao (China) 22.3 30.4 35.6 6.9
Japan 13.2 30.7 34.1 14.5
Source: UNWTO Barometer November 2018
²Ministry of Tourism, Government of India ³Ibid.
Indian Tourism Industry : Exploring Opportuni�es for Enhancing Growth
interna�onal tourist arrivals in the Asia-Pacific
region².
The USA earns the h ighest rece ipts f rom
interna�onal tourists which amounted to nearly
USD 137.0 billion in 2010 and increased to USD
210.7 billion in 2017, registering a CAGR of 6.3 per
cent. Thailand and Japan witnessed robust
increases in interna�onal tourism receipts during
2010- 2017, with a CAGR of 16.2 per cent and 14.5 thper cent, respec�vely (Table 2 ). Ranked 13 in the
world, India's posi�on in terms of interna�onal
tourism receipts is substan�ally higher than its
posi�on in terms of interna�onal tourist arrivals³.
20
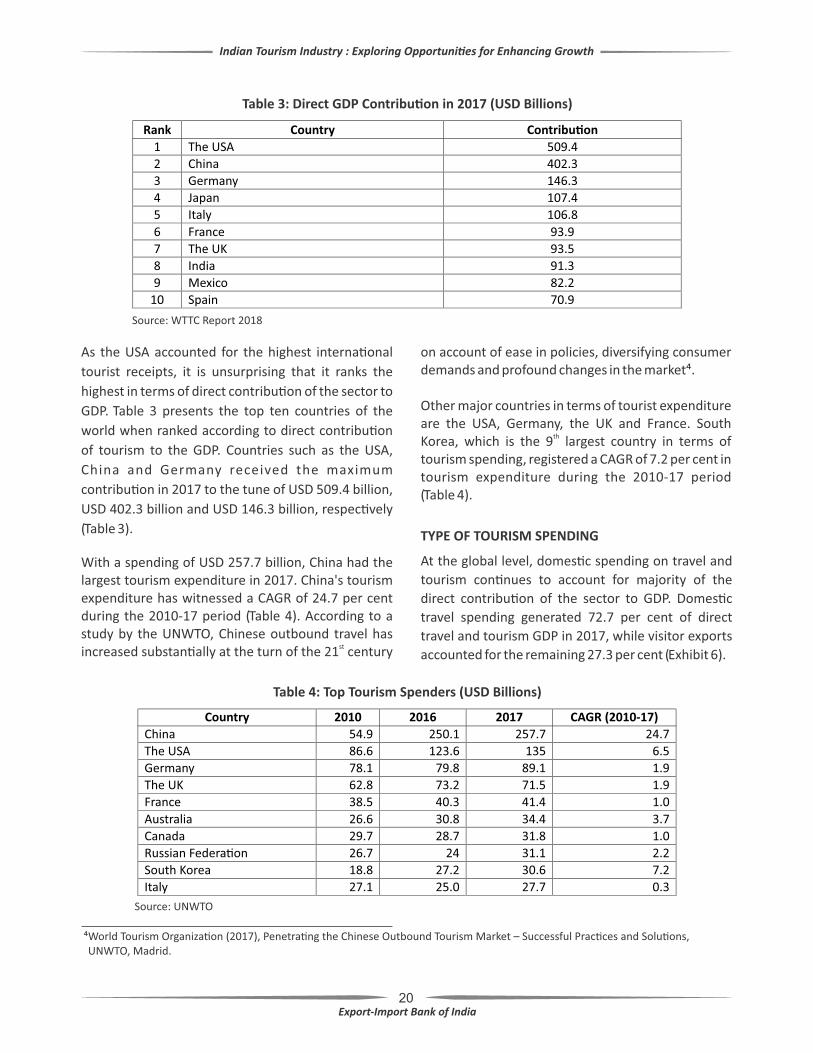
As the USA accounted for the highest interna�onal
tourist receipts, it is unsurprising that it ranks the
highest in terms of direct contribu�on of the sector to
GDP. Table 3 presents the top ten countries of the
world when ranked according to direct contribu�on
of tourism to the GDP. Countries such as the USA,
China and Germany received the maximum
contribu�on in 2017 to the tune of USD 509.4 billion,
USD 402.3 billion and USD 146.3 billion, respec�vely
(Table 3).
Table 3: Direct GDP Contribu�on in 2017 (USD Billions)
Source: WTTC Report 2018
With a spending of USD 257.7 billion, China had the largest tourism expenditure in 2017. China's tourism expenditure has witnessed a CAGR of 24.7 per cent during the 2010-17 period (Table 4). According to a study by the UNWTO, Chinese outbound travel has
stincreased substan�ally at the turn of the 21 century
on account of ease in policies, diversifying consumer demands and profound changes in the market⁴.
Other major countries in terms of tourist expenditure are the USA, Germany, the UK and France. South
thKorea, which is the 9 largest country in terms of tourism spending, registered a CAGR of 7.2 per cent in tourism expenditure during the 2010-17 period (Table 4).
Table 4: Top Tourism Spenders (USD Billions)
TYPE OF TOURISM SPENDING
At the global level, domes�c spending on travel and
tourism con�nues to account for majority of the
direct contribu�on of the sector to GDP. Domes�c
travel spending generated 72.7 per cent of direct
travel and tourism GDP in 2017, while visitor exports
accounted for the remaining 27.3 per cent (Exhibit 6).
⁴World Tourism Organiza�on (2017), Penetra�ng the Chinese Outbound Tourism Market – Successful Prac�ces and Solu�ons, UNWTO, Madrid.
Indian Tourism Industry : Exploring Opportuni�es for Enhancing Growth
Source: UNWTO
Rank Country Contribu�on
1 The USA 509.4
2 China 402.3
3 Germany 146.3
4 Japan 107.4
5 Italy 106.8
6 France 93.9
7 The UK 93.5
8 India 91.3
9 Mexico 82.2
10 Spain 70.9
Country 2010 2016 2017 CAGR (2010-17)
China 54.9 250.1 257.7 24.7
The USA 86.6 123.6 135 6.5
Germany 78.1 79.8 89.1 1.9
The UK 62.8 73.2 71.5 1.9
France 38.5 40.3 41.4 1.0
Australia 26.6 30.8 34.4 3.7
Canada 29.7 28.7 31.8 1.0
Russian Federa�on 26.7 24 31.1 2.2
South Korea 18.8 27.2 30.6 7.2
Italy 27.1 25.0 27.7 0.3
21
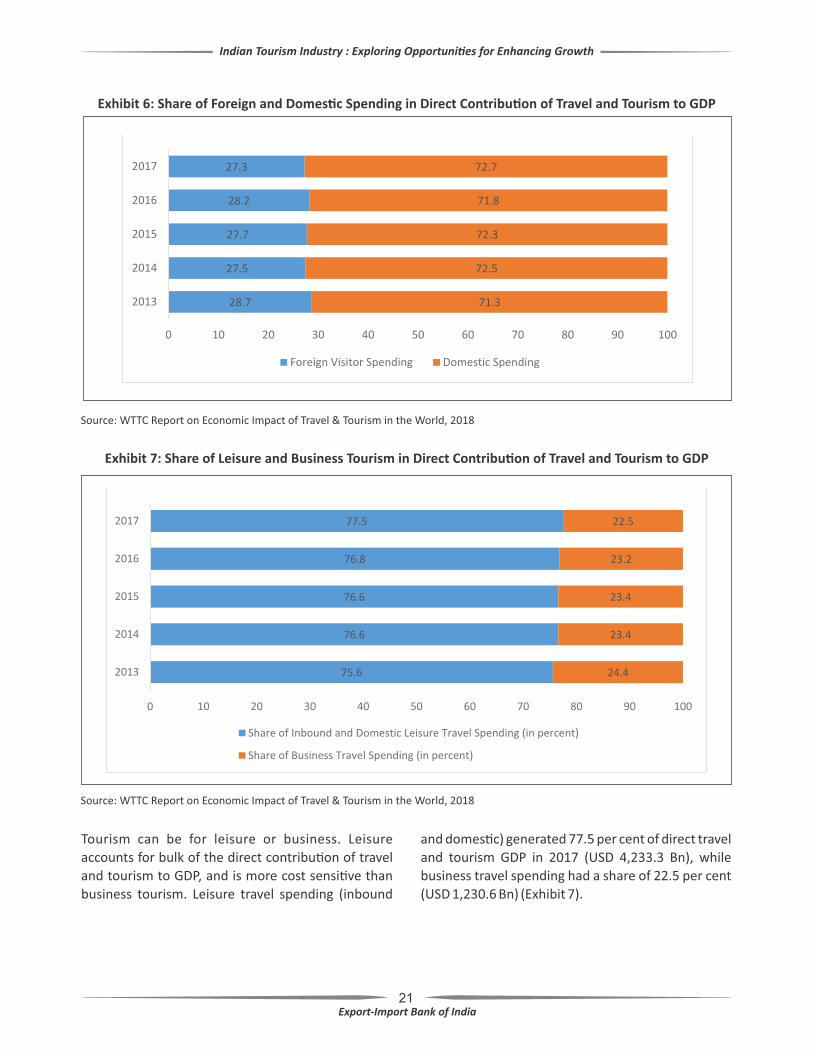
Exhibit 6: Share of Foreign and Domes�c Spending in Direct Contribu�on of Travel and Tourism to GDP
Source: WTTC Report on Economic Impact of Travel & Tourism in the World, 2018
Tourism can be for leisure or business. Leisure
accounts for bulk of the direct contribu�on of travel
and tourism to GDP, and is more cost sensi�ve than
business tourism. Leisure travel spending (inbound
and domes�c) generated 77.5 per cent of direct travel
and tourism GDP in 2017 (USD 4,233.3 Bn), while
business travel spending had a share of 22.5 per cent
(USD 1,230.6 Bn) (Exhibit 7).
Exhibit 7: Share of Leisure and Business Tourism in Direct Contribu�on of Travel and Tourism to GDP
Source: WTTC Report on Economic Impact of Travel & Tourism in the World, 2018
Indian Tourism Industry : Exploring Opportuni�es for Enhancing Growth
22
During 2017, growth in tourism sector was driven by
domes�c leisure which grew by 4.9 per cent, while the
visitor exports increased by 4.3 per cent. Many
countries witnessed a decrease in visitor exports
during the year. Major countries with declines in
visitor exports included Hong Kong, South Korea and
Taiwan, with all three facing declines due to
developments in their main source market – China.
OUTLOOK
In the recent past, tourism has experienced
con�nuous expansion and diversifica�on to become
one of the largest and fastest-growing economic
sectors in the world. Many new des�na�ons have
emerged in addi�on to the tradi�onal favourites of
Europe and North America. Tourism has boasted
virtually uninterrupted growth over �me, despite
occasional shocks, demonstra�ng the sector's
strength and resilience in the face of economic
downturn.
Going forward, business travel spending is expected to grow by 3.8 per cent in 2018 to USD 1,276.8 billion, and further by 3.2 per cent per annum to USD 1,756.1 Bn in 2028. Alongside, leisure travel
spending is expected to grow by 4.1 per cent in 2018 to USD 4,407.2 billion, and rise by 4.1 per cent per annum to reach USD 6,605.3 billion in 2028. Visitor exports at the global level is forecasted to grow by 4.1 per cent per annum, from 2018-2028, to reach 6.9 per cent of total goods and services exports by 2028.
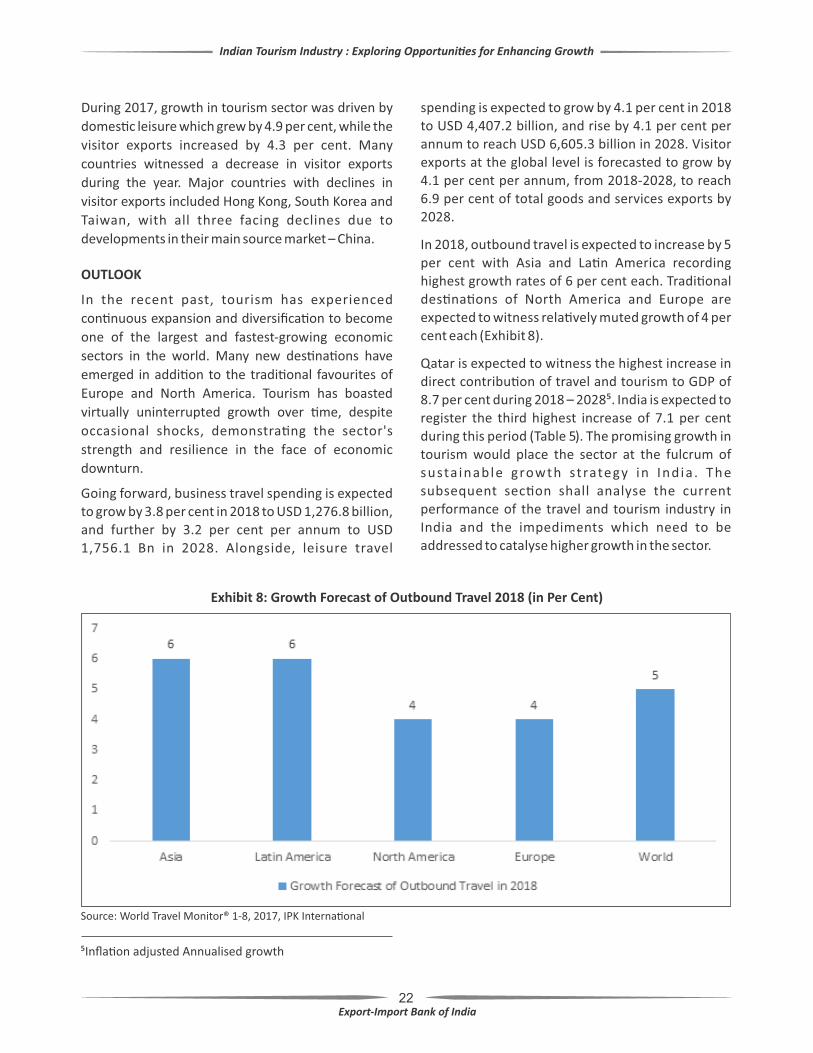
In 2018, outbound travel is expected to increase by 5 per cent with Asia and La�n America recording highest growth rates of 6 per cent each. Tradi�onal des�na�ons of North America and Europe are expected to witness rela�vely muted growth of 4 per cent each (Exhibit 8).
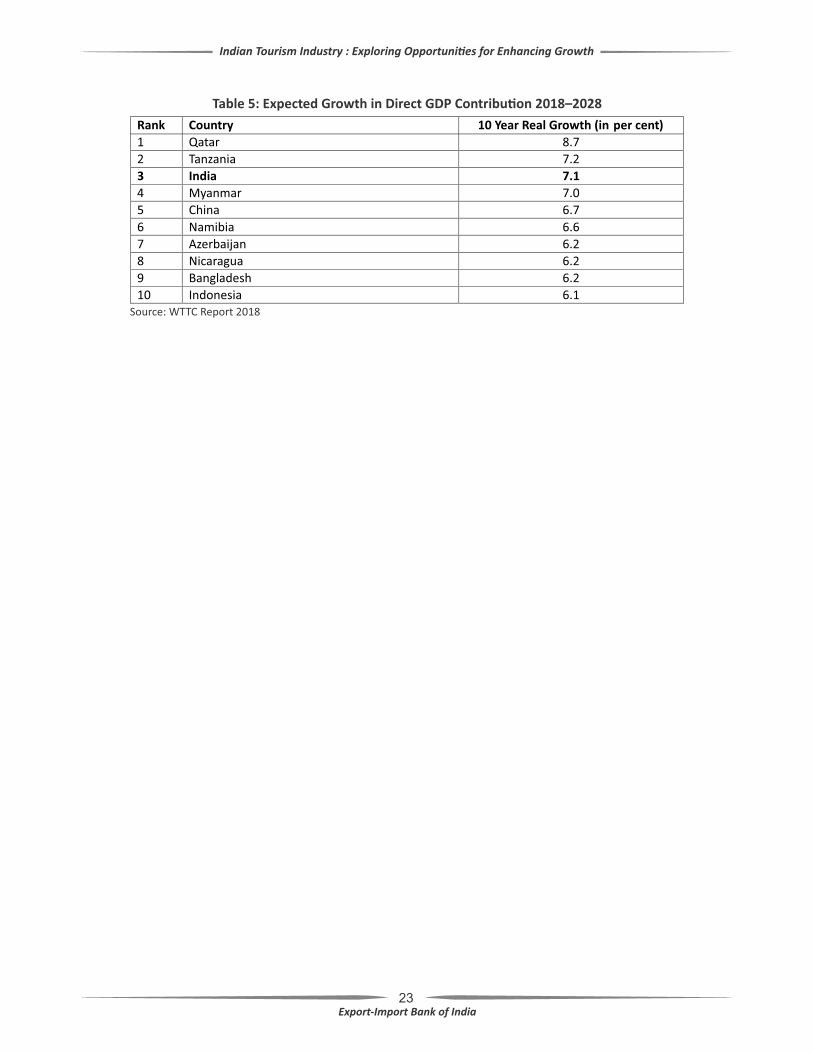
Qatar is expected to witness the highest increase in direct contribu�on of travel and tourism to GDP of 8.7 per cent during 2018 – 2028⁵. India is expected to register the third highest increase of 7.1 per cent during this period (Table 5). The promising growth in tourism would place the sector at the fulcrum of susta inable growth strategy in Ind ia . The subsequent sec�on shall analyse the current performance of the travel and tourism industry in India and the impediments which need to be addressed to catalyse higher growth in the sector.
Exhibit 8: Growth Forecast of Outbound Travel 2018 (in Per Cent)
Source: World Travel Monitor® 1-8, 2017, IPK Interna�onal
⁵Infla�on adjusted Annualised growth
Indian Tourism Industry : Exploring Opportuni�es for Enhancing Growth
23
Table 5: Expected Growth in Direct GDP Contribu�on 2018–2028
Indian Tourism Industry : Exploring Opportuni�es for Enhancing Growth
Rank Country 10 Year Real Growth (in per cent)
1 Qatar 8.7
2 Tanzania 7.2
3 India 7.1
4 Myanmar 7.0
5 China 6.7
6 Namibia 6.6
7 Azerbaijan 6.2
8 Nicaragua 6.2
9 Bangladesh 6.2
10 Indonesia 6.1 Source: WTTC Report 2018
24
3. SCENARIO OF INDIAN TOURISM INDUSTRY
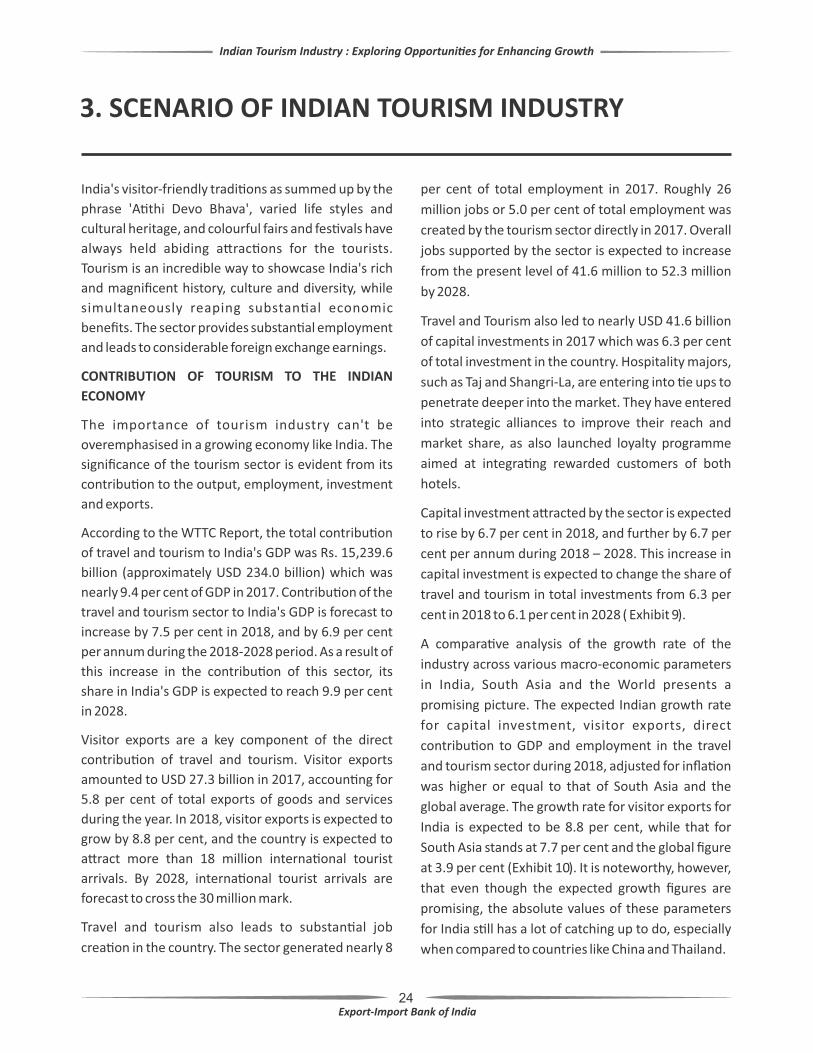
India's visitor-friendly tradi�ons as summed up by the
phrase 'A�thi Devo Bhava', varied life styles and
cultural heritage, and colourful fairs and fes�vals have
always held abiding a�rac�ons for the tourists.
Tourism is an incredible way to showcase India's rich
and magnificent history, culture and diversity, while
simultaneously reaping substan�al economic
benefits. The sector provides substan�al employment
and leads to considerable foreign exchange earnings.
CONTRIBUTION OF TOURISM TO THE INDIAN
ECONOMY
The importance of tourism industry can't be
overemphasised in a growing economy like India. The
significance of the tourism sector is evident from its
contribu�on to the output, employment, investment
and exports.
According to the WTTC Report, the total contribu�on
of travel and tourism to India's GDP was Rs. 15,239.6
billion (approximately USD 234.0 billion) which was
nearly 9.4 per cent of GDP in 2017. Contribu�on of the
travel and tourism sector to India's GDP is forecast to
increase by 7.5 per cent in 2018, and by 6.9 per cent
per annum during the 2018-2028 period. As a result of
this increase in the contribu�on of this sector, its
share in India's GDP is expected to reach 9.9 per cent
in 2028.
Visitor exports are a key component of the direct
contribu�on of travel and tourism. Visitor exports
amounted to USD 27.3 billion in 2017, accoun�ng for
5.8 per cent of total exports of goods and services
during the year. In 2018, visitor exports is expected to
grow by 8.8 per cent, and the country is expected to
a�ract more than 18 million interna�onal tourist
arrivals. By 2028, interna�onal tourist arrivals are
forecast to cross the 30 million mark.
Travel and tourism also leads to substan�al job
crea�on in the country. The sector generated nearly 8
Indian Tourism Industry : Exploring Opportuni�es for Enhancing Growth
per cent of total employment in 2017. Roughly 26
million jobs or 5.0 per cent of total employment was
created by the tourism sector directly in 2017. Overall
jobs supported by the sector is expected to increase
from the present level of 41.6 million to 52.3 million
by 2028.
Travel and Tourism also led to nearly USD 41.6 billion
of capital investments in 2017 which was 6.3 per cent
of total investment in the country. Hospitality majors,
such as Taj and Shangri-La, are entering into �e ups to
penetrate deeper into the market. They have entered
into strategic alliances to improve their reach and
market share, as also launched loyalty programme
aimed at integra�ng rewarded customers of both
hotels.
Capital investment a�racted by the sector is expected
to rise by 6.7 per cent in 2018, and further by 6.7 per
cent per annum during 2018 – 2028. This increase in
capital investment is expected to change the share of
travel and tourism in total investments from 6.3 per
cent in 2018 to 6.1 per cent in 2028 ( Exhibit 9).
A compara�ve analysis of the growth rate of the
industry across various macro-economic parameters
in India, South Asia and the World presents a
promising picture. The expected Indian growth rate
for capital investment, visitor exports, direct
contribu�on to GDP and employment in the travel
and tourism sector during 2018, adjusted for infla�on
was higher or equal to that of South Asia and the
global average. The growth rate for visitor exports for
India is expected to be 8.8 per cent, while that for
South Asia stands at 7.7 per cent and the global figure
at 3.9 per cent (Exhibit 10). It is noteworthy, however,
that even though the expected growth figures are
promising, the absolute values of these parameters
for India s�ll has a lot of catching up to do, especially
when compared to countries like China and Thailand.

25
Exhibit 10: Compara�ve Real Growth Rates Adjusted for Infla�on in Travel and Tourism (in Per Cent; 2018)
Source: WTTC Report 2018, Exim Bank Research
Indian Tourism Industry : Exploring Opportuni�es for Enhancing Growth
Exhibit 9: Snapshot of Contribu�on of Tourism to Indian Economy
Source: World Travel and Tourism Council Report, March 2018
per cent
26
DOMESTIC TOURISM INDUSTRY
Indian domes�c tourism sector has been steadily
growing. Domes�c tourist traffic is in fact one of the
main drivers of growth in Indian tourism. Inbound
tourism is being fostered by several factors such as
rapidly increasing purchasing power of the middle-
class, availability of economic package offers, be�er
road and rail connec�vity, be�er accommoda�on
op�ons, and evolving lifestyles. The growing domes�c
tourism has also led to diversifica�on of tourism
op�ons in the country. While popular des�na�ons
such as Agra, Delhi, Jaipur, Kerala, Goa and temples
of Tamil Nadu, are always sought a�er, the young
Indians are also exploring other op�ons like luxury
train journeys, Buddhist circuit, and wildlife circuit,
among others.
Trends in Domes�c Tourist Arrivals to India
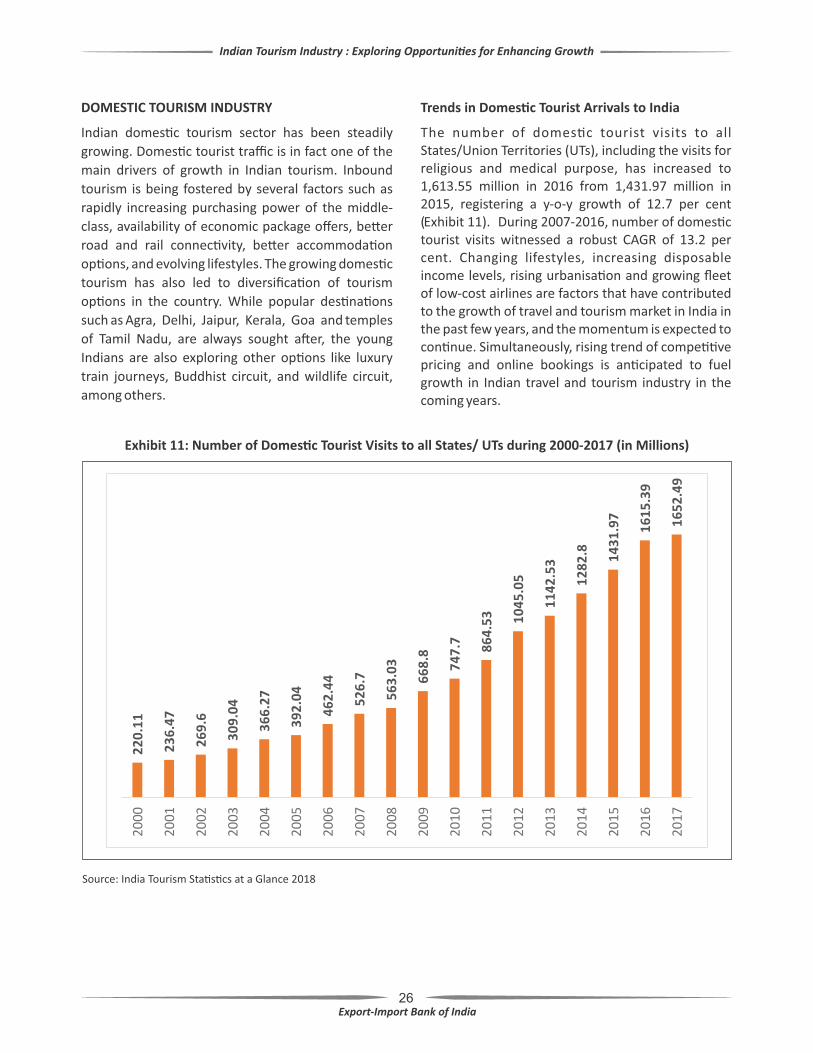
The number of domes�c tourist visits to all States/Union Territories (UTs), including the visits for religious and medical purpose, has increased to 1,613.55 million in 2016 from 1,431.97 million in 2015, registering a y-o-y growth of 12.7 per cent (Exhibit 11). During 2007-2016, number of domes�c tourist visits witnessed a robust CAGR of 13.2 per cent. Changing lifestyles, increasing disposable income levels, rising urbanisa�on and growing fleet of low-cost airlines are factors that have contributed to the growth of travel and tourism market in India in the past few years, and the momentum is expected to con�nue. Simultaneously, rising trend of compe��ve pricing and online bookings is an�cipated to fuel growth in Indian travel and tourism industry in the coming years.
Exhibit 11: Number of Domes�c Tourist Visits to all States/ UTs during 2000-2017 (in Millions)
Source: India Tourism Sta�s�cs at a Glance 2018
Indian Tourism Industry : Exploring Opportuni�es for Enhancing Growth
27
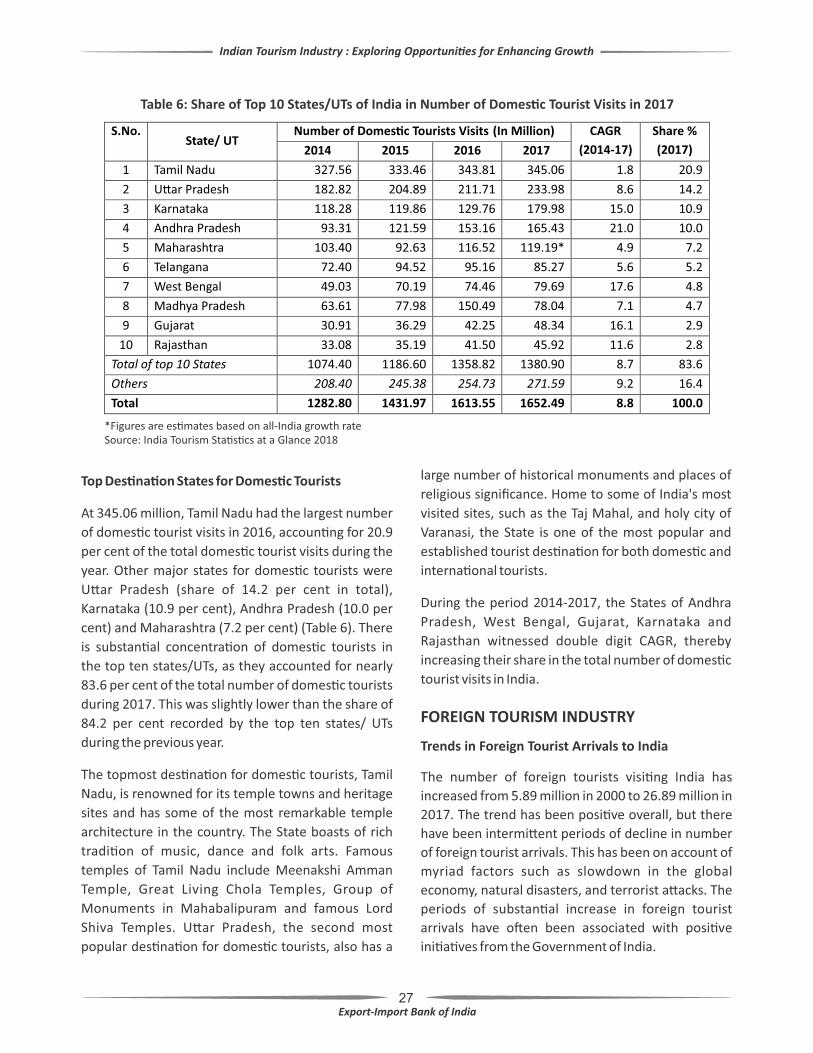
Top Des�na�on States for Domes�c Tourists
At 345.06 million, Tamil Nadu had the largest number
of domes�c tourist visits in 2016, accoun�ng for 20.9
per cent of the total domes�c tourist visits during the
year. Other major states for domes�c tourists were
U�ar Pradesh (share of 14.2 per cent in total),
Karnataka (10.9 per cent), Andhra Pradesh (10.0 per
cent) and Maharashtra (7.2 per cent) (Table 6). There
is substan�al concentra�on of domes�c tourists in
the top ten states/UTs, as they accounted for nearly
83.6 per cent of the total number of domes�c tourists
during 2017. This was slightly lower than the share of
84.2 per cent recorded by the top ten states/ UTs
during the previous year.
The topmost des�na�on for domes�c tourists, Tamil
Nadu, is renowned for its temple towns and heritage
sites and has some of the most remarkable temple
architecture in the country. The State boasts of rich
tradi�on of music, dance and folk arts. Famous
temples of Tamil Nadu include Meenakshi Amman
Temple, Great Living Chola Temples, Group of
Monuments in Mahabalipuram and famous Lord
Shiva Temples. U�ar Pradesh, the second most
popular des�na�on for domes�c tourists, also has a
large number of historical monuments and places of
religious significance. Home to some of India's most
visited sites, such as the Taj Mahal, and holy city of
Varanasi, the State is one of the most popular and
established tourist des�na�on for both domes�c and
interna�onal tourists.
During the period 2014-2017, the States of Andhra
Pradesh, West Bengal, Gujarat, Karnataka and
Rajasthan witnessed double digit CAGR, thereby
increasing their share in the total number of domes�c
tourist visits in India.
Table 6: Share of Top 10 States/UTs of India in Number of Domes�c Tourist Visits in 2017
S.No. State/ UT
Number of Domes�c Tourists Visits (In Million) CAGR
(2014-17)
Share %
(2017) 2014 2015 2016 2017
1 Tamil Nadu 327.56 333.46 343.81 345.06 1.8 20.9
2 U�ar Pradesh 182.82 204.89 211.71 233.98 8.6 14.2
3 Karnataka 118.28 119.86 129.76 179.98 15.0 10.9
4 Andhra Pradesh 93.31 121.59 153.16 165.43 21.0 10.0
5 Maharashtra 103.40 92.63 116.52 119.19* 4.9 7.2
6 Telangana 72.40 94.52 95.16 85.27 5.6 5.2
7 West Bengal 49.03 70.19 74.46 79.69 17.6 4.8
8 Madhya Pradesh 63.61 77.98 150.49 78.04 7.1 4.7
9 Gujarat 30.91 36.29 42.25 48.34 16.1 2.9
10 Rajasthan 33.08 35.19 41.50 45.92 11.6 2.8
Total of top 10 States 1074.40 1186.60 1358.82 1380.90 8.7 83.6
Others 208.40 245.38 254.73 271.59 9.2 16.4
Total 1282.80 1431.97 1613.55 1652.49 8.8 100.0
*Figures are es�mates based on all-India growth rateSource: India Tourism Sta�s�cs at a Glance 2018
FOREIGN TOURISM INDUSTRY
Trends in Foreign Tourist Arrivals to India
The number of foreign tourists visi�ng India has
increased from 5.89 million in 2000 to 26.89 million in
2017. The trend has been posi�ve overall, but there
have been intermi�ent periods of decline in number
of foreign tourist arrivals. This has been on account of
myriad factors such as slowdown in the global
economy, natural disasters, and terrorist a�acks. The
periods of substan�al increase in foreign tourist
arrivals have o�en been associated with posi�ve
ini�a�ves from the Government of India.
Indian Tourism Industry : Exploring Opportuni�es for Enhancing Growth

28
tourism sector's steady performance. In 2009, there
was a slight fall in foreign tourist arrivals, but since
then tourist inflow has grown in all years except 2012
(Exhibit 12). In recent �mes, the government has
eased visa norms and extended e-visa services which
has resulted in a substan�al increase in tourist
arrivals, with the foreign tourist visits to India
registering a CAGR of 7.7 per cent during the period
2013-2017.
Exhibit 12: Number of Foreign Tourist Visits to all States/UTs (in Millions)
Source: India Tourism Sta�s�cs at a Glance 2018
Tourism is an important source of foreign exchange in
India, similar to many other countries. Rising foreign
tourist arrival in the country has helped boost the
foreign exchange earnings from the sector. During
2017, India earned foreign exchange of USD 27.31
billion from tourism, registering a y-o-y growth of 19.1
per cent and a CAGR of 10.4 per cent during 2013-17.
Foreign Exchange Earnings registered further growth
of 12.9 per cent during January-June 2018 (Exhibit 13).
Indian Tourism Industry : Exploring Opportuni�es for Enhancing Growth
In 2002, the Ministry of Tourism launched an
interna�onal campaign — Incredible India, to
promote India as a popular tourist des�na�on. The
Ministry formulated an integrated communica�on
strategy with the aim of promo�ng India as a
des�na�on of choice for the travellers. A well-
publicised promo�onal campaign was launched that
projected India as an a�rac�ve tourist des�na�on by
showcasing different aspects of Indian culture and
history like yoga, spirituality, etc. The campaign was
conducted globally and received apprecia�on from
tourism industry, observers and travellers alike. The
success of this campaign can be gauged from the
major increase in annual growth rate of foreign
tourist visits during 2003. Since then, growth in
foreign tourist visits moderated each year and even
turned nega�ve in 2009. The onset of the financial
crisis in 2008 brought a major disrup�on in the Indian

29
Exhibit 13: Foreign Exchange Earnings from Tourism in India
Source: India Tourism Sta�s�cs at a Glance 2018
Source Countries for Foreign Tourist Arrivals
Bangladesh is the largest source for foreign tourist
arrivals in India, accoun�ng for 21.49 per cent of
foreign tourist arrivals in 2017. Other major source
countries are the USA (share of 13.72 per cent), the
UK (9.83 per cent), Canada (3.34 per cent) and
Australia (3.23 per cent) (Table 7).
Table 7: Country-wise Foreign Tourist Arrivals in India (2017)
Country Number of Tourist Arrivals Share % Y-o-Y Growth
Bangladesh 2156557 21.49 56.2
The USA
1376919
13.72
6.2
The UK
986296
9.83
4.7
Canada
335439
3.34
5.7
Australia
324243
3.23
10.4
Malaysia
322126
3.21
6.7
Sri Lanka
303590
3.03
2.1
Russia
278904
2.78
22.5
Germany
269380
2.68
1.3
France
249620
2.49
4.6
Source: Bureau of Immigra�on, Government of India
Indian Tourism Industry : Exploring Opportuni�es for Enhancing Growth
30
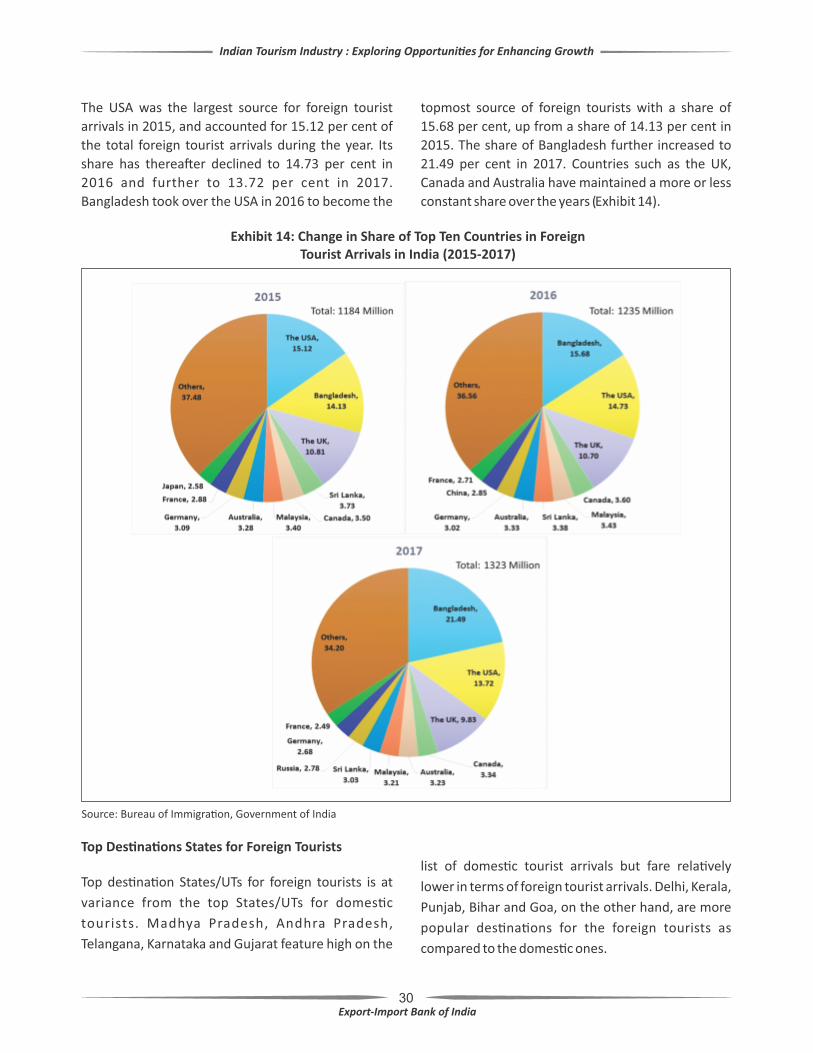
The USA was the largest source for foreign tourist
arrivals in 2015, and accounted for 15.12 per cent of
the total foreign tourist arrivals during the year. Its
share has therea�er declined to 14.73 per cent in
2016 and further to 13.72 per cent in 2017.
Bangladesh took over the USA in 2016 to become the
topmost source of foreign tourists with a share of
15.68 per cent, up from a share of 14.13 per cent in
2015. The share of Bangladesh further increased to
21.49 per cent in 2017. Countries such as the UK,
Canada and Australia have maintained a more or less
constant share over the years (Exhibit 14).
Exhibit 14: Change in Share of Top Ten Countries in Foreign Tourist Arrivals in India (2015-2017)
Source: Bureau of Immigra�on, Government of India
Top Des�na�ons States for Foreign Tourists
Top des�na�on States/UTs for foreign tourists is at
variance from the top States/UTs for domes�c
tourists. Madhya Pradesh, Andhra Pradesh,
Telangana, Karnataka and Gujarat feature high on the
list of domes�c tourist arrivals but fare rela�vely
lower in terms of foreign tourist arrivals. Delhi, Kerala,
Punjab, Bihar and Goa, on the other hand, are more
popular des�na�ons for the foreign tourists as
compared to the domes�c ones.
Indian Tourism Industry : Exploring Opportuni�es for Enhancing Growth
31
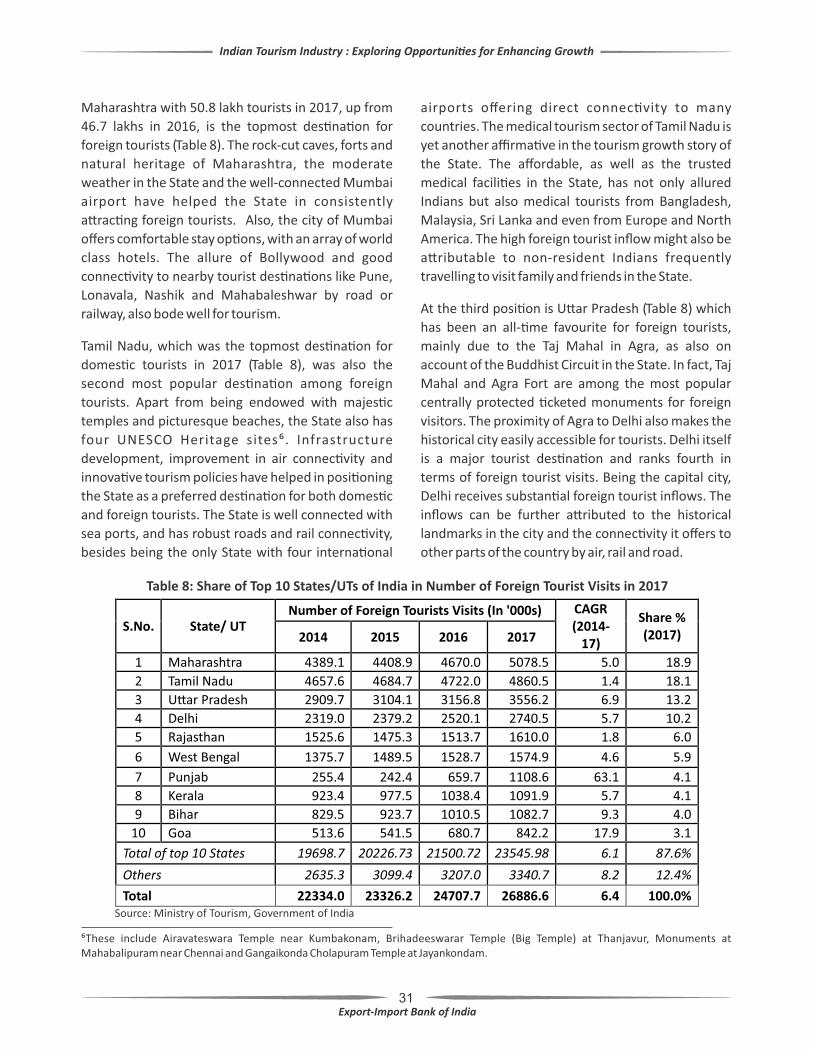
Maharashtra with 50.8 lakh tourists in 2017, up from
46.7 lakhs in 2016, is the topmost des�na�on for
foreign tourists (Table 8). The rock-cut caves, forts and
natural heritage of Maharashtra, the moderate
weather in the State and the well-connected Mumbai
airport have helped the State in consistently
a�rac�ng foreign tourists. Also, the city of Mumbai
offers comfortable stay op�ons, with an array of world
class hotels. The allure of Bollywood and good
connec�vity to nearby tourist des�na�ons like Pune,
Lonavala, Nashik and Mahabaleshwar by road or
railway, also bode well for tourism.
Tamil Nadu, which was the topmost des�na�on for
domes�c tourists in 2017 (Table 8), was also the
second most popular des�na�on among foreign
tourists. Apart from being endowed with majes�c
temples and picturesque beaches, the State also has
four UNESCO Heritage sites⁶. Infrastructure
development, improvement in air connec�vity and
innova�ve tourism policies have helped in posi�oning
the State as a preferred des�na�on for both domes�c
and foreign tourists. The State is well connected with
sea ports, and has robust roads and rail connec�vity,
besides being the only State with four interna�onal
airports offering direct connec�vity to many
countries. The medical tourism sector of Tamil Nadu is
yet another affirma�ve in the tourism growth story of
the State. The affordable, as well as the trusted
medical facili�es in the State, has not only allured
Indians but also medical tourists from Bangladesh,
Malaysia, Sri Lanka and even from Europe and North
America. The high foreign tourist inflow might also be
a�ributable to non-resident Indians frequently
travelling to visit family and friends in the State.
At the third posi�on is U�ar Pradesh (Table 8) which
has been an all-�me favourite for foreign tourists,
mainly due to the Taj Mahal in Agra, as also on
account of the Buddhist Circuit in the State. In fact, Taj
Mahal and Agra Fort are among the most popular
centrally protected �cketed monuments for foreign
visitors. The proximity of Agra to Delhi also makes the
historical city easily accessible for tourists. Delhi itself
is a major tourist des�na�on and ranks fourth in
terms of foreign tourist visits. Being the capital city,
Delhi receives substan�al foreign tourist inflows. The
inflows can be further a�ributed to the historical
landmarks in the city and the connec�vity it offers to
other parts of the country by air, rail and road.
Table 8: Share of Top 10 States/UTs of India in Number of Foreign Tourist Visits in 2017
S.No.
State/ UT
Number of Foreign Tourists Visits (In '000s)
CAGR (2014-
17)
Share % (2017) 2014 2015 2016 2017
1 Maharashtra 4389.1 4408.9 4670.0 5078.5 5.0 18.9 2 Tamil Nadu 4657.6 4684.7 4722.0 4860.5 1.4 18.1 3 U�ar Pradesh 2909.7 3104.1 3156.8 3556.2 6.9 13.2 4 Delhi 2319.0 2379.2 2520.1 2740.5 5.7 10.2
5 Rajasthan 1525.6 1475.3 1513.7 1610.0 1.8 6.0
6 West Bengal 1375.7 1489.5 1528.7 1574.9 4.6 5.9
7 Punjab 255.4 242.4 659.7 1108.6 63.1 4.1
8 Kerala 923.4 977.5 1038.4 1091.9 5.7 4.1
9 Bihar 829.5 923.7 1010.5 1082.7 9.3 4.0
10 Goa 513.6 541.5 680.7 842.2 17.9 3.1
Total of top 10 States 19698.7 20226.73 21500.72 23545.98 6.1 87.6%
Others
2635.3
3099.4
3207.0
3340.7
8.2
12.4%
Total
22334.0
23326.2
24707.7
26886.6
6.4
100.0%
Source: Ministry of Tourism, Government of India
Indian Tourism Industry : Exploring Opportuni�es for Enhancing Growth
⁶These include Airavateswara Temple near Kumbakonam, Brihadeeswarar Temple (Big Temple) at Thanjavur, Monuments at Mahabalipuram near Chennai and Gangaikonda Cholapuram Temple at Jayankondam.
32
In line with increasing number of foreign tourists
visi�ng India, the absolute number of foreign tourists
visi�ng the top ten des�na�on States has been
steadily rising from 19.70 million in 2014 to 23.55
million in 2017 (Table 8). Share of top ten States in
terms of foreign tourist arrivals reduced from 88.2 per
cent to 86.7 per cent in 2015, before increasing again
in the following two years. This indicates that the
growth in tourism sector is s�ll driven by the major
tourist states.
TYPE OF TOURISM
Tourism can be for the purpose of business and
leisure. As noted in Chapter 2 of the Study, nearly 22.5
per cent of the global spending on tourism is on
account of business travel. In case of India, the share
of expenditure incurred during business and
professional trip is much lower at 11.8 per cent.
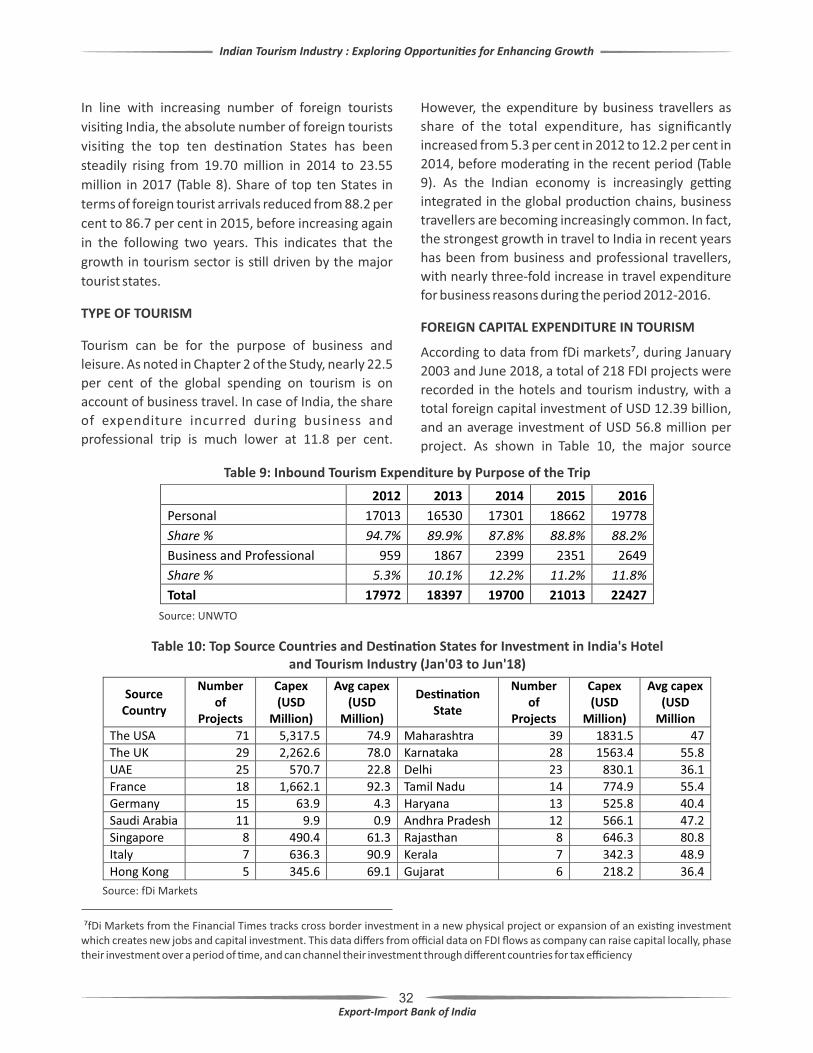
However, the expenditure by business travellers as
share of the total expenditure, has significantly
increased from 5.3 per cent in 2012 to 12.2 per cent in
2014, before modera�ng in the recent period (Table
9). As the Indian economy is increasingly ge�ng
integrated in the global produc�on chains, business
travellers are becoming increasingly common. In fact,
the strongest growth in travel to India in recent years
has been from business and professional travellers,
with nearly three-fold increase in travel expenditure
for business reasons during the period 2012-2016.
FOREIGN CAPITAL EXPENDITURE IN TOURISM
According to data from fDi markets⁷, during January
2003 and June 2018, a total of 218 FDI projects were
recorded in the hotels and tourism industry, with a
total foreign capital investment of USD 12.39 billion,
and an average investment of USD 56.8 million per
project. As shown in Table 10, the major source
Table 9: Inbound Tourism Expenditure by Purpose of the Trip
2012 2013 2014 2015 2016
Personal 17013 16530 17301 18662 19778
Share % 94.7% 89.9% 87.8% 88.8% 88.2%
Business and Professional 959 1867 2399 2351 2649
Share % 5.3% 10.1% 12.2% 11.2% 11.8%
Total 17972 18397 19700 21013 22427
Source: UNWTO
⁷fDi Markets from the Financial Times tracks cross border investment in a new physical project or expansion of an exis�ng investment which creates new jobs and capital investment. This data differs from official data on FDI flows as company can raise capital locally, phase their investment over a period of �me, and can channel their investment through different countries for tax efficiency
Indian Tourism Industry : Exploring Opportuni�es for Enhancing Growth
Table 10: Top Source Countries and Des�na�on States for Investment in India's Hoteland Tourism Industry (Jan'03 to Jun'18)
Source Country
Number of
Projects
Capex (USD
Million)
Avg capex (USD
Million)
Des�na�on State
Number of
Projects
Capex (USD
Million)
Avg capex (USD
Million
The USA 71 5,317.5 74.9 Maharashtra 39 1831.5 47
The UK 29 2,262.6 78.0 Karnataka 28 1563.4 55.8
UAE 25 570.7 22.8 Delhi 23 830.1 36.1
France 18 1,662.1 92.3 Tamil Nadu 14 774.9 55.4
Germany 15 63.9 4.3 Haryana 13 525.8 40.4
Saudi Arabia 11 9.9 0.9 Andhra Pradesh 12 566.1 47.2
Singapore 8 490.4 61.3 Rajasthan 8 646.3 80.8
Italy 7 636.3 90.9 Kerala 7 342.3 48.9
Hong Kong 5 345.6 69.1 Gujarat 6 218.2 36.4
Source: fDi Markets
33
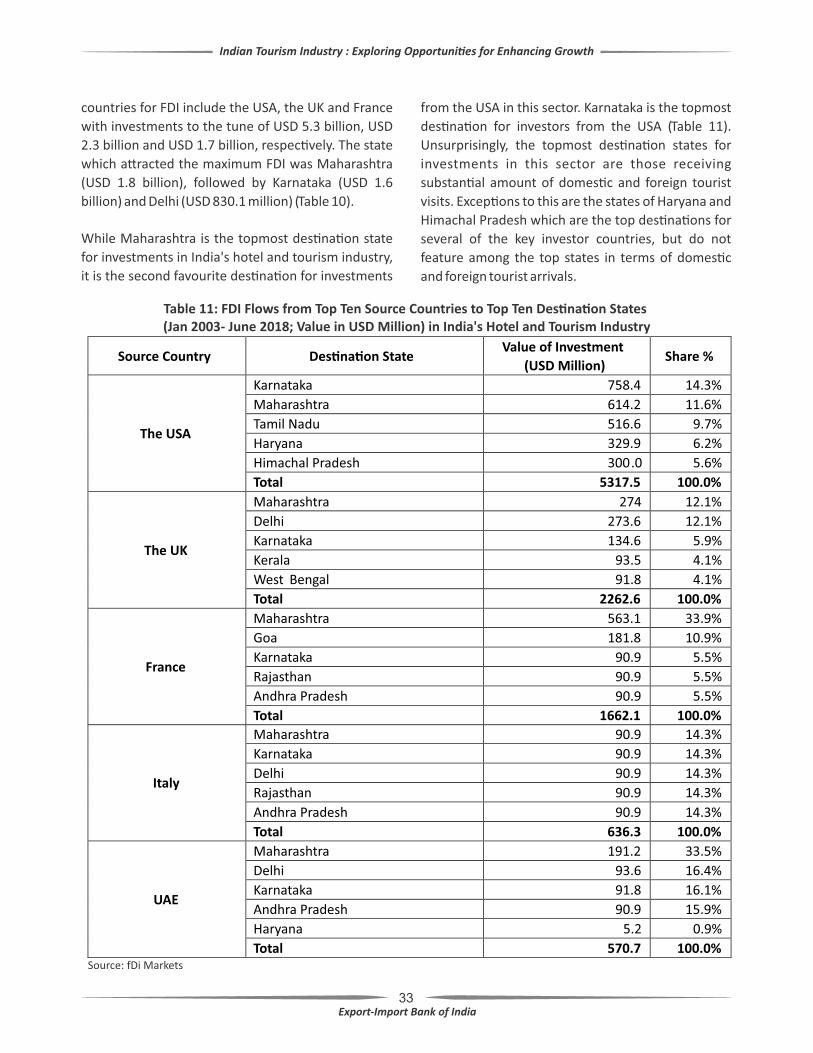
While Maharashtra is the topmost des�na�on state
for investments in India's hotel and tourism industry,
it is the second favourite des�na�on for investments
from the USA in this sector. Karnataka is the topmost
des�na�on for investors from the USA (Table 11).
Unsurprisingly, the topmost des�na�on states for
investments in this sector are those receiving
substan�al amount of domes�c and foreign tourist
visits. Excep�ons to this are the states of Haryana and
Himachal Pradesh which are the top des�na�ons for
several of the key investor countries, but do not
feature among the top states in terms of domes�c
and foreign tourist arrivals.
Table 11: FDI Flows from Top Ten Source Countries to Top Ten Des�na�on States (Jan 2003- June 2018; Value in USD Million) in India's Hotel and Tourism Industry
Indian Tourism Industry : Exploring Opportuni�es for Enhancing Growth
countries for FDI include the USA, the UK and France
with investments to the tune of USD 5.3 billion, USD
2.3 billion and USD 1.7 billion, respec�vely. The state
which a�racted the maximum FDI was Maharashtra
(USD 1.8 billion), followed by Karnataka (USD 1.6
billion) and Delhi (USD 830.1 million) (Table 10).
Italy
Maharashtra 90.9 14.3%
Karnataka
90.9
14.3%
Delhi
90.9
14.3%
Rajasthan
90.9
14.3%
Andhra Pradesh
90.9
14.3%
Source Country
Des�na�on State
Value of Investment
(USD Million)
Share %
The USA
Karnataka
758.4
14.3%
Maharashtra
614.2
11.6%
Tamil Nadu
516.6
9.7%
Haryana
329.9
6.2%
Himachal Pradesh
300.0
5.6%
Total
5317.5
100.0%
The UK
Maharashtra
274
12.1% Delhi
273.6
12.1% Karnataka
134.6
5.9% Kerala
93.5
4.1%
West Bengal
91.8
4.1%
Total 2262.6 100.0%
France
Maharashtra 563.1 33.9% Goa 181.8 10.9%
Karnataka 90.9 5.5%
Rajasthan 90.9 5.5%
Andhra Pradesh 90.9 5.5%
Total
1662.1
100.0%
Total 636.3 100.0%
UAE
Maharashtra
191.2
33.5%
Delhi
93.6
16.4%
Karnataka
91.8
16.1%
Andhra Pradesh
90.9
15.9%
Haryana
5.2
0.9%
Total
570.7
100.0%
Source: fDi Markets
34
OUTLOOK
The travel and tourism industry has witnessed
substan�al growth in the recent period. However,
there remains immense poten�al for further
expansion in the tourism sector on account of the vast
pale�e of natural and cultural heritage in the country.
According to WTTC research, India will be among the
ten fastest growing des�na�ons for leisure-travel
spending during 2016 to 2026. It will therefore be
necessary to create adequate capacity for leveraging
the growing interest of leisure-travellers. Alongside, it
will also be necessary to iden�fy new markets for
a�rac�ng visitor exports.
The la�er sec�ons analyze the key markets which can
be targeted for a�rac�ng foreign tourists and
genera�ng visitor exports, as also the strategies
which can be undertaken for allevia�ng some of the
core challenges in the sector.
Indian Tourism Industry : Exploring Opportuni�es for Enhancing Growth
35
Indian Tourism Industry : Exploring Opportuni�es for Enhancing Growth
4. TRADE IN TRAVEL SERVICES
Travel refers to the ac�vity of traveller, while tourism
refers to the ac�vity of visitors. The UNWTO defines a
traveller as someone who moves between different
geographic loca�ons for any purpose and any
dura�on, while a visitor is a traveller taking a trip to a
main des�na�on outside his/her usual environment,
for less than a year, for any main purpose (business,
leisure or other personal purpose) other than to be
employed by a resident en�ty in the country or place
visited. Data on travel services, as available in the
Balance of Payment sta�s�cs of countries, covers
expenditure by residents of one economy that are
traveling in another, and can be used for analysing the
expenditure pa�ern of interna�onal travellers.
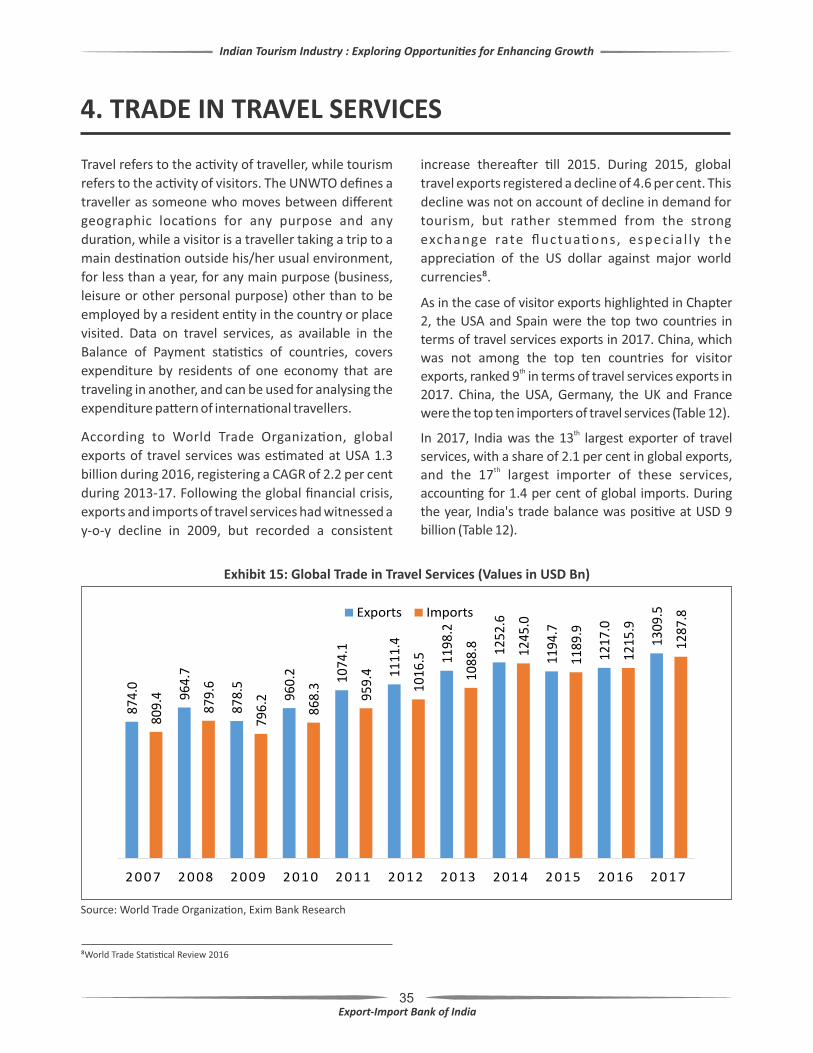
According to World Trade Organiza�on, global
exports of travel services was es�mated at USA 1.3
billion during 2016, registering a CAGR of 2.2 per cent
during 2013-17. Following the global financial crisis,
exports and imports of travel services had witnessed a
y-o-y decline in 2009, but recorded a consistent
increase therea�er �ll 2015. During 2015, global
travel exports registered a decline of 4.6 per cent. This
decline was not on account of decline in demand for
tourism, but rather stemmed from the strong
exchange rate fluctua�ons, especia l ly the
apprecia�on of the US dollar against major world
currencies⁸.
Exhibit 15: Global Trade in Travel Services (Values in USD Bn)
Source: World Trade Organiza�on, Exim Bank Research
⁸World Trade Sta�s�cal Review 2016
As in the case of visitor exports highlighted in Chapter
2, the USA and Spain were the top two countries in
terms of travel services exports in 2017. China, which
was not among the top ten countries for visitor th
exports, ranked 9 in terms of travel services exports in
2017. China, the USA, Germany, the UK and France
were the top ten importers of travel services (Table 12).thIn 2017, India was the 13 largest exporter of travel
services, with a share of 2.1 per cent in global exports, thand the 17 largest importer of these services,
accoun�ng for 1.4 per cent of global imports. During
the year, India's trade balance was posi�ve at USD 9
billion (Table 12).
36
Indian Tourism Industry : Exploring Opportuni�es for Enhancing Growth
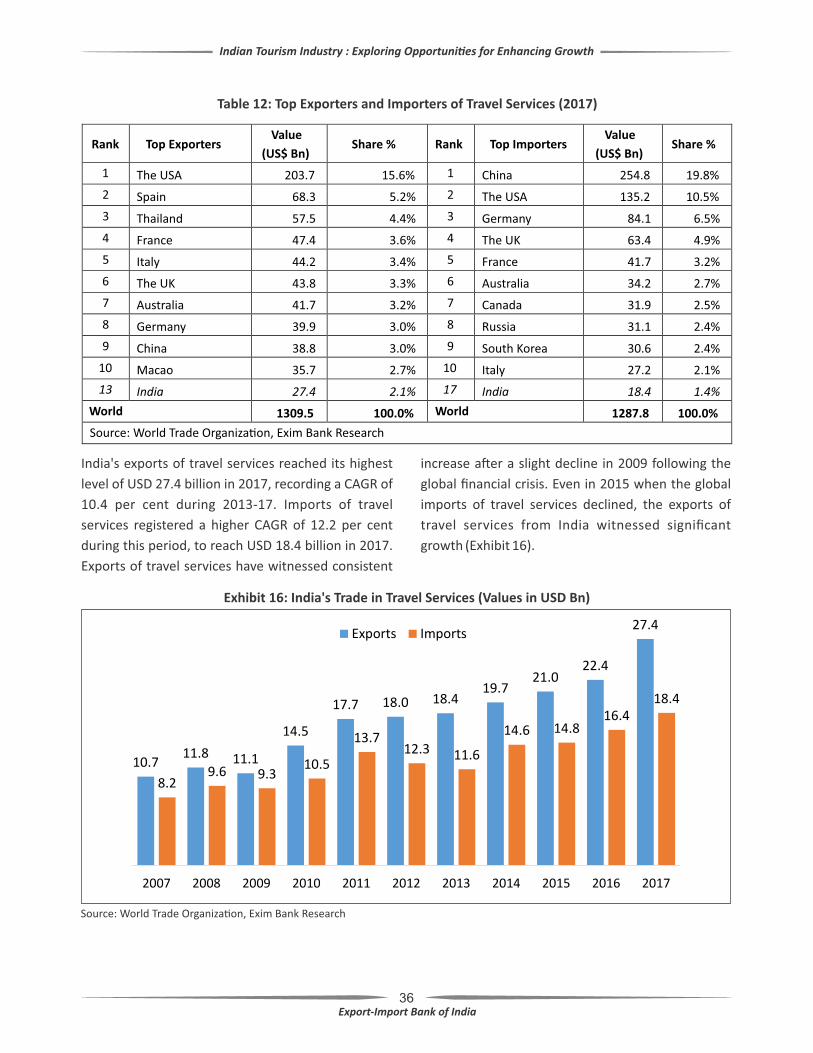
Table 12: Top Exporters and Importers of Travel Services (2017)
India's exports of travel services reached its highest
level of USD 27.4 billion in 2017, recording a CAGR of
10.4 per cent during 2013-17. Imports of travel
services registered a higher CAGR of 12.2 per cent
during this period, to reach USD 18.4 billion in 2017.
Exports of travel services have witnessed consistent
increase a�er a slight decline in 2009 following the
global financial crisis. Even in 2015 when the global
imports of travel services declined, the exports of
travel services from India witnessed significant
growth (Exhibit 16).
Exhibit 16: India's Trade in Travel Services (Values in USD Bn)
Source: World Trade Organiza�on, Exim Bank Research
Rank Top Exporters Value
(US$ Bn) Share % Rank Top Importers
Value
(US$ Bn) Share %
1 The USA 203.7 15.6% 1 China 254.8 19.8%
2 Spain 68.3 5.2% 2 The USA 135.2 10.5%
3 Thailand 57.5 4.4% 3 Germany 84.1 6.5%
4 France 47.4 3.6% 4 The UK 63.4 4.9%
5 Italy 44.2 3.4% 5 France 41.7 3.2%
6 The UK 43.8 3.3% 6 Australia 34.2 2.7%
7 Australia 41.7 3.2% 7 Canada 31.9 2.5%
8 Germany 39.9 3.0% 8 Russia 31.1 2.4%
9 China 38.8 3.0% 9 South Korea 30.6 2.4%
10 Macao 35.7 2.7% 10 Italy 27.2 2.1%
13 India 27.4 2.1% 17 India 18.4 1.4%
World 1309.5 100.0% World 1287.8 100.0%
Source: World Trade Organiza�on, Exim Bank Research
37
Indian Tourism Industry : Exploring Opportuni�es for Enhancing Growth
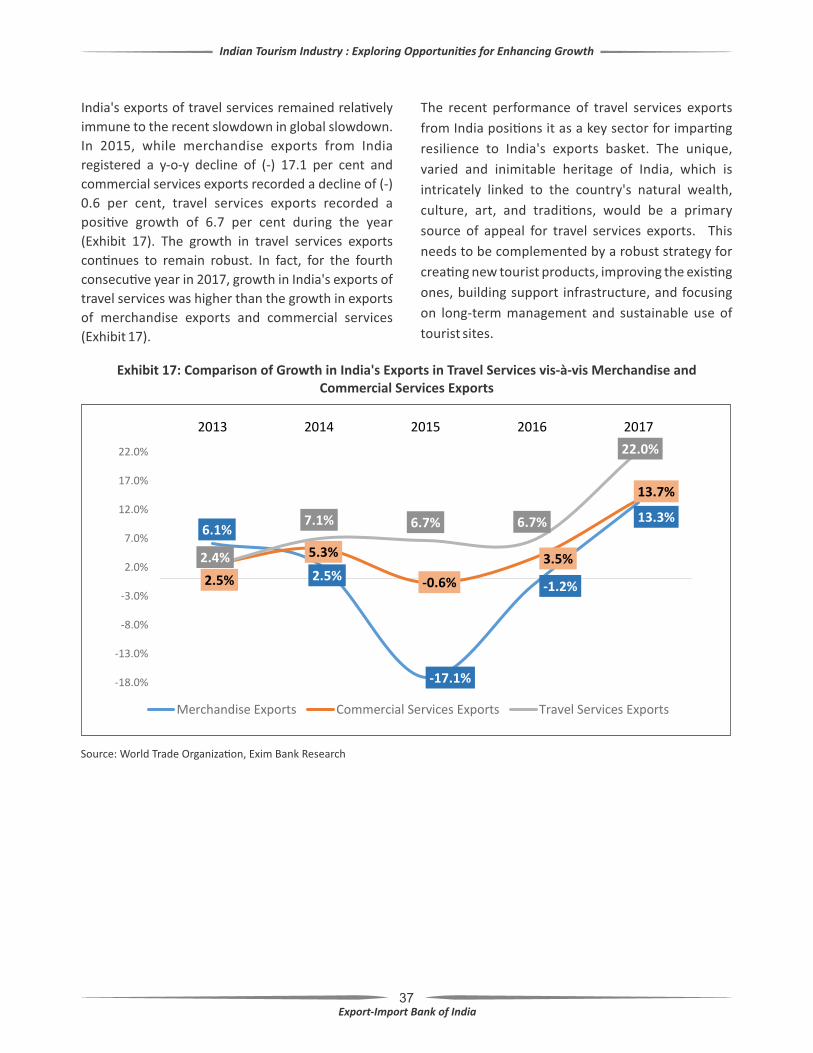
India's exports of travel services remained rela�vely
immune to the recent slowdown in global slowdown.
In 2015, while merchandise exports from India
registered a y-o-y decline of (-) 17.1 per cent and
commercial services exports recorded a decline of (-)
0.6 per cent, travel services exports recorded a
posi�ve growth of 6.7 per cent during the year
(Exhibit 17). The growth in travel services exports
con�nues to remain robust. In fact, for the fourth
consecu�ve year in 2017, growth in India's exports of
travel services was higher than the growth in exports
of merchandise exports and commercial services
(Exhibit 17).
Exhibit 17: Comparison of Growth in India's Exports in Travel Services vis-à-vis Merchandise and Commercial Services Exports
Source: World Trade Organiza�on, Exim Bank Research
The recent performance of travel services exports
from India posi�ons it as a key sector for impar�ng
resilience to India's exports basket. The unique,
varied and inimitable heritage of India, which is
intricately linked to the country's natural wealth,
culture, art, and tradi�ons, would be a primary
source of appeal for travel services exports. This
needs to be complemented by a robust strategy for
crea�ng new tourist products, improving the exis�ng
ones, building support infrastructure, and focusing
on long-term management and sustainable use of
tourist sites.
38
5. CHALLENGES AND STRATEGIES
The Indian tourism industry stands at a crucial
juncture. The industry has witnessed substan�al
growth in the recent period, and contributed
significantly to economic output, employment and
exports. This is unsurprising given the rich cultural and
natural heritage of the country which is aptly
summarized by the famous Orientalist, Max Mueller as
“If we were to look over the whole world to find out
the country most richly endowed with all the wealth,
power and beauty that nature can bestow – in some
parts a veritable paradise on the earth-I should point
to India. If I were asked under what sky the human
mind has most fully developed some of its choicest
gi�s… I should point to India”.
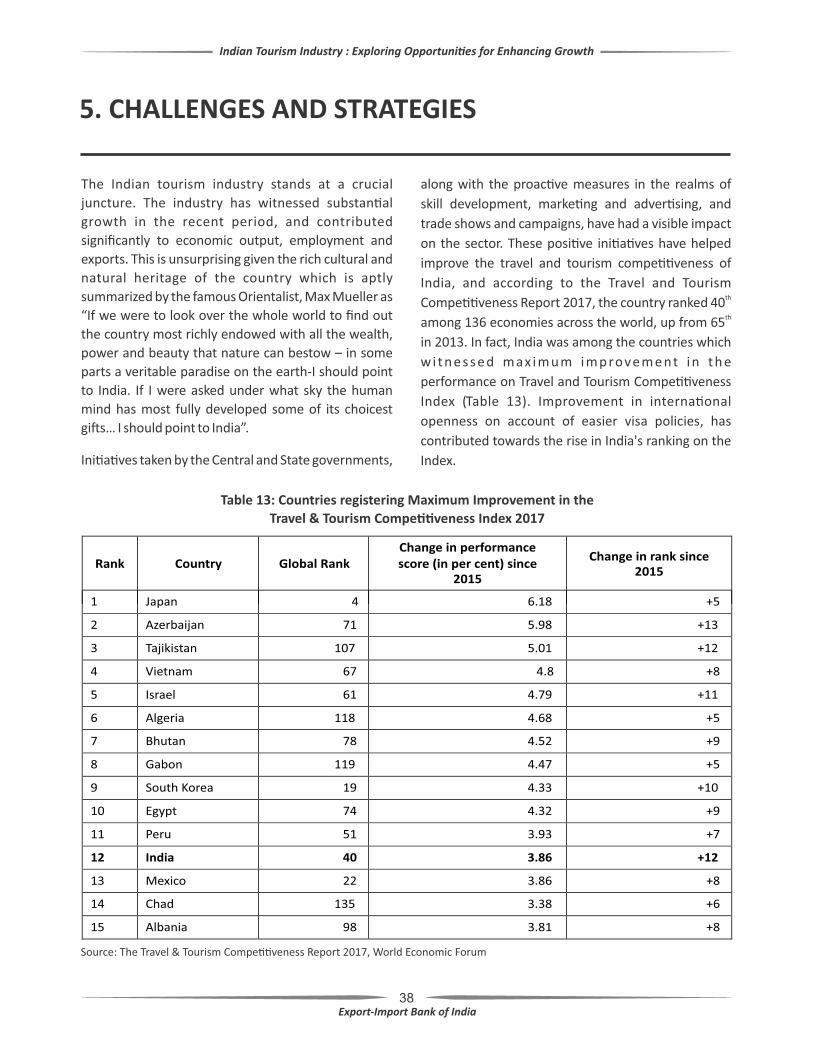
Ini�a�ves taken by the Central and State governments,
along with the proac�ve measures in the realms of
skill development, marke�ng and adver�sing, and
trade shows and campaigns, have had a visible impact
on the sector. These posi�ve ini�a�ves have helped
improve the travel and tourism compe��veness of
India, and according to the Travel and Tourism th
Compe��veness Report 2017, the country ranked 40 th
among 136 economies across the world, up from 65
in 2013. In fact, India was among the countries which
w i t n e s s e d m ax i m u m i m p rove m e nt i n t h e
performance on Travel and Tourism Compe��veness
Index (Table 13). Improvement in interna�onal
openness on account of easier visa policies, has
contributed towards the rise in India's ranking on the
Index.
Table 13: Countries registering Maximum Improvement in the
Travel & Tourism Compe��veness Index 2017
Source: The Travel & Tourism Compe��veness Report 2017, World Economic Forum
Indian Tourism Industry : Exploring Opportuni�es for Enhancing Growth
Rank Country Global Rank Change in performance score (in per cent) since
2015
Change in rank since 2015
1
Japan
4
6.18
+5
2
Azerbaijan
71
5.98
+13
3
Tajikistan
107
5.01
+12
4
Vietnam
67
4.8
+8
5
Israel
61
4.79
+11
6
Algeria
118
4.68
+5
7
Bhutan
78
4.52
+9
8
Gabon
119
4.47
+5
9
South Korea
19
4.33
+10
10
Egypt
74
4.32
+9
11
Peru
51
3.93
+7
12
India
40
3.86
+12
13
Mexico
22
3.86
+8
14
Chad
135
3.38
+6
15
Albania
98
3.81
+8
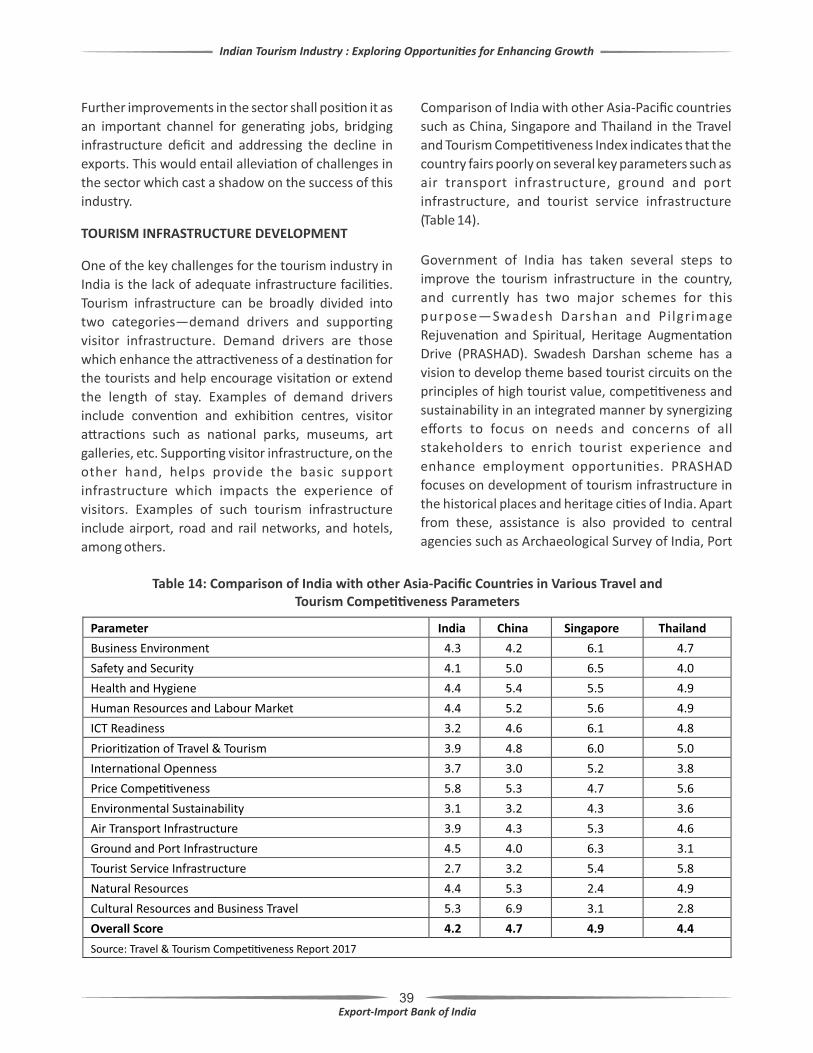
39
Further improvements in the sector shall posi�on it as
an important channel for genera�ng jobs, bridging
infrastructure deficit and addressing the decline in
exports. This would entail allevia�on of challenges in
the sector which cast a shadow on the success of this
industry.
TOURISM INFRASTRUCTURE DEVELOPMENT
One of the key challenges for the tourism industry in
India is the lack of adequate infrastructure facili�es.
Tourism infrastructure can be broadly divided into
two categories—demand drivers and suppor�ng
visitor infrastructure. Demand drivers are those
which enhance the a�rac�veness of a des�na�on for
the tourists and help encourage visita�on or extend
the length of stay. Examples of demand drivers
include conven�on and exhibi�on centres, visitor
a�rac�ons such as na�onal parks, museums, art
galleries, etc. Suppor�ng visitor infrastructure, on the
other hand, helps provide the basic support
infrastructure which impacts the experience of
visitors. Examples of such tourism infrastructure
include airport, road and rail networks, and hotels,
among others.
Comparison of India with other Asia-Pacific countries
such as China, Singapore and Thailand in the Travel
and Tourism Compe��veness Index indicates that the
country fairs poorly on several key parameters such as
air transport infrastructure, ground and port
infrastructure, and tourist service infrastructure
(Table 14).
Table 14: Comparison of India with other Asia-Pacific Countries in Various Travel and Tourism Compe��veness Parameters
Government of India has taken several steps to
improve the tourism infrastructure in the country,
and currently has two major schemes for this
purpose—Swadesh Darshan and Pi lgrimage
Rejuvena�on and Spiritual, Heritage Augmenta�on
Drive (PRASHAD). Swadesh Darshan scheme has a
vision to develop theme based tourist circuits on the
principles of high tourist value, compe��veness and
sustainability in an integrated manner by synergizing
efforts to focus on needs and concerns of all
stakeholders to enrich tourist experience and
enhance employment opportuni�es. PRASHAD
focuses on development of tourism infrastructure in
the historical places and heritage ci�es of India. Apart
from these, assistance is also provided to central
agencies such as Archaeological Survey of India, Port
Indian Tourism Industry : Exploring Opportuni�es for Enhancing Growth
Parameter
India
China
Singapore
Thailand
Business Environment
4.3
4.2
6.1
4.7
Safety and Security
4.1
5.0
6.5
4.0
Health and Hygiene
4.4
5.4
5.5
4.9 Human Resources and Labour Market
4.4
5.2
5.6
4.9
ICT Readiness
3.2
4.6
6.1
4.8
Priori�za�on of Travel & Tourism 3.9 4.8 6.0 5.0 Interna�onal Openness 3.7 3.0 5.2 3.8
Price Compe��veness 5.8 5.3 4.7 5.6
Environmental Sustainability 3.1 3.2 4.3 3.6
Air Transport Infrastructure 3.9 4.3 5.3 4.6
Ground and Port Infrastructure
4.5
4.0
6.3
3.1
Tourist Service Infrastructure
2.7
3.2
5.4
5.8
Natural Resources
4.4
5.3
2.4
4.9
Cultural Resources and Business Travel
5.3
6.9
3.1
2.8
Overall Score
4.2
4.7
4.9
4.4
Source: Travel & Tourism Compe��veness Report 2017
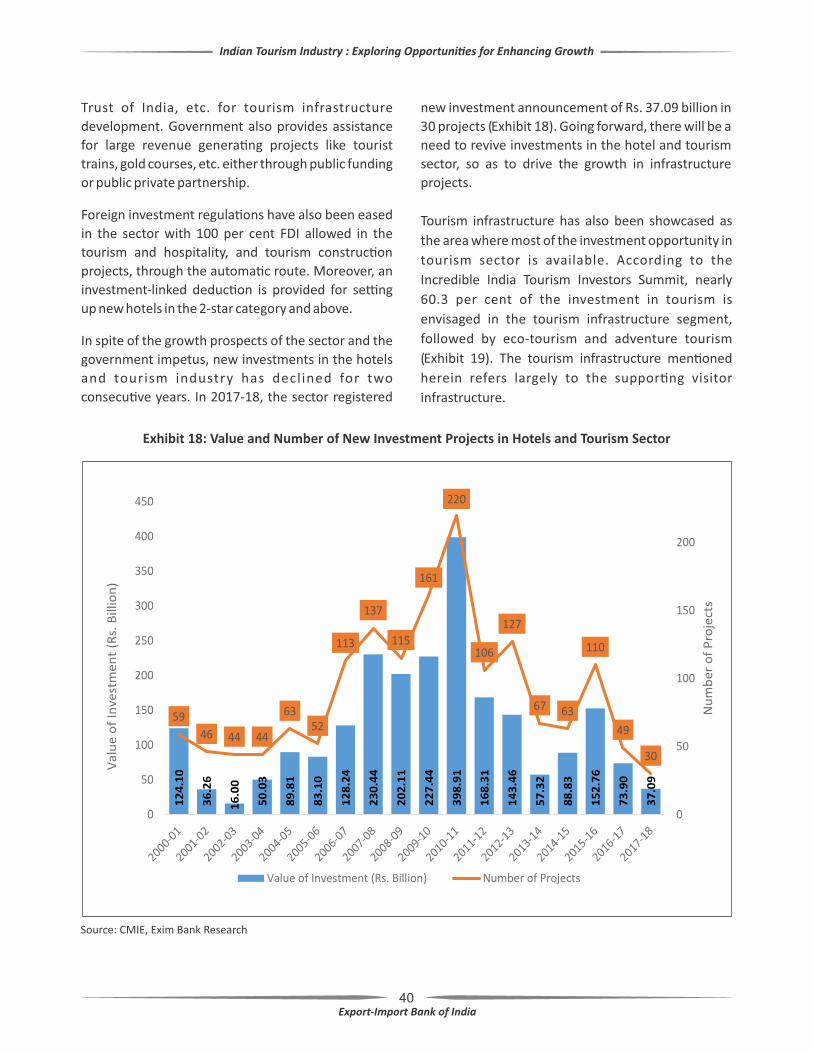
40
Trust of India, etc. for tourism infrastructure
development. Government also provides assistance
for large revenue genera�ng projects like tourist
trains, gold courses, etc. either through public funding
or public private partnership.
Foreign investment regula�ons have also been eased
in the sector with 100 per cent FDI allowed in the
tourism and hospitality, and tourism construc�on
projects, through the automa�c route. Moreover, an
investment-linked deduc�on is provided for se�ng
up new hotels in the 2-star category and above.
In spite of the growth prospects of the sector and the
government impetus, new investments in the hotels
and tourism industry has declined for two
consecu�ve years. In 2017-18, the sector registered
new investment announcement of Rs. 37.09 billion in
30 projects (Exhibit 18). Going forward, there will be a
need to revive investments in the hotel and tourism
sector, so as to drive the growth in infrastructure
projects.
Exhibit 18: Value and Number of New Investment Projects in Hotels and Tourism Sector
Source: CMIE, Exim Bank Research
Tourism infrastructure has also been showcased as
the area where most of the investment opportunity in
tourism sector is available. According to the
Incredible India Tourism Investors Summit, nearly
60.3 per cent of the investment in tourism is
envisaged in the tourism infrastructure segment,
followed by eco-tourism and adventure tourism
(Exhibit 19). The tourism infrastructure men�oned
herein refers largely to the suppor�ng visitor
infrastructure.
Indian Tourism Industry : Exploring Opportuni�es for Enhancing Growth
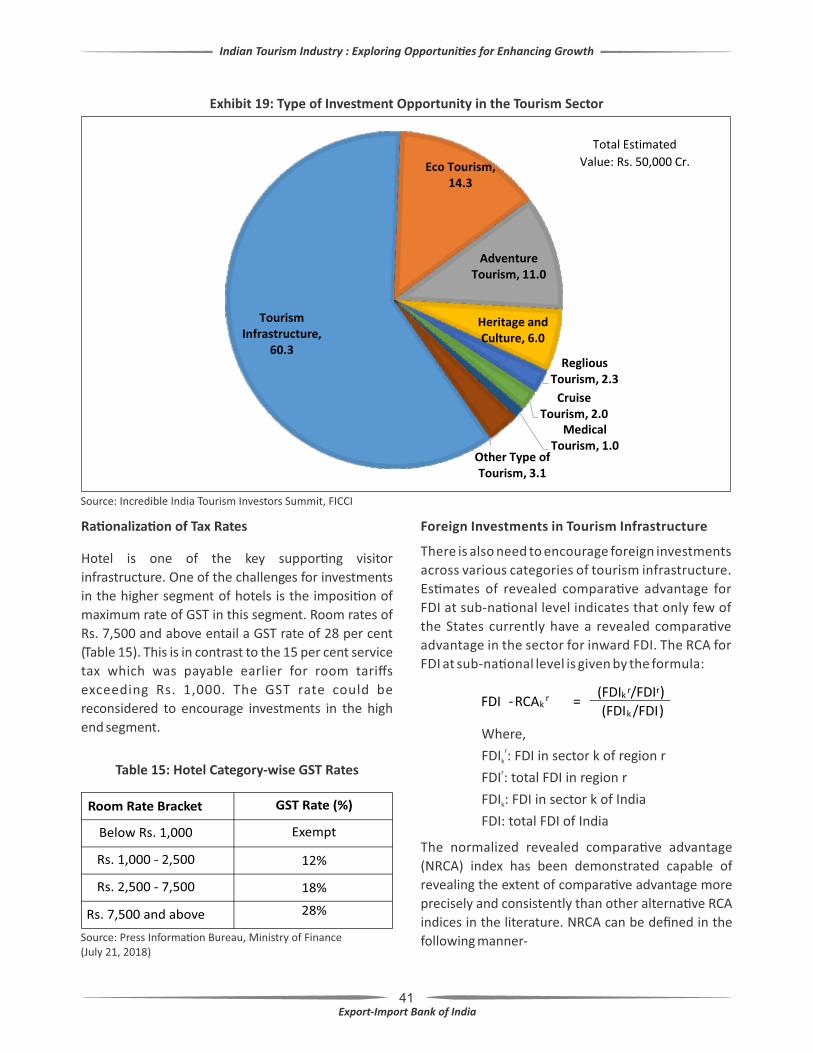
41
Exhibit 19: Type of Investment Opportunity in the Tourism Sector
Source: Incredible India Tourism Investors Summit, FICCI
Ra�onaliza�on of Tax Rates
Hotel is one of the key suppor�ng visitor
infrastructure. One of the challenges for investments
in the higher segment of hotels is the imposi�on of
maximum rate of GST in this segment. Room rates of
Rs. 7,500 and above entail a GST rate of 28 per cent
(Table 15). This is in contrast to the 15 per cent service
tax which was payable earlier for room tariffs
exceeding Rs. 1,000. The GST rate could be
reconsidered to encourage investments in the high
end segment.
Table 15: Hotel Category-wise GST Rates
Room Rate Bracket GST Rate (%)
Below Rs. 1,000 Exempt
Rs. 1,000 - 2,500 12%
Rs. 2,500 - 7,500 18%
Rs. 7,500 and above 28%
Source: Press Informa�on Bureau, Ministry of Finance(July 21, 2018)
Indian Tourism Industry : Exploring Opportuni�es for Enhancing Growth
FDI -RCAkr
=
(FDIkr/FDIr)
(FDIk /FDI)
Where,rFDI : FDI in sector k of region rk
rFDI : total FDI in region r
FDI : FDI in sector k of Indiak
FDI: total FDI of India
Foreign Investments in Tourism Infrastructure
There is also need to encourage foreign investments
across various categories of tourism infrastructure.
Es�mates of revealed compara�ve advantage for
FDI at sub-na�onal level indicates that only few of
the States currently have a revealed compara�ve
advantage in the sector for inward FDI. The RCA for
FDI at sub-na�onal level is given by the formula:
The normalized revealed compara�ve advantage
(NRCA) index has been demonstrated capable of
revealing the extent of compara�ve advantage more
precisely and consistently than other alterna�ve RCA
indices in the literature. NRCA can be defined in the
following manner-
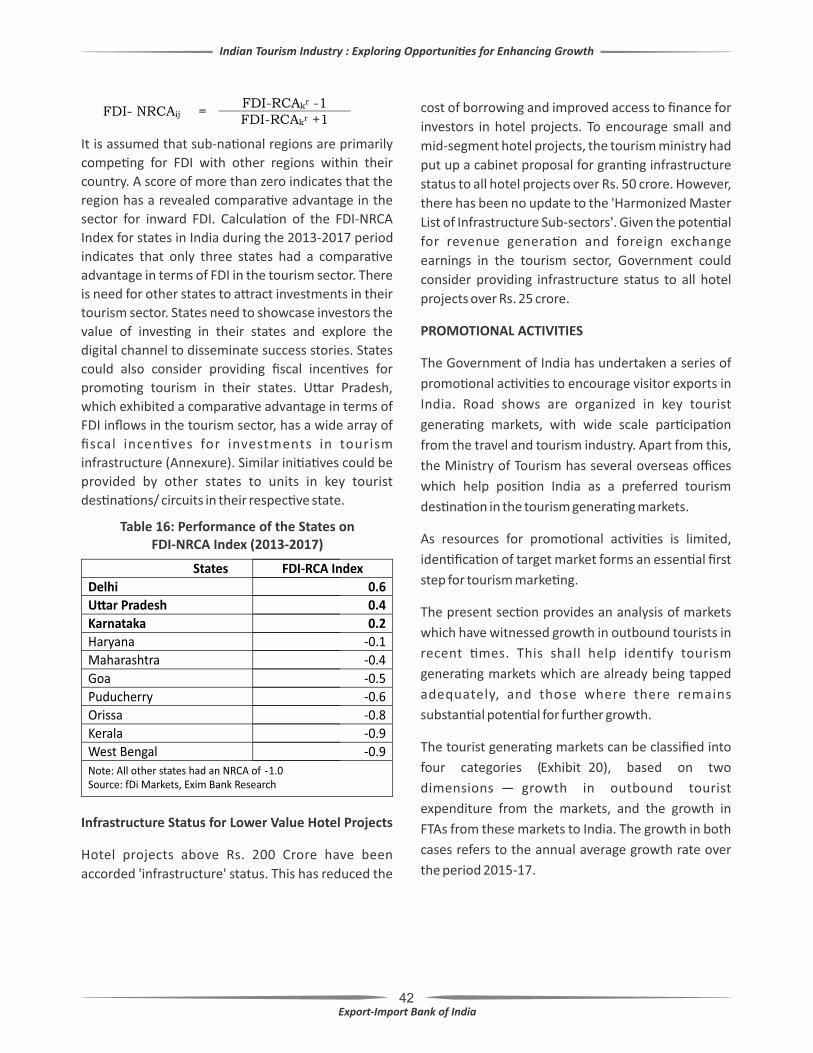
42
It is assumed that sub-na�onal regions are primarily
compe�ng for FDI with other regions within their
country. A score of more than zero indicates that the
region has a revealed compara�ve advantage in the
sector for inward FDI. Calcula�on of the FDI-NRCA
Index for states in India during the 2013-2017 period
indicates that only three states had a compara�ve
advantage in terms of FDI in the tourism sector. There
is need for other states to a�ract investments in their
tourism sector. States need to showcase investors the
value of inves�ng in their states and explore the
digital channel to disseminate success stories. States
could also consider providing fiscal incen�ves for
promo�ng tourism in their states. U�ar Pradesh,
which exhibited a compara�ve advantage in terms of
FDI inflows in the tourism sector, has a wide array of
fiscal incen�ves for investments in tourism
infrastructure (Annexure). Similar ini�a�ves could be
provided by other states to units in key tourist
des�na�ons/ circuits in their respec�ve state.
Table 16: Performance of the States on FDI-NRCA Index (2013-2017)
States FDI-RCA Index
Delhi 0.6
U�ar Pradesh 0.4
Karnataka 0.2
Haryana -0.1
Maharashtra
-0.4
Goa
-0.5
Puducherry
-0.6
Orissa
-0.8
Kerala
-0.9
West Bengal
-0.9
Note: All other states had an NRCA of -1.0
Source: fDi Markets, Exim Bank Research
Indian Tourism Industry : Exploring Opportuni�es for Enhancing Growth
Infrastructure Status for Lower Value Hotel Projects
Hotel projects above Rs. 200 Crore have been
accorded 'infrastructure' status. This has reduced the
cost of borrowing and improved access to finance for
investors in hotel projects. To encourage small and
mid-segment hotel projects, the tourism ministry had
put up a cabinet proposal for gran�ng infrastructure
status to all hotel projects over Rs. 50 crore. However,
there has been no update to the 'Harmonized Master
List of Infrastructure Sub-sectors'. Given the poten�al
for revenue genera�on and foreign exchange
earnings in the tourism sector, Government could
consider providing infrastructure status to all hotel
projects over Rs. 25 crore.
PROMOTIONAL ACTIVITIES
The Government of India has undertaken a series of
promo�onal ac�vi�es to encourage visitor exports in
India. Road shows are organized in key tourist
genera�ng markets, with wide scale par�cipa�on
from the travel and tourism industry. Apart from this,
the Ministry of Tourism has several overseas offices
which help posi�on India as a preferred tourism
des�na�on in the tourism genera�ng markets.
As resources for promo�onal ac�vi�es is limited,
iden�fica�on of target market forms an essen�al first
step for tourism marke�ng.
The present sec�on provides an analysis of markets
which have witnessed growth in outbound tourists in
recent �mes. This shall help iden�fy tourism
genera�ng markets which are already being tapped
adequately, and those where there remains
substan�al poten�al for further growth.
The tourist genera�ng markets can be classified into
four categories (Exhibit 20), based on two
dimensions — growth in outbound tourist
expenditure from the markets, and the growth in
FTAs from these markets to India. The growth in both
cases refers to the annual average growth rate over
the period 2015-17.
FDI- NRCAij = FDI-RCAk
r -1 FDI-RCAk
r +1
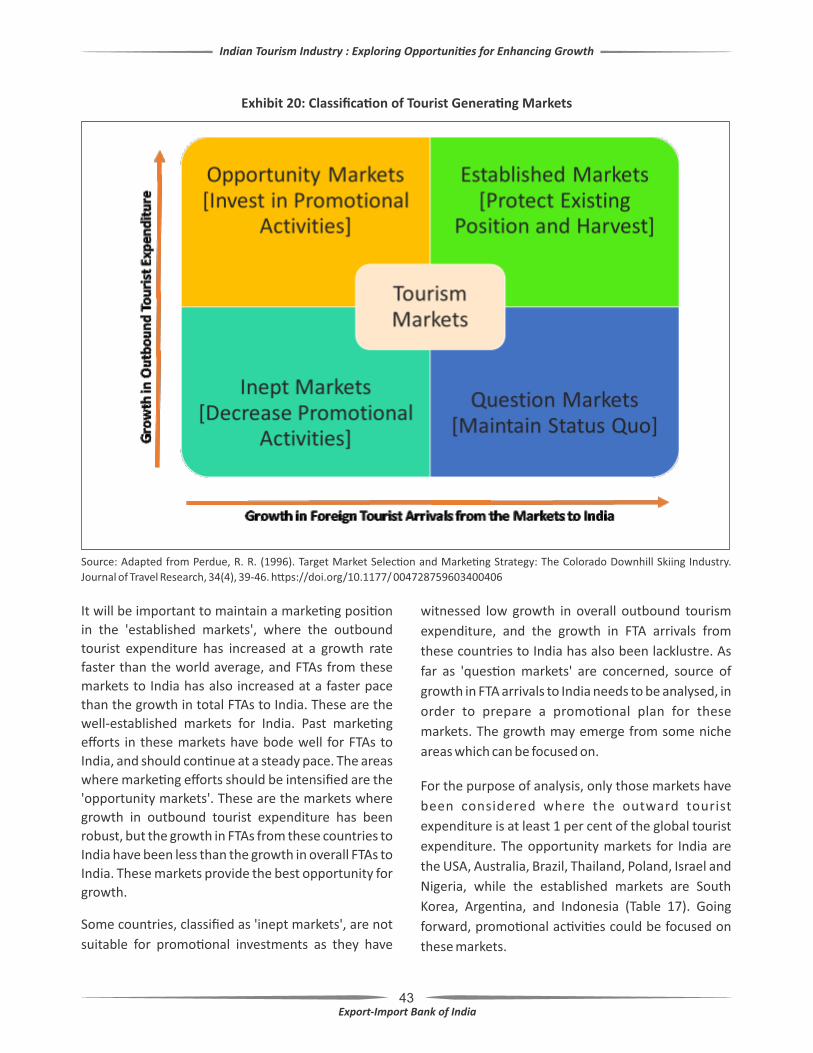
43
Exhibit 20: Classifica�on of Tourist Genera�ng Markets
It will be important to maintain a marke�ng posi�on
in the 'established markets', where the outbound
tourist expenditure has increased at a growth rate
faster than the world average, and FTAs from these
markets to India has also increased at a faster pace
than the growth in total FTAs to India. These are the
well-established markets for India. Past marke�ng
efforts in these markets have bode well for FTAs to
India, and should con�nue at a steady pace. The areas
where marke�ng efforts should be intensified are the
'opportunity markets'. These are the markets where
growth in outbound tourist expenditure has been
robust, but the growth in FTAs from these countries to
India have been less than the growth in overall FTAs to
India. These markets provide the best opportunity for
growth.
Some countries, classified as 'inept markets', are not
suitable for promo�onal investments as they have
witnessed low growth in overall outbound tourism
expenditure, and the growth in FTA arrivals from
these countries to India has also been lacklustre. As
far as 'ques�on markets' are concerned, source of
growth in FTA arrivals to India needs to be analysed, in
order to prepare a promo�onal plan for these
markets. The growth may emerge from some niche
areas which can be focused on.
For the purpose of analysis, only those markets have
been considered where the outward tourist
expenditure is at least 1 per cent of the global tourist
expenditure. The opportunity markets for India are
the USA, Australia, Brazil, Thailand, Poland, Israel and
Nigeria, while the established markets are South
Korea, Argen�na, and Indonesia (Table 17). Going
forward, promo�onal ac�vi�es could be focused on
these markets.
Indian Tourism Industry : Exploring Opportuni�es for Enhancing Growth
Source: Adapted from Perdue, R. R. (1996). Target Market Selec�on and Marke�ng Strategy: The Colorado Downhill Skiing Industry.
Journal of Travel Research, 34(4), 39-46. h�ps://doi.org/10.1177/ 004728759603400406
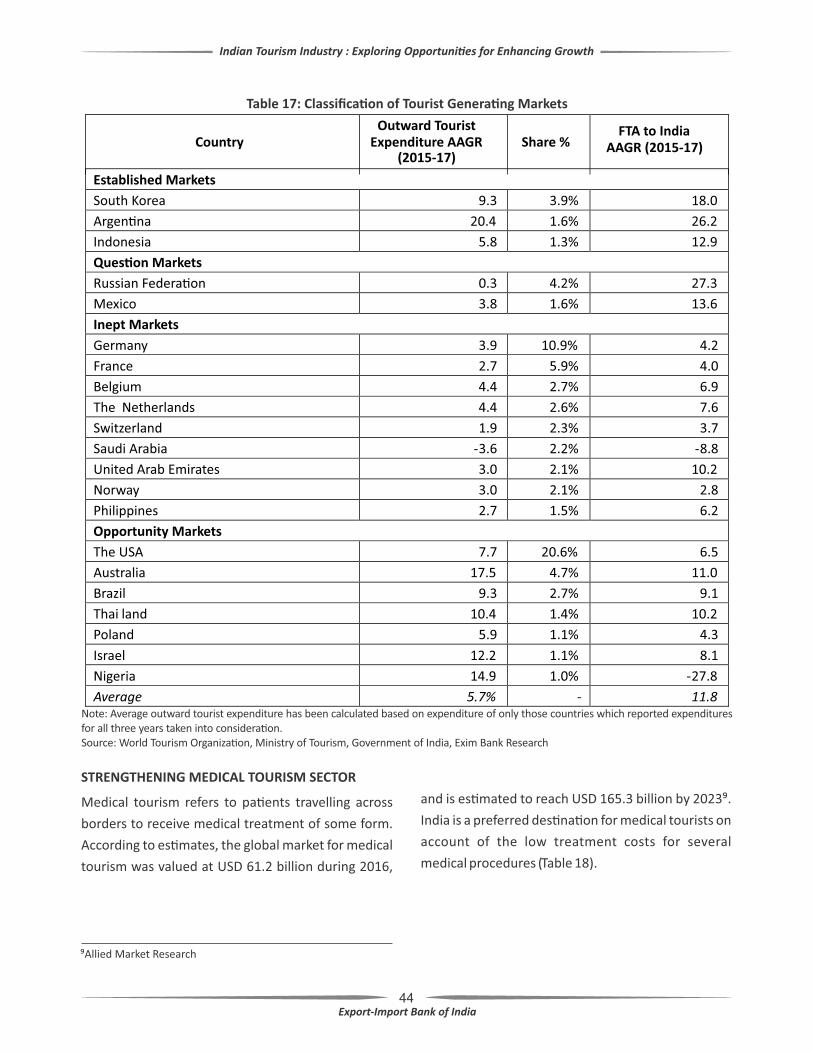
44
Table 17: Classifica�on of Tourist Genera�ng Markets
Note: Average outward tourist expenditure has been calculated based on expenditure of only those countries which reported expenditures for all three years taken into considera�on. Source: World Tourism Organiza�on, Ministry of Tourism, Government of India, Exim Bank Research
STRENGTHENING MEDICAL TOURISM SECTOR
Medical tourism refers to pa�ents travelling across
borders to receive medical treatment of some form.
According to es�mates, the global market for medical
tourism was valued at USD 61.2 billion during 2016,
and is es�mated to reach USD 165.3 billion by 2023⁹.
India is a preferred des�na�on for medical tourists on
account of the low treatment costs for several
medical procedures (Table 18).
⁹Allied Market Research
Indian Tourism Industry : Exploring Opportuni�es for Enhancing Growth
Country Outward Tourist
Expenditure AAGR (2015-17)
Share % FTA to India
AAGR (2015-17)
Established Markets
South Korea
9.3
3.9%
18.0
Argen�na
20.4
1.6%
26.2
Indonesia
5.8
1.3%
12.9
Ques�on Markets
Russian Federa�on
0.3
4.2%
27.3
Mexico
3.8
1.6%
13.6
Inept Markets
Germany
3.9
10.9%
4.2
France
2.7
5.9%
4.0
Belgium
4.4
2.7%
6.9
The Netherlands
4.4
2.6%
7.6
Switzerland
1.9
2.3%
3.7
Saudi Arabia
-3.6
2.2%
-8.8
United Arab Emirates
3.0
2.1%
10.2
Norway
3.0
2.1%
2.8
Philippines
2.7
1.5%
6.2
Opportunity Markets
The USA
7.7
20.6%
6.5
Australia
17.5
4.7%
11.0
Brazil
9.3
2.7%
9.1
Thai land
10.4
1.4%
10.2
Poland
5.9
1.1%
4.3
Israel
12.2
1.1%
8.1
Nigeria
14.9
1.0%
-27.8
Average
5.7%
-
11.8
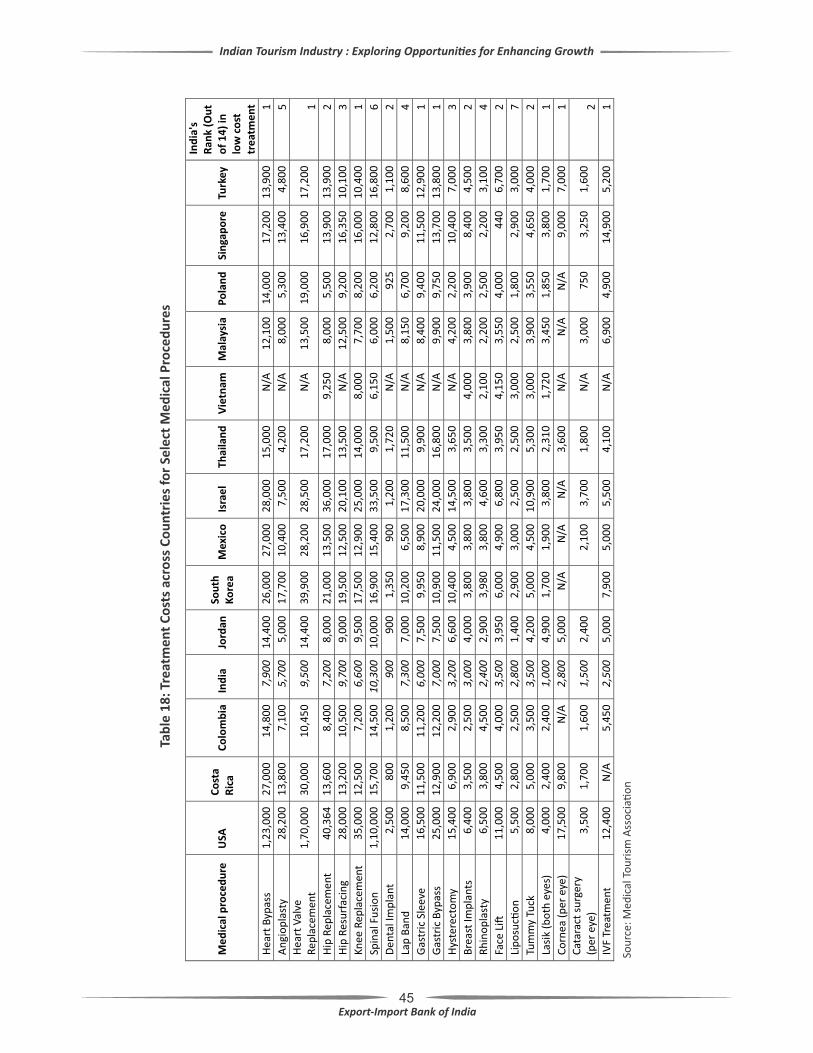
45
Tab
le 1
8:
Tre
atm
en
t C
ost
s ac
ross
Co
un
trie
s fo
r Se
lect
Me
dic
al P
roce
du
res
Me
dic
al p
roce
du
re
USA
C
ost
a R
ica
C
olo
mb
ia
Ind
ia
Jord
an
Sou
th
Ko
rea
M
exic
o
Isra
el
Th
aila
nd
V
ietn
am
Mal
aysi
a
Po
lan
d
Sin
gap
ore
Tu
rkey
Ind
ia's
R
ank
(Ou
t o
f 1
4)
in
low
co
st
tre
atm
en
t
Hea
rt B
ypas
s 1
,23
,00
0
27
,00
0
14
,80
0
7,9
00
1
4,4
00
2
6,0
00
2
7,0
00
2
8,0
00
1
5,0
00
N
/A
12
,10
0
14
,00
0
17
,20
0
13
,90
0
1
An
gio
pla
sty
28
,20
0
13
,80
0
7,1
00
5
,70
0
5,0
00
1
7,7
00
1
0,4
00
7
,50
0
4,2
00
N
/A
8,0
00
5
,30
0
13
,40
0
4,8
00
5
H
eart
Val
ve
Rep
lace
men
t 1
,70
,00
0
30
,00
0
10
,45
0
9,5
00
1
4,4
00
3
9,9
00
2
8,2
00
2
8,5
00
1
7,2
00
N
/A
13
,50
0
19
,00
0
16
,90
0
17
,20
0
1
Hip
Rep
lace
men
t 4
0,3
64
1
3,6
00
8
,40
0
7,2
00
8
,00
0
21
,00
0
13
,50
0
36
,00
0
17
,00
0
9,2
50
8
,00
0
5,5
00
1
3,9
00
1
3,9
00
2
H
ip R
esu
rfac
ing
2
8,0
00
1
3,2
00
1
0,5
00
9
,70
0
9,0
00
1
9,5
00
1
2,5
00
2
0,1
00
1
3,5
00
N
/A
12
,50
0
9,2
00
1
6,3
50
1
0,1
00
3
K
nee
Rep
lace
men
t 3
5,0
00
1
2,5
00
7
,20
0
6,6
00
9
,50
0
17
,50
0
12
,90
0
25
,00
0
14
,00
0
8,0
00
7
,70
0
8,2
00
1
6,0
00
1
0,4
00
1
Sp
inal
Fu
sio
n
1,1
0,0
00
1
5,7
00
1
4,5
00
1
0,3
00
1
0,0
00
1
6,9
00
1
5,4
00
3
3,5
00
9
,50
0
6,1
50
6
,00
0
6,2
00
1
2,8
00
1
6,8
00
6
D
enta
l Im
pla
nt
2,5
00
8
00
1
,20
0
90
0
90
0
1,3
50
9
00
1
,20
0
1,7
20
N
/A
1,5
00
9
25
2
,70
0
1,1
00
2
La
p B
and
1
4,0
00
9
,45
0
8,5
00
7
,30
0
7,0
00
1
0,2
00
6
,50
0
17
,30
0
11
,50
0
N/A
8
,15
0
6,7
00
9
,20
0
8,6
00
4
G
astr
ic S
leev
e
16
,50
0
11
,50
0
11
,20
0
6,0
00
7
,50
0
9,9
50
8
,90
0
20
,00
0
9,9
00
N
/A
8,4
00
9
,40
0
11
,50
0
12
,90
0
1
Gas
tric
Byp
ass
25
,00
0
12
,90
0
12
,20
0
7,0
00
7
,50
0
10
,90
0
11
,50
0
24
,00
0
16
,80
0
N/A
9
,90
0
9,7
50
1
3,7
00
1
3,8
00
1
H
yste
rect
om
y
15
,40
0
6,9
00
2
,90
0
3,2
00
6
,60
0
10
,40
0
4,5
00
1
4,5
00
3
,65
0
N/A
4
,20
0
2,2
00
1
0,4
00
7
,00
0
3
Bre
ast
Imp
lan
ts
6,4
00
3
,50
0
2,5
00
3
,00
0
4,0
00
3
,80
0
3,8
00
3
,80
0
3,5
00
4
,00
0
3,8
00
3
,90
0
8,4
00
4
,50
0
2
Rh
ino
pla
sty
6,5
00
3
,80
0
4,5
00
2
,40
0
2,9
00
3
,98
0
3,8
00
4
,60
0
3,3
00
2
,10
0
2,2
00
2
,50
0
2,2
00
3
,10
0
4
Face
Li�
1
1,0
00
4
,50
0
4,0
00
3
,50
0
3,9
50
6
,00
0
4,9
00
6
,80
0
3,9
50
4
,15
0
3,5
50
4
,00
0
44
0
6,7
00
2
Li
po
suc�
on
5
,50
0
2,8
00
2
,50
0
2,8
00
1
,40
0
2,9
00
3
,00
0
2,5
00
2
,50
0
3,0
00
2
,50
0
1,8
00
2
,90
0
3,0
00
7
Tu
mm
y Tu
ck
8,0
00
5
,00
0
3,5
00
3
,50
0
4,2
00
5
,00
0
4,5
00
1
0,9
00
5
,30
0
3,0
00
3
,90
0
3,5
50
4
,65
0
4,0
00
2
La
sik
(bo
th e
yes)
4
,00
0
2,4
00
2
,40
0
1,0
00
4
,90
0
1,7
00
1
,90
0
3,8
00
2
,31
0
1,7
20
3
,45
0
1,8
50
3
,80
0
1,7
00
1
C
orn
ea (
per
eye
) 1
7,5
00
9
,80
0
N/A
2
,80
0
5,0
00
N
/A
N/A
N
/A
3,6
00
N
/A
N/A
N
/A
9,0
00
7
,00
0
1
Cat
arac
t su
rger
y (p
er e
ye)
3,5
00
1
,70
0
1,6
00
1
,50
0
2,4
00
2,1
00
3
,70
0
1,8
00
N
/A
3,0
00
7
50
3
,25
0
1,6
00
2
IV
F Tr
eatm
ent
12
,40
0
N/A
5
,45
0
2,5
00
5
,00
0
7,9
00
5
,00
0
5,5
00
4
,10
0
N/A
6
,90
0
4,9
00
1
4,9
00
5
,20
0
1
So
urc
e: M
edic
al T
ou
rism
Ass
oci
a�o
n
Indian Tourism Industry : Exploring Opportuni�es for Enhancing Growth
46
Several other countries are emerging as compe�tors
for India in terms of cost of medical procedures. It is
therefore impera�ve for the medical tourism industry
to focus on other aspects such as quality, alterna�ve
healthcare systems such as Ayurveda, and be�er visa
facilita�on services for medical tourism. Over the
years, the Government of India has taken several
steps to promote alterna�ve healthcare systems, as
also to improve the visa process for medical tourism.
This has bode well for the medical tourism industry in
India. However, certain challenges remain in this
segment.
A major constraint for the medical tourism industry is
the limited number of hospitals with interna�onal
accredita�on in the country. Government has made it
compulsory for hospitals to be 'Na�onal Accredita�on
Board for Hospitals & Healthcare Providers (NABH)'
accredited if they are empanelled under the Central
Government Health Scheme. Resultantly, there are a
large number of NABH- accredited hospitals in the
country. However, number of hospitals receiving
interna�onal accredita�on from agencies such the
Joint Commission Interna�onal (JCI) is s�ll low. JCI is
the world's leading health care accredita�on, and
evaluates hospitals on most rigorous interna�onal
standards in quality and pa�ent safety. Currently,
there are 38 JCI accredited hospitals in India, which is
significantly low as compared to other compe�ng
des�na�ons such as Thailand (64) and Turkey (44).
Several countries offer fiscal incen�ves for domes�c
or interna�onal accredita�on. In Malaysia, for
example, private hospitals which incur expenses in
o bta in in g accred i ta�o n f ro m d o mes�c or
interna�onal agencies such as the Malaysian Society
for Quality in Health or JCI, qualify for double
deduc�on for the purpose o f income tax
computa�on. The success of financial incen�ves for
increase in par�cipa�on in accredita�on programmes
was also noted in case of Poland¹⁰. Fiscal incen�ves
could be considered by central and state governments
in India to encourage interna�onal accredita�on of
hospitals.
Another major issue is the lack of insurance
portability. Most medical tourism expenditures are
out-of-pocket expenses on account of incongruence
of insurance schemes across geographies. This lack of
insurance portability is a major constraint for medical
tourism industry in developing countries, including
India. With growth in medical tourism, insurance
companies are increasingly offering limited medical
tourism insurance packages for specific medical
facili�es abroad, or extending coverage to foreign
loca�ons on a hospital-by-hospital basis. For
example, in 2008, Blue Cross Blue Shield of South
Carolina launched a subsidiary, Companion Global
Healthcare, for helping pa�ents in the US to plan trips
to overseas loca�ons for lower-cost medical
procedures. Since then, several insurance companies
have started programs for extending insurance
coverage in select hospital loca�ons abroad. Indian
hospitals need to engage with such global insurance
companies, and a JCI accredita�on could be useful in
this pursuit.
There is also need for more facilitators in the medical
tourism space. Facilitators connect individual
consumers, businesses, insurance carriers and
agents, and third party administrators to affordable
and innova�ve medical travel op�ons. While several
US based and interna�onal facilitators operate in the
Indian medical tourism market, there is need for
more domes�c companies in the segment. One such
Indian start-up in this space is Hospals, which has built
and scaled a pla�orm model enabling interna�onal
pa�ents to get these services and is already catering
to more than 200 pa�ents per month. There is need to
encourage more such ini�a�ves, possibly through the
Startup India scheme of the Government of India.
TOURIST INSURANCE AND TRAVEL ASSISTANCE
India scores low on the health and hygiene parameter
of the Travel and Tourism Compe��veness Index, as
compared to other key tourist des�na�ons in the
Asia-Pacific. The importance of good percep�on
about health and sanita�on in context of tourism
cannot be overemphasized. While travellers would
¹⁰Shaw C. (2004). Developing hospital accredita�on in Europe, Division of Country Support, WHO Regional Office for Europe
Indian Tourism Industry : Exploring Opportuni�es for Enhancing Growth
47
consider the natural and cultural heritage of a country
before selec�ng a des�na�on, personal safety and
security are also key considera�ons. In fact, in the
past, security shocks have led to substan�al losses for
several developing economies. For example, in 2009,
the Mexican tourism industry suffered a loss of nearly
USD 5 billion on account of the H1N1 flu. Similarly, the
tourist arrivals in Egypt reduced from 14 million in
2010 to 9.5 million in 2013 on account of the Arab
Spring and related unrest¹¹.
While a general improvement in healthcare
infrastructure would be beneficial for tourism, there
is also a need to adopt innova�ve mechanism for
providing travel insurance to tourists. In Thailand, for
example, the State-owned Krungthai Bank, offers
tourists a debit card, which provides some medical
and life insurance coverage in case of an accident. The
Tourism Authority of Thailand partnered with state-
owned Krungthai Bank, the na�onal bank of Thailand,
to offer tourists a debit card called the Miracle
Thailand Card. The card has an issuance fee of 100
baht (approximately USD 3) and func�ons as a debit
card which can be used in department stores, as also
for admi�ance to some tourist spots. The card also
comes with life and personal accident insurance in
case of accident while on holiday in Thailand. The
coverage is of up to 10,000 baht (approximately USD
333) for outpa�ent treatment and up to 500,000 baht
(approximately USD 16,666) for inpa�ent treatment.
Similar ini�a�ve could be undertaken in case of India.
There is also need to enhance focus on tourists
requiring special care as the popula�on in key tourism
genera�ng countries is aging. According to the United
Na�ons (2015), globally, there were 901 million
people aged 60 years or over in 2015, up from 607
million in 2000. By 2030, the popula�on of people
aged 60 years or over is expected to reach 1.4 billion,
accoun�ng for nearly 16.5 per cent of the world
popula�on¹². The tourism sector needs to respond to
this change in demographics over the next decade.
Accessibility of the tourist sites is a major issue for the
elderly, and it is important to make the tourist
facili�es accessible to the physically challenged, as
also provide reliable informa�on about the
accessibility of the tourist sites.
An important step in improving the accessibility of
public buildings and transport is the Accessible India
campaign. As part of the Accessible India campaign,
accessibility of public buildings and transport were to
be made less challenging for the physically
challenged. As on end-2017, all 38 interna�onal
airports and all 48 domes�c airports in India were
provided with accessible features viz. ramps,
accessible toilets, li�s with Braille symbols and
auditory signals. Several railway sta�ons and buses
are yet to be provided with accessibility features.
Similarly, several websites of State Governments/ UTs
also need to be made accessible through ERNET India.
Achievement of the deliverables of the Accessible
India campaign will significantly improve the
prospects for visitor exports.
PROMOTION OF CULINARY TOURISM
Culinary tourism is a nascent sector of the tourism
industry in India whose poten�al is yet to be fully
realized. According to the World Food Travel
Associa�on, culinary tourism is the pursuit and
enjoyment of unique and memorable food and drink
experiences. Examples of culinary tourism ac�vi�es
include ac�vi�es such as cooking with the locals;
cooking workshops; ea�ng at the homes of local
people, at local restaurants or the street food; food
and drink tas�ng sessions, food and drink tours and
trails; collec�ng ingredients or par�cipa�ng in local
harvest; and visi�ng farms, orchards, wineries,
dis�lleries, food markets, fairs or fes�vals.
Since 2010, local food culture has also been included
as an intangible cultural world heritage by the
UNESCO. Several countries have applied for a
UNESCO world heritage status for their local cuisines,
which is favourable for the marke�ng of culinary
¹¹World Economic Forum. (2017). Incredibly India 2.0: India's US$ 20 Billion Tourism Opportunity¹²United Na�ons. (2015). World Popula�on Ageing
Indian Tourism Industry : Exploring Opportuni�es for Enhancing Growth

48
tourism in their countries. Lavash in Armenia,
tradi�on of kimchi making in Democra�c People's
Republic of Korea, Palov in Uzbekistan, Washoku in
Armenia are examples of culinary tradi�ons which
have received the UNESCO world heritage status
(Table 19). Currently, India does not have any culinary
item or tradi�on in the UNESCO intangible cultural
world heritage list. World heritage status could give a
compe��ve advantage to culinary tourism in India.
Both Central and State Governments could build their
image as a culinary tourism des�na�on around these
statuses.
Table 19: Culinary Tradi�ons with UNESCO World Heritage Status
Culinary Tradi�on Countries
Dolma making and sharing tradi�on, a marker of cultural iden�ty Azerbaijan
Nsima, culinary tradi�on of Malawi Malawi
Beer culture in Belgium Belgium
Flatbread making and sharing culture: Lavash, Katyrma, Jupka, Yu�a
Azerbaijan – Iran – Kazakhstan –
Kyrgyzstan – Turkey
Khidr Elias feast and its vows
Iraq
Oshi Palav, a tradi�onal meal and its social and cultural contexts in Tajikistan
Tajikistan
Palov culture and tradi�on
Uzbekistan
Arabic coffee, a symbol of generosity United
Arab
Emirates
–
Saudi
Arabia
–
Oman
–
Qatar
Oshituthi shomagongo, marula fruit fes�val
Namibia
Tradi�on of kimchi-making in the Democra�c People's Republic of Korea
Democra�c
People’s
Republic
of
Korea
Lavash, the prepara�on, meaning and appearance of tradi�onal bread as an expression of culture in Armenia
Armenia
Ancient Georgian tradi�onal Qvevri wine-making method
Georgia
Kimjang, making and sharing kimchi in the
Republic of Korea
Republic of Korea
Mediterranean diet
Cyprus
–
Croa�a
–
Spain
–
Greece
–
Italy
–
Morocco
–
Portugal
Shrimp fishing on horseback in Oostduinkerke
Belgium
Turkish coffee culture and tradi�on
Turkey
Washoku, tradi�onal dietary cultures of the Japanese
Japan
Gingerbread cra� from Northern Croa�a
Croa�a
Source: UNESCO
Culinary tourism projects could also be developed in
the country. Inspira�on could be taken from France
which has developed 'Ci�es of Gastronomy', which
consists of cultural spaces with tourism
facili�es dedicated to gastronomy (Box 2). Other
countries such as Belgium and Switzerland are also
developing such concepts—the former with beer, and
la�er with the feast of vineyards, 'Vevey'. In all these
cases, government involvement has played a decisive
role.
As in the case of 'Ci�es of Gastronomy', the Ministry
of Tourism can organize a contest among various
states to propose an idea for culinary tourism project
which embodies various cultural and customary
prac�ces of the local people. Such projects can then
be developed and promoted in an a�empt to
popularize culinary tourism in India. The compe��on
route for iden�fica�on of food tourism projects was
also used by Finnish authori�es in 2015. The Finnish
Food Tourism Compe��on was organized by Haaga-
Helia University of Applied Sciences and financed by
several government ins�tu�ons. The evalua�on
criteria for the compe��on were: customer
Indian Tourism Industry : Exploring Opportuni�es for Enhancing Growth
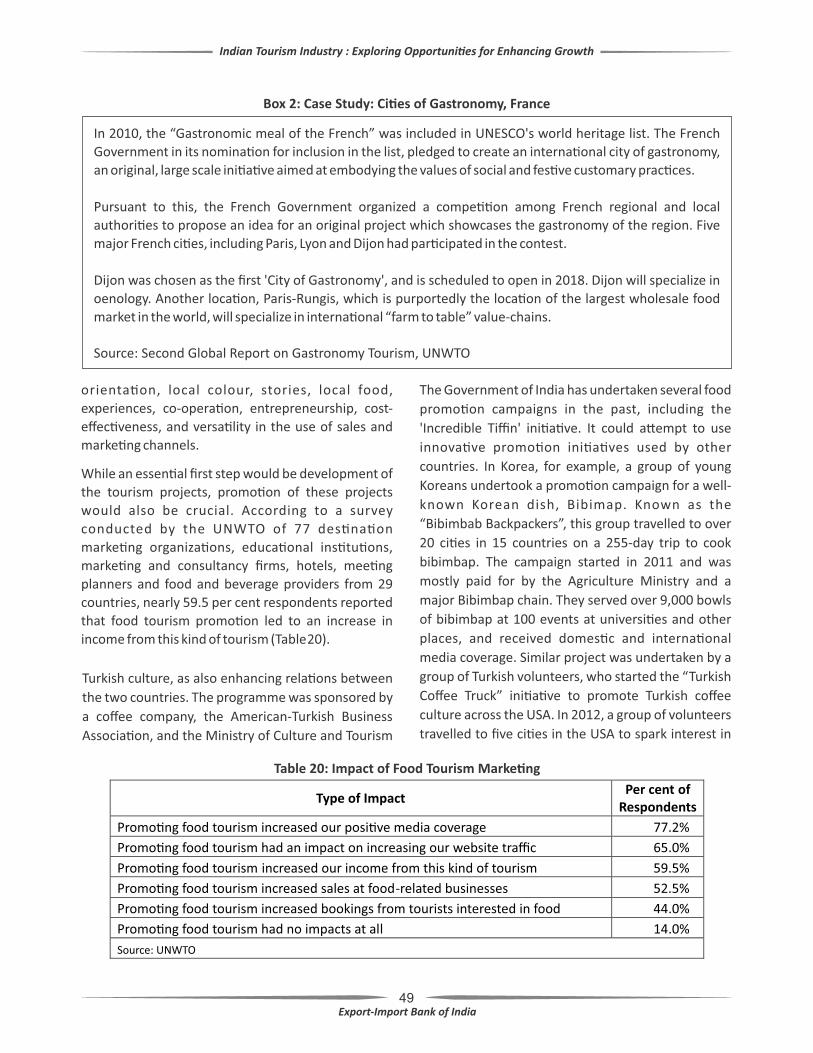
49
orienta�on, local colour, stories, local food,
experiences, co-opera�on, entrepreneurship, cost-
effec�veness, and versa�lity in the use of sales and
marke�ng channels.
While an essen�al first step would be development of
the tourism projects, promo�on of these projects
would also be crucial. According to a survey
conducted by the UNWTO of 77 des�na�on
marke�ng organiza�ons, educa�onal ins�tu�ons,
marke�ng and consultancy firms, hotels, mee�ng
planners and food and beverage providers from 29
countries, nearly 59.5 per cent respondents reported
that food tourism promo�on led to an increase in
income from this kind of tourism (Table 20).
Box 2: Case Study: Ci�es of Gastronomy, France
In 2010, the “Gastronomic meal of the French” was included in UNESCO's world heritage list. The French
Government in its nomina�on for inclusion in the list, pledged to create an interna�onal city of gastronomy,
an original, large scale ini�a�ve aimed at embodying the values of social and fes�ve customary prac�ces.
Pursuant to this, the French Government organized a compe��on among French regional and local
authori�es to propose an idea for an original project which showcases the gastronomy of the region. Five
major French ci�es, including Paris, Lyon and Dijon had par�cipated in the contest.
Dijon was chosen as the first 'City of Gastronomy', and is scheduled to open in 2018. Dijon will specialize in
oenology. Another loca�on, Paris-Rungis, which is purportedly the loca�on of the largest wholesale food
market in the world, will specialize in interna�onal “farm to table” value-chains.
Source: Second Global Report on Gastronomy Tourism, UNWTO
Table 20: Impact of Food Tourism Marke�ng
Type of Impact Per cent of
Respondents Promo�ng food tourism increased our posi�ve media coverage 77.2% Promo�ng food tourism had an impact on increasing our website traffic 65.0%
Promo�ng food tourism increased our income from this kind of tourism 59.5%
Promo�ng food tourism increased sales at food-related businesses 52.5%
Promo�ng food tourism increased bookings from tourists interested in food 44.0%
Promo�ng food tourism had no impacts at all 14.0%
Source: UNWTO
The Government of India has undertaken several food
promo�on campaigns in the past, including the
'Incredible Tiffin' ini�a�ve. It could a�empt to use
innova�ve promo�on ini�a�ves used by other
countries. In Korea, for example, a group of young
Koreans undertook a promo�on campaign for a well-
known Korean dish, Bibimap. Known as the
“Bibimbab Backpackers”, this group travelled to over
20 ci�es in 15 countries on a 255-day trip to cook
bibimbap. The campaign started in 2011 and was
mostly paid for by the Agriculture Ministry and a
major Bibimbap chain. They served over 9,000 bowls
of bibimbap at 100 events at universi�es and other
places, and received domes�c and interna�onal
media coverage. Similar project was undertaken by a
group of Turkish volunteers, who started the “Turkish
Coffee Truck” ini�a�ve to promote Turkish coffee
culture across the USA. In 2012, a group of volunteers
travelled to five ci�es in the USA to spark interest in
Turkish culture, as also enhancing rela�ons between
the two countries. The programme was sponsored by
a coffee company, the American-Turkish Business
Associa�on, and the Ministry of Culture and Tourism
Indian Tourism Industry : Exploring Opportuni�es for Enhancing Growth

50
of Turkey. Similar programme could be sponsored by
the Indian government. Such an ini�a�ve will also
help in dissipa�ng the nega�ve percep�on about
Indian food being greasy, spicy and unhealthy.
TAPPING THE CHINESE OUTBOUND TRAVEL
MARKET
China had the highest tourist expenditure in 2017,
registering a CAGR of 24.7 per cent during the period
2010-2017. In fact, more than half of the absolute
growth in global travel and tourism spending over the
past seven years has come from China alone. It is also
encouraging that nearly 67 per cent of the Chinese
tourists had travelled to other Asian countries or
regions in 2017. Clearly, there is need for targe�ng the
outward tourist market of China.
Recognizing the poten�al for visitor exports from
China, India has already taken several steps to a�ract
Chinese tourists. For example, the Government of
India has liberalised its visa norms for Chinese
na�onals. Recently, e-visa facility has been extended
to Chinese na�onals for conference and medical
purposes.
While ease of visa procedure is a clear driver for
tourism growth, interna�onal direct flights are
another important factor for market growth. The
number of travellers from Shanghai to Mauri�us
increased fourfold upon launch of the Shanghai-Kuala
Lumpur- Port Louis route. The passenger traffic
further increased from 4000 in 2012 to more than
10,000 in the following year when a non-stop flight
was started between Shanghai and Mauri�us. Other
than Beijing, Shanghai and Guangzhou, there are
several other less developed ci�es which are now
connected by interna�onal flights. In fact, in 2015,
nearly two-third of the new air routes between China
and Thailand, and nearly half of the Sino-Japan new
routes departed from inland ci�es¹³.
In case of India-China route, carriers from each side
are allowed to operate 42 flights a week. According to
latest available es�mates, while the Chinese carriers
have used up to about 93 per cent of the quota, Indian
carriers have used only 12 per cent of the quota.
There is a need to encourage airlines to fly more
flights on these routes, given the increasing outbound
travel from the Chinese market.
MANAGING OVERCROWDING FOR SUSTAINABLE
TOURISM
The environment, society, and aesthe�cs of many
tourist des�na�ons are rendered vulnerable by their
own popularity. This could be in the form of an
environmental degrada�on, threat to cultural
heritage, overuse of infrastructure, displacement of
local popula�on, or deteriora�on in tourist
experience. To counter these challenges, economies
are increasingly focusing on sustainability aspect of
tourism. World Tourism Organiza�on defines
sustainable tourism as sa�sfying current tourist and
host community needs, while protec�ng and
improving future opportuni�es . I t enta i l s
management of all resources in a way that economic,
social, and aesthe�c needs are met, and cultural
integrity, essen�al ecological processes, biological
diversity, and life support systems are maintained.
India needs to adopt strategies which promote
sustainable tourism, with overcrowding emerging as
the major challenge on this front. The tourist
experience in several heritage sites of India is
deteriora�ng on account of long queues and
crowding. The infrastructure in several ci�es has
also not been able to keep pace with the tourism
demand. In Jaisalmer for example, tourism witnessed
strong growth and contributed to the economic
development of the area, but the sewage system in
the city was not able to match the growing
requirement, and posed a threat to the integrity of
the city's classical sandstones¹⁴.
There is also evidence of environment threats in some
of the key tourism sites of India. According to Report
of Working Group II on Sustainable Tourism in the
¹³UNWTO (2017), Penetra�ng the Chinese Outbound Tourism Market – Successful Prac�ces and Solu�ons ¹⁴McKinsey and Company. (2017). Coping with Success: Managing Overcrowding in Tourism Des�na�ons.
Indian Tourism Industry : Exploring Opportuni�es for Enhancing Growth
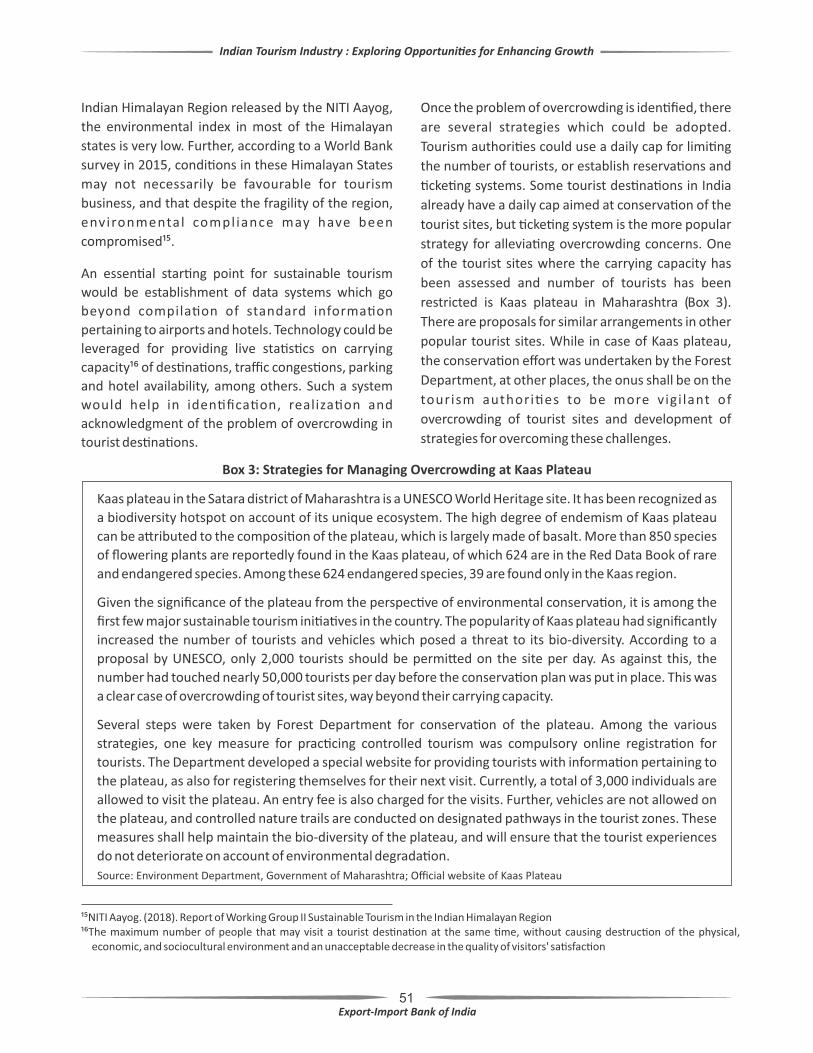
51
Indian Himalayan Region released by the NITI Aayog,
the environmental index in most of the Himalayan
states is very low. Further, according to a World Bank
survey in 2015, condi�ons in these Himalayan States
may not necessarily be favourable for tourism
business, and that despite the fragility of the region,
environmental compl iance may have been
compromised¹⁵.
An essen�al star�ng point for sustainable tourism
would be establishment of data systems which go
beyond compila�on of standard informa�on
pertaining to airports and hotels. Technology could be
leveraged for providing live sta�s�cs on carrying
capacity¹⁶ of des�na�ons, traffic conges�ons, parking
and hotel availability, among others. Such a system
would help in iden�fica�on, realiza�on and
acknowledgment of the problem of overcrowding in
tourist des�na�ons.
Once the problem of overcrowding is iden�fied, there
are several strategies which could be adopted.
Tourism authori�es could use a daily cap for limi�ng
the number of tourists, or establish reserva�ons and
�cke�ng systems. Some tourist des�na�ons in India
already have a daily cap aimed at conserva�on of the
tourist sites, but �cke�ng system is the more popular
strategy for allevia�ng overcrowding concerns. One
of the tourist sites where the carrying capacity has
been assessed and number of tourists has been
restricted is Kaas plateau in Maharashtra (Box 3).
There are proposals for similar arrangements in other
popular tourist sites. While in case of Kaas plateau,
the conserva�on effort was undertaken by the Forest
Department, at other places, the onus shall be on the
tourism authori�es to be more vigi lant of
overcrowding of tourist sites and development of
strategies for overcoming these challenges.
¹⁵NITI Aayog. (2018). Report of Working Group II Sustainable Tourism in the Indian Himalayan Region¹⁶The maximum number of people that may visit a tourist des�na�on at the same �me, without causing destruc�on of the physical,
economic, and sociocultural environment and an unacceptable decrease in the quality of visitors' sa�sfac�on
Box 3: Strategies for Managing Overcrowding at Kaas Plateau
Kaas plateau in the Satara district of Maharashtra is a UNESCO World Heritage site. It has been recognized as
a biodiversity hotspot on account of its unique ecosystem. The high degree of endemism of Kaas plateau
can be a�ributed to the composi�on of the plateau, which is largely made of basalt. More than 850 species
of flowering plants are reportedly found in the Kaas plateau, of which 624 are in the Red Data Book of rare
and endangered species. Among these 624 endangered species, 39 are found only in the Kaas region.
Given the significance of the plateau from the perspec�ve of environmental conserva�on, it is among the
first few major sustainable tourism ini�a�ves in the country. The popularity of Kaas plateau had significantly
increased the number of tourists and vehicles which posed a threat to its bio-diversity. According to a
proposal by UNESCO, only 2,000 tourists should be permi�ed on the site per day. As against this, the
number had touched nearly 50,000 tourists per day before the conserva�on plan was put in place. This was
a clear case of overcrowding of tourist sites, way beyond their carrying capacity.
Several steps were taken by Forest Department for conserva�on of the plateau. Among the various
strategies, one key measure for prac�cing controlled tourism was compulsory online registra�on for
tourists. The Department developed a special website for providing tourists with informa�on pertaining to
the plateau, as also for registering themselves for their next visit. Currently, a total of 3,000 individuals are
allowed to visit the plateau. An entry fee is also charged for the visits. Further, vehicles are not allowed on
the plateau, and controlled nature trails are conducted on designated pathways in the tourist zones. These
measures shall help maintain the bio-diversity of the plateau, and will ensure that the tourist experiences
do not deteriorate on account of environmental degrada�on.
Indian Tourism Industry : Exploring Opportuni�es for Enhancing Growth
Source: Environment Department, Government of Maharashtra; Official website of Kaas Plateau

52
CONCLUSION
Tourism is the world's third largest export sector, and
accounts for nearly 10.4 per cent of the global GDP
and 9.9 per cent of the global employment. It also
plays a significant role in the domes�c economy of
India, accoun�ng for nearly 9.4 per cent of GDP, 8 per
cent of employment, 6.3 per cent of investment, and
5.8 per cent of total exports in 2017. The domes�c
tourism industry has witnessed consistent growth in
the recent period, and is expected to be among the
top ten fastest growing des�na�ons for leisure-travel
spending during the period 2016-2026.
The growth in tourism earnings can be a�ributed to
the recovery in key tourism markets, posi�ve
ini�a�ves taken by the central and state
governments, and the resultant improvement in
compe��veness of India's travel and tourism sector.
In fact, India's rank has improved by 12 places on the
Travel and Tourism Compe��veness Index during the
2015-2017 period.
While the growth in the sector is encouraging, several
challenges plague the domes�c tourism industry.
Allevia�on of these challenges will be essen�al for
the industry to realize its full poten�al. Some of the
strategies which can be adopted are ra�onaliza�on of
taxa�on rates; providing incen�ves at the state level
for FDI in the tourism sector; according infrastructure
status to hotel projects above Rs. 25 crore; organising
road shows in the iden�fied opportunity markets of
the USA, Australia, Brazil, Thailand, Poland, Israel and
Nigeria; providing fiscal incen�ves for encouraging
interna�onal accredita�on of hospitals; encouraging
facilitators in the medical tourism space; improving
accessibility of public buildings and transport;
launching of innova�ve schemes for travel insurance;
building India's image as a culinary tourism
des�na�on by inclusion of food culture in UNESCO
intangible cultural world heritage; developing food
tourism projects; tapping the Chinese outbound
market which has witnessed remarkable growth in
the recent period; and managing overcrowding in key
tourist des�na�ons.
Indian Tourism Industry : Exploring Opportuni�es for Enhancing Growth

53
Indian Tourism Industry : Exploring Opportuni�es for Enhancing Growth
Annexure: Types and Descrip�on of Incen�ves provided by the Government of U�ar Pradesh for Tourism Infrastructure Development
New Sports
Resort
1
10%
1
Only on
Equipment cost
Fiscal Incen�ves
New Tented
Accommoda�on
0.2 20% 0.5
Only on
successful
permanent
installa�on
New Wellness
Centre
2-50
15%
7.5
>50
15%
10
New
Conven�on
Centre
Up to 50
15%
7.5
>50
15%
10
Adventure
Tourism, Cruise
Tourism,
Houseboat
1
10%
1
Crea�on of
Infrastructure &
installa�on of
permanent
facility
Light and
Sound/ Laser
Show
1
25%
2.5
Investment in
equipment cost
only
New Theme
Park
2
10%
1
Crea�on of
infrastructure
along with
installa�on of
equipment
Eligible capital
investment
(except land
cost)
Capital
investment
(In Rs. Cr.)
Percentage
of subsidy
against fixed
capital
investment
Minimum
ceiling of
subsidy
(In Rs. Cr.)
Other Condi�ons
Establishment
of New Hotel
10-50
15%
7.5
>50
15%
10
Establishment
of New Budget
Hotel
2-10
15%
1.5
Loca�on where
10 units are
eligible
2-10
20%
1.75 Loca�on where 5
units are eligible
New Resort
10-50
15%
7.5
>50
15%
10

54
Interest Subsidy to
eligible tourism
units in tourism
circuits
If bank loan amount is not more than Rs 5 Crs., interest subsidy is to be awarded
at the rate of 5% of the loan amount, with maximum amount of Rs. 25 lakhs/
annum
Stamp duty
exemp�on
Eligible Tourism Units qualify for 100% exemp�on of stamp duty and registra�on
fee on sale/ lease/ transfer of land
Conversion and
land development
charges
Land Use Conversion and development charges is waived off for all new tourism
units
Support for
sustainable tourism
for carrying out
energy audit
Assistance is provided to eligible units up to 75 per cent of the cost of carrying
out Energy Audit by recognized ins�tu�ons
Note: Units in Ramayana Circuit, Braj Circuit, Buddhist Circuit, Wildlife Eco – Tourism Circuit, Bundelkhand Circuit, Mahabharat Circuit, Shak� Peeth Circuit, Aadhyatmmik Circuit, Sufi / Kabir Circuit, Jain Circuit are eligible for these incen�ves Source: U�ar Pradesh - A new growth driver of tourism investment in India, FICCI, August 2018
Indian Handloom Industry: Poten�al and Prospects

55
About Exim Bank's Working Paper Series
As part of its endeavour in enriching the knowledge of Indian exporters and thereby to enhance their compe��veness, Exim Bank periodically conducts research studies. These research studies are broadly categorized into three segments, viz. sector studies, country studies and macro-economic related analysis. These studies are published in the form of Occasional Papers, Working Papers and Books. The research papers that are brought out in the form of Working Papers are done with swi� analysis and data colla�on from various sources. The research papers under the series provide an analy�cal overview on various trade and investment related issues.
Working Paper No. 44 Turkey: A Study of India's Trade and Investment Poten�al, October 2015Working Paper No. 45 Enhancing India's Trade Rela�ons with Africa: A Brief Analysis, October
2015Working Paper No. 46 Indian Leather Industry: Perspec�ve and Strategies, November 2015Working Paper No. 47 Make in India for the World: Realizing Export Poten�al of Railways,
December 2015Working Paper No. 48 Export from West Bengal: Poten�al and Strategy, January 2016Working Paper No. 49 Act East: Enhancing India's Engagements with Cambodia, Lao PDR,
Myanmar, Vietnam (CLMV), January 2016Working Paper No. 50 Focus Africa: Enhancing India's Engagements with Southern African
Development Community (SADC), March 2016Working Paper No. 51 India's Service Sector - An Analysis, March 2016Working Paper No. 52 Defence Equipment Industry: Achieving Self-Reliance and Promo�ng
Exports, March 2016Working Paper No. 53 Interna�onal Solar Alliance: Nurturing Possibili�es, March 2016Working Paper No. 54 India-Africa Healthcare Coopera�on: Way Forward, May 2016Working Paper No. 55 Sustainable Investment Opportuni�es in Africa: Prospects for BRICS,
October 2016Working Paper No. 56 Intra-BRICS Trade: An Indian Perspec�ve, October 2016Working Paper No. 57 Enhancing India's Ties with Middle East and North Africa (MENA), October
2016Working Paper No. 58 Enhancing India's Trade Rela�ons with La�n America and the Caribbean
(LAC) Region: Focus on Select Countries, November 2016Working Paper No. 59 The Indian Automo�ve Industry: An Interna�onal Trade Perspec�ve,
February 2017Working Paper No. 60 India's Investments in Select East African Countries: Prospects and
Opportuni�es, March 2017Working Paper No. 61 Interna�onal Trade in Processed Food: An Indian Perspec�ve, March 2017Working Paper No. 62 Machinery Sector in India: Exploring Op�ons for Neutralizing Trade Deficit,
March 2017Working Paper No. 63 Feed Africa : Achieving Progress through Partnership, May 2017Working Paper No. 64 Water, Sanita�on and Healthcare in Africa: Enhancing Facility, Enabling
Growth, May 2017Working Paper No. 65 Integrate Africa: A Mul�dimensional Perspec�ve, May 2017Working Paper No. 66 Manufacturing in Africa: A Roadmap for Sustainable Growth, May 2017Working Paper No. 67 Power Sector in Africa: Prospect and Poten�al, May 2017Working Paper No. 68 Indian Investments in East Africa: Recent Trends and Prospects, November
2017Working Paper No. 69 Trade in Environmental Goods: A Perspec�ve, December 2017
Previous Working Papers brought out by Exim Bank
Indian Tourism Industry : Exploring Opportuni�es for Enhancing Growth
56
Working Paper No. 70 Oil Price and Interna�onal Trade in Petroleum Crude and Products: An Indian Perspec�ve, January 2018
Working Paper No. 71 Revitalising Trade Finance: Development Banks and Export Credit Agencies at the Vanguard, February 2018
Working Paper No. 72 Connec�ng Africa: Role of Transport Infrastructure, March 2018Working Paper No. 73 Pharmaceu�cal Industry: Regulatory Landscape and Opportuni�es for
Indian Exporters, March 2018Working Paper No. 74 Indo-Sri Lanka Trade and Investment Rela�ons: Current Trends and
Prospects, March 2018Working Paper No. 75 Indian Investments in La�n America and Caribbean- Trends and Prospects,
March 2018Working Paper No. 76 Enhancing India's Engagement in Healthcare Sector of CLMV Countries,
May 2018Working Paper No. 77 Enhancing India’s Trade with Bangladesh and Myanmar across BorderWorking Paper No. 78 Export Strategy for Madhya PradeshWorking Paper No. 79 India-Russia Trade Rela�ons: Recent Trends and Poten�alWorking Paper No. 80 Indian Handloom Industry: Poten�al and Prospects, September 2018Working Paper No. 81 India- LAC Trade: Recent Trends and Opportuni�es in Select Countries,
September 2018Working Paper No. 82 Indian Investments in West Africa: Recent Trends and Prospects, October
2018Working Paper No. 83 Enhancing Exports of Technical Tex�les, December 2018
Indian Tourism Industry : Exploring Opportuni�es for Enhancing Growth

IND
IAN
TOU
RISM
IND
USTR
Y : EX
PLO
RIN
G O
PP
OR
TUN
ITIES FOR
ENH
AN
CIN
G G
RO
WTH


![Û Índice[es ]Instruccion es de uso - BSH CDN Service](https://static.fdokumen.com/doc/165x107/63237c2c117b4414ec0c583b/u-indicees-instruccion-es-de-uso-bsh-cdn-service.jpg)