Indian Fiscal Scenario: When will the domestic growth pick-up
164
www.plindia.com | www.majorgainz.com October to December 2013 India Strategy & Quarterly Report Indian Fiscal Scenario: When will the domestic growth pick-up
-
Upload
khangminh22 -
Category
Documents
-
view
4 -
download
0
Transcript of Indian Fiscal Scenario: When will the domestic growth pick-up

www.plindia.com | www.majorgainz.com
October to December 2013
India Strategy & Quarterly Report
Indian Fiscal Scenario: When will the domestic growth pick-up

Oct-Dec 2013 Earnings Preview
January 09, 2014 2
THIS PAGE IS INTENTIONALLY LEFT BLANK

Oct-Dec 2013 Earnings Preview
January 09, 2014 3
Contents Page No.
India Strategy ..................................................................................... 5
Agri Products & Chemcials ............................................................... 25
Automobiles ..................................................................................... 36
Auto Ancillary ................................................................................... 45
Banks ................................................................................................ 51
Capital Goods ................................................................................... 72
Cement ............................................................................................. 86
Consumer ......................................................................................... 92
Information Technology ................................................................. 105
Metals & Mining ............................................................................ 117
Pharmaceuticals ............................................................................. 128
Power ............................................................................................. 139
Others ............................................................................................ 150
Annexure ........................................................................................ 152
(All prices as on January 08, 2014)
Prabhudas Lilladher Pvt. Ltd. and/or its associates (the 'Firm') does and/or seeks to do business with companies covered in its research reports. As a result investors should be aware that the Firm may have a conflict of interest that could affect the objectivity of the report. Investors should consider this report as only a single factor in making their investment decision.
Please refer to important disclosures and disclaimers at the end of the report

Oct-Dec 2013 Earnings Preview
January 09, 2014 4
THIS PAGE IS INTENTIONALLY LEFT BLANK

Oct-Dec 2013 Earnings Preview
January 09, 2014 5
R Sreesankar [email protected] +91-22-6632 2214
India Strategy
Indian Fiscal Scenario: When will the domestic growth pick‐up?
Q3 FY14 PL’s Coverage Universe Earnings Preview
The revenue growth for all the companies in the PL Universe is estimated at 12.3% YoY and the EBITDA is expected to lead the topline growth at 15.9% YoY. Information Technology, Pharmaceuticals, Power, Auto and Auto Ancillary are the sectors leading the expansion in margins.
Sector‐wise growth and margin expectations – Q3FY14 PL estimates
Revenue (%) PAT (%) EBITDA Margin (bps)
YoY QoQ YoY QoQ YoY QoQ
Agri Products & Chemicals 5.1 (8.2) 20.1 (9.7) 113 8
Automobiles 13.6 4.0 40.5 (9.1) 163 (130)
Auto Ancillary 11.4 3.3 40.1 (2.3) 248 25
Banks 14.2 3.5 (3.0) 9.1
Capital Goods 2.0 7.5 (13.9) 18.9 (162) 139
Cement (3.4) 5.7 (30.6) 32.7 (238) 133
Consumer Staples 10.3 7.7 11.5 7.7 48 (27)
Financial Services 17.0 2.8 10.7 0.8
Information Tech. 24.7 2.4 27.4 2.8 195 35
Metals 13.9 2.5 29.4 30.3 190 236
Pharma 20.5 2.9 38.8 (12.1) 253 (18)
Power 4.5 2.0 5.4 (4.3) 74 (106)
Others 17.5 0.2 4.3 (9.8) (302) (339)
PL Universe 12.3 3.3 14.4 6.1 74 38
Source: Company Data, PL Research *EBITDA Margins are excluding BFSI
In our report dated December 9, 2014, we have recommended a portfolio with a defensive bias and we continue with the same defensive bias now as well. Our portfolio preference continue to be with IT, FMCG and Healthcare being the favoured ones. We have added both L&T and Crompton Greaves (buy on declines on December 9, 2013 report) in our top picks following the sharp price corrections and also reflecting the view that we have. We still continue see political stability as the main catalyst for a kickstart in dometsic growth and till the time we see a clarity, we expect to see the domestic growth stutter and hence a defensive stance.
Oct-Dec 2013 Earnings Preview
January 09, 2014 6
The small and mid cap stocks have been having a good run for the last few weeks. This has been mainly on the back of fictional news rather than factual news flow. On a 12 month basis, The BSE small cap index fell 12.8% against a gain of 1.6% in the BSE 100 index. However, we believe that some of the stocks in the small mid cap sector looks attarctive and warrants a closer look.
We estimate a stronger growth of 16.9% in FY15. While we expect 1QFY15 to be muted on account of parliament elections, the major growth is expected to come from the remaining three quarters. This growth is expected to be spread across the sectors excluding cement, which we feel may take time to recover as the surplus supply keeps the cement prices subdued.
Q3 FY14 Nifty Earnings Preview
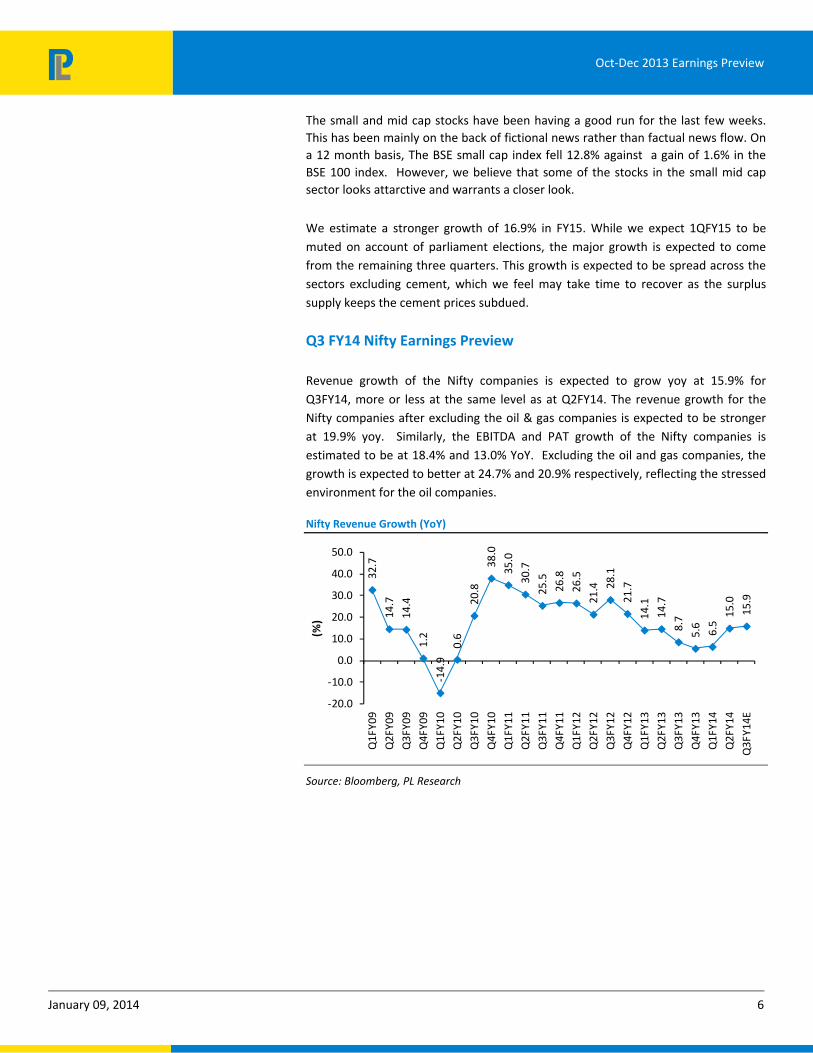
Revenue growth of the Nifty companies is expected to grow yoy at 15.9% for Q3FY14, more or less at the same level as at Q2FY14. The revenue growth for the Nifty companies after excluding the oil & gas companies is expected to be stronger at 19.9% yoy. Similarly, the EBITDA and PAT growth of the Nifty companies is estimated to be at 18.4% and 13.0% YoY. Excluding the oil and gas companies, the growth is expected to better at 24.7% and 20.9% respectively, reflecting the stressed environment for the oil companies.
Nifty Revenue Growth (YoY)
32.7
14.7
14.4
1.2
-14.
90.
620
.838
.035
.030
.725
.526
.826
.521
.4 28.1
21.7
14.1
14.7
8.7
5.6
6.5
15.0
15.9
-20.0
-10.0
0.0
10.0
20.0
30.0
40.0
50.0
Q1F
Y09
Q2F
Y09
Q3F
Y09
Q4F
Y09
Q1F
Y10
Q2F
Y10
Q3F
Y10
Q4F
Y10
Q1F
Y11
Q2F
Y11
Q3F
Y11
Q4F
Y11
Q1F
Y12
Q2F
Y12
Q3F
Y12
Q4F
Y12
Q1F
Y13
Q2F
Y13
Q3F
Y13
Q4F
Y13
Q1F
Y14
Q2F
Y14
Q3F
Y14E
(%)
Source: Bloomberg, PL Research

Oct-Dec 2013 Earnings Preview
January 09, 2014 7
Nifty EBITDA Growth (YoY)
35.4
18.3
1.9
12.6
-7.7
2.0
20.4 23
.9 31.9 40
.430
.727
.415
.56.
7 10.9 14
.85.
513
.35.
25.
4 11.7
8.7
18.4
-20.0
-10.0
0.0
10.0
20.0
30.0
40.0
50.0
Q1F
Y09
Q2F
Y09
Q3F
Y09
Q4F
Y09
Q1F
Y10
Q2F
Y10
Q3F
Y10
Q4F
Y10
Q1F
Y11
Q2F
Y11
Q3F
Y11
Q4F
Y11
Q1F
Y12
Q2F
Y12
Q3F
Y12
Q4F
Y12
Q1F
Y13
Q2F
Y13
Q3F
Y13
Q4F
Y13
Q1F
Y14
Q2F
Y14
Q3F
Y14E
(%)
Source: Bloomberg, PL Research
Nifty PAT Growth (YoY)
12.6
5.0
1.7
15.2
-12.
1
-18.
0
2.5
15.9
29.6
59.1
42.0
30.6
10.5
2.6 10
.4 21.0
2.7
26.5
3.2
1.8 11
.9
0.9
13.0
-30.0-20.0-10.0
0.010.020.030.040.050.060.070.0
Q1F
Y09
Q2F
Y09
Q3F
Y09
Q4F
Y09
Q1F
Y10
Q2F
Y10
Q3F
Y10
Q4F
Y10
Q1F
Y11
Q2F
Y11
Q3F
Y11
Q4F
Y11
Q1F
Y12
Q2F
Y12
Q3F
Y12
Q4F
Y12
Q1F
Y13
Q2F
Y13
Q3F
Y13
Q4F
Y13
Q1F
Y14
Q2F
Y14
Q3F
Y14E
(%)
Source: PL Research
Domestic economy
In the last six months, the trade deficit has been brought under US$10bn a month. While India’s exports have been hovering around the US$24.6bn levels in Nov 13, the non oil, non gold/silver imports have declined to yearly low of US$19.8 bn. While this has helped to arrest the trade deficit to a sub US$10bn level in Nov 13, any improvements in the domestic economy could result in further increase in the trade deficit numbers. Various measures implemented has resulted in the reduction of the current account deficit to US$5.1bn

Oct-Dec 2013 Earnings Preview
January 09, 2014 8
Trade Deficit
(US$ m) May'13 Jun'13 Jul'13 Aug'13 Sep'13 Oct'13 Nov'13 YTD
Exports 23,969 23,593 25,834 26,182 27,679 27,270 24,613 203,990
Imports 44,673 35,901 38,103 36,715 34,440 37,820 33,833 303,892
‐ Oil 15,060 12,730 12,731 15,095 13,197 15,131 12,965 111,059
‐ Gold & Silver 8,383 2,388 2,972 1,004 803 1,300 1,050 25,314
‐ Non Oil Non Gold/Silver 21,230 20,783 22,400 20,616 20,440 21,390 19,818 167,158
Trade Deficit (20,704) (12,308) (12,268) (10,534) (6,760) (10,550) (9,220) (99,902)
Source: RBI, PL Research
India’s Balance of Payments
(US$ m) Q1FY13 Q2FY13 Q3FY13 Q4FY13 Q1FY14 Q2FY14 YoY QoQ
1. Current Account (16,932) (20,976) (31,857) (18,078) (21,772) (5,153) ‐75% ‐76%
Goods and Services (28,868) (31,465) (41,732) (28,676) (33,616) (14,934) ‐53% ‐56%
Goods (43,849) (47,793) (58,378) (45,635) (50,484) (33,305) ‐30% ‐34%
Services 14,982 16,328 16,645 16,960 16,868 18,372 13% 9%
Primary Income (4,889) (5,581) (5,800) (5,185) (4,830) (6,322) 13% 31%
Secondary Income 16,825 16,070 15,675 15,783 16,675 16,103 0% ‐3%
2. Capital Account (218) (248) 22 150 767 (65) ‐74% ‐108%
3. Financial Account 16,070 20,999 30,754 17,626 20,076 5,028 ‐76% ‐75%
Net errors and omissions 1,080 226 1,081 302 929 190 ‐16% ‐79%
Source: RBI, PL Research
Capital Accounts & Finance Account
(US$ m) Q2FY13 Q3FY13 Q4FY13 Q1FY14 Q2FY14 YoY QoQ
Net FDI 8,159 2,106 5,733 6,495 6,889 ‐16% 6%
Net FII (Equity+Debt) 7,718 9,781 11,314 (225) (6,602) ‐186% NA
Net Overseas borrowings by Banks 2,645 2,592 (6,366) 4,783 (6,634) ‐351% ‐239%
Net ECBs (321) (160) 38 427 180 ‐156% ‐58%
Net Short term credit to India 4,133 7,678 4,468 2,451 (1,862) ‐145% ‐176%
NRI Deposits 2,846 2,651 2,794 5,497 8,340 193% 52%
Net inflows under Capital & Finance account 20,745 31,470 20,549 20,514 (5,375) ‐126% ‐126%
Source: RBI, PL Research
As we enter the New Year 2014, there is nothing in the ground that brings cheer to the economy. The demand growth seems to be subsiding, indicated by the falling price in cement across the regions, lacklustre demand in steel, aluminium, automobiles etc. We expect the first quarter of CY 2014 to be faced with head winds on the domestic front and no significant changes are expected in the near term. While the immediate worry on the CAD front seems to have been addressed, containing the fiscal deficit seems to be a challenge especially on account of lower than expected revenue mobilizations. The desire to keep the fiscal deficit at less than 4.8% of GDP could result in lower plan expenditure. In our view, this could even lead to a weak quarter performance for the domestic focused companies.
Oct-Dec 2013 Earnings Preview
January 09, 2014 9
Trends in Tax Receipts
Tax Revenue (Rs bn) Upto
Nov'12 Upto
Nov'13 % YoY
Budget Est (FY14)
% to total Budget Est.
Corporate Tax 1,630 1,817 11% 4,195 43%
Income Tax 1,053 1,269 21% 2,476 51%
Customs 1,048 1,100 5% 1,873 59%
Union Excise Duties 941 883 ‐6% 1,976 45%
Service Tax 715 839 17% 1,801 47%
Other Tax 57 63 9% 37 169%
Gross Tax Revenue 5,445 5,970 10% 12,359 48%
Surcharges 23 26 11% 48 54%
Assignment to states 1,725 1,983 15% 3,470 57%
Net Tax Revenue 3,696 3,962 7% 8,841 45%
Source: Controller General of Accounts – Ministry of Finance, PL Research
Trends in Disinvestment, Sale of Minority Stakes and Telecom Auction Proceeds
(Rs bn) Upto
Nov'13 Budget Est
(FY14) % to total Budget Est.
Divestment of Govt Holding in Equity 15.89 400 4%
Sale of shares in non-government companies or SUUTI 0 158 0%
Telecom proceeds from spectrum auction 0 200 0%
Source: Controller General of Accounts – Ministry of Finance, PL Research
Trends in Subsidy Expenditure
(Rs bn) Upto
Nov'12 Upto
Nov'13 % YoY
Budget Est (FY14)
% to total Budget Est.
Non-Plan Expenditure 6243 7302 17% 11100 66%
-Dept. of Fertilizers 552 530 ‐4% 660 80%
-Dept. of Food & PDS 726 853 17% 908 94%
-Dept. of Petroleum & Gas 403 549 36% 651 84%
Source: Controller General of Accounts – Ministry of Finance, PL Research
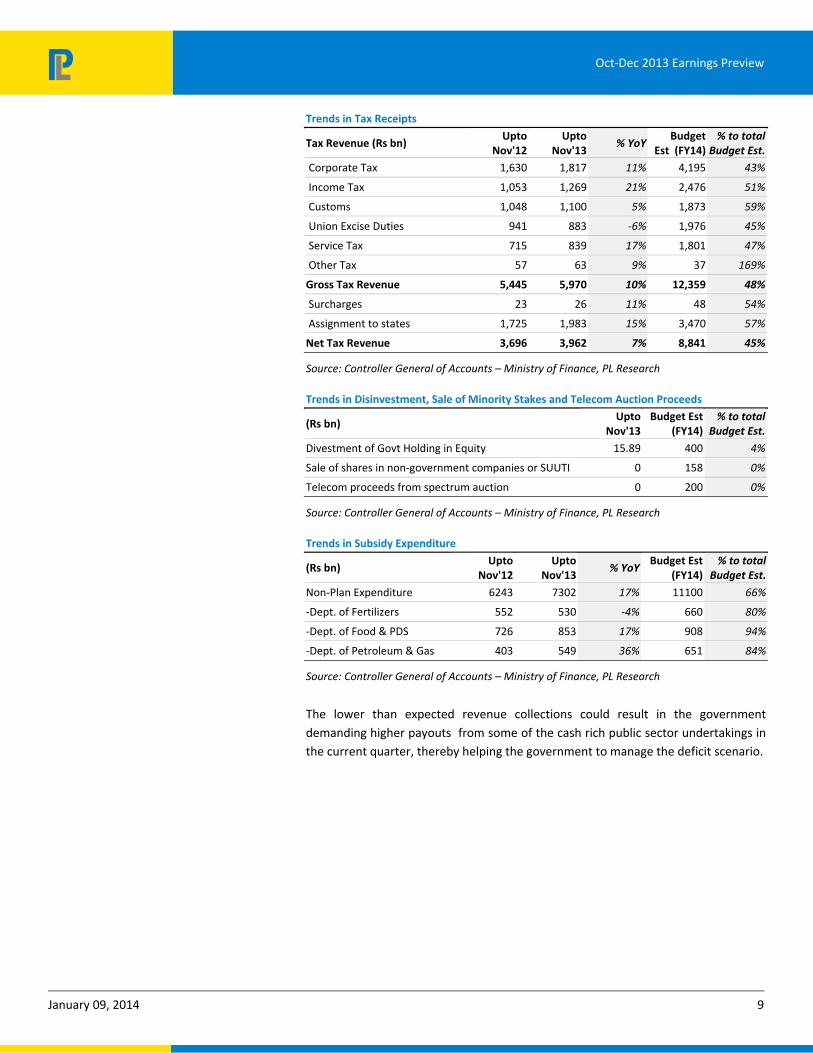
The lower than expected revenue collections could result in the government demanding higher payouts from some of the cash rich public sector undertakings in the current quarter, thereby helping the government to manage the deficit scenario.

Oct-Dec 2013 Earnings Preview
January 09, 2014 10
Inflation, will it start to recede?
Inflation has been on an elevated level for the last six months at both the WPI and the CPI levels. While the WPI was up 7.52%, the component of Food inflation is up 19.93% yoy. In the same period, while the CPI was up at 11.2%, the food inflation too was high at 14.5%. The high levels of inflation have been one of the reasons for the elevated interest rates. On the CPI front, Food constitutes 49% of the weightage and within food articles, vegetables constitute only 5.4%. Though, of late, we have seen a correction in the prices of vegetables, we do not believe that this will be sufficient to result reversal of the elevated inflation levels as all other food components have seen an increase. Hence we continue to believe that the short term interest rates are likely to remain at elevated levels.
WPI Inflation
7.31
%
7.31
%
7.28
%
5.65
%
4.77
%
4.58
% 5.16
% 5.85
%
6.99
%
7.05
%
7.00
%
7.52
%
4.0%4.5%5.0%5.5%6.0%6.5%7.0%7.5%8.0%
Dec
12
Jan
13
Feb
13
Mar
13
Apr
13
May
13
Jun
13
Jul 1
3
Aug
13
Sep
13
Oct
13
Nov
13
Source: Ministry of Commerce & Industry
Food Article
10.6
9%
12.1
7%
11.9
5%
8.63
%
6.08
% 8.25
% 10.2
7% 12.2
9%
19.1
7%
18.4
0%
18.1
9%
19.9
3%
4%6%8%
10%12%14%16%18%20%22%
Dec
12
Jan
13
Feb
13
Mar
…
Apr
13
May
…
Jun
13
Jul 1
3
Aug
…
Sep
13
Oct
13
Nov
…
Source: Ministry of Commerce & Industry
CPI Inflation
10.610.8 10.9
10.4
9.4 9.3
9.99.6 9.5
9.810.2
11.2
8.0
8.5
9.0
9.5
10.0
10.5
11.0
11.5
Dec
-12
Jan-
13
Feb-
13
Mar
-13
Apr
-13
May
-13
Jun-
13
Jul-
13
Aug
-13
Sep-
13
Oct
-13
Nov
-13
Source: CSO

Oct-Dec 2013 Earnings Preview
January 09, 2014 11
CPI Index Basket Weights
Sub group/group Rural Urban Combined (Rural+Urban)
Cereals and products 19.1 8.7 14.6
Pulses and products 3.3 1.9 2.7
Milk and milk products 8.6 6.6 7.7
Oils and fats 4.7 2.9 3.9
Egg, fish and meat 3.4 2.3 2.9
Vegetables 6.6 4.0 5.4
Fruits 1.9 1.9 1.9
Sugar etc 2.4 1.3 1.9
Condiments and spices 2.1 1.2 1.7
Non- alcoholic beverages 2.0 2.0 2.0
Prepared meals etc 2.6 3.2 2.8
Pan, tobacco and Intoxicants 2.7 1.4 2.1
Food, beverages and tobacco 59.3 37.2 49.7
Fuel and light 10.4 8.4 9.5
Clothing and bedding 4.6 3.3 4.1
Footwear 0.8 0.6 0.7
Clothing, bedding and footwear 5.4 3.9 4.7
Housing 22.5 9.8
Education 2.7 4.2 3.4
Medical care 6.7 4.3 5.7
Recreation and amusement 1.0 2.0 1.4
Transport and communication 5.8 9.8 7.6
Personal care and effects 3.1 2.7 2.9
Household requisites 4.5 3.9 4.3
Others 1.1 1.0 1.1
Miscellaneous 24.9 28.0 26.3
All Groups 100 100 100
Source: CSO
Global economy, beginning to come out of the trough
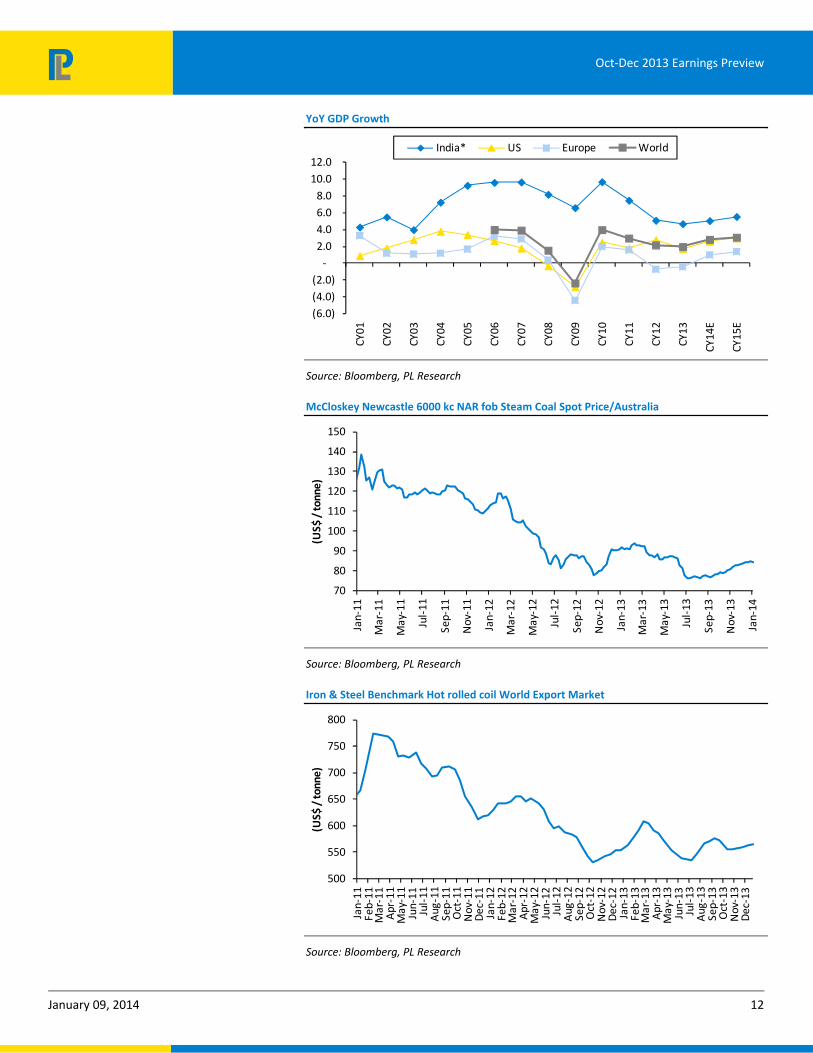
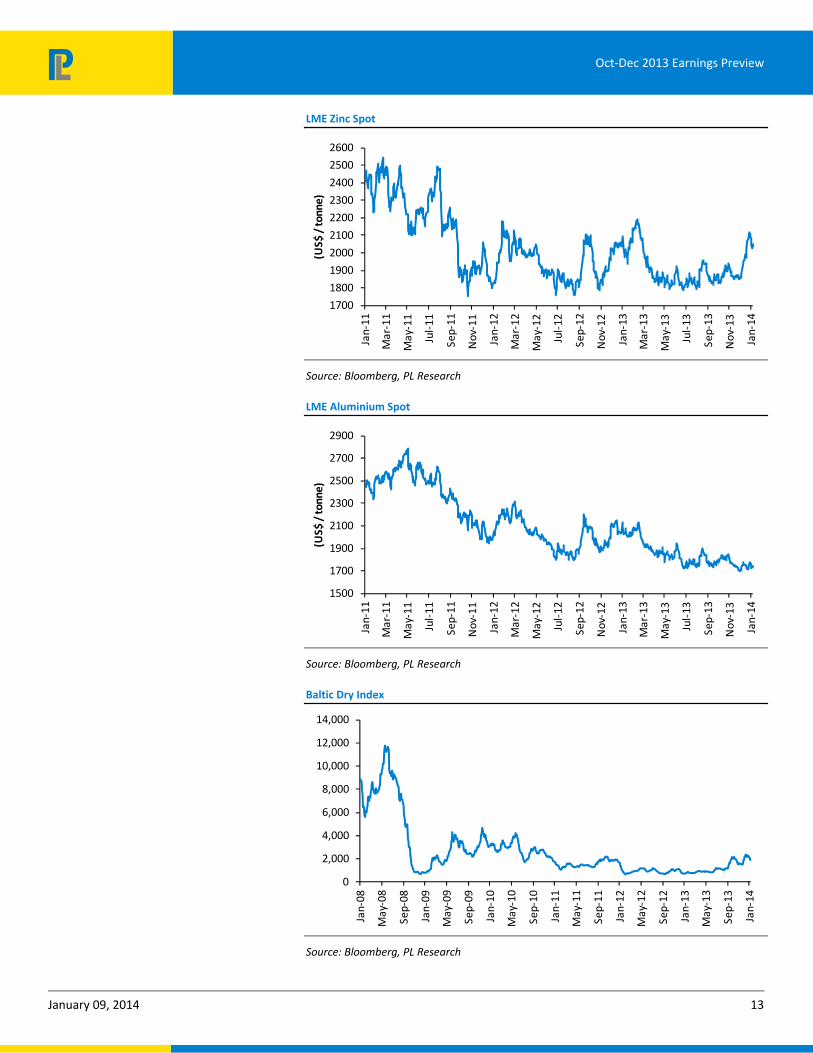
All through 2004-2008, the booming period in Indian economy, apart from the thrust on infrastructure, the Indian economy had the benefit of a strong global economy acting as a tail wind. Both the Euro zone and USA had a strong growth resulting in a boom period for the commodities. These changed during the financial crisis in 2008 and the economies across the globe have been facing challenging times. After long periods of low prices, we believe that the commodity prices have begun to bottom out and with the economic growth seen in both the Eurozone and USA, we have also started to see a recovery in various global commodities. We believe that improving Eurpoean and US economies should result in improvement in global trade, which is already reflected in the firm up in the Baltic Freight Indices (BFI).
Oct-Dec 2013 Earnings Preview
January 09, 2014 12
YoY GDP Growth
(6.0)(4.0)(2.0)
-2.0 4.0 6.0 8.0
10.0 12.0
CY01
CY02
CY03
CY04
CY05
CY06
CY07
CY08
CY09
CY10
CY11
CY12
CY13
CY14
E
CY15
E
India* US Europe World
Source: Bloomberg, PL Research
McCloskey Newcastle 6000 kc NAR fob Steam Coal Spot Price/Australia
70
80
90
100
110
120
130
140
150
Jan-
11
Mar
-11
May
-11
Jul-
11
Sep-
11
Nov
-11
Jan-
12
Mar
-12
May
-12
Jul-
12
Sep-
12
Nov
-12
Jan-
13
Mar
-13
May
-13
Jul-
13
Sep-
13
Nov
-13
Jan-
14
(US$ / tonne)
Source: Bloomberg, PL Research
Iron & Steel Benchmark Hot rolled coil World Export Market
500
550
600
650
700
750
800
Jan-
11Fe
b-11
Mar
-11
Apr
-11
May
-11
Jun-
11Ju
l-11
Aug
-11
Sep-
11O
ct-1
1N
ov-1
1D
ec-1
1Ja
n-12
Feb-
12M
ar-1
2A
pr-1
2M
ay-1
2Ju
n-12
Jul-
12A
ug-1
2Se
p-12
Oct
-12
Nov
-12
Dec
-12
Jan-
13Fe
b-13
Mar
-13
Apr
-13
May
-13
Jun-
13Ju
l-13
Aug
-13
Sep-
13O
ct-1
3N
ov-1
3D
ec-1
3
(US$ / tonne)
Source: Bloomberg, PL Research
Oct-Dec 2013 Earnings Preview
January 09, 2014 13
LME Zinc Spot
1700
1800
1900
2000
2100
2200
2300
2400
2500
2600
Jan-
11
Mar
-11
May
-11
Jul-
11
Sep-
11
Nov
-11
Jan-
12
Mar
-12
May
-12
Jul-
12
Sep-
12
Nov
-12
Jan-
13
Mar
-13
May
-13
Jul-
13
Sep-
13
Nov
-13
Jan-
14
(US$ / tonne)
Source: Bloomberg, PL Research
LME Aluminium Spot
1500
1700
1900
2100
2300
2500
2700
2900
Jan-
11
Mar
-11
May
-11
Jul-
11
Sep-
11
Nov
-11
Jan-
12
Mar
-12
May
-12
Jul-
12
Sep-
12
Nov
-12
Jan-
13
Mar
-13
May
-13
Jul-
13
Sep-
13
Nov
-13
Jan-
14
(US$ / tonne)
Source: Bloomberg, PL Research
Baltic Dry Index
0
2,000
4,000
6,000
8,000
10,000
12,000
14,000
Jan-
08
May
-08
Sep-
08
Jan-
09
May
-09
Sep-
09
Jan-
10
May
-10
Sep-
10
Jan-
11
May
-11
Sep-
11
Jan-
12
May
-12
Sep-
12
Jan-
13
May
-13
Sep-
13
Jan-
14
Source: Bloomberg, PL Research

Oct-Dec 2013 Earnings Preview
January 09, 2014 14
Baltic Dirty Tanker Index
0
500
1,000
1,500
2,000
2,500
Jan-
08
May
-08
Sep-
08
Jan-
09
May
-09
Sep-
09
Jan-
10
May
-10
Sep-
10
Jan-
11
May
-11
Sep-
11
Jan-
12
May
-12
Sep-
12
Jan-
13
May
-13
Sep-
13
Jan-
14
Source: Bloomberg, PL Research
Baltic Clean Tanker Index
0
200
400
600
800
1,000
1,200
1,400
1,600
Jan-
08
May
-08
Sep-
08
Jan-
09
May
-09
Sep-
09
Jan-
10
May
-10
Sep-
10
Jan-
11
May
-11
Sep-
11
Jan-
12
May
-12
Sep-
12
Jan-
13
May
-13
Sep-
13
Jan-
14
Source: Company Data, PL Research
Where to invest in 2014?
Though the first quarter of CY 2014 does not offer any optimism in terms of growth for the economy, it looks like that the improvement in Eurozone and USA should benefit some sectors and some companies specifically. In our view, the obvious beneficiaries seem to be the IT sector which should see a better improvement in traction with fresh IT spending. The players in the health care sector with a focus on US is likely to be more in demand and beneficiaries of global trade, shipping could turn out to be the game changers for the first half of CY 2014.

Oct-Dec 2013 Earnings Preview
January 09, 2014 15
Where do we see Nifty at the end of 2014: In our report dated 08 December 2013, we have given our estimates of the trading range for the Nifty between 5950-6500 levels for the current quarter. While we are yet to see any improvements in the domestic front, the global scenario has started to improve and this could considerably change the outlook for at least some of the sectors which have a direct impact on global trade. However, with the political uncertainty continuing to be a dampener, we estimate the market remaining range bound between 5800-6500 till the political uncertainty is sorted out.
India: FII/DII Equity Flows
(200.00)
(100.00)
-
100.00
200.00
300.00
Jan-
12Fe
b-12
Mar
-12
Apr
-12
May
-12
Jun-
12Ju
l-12
Aug
-12
Sep-
12O
ct-1
2N
ov-1
2D
ec-1
2Ja
n-13
Feb-
13M
ar-1
3A
pr-1
3M
ay-1
3Ju
n-13
Jul-
13A
ug-1
3Se
p-13
Oct
-13
Nov
-13
Dec
-13
DII Net Cash Market FII Net Cash Market
CY12 ‐ Total FII buying Rs1,293.2bn against DII net
selling at Rs-568.9bn
YTD CY13
FII Rs1125.39bnDII Rs-734.64bn
Source: Bloomberg, PL Research

Oct-Dec 2013 Earnings Preview
January 09, 2014 16
Global Equity Markets Performance
Month‐on‐Month
5.4 3.5 3.2 2.8 2.5 1.8 1.3
0.5
(1.0) (1.1) (1.3)(3.1)
(8.6)(10.0)(8.0)(6.0)(4.0)(2.0)
-2.0 4.0 6.0 8.0
Japa
n
Ger
man
y
USA
FTSE
Aus
tral
ia
S&P
Rus
sia
Indo
nesi
a
Bra
zil
S.Ko
rea
Indi
a
Hon
g Ko
ng
Chin
a
(%)
Source: Bloomberg, PL Research
Calendar Year‐to‐date
(1.0)(0.7)
(0.3) (0.2)
(0.7) (0.6)
(2.4)
(1.7)(2.1)
(2.6)
(2.1)
(1.3)
(3.4)(4.0)
(3.5)
(3.0)
(2.5)
(2.0)
(1.5)
(1.0)
(0.5)
-
Japa
n
Ger
man
y
USA
FTSE
Aus
tral
ia
S&P
Rus
sia
Indo
nesi
a
Bra
zil
S.Ko
rea
Indi
a
Hon
g Ko
ng
Chin
a
(%)
Source: Bloomberg, PL Research
Year‐on‐Year
53.4
23.3 24.0
11.3 13.3
26.1
(0.4) (4.5)
(17.5)
(2.0)
5.0
(0.5)(10.2)
(30.0)(20.0)(10.0)
-10.0 20.0 30.0 40.0 50.0 60.0
Japa
n
Ger
man
y
USA
FTSE
Aus
tral
ia
S&P
Rus
sia
Indo
nesi
a
Bra
zil
S.Ko
rea
Indi
a
Hon
g Ko
ng
Chin
a
(%)
Source: Bloomberg, PL Research
The strong pay roll numbers and the
optimism in the economies have resulted in
a better performance for the developed
markets. Lower domestic growth in China
have been a concern
Developed markets continue with the out
performance on subdued inflation and
improving economic strength.

Oct-Dec 2013 Earnings Preview
January 09, 2014 17
Indian Equities – Sector Performance
Month‐on‐Month
7.7 7.0
2.7 2.1
(0.5) (1.2) (1.2)(3.4)
(5.3) (5.5) (5.7)(8.0)(6.0)(4.0)(2.0)
-2.0 4.0 6.0 8.0
10.0
(%)
Source: Bloomberg, PL Research
Calendar Year‐to‐date
(0.1)
2.2
(2.2)
(0.7) (0.7) (0.9)
(3.7)(4.5)
(5.1)
(2.9)
(5.4)(6.0)(5.0)(4.0)(3.0)(2.0)(1.0)
-1.0 2.0 3.0
(%)
Source: Bloomberg, PL Research
Year‐on‐Year
56.9
22.7
(36.4)
10.8
(24.8)
4.3
(15.0)(4.7) (10.3) (13.7) (21.0)
(60.0)(40.0)(20.0)
-20.0 40.0 60.0 80.0
(%)
Source: Bloomberg, PL Research
Capital goods corrected sharply on account
of a bleak domestic outlook for the next
quarter. Defensives continue with the out
performance.
Capital Goods and Power under‐perform
due to concerns on stalled investment
cycle. Depreciating rupee & gathering
strength in the US economy help propel IT
as the best performing sector. Defensives
like Healthcare & FMCG too outperform

Oct-Dec 2013 Earnings Preview
January 09, 2014 18
India: Market cap‐wise Performance
Month‐on‐Month
6.9
4.8
0.1
(0.9)(2.0)
(1.0)
-
1.0
2.0
3.0
4.0
5.0
6.0
7.0
8.0
BSESMCAP Index BSEMDCAP Index BSE500 Index BSE100 Index
(%)
Source: Bloomberg, PL Research
Calendar Year‐to‐date
1.6
(0.1)
(1.6)(2.0)
(2.5)
(2.0)
(1.5)
(1.0)
(0.5)
-
0.5
1.0
1.5
2.0
BSESMCAP Index BSEMDCAP Index BSE500 Index BSE100 Index
(%)
Source: Bloomberg, PL Research
Year‐on‐Year
(12.8)
(8.7)
(0.4)
1.9
(14.0)
(12.0)
(10.0)
(8.0)
(6.0)
(4.0)
(2.0)
-
2.0
4.0
BSESMCAP Index BSEMDCAP Index BSE500 Index BSE100 Index
(%)
Source: Bloomberg, PL Research
Small‐Caps out perform mid caps which in‐
turn outperform Large‐Caps
Large Caps post low‐single digit positive
returns whereas Small Caps lose 12.8%
over the last year
Oct-Dec 2013 Earnings Preview
January 09, 2014 19
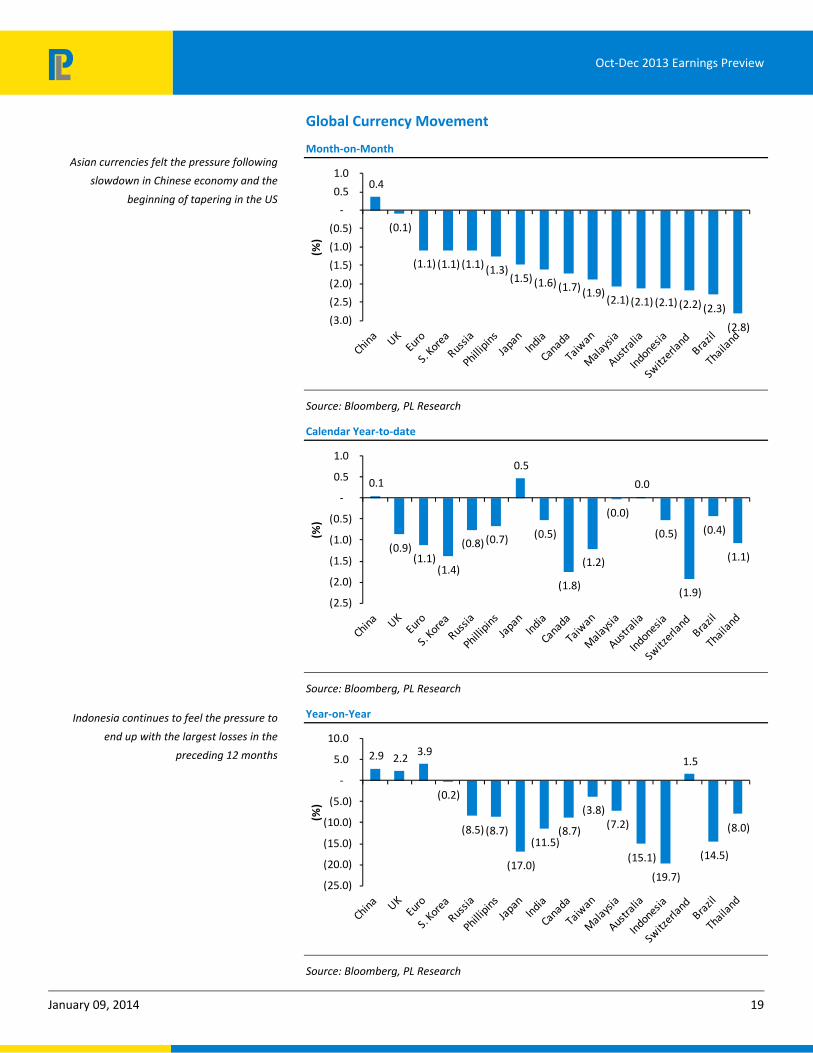
Global Currency Movement
Month‐on‐Month
0.4
(0.1)
(1.1) (1.1) (1.1) (1.3)(1.5) (1.6) (1.7) (1.9)
(2.1) (2.1) (2.1) (2.2) (2.3)
(2.8)(3.0)
(2.5)
(2.0)
(1.5)
(1.0)
(0.5)
-
0.5
1.0
(%)
Source: Bloomberg, PL Research
Calendar Year‐to‐date
0.1
(0.9)(1.1)
(1.4)
(0.8) (0.7)
0.5
(0.5)
(1.8)
(1.2)
(0.0)
0.0
(0.5)
(1.9)
(0.4)
(1.1)
(2.5)
(2.0)
(1.5)
(1.0)
(0.5)
-
0.5
1.0
(%)
Source: Bloomberg, PL Research
Year‐on‐Year
2.9 2.2 3.9
(0.2)
(8.5) (8.7)
(17.0)
(11.5)(8.7)
(3.8)(7.2)
(15.1)
(19.7)
1.5
(14.5)
(8.0)
(25.0)
(20.0)
(15.0)
(10.0)
(5.0)
-
5.0
10.0
(%)
Source: Bloomberg, PL Research
Asian currencies felt the pressure following
slowdown in Chinese economy and the
beginning of tapering in the US
Indonesia continues to feel the pressure to
end up with the largest losses in the
preceding 12 months

Oct-Dec 2013 Earnings Preview
January 09, 2014 20
Global Agricultural Commodities
Performance of Global Agricultural Commodities
60
70
80
90
100
110
120
130
Jan-
13
Feb-
13
Mar
-13
Apr
-13
May
-13
Jun-
13
Jul-
13
Aug
-13
Sep-
13
Oct
-13
Nov
-13
Dec
-13
Jan-
14
Rice Wheat Corn Soya Plam Oil Sugar
Source: Bloomberg, PL Research
Month‐on‐Month Performance
(1.6) (1.7)
(2.8) (3.0)(3.4)
(7.0)(8.0)
(7.0)
(6.0)
(5.0)
(4.0)
(3.0)
(2.0)
(1.0)
-
Rice Corn Soya Palm Oil Sugar Wheat
(%)
Source: Bloomberg, PL Research
Wheat prices declined during Dec’13 due to
expectation of bumper wheat crop next
year which could keep prices under check
Sugar prices declined on strong harvest in
Brazil which added to the surplus supply
globally
Soyabean prices dropped due to
expectation of favourable weather
boosting crop prospects
Corn prices declined due to jump in corn
stocks and expectation of good production

Oct-Dec 2013 Earnings Preview
January 09, 2014 21
Global Industrial Commodities
Month‐on‐Month
8.9
3.4 2.9
1.1 0.2
(1.8)
(4.0)(6.0)
(4.0)
(2.0)
-
2.0
4.0
6.0
8.0
10.0
Zinc Copper Lead Thermal Coal
Aluminium Nickel Brent crude
(%)
Source: Bloomberg, PL Research
Calendar Year‐to‐date
(1.7)
(0.2)
(2.9)
(0.4)
(0.9)
(2.7)
(3.3)(3.5)
(3.0)
(2.5)
(2.0)
(1.5)
(1.0)
(0.5)
-
Zinc Copper Lead Thermal Coal
Aluminium Nickel Brent crude
(%)
Source: Bloomberg, PL Research
Year‐on‐Year
3.3
(8.4)(7.1) (8.1)
(14.3)
(21.5)
(4.4)
(25.0)
(20.0)
(15.0)
(10.0)
(5.0)
-
5.0
Zinc Copper Lead Thermal Coal
Aluminium Nickel Brent crude
(%)
Source: Bloomberg, PL Research
Base metal prices (except Aluminium)
remained strong on account of supply
issues. Crude weakened due to high base
effect and elevated inventory

Oct-Dec 2013 Earnings Preview
January 09, 2014 22
NIFTY: Earnings growth and valuations
We estimate the free float EPS of the Nifty companies in FY14 and FY15 at Rs400.6 and Rs468.4 respectively, reflecting a growth of 7.3% and 16.9% respectively. IT (30.2% and 19.7%), Pharma (25.7%and 11.8%), Auto (19.0% and 23.3%), FMCG (14.0% and 19.9%) and Metals (17.5% and 13.0%) is expected to lead the way, while the laggards are expected to be Cement, engineering & Power and Oil & Gas.
Nifty trades at a PER of 15.4x FY14 and 13.2x FY15 earnings. The last ten year average of Nifty was at 14.6x and the Nifty at 13.8x trades at discount to the last ten year average.
Historically, the MSCI India index has always traded at a premium to MSCI Asia. The last ten years average premium has been around 24% and currently the index trades at a 19% premium, indicating a de rating of the market due to the continued problems affecting the domestic economy.
While our fundamental view has not changed from what we had in December, we believe that the global economy is beginning to show improvements and it is likely that stocks related to global trade could see better time ahead, while we continue to believe that the domestic focused companies will be under pressure.
Our portfolio preference continue to have a defensive bias while we have added Larsen & Toubro and Crompton Greaves to our top picks to reflect the change in our thought process.
Nifty 1‐yr forward PE
13.8
5.0
10.0
15.0
20.0
25.0
30.0
Jan-
04
Jan-
05
Jan-
06
Jan-
07
Jan-
08
Jan-
09
Jan-
10
Jan-
11
Jan-
12
Jan-
13
Jan-
14
Average14.6
Source: Bloomberg, PL Research
MSCI India Premium to MSCI Asia (Ex‐Japan)
19%
-30%-20%-10%
0%10%20%30%40%50%60%
Jan-
04
Jan-
05
Jan-
06
Jan-
07
Jan-
08
Jan-
09
Jan-
10
Jan-
11
Jan-
12
Jan-
13
Jan-
14
10 year Avg.24%
Source: Bloomberg, PL Research
Oct-Dec 2013 Earnings Preview
January 09, 2014 23
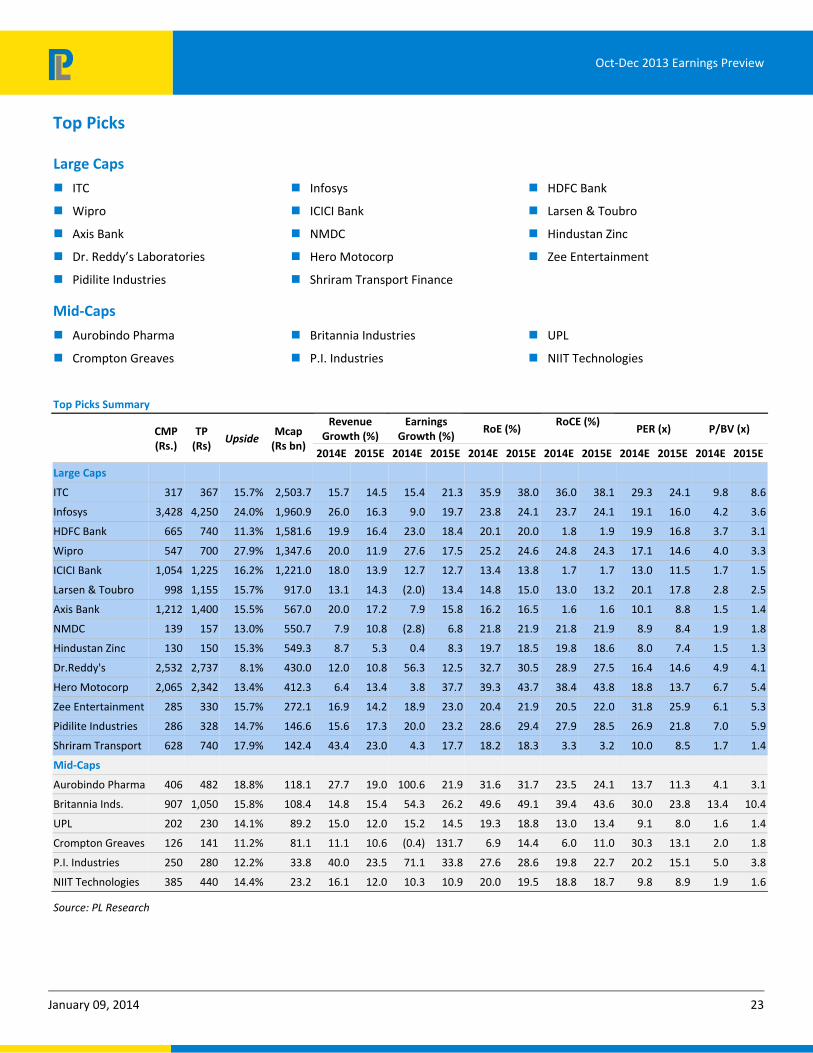
Top Picks
Large Caps
ITC Infosys HDFC Bank
Wipro ICICI Bank Larsen & Toubro
Axis Bank NMDC Hindustan Zinc
Dr. Reddy’s Laboratories Hero Motocorp Zee Entertainment
Pidilite Industries Shriram Transport Finance
Mid‐Caps
Aurobindo Pharma Britannia Industries UPL
Crompton Greaves P.I. Industries NIIT Technologies
Top Picks Summary
CMP (Rs.)
TP (Rs)
Upside Mcap (Rs bn)
Revenue Growth (%)
Earnings Growth (%)
RoE (%) RoCE (%)
PER (x) P/BV (x)
2014E 2015E 2014E 2015E 2014E 2015E 2014E 2015E 2014E 2015E 2014E 2015E
Large Caps
ITC 317 367 15.7% 2,503.7 15.7 14.5 15.4 21.3 35.9 38.0 36.0 38.1 29.3 24.1 9.8 8.6
Infosys 3,428 4,250 24.0% 1,960.9 26.0 16.3 9.0 19.7 23.8 24.1 23.7 24.1 19.1 16.0 4.2 3.6
HDFC Bank 665 740 11.3% 1,581.6 19.9 16.4 23.0 18.4 20.1 20.0 1.8 1.9 19.9 16.8 3.7 3.1
Wipro 547 700 27.9% 1,347.6 20.0 11.9 27.6 17.5 25.2 24.6 24.8 24.3 17.1 14.6 4.0 3.3
ICICI Bank 1,054 1,225 16.2% 1,221.0 18.0 13.9 12.7 12.7 13.4 13.8 1.7 1.7 13.0 11.5 1.7 1.5
Larsen & Toubro 998 1,155 15.7% 917.0 13.1 14.3 (2.0) 13.4 14.8 15.0 13.0 13.2 20.1 17.8 2.8 2.5
Axis Bank 1,212 1,400 15.5% 567.0 20.0 17.2 7.9 15.8 16.2 16.5 1.6 1.6 10.1 8.8 1.5 1.4
NMDC 139 157 13.0% 550.7 7.9 10.8 (2.8) 6.8 21.8 21.9 21.8 21.9 8.9 8.4 1.9 1.8
Hindustan Zinc 130 150 15.3% 549.3 8.7 5.3 0.4 8.3 19.7 18.5 19.8 18.6 8.0 7.4 1.5 1.3
Dr.Reddy's 2,532 2,737 8.1% 430.0 12.0 10.8 56.3 12.5 32.7 30.5 28.9 27.5 16.4 14.6 4.9 4.1
Hero Motocorp 2,065 2,342 13.4% 412.3 6.4 13.4 3.8 37.7 39.3 43.7 38.4 43.8 18.8 13.7 6.7 5.4
Zee Entertainment 285 330 15.7% 272.1 16.9 14.2 18.9 23.0 20.4 21.9 20.5 22.0 31.8 25.9 6.1 5.3
Pidilite Industries 286 328 14.7% 146.6 15.6 17.3 20.0 23.2 28.6 29.4 27.9 28.5 26.9 21.8 7.0 5.9
Shriram Transport 628 740 17.9% 142.4 43.4 23.0 4.3 17.7 18.2 18.3 3.3 3.2 10.0 8.5 1.7 1.4
Mid‐Caps
Aurobindo Pharma 406 482 18.8% 118.1 27.7 19.0 100.6 21.9 31.6 31.7 23.5 24.1 13.7 11.3 4.1 3.1
Britannia Inds. 907 1,050 15.8% 108.4 14.8 15.4 54.3 26.2 49.6 49.1 39.4 43.6 30.0 23.8 13.4 10.4
UPL 202 230 14.1% 89.2 15.0 12.0 15.2 14.5 19.3 18.8 13.0 13.4 9.1 8.0 1.6 1.4
Crompton Greaves 126 141 11.2% 81.1 11.1 10.6 (0.4) 131.7 6.9 14.4 6.0 11.0 30.3 13.1 2.0 1.8
P.I. Industries 250 280 12.2% 33.8 40.0 23.5 71.1 33.8 27.6 28.6 19.8 22.7 20.2 15.1 5.0 3.8
NIIT Technologies 385 440 14.4% 23.2 16.1 12.0 10.3 10.9 20.0 19.5 18.8 18.7 9.8 8.9 1.9 1.6
Source: PL Research

Oct-Dec 2013 Earnings Preview
January 09, 2014 24
Nifty Valuation
Source: Company Data, Bloomberg, PL Research
Note: Telecom Nos. is Bloomberg Consensus / Sector Weightages are updated as on December 31, 2013
For Detailed Break‐up of Company & Sector wise please refer Page No. 152‐160
Weight‐
age (%)FY12 FY13 FY14E FY15E
Weight‐
age (%)FY12 FY13 FY14E FY15E
Banking & Fin. 26.3% Cement 2.9%
PER (x) 14.6 12.7 12.5 10.6 PER (x) 19.2 14.8 16.7 16.2 PAT Growth (%) 26.8 15.1 1.0 18.2 PAT Growth (%) 10.1 29.6 (11.2) 3.2
Technology 16.8% Telecom 1.9%
PER (x) 33.0 26.6 20.5 17.1 PER (x) 31.2 58.4 35.3 20.9 PAT Growth (%) 16.9 23.7 30.2 19.7 PAT Growth (%) (29.6) (46.6) 65.4 68.7
Oil & Gas 11.7% Real Estate 0.4%
PER (x) 10.4 10.1 9.6 8.4 PER (x) 23.5 37.9 28.7 20.3 PAT Growth (%) 13.6 3.9 4.9 13.6 PAT Growth (%) (20.5) (37.8) 32.1 41.4
FMCG 11.6% Nifty as on Jan 8 6,175
PER (x) 43.1 35.4 31.1 25.9 PAT Growth (%) 35.5 21.8 14.0 19.9 EPS (Rs) ‐ Free Float 365.9 373.4 400.6 468.4
Growth (%) 9.7 2.1 7.3 16.9
Auto 9.0% PER (x) 16.9 16.5 15.4 13.2
PER (x) 13.9 14.9 12.6 10.2 PAT Growth (%) 23.1 (6.8) 19.0 23.3 EPS (Rs) ‐ Free Float
Nifty Cons. 365.9 373.4 403.6 474.8
Eng. & Power 8.2% Var. (PLe v/s Cons.) (%) ‐ ‐ (0.7) (1.4)
PER (x) 12.8 12.3 13.0 11.7 PAT Growth (%) 7.2 3.8 (5.1) 11.1
Sensex as on Jan 8 20,729
Pharma 6.1%
PER (x) 32.0 27.5 21.9 19.6 EPS (Rs) ‐ Free Float 1,188.5 1,173.4 1,243.6 1,463.5
PAT Growth (%) 44.3 16.3 25.7 11.8 Growth (%) 8.8 (1.3) 6.0 17.7
PER (x) 17.4 17.7 16.7 14.2
Metals 5.2%
PER (x) 11.1 11.4 9.7 8.6 Sensex Cons. 1,188.5 1,173.4 1,253.2 1,483.1
PAT Growth (%) 1.2 (2.1) 17.5 13.0 Var. (PLe v/s Cons.) (%) ‐ ‐ (0.8) (1.3)
January 09, 2014 25
Oct-Dec 2013 Earnings Preview
Balwindar Singh [email protected] +91-22-6632 2239
Top picks
PI Industries
UPL
Agri Products & Chemicals On an aggregate basis, we expect our universe to report sales growth of 5.1%
YoY with EBITDA margin improvement of 113bps YoY. For Q3, we expect aggregate PAT to increase by 20.1% YoY.
Complex Fertilisers‐ Inventory normalizes; company level sales growth picks
up: Good monsoons this year have led to significant uptick in consumption of complex fertilizers. However, as system was flushed with excess inventory of 3-4m mt, company level sales growth remained elusive in H1. Post the good monsoons, inventory has normalized in the system and company level sales growth seems to be getting back on track.
Decline in global fertilizer prices makes risk‐reward attractive for importers: As we have been highlighting earlier that imports can pick up due to a decline in global fertilizer prices, Nov’13 witnessed imported complex fertilisers volumes increasing by 17.5% YoY. Imported DAP volumes increased by 7.6% YoY even on a higher base of 556,000mt last year. Our interaction with industry points to the fact that FY15E is likely to witness increase in imported volumes.
Higher discounts being offered on DAP as costs come down: Decline in global phosphoric acid and ammonia prices have led to a reduction in global fertilizer prices. This have led to reduction in cost of production for domestic players too. Our channel checks suggests that companies are passing on the benefits of lower raw material costs through increase in discounts.
Delay in subsidy remains a key overhang on sector: Though government has recently sanctioned special banking arrangements of Rs100bn for clearing the subsidy over dues, the amount sanctioned is substantially lower than the requirement. We expect subsidy delays to continue as govt. is itself strapped with finances.
Global urea prices remain weak; IPP profitability impacted: Global urea prices continue to remain weak due to demand-supply mismatch. Though urea prices have recovered from the lows of $280/mt witnessed in Nov’13, they are currently quoting at $315/mt which is still a decline of 20% YoY. At this price point, IPP-linked production is not viable.
Urea subsidy to increase in the event of gas price hike: Gas price hikes, which is likely to be implemented from April 1, 2014 is likely to increase subsidy by ~Rs90-95bn. With every increase of $1/mmbtu in gas prices, the production cost would increase by Rs1,384/mt resulting into increase in costs by Rs24.5bn for 18m mt of urea produced by gas in India. Hence, increase in gas prices by $4/mmbtu would result into increase in subsidy by ~Rs90-95bn. We also do not rule out the possibility of a modest increase in urea prices which will somewhat lower the subsidy burden of govt.
January 09, 2014 26
Oct-Dec 2013 Earnings Preview
Agrochemicals‐ Rabi expected to be strong: Our channel checks suggests that rabi has witnessed strong growth in volume terms driven by robust rabi sowing patterns, increase in MSPs, upbeat sentiments etc. Companies including Dhanuka, PI Industries, UPL have been aggressive in placements resulting into impressive volume growth.
Companies have increased prices to offset the impact of rupee depreciation: Though costs have gone up by ~10-15% due to the depreciation of rupee, industry was not able to pass on the total impact of price hikes during the Kharif season. We estimate that the industry took price increases of 5-6% during the Kharif season. During the current Rabi season, companies have taken further price hikes to pass on increased costs.
Prefer agrochemicals over fertilisers in the near term: Though we are positive on the fertiliser space from a medium/long term point of view, in the near-term we prefer agrochemicals over fertilisers due to industry challenges and lack of any high conviction idea. Subsidies are likely to be delayed as govt. is strapped with its finances and this being an election year, budgetary allocation, going ahead, will be a constraint. Resumption of trading is another worrisome factor. Comparatively, agrochemicals companies are well-placed.
PI Industries and United Phosphorus are our top picks: PI Industries (launch of new molecules in domestic business to garner increasing market share, strong momentum in custom synthesis business, healthy order book, increase in margins due to increasing share of custom synthesis), & United Phosphorus (earnings growth combined with improvement in return ratios, gradual improvement in balance sheet, attractive valuation upside) are our top picks.
January 09, 2014 27
Oct-Dec 2013 Earnings Preview
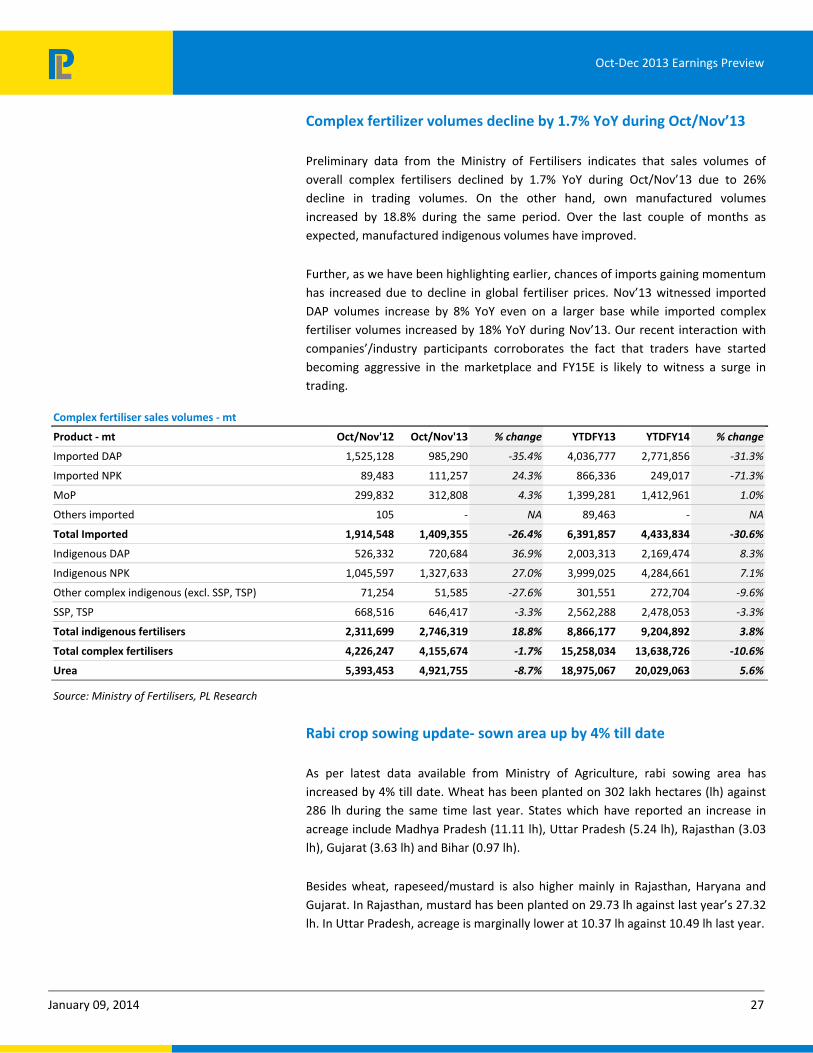
Complex fertilizer volumes decline by 1.7% YoY during Oct/Nov’13
Preliminary data from the Ministry of Fertilisers indicates that sales volumes of overall complex fertilisers declined by 1.7% YoY during Oct/Nov’13 due to 26% decline in trading volumes. On the other hand, own manufactured volumes increased by 18.8% during the same period. Over the last couple of months as expected, manufactured indigenous volumes have improved.
Further, as we have been highlighting earlier, chances of imports gaining momentum has increased due to decline in global fertiliser prices. Nov’13 witnessed imported DAP volumes increase by 8% YoY even on a larger base while imported complex fertiliser volumes increased by 18% YoY during Nov’13. Our recent interaction with companies’/industry participants corroborates the fact that traders have started becoming aggressive in the marketplace and FY15E is likely to witness a surge in trading.
Complex fertiliser sales volumes ‐ mt
Product ‐ mt Oct/Nov'12 Oct/Nov'13 % change YTDFY13 YTDFY14 % change
Imported DAP 1,525,128 985,290 ‐35.4% 4,036,777 2,771,856 ‐31.3%
Imported NPK 89,483 111,257 24.3% 866,336 249,017 ‐71.3%
MoP 299,832 312,808 4.3% 1,399,281 1,412,961 1.0%
Others imported 105 - NA 89,463 - NA
Total Imported 1,914,548 1,409,355 ‐26.4% 6,391,857 4,433,834 ‐30.6%
Indigenous DAP 526,332 720,684 36.9% 2,003,313 2,169,474 8.3%
Indigenous NPK 1,045,597 1,327,633 27.0% 3,999,025 4,284,661 7.1%
Other complex indigenous (excl. SSP, TSP) 71,254 51,585 ‐27.6% 301,551 272,704 ‐9.6%
SSP, TSP 668,516 646,417 ‐3.3% 2,562,288 2,478,053 ‐3.3%
Total indigenous fertilisers 2,311,699 2,746,319 18.8% 8,866,177 9,204,892 3.8%
Total complex fertilisers 4,226,247 4,155,674 ‐1.7% 15,258,034 13,638,726 ‐10.6%
Urea 5,393,453 4,921,755 ‐8.7% 18,975,067 20,029,063 5.6%
Source: Ministry of Fertilisers, PL Research
Rabi crop sowing update‐ sown area up by 4% till date
As per latest data available from Ministry of Agriculture, rabi sowing area has increased by 4% till date. Wheat has been planted on 302 lakh hectares (lh) against 286 lh during the same time last year. States which have reported an increase in acreage include Madhya Pradesh (11.11 lh), Uttar Pradesh (5.24 lh), Rajasthan (3.03 lh), Gujarat (3.63 lh) and Bihar (0.97 lh).
Besides wheat, rapeseed/mustard is also higher mainly in Rajasthan, Haryana and Gujarat. In Rajasthan, mustard has been planted on 29.73 lh against last year’s 27.32 lh. In Uttar Pradesh, acreage is marginally lower at 10.37 lh against 10.49 lh last year.
January 09, 2014 28
Oct-Dec 2013 Earnings Preview
Acreage under maize has increased mainly due to higher planting in Bihar, Maharashtra and Tamil Nadu. However, the area under jowar has declined marginally mainly due to lower planting in Maharashtra and Karnataka.
Rabi sowing
Crop‐ lakh hectare Area this year Area last year YoY gr.
Rabi rice 3.25 2.72 19.5%
Wheat 302.09 286.38 5.5%
Pulses 146.4 142.65 2.6%
Coarse cereals 56.49 59.14 ‐4.5%
Oilseeds 83.77 78.95 6.1%
Total 591.99 569.83 3.9%
Source: Ministry of Agriculture, PL Research
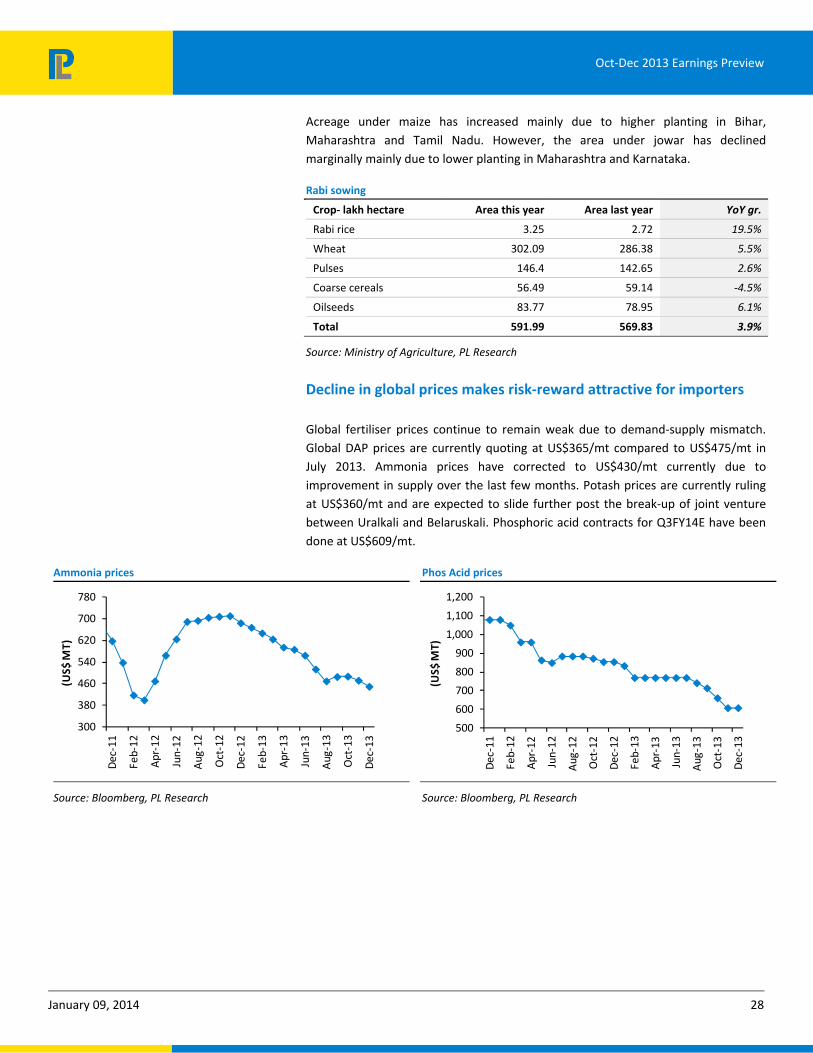
Decline in global prices makes risk‐reward attractive for importers
Global fertiliser prices continue to remain weak due to demand-supply mismatch. Global DAP prices are currently quoting at US$365/mt compared to US$475/mt in July 2013. Ammonia prices have corrected to US$430/mt currently due to improvement in supply over the last few months. Potash prices are currently ruling at US$360/mt and are expected to slide further post the break-up of joint venture between Uralkali and Belaruskali. Phosphoric acid contracts for Q3FY14E have been done at US$609/mt.
Ammonia prices
300
380
460
540
620
700
780
Dec
-11
Feb-
12
Apr
-12
Jun-
12
Aug
-12
Oct
-12
Dec
-12
Feb-
13
Apr
-13
Jun-
13
Aug
-13
Oct
-13
Dec
-13
(US$
MT)
Source: Bloomberg, PL Research
Phos Acid prices
500
600
700
800
900
1,000
1,100
1,200
Dec
-11
Feb-
12
Apr
-12
Jun-
12
Aug
-12
Oct
-12
Dec
-12
Feb-
13
Apr
-13
Jun-
13
Aug
-13
Oct
-13
Dec
-13
(US$
MT)
Source: Bloomberg, PL Research

January 09, 2014 29
Oct-Dec 2013 Earnings Preview
Rock Phospate prices
507090
110130150170190210
Dec
-11
Feb-
12
Apr
-12
Jun-
12
Aug
-12
Oct
-12
Dec
-12
Feb-
13
Apr
-13
Jun-
13
Aug
-13
Oct
-13
Dec
-13
Source: Bloomberg, PL Research
Potash prices
350380410440470500530560590
Dec
-11
Feb-
12
Apr
-12
Jun-
12
Aug
-12
Oct
-12
Dec
-12
Feb-
13
Apr
-13
Jun-
13
Aug
-13
Oct
-13
Dec
-13
(US$
MT)
Source: Bloomberg, PL Research
Global DAP prices
300350400450500550600650700
Dec
-11
Feb-
12
Apr
-12
Jun-
12
Aug
-12
Oct
-12
Dec
-12
Feb-
13
Apr
-13
Jun-
13
Aug
-13
Oct
-13
Dec
-13
(US$ MT)
Source: Bloomberg, PL Research
Urea prices
250
320
390
460
530
600
670
740
Dec
-11
Feb-
12
Apr
-12
Jun-
12
Aug
-12
Oct
-12
Dec
-12
Feb-
13
Apr
-13
Jun-
13
Aug
-13
Oct
-13
Dec
-13
(US$
/ M
T)
Source: Bloomberg, PL Research
Stock Performance
1M 3M 6M 12M 1M 3M 6M 12M
Chambal Ferti l i zers & Chemica ls 4.3 9.5 7.0 (43.5) 5.6 5.7 (0.3) (48.5)
Coromandel International 9.4 9.1 36.9 (7.1) 10.6 5.4 29.6 (12.1)
Deepak Ferti l i sers & Petrochemica ls Corporation (1.0) (6.3) 8.8 (19.6) 0.3 (10.0) 1.5 (24.6)
Dhanuka Agri tech 14.1 42.5 42.6 48.1 15.4 38.7 35.4 43.1
Gujarat State Ferti l i sers & Chemicals (6.9) 0.8 (13.2) (25.7) (5.7) (3.0) (20.5) (30.7)
P.I . Industries 11.5 64.0 84.3 93.8 12.8 60.3 77.1 88.8
Ra l l i s India 2.3 18.4 28.2 18.9 3.6 14.7 21.0 13.9
Tata Chemica ls (0.6) 11.4 (2.2) (28.2) 0.7 7.7 (9.4) (33.2)
UPL 18.9 34.5 48.4 46.5 20.2 30.8 41.1 41.5
Absolute Relative to Sensex
Source: Bloomberg, PL Research

January 09, 2014 30
Oct-Dec 2013 Earnings Preview
Summary Financials ‐ Quarterly (Rs m)
Q3FY14E Q3FY13 YoY gr. (%) Q2FY14 QoQ gr. (%) 9MFY14E 9MFY13 YoY gr. (%)
Sales 21,239 20,885 1.7 24,903 (14.7) 63,038 57,937 8.8
EBITDA 1,940 2,105 (7.8) 1,946 (0.3) 5,405 5,972 (9.5)
Margins (%) 9.1 10.1 (94)bps 7.8 132 bps 8.6 10.3 (173)bps
PAT 741 961 (22.9) 775 (4.4) 1,974 2,668 (26.0)
Sales 24,575 24,245 1.4 32,154 (23.6) 75,357 68,468 10.1
EBITDA 2,350 1,284 83.1 2,976 (21.0) 6,375 5,766 10.6
Margins (%) 9.6 5.3 427 bps 9.3 31 bps 8.5 8.4 4 bps
PAT 1,208 684 76.6 1,727 (30.1) 3,106 3,367 (7.7)
Sales 8,612 6,234 38.2 9,901 (13.0) 25,938 19,508 33.0
EBITDA 1,006 696 44.6 1,059 (5.0) 3,032 2,521 20.3
Margins (%) 11.7 11.2 52 bps 10.7 99 bps 11.7 12.9 (123)bps
PAT 523 316 65.1 454 15.0 1,479 1,228 20.5
Sales 1,649 1,397 18.0 2,534 (34.9) 5,845 4,541 28.7
EBITDA 231 158 45.7 437 (47.2) 919 622 47.8
Margins (%) 14.0 11.3 266 bps 17.2 (325)bps 15.7 13.7 203 bps
PAT 162 117 38.6 321 (49.5) 656 466 40.8
Sales 12,956 16,728 (22.6) 14,180 (8.6) 37,316 45,007 (17.1)
EBITDA 1,852 1,742 6.3 1,809 2.4 4,854 6,142 (21.0)
Margins (%) 14.3 10.4 388 bps 12.8 154 bps 13.0 13.6 (64)bps
PAT 1,226 991 23.7 1,298 (5.5) 3,127 4,223 (26.0)
Sales 3,548 2,826 25.6 4,628 (23.3) 12,236 8,202 49.2
EBITDA 575 453 26.9 921 (37.6) 2,285 1,383 65.3
Margins (%) 16.2 16.0 17 bps 19.9 (370)bps 18.7 16.9 181 bps
PAT 333 233 43.1 579 (42.4) 1,363 772 76.6
Sales 3,883 3,425 13.4 6,024 (35.5) 14,026 11,733 19.5
EBITDA 540 466 15.8 1,216 (55.6) 2,309 1,849 24.9
Margins (%) 13.9 13.6 29 bps 20.2 (628)bps 16.5 15.8 70 bps
PAT 302 247 22.4 821 (63.2) 1,455 1,052 38.3
Sales 45,276 41,968 7.9 43,440 4.2 121,831 114,147 6.7
EBITDA 5,536 5,362 3.3 5,743 (3.6) 15,394 16,475 (6.6)
Margins (%) 12.2 12.8 (55)bps 13.2 (99)bps 12.6 14.4 (180)bps
PAT 1,855 1,749 6.1 1,574 17.9 4,616 5,639 (18.1)
Sales 26,163 22,956 14.0 23,316 12.2 74,037 63,658 16.3
EBITDA 4,788 4,042 18.4 4,259 12.4 13,613 11,167 21.9
Margins (%) 18.3 17.6 69 bps 18.3 3 bps 18.4 17.5 84 bps
PAT 2,098 1,735 20.9 1,805 16.2 6,439 5,192 24.0
UPL
Ral l i s India
Tata Chemica ls
P.I. Industries
Chambal Ferti l i zers & Chemica ls
Coromandel International
Deepak Ferti l i sers & Petrochemica ls Corporation
Dhanuka Agri tech
Gujarat State Ferti l i sers & Chemica ls
Source: Company Data, PL Research

January 09, 2014 31
Oct-Dec 2013 Earnings Preview
Consolidated Sectoral Data
Quarterly Table (Rs m)
Oct‐Dec'13 Oct‐Dec'12 YoY gr. (%) Jul‐Sep'13 QoQ gr. (%)
Net Sa les 147,900 140,663 5.1 161,080 (8.2)
EBITDA 18,818 16,308 15.4 20,366 (7.6)
Margin (%) 12.7 11.6 113 bps 12.6 8 bps
PAT (Excl . Ex Items) 8,449 7,033 20.1 9,354 (9.7)
Note: Revenue, EBITDA and PAT numbers are arrived by totaling corresponding numbers of all companies under our coverage in this
sector.
We expect Chambal to report urea revenue growth of 11.2% YoY to Rs11.4bn, driven primarily by pricing increase (due to increase in weighted average gas prices). Urea volumes are likely to decline by 6% YoY to 542,720mt. Trading revenues are expected to decline by 12% YoY to Rs8.1bn due to lower fertiliser prices. Fertiliser trading volumes are expected to increase by 5.0% YoY. We expect urea to report EBIT margins of 11.0% (-250bps YoY/40 bps QoQ), while trading margins are expected at 4.6% (-380bps YoY/200bps QoQ). Shipping business profitability is likely to remain under pressure. Quarterly Table (Rs m)
Y/e MarchQ3
FY14E
Q3
FY13
YoY gr.
(%)
Q2
FY14
9M
FY14E
9M
FY13
YoY gr.
(%)
Net Sa les 21,239 20,885 1.7 24,903 63,038 57,937 8.8
EBITDA 1,940 2,105 (7.8) 1,946 5,405 5,972 (9.5)
Margin (%) 9.1 10.1 (94)bps 7.8 9 10 (173)bps
Reported PAT 741 961 (22.9) 942 2,813 2,827 (0.5)
PAT (Excl . Ex Items ) 741 961 (22.9) 775 1,974 2,668 (26.0)
Operating Metrics
Revenue Gr. (%)
Urea 11.2 26.8 (1,557)bps 33.5 21.1 24.1 (300)bps
Trading (11.6) 15.8 NA (21.5) (16.4) 56.6 (7,300)bps
EBIT margins (%)
Urea 11.0 13.5 (251)bps 10.6 11.6 12.9 (130)bps
Key Figures (Rs m)
2013 2014E 2015E
Net Sa les 531,228 569,571 619,712
Growth (%) 8.1 7.2 8.8
EBITDA 66,990 72,447 82,856
Margin (%) 12.6 12.7 13.4
PAT 31,421 33,042 39,876
Growth (%) (16.3) 5.2 20.7
PE (x) 11.2 10.7 8.8
Chambal Fertilisers
Rating Accumulate
Price (Rs ) 40
Target Pri ce (Rs ) 48
M/Cap (Rs bn) 16.6
Shares o/s (m) 416.2
Key Figures (Rs m)
Y/e March FY13 FY14E FY15E
Net Sa les 82,020 77,855 82,647
EBITDA 6,842 6,704 7,455
Margin (%) 8.3 8.6 9.0
PAT 2,266 2,272 2,721
EPS (Rs ) 5.4 5.5 6.5
Growth (%) (24.4) 0.3 19.8
RoE (%) 12.8 11.8 13.1
PE (x) 7.3 7.3 6.1
P / BV (x) 0.9 0.8 0.8
EV / E (x) 9.2 7.9 6.8

January 09, 2014 32
Oct-Dec 2013 Earnings Preview
We expect Coromandel’s (excl. Liberty) manufactured volumes to increase by 40% YoY, while trading volumes are likely to decline by 85% YoY. Coromandel continues to substitute manufacturing over trading. Non-subsidy business is likely to remain strong and we expect revenue growth of 20% YoY. Resultant, total revenues are expected to increase by 1.4% YoY. EBITDA margins are likely to improve by 430bps YoY to 9.6%. We have modeled for EBITDA margins/mt of Rs2,300. Company is likely to report PAT of Rs1.2bn, 77% YoY with EPS of Rs4.3.
Quarterly Table (Rs m)
Y/e MarchQ3
FY14E
Q3
FY13
YoY gr.
(%)
Q2
FY14
9M
FY14E
9M
FY13
YoY gr.
(%)
Net Sa les 24,575 24,245 1.4 32,154 75,357 68,468 10.1
EBITDA 2,350 1,284 83.1 2,976 6,375 5,766 10.6
Margin (%) 9.6 5.3 427 bps 9.3 8 8 4 bps
Reported PAT 1,208 684 76.6 1,601 3,023 4,204 (28.1)
PAT (Excl . Ex Items ) 1,208 684 76.6 1,727 3,106 3,367 (7.7)
Complex fertiliser Volumes‐mt
Trading 18,507 123,380 (85.0) 71,336 107,494 156,059 (31.1)
755,414 1,058,055 984,877 7.4 Manufactured - excl . Liberty
639,793 456,995 40.0
We expect chemicals to report revenue growth of 30% YoY driven primarily by higher chemical volumes. On the fertiliser side, manufactured revenues are likely to increase by 91% YoY driven by higher volumes. We expect manufactured fertiliser volumes to double YoY. Trading revenues are expected to increase by 31% YoY. Chemicals margins are expected to improve 250bps QoQ due to softening of raw materials prices. However, Deepak has initiated a Voluntary Retirement Scheme (VRS) recently. On account of this, it is likely to take a one-time hit of Rs100m during the quarter (we have not incorporated this as it is a one-off item).
Quarterly Table (Rs m)
Y/e MarchQ3
FY14E
Q3
FY13
YoY gr.
(%)
Q2
FY14
9M
FY14E
9M
FY13
YoY gr.
(%)
Net Sa les 8,612 6,234 38.2 9,901 25,938 19,508 33.0
EBITDA 1,006 696 44.6 1,059 3,032 2,521 20.3
Margin (%) 11.7 11.2 52 bps 10.7 12 13 (123)bps
Reported PAT 523 316 65.1 454 1,404 1,178 19.2
PAT (Excl . Ex Items ) 523 316 65.1 454 1,479 1,228 20.5
Sales volumes‐ mt
TAN 76,733 54,037 42.0 73,327 136,100 116,013 17.3
Nitric Acid 31,881 29,795 7.0 34,669 59,114 65,228 (9.4)
IPA 23,824 23,130 3.0 18,426 39,196 35,791 9.5
Manufactured ferti l i s 69,992 34,996 100.0 73,337 125,694 80,727 55.7
Coromandel International
Rating Accumulate
Price (Rs ) 246
Target Pri ce (Rs ) 230
M/Cap (Rs bn) 69.5
Shares o/s (m) 282.6
Key Figures (Rs m)
Y/e March FY13 FY14E FY15E
Net Sa les 89,249 101,397 111,494
EBITDA 6,591 8,146 9,765
Margin (%) 7.4 8.0 8.8
PAT 3,469 3,970 5,246
EPS (Rs ) 12.3 14.0 18.5
Growth (%) (44.3) 14.4 32.0
RoE (%) 15.1 17.4 20.9
PE (x) 20.0 17.5 13.3
P / BV (x) 3.2 2.9 2.6
EV / E (x) 14.2 11.0 8.9
Deepak Fertilisers
Rating Accumulate
Price (Rs ) 103
Target Pri ce (Rs ) 130
M/Cap (Rs bn) 9.1
Shares o/s (m) 88.2
Key Figures (Rs m)
Y/e March FY13 FY14E FY15E
Net Sa les 26,101 30,577 32,806
EBITDA 3,221 3,780 4,363
Margin (%) 12.3 12.4 13.3
PAT 1,519 1,912 2,277
EPS (Rs ) 17.2 21.7 25.8
Growth (%) (35.4) 25.9 19.1
RoE (%) 12.0 13.9 15.0
PE (x) 6.0 4.8 4.0
P / BV (x) 0.7 0.6 0.6
EV / E (x) 5.7 5.0 4.2

January 09, 2014 33
Oct-Dec 2013 Earnings Preview
We expect Dhanuka to report revenue growth of 18.0% YoY. Our channel checks suggest that Q3 has been pretty strong for Dhanuka and it is likely to report robust topline growth. New launches are also expected to gain momentum over the course of FY14E. We expect Dhanuka to report EBITDA of Rs231m, 46% YoY with margins of 14.0%. The company is likely to report PAT of Rs162m, 39% YoY.
Quarterly Table (Rs m)
Y/e MarchQ3
FY14E
Q3
FY13
YoY gr.
(%)
Q2
FY14
9M
FY14E
9M
FY13
YoY gr.
(%)
Net Sa les 1,649 1,397 18.0 2,534 5,845 4,541 28.7
EBITDA 231 158 45.7 437 919 622 47.8
Margin (%) 14.0 11.3 266 bps 17.2 16 14 203 bps
Reported PAT 162 117 38.6 321 656 466 40.8
PAT (Excl . Ex Items ) 162 117 38.6 321 656 466 40.8
We expect fertiliser revenues to decline by 40% YoY to Rs7.6bn due to lower complex fertiliser trading this year. Chemicals revenues are expected to increase by 15.0% YoY . Caprolactam-benzene spreads remained weak during the quarter though they were stable at ~$1,100/mt. We expect company to report PAT of Rs1.3bn, 24% YoY with EPS of Rs3.1.
Quarterly Table (Rs m)
Y/e MarchQ3
FY14E
Q3
FY13
YoY gr.
(%)
Q2
FY14
9M
FY14E
9M
FY13
YoY gr.
(%)
Net Sa les 12,956 16,728 (22.6) 14,180 37,316 45,007 (17.1)
EBITDA 1,852 1,742 6.3 1,809 4,854 6,142 (21.0)
Margin (%) 14.3 10.4 388 bps 12.8 13 14 (64)bps
Reported PAT 1,226 1,370 (10.5) 1,013 2,295 4,602 (50.1)
PAT (Excl . Ex Items ) 1,226 991 23.7 1,298 3,127 4,223 (26.0)
Operating Metrics
Revenues (Rs m)
Ferti l i ser 7,601 12,638 (39.9) 8,454 11,675 18,150 (35.7)
Chemica ls 5,355 4,656 15.0 5,726 10,661 10,128 5.3
EBIT Margin (%)
Ferti l i ser 8.0 8.8 (83)bps 7.2 10.4 8.7 170 bps
Chemica ls 18.0 9.2 876 bps 16.1 12.7 24.2 (1,150)bps
Dhanuka Agritech
Rating BUY
Price (Rs ) 189
Target Pri ce (Rs ) 220
M/Cap (Rs bn) 9.5
Shares o/s (m) 50.0
Key Figures (Rs m)
Y/e March FY13 FY14E FY15E
Net Sa les 5,869 7,286 8,452
EBITDA 865 1,151 1,369
Margin (%) 14.7 15.8 16.2
PAT 644 818 977
EPS (Rs ) 12.9 16.4 19.5
Growth (%) 12.8 26.9 19.4
RoE (%) 27.0 27.7 26.7
PE (x) 14.7 11.6 9.7
P / BV (x) 3.6 2.9 2.3
EV / E (x) 11.3 8.5 7.0
GSFC
Rating Accumulate
Price (Rs ) 54
Target Pri ce (Rs ) 60
M/Cap (Rs bn) 21.4
Shares o/s (m) 398.5
Key Figures (Rs m)
Y/e March FY13 FY14E FY15E
Net Sa les 61,967 54,957 58,220
EBITDA 7,813 7,023 8,091
Margin (%) 12.6 12.8 13.9
PAT 5,187 4,455 5,206
EPS (Rs ) 13.0 11.2 13.1
Growth (%) (32.3) (14.1) 16.8
RoE (%) 13.9 10.8 11.5
PE (x) 4.1 4.8 4.1
P / BV (x) 0.5 0.5 0.5
EV / E (x) 4.5 4.1 3.2
January 09, 2014 34
Oct-Dec 2013 Earnings Preview
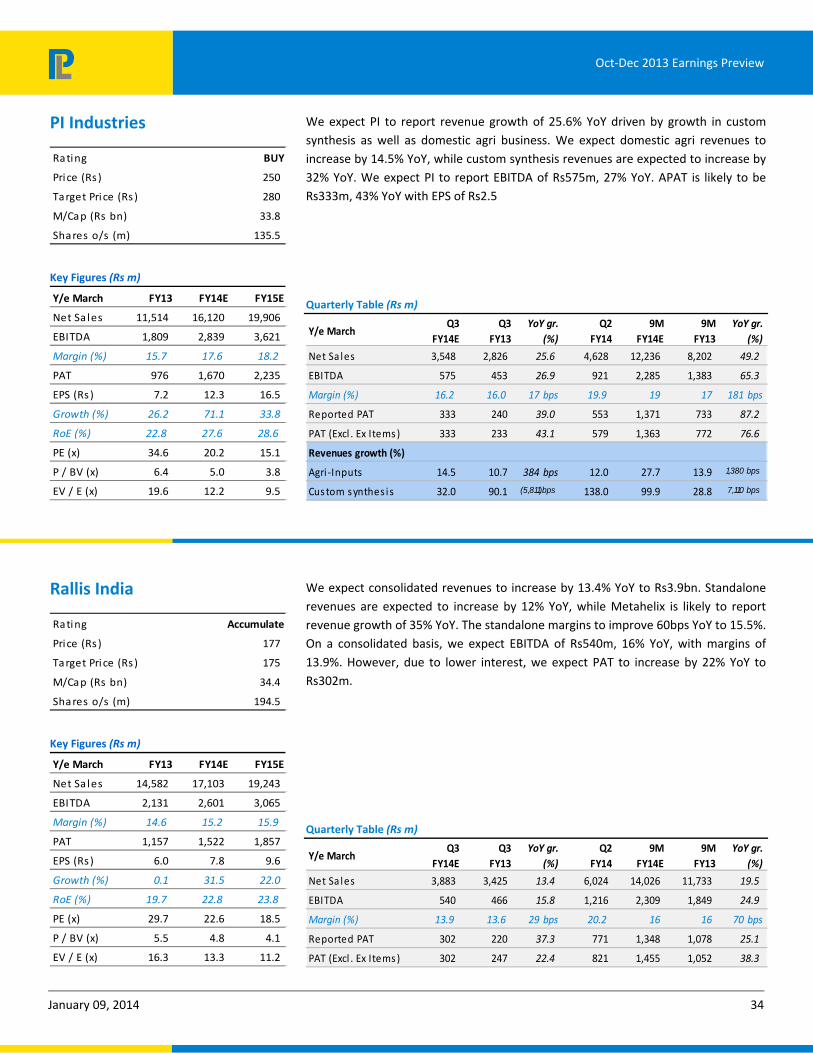
We expect PI to report revenue growth of 25.6% YoY driven by growth in custom synthesis as well as domestic agri business. We expect domestic agri revenues to increase by 14.5% YoY, while custom synthesis revenues are expected to increase by 32% YoY. We expect PI to report EBITDA of Rs575m, 27% YoY. APAT is likely to be Rs333m, 43% YoY with EPS of Rs2.5
Quarterly Table (Rs m)
Y/e MarchQ3
FY14E
Q3
FY13
YoY gr.
(%)
Q2
FY14
9M
FY14E
9M
FY13
YoY gr.
(%)
Net Sa les 3,548 2,826 25.6 4,628 12,236 8,202 49.2
EBITDA 575 453 26.9 921 2,285 1,383 65.3
Margin (%) 16.2 16.0 17 bps 19.9 19 17 181 bps
Reported PAT 333 240 39.0 553 1,371 733 87.2
PAT (Excl . Ex Items ) 333 233 43.1 579 1,363 772 76.6
Revenues growth (%)
Agri -Inputs 14.5 10.7 384 bps 12.0 27.7 13.9 1,380 bps
Cus tom synthes is 32.0 90.1 (5,811)bps 138.0 99.9 28.8 7,110 bps
We expect consolidated revenues to increase by 13.4% YoY to Rs3.9bn. Standalone revenues are expected to increase by 12% YoY, while Metahelix is likely to report revenue growth of 35% YoY. The standalone margins to improve 60bps YoY to 15.5%. On a consolidated basis, we expect EBITDA of Rs540m, 16% YoY, with margins of 13.9%. However, due to lower interest, we expect PAT to increase by 22% YoY to Rs302m.
Quarterly Table (Rs m)
Y/e MarchQ3
FY14E
Q3
FY13
YoY gr.
(%)
Q2
FY14
9M
FY14E
9M
FY13
YoY gr.
(%)
Net Sa les 3,883 3,425 13.4 6,024 14,026 11,733 19.5
EBITDA 540 466 15.8 1,216 2,309 1,849 24.9
Margin (%) 13.9 13.6 29 bps 20.2 16 16 70 bps
Reported PAT 302 220 37.3 771 1,348 1,078 25.1
PAT (Excl . Ex Items ) 302 247 22.4 821 1,455 1,052 38.3
PI Industries
Rating BUY
Price (Rs ) 250
Target Pri ce (Rs ) 280
M/Cap (Rs bn) 33.8
Shares o/s (m) 135.5
Key Figures (Rs m)
Y/e March FY13 FY14E FY15E
Net Sa les 11,514 16,120 19,906
EBITDA 1,809 2,839 3,621
Margin (%) 15.7 17.6 18.2
PAT 976 1,670 2,235
EPS (Rs ) 7.2 12.3 16.5
Growth (%) 26.2 71.1 33.8
RoE (%) 22.8 27.6 28.6
PE (x) 34.6 20.2 15.1
P / BV (x) 6.4 5.0 3.8
EV / E (x) 19.6 12.2 9.5
Rallis India
Rating Accumulate
Price (Rs ) 177
Target Pri ce (Rs ) 175
M/Cap (Rs bn) 34.4
Shares o/s (m) 194.5
Key Figures (Rs m)
Y/e March FY13 FY14E FY15E
Net Sa les 14,582 17,103 19,243
EBITDA 2,131 2,601 3,065
Margin (%) 14.6 15.2 15.9
PAT 1,157 1,522 1,857
EPS (Rs ) 6.0 7.8 9.6
Growth (%) 0.1 31.5 22.0
RoE (%) 19.7 22.8 23.8
PE (x) 29.7 22.6 18.5
P / BV (x) 5.5 4.8 4.1
EV / E (x) 16.3 13.3 11.2
January 09, 2014 35
Oct-Dec 2013 Earnings Preview
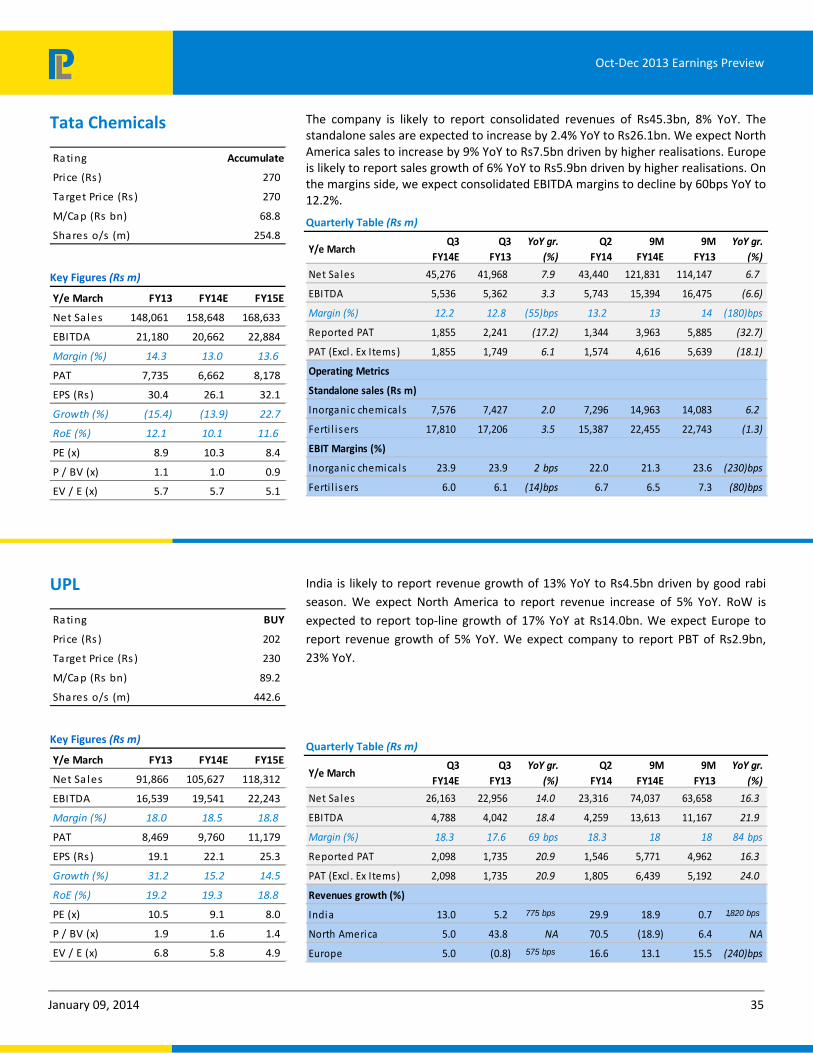
The company is likely to report consolidated revenues of Rs45.3bn, 8% YoY. The standalone sales are expected to increase by 2.4% YoY to Rs26.1bn. We expect North America sales to increase by 9% YoY to Rs7.5bn driven by higher realisations. Europe is likely to report sales growth of 6% YoY to Rs5.9bn driven by higher realisations. On the margins side, we expect consolidated EBITDA margins to decline by 60bps YoY to 12.2%.
Quarterly Table (Rs m)
Y/e MarchQ3
FY14E
Q3
FY13
YoY gr.
(%)
Q2
FY14
9M
FY14E
9M
FY13
YoY gr.
(%)
Net Sa les 45,276 41,968 7.9 43,440 121,831 114,147 6.7
EBITDA 5,536 5,362 3.3 5,743 15,394 16,475 (6.6)
Margin (%) 12.2 12.8 (55)bps 13.2 13 14 (180)bps
Reported PAT 1,855 2,241 (17.2) 1,344 3,963 5,885 (32.7)
PAT (Excl . Ex Items ) 1,855 1,749 6.1 1,574 4,616 5,639 (18.1)
Operating Metrics
Standalone sales (Rs m)
Inorganic chemicals 7,576 7,427 2.0 7,296 14,963 14,083 6.2
Ferti l i sers 17,810 17,206 3.5 15,387 22,455 22,743 (1.3)
EBIT Margins (%)
Inorganic chemicals 23.9 23.9 2 bps 22.0 21.3 23.6 (230)bps
Ferti l i sers 6.0 6.1 (14)bps 6.7 6.5 7.3 (80)bps
India is likely to report revenue growth of 13% YoY to Rs4.5bn driven by good rabi season. We expect North America to report revenue increase of 5% YoY. RoW is expected to report top-line growth of 17% YoY at Rs14.0bn. We expect Europe to report revenue growth of 5% YoY. We expect company to report PBT of Rs2.9bn, 23% YoY.
Quarterly Table (Rs m)
Y/e MarchQ3
FY14E
Q3
FY13
YoY gr.
(%)
Q2
FY14
9M
FY14E
9M
FY13
YoY gr.
(%)
Net Sa les 26,163 22,956 14.0 23,316 74,037 63,658 16.3
EBITDA 4,788 4,042 18.4 4,259 13,613 11,167 21.9
Margin (%) 18.3 17.6 69 bps 18.3 18 18 84 bps
Reported PAT 2,098 1,735 20.9 1,546 5,771 4,962 16.3
PAT (Excl . Ex Items ) 2,098 1,735 20.9 1,805 6,439 5,192 24.0
Revenues growth (%)
India 13.0 5.2 775 bps 29.9 18.9 0.7 1,820 bps
North America 5.0 43.8 NA 70.5 (18.9) 6.4 NA
Europe 5.0 (0.8) 575 bps 16.6 13.1 15.5 (240)bps
Tata Chemicals
Rating Accumulate
Price (Rs ) 270
Target Pri ce (Rs ) 270
M/Cap (Rs bn) 68.8
Shares o/s (m) 254.8
Key Figures (Rs m)
Y/e March FY13 FY14E FY15E
Net Sa les 148,061 158,648 168,633
EBITDA 21,180 20,662 22,884
Margin (%) 14.3 13.0 13.6
PAT 7,735 6,662 8,178
EPS (Rs ) 30.4 26.1 32.1
Growth (%) (15.4) (13.9) 22.7
RoE (%) 12.1 10.1 11.6
PE (x) 8.9 10.3 8.4
P / BV (x) 1.1 1.0 0.9
EV / E (x) 5.7 5.7 5.1
UPL
Rating BUY
Price (Rs ) 202
Target Pri ce (Rs ) 230
M/Cap (Rs bn) 89.2
Shares o/s (m) 442.6
Key Figures (Rs m)
Y/e March FY13 FY14E FY15E
Net Sa les 91,866 105,627 118,312
EBITDA 16,539 19,541 22,243
Margin (%) 18.0 18.5 18.8
PAT 8,469 9,760 11,179
EPS (Rs ) 19.1 22.1 25.3
Growth (%) 31.2 15.2 14.5
RoE (%) 19.2 19.3 18.8
PE (x) 10.5 9.1 8.0
P / BV (x) 1.9 1.6 1.4
EV / E (x) 6.8 5.8 4.9

January 09, 2013 36
Oct-Dec 2013 Earnings Preview
Surjit Arora [email protected] +91-22-6632 2235
Top picks
Hero Motocorp
Automobiles Domestic two‐wheeler grew by ~7.0% YoY: On account of higher fuel prices, general inflation and slowdown in the economy, the domestic two-wheeler segment growth was tepid at 7.0% YoY in volume terms during the quarter. Hero Motocorp (HMCL) is likely to grow at a faster clip of 6.9% on account of strong 20%+ growth in the scooter segment. On the other hand, Bajaj Auto (BJA) registered de-growth of ~24.0% YoY on account of slowdown in demand and increased competition from HMSI. HMSI continues to clock impressive volumes with a growth of ~29.2% YoY for the quarter led by increased capacity in the motorcycles segment.
Recovery in two-wheeler industry demand is likely, given the good monsoon, coupled with possible increase in government spending ahead of 2014 national elections. We expect 12-13% CAGR in scooter volumes for the next two years. We expect two-wheeler volumes to grow at ~7% CAGR, mainly led by 12.2% CAGR in scooter volumes and 6.0% CAGR in motorcycle volumes over FY13-FY15E period. Scooter share in the last three years has increased from 15% to 21% of two-wheeler volumes mainly driven by (a) growing acceptability of gearless scooters, particularly by women, (b) rising urbanization and increasing proportion of working women.
Going by the current trend of rising rural incomes with higher yields and minimum support prices, the outlook on two-wheelers is positive. Low penetration level, lack of adequate mode public transport and rising per capita income in rural India would lead to long-term healthy volume of two-wheelers. With rural economy accounting for 40-45% of the sales for two-wheelers, we expect good times ahead for two-wheeler manufacturers.
Quarterly trend in two‐wheeler segment sales
Particulars Q3FY13 Q4FY13 Q1FY14 Q2FY14 Q3FY14E
Two-Wheelers 3,597,592 3,420,937 3,490,677 3,526,294 3,848,000
QoQ Growth (%) 10.4% ‐4.9% 2.0% 1.0% 9.1%
Source: SIAM Data, PL Research
Two‐wheeler segment sales
Q3FY14E Q3FY13 YoY gr. (%)
Domestic Two‐wheelers 3,848,000 3,597,592 7.0
Hero Motocorp 1,680,940 1,573,145 6.9
Bajaj Auto 523,759 687,351 (23.8)
HMSI 977,000 644,737 51.5
Source: SIAM Data, PL Research

January 09, 2013 37
Oct-Dec 2013 Earnings Preview
Higher interest rates, increased fuel prices were negated by lower base of MSIL leading to a 4.7% de‐growth in the passenger vehicle (Cars +UVs) segment:
Quarterly trend in passenger car segment sales
Particulars Q3FY13 Q4FY13 Q1FY14 Q2FY14E Q3FY14E
Passenger Cars 618,825 664,439 607,469 540,498 590,000
QoQ Growth (%) 11.0% 6.3% ‐8.6% ‐11.0% 8.8%
Source: SIAM Data, PL Research
Consumer sentiment has been impacted negatively on account of higher prices of cars (Excise duty + Registration Tax) and higher fuel prices. Demand for petrol cars has weakened YTD which is evident from the high inventory levels for petrol cars and higher discounts on the same. It is unlikely that this scenario will improve in the coming months.
At the same time, given the current slowdown in the economy, the diesel car demand is also fading with a de-growth during the quarter, with the diesel cars of Maruti Suzuki (MSIL) are now available off the shelf and carry discounts on them.
M&M is facing the brunt of a slowdown in UV space coupled with intense competition especially from Ford ‘EcoSport’. M&M continued its steep decline in the Passenger vehicle segment with a de-growth of 24.4% for the quarter.
We believe the recovery is still some time away and the decline in volumes for the industry is likely to continue in the near term (at least for the next 4-6 months).
Passenger Vehicle (Car + UV) segment sales
Q3FY14E Q3FY13 YoY gr. (%)
Domestic Passenger Vehicle 590,000 618,825 (4.7)
Maruti Suzuki 242,066 243,619 (0.6)
Hyundai 100,702 97,071 3.7
M&M 56,131 74,297 (24.4)
Tata Motors 33,781 53,335 (36.7)
Ford 25,300 20,038 26.2
Source: SIAM Data, PL Research
Medium & Heavy Commercial Vehicles (M&HCV) sales decline by 30.8% YoY on account of lower freight rates and slowdown in economic activity
Quarterly trend in M&HCV segment sales
Particulars Q3FY13 Q4FY13 Q1FY14 Q2FY14 Q3FY14E
M&HCVs 57,539 70,184 55,945 49,552 39,784
QoQ Growth (%) ‐22.9% 21.9% ‐20.3% ‐11.4% ‐19.7%
Source: SIAM Data, PL Research

January 09, 2013 38
Oct-Dec 2013 Earnings Preview
Truck rentals remain stable on trunk routes on account of a) lesser availability of truck fleet due to disruption caused by heavy rains and floods in several states during Aug 2013 and b) improved cargo availability on account of arrival of fruits and vegetables in APMCs.
Despite record discounts on sales and subvention to auto financers, M&HCV goods segment reported a sharp decline of ~38.0% YoY mainly on account of low cargo offering across segments and negative sentiments on the ground level. We maintain our negative view on the Trucking industry (M&HCV segment) for the next 4-6 months.
YTD M&HCV segment sales
Q3FY14E Q3FY13 YoY gr. (%)
Domestic M&HCV 39,784 57,539 (30.8)
Tata Motors 22,417 31,482 (28.8)
Ashok Leyland 10,698 14,681 (27.1)
Source: SIAM Data, PL Research
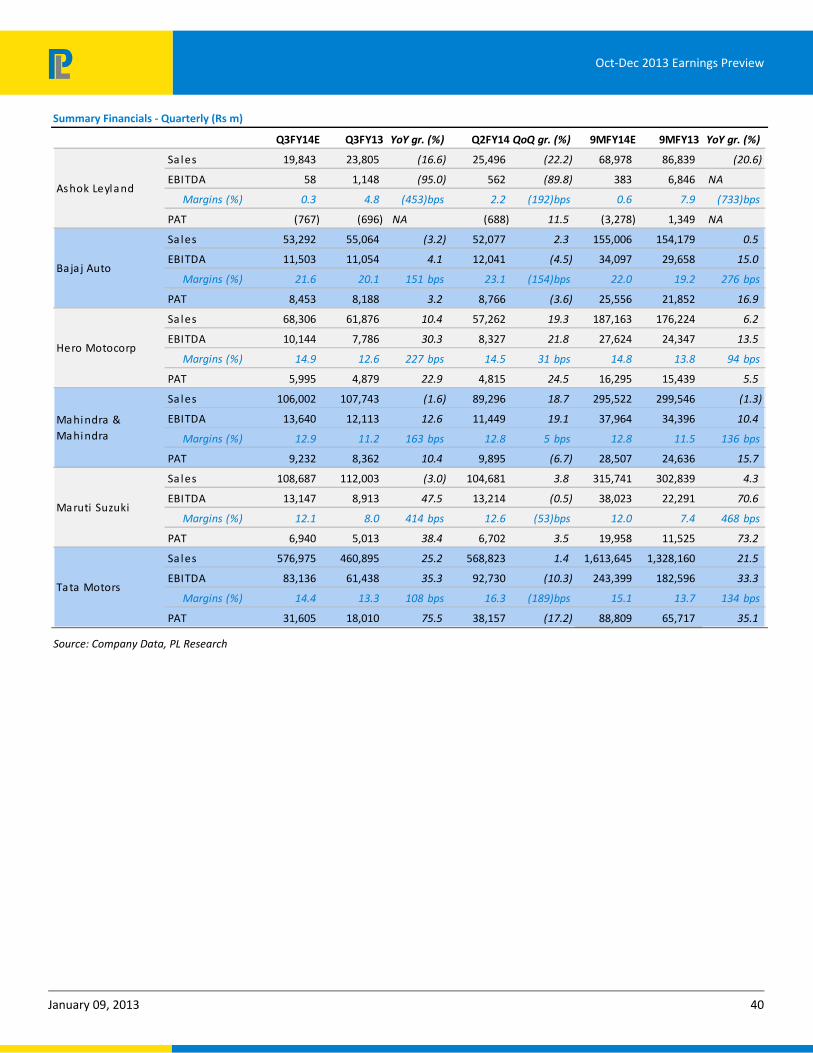
Auto companies under our coverage are likely to post a 13.5% YoY top-line growth mainly led by volume growth and price increases.
Auto Companies ‐ Raw Material Index
94.0
96.0
98.0
100.0
102.0
104.0
106.0
108.0
Q2FY13 Q3FY13 Q4FY13 Q1FY14 Q2FY14 Q3FY14E
Source: PL Research
We have built a raw material index giving different weightage to different commodities. We have assigned highest weightage to Steel (45%), followed by Aluminium (20%) and Plastics/Polymers (15%). Our raw material index declined by ~3.0% QoQ. Major raw materials have declined by 4-5% in the last few months. On account of stable raw material, coupled with cost-cutting efforts by companies and price increases, we expect EBITDA margins to improve by 160bps YoY for the quarter.

January 09, 2013 39
Oct-Dec 2013 Earnings Preview
Our universe – Volume numbers
Company Q3FY14E YoY gr (%) QoQ gr (%)
Ashok Leyland 18,453 (18.6) (20.2)
Bajaj Auto 993,690 (11.9) 3.4
Hero Motocorp 1,680,940 6.9 18.7
M&M 206,458 (1.0) 17.0
Maruti Suzuki 288,151 (4.4) 4.6
Tata Motors 130,337 (36.1) (14.3)
Tata Motors JLR 103,431 9.1 1.5
Source: Company Data, PL Research
PAT for the coverage universe is likely to grow by 40.5%, led by 75.5% growth for TTMT and a 38.4% growth for MSIL (not comparable due to merger with Suzuki Powertrain), for the quarter. Exc. TTMT, the PAT for the coverage universe is likely to grow by 16.0%.
Hero Motocorp: We believe that with the interest rate inching up and robust rural economy, two-wheeler stocks are likely to outperform over the next one year. Three key factors leading to our stance are a) Strong rural economy led by good monsoon and increase in MSPs b) Export potential - Indian firms are better placed compared to Chinese counterparts on currency and labour cost front 3) Valuation attractive at ~13.7x 1yr fwd P/E, given the strong 18% earnings CAGR, coupled with strong balance sheet and better corporate governance. We maintain ‘Accumulate’ rating with a TP of Rs2,352.
Stock Performance
1M 3M 6M 12M 1M 3M 6M 12M
As hok Le yl a nd 12.3 16.2 (1.9) (31.6) 13.6 12.5 (9.2) (36.6)
Ba ja j Auto (1.6) (9.3) 3.0 (12.7) (0.4) (13.1) (4.3) (17.7)
He ro Motocorp (1.5) 2.2 24.9 9.8 (0.2) (1.5) 17.6 4.8
Ma hi ndra & Ma hi ndra (3.9) 5.3 (4.1) (5.1) (2.6) 1.5 (11.3) (10.1)
Ma ruti Suzuki 8.0 30.6 18.5 16.7 9.3 26.9 11.2 11.7
Ta ta Motors (5.3) 5.6 28.6 17.9 (4.0) 1.9 21.4 12.9
Absolute Relative to Sensex
Source: Bloomberg, PL Research
January 09, 2013 40
Oct-Dec 2013 Earnings Preview
Summary Financials ‐ Quarterly (Rs m)
Q3FY14E Q3FY13 YoY gr. (%) Q2FY14 QoQ gr. (%) 9MFY14E 9MFY13 YoY gr. (%)
Sa les 19,843 23,805 (16.6) 25,496 (22.2) 68,978 86,839 (20.6)
EBITDA 58 1,148 (95.0) 562 (89.8) 383 6,846 NA
Margins (%) 0.3 4.8 (453)bps 2.2 (192)bps 0.6 7.9 (733)bps
PAT (767) (696) NA (688) 11.5 (3,278) 1,349 NA
Sa les 53,292 55,064 (3.2) 52,077 2.3 155,006 154,179 0.5
EBITDA 11,503 11,054 4.1 12,041 (4.5) 34,097 29,658 15.0
Margins (%) 21.6 20.1 151 bps 23.1 (154)bps 22.0 19.2 276 bps
PAT 8,453 8,188 3.2 8,766 (3.6) 25,556 21,852 16.9
Sa les 68,306 61,876 10.4 57,262 19.3 187,163 176,224 6.2
EBITDA 10,144 7,786 30.3 8,327 21.8 27,624 24,347 13.5
Margins (%) 14.9 12.6 227 bps 14.5 31 bps 14.8 13.8 94 bps
PAT 5,995 4,879 22.9 4,815 24.5 16,295 15,439 5.5
Sa les 106,002 107,743 (1.6) 89,296 18.7 295,522 299,546 (1.3)
EBITDA 13,640 12,113 12.6 11,449 19.1 37,964 34,396 10.4
Margins (%) 12.9 11.2 163 bps 12.8 5 bps 12.8 11.5 136 bps
PAT 9,232 8,362 10.4 9,895 (6.7) 28,507 24,636 15.7
Sa les 108,687 112,003 (3.0) 104,681 3.8 315,741 302,839 4.3
EBITDA 13,147 8,913 47.5 13,214 (0.5) 38,023 22,291 70.6
Margins (%) 12.1 8.0 414 bps 12.6 (53)bps 12.0 7.4 468 bps
PAT 6,940 5,013 38.4 6,702 3.5 19,958 11,525 73.2
Sa les 576,975 460,895 25.2 568,823 1.4 1,613,645 1,328,160 21.5
EBITDA 83,136 61,438 35.3 92,730 (10.3) 243,399 182,596 33.3
Margins (%) 14.4 13.3 108 bps 16.3 (189)bps 15.1 13.7 134 bps
PAT 31,605 18,010 75.5 38,157 (17.2) 88,809 65,717 35.1
Tata Motors
Ashok Leyland
Ba ja j Auto
Hero Motocorp
Mahindra & Mahindra
Maruti Suzuki
Source: Company Data, PL Research

January 09, 2013 41
Oct-Dec 2013 Earnings Preview
Consolidated Sectoral Data
Quarterly Table (Rs m)
Oct‐Dec'13 Oct‐Dec'12 YoY gr. (%) Jul‐Sep'13 QoQ gr. (%)
Net Sa les 933,105 821,386 13.6 897,634 4.0
EBITDA 131,628 102,452 28.5 138,324 (4.8)
Margin (%) 14.1 12.5 163 bps 15.4 (130)bps
PAT (Excl . Ex Items) 61,457 43,756 40.5 67,647 (9.1)
Note: Revenue, EBITDA and PAT numbers are arrived by totaling corresponding numbers of all companies under our coverage in this
sector.
AL reported a ~27.1% YoY decline in the M&HCV segment. However, on account of 7,755 units of LCV ‘Dost’, the overall decline in volumes was arrested at 18.6% YoY. The average realization/vehicle is expected to be tepid at 2.4% YoY on account of product mix skewed towards LCV segment (~42.0% of volumes) and higher discounts in the M&HCV segment. As a result, we expect a 453bps YoY decline in EBITDA margins. The company is likely to report a loss, in our view.
Quarterly Table (Rs m)
Y/e MarchQ3
FY14E
Q3
FY13
YoY gr.
(%)
Q2
FY14
9M
FY14E
9M
FY13
YoY gr.
(%)
Net Sales 19,843 23,805 (16.6) 25,496 68,978 86,839 (20.6)
EBITDA 58 1,148 (95.0) 562 383 6,846 (94.4)
Margin (%) 0.3 4.8 (453)bps 2.2 0.6 7.9 (733)bps
Reported PAT (767) 867 NA (251) (2,435) 2,842 NA
PAT (Excl . Ex Items) (767) (696) NA (688) (3,278) 1,349 NA
Operating Metrics
Total Vol (nos.) 18,453 22,666 (18.6) 23,117 63,294 79,985 (20.9)
Net Real./Unt. (Rs) 1,075,348 1,050,251 2.4 1,102,921 1,089,799 1,085,689 0.4
RM Cost/Unt. (Rs) 809,395 754,703 7.2 841,683 825,192 787,473 4.8
EBITDA/Unt. 3,123 50,658 (93.8) 24,331 6,046 85,593 NA
Key Figures (Rs m)
2013 2014E 2015E
Net Sales 3,293,840 3,669,576 4,264,364
Growth (%) 13.7 11.4 16.2
EBITDA 436,150 534,713 644,855
Margin (%) 13.2 14.6 15.1
PAT 213,717 248,793 311,499
Growth (%) (8.6) 16.4 25.2
PE (x) 15.9 13.7 10.9
Ashok Leyland
Rating Reduce
Price (Rs ) 18
Target Price (Rs ) 17
M/Cap (Rs bn) 48.6
Shares o/s (m) 2,660.7
Key Figures (Rs m)
Y/e March FY13 FY14E FY15E
Net Sa les 124,812 101,709 122,597
EBITDA 8,765 1,935 7,277
Margin (%) 7.0 1.9 5.9
PAT 1,442 (3,750) 49
EPS (Rs ) 0.5 (1.4) 0.0
Growth (%) (75.7) NA (101.3)
RoE (%) 3.3 (8.8) 0.1
PE (x) 33.7 (12.9) 982.3
P / BV (x) 1.1 1.2 1.2
EV / E (x) 10.3 50.2 13.3

January 09, 2013 42
Oct-Dec 2013 Earnings Preview
BJA reported 10.0% YoY decline in two-wheeler sales for the quarter, with domestic volumes declining by ~24.0%. Three-wheeler sales de-grew by 25.1% YoY on account of slowdown in exports as well as domestic market. On the back of exports accounting for 42.5% of overall volumes (41.7% in Q2FY14) and higher realization on account of rupee depreciation, margins are likely to increase by 150bps YoY.
Quarterly Table (Rs m)
Y/e MarchQ3
FY14E
Q3
FY13
YoY gr.
(%)
Q2
FY14
9M
FY14E
9M
FY13
YoY gr.
(%)
Net Sales 53,292 55,064 (3.2) 52,077 155,006 154,179 0.5
EBITDA 11,503 11,054 4.1 12,041 34,097 29,658 15.0
Margin (%) 21.6 20.1 151 bps 23.1 22 19 276 bps
Reported PAT 8,453 8,188 3.2 8,372 24,202 21,852 10.8
PAT (Excl. Ex Items) 8,453 8,188 3.2 8,766 25,556 21,852 16.9
Operating Metrics
Total Vol. (nos) 993,690 1,127,741 (11.9) 961,330 2,937,610 3,255,920 (9.8)
Net Real./Unt. (Rs) 53,630 48,827 9.8 54,172 52,766 47,353 11.4
RM Cost/Unit (Rs) 36,494 34,769 5.0 36,044 35,737 33,778 5.8
EBITDA/Unit (Rs) 11,576 9,802 18.1 12,525 11,607 9,109 27.4
HMCL reported a 6.9% YoY growth in volumes on account of lower base of last year and pick up in rural sales. Despite competition from HMSI, Hero Motocorp has maintained its market share on account of new product launcher and higher festive season sales. EBITDA margins are expected to improve by 230bps on account of cost-cutting as well as better product mix. Tax rate is likely to be at ~27%.
Quarterly Table (Rs m)
Y/e MarchQ3
FY14E
Q3
FY13
YoY gr.
(%)
Q2
FY14
9M
FY14E
9M
FY13
YoY gr.
(%)
Net Sales 68,306 61,876 10.4 57,262 187,163 176,224 6.2
EBITDA 10,144 7,786 30.3 8,327 27,624 24,347 13.5
Margin (%) 14.9 12.6 227 bps 14.5 14.8 13.8 94 bps
Reported PAT 5,995 4,879 22.9 4,815 16,295 15,439 5.5
PAT (Excl . Ex Items) 5,995 4,879 22.9 4,815 16,295 15,439 5.5
Operating Metrics
Tota l Vol . (nos ) 1,680,940 1,573,135 6.9 1,416,211 4,656,433 4,548,232 2.4
Net Real ./Unt. (Rs ) 40,635 39,333 3.3 40,433 40,195 38,746 3.7
RM Cos t/Unit (Rs ) 29,425 29,148 0.9 28,919 28,986 28,490 1.7
EBITDA/Unit (Rs ) 6,035 4,950 21.9 5,880 5,932 5,353 10.8
Net Profi t/Unit (Rs ) 3,566 3,101 15.0 3,400 3,500 3,395 3.1
Bajaj Auto
Rating Accumulate
Price (Rs ) 1,918
Target Price (Rs ) 2,034
M/Cap (Rs bn) 555.1
Shares o/s (m) 289.4
Key Figures (Rs m)
Y/e March FY13 FY14E FY15E
Net Sa les 202,880 210,209 239,412
EBITDA 39,260 46,007 52,772
Margin (%) 19.4 21.9 22.0
PAT 29,116 34,598 39,230
EPS (Rs ) 100.6 119.6 135.6
Growth (%) (7.2) 18.8 13.4
RoE (%) 41.8 39.7 37.5
PE (x) 19.1 16.0 14.1
P / BV (x) 7.0 5.8 4.9
EV / E (x) 14.0 12.0 10.4
Hero Motocorp
Rating Accumulate
Price (Rs ) 2,065
Target Price (Rs ) 2,342
M/Cap (Rs bn) 412.3
Shares o/s (m) 199.7
Key Figures (Rs m)
Y/e March FY13 FY14E FY15E
Net Sa les 237,681 252,864 286,816
EBITDA 32,845 37,306 44,817
Margin (%) 13.8 14.8 15.6
PAT 21,100 21,902 30,168
EPS (Rs ) 105.7 109.7 151.1
Growth (%) (11.3) 3.8 37.7
RoE (%) 45.4 39.3 43.7
PE (x) 19.5 18.8 13.7
P / BV (x) 8.2 6.7 5.4
EV / E (x) 12.5 11.0 9.1
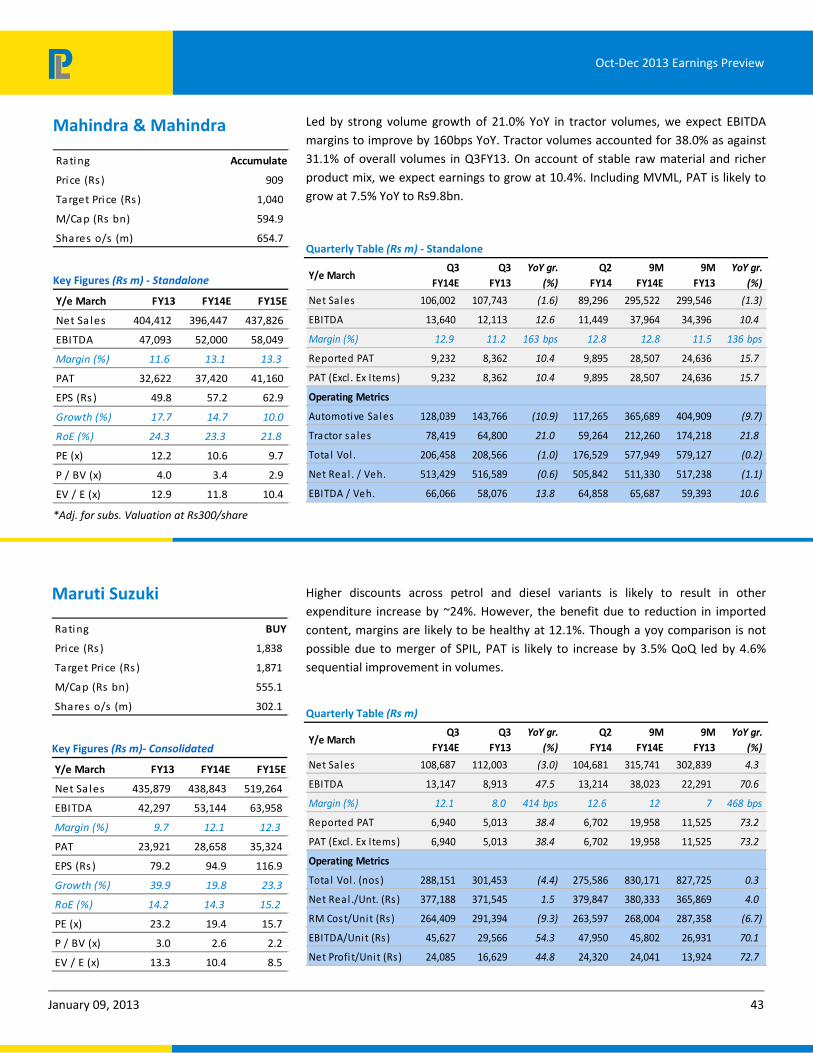
January 09, 2013 43
Oct-Dec 2013 Earnings Preview
Led by strong volume growth of 21.0% YoY in tractor volumes, we expect EBITDA margins to improve by 160bps YoY. Tractor volumes accounted for 38.0% as against 31.1% of overall volumes in Q3FY13. On account of stable raw material and richer product mix, we expect earnings to grow at 10.4%. Including MVML, PAT is likely to grow at 7.5% YoY to Rs9.8bn.
Quarterly Table (Rs m) ‐ Standalone
Y/e MarchQ3
FY14E
Q3
FY13
YoY gr.
(%)
Q2
FY14
9M
FY14E
9M
FY13
YoY gr.
(%)
Net Sales 106,002 107,743 (1.6) 89,296 295,522 299,546 (1.3)
EBITDA 13,640 12,113 12.6 11,449 37,964 34,396 10.4
Margin (%) 12.9 11.2 163 bps 12.8 12.8 11.5 136 bps
Reported PAT 9,232 8,362 10.4 9,895 28,507 24,636 15.7
PAT (Excl . Ex Items) 9,232 8,362 10.4 9,895 28,507 24,636 15.7
Operating Metrics
Automotive Sales 128,039 143,766 (10.9) 117,265 365,689 404,909 (9.7)
Tractor sa les 78,419 64,800 21.0 59,264 212,260 174,218 21.8
Tota l Vol . 206,458 208,566 (1.0) 176,529 577,949 579,127 (0.2)
Net Real . / Veh. 513,429 516,589 (0.6) 505,842 511,330 517,238 (1.1)
EBITDA / Veh. 66,066 58,076 13.8 64,858 65,687 59,393 10.6
Higher discounts across petrol and diesel variants is likely to result in other expenditure increase by ~24%. However, the benefit due to reduction in imported content, margins are likely to be healthy at 12.1%. Though a yoy comparison is not possible due to merger of SPIL, PAT is likely to increase by 3.5% QoQ led by 4.6% sequential improvement in volumes.
Quarterly Table (Rs m)
Y/e MarchQ3
FY14E
Q3
FY13
YoY gr.
(%)
Q2
FY14
9M
FY14E
9M
FY13
YoY gr.
(%)
Net Sales 108,687 112,003 (3.0) 104,681 315,741 302,839 4.3
EBITDA 13,147 8,913 47.5 13,214 38,023 22,291 70.6
Margin (%) 12.1 8.0 414 bps 12.6 12 7 468 bps
Reported PAT 6,940 5,013 38.4 6,702 19,958 11,525 73.2
PAT (Excl . Ex Items) 6,940 5,013 38.4 6,702 19,958 11,525 73.2
Operating Metrics
Tota l Vol . (nos ) 288,151 301,453 (4.4) 275,586 830,171 827,725 0.3
Net Real ./Unt. (Rs ) 377,188 371,545 1.5 379,847 380,333 365,869 4.0
RM Cos t/Unit (Rs ) 264,409 291,394 (9.3) 263,597 268,004 287,358 (6.7)
EBITDA/Unit (Rs ) 45,627 29,566 54.3 47,950 45,802 26,931 70.1
Net Profi t/Unit (Rs ) 24,085 16,629 44.8 24,320 24,041 13,924 72.7
Mahindra & Mahindra
Rating Accumulate
Price (Rs ) 909
Target Pri ce (Rs ) 1,040
M/Cap (Rs bn) 594.9
Shares o/s (m) 654.7
Key Figures (Rs m) ‐ Standalone
Y/e March FY13 FY14E FY15E
Net Sa les 404,412 396,447 437,826
EBITDA 47,093 52,000 58,049
Margin (%) 11.6 13.1 13.3
PAT 32,622 37,420 41,160
EPS (Rs ) 49.8 57.2 62.9
Growth (%) 17.7 14.7 10.0
RoE (%) 24.3 23.3 21.8
PE (x) 12.2 10.6 9.7
P / BV (x) 4.0 3.4 2.9
EV / E (x) 12.9 11.8 10.4
*Adj. for subs. Valuation at Rs300/share
Maruti Suzuki
Rating BUY
Price (Rs ) 1,838
Target Pri ce (Rs ) 1,871
M/Cap (Rs bn) 555.1
Shares o/s (m) 302.1
Key Figures (Rs m)‐ Consolidated
Y/e March FY13 FY14E FY15E
Net Sa les 435,879 438,843 519,264
EBITDA 42,297 53,144 63,958
Margin (%) 9.7 12.1 12.3
PAT 23,921 28,658 35,324
EPS (Rs ) 79.2 94.9 116.9
Growth (%) 39.9 19.8 23.3
RoE (%) 14.2 14.3 15.2
PE (x) 23.2 19.4 15.7
P / BV (x) 3.0 2.6 2.2
EV / E (x) 13.3 10.4 8.5

January 09, 2013 44
Oct-Dec 2013 Earnings Preview
On a standalone basis, M&HCV volumes de-grew by 28.8% YoY, whereas the LCV segment de-grew by 41.1%. On account of 36.1% YoY decline in overall volumes and higher discounts in the M&HCV segment, EBITDA is likely to be negative. As a result, we expect a loss of Rs7.5bn in the standalone business. JLR volumes improved by 9.1% YoY led by Jaguar which reported a ~65% YoY growth in volumes. On account of product mix in favour of the New ‘Range Rover’ and robust Jaguar volumes, we expect margins to expand by 180bps YoY to 15.8% at JLR.
Quarterly Table (Rs m)
Y/e MarchQ3
FY14E
Q3
FY13
YoY gr.
(%)
Q2
FY14
9M
FY14E
9M
FY13
YoY gr.
(%)
Net Sales 576,975 460,895 25.2 568,823 1,613,645 1,328,160 21.5
EBITDA 83,136 61,438 35.3 92,730 243,399 182,596 33.3
Margin (%) 14.4 13.3 108 bps 16.3 15.1 13.7 134 bps
Reported PAT 31,605 16,275 94.2 35,419 84,284 57,854 45.7
PAT (Excl . Ex Items) 31,605 18,010 75.5 38,157 88,809 65,717 35.1
Operating Metrics
Stnd. Topl ine (Rs m) 73,719 106,301 (30.7) 88,685 253,448 341,734 (25.8)
Stnd. EBITDA (Rs m) (220) 2,338 NA 1,776 3,621 20,402 (82.3)
JLR Volumes (nos) 103,431 94,828 9.1 101,931 295,982 255,722 15.7
JLR Topl ine (Rs m) 480,857 334,567 43.7 457,950 1,292,456 940,375 37.4
JLR EBITDA (Rs m) 76,128 46,904 62.3 81,724 210,113 135,794 54.7
Tata Motors
Rating Accumulate
Price (Rs ) 370
Target Pri ce (Rs ) 406
M/Cap (Rs bn) 1,234.8
Shares o/s (m) 3,335.1
Key Figures (Rs m)
Y/e March FY13 FY14E FY15E
Net Sa les 1,888,176 2,269,504 2,658,449
EBITDA 265,890 344,319 417,982
Margin (%) 14.1 15.2 15.7
PAT 105,517 129,966 165,567
EPS (Rs ) 31.6 39.0 49.6
Growth (%) (22.0) 23.2 27.4
RoE (%) 28.2 28.0 29.6
PE (x) 11.7 9.5 7.5
P / BV (x) 3.0 2.4 2.0
EV / E (x) 5.8 4.6 4.0

January 09, 2014 45
Oct-Dec 2013 Earnings Preview
Surjit Arora [email protected] +91-22-6632 2235
Top picks
Motherson Sumi
Apollo Tyres
Auto Ancillary
Ancillary companies under our coverage are expected to post a growth of 11.4% YoY, mainly attributed to higher realisation in the export markets and price hikes by battery manufacturers. Battery companies are likely to report 15%+ growth mainly led by cumulative 10-12% price hikes in the auto replacement segment and 6-7% volume growth.
At the same time, gross margin expansion for tyre companies is likely to continue, given that rubber has further slid by ~9% QoQ in the December quarter.
Driven by tyre companies and margin expansion at Motherson Sumi (on account of strong topline), we expect EBITDA margin for our coverage universe to improve by 250bps YoY.
Key Raw Material
90
92
94
96
98
100
102
104
160
170
180
190
200
210
220
230
Q3FY13 Q4FY13 Q1FY14 Q2FY14 Q3FY14E
Avg. Rubber Prices (Rs /kg) Crude Prices (US$ / bbl) (RHS)
Source: PL Research
As a result, PAT for our coverage universe, is expected to grow by 40.1% YoY, mainly on account of 64.4% growth in profit at Motherson Sumi (MSS) led by margin expansion across the subsidiary companies. BHFC would continue to report doubling of profit on account of higher exports and lower base of last year.
Apollo Tyres (APTY): With average rubber price of Rs160/kg for December quarter as against Rs176/kg for September quarter, we expect gross margins to further improve by 60-80bps QoQ. On account of cooper deal unlikely to go through, the stock has reverted back to Rs100 levels (levels it had corrected from) from Rs70 levels. Now, in our view, it will play a catch up with JK, MRF and CEAT which have gained 50-70% in the stock price. At the CMP, the stock trades at 6.5x FY14E and 6.2x FY15E earnings, which in our view is attractive, given 30%+ earnings growth. Despite the recent run up, the stock could run up to Rs130 levels (valued at 7.5x FY15E earnings).
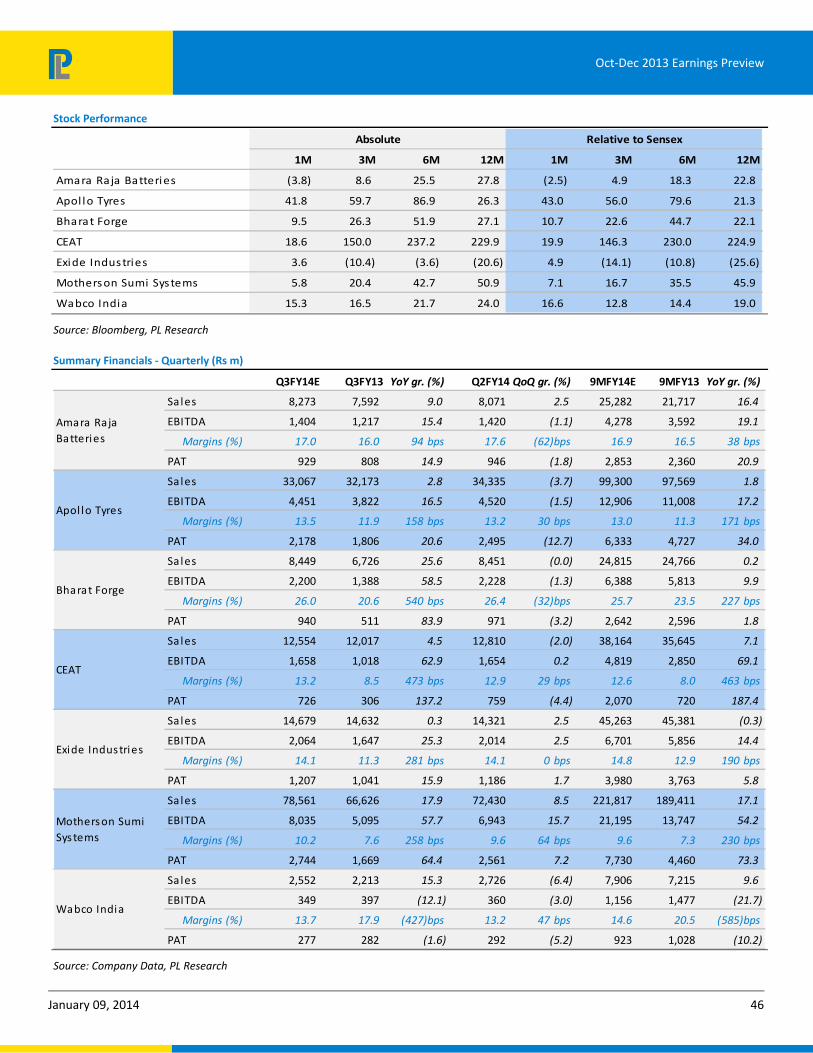
January 09, 2014 46
Oct-Dec 2013 Earnings Preview
Stock Performance
1M 3M 6M 12M 1M 3M 6M 12M
Amara Raja Batteries (3.8) 8.6 25.5 27.8 (2.5) 4.9 18.3 22.8
Apol lo Tyres 41.8 59.7 86.9 26.3 43.0 56.0 79.6 21.3
Bharat Forge 9.5 26.3 51.9 27.1 10.7 22.6 44.7 22.1
CEAT 18.6 150.0 237.2 229.9 19.9 146.3 230.0 224.9
Exide Industries 3.6 (10.4) (3.6) (20.6) 4.9 (14.1) (10.8) (25.6)
Motherson Sumi Systems 5.8 20.4 42.7 50.9 7.1 16.7 35.5 45.9
Wabco India 15.3 16.5 21.7 24.0 16.6 12.8 14.4 19.0
Absolute Relative to Sensex
Source: Bloomberg, PL Research
Summary Financials ‐ Quarterly (Rs m)
Q3FY14E Q3FY13 YoY gr. (%) Q2FY14 QoQ gr. (%) 9MFY14E 9MFY13 YoY gr. (%)
Sales 8,273 7,592 9.0 8,071 2.5 25,282 21,717 16.4
EBITDA 1,404 1,217 15.4 1,420 (1.1) 4,278 3,592 19.1
Margins (%) 17.0 16.0 94 bps 17.6 (62)bps 16.9 16.5 38 bps
PAT 929 808 14.9 946 (1.8) 2,853 2,360 20.9
Sales 33,067 32,173 2.8 34,335 (3.7) 99,300 97,569 1.8
EBITDA 4,451 3,822 16.5 4,520 (1.5) 12,906 11,008 17.2
Margins (%) 13.5 11.9 158 bps 13.2 30 bps 13.0 11.3 171 bps
PAT 2,178 1,806 20.6 2,495 (12.7) 6,333 4,727 34.0
Sales 8,449 6,726 25.6 8,451 (0.0) 24,815 24,766 0.2
EBITDA 2,200 1,388 58.5 2,228 (1.3) 6,388 5,813 9.9
Margins (%) 26.0 20.6 540 bps 26.4 (32)bps 25.7 23.5 227 bps
PAT 940 511 83.9 971 (3.2) 2,642 2,596 1.8
Sales 12,554 12,017 4.5 12,810 (2.0) 38,164 35,645 7.1
EBITDA 1,658 1,018 62.9 1,654 0.2 4,819 2,850 69.1
Margins (%) 13.2 8.5 473 bps 12.9 29 bps 12.6 8.0 463 bps
PAT 726 306 137.2 759 (4.4) 2,070 720 187.4
Sales 14,679 14,632 0.3 14,321 2.5 45,263 45,381 (0.3)
EBITDA 2,064 1,647 25.3 2,014 2.5 6,701 5,856 14.4
Margins (%) 14.1 11.3 281 bps 14.1 0 bps 14.8 12.9 190 bps
PAT 1,207 1,041 15.9 1,186 1.7 3,980 3,763 5.8
Sales 78,561 66,626 17.9 72,430 8.5 221,817 189,411 17.1
EBITDA 8,035 5,095 57.7 6,943 15.7 21,195 13,747 54.2
Margins (%) 10.2 7.6 258 bps 9.6 64 bps 9.6 7.3 230 bps
PAT 2,744 1,669 64.4 2,561 7.2 7,730 4,460 73.3
Sales 2,552 2,213 15.3 2,726 (6.4) 7,906 7,215 9.6
EBITDA 349 397 (12.1) 360 (3.0) 1,156 1,477 (21.7)
Margins (%) 13.7 17.9 (427)bps 13.2 47 bps 14.6 20.5 (585)bps
PAT 277 282 (1.6) 292 (5.2) 923 1,028 (10.2)
Wabco India
Motherson Sumi Sys tems
Amara Raja Batteries
Apol lo Tyres
Bharat Forge
CEAT
Exide Industries
Source: Company Data, PL Research

January 09, 2014 47
Oct-Dec 2013 Earnings Preview
Consolidated Sectoral Data
Quarterly Table (Rs m)
Oct‐Dec'13 Oct‐Dec'12 YoY gr. (%) Jul‐Sep'13 QoQ gr. (%)
Net Sales 158,133 141,977 11.4 153,144 3.3
EBITDA 20,161 14,584 38.2 19,138 5.3
Margin (%) 12.7 10.3 248 bps 12.5 25 bps
PAT (Excl . Ex Items) 9,000 6,423 40.1 9,210 (2.3)
Note: Revenue, EBITDA and PAT numbers are arrived by totaling corresponding numbers of all companies under our coverage in this
sector.
AMRJ is likely to post a 9.0% YoY growth in the top-line, mainly on account of a strong traction from the automotive replacement segment. EBITDA margin is likely to improve by 90bps YoY on account of better product mix. Going forward, AMRJ has taken price cut to the tune of 5% which would restrict margin expansion.
Quarterly Table (Rs m)
Y/e MarchQ3
FY14E
Q3
FY13
YoY gr.
(%)
Q2
FY14
9M
FY14E
9M
FY13
YoY gr.
(%)
Net Sales 8,273 7,592 9.0 8,071 25,282 21,717 16.4
EBITDA 1,404 1,217 15.4 1,420 4,278 3,592 19.1
Margin (%) 17.0 16.0 94 bps 17.6 16.9 16.5 38 bps
Reported PAT 929 808 14.9 946 2,853 2,360 20.9
PAT (Excl. Ex Items) 929 808 14.9 946 2,853 2,360 20.9
Key Figures (Rs m)
2013 2014E 2015E
Net Sales 589,671 663,140 753,353
Growth (%) 27.2 12.5 13.6
EBITDA 60,198 80,861 95,056
Margin (%) 10.2 12.2 12.6
PAT 24,526 36,378 42,704
Growth (%) 17.2 48.3 17.4
PE (x) 21.3 14.3 12.2
Amara Raja Batteries
Rating Reduce
Price (Rs ) 332
Target Price (Rs ) 327
M/Cap (Rs bn) 56.8
Shares o/s (m) 170.8
Key Figures (Rs m)
Y/e March FY13 FY14E FY15E
Net Sa l es 29,811 33,932 39,359
EBITDA 4,712 5,699 6,576
Margin (%) 15.8 16.8 16.7
PAT 2,943 3,591 3,994
EPS (Rs ) 17.2 21.0 23.4
Growth (%) 36.7 22.0 11.2
RoE (%) 31.3 29.6 26.0
PE (x) 19.3 15.8 14.2
P / BV (x) 5.4 4.2 3.3
EV / E (x) 11.4 9.9 8.4

January 09, 2014 48
Oct-Dec 2013 Earnings Preview
We expect Apollo Tyres to post a 2.8% YoY growth in top-line, mainly on account of a flat growth in domestic revenues reflecting the slowdown in the CV segment. Vredestein revenue is likely to grow at 16.4% led by seasonally strong December quarter due to cold weather conditions. On account of lower rubber cost, EBITDA margin is likely to improve by 160bps YoY.
Quarterly Table (Rs m)
Y/e MarchQ3
FY14E
Q3
FY13
YoY gr.
(%)
Q2
FY14
9M
FY14E
9M
FY13
YoY gr.
(%)
Net Sales 33,067 32,173 2.8 34,335 99,300 97,569 1.8
EBITDA 4,451 3,822 16.5 4,520 12,906 11,008 17.2
Margin (%) 13.5 11.9 158 bps 13.2 13.0 11.3 171 bps
Reported PAT 2,178 1,806 20.6 2,195 6,033 4,727 27.6
PAT (Excl. Ex Items) 2,178 1,806 20.6 2,495 6,333 4,727 34.0
Operating Metrics
Standalone - Rev. 20,542 20,361 0.9 21,068 63,257 64,713 (2.2)
Dunlop-Rev. 3,850 4,056 (5.1) 3,752 11,513 11,962 (3.8)
VBVV Rev. 9,500 8,159 16.4 10,609 27,372 22,682 20.7
We expect the top-line to report a growth of 25.6% YoY, mainly due to 56.7% YoY growth in the export revenues. This is slightly negated by a 5% decline in domestic revenues. EBITDA/kg is expected at Rs52.0/kg (flat QoQ).
Quarterly Table (Rs m) ‐ Standalone
Y/e MarchQ3
FY14E
Q3
FY13
YoY gr.
(%)
Q2
FY14
9M
FY14E
9M
FY13
YoY gr.
(%)
Net Sales 8,449 6,726 25.6 8,451 24,815 24,766 0.2
EBITDA 2,200 1,388 58.5 2,228 6,388 5,813 9.9
Margin (%) 26.0 20.6 540 bps 26.4 25.7 23.5 227 bps
Reported PAT 940 475 97.8 971 2,817 2,560 10.0
PAT (Excl. Ex Items) 940 511 83.9 971 2,642 2,596 1.8
Apollo Tyres
Rating BUY
Price (Rs ) 113
Target Price (Rs ) 138
M/Cap (Rs bn) 57.1
Shares o/s (m) 506.8
Key Figures (Rs m)
Y/e March FY13 FY14E FY15E
Net Sa l es 127,428 137,451 148,751
EBITDA 14,062 17,429 18,653
Margin (%) 11.0 12.7 12.5
PAT 5,452 8,292 8,708
EPS (Rs ) 10.8 16.4 17.2
Growth (%) 23.5 52.1 5.0
RoE (%) 17.6 22.3 19.6
PE (x) 10.5 6.9 6.6
P / BV (x) 1.7 1.4 1.2
EV / E (x) 5.8 4.4 3.7
Bharat Forge
Rating Accumulate
Price (Rs ) 332
Target Price (Rs ) 352
M/Cap (Rs bn) 81.6
Shares o/s (m) 246.0
Key Figures (Rs m) ‐ Consolidated
Y/e March FY13 FY14E FY15E
Net Sa l es 57,022 61,663 70,517
EBITDA 7,902 10,657 12,621
Margin (%) 13.9 17.3 17.9
PAT 2,319 3,974 5,200
EPS (Rs ) 9.4 16.2 21.1
Growth (%) (44.9) 71.4 30.8
RoE (%) 10.0 15.2 16.8
PE (x) 35.2 20.5 15.7
P / BV (x) 3.4 2.9 2.4
EV / E (x) 12.6 8.9 7.1
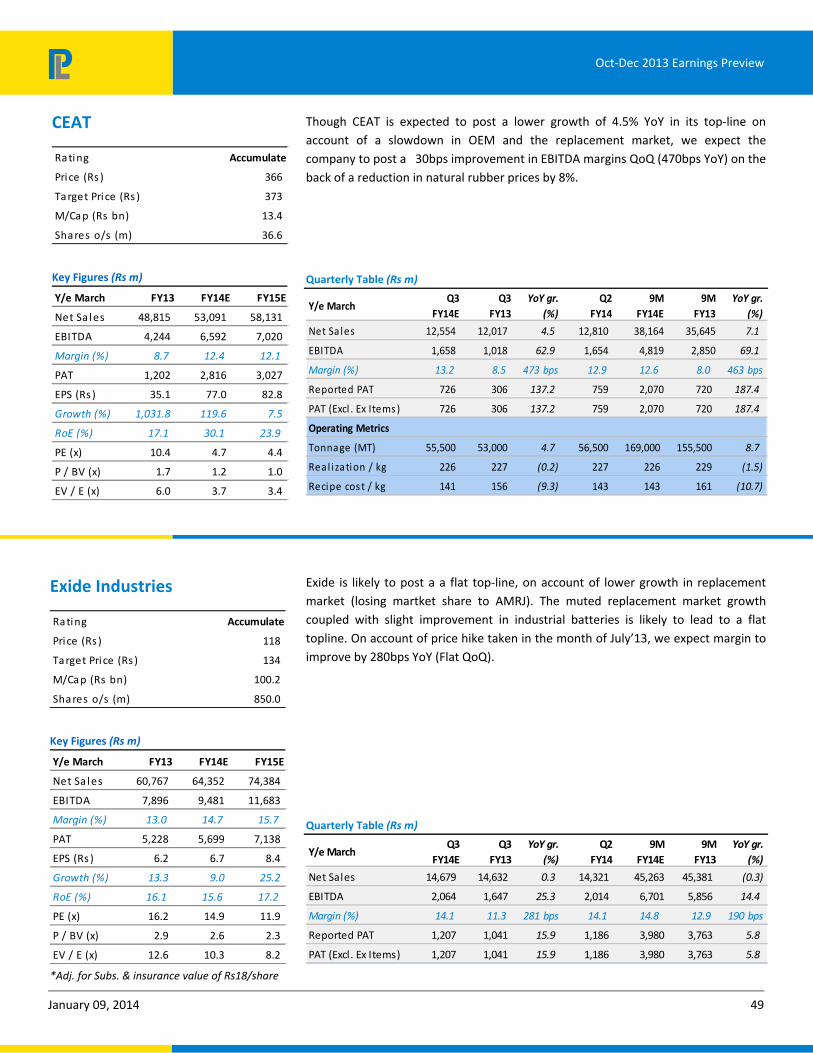
January 09, 2014 49
Oct-Dec 2013 Earnings Preview
Though CEAT is expected to post a lower growth of 4.5% YoY in its top-line on account of a slowdown in OEM and the replacement market, we expect the company to post a 30bps improvement in EBITDA margins QoQ (470bps YoY) on the back of a reduction in natural rubber prices by 8%.
Quarterly Table (Rs m)
Y/e MarchQ3
FY14E
Q3
FY13
YoY gr.
(%)
Q2
FY14
9M
FY14E
9M
FY13
YoY gr.
(%)
Net Sa les 12,554 12,017 4.5 12,810 38,164 35,645 7.1
EBITDA 1,658 1,018 62.9 1,654 4,819 2,850 69.1
Margin (%) 13.2 8.5 473 bps 12.9 12.6 8.0 463 bps
Reported PAT 726 306 137.2 759 2,070 720 187.4
PAT (Excl . Ex Items ) 726 306 137.2 759 2,070 720 187.4
Operating Metrics
Tonnage (MT) 55,500 53,000 4.7 56,500 169,000 155,500 8.7
Real ization / kg 226 227 (0.2) 227 226 229 (1.5)
Recipe cos t / kg 141 156 (9.3) 143 143 161 (10.7)
Exide is likely to post a a flat top-line, on account of lower growth in replacement market (losing martket share to AMRJ). The muted replacement market growth coupled with slight improvement in industrial batteries is likely to lead to a flat topline. On account of price hike taken in the month of July’13, we expect margin to improve by 280bps YoY (Flat QoQ).
Quarterly Table (Rs m)
Y/e MarchQ3
FY14E
Q3
FY13
YoY gr.
(%)
Q2
FY14
9M
FY14E
9M
FY13
YoY gr.
(%)
Net Sales 14,679 14,632 0.3 14,321 45,263 45,381 (0.3)
EBITDA 2,064 1,647 25.3 2,014 6,701 5,856 14.4
Margin (%) 14.1 11.3 281 bps 14.1 14.8 12.9 190 bps
Reported PAT 1,207 1,041 15.9 1,186 3,980 3,763 5.8
PAT (Excl. Ex Items) 1,207 1,041 15.9 1,186 3,980 3,763 5.8
CEAT
Rating Accumulate
Price (Rs ) 366
Target Price (Rs ) 373
M/Cap (Rs bn) 13.4
Shares o/s (m) 36.6
Key Figures (Rs m)
Y/e March FY13 FY14E FY15E
Net Sa l es 48,815 53,091 58,131
EBITDA 4,244 6,592 7,020
Margin (%) 8.7 12.4 12.1
PAT 1,202 2,816 3,027
EPS (Rs ) 35.1 77.0 82.8
Growth (%) 1,031.8 119.6 7.5
RoE (%) 17.1 30.1 23.9
PE (x) 10.4 4.7 4.4
P / BV (x) 1.7 1.2 1.0
EV / E (x) 6.0 3.7 3.4
Exide Industries
Rating Accumulate
Price (Rs ) 118
Target Price (Rs ) 134
M/Cap (Rs bn) 100.2
Shares o/s (m) 850.0
Key Figures (Rs m)
Y/e March FY13 FY14E FY15E
Net Sa l es 60,767 64,352 74,384
EBITDA 7,896 9,481 11,683
Margin (%) 13.0 14.7 15.7
PAT 5,228 5,699 7,138
EPS (Rs ) 6.2 6.7 8.4
Growth (%) 13.3 9.0 25.2
RoE (%) 16.1 15.6 17.2
PE (x) 16.2 14.9 11.9
P / BV (x) 2.9 2.6 2.3
EV / E (x) 12.6 10.3 8.2
*Adj. for Subs. & insurance value of Rs18/share

January 09, 2014 50
Oct-Dec 2013 Earnings Preview
Samvardhana Motherson Reflectec (SMR) is likely to grow by 26.4% YoY in revenue terms (17.7% growth in Euro terms). Utilization levels improving at SMR level is likely to lead to an improvement of 140bps in EBITDA margins at SMR. We expect Peguform to report a 24.8% growth with an EBITDA margin of 6.0% (improvement of 210bps). On account of improvement in standalone margins by 160bps in standalone business on a YoY basis, overall EBITDA margins are likely to improve by 250bps YoY.
Quarterly Table (Rs m)
Y/e MarchQ3
FY14E
Q3
FY13
YoY gr.
(%)
Q2
FY14
9M
FY14E
9M
FY13
YoY gr.
(%)
Net Sales 78,561 66,626 17.9 72,430 221,817 189,411 17.1
EBITDA 8,035 5,095 57.7 6,943 21,195 13,747 54.2
Margin (%) 10.2 7.6 258 bps 9.6 9.6 7.3 230 bps
Reported PAT 2,744 1,030 166.3 2,561 6,037 2,488 142.6
PAT (Excl. Ex Items) 2,744 1,669 64.4 2,561 7,730 4,460 73.3
Operating Metrics
SMP Sales (Rs m) 41,580 33,324 24.8 36,050 113,566 95,714 18.7
SMR Sales (Rs m) 23,275 18,421 26.4 21,256 65,162 50,311 18.7
Standalone Sales (Rs 10,972 10,645 3.1 11,165 32,919 30,896 6.5
EBITDA - SMP (%) 6.1 4.0 211 bps 6.0 5.8 4.0 180 bps
EBITDA - SMR (%) 8.5 7.0 144 bps 8.8 8.6 5.5 310 bps
Wabco is likely to report a better topline than the fall in the M&HCV segment , aided by higher exports and Spare sales, The topline is likely to improve by 15.3% YoY, however the EBITDA margins are likely to decline by 430bps YoY due to an increase in operating expenses.
Quarterly Table (Rs m)
Y/e MarchQ3
FY14E
Q3
FY13
YoY gr.
(%)
Q2
FY14
9M
FY14E
9M
FY13
YoY gr.
(%)
Net Sa les 2,552 2,213 15.3 2,726 7,906 7,215 9.6
EBITDA 349 397 (12.1) 360 1,156 1,477 (21.7)
Margin (%) 13.7 17.9 (427)bps 13.2 14.6 20.5 (585)bps
Reported PAT 277 282 (1.6) 292 923 1,028 (10.2)
PAT (Excl . Ex Items ) 277 282 (1.6) 292 923 1,028 (10.2)
Motherson Sumi Systems
Ra ting Accumulate
Price (Rs ) 198
Ta rget Price (Rs ) 209
M/Ca p (Rs bn) 174.6
Sha res o/s (m) 881.0
Key Figures (Rs m)
Y/e March FY13 FY14E FY15E
Net Sa l es 256,170 302,680 349,857
EBITDA 19,441 29,376 35,945
Margin (%) 7.6 9.7 10.3
PAT 6,074 10,732 12,779
EPS (Rs ) 10.3 12.2 14.5
Growth (%) 55.1 17.8 19.1
RoE (%) 29.2 39.6 35.1
PE (x) 19.2 16.3 13.7
P / BV (x) 5.1 5.6 4.2
EV / E (x) 11.2 7.2 5.3
Wabco India
Rating Accumulate
Price (Rs ) 2,000
Target Pri ce (Rs ) 1,959
M/Cap (Rs bn) 37.9
Shares o/s (m) 19.0
Key Figures (Rs m)
Y/e March FY13 FY14E FY15E
Net Sa les 9,658 9,972 12,354
EBITDA 1,941 1,627 2,557
Margin (%) 20.1 16.3 20.7
PAT 1,308 1,273 1,858
EPS (Rs ) 69.0 67.1 97.9
Growth (%) (14.7) (2.7) 46.0
RoE (%) 22.2 18.0 21.9
PE (x) 29.0 29.8 20.4
P / BV (x) 5.8 5.0 4.1
EV / E (x) 19.0 22.4 14.1

January 09, 2013 51
Oct-Dec 2013 Earnings Preview
Adarsh Parasrampuria [email protected] +91-22-6632 2236
Pritesh Bumb [email protected] +91-22-6632 2232
Top picks
ICICI Bank
Axis Bank
HDFC Bank
Shriram Transport Finance
Banking & Financial Services
3Q14 profitability for India Financials in general is likely to come off to (2% YoY PAT
contraction) due to weak growth and elevated credit costs. Slower growth will feed
into private bank’s PPOP growth (15% YoY growth) inspite of moderating opex and
elevated credit costs for corporate balance sheet linked banks will lead to muted
PAT growth (<10% YoY). For PSUs, operating metrics is unlikely to inspire any
comfort (PPOP to contract 2% YoY) and though some PSU banks have guided for an
improvement in delinquency levels, we believe that it is still too early to
extrapolate that as a trend.
Operating performance to remain muted: (1) For PSU banks, we expect NIMs to remain at 2Q14 levels but high opex growth and weak fees, we expect PPOP to contract 2% YoY (2) With wholesale funding rates easing, we expect NIMs for private banks to stabilize as well in 3Q. Slower opex growth has been one of the key PPOP drivers which is likely to continue (private banks PPOP growth of 15%).
Asset quality‐ Diverging guidance: Guidance from 2-3 Large PSUs (BOB/PNB/BOI) indicate positive sequential trends vs muted guidance by SBI/ Union but given macro weakness we believe it is still too early to extrapolate the trend. Provisions though will remain elevated due to MTM provisioning and need to build up coverage. For private banks, restructuring will increase for corporate balance sheet linked banks as guided by Axis/ICICI but the quantum of increase will be the key to watch (20-25% increase factored in). Our feedback from regional banks indicates a relatively stable qtr for most names (Fed/ ING/SIB).
NBFCs: (1) MMFS’s margins to remain steady but collections will likely miss expectations and hence YoY gross NPA formation will remain high (2) Credit costs will remain elevated for Shriram in 2HFY14 but margins is likely to see some recovery as mgt uses up the excess liquidity built up in 2Q14 (3) Spreads for LICHF is likely to remain flat QoQ.
Surprises and Misses: (1) ICICI – Margins and fees to positively surprise but restructuring likely to exceed expectations (2) Guidance of 15-20% lower QoQ slippages being factored in for BOB/PNB and any deviation will lead to positive/ negative surprise. (3) Collection rates for Mahindra Finance may negatively surprise. (4) Positive asset quality trend for most regional names we cover - Fed/J&K/SIB.
Sector and Stock View: In spite of hope of a positive election outcome and stability in CAD, we caution investors against assigning a higher multiple as (1) Most asset quality issues remain largely unresolved, (2) High inflation/rates and (3) Slowing PPOP growth even for private banks. We see only 10‐12% upside in
our top picks (Axis/HDFCB) but with the recent ~15% correction, risk‐reward is
getting incrementally favorable for ICICI (17% upside).
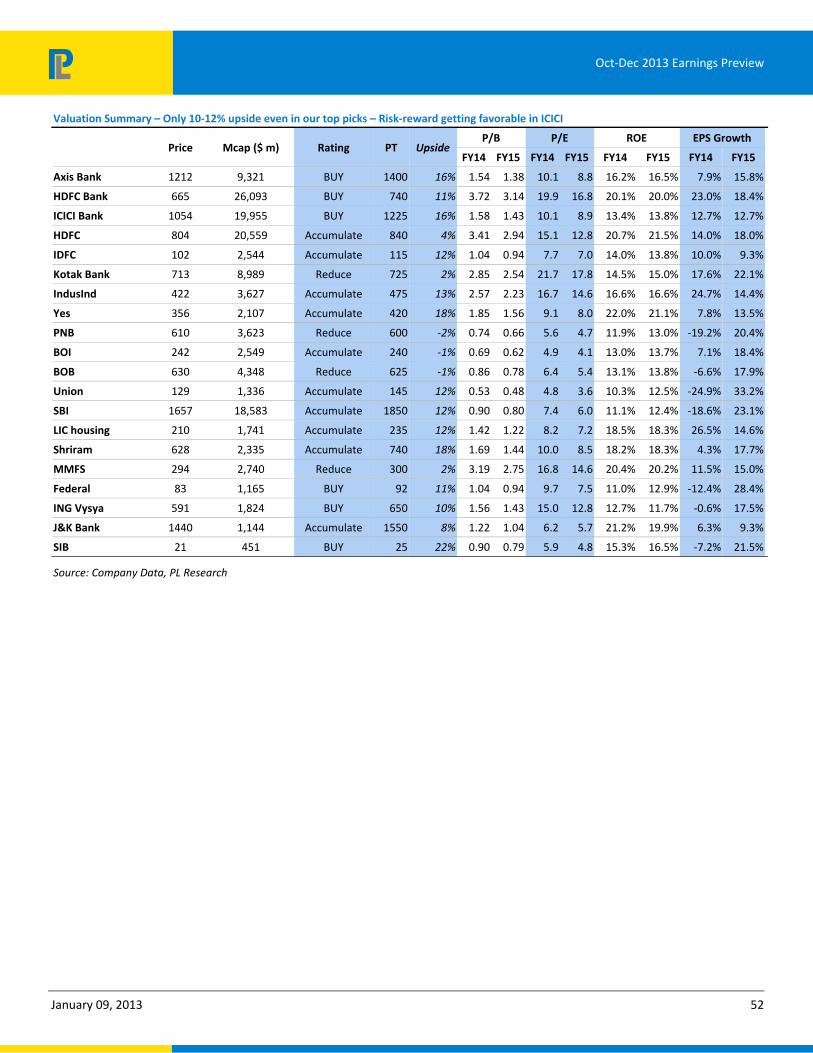
January 09, 2013 52
Oct-Dec 2013 Earnings Preview
Valuation Summary – Only 10‐12% upside even in our top picks – Risk‐reward getting favorable in ICICI
Price Mcap ($ m) Rating PT Upside P/B P/E ROE EPS Growth
FY14 FY15 FY14 FY15 FY14 FY15 FY14 FY15
Axis Bank 1212 9,321 BUY 1400 16% 1.54 1.38 10.1 8.8 16.2% 16.5% 7.9% 15.8%
HDFC Bank 665 26,093 BUY 740 11% 3.72 3.14 19.9 16.8 20.1% 20.0% 23.0% 18.4%
ICICI Bank 1054 19,955 BUY 1225 16% 1.58 1.43 10.1 8.9 13.4% 13.8% 12.7% 12.7%
HDFC 804 20,559 Accumulate 840 4% 3.41 2.94 15.1 12.8 20.7% 21.5% 14.0% 18.0%
IDFC 102 2,544 Accumulate 115 12% 1.04 0.94 7.7 7.0 14.0% 13.8% 10.0% 9.3%
Kotak Bank 713 8,989 Reduce 725 2% 2.85 2.54 21.7 17.8 14.5% 15.0% 17.6% 22.1%
IndusInd 422 3,627 Accumulate 475 13% 2.57 2.23 16.7 14.6 16.6% 16.6% 24.7% 14.4%
Yes 356 2,107 Accumulate 420 18% 1.85 1.56 9.1 8.0 22.0% 21.1% 7.8% 13.5%
PNB 610 3,623 Reduce 600 ‐2% 0.74 0.66 5.6 4.7 11.9% 13.0% -19.2% 20.4%
BOI 242 2,549 Accumulate 240 ‐1% 0.69 0.62 4.9 4.1 13.0% 13.7% 7.1% 18.4%
BOB 630 4,348 Reduce 625 ‐1% 0.86 0.78 6.4 5.4 13.1% 13.8% -6.6% 17.9%
Union 129 1,336 Accumulate 145 12% 0.53 0.48 4.8 3.6 10.3% 12.5% -24.9% 33.2%
SBI 1657 18,583 Accumulate 1850 12% 0.90 0.80 7.4 6.0 11.1% 12.4% -18.6% 23.1%
LIC housing 210 1,741 Accumulate 235 12% 1.42 1.22 8.2 7.2 18.5% 18.3% 26.5% 14.6%
Shriram 628 2,335 Accumulate 740 18% 1.69 1.44 10.0 8.5 18.2% 18.3% 4.3% 17.7%
MMFS 294 2,740 Reduce 300 2% 3.19 2.75 16.8 14.6 20.4% 20.2% 11.5% 15.0%
Federal 83 1,165 BUY 92 11% 1.04 0.94 9.7 7.5 11.0% 12.9% -12.4% 28.4%
ING Vysya 591 1,824 BUY 650 10% 1.56 1.43 15.0 12.8 12.7% 11.7% -0.6% 17.5%
J&K Bank 1440 1,144 Accumulate 1550 8% 1.22 1.04 6.2 5.7 21.2% 19.9% 6.3% 9.3%
SIB 21 451 BUY 25 22% 0.90 0.79 5.9 4.8 15.3% 16.5% -7.2% 21.5%
Source: Company Data, PL Research

January 09, 2013 53
Oct-Dec 2013 Earnings Preview
Q3 Results Preview (Rs m) – Profitability coming off
NII QoQ YoY PPOP QoQ YoY PAT QoQ YoY
HDFC Bank 47,074 5.2% 18.2% 37,650 11.2% 20.6% 22,940 15.7% 23.4%
ICICI Bank 111,800 3.4% 10.3% 40,196 3.4% 16.4% 24,023 2.1% 6.8%
Axis Bank 29,454 0.3% 18.1% 26,303 ‐4.3% 11.4% 13,718 0.7% 1.8%
HDFC 18,223 4.2% 15.0% 17,164 5.0% 18.5% 12,905 1.8% 13.1%
SBI 127,970 4.5% 14.7% 74,036 17.3% ‐4.9% 26,979 13.6% ‐20.5%
PNB 40,549 1.0% 8.6% 26,162 3.2% ‐2.5% 10,087 99.5% ‐22.7%
BOI 27,103 7.2% 17.4% 20,559 ‐2.2% 10.8% 6,959 11.9% ‐13.4%
BOB 30,114 4.0% 6.0% 21,933 3.2% ‐2.8% 9,037 ‐23.7% ‐10.7%
Union 20,380 4.3% 7.7% 12,984 6.0% ‐4.4% 3,763 80.8% 24.4%
Kotak 9,363 1.3% 13.8% 6,353 4.7% 10.9% 3,743 6.2% 3.5%
IDFC 6,650 ‐3.1% 1.4% 7,336 ‐2.4% 4.8% 4,647 ‐4.8% 2.8%
IndusInd 7,210 3.0% 24.8% 5,800 ‐1.4% 22.8% 3,221 ‐2.5% 20.5%
Yes 6,835 1.7% 17.0% 6,163 ‐13.5% 9.4% 3,696 ‐0.4% 8.0%
SIB 3,743 2.8% 6.1% 2,282 7.6% ‐3.1% 1,341 5.8% 4.5%
ING 4,591 4.3% 13.9% 3,005 8.7% 14.1% 1,767 0.2% 8.8%
J&K 6,862 0.6% 15.5% 4,726 ‐4.8% 8.7% 2,906 ‐4.0% 0.4%
Federal 5,531 0.9% 11.2% 1,883 10.5% 15.2% 1,974 ‐12.6% ‐6.4%
LIC Housing 4,723 4.2% 27.8% 4,488 ‐1.9% 26.1% 3,130 1.0% 30.5%
MMFSL 7,002 3.3% 24.8% 4,788 3.5% 26.2% 2,297 3.9% 14.7%
Shriram Tran. 5,998 3.6% 27.7% 7,047 3.0% 1.4% 3,362 2.9% ‐2.8%
Total 522,016 3.1% 12.9% 330,810 4.9% 5.8% 161,735 6.9% ‐1.8%
Total Private 232,463 3.1% 13.7% 134,359 2.7% 15.4% 79,329 4.6% 9.9%
Total Public 246,116 4.1% 12.2% 155,674 8.9% ‐2.3% 56,824 16.1% ‐16.6%
Loans (Rs bn) QoQ YoY Margins (%) QoQ YoY LLP/Loans (%) QoQ YoY
HDFC Bank 2,847 6.0% 17.9% 4.61% 0.06% 0.13% 0.55% ‐0.02% ‐0.12%
ICICI Bank 3,300 3.8% 15.1% 3.27% ‐0.04% 0.20% 0.88% 0.10% 0.37%
Axis Bank 2,073 3.0% 15.5% 3.67% ‐0.12% 0.10% 1.18% ‐0.18% 0.32%
HDFC 2,090 4.1% 18.1% 3.33% 0.05% ‐0.03% 0.00% 0.00% 0.00%
SBI 11,417 3.5% 16.7% 3.21% 0.02% ‐0.10% 1.23% 0.14% 0.14%
PNB 3,233 3.0% 8.7% 3.41% ‐0.06% ‐0.06% 1.48% ‐0.94% 0.40%
BOI 3,322 ‐1.4% 18.5% 2.46% 0.07% 0.10% 1.28% ‐0.18% ‐0.03%
BOB 3,477 2.3% 16.2% 2.36% 0.04% ‐0.29% 1.14% 0.12% ‐0.26%
Union 2,195 1.0% 18.1% 2.59% 0.05% ‐0.36% 1.76% 0.04% ‐0.08%
Kotak 557 10.0% 10.8% 4.88% 0.00% 0.32% 0.55% ‐0.02% 0.21%
IDFC 633 ‐1.1% 3.5% 4.20% ‐0.08% ‐0.09% 0.41% 0.10% 0.07%
IndusInd 517 5.5% 21.8% 3.58% ‐0.07% 0.12% 0.88% 0.15% 0.13%
Yes 515 8.0% 17.5% 2.90% ‐0.01% ‐0.10% 0.63% ‐0.88% 0.11%
SIB 330 4.0% 13.7% 3.09% ‐0.01% ‐0.11% 0.54% 0.29% ‐0.09%
ING 352 7.0% 11.3% 3.51% 0.05% ‐0.10% 0.48% 0.26% 0.17%
J&K 424 3.0% 18.8% 4.20% ‐0.13% 0.20% 0.54% 0.00% 0.29%
Federal 452 7.0% 14.4% 2.89% ‐0.06% ‐0.09% 0.78% 0.67% 0.02%
LIC Housing 870 4.5% 19.6% 2.22% 0.00% 0.13% 0.09% ‐0.07% ‐0.08%
MMFSL 324 4.0% 26.3% 9.44% 0.68% ‐0.34% 1.69% 0.07% 0.42%
Shriram Tran. 557 3.5% 19.6% 6.84% 0.02% ‐1.06% 1.97% 0.00% 0.14%
Total 39,529 3.2% 16.0% 3.35% ‐0.01% 0.00% 0.69% ‐0.11% 0.05%
Source: Company Data, PL Research

January 09, 2013 54
Oct-Dec 2013 Earnings Preview
Deposit growth has picked up after the US$30bn of FCNR swap
8.0%
13.0%
18.0%
23.0%
28.0%
Dec
-07
Mar
-08
Jun-
08Se
p-08
Dec
-08
Mar
-09
Jun-
09Se
p-09
Dec
-09
Mar
-10
Jun-
10Se
p-10
Dec
-10
Mar
-11
Jun-
11Se
p-11
Dec
-11
Mar
-12
Jun-
12Se
p-12
Dec
-12
Mar
-13
Jun-
13Se
p-13
Dec
-13
Credit growth Deposit growth
Source: RBI
No material base rate changes happened barring for SBI/HDFCB which increased by ~20bps
May‐13 Jun‐13 Jul‐13 Aug‐13 Sep‐13 Oct‐13 Nov‐13 Dec‐13
ICICI 9.75% 9.75% 9.75% 10.00% 10.00% 10.00% 10.00% 10.00%
HDFCB 9.60% 9.60% 9.60% 9.80% 9.80% 9.80% 10.00% 10.00%
Axis 10.00% 10.00% 10.00% 10.25% 10.25% 10.25% 10.25% 10.25%
PNB 10.25% 10.25% 10.25% 10.25% 10.25% 10.25% 10.25% 10.25%
BOB 10.25% 10.25% 10.25% 10.25% 10.25% 10.25% 10.25% 10.25%
BOI 10.25% 10.25% 10.00% 10.00% 10.25% 10.25% 10.25% 10.25%
SBI 9.70% 9.70% 9.70% 9.70% 9.80% 9.80% 10.00% 10.00%
IndusInd 10.75% 10.75% 10.75% 11.00% 11.00% 11.00% 11.00% 11.00%
Yes 10.50% 10.50% 10.50% 10.75% 10.75% 10.75% 10.75% 10.75%
Union Bank 10.25% 10.25% 10.00% 10.00% 10.25% 10.25% 10.25% 10.25%
Source: Media reports, Company
Deposit rates stable in last few months on eased liquidity conditions and forex swap introduced by RBI
4.0
5.0
6.0
7.0
8.0
9.0
10.0
3m 6m 1yr 3yr
Jul-13 Oct-13 Current
Source: Bloomberg, SBI
Deposit growth now outpacing credit
growth
Only SBI and HDFCB have increased base
rate in 3Q14
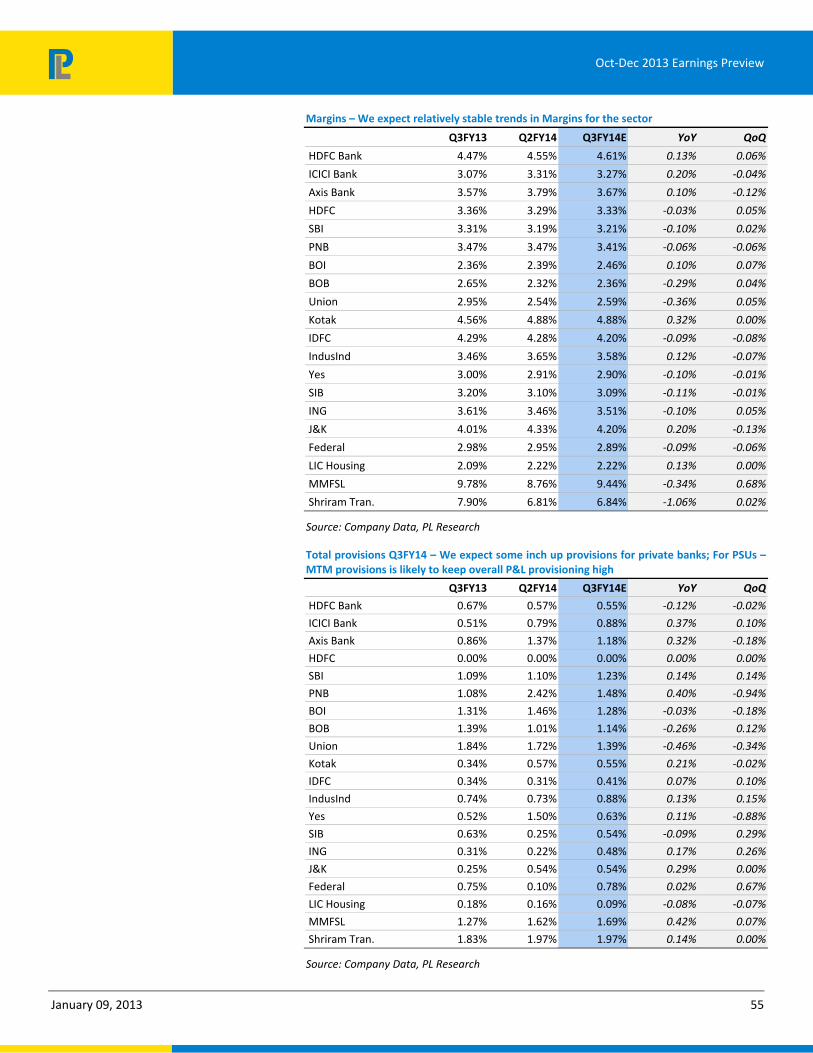
January 09, 2013 55
Oct-Dec 2013 Earnings Preview
Margins – We expect relatively stable trends in Margins for the sector
Q3FY13 Q2FY14 Q3FY14E YoY QoQ
HDFC Bank 4.47% 4.55% 4.61% 0.13% 0.06%
ICICI Bank 3.07% 3.31% 3.27% 0.20% ‐0.04%
Axis Bank 3.57% 3.79% 3.67% 0.10% ‐0.12%
HDFC 3.36% 3.29% 3.33% ‐0.03% 0.05%
SBI 3.31% 3.19% 3.21% ‐0.10% 0.02%
PNB 3.47% 3.47% 3.41% ‐0.06% ‐0.06%
BOI 2.36% 2.39% 2.46% 0.10% 0.07%
BOB 2.65% 2.32% 2.36% ‐0.29% 0.04%
Union 2.95% 2.54% 2.59% ‐0.36% 0.05%
Kotak 4.56% 4.88% 4.88% 0.32% 0.00%
IDFC 4.29% 4.28% 4.20% ‐0.09% ‐0.08%
IndusInd 3.46% 3.65% 3.58% 0.12% ‐0.07%
Yes 3.00% 2.91% 2.90% ‐0.10% ‐0.01%
SIB 3.20% 3.10% 3.09% ‐0.11% ‐0.01%
ING 3.61% 3.46% 3.51% ‐0.10% 0.05%
J&K 4.01% 4.33% 4.20% 0.20% ‐0.13%
Federal 2.98% 2.95% 2.89% ‐0.09% ‐0.06%
LIC Housing 2.09% 2.22% 2.22% 0.13% 0.00%
MMFSL 9.78% 8.76% 9.44% ‐0.34% 0.68%
Shriram Tran. 7.90% 6.81% 6.84% ‐1.06% 0.02%
Source: Company Data, PL Research
Total provisions Q3FY14 – We expect some inch up provisions for private banks; For PSUs –MTM provisions is likely to keep overall P&L provisioning high
Q3FY13 Q2FY14 Q3FY14E YoY QoQ
HDFC Bank 0.67% 0.57% 0.55% ‐0.12% ‐0.02%
ICICI Bank 0.51% 0.79% 0.88% 0.37% 0.10%
Axis Bank 0.86% 1.37% 1.18% 0.32% ‐0.18%
HDFC 0.00% 0.00% 0.00% 0.00% 0.00%
SBI 1.09% 1.10% 1.23% 0.14% 0.14%
PNB 1.08% 2.42% 1.48% 0.40% ‐0.94%
BOI 1.31% 1.46% 1.28% ‐0.03% ‐0.18%
BOB 1.39% 1.01% 1.14% ‐0.26% 0.12%
Union 1.84% 1.72% 1.39% ‐0.46% ‐0.34%
Kotak 0.34% 0.57% 0.55% 0.21% ‐0.02%
IDFC 0.34% 0.31% 0.41% 0.07% 0.10%
IndusInd 0.74% 0.73% 0.88% 0.13% 0.15%
Yes 0.52% 1.50% 0.63% 0.11% ‐0.88%
SIB 0.63% 0.25% 0.54% ‐0.09% 0.29%
ING 0.31% 0.22% 0.48% 0.17% 0.26%
J&K 0.25% 0.54% 0.54% 0.29% 0.00%
Federal 0.75% 0.10% 0.78% 0.02% 0.67%
LIC Housing 0.18% 0.16% 0.09% ‐0.08% ‐0.07%
MMFSL 1.27% 1.62% 1.69% 0.42% 0.07%
Shriram Tran. 1.83% 1.97% 1.97% 0.14% 0.00%
Source: Company Data, PL Research

January 09, 2013 56
Oct-Dec 2013 Earnings Preview
NPA Movement ‐ PSU banks ‐ Slippages and restructuring to remain elevated
3Q13 4Q13 1Q14 2Q14 3Q14E
SBI
Opening 492,020 534,580 511,900 608,920 642,070
Additions 81,750 58,680 137,660 83,650 90,000
Upgradation + Recovery 27,970 57,180 29,160 37,970 35,000
Write-offs 11,220 24,180 11,480 12,530 7,500
Closing 534,580 511,900 608,920 642,070 689,570
Gross Slippages % 3.4% 2.3% 5.2% 3.1% 3.2%
Reductions (excl. Write‐offs %) 1.2% 2.3% 1.1% 1.4% 1.2%
Net Slippages (%) 2.3% 0.1% 4.1% 1.7% 2.0%
PNB
Opening 140,250 139,978 134,658 150,906 165,256
Addition 29,690 29,570 35,940 30,500 24,000
Cash Recovery 11,540 7,100 8,030 10,640 10,000
Up gradation 18,010 18,720 3,670 4,780 5,000
Write off 400 9,070 7,990 730 4,000
Closing 139,978 134,658 150,906 165,256 170,256
Annualized Slippages % 4.0% 3.9% 4.7% 3.9% 3.0%
Reductions (excl. Write‐offs %) 4.0% 3.4% 1.5% 2.0% 1.9%
Net Slippages (%) 0.0% 0.5% 3.2% 1.9% 1.1%
BOI
Opening 88,980 86,290 87,720 94,540 99,140
Slippages 12,210 16,770 19,860 14,690 15,000
Recovery 3,650 2,310 3,710 4,260 3,500
Upgradation 3,140 170 3,350 4,630 3,500
Write off 8,110 12,860 5,980 1,200 2,000
Closing 86,290 87,720 94,540 99,140 105,140
Annualized Slippages % 1.8% 2.3% 2.6% 1.8% 1.8%
Reductions (excl. Write‐offs %) 1.0% 0.3% 0.9% 1.1% 0.8%
Net Slippages (%) 0.8% 2.0% 1.7% 0.7% 1.0%
BOB
Opening 59,348 73,215 79,825 97,625 108,879
Additions 19,997 21,160 21,655 20,170 18,000
Recovery 1,016 2,251 1,992 2,391 2,500
Upgradation 1,018 11 1,494 1,851 1,750
Write offs 3,538 12,288 370 4,674 2,000
Closing 73,215 79,825 97,625 108,879 120,629
Annualized Slippages % 2.7% 2.7% 2.7% 2.4% 2.1%
Reductions (excl. Write‐offs %) 0.3% 0.3% 0.4% 0.5% 0.5%
Net Slippages (%) 2.4% 2.4% 2.2% 1.9% 1.6%
Union
Opening 64,700 63,840 63,140 70,930 80,610
Additions 6,770 8,750 14,680 16,570 13,500
Upgrades/Recoveries 4,530 4,420 4,430 4,190 4,000
Write offs 3,100 5,030 2,460 2,700 2,500
Closing 63,840 63,140 70,930 80,610 87,610
Annualized Slippages % 1.5% 1.8% 2.9% 3.2% 2.5%
Reductions (excl. Write‐offs %) 1.0% 0.9% 0.9% 0.8% 0.7%
Net Slippages (%) 0.5% 0.9% 2.0% 2.4% 1.7%
Source: Company Data, PL Research

January 09, 2013 57
Oct-Dec 2013 Earnings Preview
10 yr G‐Sec levels similar to Sep‐13 end
6.0
6.5
7.0
7.5
8.0
8.5
9.0
Dec
-09
Mar
-10
Jun-
10
Sep-
10
Dec
-10
Mar
-11
Jun-
11
Sep-
11
Dec
-11
Mar
-12
Jun-
12
Sep-
12
Dec
-12
Mar
-13
Jun-
13
Sep-
13
Dec
-13
Source: Bloomberg
G‐Secs yields similar across maturities
6.00
6.50
7.00
7.50
8.00
8.50
9.00
9.50
3Month 1Year 5Year 10Year
1QFY14 2QFY14 3QFY14 Current
Source: Bloomberg, PL Research

January 09, 2013 58
Oct-Dec 2013 Earnings Preview
Stock Performance (Banks)
1M 3M 6M 12M 1M 3M 6M 12M
Axi s Ba nk (5.3) 13.6 (3.3) (10.9) (4.0) 9.9 (10.5) (15.9)
Ba nk of Ba roda (7.9) 21.2 13.5 (28.6) (6.7) 17.4 6.2 (33.6)
Ba nk of Indi a 9.8 36.7 7.3 (33.7) 11.1 33.0 (0.0) (38.7)
Fe de ra l Ba nk 5.3 41.4 4.6 (20.1) 6.5 37.6 (2.6) (25.1)
HDFC Ba nk (2.6) 5.1 0.6 (0.8) (1.4) 1.3 (6.6) (5.8)
ICICI Ba nk (7.8) 12.5 2.6 (10.6) (6.6) 8.8 (4.7) (15.6)
Indus Ind Ba nk (5.5) 5.2 (14.3) (2.7) (4.2) 1.5 (21.6) (7.7)
ING Vys ya Ba nk 1.4 1.5 (3.8) 4.1 2.7 (2.3) (11.1) (0.9)
Ja mmu & Ka s hmi r Ba nk 15.0 30.4 18.1 9.3 16.3 26.7 10.8 4.3
Kota k Ma hi ndra Ba nk (5.9) 2.6 3.0 9.2 (4.7) (1.1) (4.3) 4.2
Punja b Na ti ona l Ba nk 2.3 30.5 (1.6) (31.9) 3.5 26.8 (8.9) (36.9)
South Indi a n Ba nk (1.2) 3.8 (10.9) (30.9) 0.1 0.1 (18.1) (35.9)
Sta te Ba nk of Ind i a (10.9) 3.1 (11.5) (33.5) (9.6) (0.6) (18.8) (38.5)
Uni on Ba nk of Indi a 1.4 13.1 (24.6) (53.1) 2.7 9.3 (31.9) (58.1)
YES Ba nk (9.1) 8.3 (23.7) (28.7) (7.8) 4.6 (30.9) (33.7)
Absolute Relative to Sensex
Source: Bloomberg, PL Research
Stock Performance (Financial Services)
1M 3M 6M 12M 1M 3M 6M 12M
HDFC (1.2) 1.6 (2.4) (4.3) 0.1 (2.1) (9.7) (9.3)
Infrastructure Development Finance Corporation (9.1) 9.1 (19.0) (43.3) (7.9) 5.3 (26.2) (48.3)
LIC Housing Finance 4.0 2.4 (6.4) (27.3) 5.2 (1.3) (13.7) (32.3)
Mahindra & Mahindra Financial Services (3.4) 8.9 6.0 23.3 (2.1) 5.1 (1.2) 18.3
Shriram Transport Finance 6.5 14.0 (7.6) (18.4) 7.7 10.3 (14.9) (23.4)
Absolute Relative to Sensex
Source: Bloomberg, PL Research
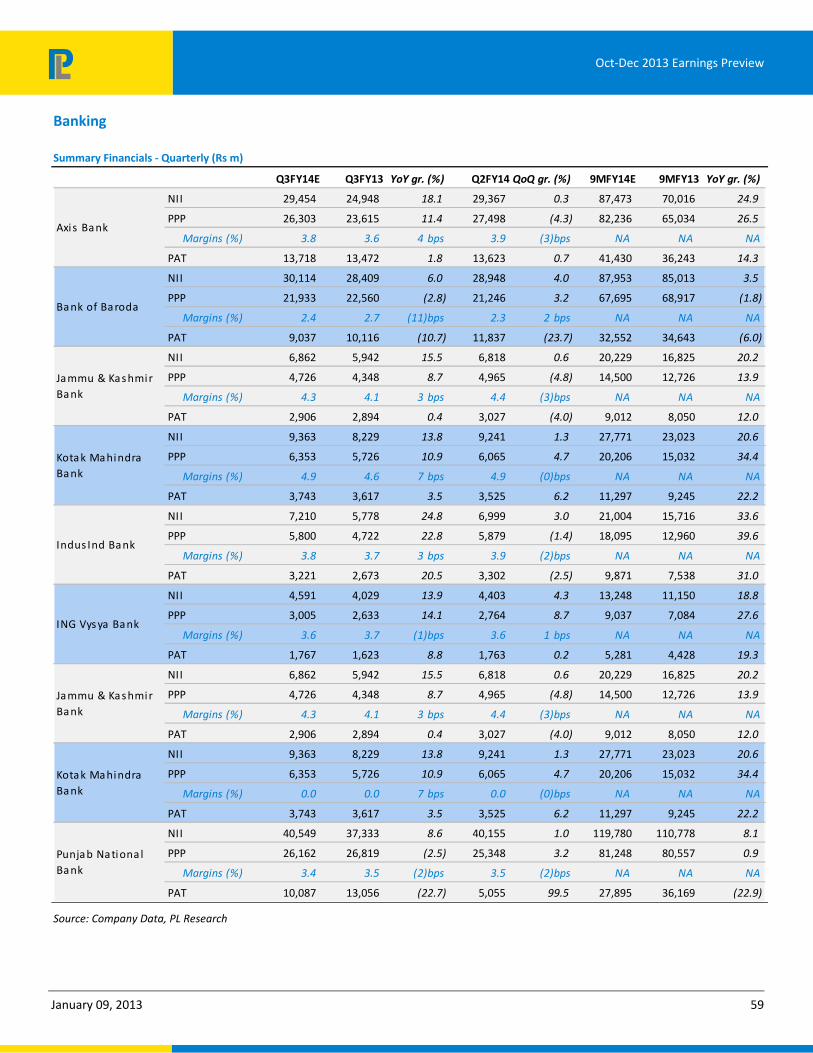
January 09, 2013 59
Oct-Dec 2013 Earnings Preview
Banking
Summary Financials ‐ Quarterly (Rs m)
Q3FY14E Q3FY13 YoY gr. (%) Q2FY14 QoQ gr. (%) 9MFY14E 9MFY13 YoY gr. (%)
NII 29,454 24,948 18.1 29,367 0.3 87,473 70,016 24.9
PPP 26,303 23,615 11.4 27,498 (4.3) 82,236 65,034 26.5
Margins (%) 3.8 3.6 4 bps 3.9 (3)bps NA NA NA
PAT 13,718 13,472 1.8 13,623 0.7 41,430 36,243 14.3
NII 30,114 28,409 6.0 28,948 4.0 87,953 85,013 3.5
PPP 21,933 22,560 (2.8) 21,246 3.2 67,695 68,917 (1.8)
Margins (%) 2.4 2.7 (11)bps 2.3 2 bps NA NA NA
PAT 9,037 10,116 (10.7) 11,837 (23.7) 32,552 34,643 (6.0)
NII 6,862 5,942 15.5 6,818 0.6 20,229 16,825 20.2
PPP 4,726 4,348 8.7 4,965 (4.8) 14,500 12,726 13.9
Margins (%) 4.3 4.1 3 bps 4.4 (3)bps NA NA NA
PAT 2,906 2,894 0.4 3,027 (4.0) 9,012 8,050 12.0
NII 9,363 8,229 13.8 9,241 1.3 27,771 23,023 20.6
PPP 6,353 5,726 10.9 6,065 4.7 20,206 15,032 34.4
Margins (%) 4.9 4.6 7 bps 4.9 (0)bps NA NA NA
PAT 3,743 3,617 3.5 3,525 6.2 11,297 9,245 22.2
NII 7,210 5,778 24.8 6,999 3.0 21,004 15,716 33.6
PPP 5,800 4,722 22.8 5,879 (1.4) 18,095 12,960 39.6
Margins (%) 3.8 3.7 3 bps 3.9 (2)bps NA NA NA
PAT 3,221 2,673 20.5 3,302 (2.5) 9,871 7,538 31.0
NII 4,591 4,029 13.9 4,403 4.3 13,248 11,150 18.8
PPP 3,005 2,633 14.1 2,764 8.7 9,037 7,084 27.6
Margins (%) 3.6 3.7 (1)bps 3.6 1 bps NA NA NA
PAT 1,767 1,623 8.8 1,763 0.2 5,281 4,428 19.3
NII 6,862 5,942 15.5 6,818 0.6 20,229 16,825 20.2
PPP 4,726 4,348 8.7 4,965 (4.8) 14,500 12,726 13.9
Margins (%) 4.3 4.1 3 bps 4.4 (3)bps NA NA NA
PAT 2,906 2,894 0.4 3,027 (4.0) 9,012 8,050 12.0
NII 9,363 8,229 13.8 9,241 1.3 27,771 23,023 20.6
PPP 6,353 5,726 10.9 6,065 4.7 20,206 15,032 34.4
Margins (%) 0.0 0.0 7 bps 0.0 (0)bps NA NA NA
PAT 3,743 3,617 3.5 3,525 6.2 11,297 9,245 22.2
NII 40,549 37,333 8.6 40,155 1.0 119,780 110,778 8.1
PPP 26,162 26,819 (2.5) 25,348 3.2 81,248 80,557 0.9
Margins (%) 3.4 3.5 (2)bps 3.5 (2)bps NA NA NA
PAT 10,087 13,056 (22.7) 5,055 99.5 27,895 36,169 (22.9)
Jammu & Kashmir Bank
Kotak Mahindra Bank
Punjab Nationa l Bank
ING Vysya Bank
Axis Bank
Bank of Baroda
Jammu & Kashmir Bank
Kotak Mahindra Bank
Indus Ind Bank
Source: Company Data, PL Research

January 09, 2013 60
Oct-Dec 2013 Earnings Preview
Summary Financials ‐ Quarterly (Rs m)
Q3FY14E Q3FY13 YoY gr. (%) Q2FY14 QoQ gr. (%) 9MFY14E 9MFY13 YoY gr. (%)
NII 3,743 3,526 6.1 3,641 2.8 10,659 9,471 12.5
PPP 2,282 2,354 (3.1) 2,120 7.6 6,917 6,425 7.7
Margins (%) 3.3 3.6 (10)bps 3.3 (0)bps NA NA NA
PAT 1,341 1,283 4.5 1,268 5.8 3,757 3,484 7.8
NII 127,970 111,545 14.7 122,514 4.5 365,603 332,472 10.0
PPP 74,036 77,888 (4.9) 63,117 17.3 212,666 233,191 (8.8)
Margins (%) 3.2 3.3 (3)bps 3.2 1 bps NA NA NA
PAT 26,979 33,941 (20.5) 23,750 13.6 83,139 108,008 (23.0)
NII 20,380 18,915 7.7 19,545 4.3 59,016 55,634 6.1
PPP 12,984 13,584 (4.4) 12,249 6.0 39,351 38,981 0.9
Margins (%) 2.5 2.9 (12)bps 2.5 2 bps NA NA NA
PAT 3,763 3,024 24.4 2,081 80.8 11,446 13,686 (16.4)
NII 6,835 5,843 17.0 6,721 1.7 20,147 15,807 27.5
PPP 6,163 5,635 9.4 7,129 (13.5) 20,092 15,078 33.3
Margins (%) 2.9 3.0 (3)bps 2.9 (0)bps NA NA NA
PAT 3,696 3,423 8.0 3,711 (0.4) 11,416 9,385 21.6
Union Bank of India
YES Bank
South Indian Bank
State Bank of India
Source: Company Data, PL Research
Financials
Summary Financials ‐ Quarterly (Rs m)
Q3FY14E Q3FY13 YoY gr. (%) Q2FY14 QoQ gr. (%) 9MFY14E 9MFY13 YoY gr. (%)
NII 18,223 15,841 15.0 17,494 4.2 53,098 46,283 14.7
PPP 17,664 15,451 14.3 17,213 2.6 50,959 44,731 13.9
PAT 12,895 11,401 13.1 12,663 1.8 37,289 32,931 13.2
NII 6,650 6,560 1.4 6,860 (3.1) 20,370 19,190 6.1
PPP 7,336 6,930 5.9 7,520 (2.4) 23,676 20,640 14.7
PAT 4,647 4,520 2.8 4,880 (4.8) 15,097 13,090 15.3
NII 4,723 3,697 27.8 4,534 4.2 13,804 10,737 28.6
PPP 4,488 3,560 26.1 4,577 (1.9) 13,477 10,432 29.2
PAT 3,130 2,398 30.5 3,101 1.0 9,336 7,106 31.4
NII 7,002 5,612 24.8 6,779 3.3 19,944 15,748 26.6
PPP 4,788 3,793 26.2 4,625 3.5 13,573 10,667 27.2
PAT 2,297 2,002 14.7 2,212 3.9 6,421 5,489 17.0
NII 5,998 4,696 27.7 5,789 3.6 16,950 11,485 47.6
PPP 7,047 6,949 1.4 6,839 3.0 20,410 19,839 2.9
PAT 3,362 3,460 (2.8) 3,268 2.9 10,041 10,054 (0.1)
HDFC
Infras tructure Development Finance Corporation
LIC Hous ing Finance
Mahindra & Mahindra Financia l Services
Shri ram Transport Finance
Source: Company Data, PL Research
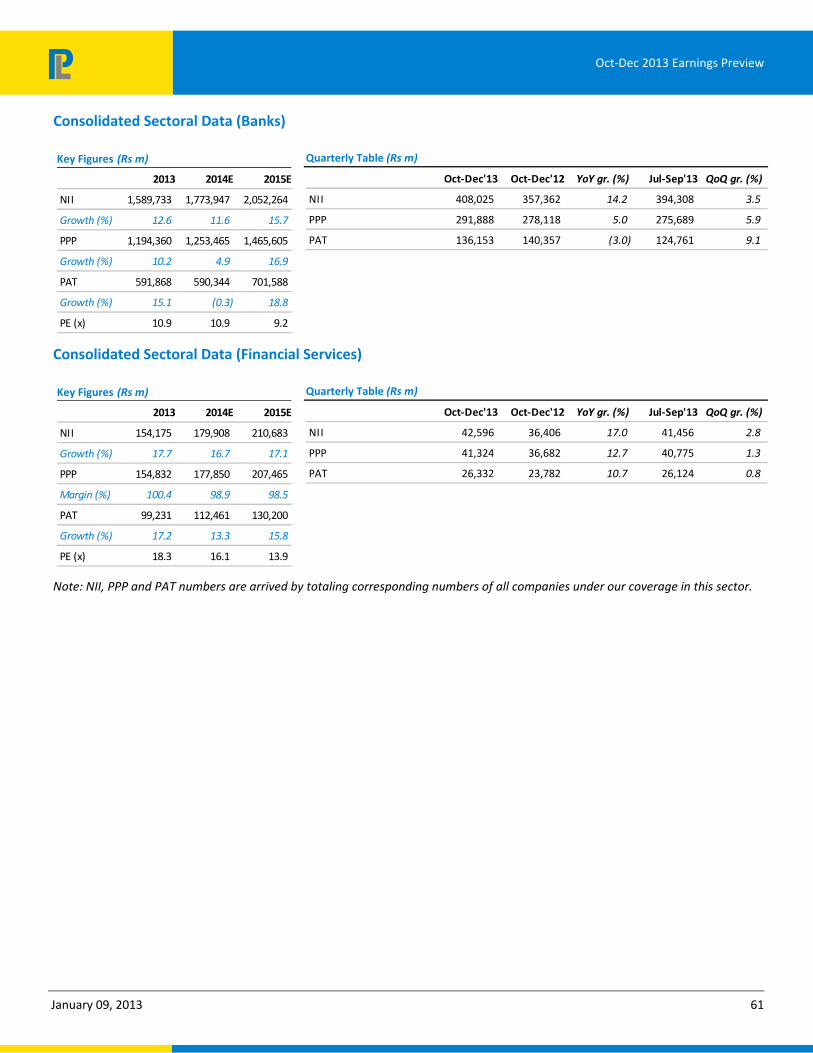
January 09, 2013 61
Oct-Dec 2013 Earnings Preview
Consolidated Sectoral Data (Banks)
Quarterly Table (Rs m)
Oct‐Dec'13 Oct‐Dec'12 YoY gr. (%) Jul‐Sep'13 QoQ gr. (%)
NII 408,025 357,362 14.2 394,308 3.5
PPP 291,888 278,118 5.0 275,689 5.9
PAT 136,153 140,357 (3.0) 124,761 9.1
Consolidated Sectoral Data (Financial Services)
Quarterly Table (Rs m)
Oct‐Dec'13 Oct‐Dec'12 YoY gr. (%) Jul‐Sep'13 QoQ gr. (%)
NII 42,596 36,406 17.0 41,456 2.8
PPP 41,324 36,682 12.7 40,775 1.3
PAT 26,332 23,782 10.7 26,124 0.8
Note: NII, PPP and PAT numbers are arrived by totaling corresponding numbers of all companies under our coverage in this sector.
Key Figures (Rs m)
2013 2014E 2015E
NII 1,589,733 1,773,947 2,052,264
Growth (%) 12.6 11.6 15.7
PPP 1,194,360 1,253,465 1,465,605
Growth (%) 10.2 4.9 16.9
PAT 591,868 590,344 701,588
Growth (%) 15.1 (0.3) 18.8
PE (x) 10.9 10.9 9.2
Key Figures (Rs m)
2013 2014E 2015E
NII 154,175 179,908 210,683
Growth (%) 17.7 16.7 17.1
PPP 154,832 177,850 207,465
Margin (%) 100.4 98.9 98.5
PAT 99,231 112,461 130,200
Growth (%) 17.2 13.3 15.8
PE (x) 18.3 16.1 13.9

January 09, 2013 62
Oct-Dec 2013 Earnings Preview
We expect flat PAT for Axis bank in 3Q14. While NIMs is likely to moderate (we expect 15bps QoQ contraction), full qtr impact of base rate with prevent a steeper decline in margins. Core fees have been slowing down and 3Q14 trends will indicate how much retail fees growth will help offset corporate fees. In-line with 1H14 guidance, we expect slippages + restructuring to inch up to Rs17.5bn in 3Q v/s Rs30bn reported in 1H14 (Rs15bn run-rate).
Quarterly Table (Rs m)
Y/e MarchQ3
FY14E
Q3
FY13
YoY gr.
(%)
Q2
FY14
9M
FY14E
9M
FY13
YoY gr.
(%)
NII 29,454 24,948 18.1 29,367 87,473 70,016 24.9
PPP 26,303 23,615 11.4 27,498 82,236 65,034 26.5
NIM Calculated (%) 3.8 3.6 4 bps 3.9 NA NA NA
PAT 13,718 13,472 1.8 13,623 41,430 36,243 14.3
Operating Metrics
Credit Cost 1.20 0.90 30 bps 1.28 NA NA NA
Advances 2,073,423 1,795,042 15.5 2,013,032 NA NA NA
Gross NPA 32,045 22,753 40.8 27,345 NA NA NA
Net NPA 9,372 6,787 38.1 8,383 NA NA NA
For BOB, PAT contraction is likely to continue with 3Q14 PAT expected to be 11% YoY lower than last yr. BOB had adopted the new mortality table in 2Q14 and hence opex growth will remain high and drive a 3% PPOP contraction. Mgt guidamce on asset quality indicates some improvement in slippage levels QoQ which will be key moniterable.
Quarterly Table (Rs m)
Y/e MarchQ3
FY14E
Q3
FY13
YoY gr.
(%)
Q2
FY14
9M
FY14E
9M
FY13
YoY gr.
(%)
NII 30,114 28,409 6.0 28,948 87,953 85,013 3.5
PPP 21,933 22,560 (2.8) 21,246 67,695 68,917 (1.8)
NIM Calculated (%) 2.4 2.7 (11)bps 2.3 NA NA NA
PAT 9,037 10,116 (10.7) 11,837 32,552 34,643 (6.0)
Operating Metrics
Credit Cost 1.15 1.30 (15)bps 1.12 NA NA NA
Advances 3,477,425 2,993,178 16.2 3,398,553 NA NA NA
Gross NPA 120,629 73,215 64.8 108,879 NA NA NA
Net NPA 67,020 33,632 99.3 63,155 NA NA NA
Axis Bank
Rating BUY
Price (Rs ) 1,212
Target Price (Rs ) 1,400
M/Cap (Rs bn) 582.4
Shares o/s (m) 480.6
Key Figures (Rs m)
Y/e March FY13 FY14E FY15E
NII 96,663 115,947 135,848
PPP 93,031 110,088 124,106
NIM (%) 3.1 3.2 3.3
PAT 51,794 57,387 66,430
EPS (Rs ) 110.7 119.4 138.2
Growth (%) 7.8 7.9 15.8
PE (x) 10.9 10.1 8.8
P / ABV (x) 1.7 1.5 1.4
Bank of Baroda
Rating Reduce
Price (Rs ) 630
Target Price (Rs ) 625
M/Cap (Rs bn) 272.0
Shares o/s (m) 432.0
Key Figures (Rs m)
Y/e March FY13 FY14E FY15E
NII 113,153 118,952 141,541
PPP 89,992 89,259 106,975
NIM (%) 2.3 2.1 2.2
PAT 44,807 42,806 50,489
EPS (Rs ) 106.0 99.1 116.9
Growth (%) (12.7) (6.6) 17.9
PE (x) 5.9 6.4 5.4
P / ABV (x) 0.9 0.9 0.8

January 09, 2013 63
Oct-Dec 2013 Earnings Preview
We expect PAT contraction of 13% YoY but a sequential improvement. We epxect a moderate increase in margins sequentially and hence expect NII growth of 17%. Guidance of recoveries/upgrades is robust and hence management expects overall asset quality performance to remain sanguine in 3Q (similar to 2Q14). Our 120bps of credit costs guidance factors in 200-300bps of coverage improvement.
Quarterly Table (Rs m)
Y/e MarchQ3
FY14E
Q3
FY13
YoY gr.
(%)
Q2
FY14
9M
FY14E
9M
FY13
YoY gr.
(%)
NII 27,103 23,085 17.4 25,272 77,745 65,480 18.7
PPP 20,559 18,558 10.8 21,025 63,387 53,834 17.7
NIM Calculated (%) 2.1 2.3 (5)bps 2.1 NA NA NA
PAT 6,959 8,035 (13.4) 6,218 22,819 19,919 14.6
Operating Metrics
Credit Cost 1.15 0.87 28 bps 1.58 NA NA NA
Advances 3,321,677 2,803,745 18.5 3,368,240 NA NA NA
Gross NPA 105,140 86,251 21.9 98,801 NA NA NA
Net NPA 61,731 54,555 13.2 61,566 NA NA NA
For Federal bank, the key highlight of 3Q14 will be stability in asset quality with no large restructuring or slippages. Operationally, business is likely to remain challenging as we expect NIMs to remain flat at best as underwriting is towards better rated corporates and cost optimisation initiated last qtr will take time to feed into operating profit growth.
Quarterly Table (Rs m)
Y/e MarchQ3
FY14E
Q3
FY13
YoY gr.
(%)
Q2
FY14
9M
FY14E
9M
FY13
YoY gr.
(%)
NII 5,531 4,974 11.2 5,484 16,110 14,949 7.8
PPP 3,738 3,939 (5.1) 3,539 11,283 10,901 3.5
NIM Calculated (%) 3.1 3.3 (6)bps 3.1 NA NA NA
PAT 1,974 2,108 (6.4) 2,258 5,288 6,162 (14.2)
Operating Metrics
Credit Cost 0.60 0.75 (15)bps 0.10 NA NA NA
Advances 451,755 394,940 14.4 422,201 NA NA NA
Gross NPA 15,060 15,640 (3.7) 14,660 NA NA NA
Net NPA 3,856 3,620 6.5 4,114 NA NA NA
Bank of India
Rating Accumulate
Price (Rs ) 242
Target Price (Rs ) 240
M/Cap (Rs bn) 155.6
Shares o/s (m) 643.0
Key Figures (Rs m)
Y/e March FY13 FY14E FY15E
NII 90,240 105,992 125,922
PPP 74,585 83,971 96,446
NIM (%) 2.2 2.2 2.2
PAT 27,493 31,732 37,586
EPS (Rs ) 46.1 49.4 58.5
Growth (%) (1.1) 7.1 18.4
PE (x) 5.3 4.9 4.1
P / ABV (x) 0.7 0.7 0.6
Federal Bank
Rating BUY
Price (Rs ) 83
Target Price (Rs ) 92
M/Cap (Rs bn) 71.1
Shares o/s (m) 855.3
Key Figures (Rs m)
Y/e March FY13 FY14E FY15E
NII 19,747 21,952 25,667
PPP 14,596 15,507 18,290
NIM (%) 3.0 2.9 2.9
PAT 8,382 7,343 9,428
EPS (Rs ) 9.8 8.6 11.0
Growth (%) 7.9 (12.4) 28.4
PE (x) 8.5 9.7 7.5
P / ABV (x) 1.1 1.0 0.9

January 09, 2013 64
Oct-Dec 2013 Earnings Preview
We expect HDFCB to report a PAT growth of ~23% YoY as balance sheet growth will continue to come off. Margin is likely to improve QoQ after ~20-30bps drop in 2Q14 as HDFCB is dependent on inter bank borrowings. We expect stability in asset quality and also expect opex growth to remain muted but slowing fee income growth will be the key to watch for HDFCB. (11% YoY growth in core fees in 2Q14).
Quarterly Table (Rs m)
Y/e MarchQ3
FY14E
Q3
FY13
YoY gr.
(%)
Q2
FY14
9M
FY14E
9M
FY13
YoY gr.
(%)
NII 47,074 39,816 18.2 44,765 136,027 115,159 18.1
PPP 37,650 31,214 20.6 33,867 104,578 84,649 23.5
NIM Calculated (%) 4.6 4.2 10 bps 4.5 NA NA NA
PAT 22,940 18,591 23.4 19,823 61,201 48,364 26.5
Operating Metrics
Credit Cost 0.55 0.56 (1)bps 0.59 NA NA NA
Advances 2,847,340 2,414,933 17.9 2,686,170 NA NA NA
Gross NPA 26,950 24,322 10.8 29,417 NA NA NA
Net NPA 6,760 4,958 36.3 7,672 NA NA NA
We expect ICICI to report PAT of Rs24bn up 7% YoY. Tough PPOP growth is moderating, we still expect ICICI to do ~16% YoY PPOP growth and the slower PAT growth is largely due to our expectations of higher credit costs. We factor in Slippages of Rs11bn (similar to 2Q14) and restructuring of Rs13bn (higher than 2Q14) in line with company guidance and any significant deviation will lead to positive/negative surprise.
Quarterly Table (Rs m)
Y/e MarchQ3
FY14E
Q3
FY13
YoY gr.
(%)
Q2
FY14
9M
FY14E
9M
FY13
YoY gr.
(%)
NII 41,247 34,990 17.9 40,435 119,887 100,632 19.1
PPP 40,196 34,525 16.4 38,879 117,216 95,951 22.2
NIM Calculated (%) 3.3 3.1 7 bps 3.3 NA NA NA
PAT 24,023 22,502 6.8 23,521 70,286 60,214 16.7
Operating Metrics
Credit Cost 0.90 0.53 37 bps 0.81 NA NA NA
Advances 3,300 2,868 15.1 3,178 NA NA NA
Gross NPA 102,347 97,634 4.8 100,285 NA NA NA
Net NPA 25,182 21,815 15.4 26,976 NA NA NA
HDFC Bank
Rating BUY
Price (Rs ) 665
Target Price (Rs ) 740
M/Cap (Rs bn) 1,581.6
Shares o/s (m) 2,379.4
Key Figures (Rs m)
Y/e March FY13 FY14E FY15E
NII 158,111 189,570 220,702
PPP 114,276 140,047 166,004
NIM (%) 4.3 4.4 4.4
PAT 64,749 79,652 94,269
EPS (Rs ) 27.2 33.5 39.6
Growth (%) 23.6 23.0 18.4
PE (x) 24.4 19.9 16.8
P / ABV (x) 4.4 3.7 3.1
ICICI Bank
Rating BUY
Price (Rs ) 1,054
Target Price (Rs ) 1,225
M/Cap (Rs bn) 1,221.0
Shares o/s (m) 1,158.1
Key Figures (Rs m)
Y/e March FY13 FY14E FY15E
NII 138,664 163,632 186,330
PPP 131,992 157,742 181,158
NIM (%) 2.7 2.9 2.9
PAT 83,255 93,795 105,737
EPS (Rs ) 71.9 81.0 91.3
Growth (%) 28.4 12.7 12.7
PE (x) 14.7 13.0 11.5
P / ABV (x) 1.8 1.7 1.5
Adj. for Subs. Valuation of Rs164/share

January 09, 2013 65
Oct-Dec 2013 Earnings Preview
We expect IIB to report ~21% YoY PAT growth. Margins had surprised in 2Q14 with just 7% YoY contraction and we expect similar contraction in 3Q14 as well. Core fee trend is expected to remain robust (23% YoY) growth but unamortized MTM losses will likely lead to a spike in provisions of ~90bps. Industry feedback on CV asset quality has been negative v/s better trends reported by IIB and that will be the key to watch out for in 3Q14.
Quarterly Table (Rs m)
Y/e MarchQ3
FY14E
Q3
FY13
YoY gr.
(%)
Q2
FY14
9M
FY14E
9M
FY13
YoY gr.
(%)
NII 7,210 5,778 24.8 6,999 21,004 15,716 33.6
PPP 5,800 4,722 22.8 5,879 18,095 12,960 39.6
NIM Calculated (%) 3.8 3.7 3 bps 3.9 NA NA NA
PAT 3,221 2,673 20.5 3,302 9,871 7,538 31.0
Operating Metrics
Credit Cost 0.90 0.77 13 bps 0.74 NA NA NA
Advances 516,613 424,260 21.8 489,681 NA NA NA
Gross NPA 5,820 4,216 38.0 5,464 NA NA NA
Net NPA 1,455 1,252 16.2 1,092 NA NA NA
We epxect ING to report a PAT growth of 9% YoY. Though NIMs is likely to inch up QoQ as guided, growth pick up may not be as strong after the de-bulking in last 2-3 qtrs. Our interaction indicates some stress build up in their mid corporate portfolio but stress still seems manageable and hence we expect cerdit costs of ~60bps. SA growth has been volatile and will be keenly watched.
Quarterly Table (Rs m)
Y/e MarchQ3
FY14E
Q3
FY13
YoY gr.
(%)
Q2
FY14
9M
FY14E
9M
FY13
YoY gr.
(%)
NII 4,591 4,029 13.9 4,403 13,248 11,150 18.8
PPP 3,005 2,633 14.1 2,764 9,037 7,084 27.6
NIM Calculated (%) 3.6 3.7 (1)bps 3.6 NA NA NA
PAT 1,767 1,623 8.8 1,763 5,281 4,428 19.3
Operating Metrics
Credit Cost 0.50 0.32 18 bps 0.22 NA NA NA
Advances 351,564 315,985 11.3 328,564 NA NA NA
Gross NPA 5,988 5,705 5.0 5,738 NA NA NA
Net NPA 719 159 351.1 623 NA NA NA
IndusInd Bank
Rating Accumulate
Price (Rs ) 422
Target Price (Rs ) 475
M/Cap (Rs bn) 220.6
Shares o/s (m) 522.9
Key Figures (Rs m)
Y/e March FY13 FY14E FY15E
NII 22,329 28,762 34,266
PPP 18,395 23,913 27,285
NIM (%) 3.4 3.6 3.6
PAT 10,612 13,234 15,144
EPS (Rs ) 20.3 25.3 29.0
Growth (%) 18.3 24.7 14.4
PE (x) 20.8 16.7 14.6
P / ABV (x) 3.0 2.6 2.2
ING Vysya Bank
Rating BUY
Price (Rs ) 591
Target Price (Rs ) 650
M/Cap (Rs bn) 109.2
Shares o/s (m) 184.9
Key Figures (Rs m)
Y/e March FY13 FY14E FY15E
NII 15,386 18,194 20,894
PPP 9,927 12,349 14,975
NIM (%) 3.0 3.1 3.2
PAT 6,131 7,272 8,548
EPS (Rs ) 39.6 39.3 46.2
Growth (%) 30.2 (0.6) 17.5
PE (x) 14.9 15.0 12.8
P / ABV (x) 2.0 1.6 1.4

January 09, 2013 66
Oct-Dec 2013 Earnings Preview
J&K margin performance has been spectacular and even in 3Q14 we expect margins to remain +4% as their J&K book continues to grow faster than low margin non J&K business. Management has been maintaining a cautious asset quality outlook on the non J&K book for last 2-3 qtrs and continues to do so but we do not expect any negative surprise both on slippages and restructuring.
Quarterly Table (Rs m)
Y/e MarchQ3
FY14E
Q3
FY13
YoY gr.
(%)
Q2
FY14
9M
FY14E
9M
FY13
YoY gr.
(%)
NII 6,862 5,942 15.5 6,818 20,229 16,825 20.2
PPP 4,726 4,348 8.7 4,965 14,500 12,726 13.9
NIM Calculated (%) 4.3 4.1 3 bps 4.4 NA NA NA
PAT 2,906 2,894 0.4 3,027 9,012 8,050 12.0
Operating Metrics
Credit Cost 0.55 0.26 29 bps 0.55 NA NA NA
Advances 423,544 356,577 18.8 411,208 NA NA NA
Gross NPA 7,444 5,817 28.0 7,089 NA NA NA
Net NPA 815 495 64.5 776 NA NA NA
We expect just 3.5% YoY PAT growth for Kotak in 3Q14 due to a small base impact of credit costs. Slowing balance sheet growth is likely to lead to slowing PPOP growth (13% YoY growth) but asset quality is unlikely to bring any large negative surprise. We expect credit costs of ~55bps in 3Q14.
Quarterly Table (Rs m)
Y/e MarchQ3
FY14E
Q3
FY13
YoY gr.
(%)
Q2
FY14
9M
FY14E
9M
FY13
YoY gr.
(%)
NII 9,363 8,229 13.8 9,241 27,771 23,023 20.6
PPP 6,353 5,726 10.9 6,065 20,206 15,032 34.4
NIM Calculated (%) 4.9 4.6 7 bps 4.9 NA NA NA
PAT 3,743 3,617 3.5 3,525 11,297 9,245 22.2
Operating Metrics
Credit cost 0.00 0.00 0 bps 0.00 NA NA NA
Advances 556,695 502,450 10.8 506,087 NA NA NA
Gross NPA 0 8,241 (100.0) 11,181 NA NA NA
Net NPA 5,748 3,648 57.6 5,474 NA NA NA
Jammu & Kashmir Bank
Rating Accumulate
Price (Rs ) 1,440
Target Price (Rs ) 1,550
M/Cap (Rs bn) 69.8
Shares o/s (m) 48.5
Key Figures (Rs m)
Y/e March FY13 FY14E FY15E
NII 23,160 27,038 30,320
PPP 18,108 19,709 21,584
NIM (%) 3.5 3.5 3.4
PAT 10,551 11,217 12,262
EPS (Rs ) 217.6 231.3 252.9
Growth (%) 31.4 6.3 9.3
PE (x) 6.6 6.2 5.7
P / ABV (x) 1.4 1.2 1.0
Kotak Mahindra Bank
Rating Reduce
Price (Rs ) 713
Target Price (Rs ) 725
M/Cap (Rs bn) 546.5
Shares o/s (m) 766.6
Key Figures (Rs m)
Y/e March FY13 FY14E FY15E
NII 41,689 50,571 60,212
PPP 31,651 40,117 46,965
NIM (%) 4.5 4.5 4.6
PAT 19,995 24,144 29,491
EPS (Rs ) 26.8 31.5 38.5
Growth (%) 15.3 17.6 22.1
PE (x) 26.6 22.6 18.5
P / ABV (x) 3.6 3.0 2.7

January 09, 2013 67
Oct-Dec 2013 Earnings Preview
PNB is likely to report better asset quality in 3Q14 v/s previous trends as management has front loaded NPA/CDR recognitions in 2Q14. We believe that it will be too early to still extrapolate 3Q14 in asset quality as PNB’s involvement in stressed assets yet not restructured/declared NPAs is one of the highest. MTM provisioning and higher coverage is likely to keep credit costs elevated in spite of lower slippages expected.
Quarterly Table (Rs m)
Y/e MarchQ3
FY14E
Q3
FY13
YoY gr.
(%)
Q2
FY14
9M
FY14E
9M
FY13
YoY gr.
(%)
NII 40,549 37,333 8.6 40,155 119,780 110,778 8.1
PPP 26,162 26,819 (2.5) 25,348 81,248 80,557 0.9
NIM Calculated (%) 3.4 3.5 (2)bps 3.5 NA NA NA
PAT 10,087 13,056 (22.7) 5,055 27,895 36,169 (22.9)
Operating Metrics
Credit Cost 1.25 1.05 20 bps 1.86 NA NA NA
Advances 3,232,674 2,973,130 8.7 3,138,519 NA NA NA
Gross NPA 170,256 139,978 21.6 165,263 NA NA NA
Net NPA 96,622 75,862 27.4 96,090 NA NA NA
Management expects NIMs to be largely stable in 3Q14 but balance sheet growth is unlikely to improve in a hurry for SIB as gold loan book remains flat QoQ. Asset quality has been volatile for SIB in the last 2 qtrs with some large ticket delinquencies- Guidance indicates that large negative surprises is unlikely and recoveries/upgrades will lead to an improvement in asset quality.
Quarterly Table (Rs m)
Y/e MarchQ3
FY14E
Q3
FY13
YoY gr.
(%)
Q2
FY14
9M
FY14E
9M
FY13
YoY gr.
(%)
NII 3,743 3,526 6.1 3,641 10,659 9,471 12.5
PPP 2,282 2,354 (3.1) 2,120 6,917 6,425 7.7
NIM Calculated (%) 3.3 3.6 (10)bps 3.3 NA NA NA
PAT 1,341 1,283 4.5 1,268 3,757 3,484 7.8
Operating Metrics
Credit Cost 0.55 0.64 (9)bps 0.25 NA NA NA
Advances 330,123 290,390 13.7 317,426 NA NA NA
Gross NPA 6,343 4,745 33.7 6,143 NA NA NA
Net NPA 4,313 1,966 119.4 4,399 NA NA NA
Punjab National Bank
Rating Reduce
Price (Rs ) 610
Target Price (Rs ) 600
M/Cap (Rs bn) 221.0
Shares o/s (m) 362.1
Key Figures (Rs m)
Y/e March FY13 FY14E FY15E
NII 148,565 158,650 176,781
PPP 109,074 107,514 119,580
NIM (%) 3.2 3.1 3.1
PAT 47,477 39,304 47,339
EPS (Rs ) 134.3 108.6 130.7
Growth (%) (6.7) (19.2) 20.4
PE (x) 4.5 5.6 4.7
P / ABV (x) 0.8 0.7 0.7
South Indian Bank
Rating BUY
Price (Rs ) 21
Target Price (Rs ) 25
M/Cap (Rs bn) 27.4
Shares o/s (m) 1,338.5
Key Figures (Rs m)
Y/e March FY13 FY14E FY15E
NII 12,808 14,516 16,832
PPP 8,486 9,455 10,755
NIM (%) 2.9 2.7 2.7
PAT 5,023 4,913 5,971
EPS (Rs ) 3.8 3.7 4.5
Growth (%) 5.9 (2.2) 21.5
PE (x) 5.5 5.6 4.6
P / ABV (x) 1.0 0.9 0.8

January 09, 2013 68
Oct-Dec 2013 Earnings Preview
We expect PAT contraction of 20% YoY for SBI driven by higher opex growth (~30% YoY) and also higher provisions (credit costs + MTM provisioning). SBI margins were stable in 2Q14; and with aggressive pricing in many segments we expect margins to remain flat for SBI. Unlike peers, SBI’s management is not guiding to a significant improvement in slippages in 3Q14 and hence credit cost is expected to remain elevated.
Quarterly Table (Rs m)
Y/e MarchQ3
FY14E
Q3
FY13
YoY gr.
(%)
Q2
FY14
9M
FY14E
9M
FY13
YoY gr.
(%)
NII 127,970 111,545 14.7 122,514 365,603 332,472 10.0
PPP 74,036 77,888 (4.9) 63,117 212,666 233,191 (8.8)
NIM Calculated (%) 3.2 3.3 (3)bps 3.2 NA NA NA
PAT 26,979 33,941 (20.5) 23,750 83,139 108,008 (23.0)
Operating Metrics
Credit Cost 1.00 1.16 (16)bps 0.98 NA NA NA
Advances 11,416,979 9,781,153 16.7 11,030,898 NA NA NA
Gross NPA 689,563 534,578 29.0 642,063 NA NA NA
Net NPA 352,663 253,703 39.0 321,514 NA NA NA
We expect PAT growth of ~24% YoY (low base impact). The margins are likely to inch up QoQ by 5bps but with ~30bps YoY margin contraction we expect NII growth of just 8% YoY. Slippages have remained high for Union in the last 2-3 qtrs and 3Q14 being a transition qtr, slippages trend will be keenly watched. Stock multiples imply higher NPA recognition/provisions in 3Q14.
Quarterly Table (Rs m)
Y/e MarchQ3
FY14E
Q3
FY13
YoY gr.
(%)
Q2
FY14
9M
FY14E
9M
FY13
YoY gr.
(%)
NII 20,380 18,915 7.7 19,545 59,016 55,634 6.1
PPP 12,984 13,584 (4.4) 12,249 39,351 38,981 0.9
NIM Calculated (%) 2.5 2.9 (12)bps 2.5 NA NA NA
PAT 3,763 3,024 24.4 2,081 11,446 13,686 (16.4)
Operating Metrics
Credit Cost 1.25 1.82 (57)bps 1.63 NA NA NA
Advances 2,194,675 1,858,849 18.1 2,172,946 NA NA NA
Gross NPA 87,610 63,836 37.2 80,607 NA NA NA
Net NPA 50,376 31,685 59.0 46,703 NA NA NA
State Bank of India
Rating Accumulate
Price (Rs ) 1,657
Target Price (Rs ) 1,850
M/Cap (Rs bn) 1,152.1
Shares o/s (m) 695.3
Key Figures (Rs m)
Y/e March FY13 FY14E FY15E
NII 611,602 651,318 748,183
PPP 403,000 363,310 437,613
NIM (%) 3.1 2.8 2.8
PAT 177,008 146,466 180,264
EPS (Rs ) 258.8 210.7 259.3
Growth (%) 13.7 (18.6) 23.1
PE (x) 6.4 7.9 6.4
P / ABV (x) 1.0 1.0 0.9
Union Bank of India
Rating Accumulate
Price (Rs ) 129
Target Price (Rs ) 145
M/Cap (Rs bn) 81.2
Shares o/s (m) 628.0
Key Figures (Rs m)
Y/e March FY13 FY14E FY15E
NII 75,428 81,827 97,284
PPP 55,827 55,310 65,945
NIM (%) 2.6 2.4 2.5
PAT 21,579 17,054 22,715
EPS (Rs ) 36.2 27.2 36.2
Growth (%) 11.4 (24.9) 33.2
PE (x) 3.6 4.8 3.6
P / ABV (x) 0.5 0.5 0.5

January 09, 2013 69
Oct-Dec 2013 Earnings Preview
We expect PAT growth of 8% YoY for Yes bank. With moderation in wholesale rates, the may remain flat for Yes bank at 2.9%. With yields at similar levels as last qtr, we do not expect any MTM provisions in 3Q14. Mgt has guided to some inch up in stress from mid corporate and hence we factor in credit costs of ~65bps.
Quarterly Table (Rs m)
Y/e MarchQ3
FY14E
Q3
FY13
YoY gr.
(%)
Q2
FY14
9M
FY14E
9M
FY13
YoY gr.
(%)
NII 6,835 5,843 17.0 6,721 20,147 15,807 27.5
PPP 6,163 5,635 9.4 7,129 20,092 15,078 33.3
NIM Calculated (%) 2.9 3.0 (3)bps 2.9 NA NA NA
PAT 3,696 3,423 8.0 3,711 11,416 9,385 21.6
Operating Metrics
Credit Cost 0.65 0.53 12 bps 0.55 NA NA NA
Advances 515,346 438,568 17.5 477,172 NA NA NA
Gross NPA 1,453 762 90.6 1,321 NA NA NA
Net NPA 160 155 3.0 194 NA NA NA
We expect PAT growth of 13% YoY due to capital gains. We expect NII growth of ~14-15% for HDFC limited but we would like to highlight that incremental mortgage spreads have come off post the recent cut and there could be some pressure on NII going forward.
Quarterly Table (Rs m)
Y/e MarchQ3
FY14E
Q3
FY13
YoY gr.
(%)
Q2
FY14
9M
FY14E
9M
FY13
YoY gr.
(%)
Net Operating Inc. 19,583 17,290 13.3 19,083 56,682 50,189 12.9
NII 18,223 15,841 15.0 17,494 53,098 46,283 14.7
Non Interest Inc. 1,360 1,449 (6.1) 1,590 3,584 3,906 (8.2)
PPP 17,664 15,451 14.3 17,213 50,959 44,731 13.9
PAT 12,895 11,401 13.1 12,663 37,289 32,931 13.2
Operating Metrics
Advances 1,917,240 1,609,413 19.1 1,843,500 NA NA NA
Borrowing 1,800,874 1,488,701 21.0 1,732,840 NA NA NA
Disbursement 168,311 141,438 19.0 0 NA NA NA
NIM 3.3 3.4 (3)bps 3.3 NA NA NA
YES Bank
Rating Accumulate
Price (Rs ) 356
Target Price (Rs ) 420
M/Cap (Rs bn) 127.8
Shares o/s (m) 358.6
Key Figures (Rs m)
Y/e March FY13 FY14E FY15E
NII 22,188 27,027 31,484
PPP 21,422 25,174 27,926
NIM (%) 2.6 2.6 2.6
PAT 13,012 14,023 15,915
EPS (Rs ) 36.3 39.1 44.4
Growth (%) 31.0 7.8 13.5
PE (x) 9.8 9.1 8.0
P / ABV (x) 2.2 1.8 1.6
HDFC
Rating Accumulate
Price (Rs ) 804
Target Price (Rs ) 840
M/Cap (Rs bn) 1,243.7
Shares o/s (m) 1,546.4
Key Figures (Rs m)
Y/e March FY13 FY14E FY15E
Net Op. Inc. 72,567 83,854 98,229
NII 57,988 68,233 81,164
PPP 67,178 77,727 91,277
PAT 48,483 55,281 65,250
EPS (Rs ) 31.4 35.7 42.2
Growth (%) 12.3 14.0 18.0
NIM (%) 3.2 3.2 3.1
RoE (%) 22.0 20.7 21.5
PE (x) 25.7 22.5 19.1
P / BV (x) 5.0 4.4 3.9
Adj. for Subs. Valuation of Rs210/share

January 09, 2013 70
Oct-Dec 2013 Earnings Preview
We expect IDFC to report ~3% YoY PAT growth. With slowing balance sheet growth (4% YoY), we expect NII to remain almost flat as margins have already started moderating. Asset quality will remain lumpy and is difficult to predict recognition of NPAs in case of IDFC.
Quarterly Table (Rs m)
Y/e MarchQ3
FY14E
Q3
FY13
YoY gr.
(%)
Q2
FY14
9M
FY14E
9M
FY13
YoY gr.
(%)
Net Operating Inc. 8,850 8,270 7.0 8,900 27,960 24,390 14.6
NII 6,650 6,560 1.4 6,860 20,370 19,190 6.1
Non Interest Inc. 2,200 1,710 28.7 2,040 7,590 5,200 46.0
PPP 7,336 6,930 5.9 7,520 23,676 20,640 14.7
PAT 4,647 4,520 2.8 4,880 15,097 13,090 15.3
Operating Metrics
NIM 4.2 4.3 (9)bps 4.3 NA NA NA
Disbursements 20,155 25,840 (22.0) 24,390 NA NA NA
Credit Cost 0.0 0.3 (34)bps 0.3 NA NA NA
Loans 560,847 533,250 5.2 549,850 NA NA NA
We expect LICHF to report flat spreads in 3Q v/s 2Q at 1.25% (1.22% in 2Q14). Incremental spreads in 3Q14 would have been better than 2Q14 as wholesale funding rates eased but festive offer at 10.25% and rate competition by competitors would restrict any improvement. We expect corporate asset quality to remain stable in 3Q14 with some improvement expected in 4Q14 related to sale of property possessed.
Quarterly Table (Rs m)
Y/e MarchQ3
FY14E
Q3
FY13
YoY gr.
(%)
Q2
FY14
9M
FY14E
9M
FY13
YoY gr.
(%)
Net Operating Inc. 5,232 4,232 23.6 5,321 15,577 12,305 26.6
NII 4,723 3,697 27.8 4,534 13,804 10,737 28.6
Non Interest Inc. 509 536 (5.0) 787 1,773 1,568 13.1
PPP 4,488 3,560 26.1 4,577 13,477 10,432 29.2
PAT 3,130 2,398 30.5 3,101 9,336 7,106 31.4
Operating Metrics
Credit Cost 0.1 0.2 (9)bps 0.2 NA NA NA
Loans 869,607 727,040 19.6 832,160 NA NA NA
NIM 2.2 2.1 13 bps 2.2 NA NA NA
Builders Loans % 0.0 3.9 (388)bps 3.0 NA NA NA
IDFC
Rating Accumulate
Price (Rs ) 102
Target Price (Rs ) 115
M/Cap (Rs bn) 155.0
Shares o/s (m) 1,514.7
Key Figures (Rs m)
Y/e March FY13 FY14E FY15E
Net Op. Inc. 34,470 36,623 40,793
NII 25,420 26,800 29,314
PPP 29,176 30,552 33,978
PAT 18,368 20,197 22,083
EPS (Rs ) 12.1 13.3 14.6
Growth (%) 18.2 10.0 9.3
NIM (%) 3.8 3.7 3.7
RoE (%) 14.1 14.0 13.8
PE (x) 8.4 7.7 7.0
P / BV (x) 1.1 1.0 1.0
LIC Housing Finance
Rating Accumulate
Price (Rs ) 210
Target Price (Rs ) 230
M/Cap (Rs bn) 106.2
Shares o/s (m) 505.0
Key Figures (Rs m)
Y/e March FY13 FY14E FY15E
Net Op. Inc. 17,343 21,682 24,928
NII 15,493 19,352 22,503
PPP 14,524 18,389 21,104
PAT 10,232 12,943 14,834
EPS (Rs ) 20.3 25.6 29.4
Growth (%) 11.9 26.5 14.6
NIM (%) 2.3 2.4 2.3
RoE (%) 16.8 18.5 18.3
PE (x) 10.4 8.2 7.2
P / BV (x) 1.7 1.5 1.3

January 09, 2013 71
Oct-Dec 2013 Earnings Preview
We expect MMFS to report ~15% PAT growth. AUM growth is likely to moderate but hike of 50-75bps taken in 2Q14 is likely to continue to aid margins (we expect flat margins QoQ). With better than average monsoons, stock is discounting a significant pick up in collection in 2H14 (mgt guidance in 2Q14 concall) but given weak economic cycle we believe collections will lag market expectations (negative surprise). We have in our note dated December 16, 2013 revised the recommendation to Reduce and we re iterate our REDUCE recommendation on account of the steep valuation.
Quarterly Table (Rs m)
Y/e MarchQ3
FY14E
Q3
FY13
YoY gr.
(%)
Q2
FY14
9M
FY14E
9M
FY13
YoY gr.
(%)
Net Operating Inc. 7,122 5,665 25.7 6,875 20,221 15,975 26.6
NII 7,002 5,612 24.8 6,779 19,944 15,748 26.6
Non Interest Inc. 120 53 127.8 96 276 227 21.7
PPP 4,788 3,793 26.2 4,625 13,573 10,667 27.2
PAT 2,297 2,002 14.7 2,212 6,421 5,489 17.0
Operating Metrics
Credit Cost 1.7 1.3 41 bps 1.7 NA NA NA
AUM 323,924 256,451 26.3 311,465 NA NA NA
Off-Balance sheet AU 12,927 16,519 (21.7) 19,126 NA NA NA
NIM (% AUM) 8.8 8.2 60 bps 8.9 NA NA NA
Growth is likely to get slower as large disbursements in the newer used CV segment has eased. Margins had dipped for SHTF in 2Q14 due to management’s decision of keeping higher liquidity in the balance sheet which will get reversed in 2H14 and will have a positive rub on margins. CV collections continue to remain weak and hence we expect credit costs to remain elevated at ~200bps.
Quarterly Table (Rs m)
Y/e MarchQ3
FY14E
Q3
FY13
YoY gr.
(%)
Q2
FY14
9M
FY14E
9M
FY13
YoY gr.
(%)
Net Operating Inc. 9,902 9,247 7.1 9,580 29,330 26,966 8.8
NII 5,998 4,696 27.7 5,789 16,950 11,485 47.6
Non Interest Inc. 550 300 83.4 529 1,905 1,316 44.7
PPP 7,047 6,949 1.4 6,839 20,410 19,839 2.9
PAT 3,362 3,460 (2.8) 3,268 10,041 10,054 (0.1)
Operating Metrics
Credit Cost 2.0 1.9 12 bps 2.0 NA NA NA
AUM 556,638 465,446 19.6 537,815 NA NA NA
Off-Balance Sheet 172,558 154,599 11.6 162,907 NA NA NA
NIM (on AUM) 6.8 7.9 (106)bps 6.8 NA NA NA
M&M Financial Services
Rating Reduce
Price (Rs ) 294
Target Price (Rs ) 300
M/Cap (Rs bn) 165.4
Shares o/s (m) 563.0
Key Figures (Rs m)
Y/e March FY13 FY14E FY15E
Net Op. Inc. 22,759 28,524 34,902
NII 22,380 28,087 34,400
PPP 15,340 19,432 24,086
PAT 8,541 9,846 11,322
EPS (Rs ) 15.2 17.5 20.1
Growth (%) 25.6 15.3 15.0
NIM (%) 10.1 9.8 9.6
RoE (%) 23.1 20.4 20.2
PE (x) 19.4 16.8 14.6
P / BV (x) 3.9 3.5 3.1
Shriram Transport Finance
Rating Accumulate
Price (Rs ) 628
Target Price (Rs ) 740
M/Cap (Rs bn) 142.4
Shares o/s (m) 226.9
Key Figures (Rs m)
Y/e March FY13 FY14E FY15E
Net Op. Inc. 36,473 41,576 48,302
NII 32,894 37,435 43,301
PPP 28,613 31,750 37,020
PAT 13,606 14,194 16,711
EPS (Rs ) 60.0 62.6 73.7
Growth (%) 7.9 4.3 17.7
NIM (%) 4.4 5.0 5.0
RoE (%) 20.6 18.2 18.3
PE (x) 10.5 10.0 8.5
P / BV (x) 2.0 1.8 1.5

January 09, 2014 72
Oct-Dec 2013 Earnings Preview
Kunal Sheth [email protected] +91-22-6632 2257
Mandar Dhavle [email protected] +91-22-6632 2258
Top picks
L&T
Crompton Greaves
Capital Goods
Though 2013 started on a positive note with a hope of revival in the investment cycle, nothing materialised The hope remained as hope and there was no signs of any recovery visible over the course of the year. Most of the data points like PMI, IIP, New project announcements, GFCF still show signs of bottoming out but catalyst for a turn around was absent. Our interaction with various companies indicate that outlook and commentary for the export market continues to be robust with improving global economy and weak rupee, however domestic market dynamics continues to be subdued in near term. Most of the corporates, although seem to be looking beyond near term weakness and pinning there hope of recovery in investment cycle post election once a government with a clear mandate comes to power.
Quarterly Gross Fixed Capital Formation trend
-15.0%-10.0%
-5.0%0.0%5.0%
10.0%15.0%20.0%25.0%30.0%
Sep-
05M
ar-0
6Se
p-06
Mar
-07
Sep-
07M
ar-0
8Se
p-08
Mar
-09
Sep-
09M
ar-1
0Se
p-10
Mar
-11
Sep-
11M
ar-1
2Se
p-12
Mar
-13
Sep-
13
Source: xxx
Annual Gross Fixed Capital Formation trend
0
5
10
15
20
25
2000
2001
2002
2003
2004
2005
2006
2007
2008
2009
2010
2011
2012
2013
YoY gr. (%)
Source: RBI, PL Research
After a boom period (in terms of announcement of new investments) of four years, when average quarterly new investments rose from Rs.2.2 trillion in 2005-06 to a peak of Rs.5.6 trillion in 2008-09, the hype subsided post 2009-10. Average quarterly investment announcements dropped to Rs.4.1 trillion in 2009-10, Rs.3.97 trillion in 2010-11, Rs.2.48 trillion in 2011-12, Rs.1.18 trillion in 2012-13 and an average of Rs.853 billion in the first 2 quarters of fiscal 2013-14. Announcement of new investment proposals at Rs.1.44 trillion during the quarter ended December 2013, grew significantly by 165 per cent, year on year. They were the highest when compared with the previous 6 consecutive quarters. The strong growth in new project proposal announcements during the quarter can be attributed mainly to 2 reasons, first being the low base of new investment proposals worth Rs.545 billion announced in December 2012 quarter and 3 solar ultra mega power projects (UMPP) worth Rs.660 billion proposed during the quarter ended December 2013.

January 09, 2014 73
Oct-Dec 2013 Earnings Preview
New project announcements ...not inspiring confidence
01,0002,0003,0004,0005,0006,0007,0008,0009,000
10,000
Mar
-08
Jun-
08Se
p-08
Dec
-08
Mar
-09
Jun-
09Se
p-09
Dec
-09
Mar
-10
June
-10
Sep-
10D
ec-1
0M
ar-1
1Ju
ne-1
1Se
p-11
Dec
-11
Mar
-12
Jun-
12Se
p-12
Dec
-12
Mar
-13
Jun-
13Se
p-13
Dec
-13
(Rs bn)
Lack of confidence
visible
Source: PL Research, CMIE
Stalled projects ....increasing
0
500
1,000
1,500
2,000
2,500
3,000
Mar
-08
Jun-
08Se
p-08
Dec
-08
Mar
-09
Jun-
09Se
p-09
Dec
-09
Mar
-10
June
-10
Sep-
10D
ec-1
0M
ar-1
1Ju
ne-1
1Se
p-11
Dec
-11
Mar
-12
Jun-
12Se
p-12
Dec
-12
Mar
-13
Jun-
13Se
p-13
Dec
-13
(Rs bn)
Source: PL Research, CMIE
HSBC PMI India
4042444648505254565860
Dec
07
Mar
08
Jun
08
Sep
08
Dec
08
Mar
09
Jun
09
Sep
09
Dec
09
Mar
10
Jun
10
Sep
10
Dec
10
Mar
11
Jun
11
Sep
11
Dec
11
Mar
12
Jun
12
Sep
12
Dec
12
Mar
13
Source: Markit Economics, HSBC, PL Research NOTE: Reading above 50 indicates expansion and below it denotes contraction; 50 denotes no change
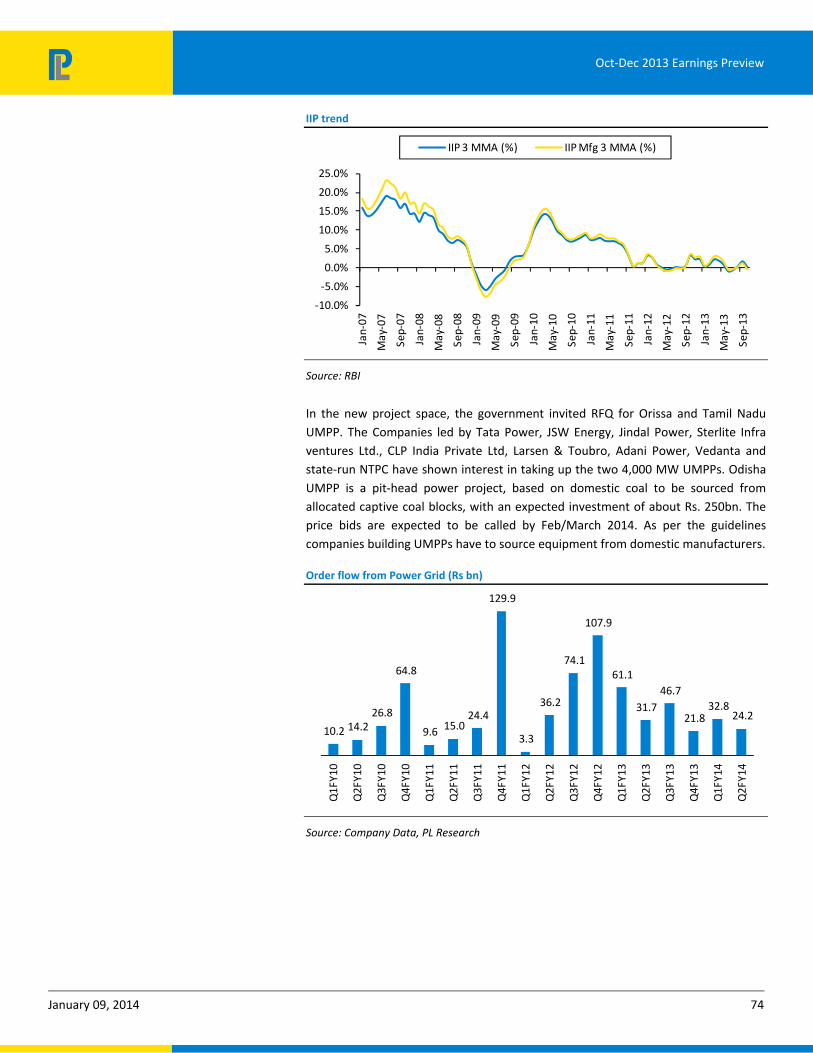
January 09, 2014 74
Oct-Dec 2013 Earnings Preview
IIP trend
-10.0%
-5.0%
0.0%
5.0%
10.0%
15.0%
20.0%
25.0%
Jan-
07
May
-07
Sep-
07
Jan-
08
May
-08
Sep-
08
Jan-
09
May
-09
Sep-
09
Jan-
10
May
-10
Sep-
10
Jan-
11
May
-11
Sep-
11
Jan-
12
May
-12
Sep-
12
Jan-
13
May
-13
Sep-
13
IIP 3 MMA (%) IIP Mfg 3 MMA (%)
Source: RBI
In the new project space, the government invited RFQ for Orissa and Tamil Nadu UMPP. The Companies led by Tata Power, JSW Energy, Jindal Power, Sterlite Infra ventures Ltd., CLP India Private Ltd, Larsen & Toubro, Adani Power, Vedanta and state-run NTPC have shown interest in taking up the two 4,000 MW UMPPs. Odisha UMPP is a pit-head power project, based on domestic coal to be sourced from allocated captive coal blocks, with an expected investment of about Rs. 250bn. The price bids are expected to be called by Feb/March 2014. As per the guidelines companies building UMPPs have to source equipment from domestic manufacturers.
Order flow from Power Grid (Rs bn)
10.2 14.2 26.8
64.8
9.6 15.0 24.4
129.9
3.3
36.2
74.1
107.9
61.1
31.7 46.7
21.8 32.8
24.2
Q1F
Y10
Q2F
Y10
Q3F
Y10
Q4F
Y10
Q1F
Y11
Q2F
Y11
Q3F
Y11
Q4F
Y11
Q1F
Y12
Q2F
Y12
Q3F
Y12
Q4F
Y12
Q1F
Y13
Q2F
Y13
Q3F
Y13
Q4F
Y13
Q1F
Y14
Q2F
Y14
Source: Company Data, PL Research

January 09, 2014 75
Oct-Dec 2013 Earnings Preview
Power Grid (PWG) ordering for H1FY14 remained subdued. Ordering for H1FY14 stood at Rs57bn (down 36% YoY). Trend in ordering is more evenly spread through the year against an earlier trend of Q4 being the quarter in which most of the awarding is done. Transmission EPC continued to dominate ordering in H1FY14 with 44% share. In the overall ordering, Substation (30%) and Equipment ordering remained weak with a market share of 1.7% in H1FY14 (Exhibit 1). We expect the FY14 ordering for PWG in the range of Rs160-170bn (0-6% growth YoY). Our interaction with PWG suggests pending ordering worth Rs260bn to be tendered over the next two years (14400ckm of Transmission line, 9 Substation and 50,000MVA of transformer capacity). Apart from this, new approvals are likely to come over the next two years which is expected to improve the outlook.
Transmission orders continue to command high share in the overall ordering in PWG (44% in H1FY14). The trend of consolidation, which was visible in FY13, continued even in H1FY14, with players like KEC/KPP/L&T/Tata Projects gaining significant market share (Exhibit 4). All 4 players put together had 81% market share in H1FY14. Our interactions with industry players indicate that the domestic market has seen consolidation as at present only four other players have general qualification (no restriction of number of projects that can be bid upon) along with PWG, while various restrictions have been imposed upon lot of players who have not performed in past. We believe that the competitive intensity decreased due to the fact that PWG stopped opening bids of various players who were not performing in terms of execution. Also, people who had taken orders at low margins are draining financially and hence, refraining from ordering.
Transformer/Reactor orders continued to be weak, with total orders in H1FY14 standing at Rs4.9bn, bundling of transformer order with substation orders in H1FY14 also could have led to lower standalone equipment ordering. While Chinese players dominated the Transformer market, with market share of 40-45% in FY13 , Chinese did not win any tenders in H1FY14. We note that the Chinese players were present in all the bids and still didn’t win any projects; we believe adverse currency movement could have played a part. We learn that with PWG becoming stringent about the domestic manufacturing clause, we could see some moderation in the Chinese market share in transformer ordering for full year FY14 as well. Domestic players like Crompton are benefiting and dominated the ordering in H1FY14 with 58% market share, followed by ABB with 12% market share. Our recent interaction with industry players suggest that the fall in pricing has stopped in the last few tenders.
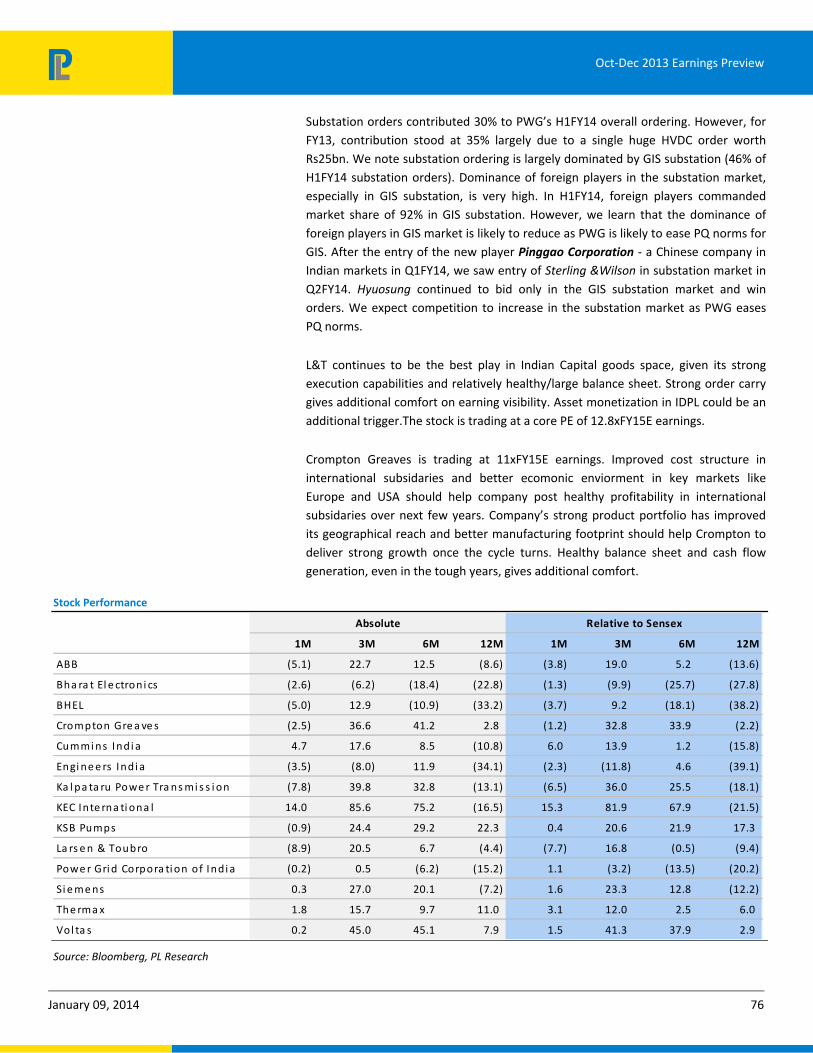
January 09, 2014 76
Oct-Dec 2013 Earnings Preview
Substation orders contributed 30% to PWG’s H1FY14 overall ordering. However, for FY13, contribution stood at 35% largely due to a single huge HVDC order worth Rs25bn. We note substation ordering is largely dominated by GIS substation (46% of H1FY14 substation orders). Dominance of foreign players in the substation market, especially in GIS substation, is very high. In H1FY14, foreign players commanded market share of 92% in GIS substation. However, we learn that the dominance of foreign players in GIS market is likely to reduce as PWG is likely to ease PQ norms for GIS. After the entry of the new player Pinggao Corporation - a Chinese company in Indian markets in Q1FY14, we saw entry of Sterling &Wilson in substation market in Q2FY14. Hyuosung continued to bid only in the GIS substation market and win orders. We expect competition to increase in the substation market as PWG eases PQ norms.
L&T continues to be the best play in Indian Capital goods space, given its strong execution capabilities and relatively healthy/large balance sheet. Strong order carry gives additional comfort on earning visibility. Asset monetization in IDPL could be an additional trigger.The stock is trading at a core PE of 12.8xFY15E earnings.
Crompton Greaves is trading at 11xFY15E earnings. Improved cost structure in international subsidaries and better ecomonic enviorment in key markets like Europe and USA should help company post healthy profitability in international subsidaries over next few years. Company’s strong product portfolio has improved its geographical reach and better manufacturing footprint should help Crompton to deliver strong growth once the cycle turns. Healthy balance sheet and cash flow generation, even in the tough years, gives additional comfort.
Stock Performance
1M 3M 6M 12M 1M 3M 6M 12M
ABB (5.1) 22.7 12.5 (8.6) (3.8) 19.0 5.2 (13.6)
Bha ra t El e ctroni cs (2.6) (6.2) (18.4) (22.8) (1.3) (9.9) (25.7) (27.8)
BHEL (5.0) 12.9 (10.9) (33.2) (3.7) 9.2 (18.1) (38.2)
Crompton Gre a ve s (2.5) 36.6 41.2 2.8 (1.2) 32.8 33.9 (2.2)
Cummi ns Indi a 4.7 17.6 8.5 (10.8) 6.0 13.9 1.2 (15.8)
Engi ne e rs Indi a (3.5) (8.0) 11.9 (34.1) (2.3) (11.8) 4.6 (39.1)
Ka l pa ta ru Powe r Tra ns mi s s i on (7.8) 39.8 32.8 (13.1) (6.5) 36.0 25.5 (18.1)
KEC Inte rna ti ona l 14.0 85.6 75.2 (16.5) 15.3 81.9 67.9 (21.5)
KSB Pumps (0.9) 24.4 29.2 22.3 0.4 20.6 21.9 17.3
La rs e n & Toubro (8.9) 20.5 6.7 (4.4) (7.7) 16.8 (0.5) (9.4)
Powe r Gri d Corpora ti on of Indi a (0.2) 0.5 (6.2) (15.2) 1.1 (3.2) (13.5) (20.2)
Si e me ns 0.3 27.0 20.1 (7.2) 1.6 23.3 12.8 (12.2)
The rma x 1.8 15.7 9.7 11.0 3.1 12.0 2.5 6.0
Vol ta s 0.2 45.0 45.1 7.9 1.5 41.3 37.9 2.9
Absolute Relative to Sensex
Source: Bloomberg, PL Research

January 09, 2014 77
Oct-Dec 2013 Earnings Preview
Summary Financials ‐ Quarterly (Rs m)
Q3FY14E Q3FY13 YoY gr. (%) Q2FY14 QoQ gr. (%) 9MFY14E 9MFY13 YoY gr. (%)
Sa les 19,501 20,528 (5.0) 17,859 9.2 74,776 76,105 (1.7)
EBITDA 1,269 370 242.7 1,054 20.4 4,337 3,416 27.0
Margins (%) 6.5 1.8 470 bps 5.9 61 bps 5.8 4.5 131 bps
PAT 515 167 207.6 356 44.6 1,715 1,409 21.7
Sa les 15,014 14,437 4.0 10,448 43.7 34,445 33,042 4.2
EBITDA 1,124 1,382 (18.6) 17 6,436.7 582 218 167.5
Margins (%) 7.5 9.6 (208)bps 0.2 732 bps 1.7 0.7 103 bps
PAT 1,852 1,976 (6.3) 593 212.3 2,618 2,972 (11.9)
Sa les 85,354 100,417 (15.0) 88,190 (3.2) 237,070 287,675 (17.6)
EBITDA 5,331 14,560 (63.4) 2,466 116.2 10,627 42,830 (75.2)
Margins (%) 6.2 14.5 (825)bps 2.8 345 bps 4.5 14.9 (1,041)bps
PAT 5,816 11,819 (50.8) 4,560 27.6 15,030 33,772 (55.5)
Sa les 32,937 29,718 10.8 32,049 2.8 96,558 87,071 10.9
EBITDA 1,736 20 8,535.3 1,613 7.6 4,796 3,052 57.1
Margins (%) 5.3 0.1 520 bps 5.0 24 bps 5.0 3.5 146 bps
PAT 760 (683) (211.4) 598 27.2 1,966 591 232.5
Sa les 9,618 10,895 (11.7) 9,327 3.1 29,438 34,352 (14.3)
EBITDA 1,597 2,086 (23.4) 1,527 4.6 4,880 6,411 (23.9)
Margins (%) 16.6 19.1 (254)bps 16.4 24 bps 16.6 18.7 (209)bps
PAT 1,413 1,866 (24.3) 1,448 (2.5) 4,523 5,281 (14.4)
Sa les 4,838 6,048 (20.0) 4,652 4.0 13,922 19,925 (30.1)
EBITDA 1,007 1,313 (23.3) 886 13.7 3,057 4,509 (32.2)
Margins (%) 20.8 21.7 (89)bps 19.0 178 bps 22.0 22.6 (67)bps
PAT 1,206 1,323 (8.8) 1,119 7.8 3,618 4,479 (19.2)
Sa les 10,231 8,897 15.0 9,622 6.3 28,749 23,038 24.8
EBITDA 1,034 886 16.8 911 13.5 2,865 2,224 28.9
Margins (%) 10.1 10.0 15 bps 9.5 64 bps 10.0 9.7 31 bps
PAT 374 351 6.4 310 20.6 1,030 890 15.7
Sa les 19,767 17,970 10.0 17,780 11.2 55,011 48,295 13.9
EBITDA 1,210 1,035 17.0 1,119 8.2 3,210 2,925 9.7
Margins (%) 6.1 5.8 37 bps 6.3 (17)bps 5.8 6.1 (22)bps
PAT 259 293 (11.6) 221 17.4 573 790 (27.4)
Sa les 2,061 1,971 4.6 1,902 8.3 7,564 7,224 4.7
EBITDA 302 299 1.1 302 0.1 1,112 911 22.1
Margins (%) 14.7 15.2 (51)bps 15.9 (120)bps 14.7 12.6 209 bps
PAT 178 195 (8.7) 179 (0.4) 7,564 7,224 4.7
Engineers India
ABB
Bharat Electronics
BHEL
Crompton Greaves
Cummins India
Kalpataru Power Transmiss ion
KEC Internationa l
KSB Pumps
Source: Company Data, PL Research ABB & KSB Pumps – Y/e Dec Siemens – Y/e Sep

January 09, 2014 78
Oct-Dec 2013 Earnings Preview
Summary Financials ‐ Quarterly (Rs m)
Q3FY14E Q3FY13 YoY gr. (%) Q2FY14 QoQ gr. (%) 9MFY14E 9MFY13 YoY gr. (%)
Sa les 174,352 154,294 13.0 145,095 20.2 444,997 405,810 9.7
EBITDA 17,784 16,000 11.2 14,017 26.9 42,516 40,952 3.8
Margins (%) 10.2 10.4 (17)bps 9.7 54 bps 9.6 10.1 (54)bps
PAT 11,544 10,218 13.0 9,775 18.1 28,879 28,401 1.7
Sa les 41,052 33,617 22.1 39,816 3.1 116,468 93,357 24.8
EBITDA 33,952 29,231 16.2 33,708 0.7 98,252 80,570 21.9
Margins (%) 82.7 87.0 (425)bps 84.7 (195)bps 84.4 86.3 (194)bps
PAT 12,667 11,290 12.2 12,461 1.6 35,465 31,250 13.5
Sa les 25,850 24,856 2.0 32,589 (10.3) 126,119 113,524 5.5
EBITDA 1,282 1,616 (10.3) 1,755 (13.5) 9,207 4,204 59.5
Margins (%) 2.5 3.2 (39)bps 2.7 (11)bps 3.7 1.9 90 bps
PAT 456 731 (18.8) 971 (26.5) 4,995 1,937 79.0
Sa les 9,631 10,468 (8.0) 10,433 (7.7) 28,692 32,227 (11.0)
EBITDA 903 1,119 (19.3) 935 (3.4) 2,652 3,300 (19.7)
Margins (%) 9.4 10.7 (131)bps 9.0 41 bps 9.2 10.2 (100)bps
PAT 717 764 (6.2) 592 21.0 1,811 2,348 (22.8)
Sa les 11,064 11,525 (4.0) 10,805 2.4 37,903 39,242 (3.4)
EBITDA 334 242 37.7 432 (22.8) 1,381 1,526 (9.5)
Margins (%) 3.0 2.1 91 bps 4.0 (98)bps 3.6 3.9 (25)bps
PAT 344 170 101.9 424 (18.8) 1,174 1,235 (4.9)
Thermax
Voltas
Siemens
Larsen & Toubro
Power Grid Corporation of India
Source: Company Data, PL Research ABB & KSB Pumps – Y/e Dec Siemens – Y/e Sep
Consolidated Sectoral Data
Quarterly Table (Rs m)
Oct‐Dec'13 Oct‐Dec'12 YoY gr. (%) Jul‐Sep'13 QoQ gr. (%)
Net Sa les 420,218 412,022 2.0 390,751 7.5
EBITDA 34,914 40,927 (14.7) 27,034 29.1
Margin (%) 8.3 9.9 (162)bps 6.9 139 bps
PAT (Excl . Ex Items) 25,145 29,191 (13.9) 21,145 18.9
Note: Revenue, EBITDA and PAT numbers are arrived by totaling corresponding numbers of all companies under our coverage in this
sector.
All Nos. excluding Power Grid Corporation
Key Figures (Rs m)
2013 2014E 2015E
Net Sales 1,771,817 1,794,809 1,952,850
Growth (%) 6.7 1.3 8.8
EBITDA 209,230 174,993 196,886
Margin (%) 11.8 9.7 10.1
PAT 150,945 120,188 132,837
Growth (%) (4.5) (20.4) 10.5
PE (x) 18.0 22.5 20.4
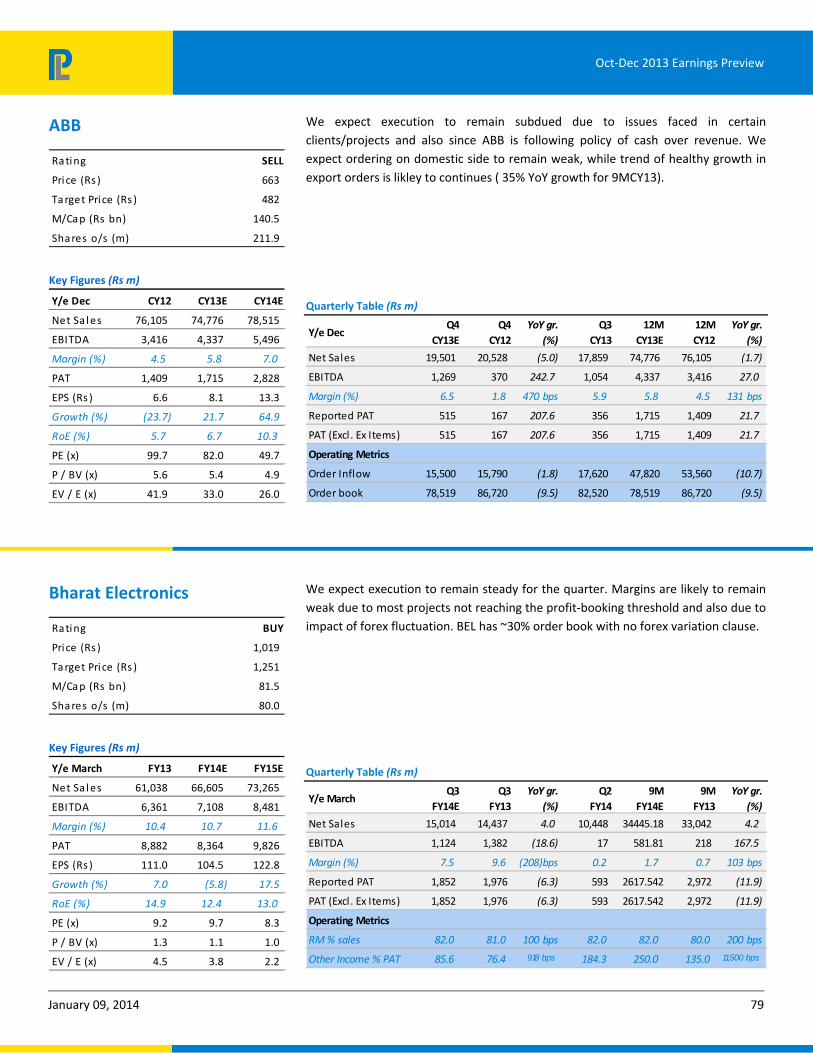
January 09, 2014 79
Oct-Dec 2013 Earnings Preview
We expect execution to remain subdued due to issues faced in certain clients/projects and also since ABB is following policy of cash over revenue. We expect ordering on domestic side to remain weak, while trend of healthy growth in export orders is likley to continues ( 35% YoY growth for 9MCY13).
Quarterly Table (Rs m)
Y/e DecQ4
CY13E
Q4
CY12
YoY gr.
(%)
Q3
CY13
12M
CY13E
12M
CY12
YoY gr.
(%)
Net Sales 19,501 20,528 (5.0) 17,859 74,776 76,105 (1.7)
EBITDA 1,269 370 242.7 1,054 4,337 3,416 27.0
Margin (%) 6.5 1.8 470 bps 5.9 5.8 4.5 131 bps
Reported PAT 515 167 207.6 356 1,715 1,409 21.7
PAT (Excl. Ex Items) 515 167 207.6 356 1,715 1,409 21.7
Operating Metrics
Order Inflow 15,500 15,790 (1.8) 17,620 47,820 53,560 (10.7)
Order book 78,519 86,720 (9.5) 82,520 78,519 86,720 (9.5)
We expect execution to remain steady for the quarter. Margins are likely to remain weak due to most projects not reaching the profit-booking threshold and also due to impact of forex fluctuation. BEL has ~30% order book with no forex variation clause.
Quarterly Table (Rs m)
Y/e MarchQ3
FY14E
Q3
FY13
YoY gr.
(%)
Q2
FY14
9M
FY14E
9M
FY13
YoY gr.
(%)
Net Sales 15,014 14,437 4.0 10,448 34445.18 33,042 4.2
EBITDA 1,124 1,382 (18.6) 17 581.81 218 167.5
Margin (%) 7.5 9.6 (208)bps 0.2 1.7 0.7 103 bps
Reported PAT 1,852 1,976 (6.3) 593 2617.542 2,972 (11.9)
PAT (Excl. Ex Items) 1,852 1,976 (6.3) 593 2617.542 2,972 (11.9)
Operating Metrics
RM % sales 82.0 81.0 100 bps 82.0 82.0 80.0 200 bps
Other Income % PAT 85.6 76.4 918 bps 184.3 250.0 135.0 11,500 bps
ABB
Rating SELL
Price (Rs ) 663
Target Price (Rs ) 482
M/Cap (Rs bn) 140.5
Shares o/s (m) 211.9
Key Figures (Rs m)
Y/e Dec CY12 CY13E CY14E
Net Sa l es 76,105 74,776 78,515
EBITDA 3,416 4,337 5,496
Margin (%) 4.5 5.8 7.0
PAT 1,409 1,715 2,828
EPS (Rs ) 6.6 8.1 13.3
Growth (%) (23.7) 21.7 64.9
RoE (%) 5.7 6.7 10.3
PE (x) 99.7 82.0 49.7
P / BV (x) 5.6 5.4 4.9
EV / E (x) 41.9 33.0 26.0
Bharat Electronics
Ra ting BUY
Price (Rs ) 1,019
Ta rget Price (Rs ) 1,251
M/Ca p (Rs bn) 81.5
Sha res o/s (m) 80.0
Key Figures (Rs m)
Y/e March FY13 FY14E FY15E
Net Sa l es 61,038 66,605 73,265
EBITDA 6,361 7,108 8,481
Margin (%) 10.4 10.7 11.6
PAT 8,882 8,364 9,826
EPS (Rs ) 111.0 104.5 122.8
Growth (%) 7.0 (5.8) 17.5
RoE (%) 14.9 12.4 13.0
PE (x) 9.2 9.7 8.3
P / BV (x) 1.3 1.1 1.0
EV / E (x) 4.5 3.8 2.2

January 09, 2014 80
Oct-Dec 2013 Earnings Preview
A reducing order book and stalled projects of various clients due to many issues are likely to impact revenue booking. BHEL has announced one order worth Rs 10bn during the quarter from Neyveli Lignite. With no major orders being finalised in the sector, we expect order booking for BHEL to remain weak for the quarter.
Quarterly Table (Rs m)
Y/e MarchQ3
FY14E
Q3
FY13
YoY gr.
(%)
Q2
FY14
9M
FY14E
9M
FY13
YoY gr.
(%)
Net Sales 85,354 100,417 (15.0) 88,190 237069.5 287,675 (17.6)
EBITDA 5,331 14,560 (63.4) 2,466 10626.77 42,830 (75.2)
Margin (%) 6.2 14.5 (825)bps 2.8 4.5 14.9 (1,041)bps
Reported PAT 5,816 11,819 (50.8) 4,560 15030.14 33,772 (55.5)
PAT (Excl. Ex Items) 5,816 11,819 (50.8) 4,560 15030.14 33,772 (55.5)
Operating Metrics (Rs bn)
Order book 977 1,130 (13.5) 1,023 977 1,130 (13.5)
Order inflow -Total 40 20 102.4 26 80 107 (25.2)
We expect International subsidiaries to post a loss of Rs529m on account of continued losses in Canada & USA. We expect improved performance in Belgium and Hungary to help reduce loss in subsidaries QoQ (Rs 729mn in Q2FY14). In the domestic business after a weak Q2FY14 in consumer business (12% YoY), we expect consumer segment to bounce back to trend growth rate of 17-18%.
Quarterly Table (Rs m)
Y/e MarchQ3
FY14E
Q3
FY13
YoY gr.
(%)
Q2
FY14
9M
FY14E
9M
FY13
YoY gr.
(%)
Net Sales 32,937 29,718 10.8 32,049 96558 87,071 10.9
EBITDA 1,736 20 8,535.3 1,613 4826.0 3,052 58.1
Margin (%) 5.3 0.1 520 bps 5.0 5.0 3.5 149 bps
Reported PAT 760 (683) LTP 598 1966 (601) (427.2)
PAT (Excl. Ex Items) 760 (683) LTP 598 1966 (601) (427.2)
Operating Metrics
Power segment 20,434 18,177 12.4 20,265 40,699 35,439 14.8
Industry segment 4,443 4,518 (1.7) 4,380 8,823 8,866 (0.5)
Consumer segment 7,101 6,070 17.0 6,592 13,693 12,365 10.7
BHEL
Rating Reduce
Price (Rs ) 163
Target Price (Rs ) 133
M/Cap (Rs bn) 398.7
Shares o/s (m) 2,447.5
Key Figures (Rs m)
Y/e March FY13 FY14E FY15E
Net Sa l es 484,246 420,965 404,126
EBITDA 93,898 53,925 47,197
Margin (%) 19.4 12.8 11.7
PAT 66,116 39,766 33,066
EPS (Rs ) 27.0 16.2 13.5
Growth (%) (6.3) (39.9) (16.8)
RoE (%) 23.7 12.7 9.9
PE (x) 6.0 10.0 12.1
P / BV (x) 1.3 1.2 1.2
EV / E (x) 3.6 6.5 6.4
Crompton Greaves
Rating Buy
Price (Rs ) 126
Target Price (Rs ) 141
M/Cap (Rs bn) 81.1
Shares o/s (m) 641.5
Key Figures (Rs m)
Y/e March FY13 FY14E FY15E
Net Sa l es 120,944 134,391 148,622
EBITDA 3,832 7,389 10,938
Margin (%) 3.2 5.5 7.4
PAT 2,686 2,676 6,200
EPS (Rs ) 4.2 4.2 9.7
Growth (%) (25.7) (0.4) 131.7
RoE (%) 7.3 6.9 14.4
PE (x) 30.2 30.3 13.1
P / BV (x) 2.2 2.0 1.8
EV / E (x) 24.5 12.5 8.2

January 09, 2014 81
Oct-Dec 2013 Earnings Preview
While sales are likely to be down YoY, we expect the sales to improve QoQ due to improved volume in powergen segment from southern market due to low wind power generation and low PLF of coal plants in Tamil Nadu. We expect margins to be down YoY due to moderating demand and cross-corporate charges of ~Rs150m/quarter.
Quarterly Table (Rs m)
Y/e MarchQ3
FY14E
Q3
FY13
YoY gr.
(%)
Q2
FY14
9M
FY14E
9M
FY13
YoY gr.
(%)
Net Sales 9,618 10,895 (11.7) 9,327 29438.4 34,352 (14.3)
EBITDA 1,597 2,086 (23.4) 1,527 4879.76 6,411 (23.9)
Margin (%) 16.6 19.1 (254)bps 16.4 16.6 18.7 (209)bps
Reported PAT 1,413 1,866 (24.3) 1,448 4522.978 5,281 (14.4)
PAT (Excl. Ex Items) 1,413 1,866 (24.3) 1,448 4522.978 5,281 (14.4)
Operating Metrics
RM % Sales 62.4 62.7 (30)bps 63.0 62.5 63.0 (50)bps
% Full year Sales 21.0 23.7 (278)bps 24.0 45.0 48.0 (304)bps
We expect the sales to be down 20% YoY on account of weak order carry. We expect margin to be under pressure due to low volumers and execution of low margins ordes. We expect order booking to be heathy as it was L1 in ~30bn worth of tenders.
Quarterly Table (Rs m)
Y/e MarchQ3
FY14E
Q3
FY13
YoY gr.
(%)
Q2
FY14
9M
FY14E
9M
FY13
YoY gr.
(%)
Net Sales 4,838 6,048 (20.0) 4,652 13921.6 19,925 (30.1)
EBITDA 1,007 1,313 (23.3) 886 3057.4 4,509 (32.2)
Margin (%) 20.8 21.7 (89)bps 19.0 22.0 22.6 (67)bps
Reported PAT 1,206 1,323 (8.8) 1,119 3617.881 4,479 (19.2)
PAT (Excl. Ex Items) 1,206 1,323 (8.8) 1,119 3617.881 4,479 (19.2)
Operating Metrics
Consultancy (Rs m) 2,287 2,896 (21.0) 2,641 4,928 6,420 (23.2)
LSTK (Rs m) 2,553 3,152 (19.0) 2,011 4,564 7,457 (38.8)
Other Inc. / PAT (%) 0.0 50.6 (5,056)bps 74.0 45.7 46.0 (30)bps
Order Book (Rs bn) 27.8 38.5 (27.8) 27.6 27.8 38.5 (27.8)
Cummins India
Rating Accumulate
Price (Rs ) 472
Target Price (Rs ) 504
M/Cap (Rs bn) 130.7
Shares o/s (m) 277.2
Key Figures (Rs m)
Y/e March FY13 FY14E FY15E
Net Sa l es 45,894 41,416 46,788
EBITDA 8,349 7,041 8,188
Margin (%) 18.2 17.0 17.5
PAT 6,846 6,287 6,995
EPS (Rs ) 24.7 22.7 25.2
Growth (%) 26.8 (8.2) 11.3
RoE (%) 30.9 25.8 26.4
PE (x) 19.1 20.8 18.7
P / BV (x) 5.5 5.2 4.7
EV / E (x) 15.4 18.3 15.6
Engineers India
Rating Accumulate
Price (Rs ) 157
Target Price (Rs ) 193
M/Cap (Rs bn) 53.0
Shares o/s (m) 336.9
Key Figures (Rs m)
Y/e March FY13 FY14E FY15E
Net Sa l es 25,059 20,047 22,052
EBITDA 6,138 4,571 5,187
Margin (%) 24.5 22.8 23.5
PAT 6,181 5,366 5,651
EPS (Rs ) 18.3 15.9 16.8
Growth (%) (2.9) (13.2) 5.3
RoE (%) 30.3 22.5 21.0
PE (x) 8.6 9.9 9.4
P / BV (x) 2.4 2.1 1.9
EV / E (x) 5.6 6.4 5.4

January 09, 2014 82
Oct-Dec 2013 Earnings Preview
We expect sales growth to be 15% YoY at Rs10.2bn driven by strong execution in both domestic and international markets. Margins are likely to be stable YoY. Order inflow is likely to be strong as the company has managed good orders from international markets.
Quarterly Table (Rs m)
Y/e MarchQ3
FY14E
Q3
FY13
YoY gr.
(%)
Q2
FY14
9M
FY14E
9M
FY13
YoY gr.
(%)
Net Sales 10,231 8,897 15.0 9,622 28749.21 23,038 24.8
EBITDA 1,034 886 16.8 911 2865.375 2,224 28.9
Margin (%) 10.1 10.0 15 bps 9.5 10.0 9.7 31 bps
Reported PAT 374 351 6.4 310 1030.325 890 15.7
PAT (Excl. Ex Items) 374 351 6.4 310 1030.325 890 15.7
Operating Metrics
Order Book (Rs m) 69,552 65,000 7.0 70,782 69,552 65,000 7.0
Order Flow (Rs m) 11,500 9,500 21.1 9,000 28,500 22,140 28.7
Interest % sales 4.2 3.9 30 bps 4.3 4.3 3.8 50 bps
We expect sales growth to be 10% YoY at Rs19.7bn driven by strong execution in both domestic and international markets. We do not expect sigficant improvement in margins QoQ due to execution of low margin orders and contribution from new businesses with low margins and forex losses. Higher interest costs and lower margins will take a toll on the PAT growth.
Quarterly Table (Rs m)
Y/e MarchQ3
FY14E
Q3
FY13
YoY gr.
(%)
Q2
FY14
9M
FY14E
9M
FY13
YoY gr.
(%)
Net Sales 19,767 17,970 10.0 17,780 55010.79 48,295 13.9
EBITDA 1,210 1,035 17.0 1,119 3209.76 2,925 9.7
Margin (%) 6.1 5.8 37 bps 6.3 5.8 6.1 (22)bps
Reported PAT 259 293 (11.6) 221 573.435 790 (27.4)
PAT (Excl. Ex Items) 259 293 (11.6) 221 573.435 790 (27.4)
Operating Metrics
Order Book 78,489 101,500 (22.7) 82,256 78,489 101,500 (22.7)
Order Flow 16,000 22,900 (30.1) 16,000 32,000 34,900 (8.3)
Interest % sales 3.4 2.9 42 bps 3.6 3.2 2.9 30 bps
Kalpataru Power Transmission
Rating Accumulate
Price (Rs ) 86
Target Price (Rs ) 97
M/Cap (Rs bn) 13.2
Shares o/s (m) 153.5
Key Figures (Rs m)
Y/e March FY13 FY14E FY15E
Net Sa l es 33,354 39,224 45,108
EBITDA 3,265 3,883 4,465
Margin (%) 9.8 9.9 9.9
PAT 1,421 1,613 1,921
EPS (Rs ) 9.3 10.5 12.5
Growth (%) (13.8) 13.5 19.1
RoE (%) 7.9 8.4 9.2
PE (x) 9.3 8.2 6.9
P / BV (x) 0.7 0.7 0.6
EV / E (x) 5.5 5.1 4.5
KEC International
Rating Accumulate
Price (Rs ) 56
Target Price (Rs ) 58
M/Cap (Rs bn) 14.4
Shares o/s (m) 257.0
Key Figures (Rs m)
Y/e March FY13 FY14E FY15E
Net Sa l es 69,795 80,971 89,750
EBITDA 3,814 5,062 6,214
Margin (%) 5.5 6.3 6.9
PAT 654 1,301 1,944
EPS (Rs ) 2.5 5.1 7.6
Growth (%) (64.9) 99.0 49.4
RoE (%) 5.7 10.2 13.4
PE (x) 22.0 11.1 7.4
P / BV (x) 1.2 1.1 0.9
EV / E (x) 7.2 5.4 4.6
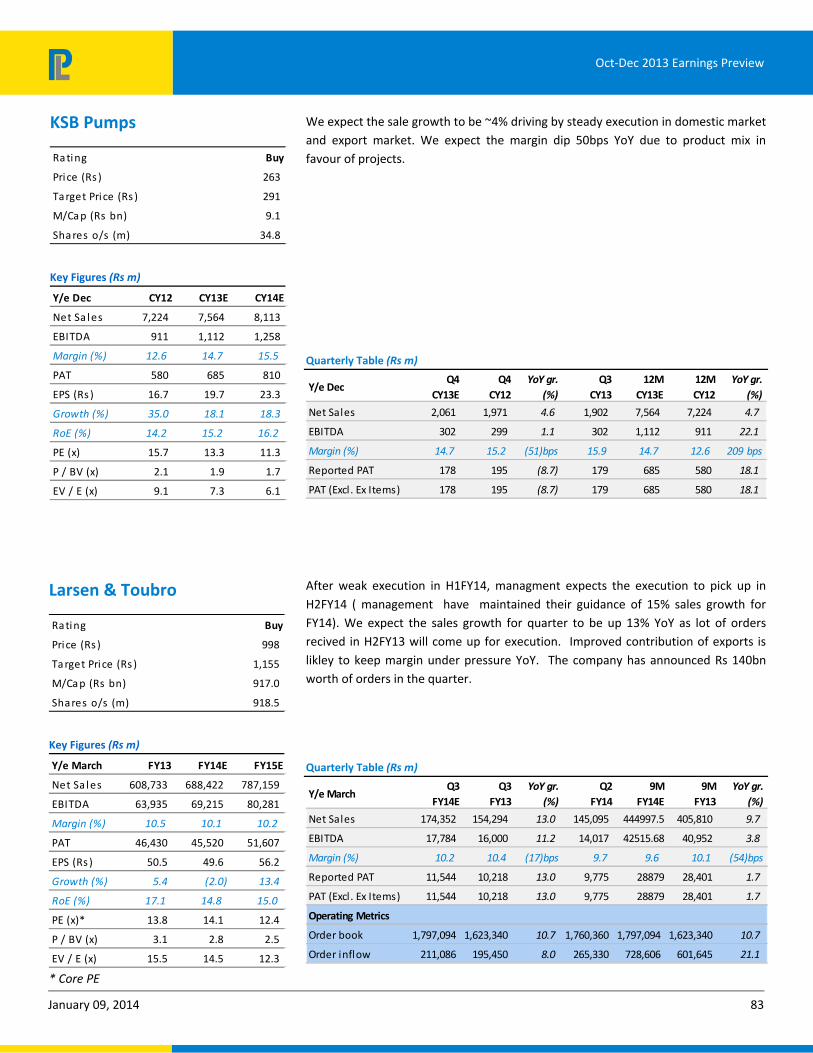
January 09, 2014 83
Oct-Dec 2013 Earnings Preview
We expect the sale growth to be ~4% driving by steady execution in domestic market and export market. We expect the margin dip 50bps YoY due to product mix in favour of projects.
Quarterly Table (Rs m)
Y/e DecQ4
CY13E
Q4
CY12
YoY gr.
(%)
Q3
CY13
12M
CY13E
12M
CY12
YoY gr.
(%)
Net Sales 2,061 1,971 4.6 1,902 7,564 7,224 4.7
EBITDA 302 299 1.1 302 1,112 911 22.1
Margin (%) 14.7 15.2 (51)bps 15.9 14.7 12.6 209 bps
Reported PAT 178 195 (8.7) 179 685 580 18.1
PAT (Excl. Ex Items) 178 195 (8.7) 179 685 580 18.1
After weak execution in H1FY14, managment expects the execution to pick up in H2FY14 ( management have maintained their guidance of 15% sales growth for FY14). We expect the sales growth for quarter to be up 13% YoY as lot of orders recived in H2FY13 will come up for execution. Improved contribution of exports is likley to keep margin under pressure YoY. The company has announced Rs 140bn worth of orders in the quarter.
Quarterly Table (Rs m)
Y/e MarchQ3
FY14E
Q3
FY13
YoY gr.
(%)
Q2
FY14
9M
FY14E
9M
FY13
YoY gr.
(%)
Net Sales 174,352 154,294 13.0 145,095 444997.5 405,810 9.7
EBITDA 17,784 16,000 11.2 14,017 42515.68 40,952 3.8
Margin (%) 10.2 10.4 (17)bps 9.7 9.6 10.1 (54)bps
Reported PAT 11,544 10,218 13.0 9,775 28879 28,401 1.7
PAT (Excl. Ex Items) 11,544 10,218 13.0 9,775 28879 28,401 1.7
Operating Metrics
Order book 1,797,094 1,623,340 10.7 1,760,360 1,797,094 1,623,340 10.7
Order inflow 211,086 195,450 8.0 265,330 728,606 601,645 21.1
KSB Pumps
Rating Buy
Price (Rs ) 263
Target Price (Rs ) 291
M/Cap (Rs bn) 9.1
Shares o/s (m) 34.8
Key Figures (Rs m)
Y/e Dec CY12 CY13E CY14E
Net Sa l es 7,224 7,564 8,113
EBITDA 911 1,112 1,258
Margin (%) 12.6 14.7 15.5
PAT 580 685 810
EPS (Rs ) 16.7 19.7 23.3
Growth (%) 35.0 18.1 18.3
RoE (%) 14.2 15.2 16.2
PE (x) 15.7 13.3 11.3
P / BV (x) 2.1 1.9 1.7
EV / E (x) 9.1 7.3 6.1
Larsen & Toubro
Rating Buy
Price (Rs ) 998
Target Price (Rs ) 1,155
M/Cap (Rs bn) 917.0
Shares o/s (m) 918.5
Key Figures (Rs m)
Y/e March FY13 FY14E FY15E
Net Sa l es 608,733 688,422 787,159
EBITDA 63,935 69,215 80,281
Margin (%) 10.5 10.1 10.2
PAT 46,430 45,520 51,607
EPS (Rs ) 50.5 49.6 56.2
Growth (%) 5.4 (2.0) 13.4
RoE (%) 17.1 14.8 15.0
PE (x)* 13.8 14.1 12.4
P / BV (x) 3.1 2.8 2.5
EV / E (x) 15.5 14.5 12.3
* Core PE

January 09, 2014 84
Oct-Dec 2013 Earnings Preview
We expect the company to continue to deliver on execution. We expect the capitalization to be up 132% YoY due to low base and commsiisiong of Raichur –Sholapur line ( Rs 8bn). As per the company, quick clearance and corporation from the Ministry of Power has also aided execution.
Quarterly Table (Rs m)
Y/e MarchQ3
FY14E
Q3
FY13
YoY gr.
(%)
Q2
FY14
9M
FY14E
9M
FY13
YoY gr.
(%)
Net Sales 41,052 33,617 22.1 39,816 116467.8 93,357 24.8
EBITDA 33,952 29,231 16.2 33,708 98251.5 80,570 21.9
Margin (%) 82.7 87.0 (425)bps 84.7 84.4 86.3 (194)bps
Reported PAT 12,667 11,290 12.2 12,461 35464.51 31,250 13.5
PAT (Excl. Ex Items) 12,667 11,290 12.2 12,461 35464.51 31,250 13.5
Operating Metrics
Capital ization(Rs bn 60 26 132.0 21 110 91 20.9
We expect stagnant orders and client-related issues in specific projects leading to muted execution. In addition, the provision related to cost overruns in few projects to continue to impact margins.
Quarterly Table (Rs m)
Y/e SepQ1
FY14E
Q1
FY13
YoY gr.
(%)
Q4
FY13
12M
FY14
12M
FY13
YoY gr.
(%)
Net Sales 25,850 24,856 4.0 32,589 126,119 113,524 11.1
EBITDA 1,282 1,616 (20.6) 1,755 9,207 4,204 119.0
Margin (%) 5.0 6.5 (154)bps 5.4 7.3 3.7 360 bps
Reported PAT 456 731 (37.5) 971 4,995 1,937 157.9
PAT (Excl. Ex Items) 456 731 (37.5) 971 4,995 1,937 157.9
Operating Metrics
Order Book (Rs bn) 124 132 (6.1) 124 124 137 (9.5)
Order Inflows (Rs bn 24 20 20.6 35 125 109 14.7
Power Grid Corporation
Rating BUY
Price (Rs ) 99
Target Price (Rs ) 116
M/Cap (Rs bn) 525.8
Shares o/s (m) 5,324.1
Key Figures (Rs m)
Y/e March FY13 FY14E FY15E
Net Sa l es 127,579 156,931 180,559
EBITDA 109,999 136,832 161,012
Margin (%) 86.2 87.2 89.2
PAT 42,343 48,787 53,977
EPS (Rs ) 9.1 9.2 10.1
Growth (%) 30.1 0.2 10.6
RoE (%) 15.1 14.2 13.2
PE (x) 10.8 10.8 9.7
P / BV (x) 1.5 1.4 1.2
EV / E (x) 10.5 8.8 8.1
Siemens
Rating Reduce
Price (Rs ) 631
Target Price (Rs ) 518
M/Cap (Rs bn) 224.7
Shares o/s (m) 356.1
Key Figures (Rs m)
Y/e Sep CY12 CY13E CY14E
Net Sa l es 129,199 113,524 126,119
EBITDA 8,913 4,204 9,207
Margin (%) 6.9 3.7 7.3
PAT 5,211 1,937 4,995
EPS (Rs ) 15.3 5.4 14.0
Growth (%) (38.4) (64.5) 157.9
RoE (%) 13.4 4.8 11.8
PE (x) 41.2 116.0 45.0
P / BV (x) 5.4 5.6 5.1
EV / E (x) 24.1 52.0 23.0
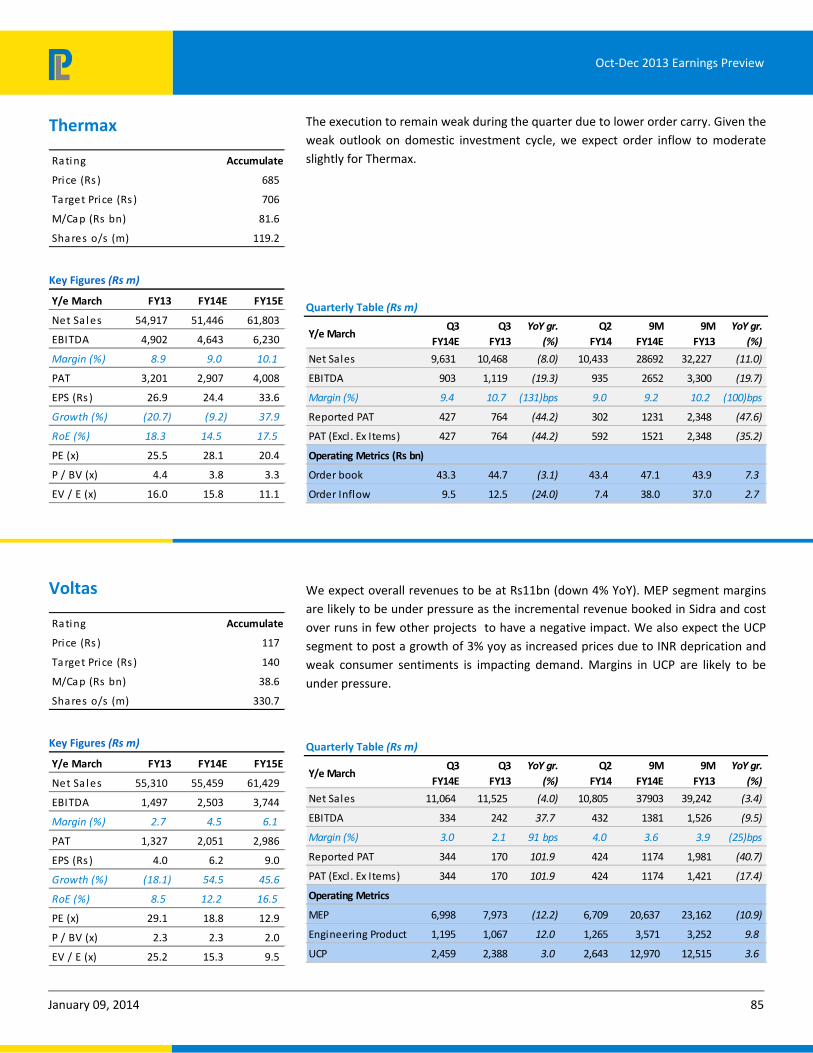
January 09, 2014 85
Oct-Dec 2013 Earnings Preview
The execution to remain weak during the quarter due to lower order carry. Given the weak outlook on domestic investment cycle, we expect order inflow to moderate slightly for Thermax.
Quarterly Table (Rs m)
Y/e MarchQ3
FY14E
Q3
FY13
YoY gr.
(%)
Q2
FY14
9M
FY14E
9M
FY13
YoY gr.
(%)
Net Sales 9,631 10,468 (8.0) 10,433 28692 32,227 (11.0)
EBITDA 903 1,119 (19.3) 935 2652 3,300 (19.7)
Margin (%) 9.4 10.7 (131)bps 9.0 9.2 10.2 (100)bps
Reported PAT 427 764 (44.2) 302 1231 2,348 (47.6)
PAT (Excl. Ex Items) 427 764 (44.2) 592 1521 2,348 (35.2)
Operating Metrics (Rs bn)
Order book 43.3 44.7 (3.1) 43.4 47.1 43.9 7.3
Order Inflow 9.5 12.5 (24.0) 7.4 38.0 37.0 2.7
We expect overall revenues to be at Rs11bn (down 4% YoY). MEP segment margins are likely to be under pressure as the incremental revenue booked in Sidra and cost over runs in few other projects to have a negative impact. We also expect the UCP segment to post a growth of 3% yoy as increased prices due to INR deprication and weak consumer sentiments is impacting demand. Margins in UCP are likely to be under pressure.
Quarterly Table (Rs m)
Y/e MarchQ3
FY14E
Q3
FY13
YoY gr.
(%)
Q2
FY14
9M
FY14E
9M
FY13
YoY gr.
(%)
Net Sales 11,064 11,525 (4.0) 10,805 37903 39,242 (3.4)
EBITDA 334 242 37.7 432 1381 1,526 (9.5)
Margin (%) 3.0 2.1 91 bps 4.0 3.6 3.9 (25)bps
Reported PAT 344 170 101.9 424 1174 1,981 (40.7)
PAT (Excl. Ex Items) 344 170 101.9 424 1174 1,421 (17.4)
Operating Metrics
MEP 6,998 7,973 (12.2) 6,709 20,637 23,162 (10.9)
Engineering Product 1,195 1,067 12.0 1,265 3,571 3,252 9.8
UCP 2,459 2,388 3.0 2,643 12,970 12,515 3.6
Thermax
Rating Accumulate
Price (Rs ) 685
Target Price (Rs ) 706
M/Cap (Rs bn) 81.6
Shares o/s (m) 119.2
Key Figures (Rs m)
Y/e March FY13 FY14E FY15E
Net Sa l es 54,917 51,446 61,803
EBITDA 4,902 4,643 6,230
Margin (%) 8.9 9.0 10.1
PAT 3,201 2,907 4,008
EPS (Rs ) 26.9 24.4 33.6
Growth (%) (20.7) (9.2) 37.9
RoE (%) 18.3 14.5 17.5
PE (x) 25.5 28.1 20.4
P / BV (x) 4.4 3.8 3.3
EV / E (x) 16.0 15.8 11.1
Voltas
Rating Accumulate
Price (Rs ) 117
Target Price (Rs ) 140
M/Cap (Rs bn) 38.6
Shares o/s (m) 330.7
Key Figures (Rs m)
Y/e March FY13 FY14E FY15E
Net Sa l es 55,310 55,459 61,429
EBITDA 1,497 2,503 3,744
Margin (%) 2.7 4.5 6.1
PAT 1,327 2,051 2,986
EPS (Rs ) 4.0 6.2 9.0
Growth (%) (18.1) 54.5 45.6
RoE (%) 8.5 12.2 16.5
PE (x) 29.1 18.8 12.9
P / BV (x) 2.3 2.3 2.0
EV / E (x) 25.2 15.3 9.5

January 09, 2013 86
Oct-Dec 2013 Earnings Preview
Kamlesh Bagmar [email protected] +91-22-6632 2237
Mandar Dhavle [email protected] +91-22-6632 2258
Top picks
Shree Cement
Cement
Based on Economic Adviser’s (Ministry of Commerce and Industry) data, all-India cement production grew 2.5% YoY at 39.5m tonnes during Oct-Nov2013. Our interactions with companies suggest growth of ~6% YoY in December on the back of latent demand and restocking ahead of peak season. Hence, we expect all-India production to grow at 3.8% at 62.8m tonnes on a base of +5.5%.
All‐India Cement Production
0.0
2.0
4.0
6.0
8.0
10.0
12.0
14.0
40.0
45.0
50.0
55.0
60.0
65.0
70.0
75.0
Q2F
Y11
Q3F
Y11
Q4F
Y11
Q1F
Y12
Q2F
Y12
Q3F
Y12
Q4F
Y12
Q1F
Y13
Q2F
Y13
Q3F
Y13
Q4F
Y13
Q1F
Y14
Q2F
Y14
Q3F
Y14E
(m tonnes)
India cement production-LHS Growth (%) (RHS)
Source: Economic Advisor to Ministry of Commerce & Industry
All-India cement prices fell 1.1% QoQ (1.2% YoY) at Rs287/bag in the quarter. Eastern region posted the highest fall of 3.6% QoQ on account of 8.7% fall in West Bengal, followed by 4.6% fall in Bihar. Prices in South fell 0.8% on account of steep fall in AP and Tamil Nadu prices. Prices in North fell 0.6%, largely led by subdued prices in Rajasthan. Central region outperformed rest of the regions with flat prices QoQ on the back of firm prices in UP, partially negated by drop in MP prices.
East ‐ the weakest region: Prices in West Bengal and Bihar, the most prominent states in the region, fell by Rs30 and Rs15/bag QoQ, respectively. Prices in Orissa and Chhattisgarh fell by lower quantum of Rs2 and Rs5/bag, respectively. Hence, region’s average fell by Rs13/bag QoQ.
Average price up by Rs7/bag in North; Rajasthan prices down: Delhi witnessed the highest increase in prices of Rs13/bag in the quarter. Prices in Punjab and Haryana rose by an average of Rs9 and Rs8, respectively. On the contrary, prices in Rajasthan, the largest market in the North, fell by Rs6/bag.
Central region ‐ a mixed bag: Prices in UP rose by an average of Rs8/bag due to relatively better demand and rare discipline in Eastern and Central UP. Prices in MP, on the other hand, fell by Rs5/bag on account of the state elections and higher base.

January 09, 2013 87
Oct-Dec 2013 Earnings Preview
West ‐ Maharashtra better placed; Gujarat disappoints: Average prices in Maharashtra rose Rs10/bag QoQ. Prices in Mumbai and Pune rose by Rs10 and Rs30 QoQ, respectively, while, prices in Nagpur fell by Rs15/bag QoQ. Prices in Gujarat witnessed fall of Rs2/bag QoQ.
Average price up by Rs7/bag in South; prices in AP flat: Prices in the key markets of the region, Tamil Nadu and Karnataka, rose by Rs7 and Rs8/bag respectively. While, price in AP remained flat on account of high base and steep fall in demand. Prices in Kerala were up by Rs10/bag. Demand remained soft across the region due to the dearth of govt spending, shortage of sand (applicable to Tamil Nadu) and a weak housing demand.
Region‐wise prices
230 245 260 275 290 305 320 335 350 365 380
Jul-
12
Aug
-12
Sep-
12
Oct
-12
Nov
-12
Dec
-12
Jan-
13
Feb-
13
Mar
-13
Apr
-13
May
-13
Jun-
13
Jul-
13
Aug
-13
Sep-
13
Oct
-13
Nov
-13
Dec
-13
Rs/50kg bag
North South West Central East
Source: Industry, PL Research
We expect earnings of our coverage universe to fall by 30% YoY for the quarter on account of weak volumes and subdued margins.
We maintain our Negative rating on ACC, ACEM and UTCEM on the back of uninspiring earnings outlook and expensive valuations (EV/EBITDA>9.2x, P/E>16xx FY15E). We continue to like SRCM, backed by strong earnings outlook and attractive valuations (EV/EBITDA 6.5x FY15E).
Stock Performance
1M 3M 6M 12M 1M 3M 6M 12M
ACC (2.9) (4.0) (13.8) (23.6) (1.6) (7.7) (21.1) (28.6)
Ambuja Cement (5.6) (10.2) (9.6) (13.5) (4.3) (14.0) (16.8) (18.5)
Ja iprakash Associates (7.8) 34.3 (2.1) (48.7) (6.5) 30.5 (9.4) (53.7)
Shree Cement 5.1 4.9 (1.0) (0.7) 6.3 1.1 (8.3) (5.7)
Ultratech Cement (9.6) (12.5) (9.9) (15.8) (8.3) (16.3) (17.2) (20.8)
Absolute Relative to Sensex
Source: Bloomberg, PL Research

January 09, 2013 88
Oct-Dec 2013 Earnings Preview
Summary Financials ‐ Quarterly (Rs m)
Q3FY14E Q3FY13 YoY gr. (%) Q2FY14 QoQ gr. (%) 9MFY14E 9MFY13 YoY gr. (%)
Sales 26,805 26,915 (0.4) 25,087 6.8 109,397 111,306 (1.7)
EBITDA 2,706 3,161 (14.4) 2,254 20.0 14,112 19,690 (28.3)
Margins (%) 10.1 11.7 (165)bps 9.0 111 bps 12.9 17.7 (479)bps
PAT 1,747 2,512 (30.5) 1,189 46.9 9,030 13,305 (32.1)
Sales 21,517 23,133 (7.0) 20,049 7.3 90,606 96,749 (6.3)
EBITDA 2,912 4,282 (32.0) 2,554 14.0 15,699 24,495 (35.9)
Margins (%) 13.5 18.5 (498)bps 12.7 80 bps 17.3 25.3 (799)bps
PAT 1,877 2,289 (18.0) 1,178 59.3 90,606 96,749 (6.3)
Sales 32,019 33,984 (5.8) 31,494 1.7 96,346 93,445 3.1
EBITDA 8,325 7,625 9.2 7,637 9.0 23,494 23,249 1.1
Margins (%) 26.0 22.4 356 bps 24.2 175 bps 24.4 24.9 (49)bps
PAT 709 1,109 (36.1) 677 4.8 1,465 3,750 (60.9)
Sales 13,125 14,281 (8.1) 12,475 5.2 25,600 28,562 (10.4)
EBITDA 2,597 3,717 (30.1) 2,494 4.1 5,091 7,435 (31.5)
Margins (%) 19.8 26.0 (624)bps 20.0 (21)bps 19.9 26.0 (614)bps
PAT 1,391 2,258 (38.4) 1,730 (19.6) 3,121 4,516 (30.9)
Sales 48,358 48,574 (0.4) 45,021 7.4 142,955 146,287 (2.3)
EBITDA 8,116 10,243 (20.8) 6,597 23.0 25,204 33,192 (24.1)
Margins (%) 16.8 21.1 (430)bps 14.7 213 bps 17.6 22.7 (506)bps
PAT 4,116 6,008 (31.5) 2,641 55.8 13,483 19,292 (30.1)
ACC
Ambuja Cement
Shree Cement
Ul tratech Cement
Ja iprakash Associates
Source: Company Data, PL Research ACC & Ambuja Cement ‐ Y/e Dec; Shree Cement ‐ Y/e Jun
Consolidated Sectoral Data
Quarterly Table (Rs m)
Oct‐Dec'13 Oct‐Dec'12 YoY gr. (%) Jul‐Sep'13 QoQ gr. (%)
Net Sa les 141,824 146,887 (3.4) 134,126 5.7
EBITDA 24,656 29,028 (15.1) 21,536 14.5
Margin (%) 17.4 19.8 (238)bps 16.1 133 bps
PAT (Excl . Ex Items) 9,841 14,177 (30.6) 7,414 32.7
Note: Revenue, EBITDA and PAT numbers are arrived by totaling corresponding numbers of all companies under our coverage in this
sector.
Key Figures (Rs m)
2013 2014E 2015E
Net Sa les 599,878 626,340 739,708
Growth (%) 2.7 4.4 18.1
EBITDA 123,802 120,774 150,049
Margin (%) 20.6 19.3 20.3
PAT 61,123 52,389 63,842
Growth (%) (11.2) (14.3) 21.9
PE (x) 19.3 22.6 18.5
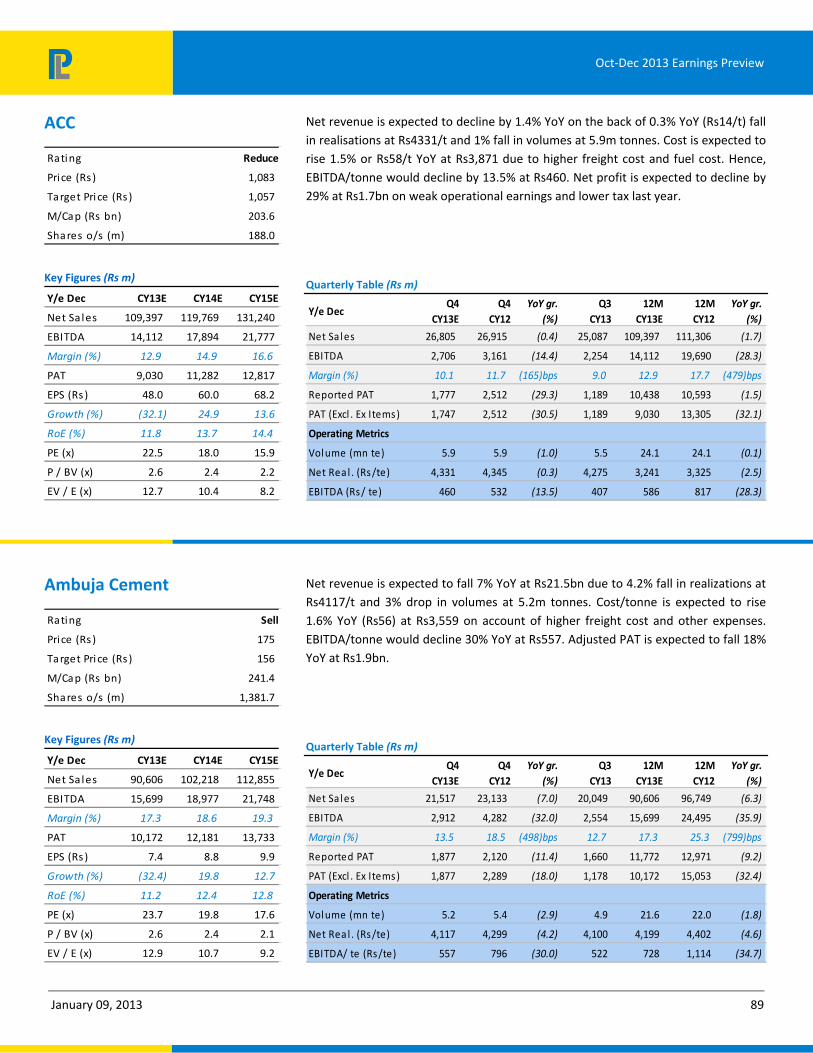
January 09, 2013 89
Oct-Dec 2013 Earnings Preview
Net revenue is expected to decline by 1.4% YoY on the back of 0.3% YoY (Rs14/t) fall in realisations at Rs4331/t and 1% fall in volumes at 5.9m tonnes. Cost is expected to rise 1.5% or Rs58/t YoY at Rs3,871 due to higher freight cost and fuel cost. Hence, EBITDA/tonne would decline by 13.5% at Rs460. Net profit is expected to decline by 29% at Rs1.7bn on weak operational earnings and lower tax last year.
Quarterly Table (Rs m)
Y/e DecQ4
CY13E
Q4
CY12
YoY gr.
(%)
Q3
CY13
12M
CY13E
12M
CY12
YoY gr.
(%)
Net Sa les 26,805 26,915 (0.4) 25,087 109,397 111,306 (1.7)
EBITDA 2,706 3,161 (14.4) 2,254 14,112 19,690 (28.3)
Margin (%) 10.1 11.7 (165)bps 9.0 12.9 17.7 (479)bps
Reported PAT 1,777 2,512 (29.3) 1,189 10,438 10,593 (1.5)
PAT (Excl . Ex Items) 1,747 2,512 (30.5) 1,189 9,030 13,305 (32.1)
Operating Metrics
Volume (mn te) 5.9 5.9 (1.0) 5.5 24.1 24.1 (0.1)
Net Rea l . (Rs/te) 4,331 4,345 (0.3) 4,275 3,241 3,325 (2.5)
EBITDA (Rs/ te) 460 532 (13.5) 407 586 817 (28.3)
Net revenue is expected to fall 7% YoY at Rs21.5bn due to 4.2% fall in realizations at Rs4117/t and 3% drop in volumes at 5.2m tonnes. Cost/tonne is expected to rise 1.6% YoY (Rs56) at Rs3,559 on account of higher freight cost and other expenses. EBITDA/tonne would decline 30% YoY at Rs557. Adjusted PAT is expected to fall 18% YoY at Rs1.9bn.
Quarterly Table (Rs m)
Y/e DecQ4
CY13E
Q4
CY12
YoY gr.
(%)
Q3
CY13
12M
CY13E
12M
CY12
YoY gr.
(%)
Net Sa les 21,517 23,133 (7.0) 20,049 90,606 96,749 (6.3)
EBITDA 2,912 4,282 (32.0) 2,554 15,699 24,495 (35.9)
Margin (%) 13.5 18.5 (498)bps 12.7 17.3 25.3 (799)bps
Reported PAT 1,877 2,120 (11.4) 1,660 11,772 12,971 (9.2)
PAT (Excl . Ex Items) 1,877 2,289 (18.0) 1,178 10,172 15,053 (32.4)
Operating Metrics
Volume (mn te) 5.2 5.4 (2.9) 4.9 21.6 22.0 (1.8)
Net Rea l . (Rs/te) 4,117 4,299 (4.2) 4,100 4,199 4,402 (4.6)
EBITDA/ te (Rs/te) 557 796 (30.0) 522 728 1,114 (34.7)
ACC
Rating Reduce
Price (Rs ) 1,083
Target Pri ce (Rs ) 1,057
M/Cap (Rs bn) 203.6
Shares o/s (m) 188.0
Key Figures (Rs m)
Y/e Dec CY13E CY14E CY15E
Net Sa les 109,397 119,769 131,240
EBITDA 14,112 17,894 21,777
Margin (%) 12.9 14.9 16.6
PAT 9,030 11,282 12,817
EPS (Rs ) 48.0 60.0 68.2
Growth (%) (32.1) 24.9 13.6
RoE (%) 11.8 13.7 14.4
PE (x) 22.5 18.0 15.9
P / BV (x) 2.6 2.4 2.2
EV / E (x) 12.7 10.4 8.2
Ambuja Cement
Rating Sell
Price (Rs ) 175
Target Pri ce (Rs ) 156
M/Cap (Rs bn) 241.4
Shares o/s (m) 1,381.7
Key Figures (Rs m)
Y/e Dec CY13E CY14E CY15E
Net Sa les 90,606 102,218 112,855
EBITDA 15,699 18,977 21,748
Margin (%) 17.3 18.6 19.3
PAT 10,172 12,181 13,733
EPS (Rs ) 7.4 8.8 9.9
Growth (%) (32.4) 19.8 12.7
RoE (%) 11.2 12.4 12.8
PE (x) 23.7 19.8 17.6
P / BV (x) 2.6 2.4 2.1
EV / E (x) 12.9 10.7 9.2

January 09, 2013 90
Oct-Dec 2013 Earnings Preview
We are expecting cement volumes of 3.6mt up 12.5% YoY and realisations of Rs4180/tone up 13.4%. Construction revenues are expected to increase by 1.5% YoY and margins will improve on account of completion of Bina TPP. Overall top line will remain muted on account of lower sales booked in real estate and hotel segments. Higher interest cost is expected to neutralize the gains on EBIDTA front.
Quarterly Table (Rs m)
Y/e MarchQ3
FY14E
Q3
FY13
YoY gr.
(%)
Q2
FY14
9M
FY14E
9M
FY13
YoY gr.
(%)
Net Sa les 32,019 33,984 (5.8) 31,494 96346 93,445 3.1
EBITDA 8,325 7,625 9.2 7,637 23493.54 23,249 1.1
Margin (%) 26.0 22.4 356 bps 24.2 24.4 24.9 (49)bps
Reported PAT 709 1,109 (36.1) 677 4632.232 3,750 23.5
PAT (Excl . Ex Items ) 709 1,109 (36.1) 677 1465.232 3,750 (60.9)
Operating Metrics
Const. (Rs m) 12,947 12,757 1.5 14,528 39,983 37,816 5.7
Cement (Rs m) 15,048 14,747 2.0 13,633 44,074 44,096 (0.0)
Int. as a % to sales 19.8 15.7 413 bps 20.8 19.5 15.6 387 bps
EBIT per Tonne Rs 460 319 44.3 193 370 397 (6.7)
Aided by strong volume growth of 15.8%, the fall in realisations of 9% is expected to be offset resulting in a revenue growth of 5.7%. Power biz is expected to post 57% fall in revenue at Rs1.3bn on account of 48% fall in volumes and 18% fall in realisations. Though Cost/t in cement is expected to fall 0.8% YoY at Rs2,688 owing to lower fuel cost, the steeper fall in realisations is expected to result in lower EBITDA/t in cement by 30% YoY at Rs711. Owing to weak performance in both the businesses; EBITDA would decline by 30% YoY at Rs2.6bn.
Quarterly Table (Rs m)
Y/e JuneQ2
FY14E
Q2
FY13
YoY gr.
(%)
Q1
FY14
H1
FY14E
H1
FY13
YoY gr.
(%)
Net Sa les 13,125 14,281 (8.1) 12,475 25,600 27,245 (6.0)
EBITDA 2,597 3,717 (30.1) 2,494 5,091 7,619 (33.2)
Margin (%) 19.8 26.0 (624)bps 20.0 19.9 28.0 (808)bps
Reported PAT 1,391 2,174 (36.0) 1,722 3,114 4,456 (30.1)
PAT (Excl . Ex Items ) 1,391 2,258 (38.4) 1,730 3,121 4,546 (31.4)
Operating Metrics
Vol . (m te)-Cement 3.5 3.0 15.8 3.3 3.4 3.0 11.5
Vol . (m uni ts )-Power 409 786 (48.0) 417 413 547 (24.5)
Net Rea l . (Rs/te) 3,399 3,723 (8.7) 3,334 3,366 3,769 (10.7)
Cmnt. EBITDA (Rs/te) 713 1,017 (29.9) 670 692 1,095 (36.8)
Cement EBITDA 2,474 3,046 (18.8) 2,185 11,010 12,509 (12.0)
Power EBITDA 123 672 (81.8) 309 1,902 2,494 (23.7)
Jaiprakash Associates
Rating Accumulate
Price (Rs ) 51
Target Pri ce (Rs ) 59
M/Cap (Rs bn) 113.1
Shares o/s (m) 2,219.1
Key Figures (Rs m)
Y/e March FY13 FY14E FY15E
Net Sa les 132,087 132,182 154,988
EBITDA 31,755 31,554 35,544
Margin (%) 24.0 23.9 22.9
PAT 5,013 2,684 3,973
EPS (Rs ) 2.3 1.2 1.8
Growth (%) (53.2) (46.5) 48.0
RoE (%) 3.9 2.0 2.9
PE (x) 22.6 42.1 28.5
P / BV (x) 0.8 0.8 0.8
EV / E (x) 10.4 11.4 9.8
Shree Cement
Rating BUY
Price (Rs ) 4,514
Target Pri ce (Rs ) 4,753
M/Cap (Rs bn) 157.3
Shares o/s (m) 34.8
Key Figures (Rs m)
Y/e June FY13E FY14E FY15E
Net Sa les 56,227 56,857 66,068
EBITDA 15,473 12,912 16,231
Margin (%) 27.5 22.7 24.6
PAT 10,170 5,199 7,502
EPS (Rs ) 291.9 149.2 215.3
Growth (%) 61.2 (48.9) 44.3
RoE (%) 30.9 12.5 15.3
PE (x) 15.5 30.3 21.0
P / BV (x) 4.1 3.5 3.0
EV / E (x) 9.3 11.1 8.3

January 09, 2013 91
Oct-Dec 2013 Earnings Preview
Domestic grey cement realisations are expected to fall by 2% YoY (Rs84/tonne) while, up 1.1% QoQ (Rs47/t) to Rs4,117/t. Blended realisations would fall by 0.3% YoY (+0.9%/Rs42) QoQ at Rs4,752/t. Grey cement volumes are expected to remain flat YoY at 9.8m tonnes. Owing to higher freight and raw material cost, cost/t is expected to rise by 5% YoY or Rs195/tonne at Rs3,954. Hence, EBITDA/t would decline by ~21% YoY at Rs798. PAT is expected to fall 31% YoY at Rs4.1bn.
Quarterly Table (Rs m)
Y/e MarchQ3
FY14E
Q3
FY13
YoY gr.
(%)
Q2
FY14
9M
FY14E
9M
FY13
YoY gr.
(%)
Net Sa les 48,358 48,574 (0.4) 45,021 142954.9 146,287 (2.3)
EBITDA 8,116 10,243 (20.8) 6,597 25204.21 33,192 (24.1)
Margin (%) 16.8 21.1 (430)bps 14.7 17.6 22.7 (506)bps
Reported PAT 4,116 6,008 (31.5) 2,641 13482.77 19,292 (30.1)
PAT (Excl . Ex Items) 4,116 6,008 (31.5) 2,641 13482.77 19,292 (30.1)
Operating Metrics
Grey Cement Vol . (mn te)
Grey Cement Real . (Rs/te)
9.8 9.8 0.0 9.3 29.2
4,117 4,201 (2.0) 4,070
Blended EBITDA/tonne (Rs )
798 1,005 (20.6) 690 1,267 1,648 (23.1)
29.2 (0.2)
(3.5)4,290 4,140
UltraTech Cement
Rating Reduce
Price (Rs ) 1,701
Target Pri ce (Rs ) 1,746
M/Cap (Rs bn) 466.3
Shares o/s (m) 274.2
Key Figures (Rs m)
Y/e March FY13 FY14E FY15E
Net Sa les 211,561 215,314 274,556
EBITDA 46,764 39,437 54,748
Margin (%) 22.1 18.3 19.9
PAT 26,739 21,043 25,817
EPS (Rs ) 97.5 76.7 94.2
Growth (%) 11.7 (21.3) 22.7
RoE (%) 19.1 13.1 14.3
PE (x) 17.4 22.2 18.1
P / BV (x) 3.1 2.7 2.4
EV / E (x) 11.5 13.8 10.6

January 09, 2014 92
Oct-Dec 2013 Earnings Preview
Amnish Aggarwal [email protected] +91-22-6632 2233
Gaurav Jogani [email protected] +91-22-6632 2238
Top picks
ITC
Britannia Industries
Pidilite Inds
Consumer
Q3FY14 PAT to grow by 11.5%, margin growth to remain flat
We expect Q3FY14 sales to increase by 10.3% (10.7% in Q2) for our coverage universe. EBITDA is expected to grow at 12.8% (14.1% in Q2) as margins expand 48bps YoY. Higher tax rate and lower other income will curtail PAT growth to 11.5% YoY (13.4% in Q2). Volume growth is expected to remain muted given poor consumer sentiment and price increases as firm input costs and 14.3% YoY rupee depreciation has added to the cost pressures.
Urban demand sluggish, rural growth disappoints
Consumer Demand: Consumer demand remained Sluggish; while urban demand growth has slowed down from past few quarters, expected acceleration in rural demand post good monsoons has not materialised. Gap between Urban and rural demand growth has narrowed down.
Discretionary spending: Discretionary spending remains impacted due to poor consumer sentiment. Demand for Gold jewellery, watches, white goods etc remained subdued even in festivals and longer marriage season.
Skin Creams: Late onset of winter has impacted the demand for skin care products. Expect subdued sales in 3Q due to high inventory stocking in 2Q.
Oral care: High competitive intensity continues as Colgate, HUVR and P&G offer heavy discounts and advertise aggressively.
Soaps and Detergents: Discounts in premium detergents (Rs135/kg) continue, however discounts in the economy segment (Wheel, Tide Naturals) have been taken off. Toilet Soaps have seen lower discounts/freebies as PFAD prices move up; volume growth has also softened.
Paints, Adhesive demand sustained: Decorative paints, adhesives etc have sustained growth due to strong demand in tier2/3 cities and rural areas.
Input prices firm on rupee depreciation
Impact of Rupee depreciation (14.3%) on crude linked inputs is being fully reflected in 3QFY14. LAB prices have corrected from highs of Rs138/kg but are up 14% YoY. Ti02 prices are up 11.8% YoY. PFAD prices have gone up by 19.4% YoY (down 9.4% YoY in 2Q) and 10.3% sequentially. Copra price are up by 71% YoY and 38.7% QoQ. Agri linked inputs are mixed as prices for Wheat are at a high (up 8.4% YoY, 7.5% QoQ), Sugar prices remain benign and are down 12.4% YoY (2.6% QoQ) and Coffee prices are down 14.0% YoY (up 17% in 1 month).

January 09, 2014 93
Oct-Dec 2013 Earnings Preview
Prefer ITC in large caps and Britannia in midcaps
CNX FMCG’s massive outperformance to Nifty is coming down. Sectoral valuations have corrected from the peak (still trade at 20-40% premium to LTA) amidst slowing growth and rising risk appetite. However beyond the current phase of slowdown in demand and rising competition, we remain positive on long-term demand growth. We believe increased spending ahead of general elections and lagged impact of bumper harvest will support demand growth. However we expect select stocks to sustain time correction in near term. We rate ITC as our top pick in large caps and Britannia and Pidilite amongst mid caps.
LAB Prices have corrected 4% from highs of 138.1, up 14% YoY
79.1
90.186.1
82.1
109.1 113.1114.1
121.1
138.1
132.1
60.0
70.0
80.0
90.0
100.0
110.0
120.0
130.0
140.0
Jun-
09
Sep-
09
Dec
-09
Mar
-10
Jun-
10
Sep-
10
Dec
-10
Mar
-11
Jun-
11
Sep-
11
Dec
-11
Mar
-12
Jun-
12
Sep-
12
Dec
-12
Mar
-13
Jun-
13
Sep-
13
Dec
-13
(Rs/Kg)
Source: Bloomberg, PL Research
Wheat prices trade at a new high (up 8.4% YoY and 7.5% QoQ)
1,700 1,680
1,400
1,540
1,745
1,000
1,100
1,200
1,300
1,400
1,500
1,600
1,700
1,800
Jan-
12Fe
b-12
Mar
-12
Apr
-12
May
-12
Jun-
12Ju
l-12
Aug
-12
Sep-
12O
ct-1
2N
ov-1
2D
ec-1
2Ja
n-13
Feb-
13M
ar-1
3A
pr-1
3M
ay-1
3Ju
n-13
Jul-
13A
ug-1
3Se
p-13
Oct
-13
Nov
-13
Dec
-13
(Rs / Quintal)
Source: Bloomberg, PL Research
Impact of spike in LAB prices will curtail
margin expansion in detergents despite
withdrawal of discounts in economy
segment
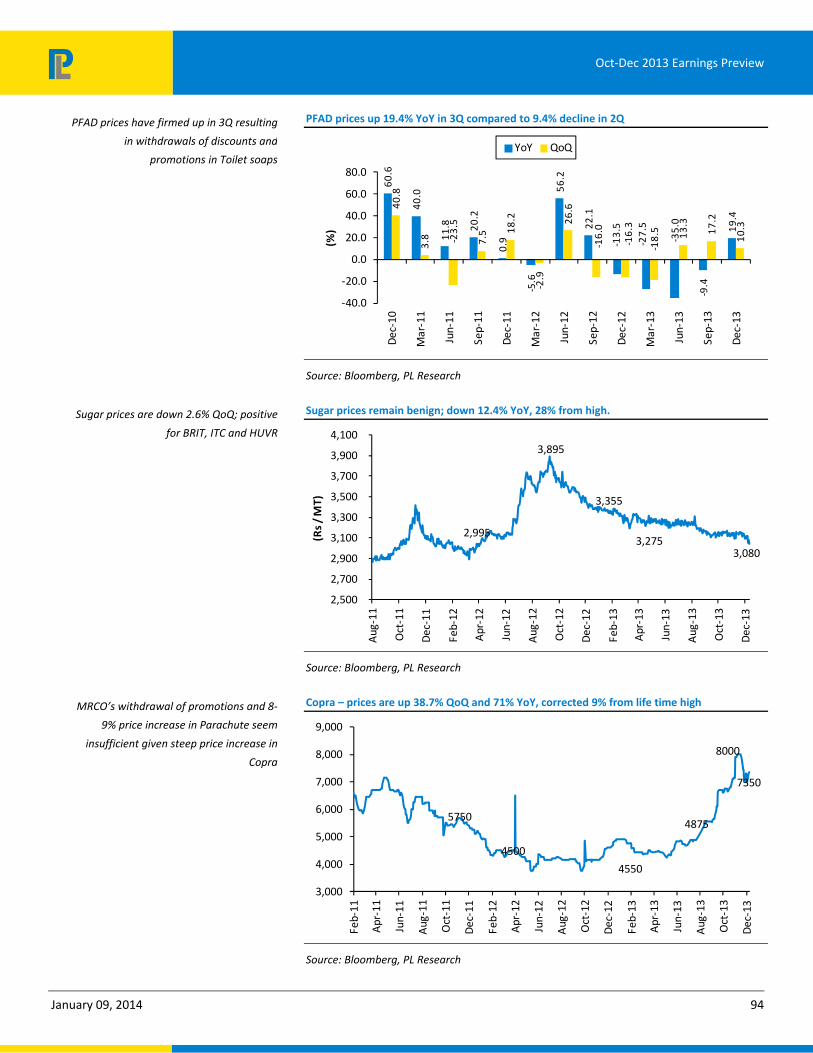
January 09, 2014 94
Oct-Dec 2013 Earnings Preview
PFAD prices up 19.4% YoY in 3Q compared to 9.4% decline in 2Q
60.6
40.0
11.8 20
.2
0.9
-5.6
56.2
22.1
-13.
5
-27.
5
-35.
0
-9.4
19.4
40.8
3.8 -2
3.5
7.5 18
.2
-2.9
26.6
-16.
0
-16.
3
-18.
5 13.3
17.2
10.3
-40.0
-20.0
0.0
20.0
40.0
60.0
80.0
Dec
-10
Mar
-11
Jun-
11
Sep-
11
Dec
-11
Mar
-12
Jun-
12
Sep-
12
Dec
-12
Mar
-13
Jun-
13
Sep-
13
Dec
-13
(%)
YoY QoQ
Source: Bloomberg, PL Research
Sugar prices remain benign; down 12.4% YoY, 28% from high.
2,995
3,895
3,355
3,275 3,080
2,500
2,700
2,900
3,100
3,300
3,500
3,700
3,900
4,100
Aug
-11
Oct
-11
Dec
-11
Feb-
12
Apr
-12
Jun-
12
Aug
-12
Oct
-12
Dec
-12
Feb-
13
Apr
-13
Jun-
13
Aug
-13
Oct
-13
Dec
-13
(Rs / MT)
Source: Bloomberg, PL Research
Copra – prices are up 38.7% QoQ and 71% YoY, corrected 9% from life time high
5750
4500
4550
4875
8000
7350
3,000
4,000
5,000
6,000
7,000
8,000
9,000
Feb-
11
Apr
-11
Jun-
11
Aug
-11
Oct
-11
Dec
-11
Feb-
12
Apr
-12
Jun-
12
Aug
-12
Oct
-12
Dec
-12
Feb-
13
Apr
-13
Jun-
13
Aug
-13
Oct
-13
Dec
-13
Source: Bloomberg, PL Research
PFAD prices have firmed up in 3Q resulting
in withdrawals of discounts and
promotions in Toilet soaps
Sugar prices are down 2.6% QoQ; positive
for BRIT, ITC and HUVR
MRCO’s withdrawal of promotions and 8‐
9% price increase in Parachute seem
insufficient given steep price increase in
Copra

January 09, 2014 95
Oct-Dec 2013 Earnings Preview
Tio2 prices are up 11.4% YoY, 6% QoQ despite 3% correction in Dec
41.5
-12.9
-2.0
11.8
-30.0-20.0-10.0
0.010.020.030.040.050.060.070.0
Oct
-09
Dec-
09Fe
b-10
Apr-
10Ju
n-10
Aug-
10O
ct-1
0De
c-10
Feb-
11Ap
r-11
Jun-
11Au
g-11
Oct
-11
Dec-
11Fe
b-12
Apr-
12Ju
n-12
Aug-
12O
ct-1
2De
c-12
Feb-
13Ap
r-13
Jun-
13Au
g-13
Oct
-13
Dec-
13
TiO2 ‐ YoY Price Change%
Source: Bloomberg, PL Research
Coffee prices remain volatile, bounced 20% from lows
21522067
1765
20001951
1621
1756
1447
1849
1694
1,400
1,500
1,600
1,700
1,800
1,900
2,000
2,100
2,200
Dec
-12
Jan-
13
Feb-
13
Mar
-13
Apr
-13
May
-13
Jun-
13
Jul-
13
Aug
-13
Sep-
13
Oct
-13
Nov
-13
Dec
-13
(FOB US$ / Ton)
Source: Bloomberg, PL Research
Gold prices are down 4.5% QoQ, 2.2% YoY
32460
2569525186
32943
29312
19000
21000
23000
25000
27000
29000
31000
33000
35000
Feb-
11
Apr
-11
Jun-
11
Aug
-11
Oct
-11
Dec
-11
Feb-
12
Apr
-12
Jun-
12
Aug
-12
Oct
-12
Dec
-12
Feb-
13
Apr
-13
Jun-
13
Aug
-13
Oct
-13
Dec
-13
INR/10gm
Source: Company Data, PL Research
Ti02 prices have corrected 3.3% in
December, will APNT hold on to current
pricing and boost volumes
Coffee prices are down 14% YoY and 11%
QoQ despite a relief rally from the lows;
will benefit HUVR and NEST
Gold prices continue to soften despite
longer marriage season and festival
demand as poor consumer sentiment
impacts demand

January 09, 2014 96
Oct-Dec 2013 Earnings Preview
Volume growth unlikely to see revival in 3QFY14, discretionary segments to suffer
Volume growth (%) 3QFY12 4QFY12 1QFY13 2QFY13 3QFY13 4QFY13 1QFY14 2QFY14 3QFY14E
Asian Paints 12.0 18.0 (2.0) 5.0 13.0 2.5 10.5 15.0 11.0
Britannia 7.0 5.5 3.5 2.0 5.5 3.0 6.0 6.0 7.0
Colgate 13.0 12.0 11.0 10.0 8.0 12.0 9.0 10.0 9.5
GSK Consumer 12.0 7.0 7.0 6.0 8.0 8.0 7.0 12.0 8.0
ITC (Cigarettes) 6.0 6.0 1.5 0.5 1.5 2.5 (1.5) (3.7) (2.5)
HUVR 9.1 10.0 9.0 7.0 5.0 6.3 4.0 5.0 4.5
MRCO
Parachute 13.0 11.1 18.0 9.0 6.0 5.0 4.0 1.0 3.0
Saffola 15.0 3.3 12.0 6.0 4.0 5.0 10.0 7.0 8.0
Value added Hair Oil 20.0 17.5 25.0 20.0 30.0 24.0 16.0 15.0 13.0
Retail
Titan (Gold) (5.0) (7.0) (21.0) (11.0) 12.0 9.0 67.0 (4.0) (2.5)
Jubilant (SSS) 30.1 33.2 22.3 19.8 16.1 7.7 6.3 6.6 6.0
Source: Company Data, PL Research
New Product launches indicate rising tilt towards premium segments
Company Name Product Segment Brand Product offerings
Asian Paints Paints Royale Aspira-Royale
Dabur Packaged Milk Drink Real Mango Fruit Shake
Dabur Personal care Fem Facial Bleach (Ammonia free)
Mars Chocolate Galaxy Premium Chocolate
Jubilant Foodworks QSR Fresh Pan Pizza Pan Pizza
Parle Biscuits Parle-G Parle – G Gold
Titan Accessories Fast Track Helmets
Godrej Consumer Home Insecticide Goodnight Fast Card
Emami Skin Care Boroplus Advanced Body Lotion
Source: Company Data, PL Research
Stock Performance
1M 3M 6M 12M 1M 3M 6M 12M
As ian Pa ints (2.8) 6.7 5.0 11.6 (1.6) 3.0 (2.3) 6.6
Bri tannia Industries 4.6 5.1 35.5 81.4 5.8 1.4 28.2 76.4
Colgate Palmol ive 4.8 4.6 (5.3) (13.5) 6.0 0.8 (12.6) (18.5)
GlaxoSmithKl ine Consumer Healthcare (6.4) 1.6 (19.7) 12.2 (5.1) (2.1) (26.9) 7.2
Hindus tan Uni lever (0.1) (8.3) (8.3) 6.4 1.2 (12.0) (15.6) 1.4
ITC 1.9 (8.9) (8.6) 10.9 3.1 (12.6) (15.9) 5.9
Jubi lant FoodWorks (6.1) 7.0 13.4 (2.6) (4.8) 3.2 6.1 (7.6)
Marico 2.9 2.7 5.0 (4.7) 4.2 (1.0) (2.3) (9.7)
Nestle India 7.0 8.2 5.6 10.8 8.3 4.4 (1.6) 5.8
Pidi l i te Indus tries (2.0) 7.1 7.9 24.9 (0.8) 3.4 0.6 19.9
Ti tan Industries (3.6) (7.6) (4.5) (18.2) (2.3) (11.3) (11.8) (23.2)
Absolute Relative to Sensex
Source: Bloomberg, PL Research

January 09, 2014 97
Oct-Dec 2013 Earnings Preview
Summary Financials ‐ Quarterly (Rs m)
Q3FY14E Q3FY13 YoY gr. (%) Q2FY14 QoQ gr. (%) 9MFY14E 9MFY13 YoY gr. (%)
Sales 35,414 30,529 16.0 31,147 13.7 94,971 82,319 15.4
EBITDA 5,843 5,104 14.5 5,108 14.4 15,598 13,388 16.5
Margins (%) 16.5 16.7 (22)bps 16.4 10 bps 16.4 16.3 16 bps
PAT 3,807 3,352 13.6 3,268 16.5 9,828 8,628 13.9
Sales 16,951 14,676 15.5 16,100 5.3 47,214 41,131 14.8
EBITDA 1,526 924 65.1 1,532 (0.4) 4,354 2,392 82.1
Margins (%) 9.0 6.3 270 bps 9.5 (52)bps 9.2 5.8 341 bps
PAT 932 570 63.6 957 (2.6) 2,752 1,460 88.5
Sales 8,516 7,838 8.7 9,007 (5.5) 26,120 23,323 12.0
EBITDA 1,414 1,499 (5.7) 1,463 (3.4) 4,530 4,882 (7.2)
Margins (%) 16.6 19.1 (253)bps 16.2 36 bps 17.3 20.9 (359)bps
PAT 1,011 1,111 (9.0) 1,095 (7.7) 3,403 3,736 (8.9)
Sales 8,546 7,345 16.3 10,141 (15.7) 37,343 32,024 16.6
EBITDA 1,002 764 31.1 1,920 (47.8) 6,545 5,883 11.3
Margins (%) 11.7 10.4 132 bps 18.9 (722)bps 17.5 18.4 (84)bps
PAT 816 696 17.2 1,469 (44.5) 5,049 4,367 15.6
Sales 71,939 66,548 8.1 68,926 4.4 208,956 193,444 8.0
EBITDA 12,014 10,888 10.3 10,853 10.7 33,723 30,320 11.2
Margins (%) 16.7 16.4 34 bps 15.7 95 bps 16.1 15.7 47 bps
PAT 9,496 8,731 8.8 8,830 7.5 27,178 25,335 7.3
Sales 84,447 77,121 9.5 78,625 7.4 237,180 216,449 9.6
EBITDA 32,681 28,578 14.4 30,179 8.3 90,774 79,222 14.6
Margins (%) 38.7 37.1 164 bps 38.4 32 bps 38.3 36.6 167 bps
PAT 23,295 20,519 13.5 20,984 11.0 63,192 54,904 15.1
Sales 4,949 3,851 28.5 4,367 13.3 13,281 10,418 27.5
EBITDA 762 672 13.5 653 16.7 2,082 1,831 13.7
Margins (%) 15.4 17.4 (204)bps 15.0 45 bps 15.7 17.6 (190)bps
PAT 400 377 6.1 332 20.2 1,072 1,024 4.7
Sales 12,222 11,640 5.0 11,184 9.3 36,356 34,992 3.9
EBITDA 1,711 1,620 5.6 1,685 1.5 5,596 4,847 15.4
Margins (%) 14.0 13.9 8 bps 15.1 (107)bps 15.4 13.9 154 bps
PAT 1,151 1,023 12.5 1,059 8.7 3,749 3,101 20.9
Sales 23,829 21,526 10.7 23,600 1.0 92,617 83,345 11.1
EBITDA 5,200 4,957 4.9 5,039 3.2 20,613 18,580 10.9
Margins (%) 21.8 23.0 (120)bps 21.4 47 bps 22.3 22.3 (4)bps
PAT 3,125 2,940 6.3 2,919 7.1 11,981 11,006 8.9
Nestle India
Jubi lant FoodWorks
Marico
ITC
As ian Pa ints
Bri tannia Industries
Colgate Pa lmol ive
GlaxoSmithKl ine Consumer Heal thcare
Hindustan Uni lever
Source: Company Data, PL Research

January 09, 2014 98
Oct-Dec 2013 Earnings Preview
Summary Financials ‐ Quarterly (Rs m)
Q3FY14E Q3FY13 YoY gr. (%) Q2FY14 QoQ gr. (%) 9MFY14E 9MFY13 YoY gr. (%)
Sales 9,841 8,376 17.5 9,912 (0.7) 29,901 25,709 16.3
EBITDA 1,830 1,514 20.9 1,846 (0.8) 5,916 4,888 21.0
Margins (%) 18.6 18.1 53 bps 18.6 (2)bps 19.8 19.0 77 bps
PAT 1,363 1,147 18.9 1,257 8.5 4,166 3,597 15.8
Sales 31,808 30,178 5.4 23,290 36.6 86,174 75,303 14.4
EBITDA 2,958 2,828 4.6 2,617 13.0 8,025 7,750 3.5
Margins (%) 9.3 9.4 (7)bps 11.2 (194)bps 9.3 10.3 (98)bps
PAT 2,011 2,037 (1.3) 1,867 7.8 5,703 5,709 (0.1)
Ti tan Industries
Pidi l i te Industries
Source: Company Data, PL Research
Consolidated Sectoral Data
Quarterly Table (Rs m)
Oct‐Dec'13 Oct‐Dec'12 YoY gr. (%) Jul‐Sep'13 QoQ gr. (%)
Net Sa les 308,461 279,628 10.3 286,299 7.7
EBITDA 66,941 59,347 12.8 62,896 6.4
Margin (%) 21.7 21.2 48 bps 22.0 (27)bps
PAT (Excl . Ex Items) 47,408 42,502 11.5 44,037 7.7
Note: Revenue, EBITDA and PAT numbers are arrived by totaling corresponding numbers of all companies under our coverage in this
sector.
Key Figures (Rs m)
2013 2014E 2015E
Net Sa les 1,064,572 1,211,783 1,406,137
Growth (%) 16.3 13.8 16.0
EBITDA 223,424 259,993 307,789
Margin (%) 21.0 21.5 21.9
PAT 158,134 180,158 216,145
Growth (%) 20.6 13.9 20.0
PE (x) 36.5 32.0 26.7

January 09, 2014 99
Oct-Dec 2013 Earnings Preview
Key Trends: Sustained demand from rural India and small towns should enable double digit volume growth. Stable INR will enable 80bp gross margin expansion even as Ti02 prices are up both YOY and QoQ. Deprecition on Khandala unit will curtail PAT Gr.
Key factors to watch out for: Subsidy finalisation in Khandala unit, Financial performance of Sleek JV and recovery in IBD
Quarterly Table (Rs m)
Y/e MarchQ3
FY14E
Q3
FY13
YoY gr.
(%)
Q2
FY14
9M
FY14E
9M
FY13
YoY gr.
(%)
Net Sa les 35,414 30,529 16.0 31,147 94,971 82,319 15.4
EBITDA 5,843 5,104 14.5 5,108 15,598 13,388 16.5
Margin (%) 16.5 16.7 (22)bps 16.4 16.4 16.3 16 bps
Reported PAT 3,807 3,352 13.6 3,268 9,828 8,628 13.9
PAT (Excl . Ex Items) 3,807 3,352 13.6 3,268 9,828 8,628 13.9
Operating Metrics
Gross Margins % 41.4 40.6 80 bps 43.3 42.6 40.8 180 bps
Tio2 Price 262 242 6.6 255 246.0 269.0 (6.8)
15.0 12.2 5.3 690 bpsDecoratives Volume
Growth %11.0 13.0 (200)bps
Key trends: Mid single digit volume growth, Palmoil and wheat prices up 7.5% and 7.8% QoQ. Sugar prices decline 2.6% QoQ. Low base to enable 270bps EBIDTA margin expanion and 63.6% PAT growth. Key Factors to watch out for: Sustainability of sales growth in slowing demand environment, ad-spends and conversion cost.
Quarterly Table (Rs m)
Y/e MarchQ3
FY14E
Q3
FY13
YoY gr.
(%)
Q2
FY14
9M
FY14E
9M
FY13
YoY gr.
(%)
Net Sa les 16,951 14,676 15.5 16,100 47,214 41,131 14.8
EBITDA 1,526 924 65.1 1,532 4,354 2,392 82.1
Margin (%) 9.0 6.3 270 bps 9.5 9.2 5.8 341 bps
Reported PAT 932 570 63.6 957 2,752 1,460 88.5
PAT (Excl . Ex Items) 932 570 63.6 957 2,752 1,460 88.5
Operating Metrics
Gross Margin % 39.5 37.3 218 bps 40.0 40.1 37.3 280 bps
Asian Paints
Rating Reduce
Price (Rs ) 491
Target Pri ce (Rs ) 482
M/Cap (Rs bn) 470.5
Shares o/s (m) 959.2
Key Figures (Rs m)
Y/e March FY13 FY14E FY15E
Net Sa les 109,707 126,846 148,861
EBITDA 17,319 20,780 24,240
Margin (%) 15.8 16.4 16.3
PAT 11,139 13,012 15,819
EPS (Rs ) 11.6 13.6 16.5
Growth (%) 12.7 16.8 21.6
RoE (%) 36.3 35.0 35.6
PE (x) 42.2 36.2 29.7
P / BV (x) 13.9 11.6 9.7
EV / E (x) 26.8 22.0 18.7
Britannia Industries
Rating BUY
Price (Rs ) 907
Target Pri ce (Rs ) 1,050
M/Cap (Rs bn) 108.4
Shares o/s (m) 119.6
Key Figures (Rs m)
Y/e March FY13 FY14E FY15E
Net Sa les 56,155 64,439 74,361
EBITDA 3,716 5,828 7,045
Margin (%) 6.6 9.0 9.5
PAT 2,339 3,608 4,555
EPS (Rs ) 19.6 30.2 38.1
Growth (%) 25.1 54.3 26.2
RoE (%) 40.2 49.6 49.1
PE (x) 46.4 30.0 23.8
P / BV (x) 16.8 13.4 10.4
EV / E (x) 29.5 18.4 14.9

January 09, 2014 100
Oct-Dec 2013 Earnings Preview
Key trends: High single digit volume growth; sustained competitive and promotional activity post Oral B launch
Key factors to watch out for: Toothpaste market share, Advertising and promotional spend (% of sales) and EBIDTA margins
Quarterly Table (Rs m)
Y/e MarchQ3
FY14E
Q3
FY13
YoY gr.
(%)
Q2
FY14
9M
FY14E
9M
FY13
YoY gr.
(%)
Net Sa les 8,516 7,838 8.7 9,007 26,120 23,323 12.0
EBITDA 1,414 1,499 (5.7) 1,463 4,530 4,882 (7.2)
Margin (%) 16.6 19.1 (253)bps 16.2 17.3 20.9 (359)bps
Reported PAT 1,011 1,111 (9.0) 1,095 3,958 3,736 6.0
PAT (Excl . Ex Items ) 1,011 1,111 (9.0) 1,095 3,403 3,736 (8.9)
Operating Metrics
Volume Growth % 9.5 8.0 150 bps 12.0 10.2 10.0 20 bps
Tax rate % 28.5 26.1 236 bps 25.8 26.1 24.5 160 bps
Gross margin % 60.2 61.2 (92)bps 59.8 60.6 60.2 40 bps
Key Trends: High single digit MFD volume growth (8%), Mid teens sales growth; 25%+ growth in OTC marketing income and interest income Key factors to watch out for: Annual price increase in January 2014, volume growth and capex outlook for CY14.
Quarterly Table (Rs m)
Y/e DecQ4
CY13E
Q4
CY12
YoY gr.
(%)
Q3
CY13
12M
CY13E
12M
CY12
YoY gr.
(%)
Net Sa les 8,546 7,345 16.3 10,141 37,343 32,024 16.6
EBITDA 1,002 764 31.1 1,920 6,545 5,883 11.3
Margin (%) 11.7 10.4 132 bps 18.9 17.5 18.4 (84)bps
Reported PAT 816 696 17.2 1,469 5,049 4,367 15.6
PAT (Excl . Ex Items ) 816 696 17.2 1,469 5,049 4,367 15.6
Colgate Palmolive
Rating Reduce
Price (Rs ) 1,336
Target Pri ce (Rs ) 1,130
M/Cap (Rs bn) 181.7
Shares o/s (m) 136.0
Key Figures (Rs m)
Y/e March FY13 FY14E FY15E
Net Sa les 31,738 35,641 40,656
EBITDA 6,668 6,277 7,397
Margin (%) 21.0 17.6 18.2
PAT 4,968 4,579 5,285
EPS (Rs ) 36.5 33.7 38.9
Growth (%) 11.3 (7.8) 15.4
RoE (%) 107.4 89.2 92.7
PE (x) 36.6 39.7 34.4
P / BV (x) 37.1 33.9 30.1
EV / E (x) 26.5 28.1 23.7
GSK Consumer
Rating Reduce
Price (Rs ) 4,330
Target Pri ce (Rs ) 4,087
M/Cap (Rs bn) 182.1
Shares o/s (m) 42.1
Key Figures (Rs m)
Y/e Dec CY12 CY13E CY14E
Net Sa les 32,024 37,343 43,628
EBITDA 5,883 6,545 7,928
Margin (%) 18.4 17.5 18.2
PAT 4,367 5,049 5,944
EPS (Rs ) 103.8 120.1 141.3
Growth (%) 22.9 15.6 17.7
RoE (%) 34.9 34.0 33.9
PE (x) 41.7 36.1 30.6
P / BV (x) 13.4 11.3 9.6
EV / E (x) 30.9 27.8 22.9

January 09, 2014 101
Oct-Dec 2013 Earnings Preview
Key Trends: Tepid volume growth; ~19% higher PFAD prices; slow offtake of skin care products; sustained competition in premium detergents; anniversary impact of pricing and profit margins in beverages
Key factors to watch out for; Trend in consumer demand, EBIT margins in Soaps and Detergents, personal care sales growth and margins, other income
Quarterly Table (Rs m)
Y/e MarchQ3
FY14E
Q3
FY13
YoY gr.
(%)
Q2
FY14
9M
FY14E
9M
FY13
YoY gr.
(%)
Net Sa les 71,939 66,548 8.1 68,926 208,956 193,444 8.0
EBITDA 12,014 10,888 10.3 10,853 33,723 30,320 11.2
Margin (%) 16.7 16.4 34 bps 15.7 16.1 15.7 47 bps
Reported PAT 9,496 8,714 9.0 9,138 28,827 30,095 (4.2)
PAT (Excl . Ex Items ) 9,496 8,731 8.8 8,830 27,178 25,335 7.3
Operating Metrics
Volume Growth % 4.5 5.0 (50)bps 5.0 4.5 7.0 (250)bps
PFAD Price change % 19.4 (13.5) NA (9.4) (11.5) 19.0 NA
S&D Margins % 13.0 12.4 58 bps 14.0 13.3 13.0 30 bps
Gross Margin % 48.9 48.6 28 bps 49.7 49.1 48.0 110 bps
11.8 (399)bps 25.0 24.1 30.0 Personal care Sales
Gr %9.0 13.0
Key trends: cigaratte volumes decline 2.5% YoY; FMCG EBIT decline of Rs85mn, sales decline in Agri (high base), margin decline in paper and sustained pressure in Hotels
Key factors to watch out for: Volume trend in cigarettes; ARR and occupancy in Hotels, sales growth in FMCG, paper margins trend QoQ and other income
Quarterly Table (Rs m)
Y/e MarchQ3
FY14E
Q3
FY13
YoY gr.
(%)
Q2
FY14
9M
FY14E
9M
FY13
YoY gr.
(%)
Net Sa les 84,447 77,121 9.5 78,625 237,180 216,449 9.6
EBITDA 32,681 28,578 14.4 30,179 90,774 79,222 14.6
Margin (%) 38.7 37.1 164 bps 38.4 38.3 36.6 167 bps
Reported PAT 23,295 20,519 13.5 20,984 63,192 54,904 15.1
PAT (Excl . Ex Items) 23,295 20,519 13.5 20,984 63,192 54,904 15.1
Operating Metrics
Cigarette Vol. Gr. (%) (2.5) 1.5 NA (3.7) (2.6) 1.2 NA
Cigarette EBIT Gr. (%) 18.6 21.1 (247)bps 15.9 17.5 20.6 (310)bps
FMCG EBIT (Rs m) (85) (240) NA (127) (401) (931) NA
Hindustan Unilever
Rating Reduce
Price (Rs ) 559
Target Pri ce (Rs ) 536
M/Cap (Rs bn) 1,209.2
Shares o/s (m) 2,162.5
Key Figures (Rs m)
Y/e March FY13 FY14E FY15E
Net Sa les 258,102 283,034 325,873
EBITDA 40,038 44,844 53,093
Margin (%) 15.5 15.8 16.3
PAT 33,144 35,677 40,651
EPS (Rs ) 15.3 16.5 18.8
Growth (%) 28.8 7.6 13.9
RoE (%) 107.1 113.6 100.1
PE (x) 36.5 33.9 29.7
P / BV (x) 45.2 33.5 26.8
EV / E (x) 29.3 25.9 21.5
ITC
Rating BUY
Price (Rs ) 317
Target Pri ce (Rs ) 367
M/Cap (Rs bn) 2,525.9
Shares o/s (m) 7,971.8
Key Figures (Rs m)
Y/e March FY13 FY14E FY15E
Net Sa les 299,013 345,954 396,276
EBITDA 106,275 125,538 148,208
Margin (%) 35.5 36.3 37.4
PAT 74,184 86,344 105,482
EPS (Rs ) 9.4 10.8 13.1
Growth (%) 19.1 15.4 21.3
RoE (%) 36.1 35.9 38.0
PE (x) 33.7 29.3 24.1
P / BV (x) 11.2 9.8 8.6
EV / E (x) 23.0 19.1 15.9

January 09, 2014 102
Oct-Dec 2013 Earnings Preview
Key trends: sustained pressure on SSS growth (6%); QOQ recovery in gross and EBIDTA margins given 1) 5% price increase and 2) Withdrawal of one on one Wednesday scheme
Key factors to watch out for: SSS growth given price increase and lower discounts, store openings in Dominos and Dunkin Donuts and profit margins
Quarterly Table (Rs m)
Y/e MarchQ3
FY14E
Q3
FY13
YoY gr.
(%)
Q2
FY14
9M
FY14E
9M
FY13
YoY gr.
(%)
Net Sa les 4,949 3,851 28.5 4,367 13,281 10,418 27.5
EBITDA 762 672 13.5 653 2,082 1,831 13.7
Margin (%) 15.4 17.4 (204)bps 15.0 15.7 17.6 (190)bps
Reported PAT 400 377 6.1 332 1,072 1,024 4.7
PAT (Excl . Ex Items) 400 377 6.1 332 1,072 1,024 4.7
Operating Metrics
Gross Margin % 74.0 74.3 (34)bps 73.2 73.7 73.9 (20)bps
Dominos Store Addition
28.0 37.0 87.0 (3.4)
6.6 6.3 19.4 (1,310)bps
(24.3)
(1,010)bps
30.0 84.0
Same Store Sales
growth %6.0 16.1
Key trends: Parachute volumes impacted due to 7-9% price increase, Saffola and hair oil volume growth tepid. High copra prices to impact EBIDTA margins in India and Bangladesh.
Key factors to watch out for: Outlook on parachute volumes; sales growth in Deo’s and IBD (excluding Bangladesh)
Quarterly Table (Rs m)
Y/e MarchQ3
FY14E
Q3
FY13
YoY gr.
(%)
Q2
FY14
9M
FY14E
9M
FY13
YoY gr.
(%)
Net Sa les 12,222 11,640 5.0 11,184 36,356 34,992 3.9
EBITDA 1,711 1,620 5.6 1,685 5,596 4,847 15.4
Margin (%) 14.0 13.9 8 bps 15.1 15.4 13.9 154 bps
Reported PAT 1,151 1,023 12.5 1,059 3,749 3,101 20.9
PAT (Excl . Ex Items ) 1,151 1,023 12.5 1,059 3,749 3,101 20.9
Operating Metrics
Parachute Vol . Gr. (% 3.0 6.0 (300)bps 1.0 3.0 11.0 (800)bps
Saffola Vol . Gr. (%) 8.0 4.0 400 bps 7.0 8.0 7.0 100 bps
Hair Oi l Vol . Gr. (%) 13.0 30.0 (1,700)bps 15.0 15.0 25.0 (1,000)bps
Domestic Vol . Gr. (%) 7.0 9.0 (200)bps 4.0 7.0 14.0 (700)bps
Gross Margin % 48.0 52.0 (400)bps 50.0 49.0 49.8 (80)bps
Jubilant Foodworks
Rating Reduce
Price (Rs ) 1,269
Target Pri ce (Rs ) 1,002
M/Cap (Rs bn) 82.8
Shares o/s (m) 65.3
Key Figures (Rs m)
Y/e March FY13 FY14E FY15E
Net Sa les 14,073 18,220 24,373
EBITDA 2,440 2,902 3,912
Margin (%) 17.3 15.9 16.0
PAT 1,347 1,469 2,024
EPS (Rs ) 20.6 22.5 31.0
Growth (%) 22.4 9.0 37.8
RoE (%) 36.6 29.0 30.3
PE (x) 61.5 56.4 40.9
P / BV (x) 19.0 14.4 10.9
EV / E (x) 33.5 28.1 20.6
Marico
Rating Accumulate
Price (Rs ) 220
Target Pri ce (Rs ) 236
M/Cap (Rs bn) 142.0
Shares o/s (m) 644.6
Key Figures (Rs m)
Y/e March FY13 FY14E FY15E
Net Sa les 45,962 50,687 58,920
EBITDA 6,258 7,846 9,262
Margin (%) 13.6 15.5 15.7
PAT 3,840 5,083 6,032
EPS (Rs ) 6.0 7.9 9.4
Growth (%) 14.9 32.3 18.7
RoE (%) 24.6 23.4 23.2
PE (x) 37.0 27.9 23.5
P / BV (x) 7.2 6.0 5.0
EV / E (x) 23.5 18.7 15.7

January 09, 2014 103
Oct-Dec 2013 Earnings Preview
Key trends: Sales growth to remain in line with the historical trend since past few quarters in the absence of any new blockbuster product. Margin may decline due to firm Wheat and Milk prices.
Key factors to watch out for: Sales growth trend and sustenance of gross margins
Quarterly Table (Rs m)
Y/e DecQ4
CY13E
Q4
CY12
YoY gr.
(%)
Q3
CY13
12M
CY13E
12M
CY12
YoY gr.
(%)
Net Sa les 23,829 21,526 10.7 23,600 92,617 83,345 11.1
EBITDA 5,200 4,957 4.9 5,039 20,613 18,580 10.9
Margin (%) 21.8 23.0 (120)bps 21.4 22.3 22.3 (4)bps
Reported PAT 3,125 2,789 12.0 2,850 11,622 10,679 8.8
PAT (Excl . Ex Items ) 3,125 2,940 6.3 2,919 11,981 11,006 8.9
Key trends: Strong growth in teir2/3 cities, margin expansion led by sales mix and stable VAM prices
Key factors to watch out for: Recovery in construction chemicals, Sales growth and margins in Industrial chemicals and North America business, progress on synthetic elastomer project.
Quarterly Table (Rs m)
Y/e MarchQ3
FY14E
Q3
FY13
YoY gr.
(%)
Q2
FY14
9M
FY14E
9M
FY13
YoY gr.
(%)
Net Sa les 9,841 8,376 17.5 9,912 29,901 25,709 16.3
EBITDA 1,830 1,514 20.9 1,846 5,916 4,888 21.0
Margin (%) 18.6 18.1 53 bps 18.6 19.8 19.0 77 bps
Reported PAT 1,363 1,242 9.8 1,196 4,182 3,625 15.4
PAT (Excl . Ex Items ) 1,363 1,147 18.9 1,257 4,166 3,597 15.8
Operating Metrics
Gross Margin % 44.8 45.0 (26)bps 44.6 45.2 44.9 30 bps
Volume Growth% 12.5 16.0 (350)bps 15.0 12.0 13.0 (100)bps
Nestle India
Rating Accumulate
Price (Rs ) 5,422
Target Pri ce (Rs ) 4,683
M/Cap (Rs bn) 522.8
Shares o/s (m) 96.4
Key Figures (Rs m)
Y/e Dec CY12 CY13E CY14E
Net Sa les 83,345 92,617 106,284
EBITDA 18,580 20,613 23,536
Margin (%) 22.3 22.3 22.1
PAT 11,006 11,981 14,110
EPS (Rs ) 114.1 124.3 146.3
Growth (%) 8.0 8.9 17.8
RoE (%) 71.6 58.0 53.8
PE (x) 47.5 43.6 37.1
P / BV (x) 29.1 22.4 17.9
EV / E (x) 28.6 25.8 22.6
Pidilite Industries
Rating Accumulate
Price (Rs ) 286
Target Pri ce (Rs ) 328
M/Cap (Rs bn) 146.6
Shares o/s (m) 512.6
Key Figures (Rs m)
Y/e March FY13 FY14E FY15E
Net Sa les 33,317 38,517 45,177
EBITDA 6,131 7,362 8,921
Margin (%) 18.4 19.1 19.7
PAT 4,548 5,456 6,721
EPS (Rs ) 8.9 10.6 13.1
Growth (%) 29.8 20.0 23.2
RoE (%) 29.3 28.6 29.4
PE (x) 32.2 26.9 21.8
P / BV (x) 8.5 7.0 5.9
EV / E (x) 23.3 19.1 15.4

January 09, 2014 104
Oct-Dec 2013 Earnings Preview
Key Trends: Sustained pressure on demand in both watches and jewellery; eyewear sustains high teens sales growth
Key factors to watch out for: Volume growth and margins in Jewellery, EBIT margins in watches, debt levels given own funding of gold purchasde, finalisation of hedging and imports under 80:20 scheme.
Quarterly Table (Rs m)
Y/e MarchQ3
FY14E
Q3
FY13
YoY gr.
(%)
Q2
FY14
9M
FY14E
9M
FY13
YoY gr.
(%)
Net Sa les 31,808 30,178 5.4 23,290 86,174 75,303 14.4
EBITDA 2,958 2,828 4.6 2,617 8,025 7,750 3.5
Margin (%) 9.3 9.4 (7)bps 11.2 9.3 10.3 (98)bps
Reported PAT 2,011 2,037 (1.3) 1,867 5,703 5,709 (0.1)
PAT (Excl . Ex Items ) 2,011 2,037 (1.3) 1,867 5,703 5,709 (0.1)
Operating Metrics
Watch s a les Growth 5.0 10.6 (555)bps (6.2) 10.1 12.6 NA
Watch EBIT Growth % (6.1) 6.5 NA (15.1) (13.0) (2.0) NA
Watch Margins 10.8 12.1 NA 10.5 10.5 12.5 NA
Jewelry Sa les Growth 5.0 26.7 (2,166)bps 4.3 18.8 13.4 540 bps
Jewel lery EBIT Growt 5.0 29.5 (2,451)bps 12.0 15.0 25.0 (1,000)bps
Jewelry Margins 9.8 9.8 (0)bps 13.4 10.7 10.8 (10)bps
Gold Price Change % (2.1) 12.2 NA (4.1) (4.1) 20.7 NA
Titan Industries
Rating Reduce
Price (Rs ) 223
Target Pri ce (Rs ) 238
M/Cap (Rs bn) 197.8
Shares o/s (m) 887.8
Key Figures (Rs m)
Y/e March FY13 FY14E FY15E
Net Sa les 101,136 118,485 141,727
EBITDA 10,115 11,459 14,248
Margin (%) 10.0 9.7 10.1
PAT 7,252 7,899 9,522
EPS (Rs ) 8.2 8.9 10.7
Growth (%) 20.7 8.9 20.5
RoE (%) 42.5 35.3 33.5
PE (x) 27.3 25.0 20.8
P / BV (x) 10.1 7.9 6.2
EV / E (x) 18.3 17.4 13.8

January 09, 2014 105
Oct-Dec 2013 Earnings Preview
Shashi Bhusan [email protected] +91-22-6632 2300
Rupa Shah [email protected] +91-22-6632 244
Hussain Kagzi [email protected] +91-22-6632 2242
Top picks
Infosys
Wipro
Tech Mahindra
MindTree
NIIT Techenologies
Persistent Systems
Information Technology
The demand environment for Indian IT Services companies continues to see improvement. The improvement is not only marked in the sales cycle but also the deal pipeline. We expect improved commentaries on overall demand environment. The results from tech majors like Oracle, Accenture and Red Hat has indicated improvement in the overall demand environment, with the guidance indicating stronger recovery in the US and signs of life in Europe. The pricing environment is stable.
Infosys – FY14 guidance of 9‐10% US$ term revenue growth likely to be revised by
1 percentage point: The commentary from Infosys’ management is likely to be increasingly optimistic from cautiously optimistic on overall demand environment. We expect the management to revise its FY14 US$ revenue growth guidance of 9-10% growth to 10-11% YoY. We expect TCV of deals signed in the quarter to exceed $450mn TCV deals signed in the previous quarter. Moreover, our interaction indicates improvement in deal pipeline for Infosys. We expect commentary on recent churn in the senior management.
Currency–Cross currency positive impact by 20‐80bps, some translation loss along
with OCI losses hitting P&L: Euro/GBP/AUD appreciated against US$ by 2.2%/3.9%/1.3% and is likely to have a positive impact of ~20-80bps in US$ terms on revenue. Rupee was largely flattish in the quarter against US$, but depreciated against EUR and GBP; hence, it will have a positive impact on the operating margin. Moreover, the quarter end rate for JAS-13 quarter was Rs62.62/$ against OND-13 quarter end rate of Rs61.80/$ will have headwinds at the bottom-line due to revaluation of financial assets. Few companies have thick hedges at Rs52-57/$; hence, will have some losses due to rupee depreciation.
What to look for? 1) Commentary on early signs of IT budgets 2) Pricing pressure v/s pricing discipline 3) Key verticals/Geography growth/de-growth expectation 4) Discretionary/Non-Discretionary spending 5) Any delay in project ramp-ups 6) Demand environment US/Europe/Continental Europe.
Tier‐1 IT companies – Performance likely to be 1‐3% growth in constant currency: We expect Tier-1 companies to deliver their 1-3% growth in the constant currency, with little softness in realization, moreover, we expect mid and Tier-2 Indian IT companies also to report 1-3% growth in constant currency.
Infosys, Wipro, Tech Mahindra, MindTree, NIIT Tech, and Persistent – our top pick
in the sector: We expect Infosys likely to revise guidance upward. Wipro is likely to show another improvement on QoQ performance. Moreover, we expect Wipro to guide for 1.5-3.5% QoQ growth in Q4FY14. MindTree is our preferred pick in Tier-2 as we expect momentum to get stronger in CY14 with improvement in margins. We expect Persistent to deliver the strongest growth among mid-cap peers. NIIT Tech commentary is likely to indicate improvement in growth momentum in CY14.
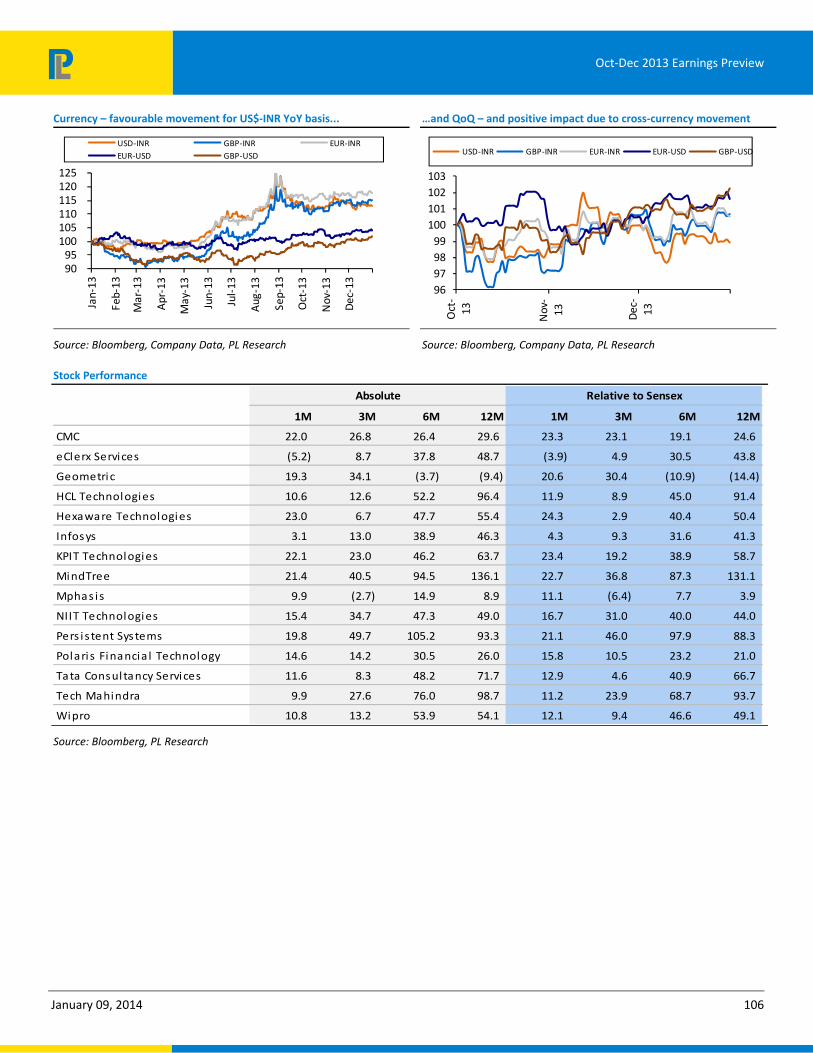
January 09, 2014 106
Oct-Dec 2013 Earnings Preview
Currency – favourable movement for US$‐INR YoY basis...
90 95
100 105 110 115 120 125
Jan-
13
Feb-
13
Mar
-13
Apr
-13
May
-13
Jun-
13
Jul-
13
Aug
-13
Sep-
13
Oct
-13
Nov
-13
Dec
-13
USD-INR GBP-INR EUR-INREUR-USD GBP-USD
Source: Bloomberg, Company Data, PL Research
…and QoQ – and positive impact due to cross‐currency movement
96979899
100101102103
Oct
-13
Nov
-13 Dec
-13
USD-INR GBP-INR EUR-INR EUR-USD GBP-USD
Source: Bloomberg, Company Data, PL Research
Stock Performance
1M 3M 6M 12M 1M 3M 6M 12M
CMC 22.0 26.8 26.4 29.6 23.3 23.1 19.1 24.6
eClerx Services (5.2) 8.7 37.8 48.7 (3.9) 4.9 30.5 43.8
Geometric 19.3 34.1 (3.7) (9.4) 20.6 30.4 (10.9) (14.4)
HCL Technologies 10.6 12.6 52.2 96.4 11.9 8.9 45.0 91.4
Hexaware Technologies 23.0 6.7 47.7 55.4 24.3 2.9 40.4 50.4
Infosys 3.1 13.0 38.9 46.3 4.3 9.3 31.6 41.3
KPIT Technologies 22.1 23.0 46.2 63.7 23.4 19.2 38.9 58.7
MindTree 21.4 40.5 94.5 136.1 22.7 36.8 87.3 131.1
Mphas is 9.9 (2.7) 14.9 8.9 11.1 (6.4) 7.7 3.9
NIIT Technologies 15.4 34.7 47.3 49.0 16.7 31.0 40.0 44.0
Pers i s tent Systems 19.8 49.7 105.2 93.3 21.1 46.0 97.9 88.3
Polari s Financia l Technology 14.6 14.2 30.5 26.0 15.8 10.5 23.2 21.0
Tata Consul tancy Services 11.6 8.3 48.2 71.7 12.9 4.6 40.9 66.7
Tech Mahindra 9.9 27.6 76.0 98.7 11.2 23.9 68.7 93.7
Wipro 10.8 13.2 53.9 54.1 12.1 9.4 46.6 49.1
Absolute Relative to Sensex
Source: Bloomberg, PL Research

January 09, 2014 107
Oct-Dec 2013 Earnings Preview
Summary Financials ‐ Quarterly (Rs m)
Q3FY14E Q2FY14 QoQ gr. (%) Q3FY13 YoY gr. (%) 9MFY14E 9MFY13 YoY gr. (%)
Sales 5,767 5,608 2.9 4,930 17.0 16,241 14,039 15.7
EBITDA 934 884 5.7 832 12.3 2,589 2,350 10.2
Margins (%) 16.2 15.8 43 bps 16.9 (67)bps 15.9 16.7 (80)bps
PAT 711 673 5.6 611 16.4 1,915 1,689 13.4
Sales 2,188 2,146 2.0 1,708 28.1 6,233 4,862 28.2
EBITDA 941 928 1.4 668 40.8 2,659 1,881 41.4
Margins (%) 43.0 43.2 (24)bps 39.1 387 bps 42.7 38.7 397 bps
PAT 664 672 (1.2) 490 35.6 1,953 1,234 58.2
Sales 2,911 2,865 1.6 2,508 16.0 8,379 7,732 8.4
EBITDA 611 627 (2.6) 527 16.0 1,708 1,617 5.6
Margins (%) 21.0 21.9 (89)bps 21.0 (0)bps 20.4 20.9 (53)bps
PAT 240 166 44.8 191 25.7 560 576 (2.9)
Sales 81,989 79,610 3.0 62,738 30.7 161,599 123,648 30.7
EBITDA 20,579 20,930 (1.7) 14,166 45.3 41,509 27,676 50.0
Margins (%) 25.1 26.3 (119)bps 22.6 252 bps 25.7 22.4 330 bps
PAT 14,531 14,160 2.6 9,646 50.6 28,691 18,493 55.1
Sales 6,341 6,211 2.1 5,023 26.2 22,994 19,482 18.0
EBITDA 1,479 1,478 0.1 847 74.6 5,209 4,074 27.8
Margins (%) 23.3 23.8 (47)bps 16.9 646 bps 22.7 20.9 174 bps
PAT 1,041 988 5.4 662 57.2 3,800 3,276 16.0
Sales 131,682 129,650 1.6 104,240 26.3 374,002 298,980 25.1
EBITDA 34,896 31,700 10.1 29,700 17.5 96,426 87,880 9.7
Margins (%) 26.5 24.5 205 bps 28.5 (199)bps 25.8 29.4 (361)bps
PAT 26,466 24,070 10.0 23,690 11.7 74,276 70,270 5.7
Sales 7,223 7,028 2.8 5,633 28.2 20,383 16,688 22.1
EBITDA 1,141 1,081 5.6 879 29.8 3,188 2,629 21.3
Margins (%) 15.8 15.4 42 bps 15.6 19 bps 15.6 15.8 (11)bps
PAT 676 667 1.3 504 34.0 1,945 1,478 31.5
Sales 7,908 7,696 2.8 5,901 34.0 22,081 17,494 26.2
EBITDA 1,550 1,598 (3.0) 1,204 28.7 4,339 3,697 17.4
Margins (%) 19.6 20.8 (116)bps 20.4 (80)bps 19.7 21.1 (148)bps
PAT 858 1,287 (33.4) 988 (13.2) 3,499 2,602 34.5
Sales 16,243 16,407 (1.0) 12,804 26.9 65,972 59,040 11.7
EBITDA 3,289 3,257 1.0 2,539 29.5 12,853 11,390 12.8
Margins (%) 20.3 19.9 40 bps 19.8 42 bps 19.5 19.3 19 bps
PAT 1,978 1,902 4.0 1,844 7.3 8,404 7,437 13.0
Sales 5,990 5,873 2.0 5,144 16.5 17,282 14,841 16.5
EBITDA 923 886 4.1 813 13.5 2,591 2,412 7.4
Margins (%) 15.4 15.1 31 bps 15.8 (40)bps 15.0 16.3 (126)bps
PAT 595 624 (4.6) 561 6.1 1,751 1,568 11.7
Infosys
CMC
eClerx Services
Geometric
HCL Technologies
Hexaware Technologies
KPIT Technologies
MindTree
Mphas is
NIIT Technologies
Source: Company Data, PL Research

January 09, 2014 108
Oct-Dec 2013 Earnings Preview
Summary Financials ‐ Quarterly (Rs m)
Q3FY14E Q2FY14 QoQ gr. (%) Q3FY13 YoY gr. (%) 9MFY14E 9MFY13 YoY gr. (%)
Sales 4,418 4,324 2.2 3,330 32.7 12,315 9,606 28.2
EBITDA 1,122 1,122 0.0 824 36.2 3,021 2,521 19.8
Margins (%) 25.4 26.0 (55)bps 24.7 65 bps 24.5 26.2 (171)bps
PAT 592 608 (2.6) 495 19.6 1,771 1,357 30.5
Sales 6,567 6,434 2.1 5,729 14.6 18,839 17,536 7.4
EBITDA 1,215 1,240 (2.1) 942 29.0 3,466 3,313 4.6
Margins (%) 18.5 19.3 (78)bps 16.4 206 bps 18.4 18.9 (49)bps
PAT 585 598 (2.2) 407 43.8 1,615 1,567 3.1
Sales 214,826 209,772 2.4 160,699 33.7 604,469 465,594 29.8
EBITDA 68,744 66,390 3.5 46,540 47.7 186,667 134,272 39.0
Margins (%) 32.0 31.6 35 bps 29.0 304 bps 30.9 28.8 204 bps
PAT 52,842 51,441 2.7 35,655 48.2 142,945 104,190 37.2
Sales 48,563 47,715 1.8 36,683 32.4 137,310 105,647 30.0
EBITDA 11,024 11,110 (0.8) 7,957 38.5 30,779 22,918 34.3
Margins (%) 22.7 23.3 (58)bps 21.7 101 bps 22.4 21.7 72 bps
PAT 7,317 7,191 1.7 9,313 (21.4) 21,631 19,386 11.6
Sales 114,044 110,053 3.6 109,487 4.2 321,626 292,517 10.0
EBITDA 26,287 25,170 4.4 21,422 22.7 71,844 59,910 19.9
Margins (%) 23.1 22.9 18 bps 19.6 348 bps 22.3 20.5 186 bps
PAT 21,107 21,647 (2.5) 17,164 23.0 59,222 46,856 26.4
Polaris Financia l Technology
Tata Consultancy Services
Tech Mahindra
Wipro
Pers is tent Sys tems
Source: Company Data, PL Research
Consolidated Sectoral Data
Quarterly Table (Rs m)
Oct‐Dec'13 Jul‐Sep'13 QoQ gr. (%) Oct‐Dec'12 YoY gr. (%)
Net Sa les 656,661 641,391 2.4 526,557 24.7
EBITDA 174,736 168,401 3.8 129,860 34.6
Margin (%) 26.6 26.3 35 bps 24.7 195 bps
PAT (Excl . Ex Items) 130,202 126,693 2.8 102,220 27.4
Note: Revenue, EBITDA and PAT numbers are arrived by totaling corresponding numbers of all companies under our coverage in this
sector.
Key Figures (Rs m)
2013 2014E 2015E
Net Sa les 2,024,560 2,557,374 2,954,665
Growth (%) 22.7 26.3 15.5
EBITDA 507,468 663,781 771,688
Margin (%) 25.1 26.0 26.1
PAT 388,119 500,112 580,247
Growth (%) 25.4 28.9 16.0
PE (x) 24.1 18.7 16.1

January 09, 2014 109
Oct-Dec 2013 Earnings Preview
We expect revenue growth (in US$ terms) of 3% QoQ. Subcontracting expense is likely to come down after an increase in the previous quarter, we expect margin to track better in Q3FY14. Despite some asset translation loss, we expect PAT to grow by 5.6% QoQ. We expect management guidance on the onset of offshoring, since onsite has gone up in the previous quarter pushing the margin down due to ramp-ups.
Quarterly Table (Rs m)
Y/e MarchQ3
FY14E
Q2
FY14
QoQ gr.
(%)
Q3
FY13
9M
FY14E
9M
FY13
YoY gr.
(%)
Net Sa les 5,767 5,608 2.9 4,930 16,241 14,039 15.7
EBITDA 934 884 5.7 832 2,589 2,350 10.2
Margin (%) 16.2 15.8 43 bps 16.9 15.9 16.7 (80)bps
Reported PAT 711 673 5.6 611 1,915 1,689 13.4
PAT (Excl . Ex Items) 711 673 5.6 611 1,915 1,689 13.4
Operating Metrics
Revenue (US$ mn) 92.7 90.0 3.0 90.1 268.4 256.3 4.7
Rs/US$ 62.2 62.3 (0.1) 54.7 60.4 54.8 10.4
Gros s Margin 35.0 32.3 267 bps 32.7 34.3 34.7 (44)bps
40.3 39.8 37.3 255 bpsSubcontracting Cost (as % of Revenue)
39.0 42.5 (352)bps
We expect a volume growth of 3% QoQ for Q3FY14, resulting in US$ term growth of 3% QoQ. However, we expect realizations to remain flattish QoQ. We anticipate margin erosion due to lower working days. Forex loss and revaluation of financial asset would result in a PAT de-growth of 1.2% QoQ.
Quarterly Table (Rs m)
Y/e MarchQ3
FY14E
Q2
FY14
QoQ gr.
(%)
Q3
FY13
9M
FY14E
9M
FY13
YoY gr.
(%)
Net Sa les 2,188 2,146 2.0 1,708 6,233 4,862 28.2
EBITDA 941 928 1.4 668 2,659 1,881 41.4
Margin (%) 43.0 43.2 (24)bps 39.1 42.7 38.7 397 bps
Reported PAT 664 672 (1.2) 490 1,953 1,234 58.2
PAT (Excl . Ex Items) 664 672 (1.2) 490 1,953 1,234 58.2
Operating Metrics
Volume (persons month) 12,286 11,928 3.0 11,669 35,607 33,915 5.0
Uti l i zation (%) 65.0 65.0 0 bps 69.0 65.3 68.3 (300)bps
Re/$ Rate 62.3 62.9 (1.0) 54.6 60.9 54.5 11.8
Per. Exp. (as % of s a les ) 44.5 42.2 234 bps 45.0 43.6 44.5 (90)bps
Revenue (US$ m) 35.1 34.1 3.0 31.3 102.2 89.2 14.6
CMC
Rating Accumulate
Price (Rs ) 1,657
Target Pri ce (Rs ) 1,710
M/Cap (Rs bn) 50.2
Shares o/s (m) 30.3
Key Figures (Rs m)
Y/e March FY13 FY14E FY15E
Net Sa les 19,279 22,296 26,181
EBITDA 3,168 3,625 4,573
Margin (%) 16.4 16.3 17.5
PAT 2,302 2,750 3,449
EPS (Rs ) 76.0 90.8 113.8
Growth (%) 51.7 19.5 25.4
RoE (%) 26.8 26.0 26.2
PE (x) 21.8 18.3 14.6
P / BV (x) 5.3 4.3 3.4
EV / E (x) 15.5 13.7 10.8
eClerx Services
Rating Reduce
Price (Rs ) 1,029
Target Pri ce (Rs ) 1,050
M/Cap (Rs bn) 29.9
Shares o/s (m) 29.1
Key Figures (Rs m)
Y/e March FY13 FY14E FY15E
Net Sa les 6,605 8,489 9,858
EBITDA 2,568 3,620 4,144
Margin (%) 38.9 42.6 42.0
PAT 1,716 2,638 3,100
EPS (Rs ) 59.1 90.8 106.7
Growth (%) 7.4 53.7 17.5
RoE (%) 44.5 52.0 45.3
PE (x) 17.4 11.3 9.6
P / BV (x) 7.0 5.1 3.8
EV / E (x) 10.7 7.2 5.8

January 09, 2014 110
Oct-Dec 2013 Earnings Preview
Geometric’s volumes and pricing (put together for Q3FY14) are expected to report a growth of 1% QoQ. The company will witness growth in the quarter after pressure on the top-line due to rampdown from one client in H1FY14. We expect EBITDA margin to contract by 129bps due to currency appreciation. Moreover, bottom-line would grow by 44% due to lower forex loss and asset translation gain.
Quarterly Table (Rs m)
Y/e MarchQ3
FY14E
Q2
FY14
QoQ gr.
(%)
Q3
FY13
9M
FY14E
9M
FY13
YoY gr.
(%)
Net Sa les 2,911 2,865 1.6 2,508 8,379 7,732 8.4
EBITDA 611 627 (2.6) 527 1,708 1,617 5.6
Margin (%) 21.0 21.9 (89)bps 21.0 20.4 20.9 (53)bps
Reported PAT 240 166 44.8 191 560 576 (2.9)
PAT (Excl . Ex Items) 240 166 44.8 191 560 576 (2.9)
Operating Metrics
Volume (persons month) 3,568 3,533 1.0 3,650 10,734 11,231 (4.4)
Uti l z (excl . Tra inees) 87.0 86.9 10 bps 88.8 87.2 88.8 (157)bps
Revenue (US$ m) 46.7 46.3 1.0 46.3 139.4 141.8 (1.7)
SW Devp. (% of sa les ) 59.0 58.8 22 bps 61.4 60.3 61.2 (98)bps
S&M (% of Sa les ) 20.0 19.3 67 bps 17.6 19.4 17.8 159 bps
We expect HCL to report 3% QoQ volume growth for Q2FY14, pricing to be muted with no decline, and the margins to contract by 119bps due to wage hike. Our expectations also include positive management commentary on demand environment, strong growth and margin outlook for CY14, and on large project ramp-ups and clients’ IT budget.
Quarterly Table (Rs m)
Y/e JuneQ2
FY14E
Q1
FY14
QoQ gr.
(%)
Q2
FY13
H1
FY14E
H1
FY13
YoY gr.
(%)
Net Sa les 81,989 79,610 3.0 62,738 161,599 123,648 30.7
EBITDA 20,579 20,930 (1.7) 14,166 41,509 27,676 50.0
Margin (%) 25.1 26.3 (119)bps 22.6 25.7 22.4 330 bps
Reported PAT 14,531 14,160 2.6 9,646 28,691 18,493 55.1
PAT (Excl . Ex Items) 14,531 14,160 2.6 9,646 28,691 18,493 55.1
Operating Metrics
Volume (persons month) 135,263 131,323 3.0 124,613 266,585 248,683 7.2
Pricing (US$ / Hr) 35.3 35.3 0.0 35.4 35.3 35.3 0.1
Revenue (US$ m) 1,316 1,270 3.6 1,154 2,586 2,268 14.0
SW. Devp. (% of s a les ) 61.8 61.0 78 bps 64.2 61.4 64.5 (307)bps
SG&A (% of sa les ) 13.1 12.7 41 bps 13.2 12.9 13.1 (25)bps
Geometric
Rating Accumulate
Price (Rs ) 101
Target Price (Rs ) 130
M/Cap (Rs bn) 6.4
Shares o/s (m) 63.0
Key Figures (Rs m)
Y/e March FY13 FY14E FY15E
Net Sa les 10,204 11,328 12,623
EBITDA 1,951 2,330 2,564
Margin (%) 19.1 20.6 20.3
PAT 687 809 1,056
EPS (Rs ) 10.9 12.8 16.8
Growth (%) 15.5 17.7 30.6
RoE (%) 30.6 27.0 24.6
PE (x) 9.3 7.9 6.0
P / BV (x) 2.4 1.9 1.5
EV / E (x) 3.1 2.7 2.1
HCL Technologies
Rating Accumulate
Price (Rs ) 1,246
Target Pri ce (Rs ) 1,500
M/Cap (Rs bn) 864.1
Shares o/s (m) 693.3
Key Figures (Rs m)
Y/e June FY13 FY14E FY15E
Net Sa les 257,336 333,685 379,707
EBITDA 58,356 83,355 91,880
Margin (%) 22.7 25.0 24.2
PAT 40,984 60,838 67,837
EPS (Rs ) 59.1 87.8 97.8
Growth (%) 62.2 48.4 11.5
RoE (%) 32.8 36.2 30.6
PE (x) 21.1 14.2 12.7
P / BV (x) 6.0 4.5 3.4
EV / E (x) 14.8 9.9 8.6

January 09, 2014 111
Oct-Dec 2013 Earnings Preview
We expect volume growth of 2.8% QoQ with marginal dip in realizations QoQ. However, cross-currency would impact dollar revenue negatively by 0.4%. We expect margins to erode by 79bps due to currency appreciation. We expect PAT growth of 3.7% QoQ due to lower forex loss. We expect update on the new strategy from Baring Team.
Quarterly Table (Rs m)
Y/e DecQ4
CY13E
Q3
CY13
QoQ gr.
(%)
Q4
CY12
12M
CY13E
12M
CY12
YoY gr.
(%)
Net Sa les 6,341 6,211 2.1 5,023 22,994 19,482 18.0
EBITDA 1,479 1,478 0.1 847 5,209 4,074 27.8
Margin (%) 23.3 23.8 (47)bps 16.9 22.7 20.9 174 bps
Reported PAT 1,041 988 5.4 662 3,800 3,276 16.0
PAT (Excl . Ex Items) 1,041 988 5.4 662 3,800 3,276 16.0
Operating Metrics
Volume (persons month) 8,455 8,225 2.8 8,371 8,944 8,371 6.9
Offshore Real . ($/hr) 23.4 23.4 (0.2) 23.2 23.0 23.0 0.0
Revenue (US$ m) 101.8 98.8 3.0 92.4 389 364 6.9
SW. Devp. (% of s a les ) 59.2 59.3 (13)bps 63.9 60.2 60.8 (58)bps
SG&A (% of sa les ) 17.5 16.9 59 bps 19.2 17.1 18.3 (116)bps
Eexpect Infosys to report revenue growth of 2.3% in US$ terms, with volume growth of 1.7% QoQ for Q3FY14, along with realization flattish QoQ. We also expect cross-currency to have a positive impact of 0.6% QoQ. We expect the margins to expand by 205bps for the quarter due to non-accrual of $35m payout and cost-efficiencey. We expect FY14 US$ revenue guidance to be revised to 9-11% YoY. There is likelihood of some commentary on road-map for growth acceleration.
Quarterly Table (Rs m)
Y/e MarchQ3
FY14E
Q2
FY14
QoQ gr.
(%)
Q3
FY13
9M
FY14E
9M
FY13
YoY gr.
(%)
Net Sa les 131,682 129,650 1.6 104,240 374,002 298,980 25.1
EBITDA 34,896 31,700 10.1 29,700 96,426 87,880 9.7
Margin (%) 26.5 24.5 205 bps 28.5 25.8 29.4 (361)bps
Reported PAT 26,466 24,070 10.0 23,690 74,276 70,270 5.7
PAT (Excl . Ex Items) 26,466 24,070 10.0 23,690 74,276 70,270 5.7
Operating Metrics
Volume (persons month) 347,012 341,211 1.7 316,565 1,020,630 915,294 11.5
Pricing (US$ / Hr) 34.4 34.4 0.0 34.3 34.3 33.9 1.1
Revenue (US$ m) 2,114 2,066 2.3 1,911 6,171 5,460 13.0
SW. Devp. (% of s a les ) 61.5 62.1 (60)bps 60.2 61.9 59.0 288 bps
SG&A (% of sa les ) 12.0 13.5 (145)bps 11.3 12.3 11.6 73 bps
Hexaware Technologies
Rating Reduce
Price (Rs ) 138
Target Pri ce (Rs ) 130
M/Cap (Rs bn) 41.0
Shares o/s (m) 296.5
Key Figures (Rs m)
Y/e Dec CY13 CY14E CY15E
Net Sa les 22,994 26,796 29,042
EBITDA 5,209 5,453 5,869
Margin (%) 22.7 20.4 20.2
PAT 3,800 4,351 4,766
EPS (Rs ) 12.8 14.7 16.1
Growth (%) 16.0 14.5 9.5
RoE (%) 28.9 27.9 25.8
PE (x) 10.8 9.4 8.6
P / BV (x) 2.9 2.4 2.1
EV / E (x) 7.3 6.6 5.8
Infosys
Rating BUY
Price (Rs ) 3,428
Target Pri ce (Rs ) 4,250
M/Cap (Rs bn) 1,960.9
Shares o/s (m) 572.0
Key Figures (Rs m)
Y/e March FY13 FY14E FY15E
Net Sa les 403,520 508,588 591,691
EBITDA 115,580 132,237 158,319
Margin (%) 28.6 26.0 26.8
PAT 94,210 102,679 122,874
EPS (Rs ) 164.7 179.5 214.8
Growth (%) 13.3 9.0 19.7
RoE (%) 25.7 23.8 24.1
PE (x) 20.8 19.1 16.0
P / BV (x) 4.9 4.2 3.6
EV / E (x) 15.1 12.9 10.4
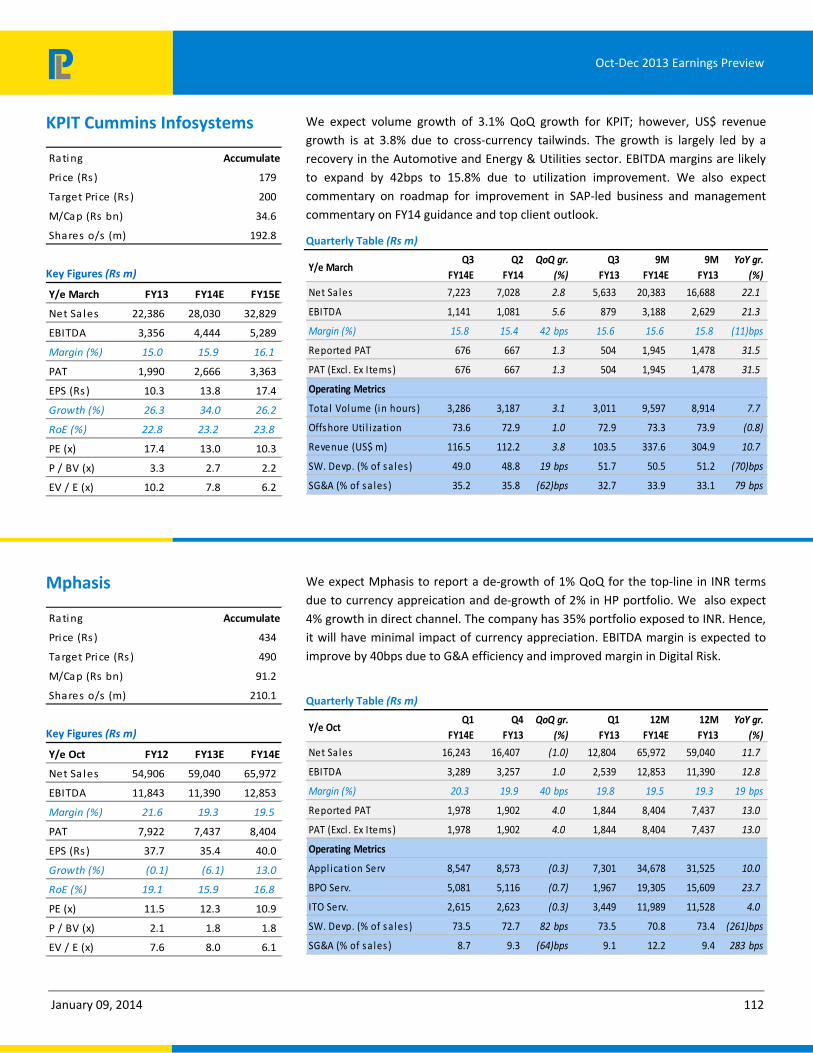
January 09, 2014 112
Oct-Dec 2013 Earnings Preview
We expect volume growth of 3.1% QoQ growth for KPIT; however, US$ revenue growth is at 3.8% due to cross-currency tailwinds. The growth is largely led by a recovery in the Automotive and Energy & Utilities sector. EBITDA margins are likely to expand by 42bps to 15.8% due to utilization improvement. We also expect commentary on roadmap for improvement in SAP-led business and management commentary on FY14 guidance and top client outlook.
Quarterly Table (Rs m)
Y/e MarchQ3
FY14E
Q2
FY14
QoQ gr.
(%)
Q3
FY13
9M
FY14E
9M
FY13
YoY gr.
(%)
Net Sa les 7,223 7,028 2.8 5,633 20,383 16,688 22.1
EBITDA 1,141 1,081 5.6 879 3,188 2,629 21.3
Margin (%) 15.8 15.4 42 bps 15.6 15.6 15.8 (11)bps
Reported PAT 676 667 1.3 504 1,945 1,478 31.5
PAT (Excl . Ex Items) 676 667 1.3 504 1,945 1,478 31.5
Operating Metrics
Tota l Volume (in hours ) 3,286 3,187 3.1 3,011 9,597 8,914 7.7
Offshore Uti l i zation 73.6 72.9 1.0 72.9 73.3 73.9 (0.8)
Revenue (US$ m) 116.5 112.2 3.8 103.5 337.6 304.9 10.7
SW. Devp. (% of s a les ) 49.0 48.8 19 bps 51.7 50.5 51.2 (70)bps
SG&A (% of sa les ) 35.2 35.8 (62)bps 32.7 33.9 33.1 79 bps
We expect Mphasis to report a de-growth of 1% QoQ for the top-line in INR terms due to currency appreication and de-growth of 2% in HP portfolio. We also expect 4% growth in direct channel. The company has 35% portfolio exposed to INR. Hence, it will have minimal impact of currency appreciation. EBITDA margin is expected to improve by 40bps due to G&A efficiency and improved margin in Digital Risk.
Quarterly Table (Rs m)
Y/e OctQ1
FY14E
Q4
FY13
QoQ gr.
(%)
Q1
FY13
12M
FY14E
12M
FY13
YoY gr.
(%)
Net Sa les 16,243 16,407 (1.0) 12,804 65,972 59,040 11.7
EBITDA 3,289 3,257 1.0 2,539 12,853 11,390 12.8
Margin (%) 20.3 19.9 40 bps 19.8 19.5 19.3 19 bps
Reported PAT 1,978 1,902 4.0 1,844 8,404 7,437 13.0
PAT (Excl . Ex Items) 1,978 1,902 4.0 1,844 8,404 7,437 13.0
Operating Metrics
Appl ication Serv 8,547 8,573 (0.3) 7,301 34,678 31,525 10.0
BPO Serv. 5,081 5,116 (0.7) 1,967 19,305 15,609 23.7
ITO Serv. 2,615 2,623 (0.3) 3,449 11,989 11,528 4.0
SW. Devp. (% of s a les ) 73.5 72.7 82 bps 73.5 70.8 73.4 (261)bps
SG&A (% of sa les ) 8.7 9.3 (64)bps 9.1 12.2 9.4 283 bps
KPIT Cummins Infosystems
Rating Accumulate
Price (Rs ) 179
Target Pri ce (Rs ) 200
M/Cap (Rs bn) 34.6
Shares o/s (m) 192.8
Key Figures (Rs m)
Y/e March FY13 FY14E FY15E
Net Sa les 22,386 28,030 32,829
EBITDA 3,356 4,444 5,289
Margin (%) 15.0 15.9 16.1
PAT 1,990 2,666 3,363
EPS (Rs ) 10.3 13.8 17.4
Growth (%) 26.3 34.0 26.2
RoE (%) 22.8 23.2 23.8
PE (x) 17.4 13.0 10.3
P / BV (x) 3.3 2.7 2.2
EV / E (x) 10.2 7.8 6.2
Mphasis
Rating Accumulate
Price (Rs ) 434
Target Pri ce (Rs ) 490
M/Cap (Rs bn) 91.2
Shares o/s (m) 210.1
Key Figures (Rs m)
Y/e Oct FY12 FY13E FY14E
Net Sa les 54,906 59,040 65,972
EBITDA 11,843 11,390 12,853
Margin (%) 21.6 19.3 19.5
PAT 7,922 7,437 8,404
EPS (Rs ) 37.7 35.4 40.0
Growth (%) (0.1) (6.1) 13.0
RoE (%) 19.1 15.9 16.8
PE (x) 11.5 12.3 10.9
P / BV (x) 2.1 1.8 1.8
EV / E (x) 7.6 8.0 6.1
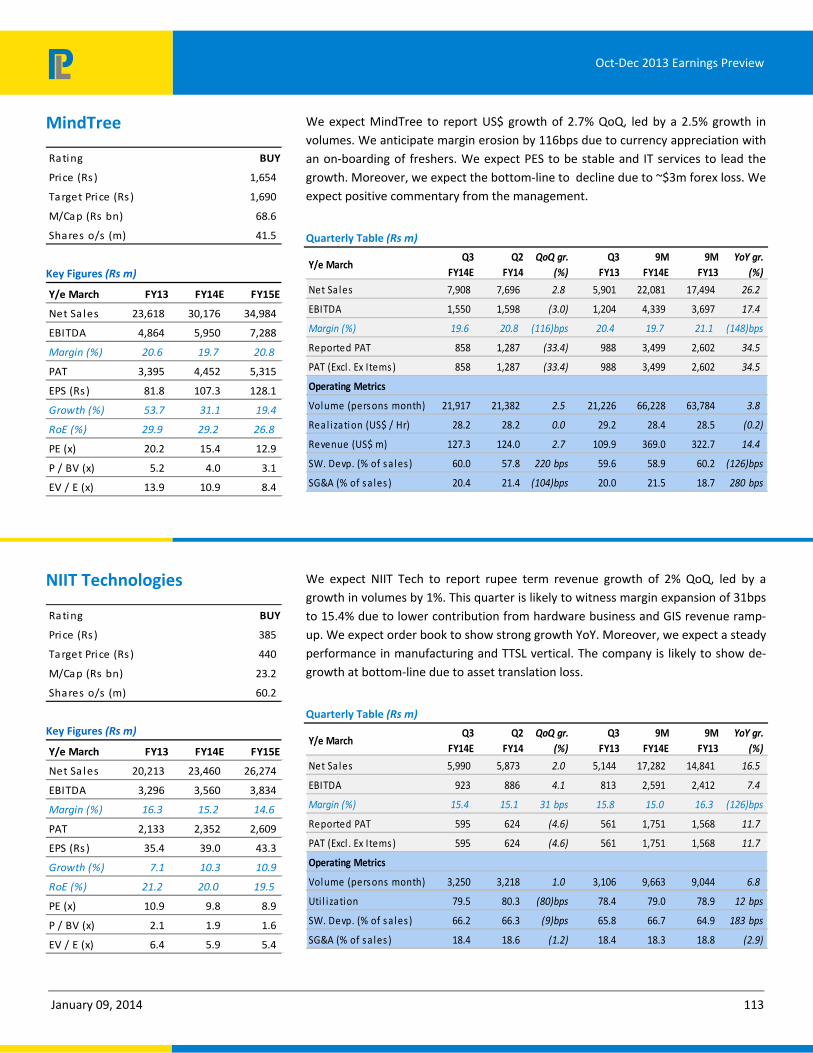
January 09, 2014 113
Oct-Dec 2013 Earnings Preview
We expect MindTree to report US$ growth of 2.7% QoQ, led by a 2.5% growth in volumes. We anticipate margin erosion by 116bps due to currency appreciation with an on-boarding of freshers. We expect PES to be stable and IT services to lead the growth. Moreover, we expect the bottom-line to decline due to ~$3m forex loss. We expect positive commentary from the management.
Quarterly Table (Rs m)
Y/e MarchQ3
FY14E
Q2
FY14
QoQ gr.
(%)
Q3
FY13
9M
FY14E
9M
FY13
YoY gr.
(%)
Net Sa les 7,908 7,696 2.8 5,901 22,081 17,494 26.2
EBITDA 1,550 1,598 (3.0) 1,204 4,339 3,697 17.4
Margin (%) 19.6 20.8 (116)bps 20.4 19.7 21.1 (148)bps
Reported PAT 858 1,287 (33.4) 988 3,499 2,602 34.5
PAT (Excl . Ex Items) 858 1,287 (33.4) 988 3,499 2,602 34.5
Operating Metrics
Volume (persons month) 21,917 21,382 2.5 21,226 66,228 63,784 3.8
Real ization (US$ / Hr) 28.2 28.2 0.0 29.2 28.4 28.5 (0.2)
Revenue (US$ m) 127.3 124.0 2.7 109.9 369.0 322.7 14.4
SW. Devp. (% of s a les ) 60.0 57.8 220 bps 59.6 58.9 60.2 (126)bps
SG&A (% of sa les ) 20.4 21.4 (104)bps 20.0 21.5 18.7 280 bps
We expect NIIT Tech to report rupee term revenue growth of 2% QoQ, led by a growth in volumes by 1%. This quarter is likely to witness margin expansion of 31bps to 15.4% due to lower contribution from hardware business and GIS revenue ramp-up. We expect order book to show strong growth YoY. Moreover, we expect a steady performance in manufacturing and TTSL vertical. The company is likely to show de-growth at bottom-line due to asset translation loss.
Quarterly Table (Rs m)
Y/e MarchQ3
FY14E
Q2
FY14
QoQ gr.
(%)
Q3
FY13
9M
FY14E
9M
FY13
YoY gr.
(%)
Net Sa les 5,990 5,873 2.0 5,144 17,282 14,841 16.5
EBITDA 923 886 4.1 813 2,591 2,412 7.4
Margin (%) 15.4 15.1 31 bps 15.8 15.0 16.3 (126)bps
Reported PAT 595 624 (4.6) 561 1,751 1,568 11.7
PAT (Excl . Ex Items) 595 624 (4.6) 561 1,751 1,568 11.7
Operating Metrics
Volume (persons month) 3,250 3,218 1.0 3,106 9,663 9,044 6.8
Uti l i zation 79.5 80.3 (80)bps 78.4 79.0 78.9 12 bps
SW. Devp. (% of s a les ) 66.2 66.3 (9)bps 65.8 66.7 64.9 183 bps
SG&A (% of sa les ) 18.4 18.6 (1.2) 18.4 18.3 18.8 (2.9)
MindTree
Rating BUY
Price (Rs ) 1,654
Target Pri ce (Rs ) 1,690
M/Cap (Rs bn) 68.6
Shares o/s (m) 41.5
Key Figures (Rs m)
Y/e March FY13 FY14E FY15E
Net Sa les 23,618 30,176 34,984
EBITDA 4,864 5,950 7,288
Margin (%) 20.6 19.7 20.8
PAT 3,395 4,452 5,315
EPS (Rs ) 81.8 107.3 128.1
Growth (%) 53.7 31.1 19.4
RoE (%) 29.9 29.2 26.8
PE (x) 20.2 15.4 12.9
P / BV (x) 5.2 4.0 3.1
EV / E (x) 13.9 10.9 8.4
NIIT Technologies
Rating BUY
Price (Rs ) 385
Target Pri ce (Rs ) 440
M/Cap (Rs bn) 23.2
Shares o/s (m) 60.2
Key Figures (Rs m)
Y/e March FY13 FY14E FY15E
Net Sa les 20,213 23,460 26,274
EBITDA 3,296 3,560 3,834
Margin (%) 16.3 15.2 14.6
PAT 2,133 2,352 2,609
EPS (Rs ) 35.4 39.0 43.3
Growth (%) 7.1 10.3 10.9
RoE (%) 21.2 20.0 19.5
PE (x) 10.9 9.8 8.9
P / BV (x) 2.1 1.9 1.6
EV / E (x) 6.4 5.9 5.4

January 09, 2014 114
Oct-Dec 2013 Earnings Preview
We expect Sourcing and Intellect to grow at 2.1% and 1.9% QoQ, respectively, whereas BPO revenue is likely to de-grow by 3.3% QoQ. We expect margins to decline by 78bps due to currency appreciation. Also, we expect muted commentary on the deal pipeline for Intellect and increasingly confident tone on the overall demand environment due to high exposure to BFSI vertical.
Quarterly Table (Rs m)
Y/e MarchQ3
FY14E
Q2
FY14
QoQ gr.
(%)
Q3
FY13
9M
FY14E
9M
FY13
YoY gr.
(%)
Net Sa les 6,567 6,434 2.1 5,729 18,839 17,536 7.4
EBITDA 1,215 1,240 (2.1) 942 3,466 3,313 4.6
Margin (%) 18.5 19.3 (78)bps 16.4 18.4 18.9 (49)bps
Reported PAT 585 598 (2.2) 407 1,615 1,567 3.1
PAT (Excl . Ex Items) 585 598 (2.2) 407 1,615 1,567 3.1
Operating Metrics
FT Sourcing (US$ m) 82 80 2.1 81 241 247 (2.2)
FT Intel lect (US$ m) 22.8 22.4 1.9 23.6 69.1 73.4 (5.9)
BPO (US$ m) 1.1 1.1 (3.3) 1.3 3.4 3.3 0.4
SW. Devp. (% of s a les ) 64.0 62.4 164 bps 64.0 63.5 62.7 78 bps
SG&A (% of sa les ) 11.9 12.6 (69)bps 12.1 12.2 12.1 5 bps
We expect Persistent Systems to grow by 3.6% QoQ in US$ terms, margin decline of 55bps due to currency appreciation and change in IP revenue mix with headwinds due to S&M investment. We also expect positive commentary on deal pipeline for organic and inorganic IP-led growth and a hint towards an improving demand scenario in CY14.
Quarterly Table (Rs m)
Y/e MarchQ3
FY14E
Q2
FY14
QoQ gr.
(%)
Q3
FY13
9M
FY14E
9M
FY13
YoY gr.
(%)
Net Sa les 4,418 4,324 2.2 3,330 12,315 9,606 28.2
EBITDA 1,122 1,122 0.0 824 3,021 2,521 19.8
Margin (%) 25.4 26.0 (55)bps 24.7 24.5 26.2 (171)bps
Reported PAT 592 608 (2.6) 495 1,771 1,357 30.5
PAT (Excl . Ex Items) 592 608 (2.6) 495 1,771 1,357 30.5
Operating Metrics
Volume (persons month) 11,305 10,933 3.4 10,487 32,845 30,873 6.4
Revenue (US$ m) 70.9 68.5 3.6 60.8 202.4 175.7 15.2
SW. Devp. (% of s a les ) 68.0 67.6 42 bps 70.5 68.9 67.7 118 bps
SG&A (% of sa les ) 6.6 6.5 13 bps 4.8 6.7 6.0 73 bps
0.0 3,838 3,813 3,643 4.7 Real ization (US$ / person month)
3,919 3,919
Polaris Financial Technology
Rating Accumulate
Price (Rs ) 146
Target Pri ce (Rs ) 190
M/Cap (Rs bn) 14.5
Shares o/s (m) 99.5
Key Figures (Rs m)
Y/e March FY13 FY14E FY15E
Net Sa les 23,083 25,612 27,871
EBITDA 4,242 4,759 5,245
Margin (%) 18.4 18.6 18.8
PAT 1,941 2,190 2,787
EPS (Rs ) 19.5 22.0 28.0
Growth (%) (12.0) 12.9 27.2
RoE (%) 15.2 15.6 17.9
PE (x) 7.5 6.6 5.2
P / BV (x) 1.1 1.0 0.9
EV / E (x) 3.2 2.5 2.0
Persistent Systems
Rating BUY
Price (Rs ) 1,021
Target Pri ce (Rs ) 1,100
M/Cap (Rs bn) 40.8
Shares o/s (m) 40.0
Key Figures (Rs m)
Y/e March FY13 FY14E FY15E
Net Sa les 12,945 16,919 20,014
EBITDA 3,352 4,349 5,307
Margin (%) 25.9 25.7 26.5
PAT 1,876 2,493 3,181
EPS (Rs ) 46.9 62.3 79.5
Growth (%) 32.3 32.9 27.6
RoE (%) 20.2 22.3 23.5
PE (x) 21.8 16.4 12.8
P / BV (x) 4.0 3.3 2.7
EV / E (x) 12.2 9.2 7.4

January 09, 2014 115
Oct-Dec 2013 Earnings Preview
We expect TCS to report 2.7% QoQ volume growth aided by all the verticals except Telecom, with slight positive bias in the pricing front. EBITDA margin is expected to expand by 35bps despite currency appreciation. We expect cross-currency to have a positive impact of 0.7% on growth. The management is likely to stay with its positive commentary on the demand outlook.
Quarterly Table (Rs m)
Y/e MarchQ3
FY14E
Q2
FY14
QoQ gr.
(%)
Q3
FY13
9M
FY14E
9M
FY13
YoY gr.
(%)
Net Sa les 214,826 209,772 2.4 160,699 604,469 465,594 29.8
EBITDA 68,744 66,390 3.5 46,540 186,667 134,272 39.0
Margin (%) 32.0 31.6 35 bps 29.0 30.9 28.8 204 bps
Reported PAT 52,842 51,441 2.7 35,655 142,945 104,190 37.2
PAT (Excl . Ex Items) 52,842 51,441 2.7 35,655 142,945 104,190 37.2
Operating Metrics
Volume (persons month) 709,621 690,965 2.7 581,354 2,044,543 1,702,626 20.1
Pricing (US$ / Hr) 32.7 32.6 0.1 33.6 32.8 33.4 (1.9)
Revenue (US$ m) 3,454 3,337 3.5 2,948 9,955 8,529 16.7
SW. Devp. (% of s a les ) 53.0 53.5 (48)bps 55.1 53.9 55.5 (162)bps
SG&A (% of Sa les ) 15.5 15.4 13 bps 16.4 15.8 16.1 (30)bps
Tech Mahindra is likely to report 2.8% QoQ growth in the US$ terms. We expect no ramp-up in the large deals that the company bagged over last 2 quarters. The margin is likely to erode by 58bps for the quarter due to currency appreciation and we expect commentary on the early signs of recovery in Europe wherein TechM has strong persence.
Quarterly Table (Rs m)
Y/e MarchQ3
FY14E
Q2
FY14
QoQ gr.
(%)
Q3
FY13
9M
FY14E
9M
FY13
YoY gr.
(%)
Net Sa les 48,563 47,715 1.8 36,683 137,310 105,647 30.0
EBITDA 11,024 11,110 (0.8) 7,957 30,779 22,918 34.3
Margin (%) 22.7 23.3 (58)bps 21.7 22.4 21.7 72 bps
Reported PAT 7,317 7,191 1.7 9,313 21,631 19,386 11.6
PAT (Excl . Ex Items) 7,317 7,191 1.7 9,313 21,631 19,386 11.6
Operating Metrics
Revenue (US$ mn) 780 758 2.8 675 2,262 1,935 16.9
SW. Devp. (% of s a les ) 60.7 60.4 29 bps 62.0 61.2 62.5 (127)bps
SG&A (% of sa les ) 16.6 16.3 30 bps 16.3 16.4 15.8 61 bps
Tata Consultancy Services
Rating Accumulate
Price (Rs ) 2,233
Target Pri ce (Rs ) 2,560
M/Cap (Rs bn) 4,369.7
Shares o/s (m) 1,957.2
Key Figures (Rs m)
Y/e March FY13 FY14E FY15E
Net Sa les 629,895 828,020 981,131
EBITDA 180,872 257,833 299,338
Margin (%) 28.7 31.1 30.5
PAT 140,122 195,995 224,566
EPS (Rs ) 71.6 100.1 114.7
Growth (%) 31.0 39.9 14.6
RoE (%) 38.1 41.3 36.4
PE (x) 31.2 22.3 19.5
P / BV (x) 10.7 8.1 6.3
EV / E (x) 23.8 16.5 13.9
Tech Mahindra
Rating BUY
Price (Rs ) 1,841
Target Pri ce (Rs ) 2,150
M/Cap (Rs bn) 426.3
Shares o/s (m) 231.6
Key Figures (Rs m)
Y/e March FY13 FY14E FY15E
Net Sa les 143,320 185,895 213,991
EBITDA 30,631 42,291 48,148
Margin (%) 21.4 22.8 22.5
PAT 23,356 29,775 34,460
EPS (Rs ) 100.8 128.6 148.8
Growth (%) 32.9 27.5 15.7
RoE (%) 40.0 36.3 31.1
PE (x) 18.3 14.3 12.4
P / BV (x) 6.2 4.5 3.4
EV / E (x) 13.1 9.4 7.8

January 09, 2014 116
Oct-Dec 2013 Earnings Preview
We expect Wipro to report IT Services revenue growth of 3% in US$ terms to US$1,680m, in line with their guidance of 1.8% to 3.6% QoQ growth. EBITDA margin is expected to expand by 18bps due to deal ramp-up and improved utilization. We are expecting the management commentary to be more positive. We also expect Wipro to guide for 1.5-3.5% QoQ growth for Q4FY14.
Quarterly Table (Rs m)
Y/e MarchQ3
FY14E
Q2
FY14
QoQ gr.
(%)
Q3
FY13
9M
FY14E
9M
FY13
YoY gr.
(%)
Net Sa les 114,044 110,053 3.6 109,487 321,626 292,517 10.0
EBITDA 26,287 25,170 4.4 21,422 71,844 59,910 19.9
Margin (%) 23.1 22.9 18 bps 19.6 22.3 20.5 186 bps
Reported PAT 21,107 21,647 (2.5) 17,164 59,222 46,856 26.4
PAT (Excl . Ex Items) 21,107 21,647 (2.5) 17,164 59,222 46,856 26.4
Operating Metrics
IT Svcs Revs ($ mn) 1,680 1,631 3.0 1,577 4,899 4,633 5.8
Pricing (US$ / Hr) 38.7 38.7 0.0 39.9 38.7 38.8 (0.2)
Currency (USDINR) 62 62 0.6 55 60.0 51.7 16.1
SW. Devp. (% of s a les ) 67.0 67.4 (43)bps 69.0 67.8 69.5 (171)bps
SG&A (% of Sa les ) 10.0 9.7 25 bps 11.4 9.9 10.0 (3)bps
Wipro
Rating BUY
Price (Rs ) 547
Target Pri ce (Rs ) 700
M/Cap (Rs bn) 1,347.6
Shares o/s (m) 2,463.0
Key Figures (Rs m)
Y/e March FY13 FY14E FY15E
Net Sa les 374,256 449,041 502,498
EBITDA 78,181 98,584 117,038
Margin (%) 20.9 22.0 23.3
PAT 61,684 78,688 92,479
EPS (Rs ) 25.0 31.9 37.5
Growth (%) 17.1 27.6 17.5
RoE (%) 21.7 25.2 24.6
PE (x) 21.8 17.1 14.6
P / BV (x) 4.7 4.0 3.3
EV / E (x) 16.2 12.5 10.0

January 09, 2013 117
Oct-Dec 2013 Earnings Preview
Kamlesh Bagmar [email protected] +91-22-6632 2237
Mandar Dhavle [email protected] +91-22-6632 2258
Top picks
NMDC
Coal India
Hindustan Zinc
Metals & Mining
World steel production grew 5.8% YoY at 261m tonnes in Oct-Nov 2013, driven by continued expansion in China’s steel production. China’s steel production grew 8.1% to 125m tonnes. Europe resumed growth in the quarter after reporting consecutive fall for previous eight quarters. Region reported 4% YoY growth in production at 29m tonnes. Japan and USA reported 8.4% and 4.9% growth in production at 18.8m and 14.5m tonnes respectively on the back of strong domestic activity. Production in rest of the world rose 3.8% YoY at 135.5m tonnes
Movement in Crude Steel Production
-10.0
-5.0
0.0
5.0
10.0
15.0
20.0
25.0
30.0
Nov
-10
Jan-
11
Mar
-11
May
-11
Jul-
11
Sep-
11
Nov
-11
Jan-
12
Mar
-12
May
-12
Jul-
12
Sep-
12
Nov
-12
Jan-
13
Mar
-13
May
-13
Jul-
13
Sep-
13
Nov
-13
(%)
China World steel World steel ex China
Source: World Steel, PL Research
Average capacity utilisation levels in Oct-Nov 2013 period rose ~35bps YoY at 75.7%.
Movement in World Steel capacity utilisation
65.0
68.0
71.0
74.0
77.0
80.0
83.0
86.0
May
-10
Jul-
10
Sep-
10
Nov
-10
Jan-
11
Mar
-11
May
-11
Jul-
11
Sep-
11
Nov
-11
Jan-
12
Mar
-12
May
-12
Jul-
12
Sep-
12
Nov
-12
Jan-
13
Mar
-13
May
-13
Jul-
13
Sep-
13
Nov
-13
(%)
Source: World Steel, PL Research
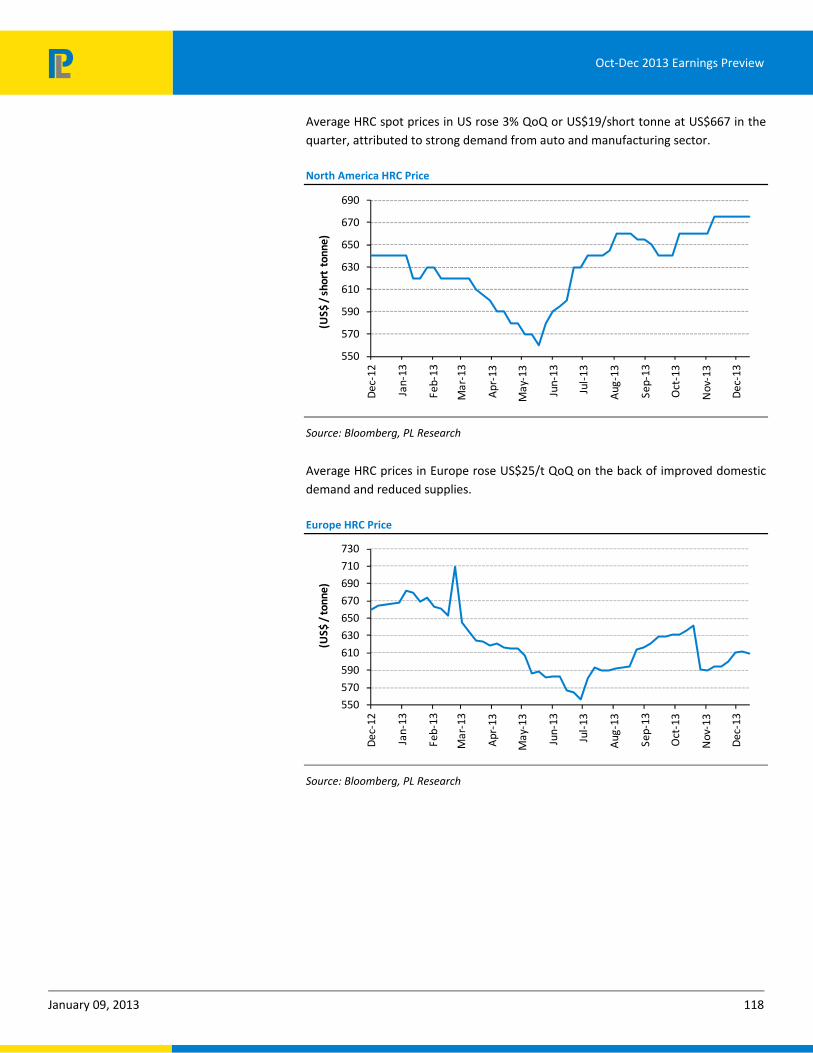
January 09, 2013 118
Oct-Dec 2013 Earnings Preview
Average HRC spot prices in US rose 3% QoQ or US$19/short tonne at US$667 in the quarter, attributed to strong demand from auto and manufacturing sector.
North America HRC Price
550
570
590
610
630
650
670
690
Dec
-12
Jan-
13
Feb-
13
Mar
-13
Apr
-13
May
-13
Jun-
13
Jul-
13
Aug
-13
Sep-
13
Oct
-13
Nov
-13
Dec
-13
(US$ / short tonne)
Source: Bloomberg, PL Research
Average HRC prices in Europe rose US$25/t QoQ on the back of improved domestic demand and reduced supplies.
Europe HRC Price
550
570
590
610
630
650
670
690
710
730
Dec
-12
Jan-
13
Feb-
13
Mar
-13
Apr
-13
May
-13
Jun-
13
Jul-
13
Aug
-13
Sep-
13
Oct
-13
Nov
-13
Dec
-13
(US$ / tonne)
Source: Bloomberg, PL Research

January 09, 2013 119
Oct-Dec 2013 Earnings Preview
Chinese steel prices (including 17% VAT) fell 2.1% QoQ or US$13/t at US$593 on account of tight liquidity and weak demand.
China HRC price
550
570
590
610
630
650
670
690
Dec
-12
Jan-
13
Feb-
13
Mar
-13
Apr
-13
May
-13
Jun-
13
Jul-
13
Aug
-13
Sep-
13
Oct
-13
Nov
-13
Dec
-13
(US$ / tonne)
Source: Bloomberg, PL Research
Average for the spot iron ore prices (CIF China) rose 1.4% QoQ or US$2/t at US$136 on the back of China’s strong restocking demand and continued expansion in China’s steel production. China’s iron ore imports rose by 11% YoY in January-November 2013 at 746m tonnes, constituting ~66% of world’s total sea-borne trade.
Indian origin Iron Ore (63% Fe) Export Prices (CIF) to China
110115120125130135140145150155160
Dec
-12
Jan-
13
Feb-
13
Mar
-13
Apr
-13
May
-13
Jun-
13
Jul-
13
Aug
-13
Sep-
13
Oct
-13
Nov
-13
Dec
-13
(US$ / tonne)
Source: Bloomberg, PL Research.

January 09, 2013 120
Oct-Dec 2013 Earnings Preview
Scrap prices outperformed iron ore on the back of strong demand from US, Europe and Japan. Average for scrap prices rose 3.3% or RsUS$13/t at US$371.
Rotterdam Scrap Prices
300
320
340
360
380
400
420
Dec
-12
Jan-
13
Feb-
13
Mar
-13
Apr
-13
May
-13
Jun-
13
Jul-
13
Aug
-13
Sep-
13
Oct
-13
Nov
-13
Dec
-13
(US$ / short tonne)
Source: Bloomberg, PL Research
Spreads basis on an average were positive during the quarter across markets on the back of higher regional prices and lower input prices. US enjoyed the highest spreads compared to China and Europe. Spreads in Europe moved sharply in December on the back of recovery in prices. However, European spreads are ~50% lower than last year.
Steel prices and cost of production (Blast furnace producers) movement
-135-110
-85-60-35-1015406590
115140
Sep-
12
Oct
-12
Nov
-12
Dec
-12
Jan-
13
Feb-
13
Mar
-13
Apr
-13
May
-13
Jun-
13
Jul-
13
Aug
-13
Sep-
13
Oct
-13
Nov
-13
Dec
-13
(US$ / Tonne)
US China Europe
Source: Bloomberg, PL Research
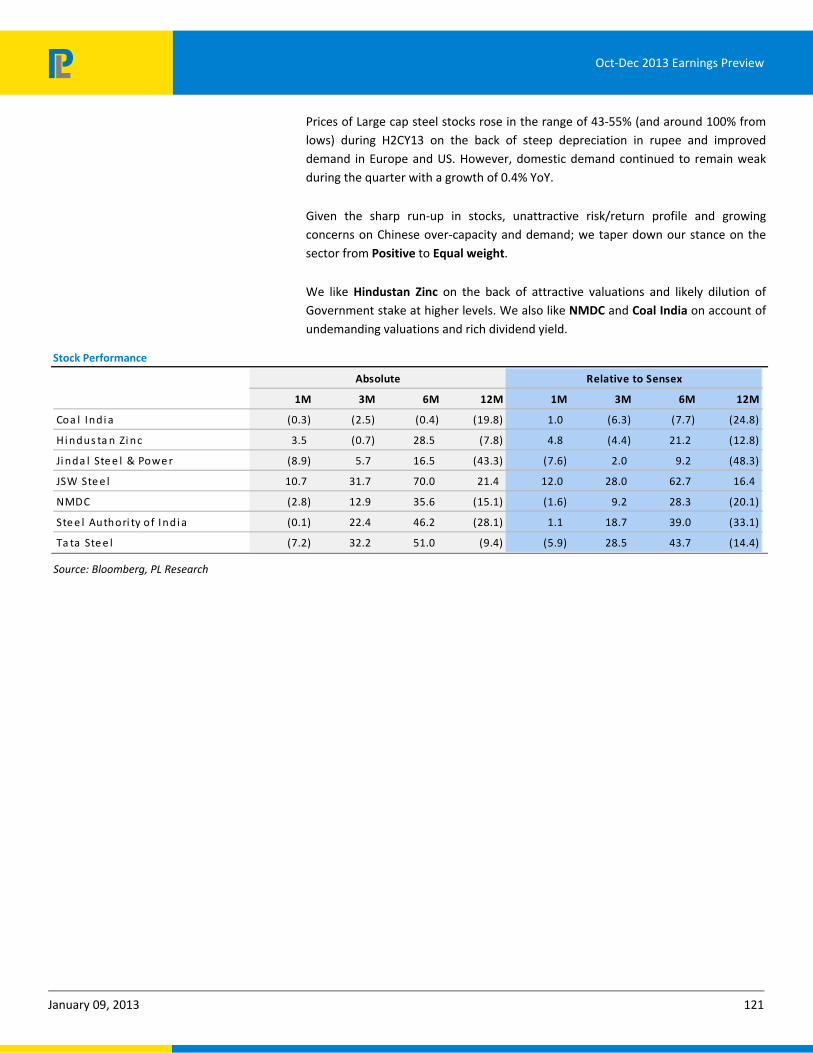
January 09, 2013 121
Oct-Dec 2013 Earnings Preview
Prices of Large cap steel stocks rose in the range of 43-55% (and around 100% from lows) during H2CY13 on the back of steep depreciation in rupee and improved demand in Europe and US. However, domestic demand continued to remain weak during the quarter with a growth of 0.4% YoY.
Given the sharp run-up in stocks, unattractive risk/return profile and growing concerns on Chinese over-capacity and demand; we taper down our stance on the sector from Positive to Equal weight.
We like Hindustan Zinc on the back of attractive valuations and likely dilution of Government stake at higher levels. We also like NMDC and Coal India on account of undemanding valuations and rich dividend yield.
Stock Performance
1M 3M 6M 12M 1M 3M 6M 12M
Coa l Indi a (0.3) (2.5) (0.4) (19.8) 1.0 (6.3) (7.7) (24.8)
H i ndus ta n Zi nc 3.5 (0.7) 28.5 (7.8) 4.8 (4.4) 21.2 (12.8)
Ji nda l Ste e l & Powe r (8.9) 5.7 16.5 (43.3) (7.6) 2.0 9.2 (48.3)
JSW Ste e l 10.7 31.7 70.0 21.4 12.0 28.0 62.7 16.4
NMDC (2.8) 12.9 35.6 (15.1) (1.6) 9.2 28.3 (20.1)
Ste e l Authori ty of Indi a (0.1) 22.4 46.2 (28.1) 1.1 18.7 39.0 (33.1)
Ta ta Ste e l (7.2) 32.2 51.0 (9.4) (5.9) 28.5 43.7 (14.4)
Absolute Relative to Sensex
Source: Bloomberg, PL Research
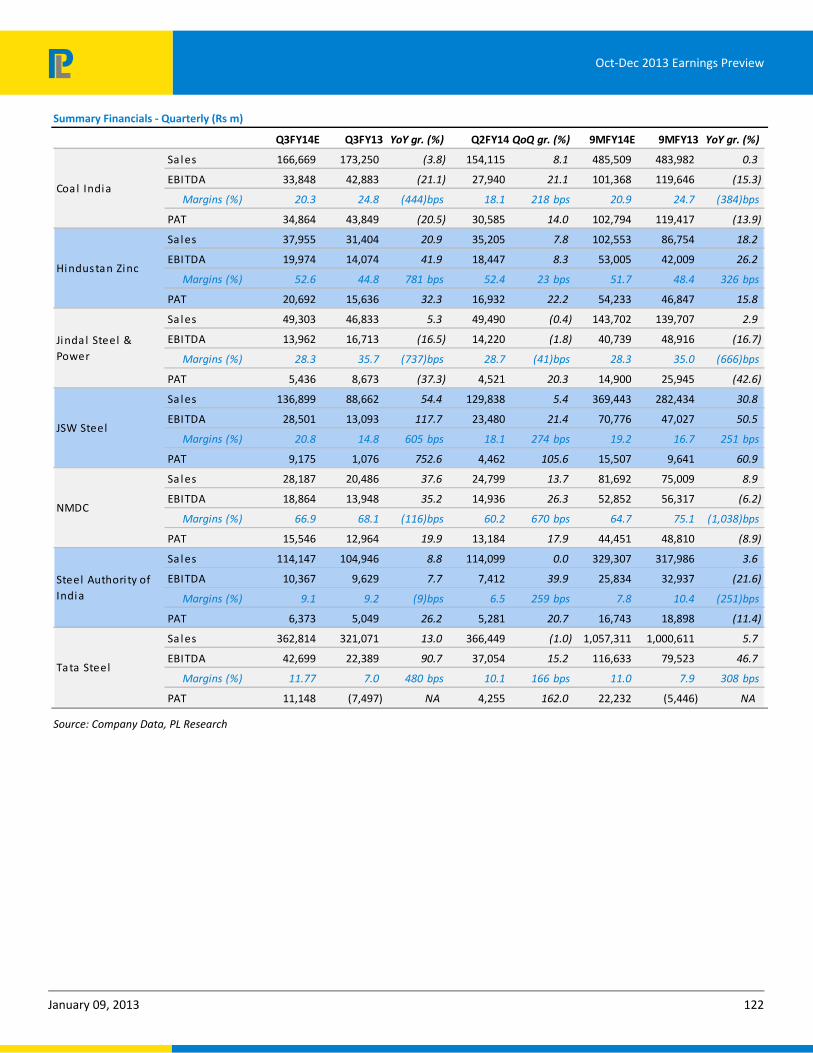
January 09, 2013 122
Oct-Dec 2013 Earnings Preview
Summary Financials ‐ Quarterly (Rs m)
Q3FY14E Q3FY13 YoY gr. (%) Q2FY14 QoQ gr. (%) 9MFY14E 9MFY13 YoY gr. (%)
Sa les 166,669 173,250 (3.8) 154,115 8.1 485,509 483,982 0.3
EBITDA 33,848 42,883 (21.1) 27,940 21.1 101,368 119,646 (15.3)
Margins (%) 20.3 24.8 (444)bps 18.1 218 bps 20.9 24.7 (384)bps
PAT 34,864 43,849 (20.5) 30,585 14.0 102,794 119,417 (13.9)
Sa les 37,955 31,404 20.9 35,205 7.8 102,553 86,754 18.2
EBITDA 19,974 14,074 41.9 18,447 8.3 53,005 42,009 26.2
Margins (%) 52.6 44.8 781 bps 52.4 23 bps 51.7 48.4 326 bps
PAT 20,692 15,636 32.3 16,932 22.2 54,233 46,847 15.8
Sa les 49,303 46,833 5.3 49,490 (0.4) 143,702 139,707 2.9
EBITDA 13,962 16,713 (16.5) 14,220 (1.8) 40,739 48,916 (16.7)
Margins (%) 28.3 35.7 (737)bps 28.7 (41)bps 28.3 35.0 (666)bps
PAT 5,436 8,673 (37.3) 4,521 20.3 14,900 25,945 (42.6)
Sa les 136,899 88,662 54.4 129,838 5.4 369,443 282,434 30.8
EBITDA 28,501 13,093 117.7 23,480 21.4 70,776 47,027 50.5
Margins (%) 20.8 14.8 605 bps 18.1 274 bps 19.2 16.7 251 bps
PAT 9,175 1,076 752.6 4,462 105.6 15,507 9,641 60.9
Sa les 28,187 20,486 37.6 24,799 13.7 81,692 75,009 8.9
EBITDA 18,864 13,948 35.2 14,936 26.3 52,852 56,317 (6.2)
Margins (%) 66.9 68.1 (116)bps 60.2 670 bps 64.7 75.1 (1,038)bps
PAT 15,546 12,964 19.9 13,184 17.9 44,451 48,810 (8.9)
Sa les 114,147 104,946 8.8 114,099 0.0 329,307 317,986 3.6
EBITDA 10,367 9,629 7.7 7,412 39.9 25,834 32,937 (21.6)
Margins (%) 9.1 9.2 (9)bps 6.5 259 bps 7.8 10.4 (251)bps
PAT 6,373 5,049 26.2 5,281 20.7 16,743 18,898 (11.4)
Sa les 362,814 321,071 13.0 366,449 (1.0) 1,057,311 1,000,611 5.7
EBITDA 42,699 22,389 90.7 37,054 15.2 116,633 79,523 46.7
Margins (%) 11.77 7.0 480 bps 10.1 166 bps 11.0 7.9 308 bps
PAT 11,148 (7,497) NA 4,255 162.0 22,232 (5,446) NA
Tata Steel
Steel Authori ty of India
Coal India
Hindustan Zinc
Jinda l Steel & Power
JSW Steel
NMDC
Source: Company Data, PL Research

January 09, 2013 123
Oct-Dec 2013 Earnings Preview
Consolidated Sectoral Data
Quarterly Table (Rs m)
Oct‐Dec'13 Oct‐Dec'12 YoY gr. (%) Jul‐Sep'13 QoQ gr. (%)
Net Sa les 895,975 786,653 13.9 873,994 2.5
EBITDA 168,217 132,730 26.7 143,489 17.2
Margin (%) 18.8 16.9 190 bps 16.4 236 bps
PAT (Excl . Ex Items) 103,234 79,750 29.4 79,220 30.3
Note: Revenue, EBITDA and PAT numbers are arrived by totaling corresponding numbers of all companies under our coverage in this
sector.
Net revenue is expected to decline 3.8% YoY due to 2.9% fall in volumes and 1% fall in realisations. Cost/t is expected to increase 5% YoY (Rs54/t) at Rs1,138 due to higher diesel cost and hike in contractual expenses. Hence, EBITDA/t is expected to fall 18.7% YoY at Rs290. Accordingly, EBITDA and PAT is expected to decline by 21.1% YoY and 20.5% YoY at Rs33.8bn and 34.9bn, respectively.
Quarterly Table (Rs m)
Y/e MarchQ3
FY14E
Q3
FY13
YoY gr.
(%)
Q2
FY14
9M
FY14E
9M
FY13
YoY gr.
(%)
Net Sales 166,669 173,250 (3.8) 154,115 485,509 483,982 0.3
EBITDA 33,848 42,883 (21.1) 27,940 101,368 119,646 (15.3)
Margin (%) 20.3 24.8 (444)bps 18.1 20.9 24.7 (384)bps
Reported PAT 34,864 43,951 (20.7) 30,524 102,698 119,317 (13.9)
PAT (Excl. Ex Items) 34,864 43,849 (20.5) 30,585 102,794 119,417 (13.9)
Operating Metrics
Coal despatches (mn tn) 117 120 (2.9) 109 341 335 1.9
Real. / tonne (Rs) 1,428 1,441 (0.9) 1,416 1,422 1,444 (1.5)
Total cost per tonne (Rs) 1,138 1,084 4.9 1,159 1,125 1,087 3.5
EBITDA / tonne (Rs) 290 357 (18.7) 257 297 357 (16.8)
Cash cost per tonne (Rs) 1,057 992 6.6 1,124 1,059 1,005 5.4
Emp. cost / tonne (Rs) 603 566 5.3 715 652 641 1.4
OBR adj / tonne (Rs) 60 77 (22.4) 48 55 75 (26.1)
Key Figures (Rs m)
2013 2014E 2015E
Net Sales 3,279,689 3,692,695 4,064,177
Growth (%) 3.8 12.6 10.1
EBITDA 616,640 668,860 762,609
Margin (%) 18.8 18.1 18.8
PAT 385,486 402,661 451,702
Growth (%) 0.5 4.5 12.2
PE (x) 10.6 10.1 9.0
Coal India
Rating Accumulate
Price (Rs ) 289
Target Price (Rs ) 310
M/Cap (Rs bn) 1,824.2
Shares o/s (m) 6,316.4
Key Figures (Rs m)
Y/e March FY13 FY14E FY15E
Net Sa l es 683,027 701,798 770,357
EBITDA 187,061 162,264 183,970
Margin (%) 27.4 23.1 23.9
PAT 179,742 158,109 182,089
EPS (Rs ) 28.5 25.0 28.8
Growth (%) 22.1 (12.0) 15.2
RoE (%) 40.4 31.3 33.3
PE (x) 10.1 11.5 10.0
P / BV (x) 3.8 3.5 3.2
EV / E (x) 6.5 6.9 5.7
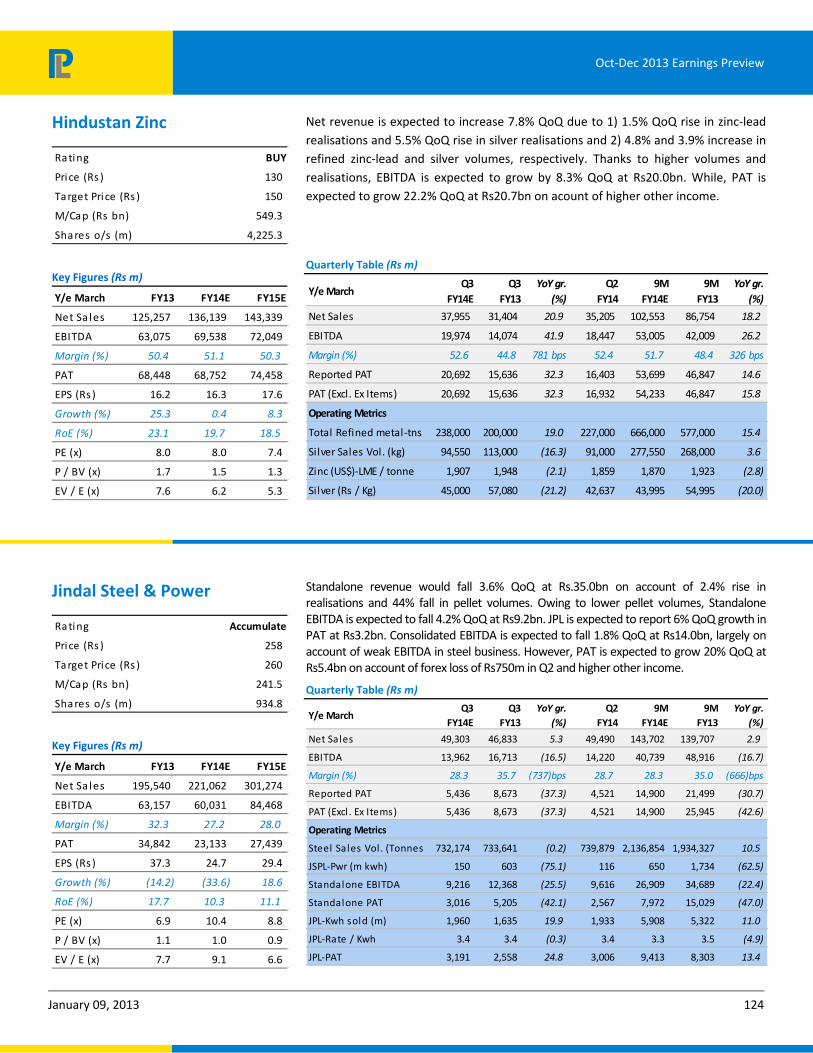
January 09, 2013 124
Oct-Dec 2013 Earnings Preview
Net revenue is expected to increase 7.8% QoQ due to 1) 1.5% QoQ rise in zinc-lead realisations and 5.5% QoQ rise in silver realisations and 2) 4.8% and 3.9% increase in refined zinc-lead and silver volumes, respectively. Thanks to higher volumes and realisations, EBITDA is expected to grow by 8.3% QoQ at Rs20.0bn. While, PAT is expected to grow 22.2% QoQ at Rs20.7bn on acount of higher other income.
Quarterly Table (Rs m)
Y/e MarchQ3
FY14E
Q3
FY13
YoY gr.
(%)
Q2
FY14
9M
FY14E
9M
FY13
YoY gr.
(%)
Net Sales 37,955 31,404 20.9 35,205 102,553 86,754 18.2
EBITDA 19,974 14,074 41.9 18,447 53,005 42,009 26.2
Margin (%) 52.6 44.8 781 bps 52.4 51.7 48.4 326 bps
Reported PAT 20,692 15,636 32.3 16,403 53,699 46,847 14.6
PAT (Excl. Ex Items) 20,692 15,636 32.3 16,932 54,233 46,847 15.8
Operating Metrics
Total Refined metal-tns 238,000 200,000 19.0 227,000 666,000 577,000 15.4
Silver Sales Vol. (kg) 94,550 113,000 (16.3) 91,000 277,550 268,000 3.6
Zinc (US$)-LME / tonne 1,907 1,948 (2.1) 1,859 1,870 1,923 (2.8)
Silver (Rs / Kg) 45,000 57,080 (21.2) 42,637 43,995 54,995 (20.0)
Standalone revenue would fall 3.6% QoQ at Rs.35.0bn on account of 2.4% rise in realisations and 44% fall in pellet volumes. Owing to lower pellet volumes, Standalone EBITDA is expected to fall 4.2% QoQ at Rs9.2bn. JPL is expected to report 6% QoQ growth in PAT at Rs3.2bn. Consolidated EBITDA is expected to fall 1.8% QoQ at Rs14.0bn, largely on account of weak EBITDA in steel business. However, PAT is expected to grow 20% QoQ at Rs5.4bn on account of forex loss of Rs750m in Q2 and higher other income.
Quarterly Table (Rs m)
Y/e MarchQ3
FY14E
Q3
FY13
YoY gr.
(%)
Q2
FY14
9M
FY14E
9M
FY13
YoY gr.
(%)
Net Sales 49,303 46,833 5.3 49,490 143,702 139,707 2.9
EBITDA 13,962 16,713 (16.5) 14,220 40,739 48,916 (16.7)
Margin (%) 28.3 35.7 (737)bps 28.7 28.3 35.0 (666)bps
Reported PAT 5,436 8,673 (37.3) 4,521 14,900 21,499 (30.7)
PAT (Excl . Ex Items) 5,436 8,673 (37.3) 4,521 14,900 25,945 (42.6)
Operating Metrics
Steel Sales Vol . (Tonnes) 732,174 733,641 (0.2) 739,879 2,136,854 1,934,327 10.5
JSPL-Pwr (m kwh) 150 603 (75.1) 116 650 1,734 (62.5)
Standalone EBITDA 9,216 12,368 (25.5) 9,616 26,909 34,689 (22.4)
Standalone PAT 3,016 5,205 (42.1) 2,567 7,972 15,029 (47.0)
JPL-Kwh sold (m) 1,960 1,635 19.9 1,933 5,908 5,322 11.0
JPL-Rate / Kwh 3.4 3.4 (0.3) 3.4 3.3 3.5 (4.9)
JPL-PAT 3,191 2,558 24.8 3,006 9,413 8,303 13.4
Hindustan Zinc
Rating BUY
Price (Rs ) 130
Target Price (Rs ) 150
M/Cap (Rs bn) 549.3
Shares o/s (m) 4,225.3
Key Figures (Rs m)
Y/e March FY13 FY14E FY15E
Net Sa l es 125,257 136,139 143,339
EBITDA 63,075 69,538 72,049
Margin (%) 50.4 51.1 50.3
PAT 68,448 68,752 74,458
EPS (Rs ) 16.2 16.3 17.6
Growth (%) 25.3 0.4 8.3
RoE (%) 23.1 19.7 18.5
PE (x) 8.0 8.0 7.4
P / BV (x) 1.7 1.5 1.3
EV / E (x) 7.6 6.2 5.3
Jindal Steel & Power
Rating Accumulate
Price (Rs ) 258
Target Price (Rs ) 260
M/Cap (Rs bn) 241.5
Shares o/s (m) 934.8
Key Figures (Rs m)
Y/e March FY13 FY14E FY15E
Net Sa l es 195,540 221,062 301,274
EBITDA 63,157 60,031 84,468
Margin (%) 32.3 27.2 28.0
PAT 34,842 23,133 27,439
EPS (Rs ) 37.3 24.7 29.4
Growth (%) (14.2) (33.6) 18.6
RoE (%) 17.7 10.3 11.1
PE (x) 6.9 10.4 8.8
P / BV (x) 1.1 1.0 0.9
EV / E (x) 7.7 9.1 6.6

January 09, 2013 125
Oct-Dec 2013 Earnings Preview
Standalone revenue is expected to grow 9.6% QoQ on the back of 5.4% growth in volumes and 4.0% rise or Rs1429/t in realisation. Cost is expected to rise 1.7% QoQ or Rs496/t on account of higher iron ore cost. Hence, EBITDA/t is expected to expand 15.3% or Rs1135 at Rs8637. EBITDA is expected to grow 21.4% QoQ at Rs28.5bn. We expect adjusted consolidated PAT at Rs9.2bn.
Quarterly Table (Rs m)
Y/e MarchQ3
FY14E
Q3
FY13
YoY gr.
(%)*
Q2
FY14
9M
FY14E
9M
FY13
YoY gr.
(%)
Net Sales 136,899 88,662 54.4 129,838 369,443 282,434 30.8
EBITDA 28,501 13,093 117.7 23,480 70,776 47,027 50.5
Margin (%) 20.8 14.8 605bps 18.1 19.2 16.7 251 bps
Reported PAT 9,175 (737) (1,344.4) (1,156) 4,202 6,672 (37.0)
PAT (Excl. Ex Items) 9,175 1,076 752.6 4,462 15,507 9,641 60.9
Operating Metrics
Sales Vol. (mt) 3.3 2.2 52.1 3.1 9.0 6.4 39.4
Realisation / tonne (Rs) 37,558 38,133 (1.5) 36,129 36,638 40,532 (9.6)
EBITDA / tonne (Rs) 8,637 6,034 43.1 7,502 7,873 7,292 8.0
* YoY number not comparable due to merger of JSW‐Ispat from Q1FY14
Net revenue is expected to grow 13.7% QoQ at Rs28.2bn on the back of 13.2% QoQ growth in iron ore volumes and 0.5% QoQ or Rs20/t rise in realisations at Rs3783/t. Thanks to higher domestic volumes and better domestic realisations, EBITDA and adjusted PAT is expected to grow 26.0% QoQ and 18.0% QoQ at Rs18.9bn and Rs15.5bn, respectively.
Quarterly Table (Rs m)
Y/e MarchQ3
FY14E
Q3
FY13
YoY gr.
(%)
Q2
FY14
9M
FY14E
9M
FY13
YoY gr.
(%)
Net Sales 28,187 20,486 37.6 24,799 81,692 75,009 8.9
EBITDA 18,864 13,948 35.2 14,936 52,852 56,317 (6.2)
Margin (%) 66.9 68.1 (116)bps 60.2 64.7 75.1 (1,038)bps
Reported PAT 15,546 12,964 19.9 13,184 44,451 48,810 (8.9)
PAT (Excl. Ex Items) 15,546 12,964 19.9 13,184 44,451 48,810 (8.9)
Operating Metrics
Total Volume (mt) 7.4 5.3 38.1 6.5 21.1 18.0 17.0
Realization/t (Rs.) 3,783 3,790 (0.2) 3,763 3,820 4,104 (6.9)
EBITDA/t (Rs) 2,564 2,619 (2.1) 2,298 2,504 3,123 (19.8)
JSW Steel
Rati ng Reduce
Price (Rs ) 1,026
Target Price (Rs ) 860
M/Cap (Rs bn) 248.0
Shares o/s (m) 241.6
Key Figures (Rs m) ‐ Consolidated
Y/e March FY13 FY14E FY15E
Net Sa l es 382,097 495,517 567,661
EBITDA 65,039 90,499 110,424
Margin (%) 17.0 18.3 19.5
PAT 12,126 19,822 28,577
EPS (Rs ) 54.3 82.0 118.3
Growth (%) 10.7 50.9 44.2
RoE (%) 7.2 10.4 12.8
PE (x) 18.9 12.5 8.7
P / BV (x) 1.3 1.2 1.0
EV / E (x) 7.9 6.9 5.7
NMDC
Rating BUY
Price (Rs ) 139
Target Price (Rs ) 157
M/Cap (Rs bn) 550.7
Shares o/s (m) 3,964.7
Key Figures (Rs m)
Y/e March FY13 FY14E FY15E
Net Sa l es 107,043 115,552 128,071
EBITDA 75,322 74,666 82,354
Margin (%) 70.4 64.6 64.3
PAT 63,424 61,658 65,873
EPS (Rs ) 16.0 15.6 16.6
Growth (%) (12.7) (2.8) 6.8
RoE (%) 24.4 21.8 21.9
PE (x) 8.7 8.9 8.4
P / BV (x) 2.0 1.9 1.8
EV / E (x) 4.5 4.7 4.4

January 09, 2013 126
Oct-Dec 2013 Earnings Preview
Standalone net revenue (incl. other operating income) is expected to grow 4.0% QoQ on the back of 2% volume growth and 3.3% (Rs1170/t) rise in realisations. Aided by higher realisations and lower forex loss, EBITDA/t expected to increase by 8.9% QoQ (Rs1279/t) at ~Rs15,681. Hence, EBITDA and PAT expected to grow by 11.0% and 8.3% QoQ at Rs32.6bn and Rs16.9bn, respectively.
Quarterly Table (Rs m) ‐ Standalone
Y/e MarchQ3
FY14E
Q3
FY13
YoY gr.
(%)
Q2
FY14
9M
FY14E
9M
FY13
YoY gr.
(%)
Net Sales 103,147 93,703 10.1 99,210 296,911 274,289 8.2
EBITDA 32,616 25,262 29.1 29,379 90,339 78,222 15.5
Margin (%) 31.6 27.0 466 bps 29.6 30.4 28.5 191 bps
Reported PAT 16,875 10,464 61.3 15,587 46,023 37,538 22.6
PAT (Excl. Ex Items) 16,875 10,464 61.3 15,587 46,023 37,538 22.6
Operating Metrics
Sales volume (m tonnes) 2.1 1.9 10.1 2.0 6.1 5.2 17.6
Realisation / Tonne (Rs) 37,160 36,509 1.8 35,990 36,571 38,648 (5.4)
EBITDA / Tonne (Rs) 15,681 13,366 17.3 14,402 14,761 15,025 (1.8)
Tata Steel Europe (TSE) is expected to report an increase of 61% QoQ in EBITDA/t at US$40, largely on account of US$15/t rise in realisations. Lower variable cost in TSE would be undone by lower scale. Hence, TSE is expected to report 56% QoQ growth in EBITDA at US$133m; factoring ~3.2% fall in volumes. On the back of strong earnings in TSE and India operations, we expect consolidated EBITDA to grow 15.3% QoQ. We expect PAT to grow 21.6% QoQ at Rs11.1bn.
Quarterly Table (Rs m) – Consolidated
Y/e MarchQ3
FY14E
Q3
FY13
YoY gr.
(%)
Q2
FY14
9M
FY14E
9M
FY13
YoY gr.
(%)
Net Sales 362,814 321,071 13.0 366,449 1,057,311 1,000,611 5.7
EBITDA 42,699 22,389 90.7 37,054 116,633 79,523 46.7
Margin (%) 11.8 7.0 480 bps 10.1 11.0 7.9 308 bps
Reported PAT 11,148 (7,631) NA 9,168 31,705 (5,291) NA
PAT (Excl. Ex Items) 11,148 (7,497) NA 4,255 22,232 (5,446) NA
Operating Metrics
SalesVol.-Corus (mt) 3.4 3.0 10.9 3.5 10.0 9.7 3.1
EBITDA/Tn-Corus (US$) 40 (26) NA 25 36 3 NA
EBITDA/Tn-SEAN (US$) 18.0 31.7 (43.2) 21.6 20 21 (5.9)
1.0 2.7 2.2 19.2 Sales Vol.-South East (mt)
0.9 0.8 3.7
Tata Steel
Ra ting Reduce
Price (Rs ) 392
Ta rget Price (Rs ) 436
M/Ca p (Rs bn) 381.2
Sha res o/s (m) 971.4
Key Figures (Rs m) ‐ Consolidated
Y/e March FY13 FY14E FY15E
Net Sa l es 1,347,115 1,556,843 1,623,065
EBITDA 123,212 172,578 176,871
Margin (%) 9.1 11.1 10.9
PAT 3,323 50,983 48,251
EPS (Rs ) 3.4 52.5 49.7
Growth (%) (83.6) 1,434.4 (5.4)
RoE (%) 0.9 14.1 12.0
PE (x) 114.7 7.5 7.9
P / BV (x) 1.1 1.0 0.9
EV / E (x) 7.8 5.8 5.9

January 09, 2013 127
Oct-Dec 2013 Earnings Preview
Net revenue is expected to remain flat QoQ at Rs114bn on account of 3% fall in volumes and 3%/Rs1139/t rise in realisations. Cost/t is expected to remain rise marginally by 0.2% QoQ or Rs60/t on account of lower scale and higher coking coal cost. Thanks to higher spreads, EBITDA/tonne is expected to grow 44% QoQ at Rs3,538. Accordingly, EBITDA and Adjusted PAT are expected to grow 40% and 21% QoQ at Rs10.4bn and 6.4bn, respectively.
Quarterly Table (Rs m)
Y/e MarchQ3
FY14E
Q3
FY13
YoY gr.
(%)
Q2
FY14
9M
FY14E
9M
FY13
YoY gr.
(%)
Net Sales 114,147 104,946 8.8 114,099 329,307 317,986 3.6
EBITDA 10,367 9,629 7.7 7,412 25,834 32,937 (21.6)
Margin (%) 9.1 9.2 (9)bps 6.5 7.8 10.4 (251)bps
Reported PAT 6,373 4,842 31.6 11,804 22,686 17,237 31.6
PAT (Excl. Ex Items) 6,373 5,049 26.2 5,281 16,743 18,898 (11.4)
Operating Metrics
Sales Vol. (mt) 2.9 2.8 6.5 3.0 8.6 7.9 9.0
Real./Tonne (Rs) 38,958 38,162 2.1 37,819 38,439 40,456 (5.0)
EBITDA/Tonne (Rs) 3,538 3,502 1.0 2,457 3,016 4,191 (28.0)
SAIL
Ra ting Reduce
Price (Rs ) 70
Ta rget Price (Rs ) 50
M/Ca p (Rs bn) 288.7
Sha res o/s (m) 4,130.5
Key Figures (Rs m)
Y/e March FY13 FY14E FY15E
Net Sa l es 439,611 465,784 530,410
EBITDA 39,774 39,284 52,474
Margin (%) 9.0 8.4 9.9
PAT 23,581 20,203 25,014
EPS (Rs ) 5.7 4.9 6.1
Growth (%) (36.7) (14.3) 23.8
RoE (%) 5.8 4.8 5.7
PE (x) 12.2 14.3 11.5
P / BV (x) 0.7 0.7 0.6
EV / E (x) 11.7 13.3 11.5

January 09, 2013 128
Oct-Dec 2013 Earnings Preview
Surajit Pal [email protected] +91-22-6632 2259
Top picks
Dr. Reddy’s Lab
Aurobindo Pharma
Pharmaceuticals
With mixed bag of development in global and domestic pharmaceutical markets, Indian pharmaceutical companies are expected to achieve 21% YoY growth and 8% QoQ growth in our coverage universe. Approval of Cymbalta with market size of USD5.5bn would be largest generic approval in US in Q3FY14E. There are five Indian generics among the seven approvals in Cymbalta on day-one of off-patent period. The domestic formulations returned to the growth phase in November 2013 after seeing declines in September and October 2013. While decline in prices of IPM was expected following new list of NPPA of 348 drugs, the decline in volume of IPM was beyond our expectation. Major companies however explained the decline as one-off events. They cited lower offtake by channel partners due to uncertain pricing regime and issue of commissions to retailers and wholesalers. The issue of re-establishment of retailers’ commission at 20% and distributors commission at 10% is virtually settled as majority of pharma companies negotiated the issue at individual level as discussion with three organisations of pharma companies’ had not yield expected outcome.
With stable USD/INR and strong contributions of new generics in US generics, we expect 21% YoY revenue growth and 248bps increase in EBITDA margin along with 35% YoY growth in EBITDA in our coverage universe. With new approvals of high value generics in Aurobindo, higher contribution of limited competition drug in DRL and inorganic growth in Sun (DUSA and URL) and Cipla (Medpro) is expected to help growth in net income (PAT) by 58% YoY and 8% QoQ growth in Q3FY14E. Stable USD/INR benefits in lower raw material costs and employee costs for large pharma companies while MTM loss on forex loan would be lower for high geared company. With highly leveraged balance sheets, Aurobindo, Jubilant Life and Cadila would be benefitted from lower MTM loss in Q3FY14E. Companies in our coverage would also benefit from stable USD/INR as it would reduce volatility in margin from ROW markets. We assume average forex rate at INR62/USD in Q3FY14E.

January 09, 2013 129
Oct-Dec 2013 Earnings Preview
Q3FY14 Performance – Excluding one‐offs
YoY growth (%) YoY margin improvement (bps)
Revenue EBITDA PAT EBITDA PAT
Sun Pharma 49 45 44 (123) (102)
Cipla 24 18 16 (99) (101)
Dr. Reddy's Labs 24 53 62 449 380
Ranbaxy 2 191 -41 550 760
Lupin 15 13 25 38 122
Cadila 14 21 94 86 445
Large generic companies 21 57 33 150 284
Glenmark 11 -2 -23 (252) (465)
Aurobindo 22 75 188 710 788
Jubilant Life 12 -7 -367 -340 NA
Mid‐cap companies 15 22 ‐67 39 161.5
Aggregate 18 40 ‐17 94.5 223
Source: Company Data, PL Research Note – Above numbers exclude one‐offs to facilitate comparison of core operations
Cymbalta and niche drugs to drive US sales in Q3FY14E
With first time generic approval of Cymbalta and launches of niche generics with limited competition, revenues from para-IV launches to be key growth driver of US business for Indian generic companies in Q3FY14E. Product shortage in ceph injectables and Depakote ER expected to benefit Aurobindo and Dr Reddy’s respectively. Withdrawal of Lipodox by originator in US would benefit Sun Pharma in Q3FY14E. Cipla started its individual presence in US with approval of major product Xopenex in December 2013, other than its presence in Dymista through partnership with Meda Pharma. Ranbaxy would also gain benefits from launch of Ximino, a branded Minocycline in US. We also expect seasonal benefits for Lupin with higher sales of Suprax as the company branches into new dosages and forms such as chewable and drop for paediatric segment.
We expect US revenues to be major growth driver for majority of pharma companies in our coverage expect Cipla, Jubilant and Ranbaxy. Cipla gains major growth with incorporation of Medpro and new tender business in South Africa while Jubilant draws benefit from higher export of Life Sciences Ingredients (PPES, Nutritional ingredients) and Ranbaxy gains benefit from non-US exports.

January 09, 2013 130
Oct-Dec 2013 Earnings Preview
US lead growth for companies during the quarter
Base US business growth (%) Overall top‐line growth (%)
Sun Pharma 15 49
Dr. Reddy's Lab 13 24
Lupin 10 15
Cadila 7 14
Ranbaxy 2 2
Glenmark 9 11
Source: Company Data, PL Research * Excluding Irom acquisition. ^ Excluding Biochem Acquisition
Stable USD/INR to reduce volatility in ROW exports; also benefits high leveraged companies with lower MTM loss
Rupee remains flat QoQ against USD while depreciates 3% QoQ against Euro.
This would benefit stable growth in US revenues while margin volatility in ROW exports would be avoided in Q3FY14E. Lower volatility of emerging market currencies against USD would reduce partial loss on receivables, which would generally adjusted by distributors to compensate loss due to forex volatility. We however notice that currencies of South Africa and Russia have higher depreciation against USD in comparison to INR in Q3FY14E. This may tepid growth for Dr Reddy’s and Glenmark with their 10%-14% revenues from those markets.
It would also benefit high leveraged companies with lower MTM loss on forex debt such as Aurobindo (USD550mn) and jubilant Life (USD600mn). The companies with limited hedge such as Lupin, Sun Pharma, Glenmark, and Cipla will benefit vis-à-vis peers as they cover hedge only 20-30% of quarterly sales.
YoY and QoQ INR depreciation v/s USD and Euro to partially boost revenues but PAT to have different impact on foreign currency borrowers
90
100
110
120
130
140
Jun-
12
Jul-
12
Aug
-12
Sep-
12
Oct
-12
Nov
-12
Dec
-12
Jan-
13Fe
b-13
Mar
-13
Apr
-13
May
-13
Jun-
13
Jul-
13
Aug
-13
Sep-
13
USD-INR EUR-INR
90
100
110
120
130
140
Apr
-13
May
-13
Jun-
13
Jul-
13
Aug
-13
Sep-
13
Oct
-13
USD-INR EUR-INR
Source: Bloomberg, PL Research

January 09, 2013 131
Oct-Dec 2013 Earnings Preview
New Pharma Pricing Policy (NPPA) continue to impact India sales
New pricing policy in India continue to impact formulation sales in India in Q3FY14E as domestic market witnessed decrease in volume along with price in H2 2014. The India formulation business volume decreased in September (-1.8%) and October (-1.7% gr) 2013 while average growth in June, July (9.4% gr), August (1.1% gr) and November (6.9% gr) were hovering at lower single digit. The price impact from NPPA was witnessed in only 195 drugs (molecules) which have received revised price from government of India. The price of other drugs included in restricted list is not yet determined as government have not received current market price of those drugs from companies to determine average price under new DPCO. We believe that companies are avoiding restricted price regime by discontinuing older drugs and launch improved version of those molecules. This may help to avoid restricted price regime in near to medium term while regulator indicated that price of the improved version of the molecules may also be included in NPPA in case prices of the simple generic are not available. We believe that if government includes improved version of molecules in NPPA, then domestic sales of pharma companies would be impacted for long term. Current list of NPPA drugs include 348 molecules (including combinations) or more than 600 SKUs.
Government has announced new pharma pricing policy (modified) to be implemented from July 1, 2013 post approval from Union cabinet. The new policy, which was modified to fix ceiling price for 348 drugs, increased from 75 drugs covered by National List of Essential Medicines (NLEM) 2011 based on simple average price (v/s weighted average price earlier) of all the brands having market share of more than 1% market share. The government has released suggested ceiling price of 195 drugs out of 348 drugs under new NLEM to be applied from July 1, 2013. Within our coverage, Glenmark and Dr Reddy’s Lab to be the least affected, while Cipla and Zydus Cadila to be the most impacted.
The key highlights of the new pricing policy are:
Market-based pricing policy to be positive in the long term v/s cost-based pricing in the previous NLEM policy
The ceiling price would be based on simple average price of all formulations with market share more than 1% (as of May-2012)
The companies are required to provide six months prior notice to the government before discontinuing supply of NLEM drugs. The government, however, may direct the company to continue for one more year from the date of notice
Retailers’ margin to be revised to 16% (from 20% previously) for non-Rx drug
Bargain over margin for retailer and distributors continue to impact sales in Q2FY14E and Q3FY14E and reduce margin if channel partners are able to restore margin at pre-DPCO regime for 349 drugs
The current selling price lower than the ceiling price cannot be hiked

January 09, 2013 132
Oct-Dec 2013 Earnings Preview
Stock Performance
1M 3M 6M 12M 1M 3M 6M 12M
Aurobi ndo Pha rma 32.4 96.8 110.5 102.0 33.7 93.1 103.3 97.0
Ca di l a He a l thca re 14.7 24.5 6.9 (5.6) 16.0 20.8 (0.4) (10.6)
Ci pl a 4.0 (7.0) 1.9 (5.9) 5.2 (10.7) (5.3) (10.9)
Dr.Re ddy's La bora tori e s 4.5 5.8 12.6 32.7 5.8 2.1 5.3 27.7
Gl e nma rk Pha rma ce uti ca l s (2.1) (9.7) (11.4) (5.3) (0.8) (13.4) (18.6) (10.3)
Jubi l a nt Li fe Sci e nce s 8.9 57.1 6.8 (45.3) 10.2 53.4 (0.5) (50.3)
Lupi n 9.4 5.4 13.3 56.9 10.7 1.7 6.1 51.9
Ra nba xy La bora tori e s 9.2 25.3 38.3 (6.7) 10.5 21.6 31.0 (11.7)
Sun Pha rma ce uti ca l Indus tri e s 3.4 (2.2) 15.3 59.3 4.6 (5.9) 8.0 54.3
Absolute Relative to Sensex
Source: Bloomberg, PL Research
Summary Financials ‐ Quarterly (Rs m)
Q3FY14E Q3FY13 YoY gr. (%) Q2FY14 QoQ gr. (%) 9MFY14E 9MFY13 YoY gr. (%)
Sales 19,231 15,701 22.5 18,975 1.3 55,202 42,680 29.3
EBITDA 4,540 2,591 75.2 4,220 7.6 11,677 6,322 84.7
Margins (%) 23.6 16.5 710 bps 22.2 137 bps 21.2 14.8 634 bps
PAT 3,051 1,652 84.7 3,032 0.6 7,994 3,475 130.0
Sales 18,338 16,041 14.3 17,468 5.0 52,176 47,462 9.9
EBITDA 3,074 2,550 20.5 2,605 18.0 8,537 8,312 2.7
Margins (%) 16.8 15.9 87 bps 14.9 185 bps 16.4 17.5 (115)bps
PAT 1,994 1,029 93.8 1,834 8.7 5,784 3,923 47.4
Sales 24,773 20,307 22.0 24,632 0.6 72,482 61,300 18.2
EBITDA 5,359 4,531 18.3 5,150 4.1 15,632 16,139 (3.1)
Margins (%) 21.6 22.3 (68)bps 20.9 73 bps 21.6 26.3 (476)bps
PAT 3,939 3,388 16.3 3,581 10.0 12,373 12,235 1.1
Sales 35,610 28,652 24.3 33,575 6.1 97,634 82,866 17.8
EBITDA 8,653 5,673 52.5 8,456 2.3 22,518 17,579 28.1
Margins (%) 24.3 19.8 450 bps 25.2 (89)bps 23.1 21.2 185 bps
PAT 5,891 3,578 64.6 6,903 (14.7) 16,403 11,012 49.0
Sales 15,264 13,813 10.5 14,630 4.3 42,276 36,771 15.0
EBITDA 3,150 3,198 (1.5) 3,153 (0.1) 8,780 8,109 8.3
Margins (%) 20.6 23.2 (252)bps 21.6 (92)bps 20.8 22.1 (128)bps
PAT 1,642 2,132 (23.0) 1,573 4.4 4,521 4,512 0.2
Aurobindo Pharma
Cadi la Heal thcare
Cipla
Dr.Reddy's Laboratories
Glenmark Pharmaceutica ls
Source: Company Data, PL Research. Note: PAT is adjusted for one‐offs

January 09, 2013 133
Oct-Dec 2013 Earnings Preview
Summary Financials ‐ Quarterly (Rs m)
Q3FY14E Q3FY13 YoY gr. (%) Q2FY14 QoQ gr. (%) 9MFY14E 9MFY13 YoY gr. (%)
Sales 14,619 13,064 11.9 14,356 1.8 42,551 37,689 12.9
EBITDA 2,410 2,598 (7.2) 2,709 (11.0) 7,482 8,099 (7.6)
Margins (%) 16.5 19.9 (340)bps 18.9 (238)bps 17.6 21.5 (391)bps
PAT 639 267 139.6 696 (8.2) 1,921 1,727 11.2
Sales 28,296 24,659 14.8 26,315 7.5 78,817 69,243 13.8
EBITDA 6,431 5,698 12.9 6,232 3.2 18,003 14,473 24.4
Margins (%) 22.7 23.1 (38)bps 23.7 (95)bps 22.8 20.9 194 bps
PAT 4,193 3,515 19.3 4,062 3.2 12,265 9,224 33.0
Sales 27,739 27,112 2.3 28,016 (1.0) 76,790 92,117 (16.6)
EBITDA 2,356 810 191.1 2,270 3.8 6,501 13,059 (50.2)
Margins (%) 8.5 3.0 551 bps 8.1 39 bps 8.5 14.2 (571)bps
PAT (2,926) (1,965) NA 66 NA (7,807) (18,422) NA
Sales 42,453 28,520 48.9 41,921 1.3 119,195 81,674 45.9
EBITDA 18,248 12,611 44.7 18,284 (0.2) 51,838 36,464 42.2
Margins (%) 43.0 44.2 (123)bps 43.6 (63)bps 43.5 44.6 (116)bps
PAT 12,683 8,813 43.9 13,623 (6.9) 38,719 25,801 50.1
Jubi lant Li fe Sciences
Lupin
Ranbaxy Laboratories
Sun Pharmaceutica l Industries
Source: Company Data, PL Research. Note: PAT is adjusted for one‐offs
Consolidated Sectoral Data
Quarterly Table (Rs m)
Oct‐Dec'13 Oct‐Dec'12 YoY gr. (%) Jul‐Sep'13 QoQ gr. (%)
Net Sa les 226,322 187,868 20.5 219,887 2.9
EBITDA 54,221 40,259 34.7 53,079 2.2
Margin (%) 24.0 21.4 253 bps 24.1 (18)bps
PAT (Excl . Ex Items) 31,105 22,409 38.8 35,370 (12.1)
Note: Revenue, EBITDA and PAT numbers are arrived by totaling corresponding numbers of all companies under our coverage in this
sector.
Key Figures (Rs m)
2013 2014E 2015E
Net Sales 754,759 895,711 982,097
Growth (%) 25.9 18.7 9.6
EBITDA 175,766 207,988 237,243
Margin (%) 23.3 23.2 24.2
PAT 115,973 145,384 164,493
Growth (%) 15.1 25.4 13.1
PE (x) 26.5 21.1 18.7

January 09, 2013 134
Oct-Dec 2013 Earnings Preview
We expect Aurobindo Pharma’s Q3FY14E revenue to grow at 22% YoY to Rs19bn led by launches of new generics and shortage of ceph injectables in the US. US sales growth to be benefitted from strong flow of approvals especially launch of generic Cymbalta. With launches of valuable generics and increasing presence of injectables, the company EBITDA margin to be increased by 710bps YoY to 23.6% in Q3FY14E. Aurobindo’s high foreign debt, capex and working capital cycle continues to be a hangover though improvement in cash flow new launches would mitigate risk partially.
Quarterly Table (Rs m)
Y/e MarchQ3
FY14E
Q3
FY13
YoY gr.
(%)
Q2
FY14
9M
FY14E
9M
FY13
YoY gr.
(%)
Net Sales 19,231 15,701 22.5 18,975 55,202 42,680 29.3
EBITDA 4,540 2,591 75.2 4,220 11,677 6,322 84.7
Margin (%) 23.6 16.5 710 bps 22.2 21.2 14.8 634 bps
Reported PAT 2,641 918 187.7 2,350 5,177 1,853 179.5
PAT (Excl. Ex Items) 3,051 1,652 84.7 3,032 7,994 3,475 130.0
Operating Metrics
US Formulations 7,747 5,134 50.9 7,308 21,303 12,666 68.2
EU & ROW 2,723 2,233 22.0 2,644 8,206 6,351 29.2
ARV formulations 2,098 1,751 15.8 2,331 6,347 5,675 9.5
APIs 6,986 6,602 4.6 7,180 20,635 18,694 8.3
Zydus Cadila’s Q3FY14E revenues is likely to grow at 14% YoY due to improved visibility post launch of Depakote ER in US. Management expects a series of approvals in H1 2014, which would improve revenue growth and operating margin of in FY15E. The company would continue to witness setbacks in multiple business verticals. India sales to improve in H2FY14E due to lower base from NLEM impact. Cadila expects INR950mn revenue loss due to NLEM in FY14E while discontinuation of two products in Bayer JV would incur INR900mn loss of sales in FY15E.
Quarterly Table (Rs m)
Y/e MarchQ3
FY14E
Q3
FY13
YoY gr.
(%)
Q2
FY14
9M
FY14E
9M
FY13
YoY gr.
(%)
Net Sa les 18,338 16,041 14.3 17,468 52,176 47,462 9.9
EBITDA 3,074 2,550 20.5 2,605 8,537 8,312 2.7
Margin (%) 16.8 15.9 87 bps 14.9 16.4 17.5 (115)bps
Reported PAT 1,994 1,029 93.8 1,834 5,784 3,923 47.4
PAT (Excl . Ex Items) 1,994 1,029 93.8 1,834 5,784 3,923 47.4
Operating Metrics
US Formulations 5,185 3,920 32.3 4,730 13,789 11,186 23.3
Domestic Formulation 6,388 5,699 12.1 6,263 18,903 17,533 7.8
Consumer Healthcare 1,070 1,018 5.1 1,039 3,259 3,016 8.1
Income from JVs 1,015 1,263 (19.7) 1,068 3,393 3,872 (12.4)
Aurobindo Pharma
Rating BUY
Price (Rs ) 406
Target Price (Rs ) 482
M/Cap (Rs bn) 118.1
Shares o/s (m) 291.2
Key Figures (Rs m)
Y/e March FY13 FY14E FY15E
Net Sa l es 58,553 74,770 88,977
EBITDA 8,610 14,132 16,995
Margin (%) 14.7 18.9 19.1
PAT 4,292 8,610 10,493
EPS (Rs ) 14.7 29.6 36.0
Growth (%) 1.9 100.6 21.9
RoE (%) 17.4 31.6 31.7
PE (x) 27.5 13.7 11.3
P / BV (x) 4.5 4.1 3.1
EV / E (x) 14.8 9.0 7.4
Cadila Healthcare
Rating Reduce
Price (Rs ) 845
Target Pri ce (Rs ) 740
M/Cap (Rs bn) 173.0
Shares o/s (m) 204.7
Key Figures (Rs m)
Y/e March FY13 FY14E FY15E
Net Sa les 61,552 68,394 75,089
EBITDA 9,226 11,011 12,840
Margin (%) 15.0 16.1 17.1
PAT 6,535 7,700 9,367
EPS (Rs ) 31.9 37.6 45.7
Growth (%) 0.1 17.8 21.6
RoE (%) 23.6 24.3 24.9
PE (x) 26.5 22.5 18.5
P / BV (x) 5.9 5.1 4.2
EV / E (x) 19.8 17.0 14.5

January 09, 2013 135
Oct-Dec 2013 Earnings Preview
Cipla’s Q3FY14E revenues are likely to be benefitted from incorporation of Medpro, launch of Xopenex and supply of Dymista to Meda Pharma in US. Domestic formulations would improve sequentially post negotiations with channel partners on retailers and distributors margin. Launch of first limited competition generic Xopenex would improve visibility of the company in US as it identifies entry in niche drugs to be medium to long term growth driver of the company.
Quarterly Table (Rs m)
Y/e MarchQ3
FY14E
Q3
FY13
YoY gr.
(%)
Q2
FY14
9M
FY14E
9M
FY13
YoY gr.
(%)
Net Sa les 24,773 20,307 22.0 24,632 72,482 61,300 18.2
EBITDA 5,359 4,531 18.3 5,150 15,632 16,139 (3.1)
Margin (%) 21.6 22.3 (68)bps 20.9 21.6 26.3 (476)bps
Reported PAT 3,939 3,388 16.3 3,581 12,373 12,633 (2.1)
PAT (Excl . Ex Items) 3,939 3,388 16.3 3,581 12,373 12,235 1.1
Operating Metrics
India Formulations 10,718 9,570 12.0 10,398 32,437 28,586 13.5
Exports 13,154 9,692 35.7 12,017 35,515 28,406 25.0
APIs 1,693 1,375 23.2 2,217 5,374 4,797 12.0
With full quarterly benefits of Vidaza and Dacogen, DRL’s sales to grow at 24% YoY at INR35bn and EBITDA margin to expand by 450bps in Q3FY14E. Lower growth in domestic formulations and PSAI business, however, continues to be a hangover to its valuation. We expect gain in market share in Lamictal XR and Depakote ER (due to shortage) would partially compensate lower revenues in Reclast and Propecia due to increasing competition. We beleive that the company lost business of USD20mn by not opting for Cymbalta launch while Donepezil 23mg could see additional revenue from inventory push before the end of exclusivity.
Quarterly Table (Rs m)
Y/e MarchQ3
FY14E
Q3
FY13
YoY gr.
(%)
Q2
FY14
9M
FY14E
9M
FY13
YoY gr.
(%)
Net Sa les 35,610 28,652 24.3 33,575 97,634 82,866 17.8
EBITDA 8,653 5,673 52.5 8,456 22,518 17,579 28.1
Margin (%) 24.3 19.8 450 bps 25.2 23.1 21.2 185 bps
Reported PAT 5,891 3,578 64.6 6,903 16,403 11,012 49.0
PAT (Excl . Ex Items) 5,891 3,578 64.6 6,903 16,403 11,012 49.0
Operating Metrics
India Formulations 4,249 3,718 14.3 4,207 11,949 11,079 7.9
US Formulations 14,762 9,243 59.7 13,244 38,877 26,433 47.1
Russ ia 5,681 4,380 29.7 5,516 15,686 12,388 26.6
PSAI 6,574 7,127 (7.8) 6,403 18,845 20,530 (8.2)
Cipla
Rating Accumulate
Price (Rs ) 404
Target Pri ce (Rs ) 435
M/Cap (Rs bn) 324.5
Shares o/s (m) 802.9
Key Figures (Rs m)
Y/e March FY13 FY14E FY15E
Net Sa les 82,793 95,895 109,194
EBITDA 21,979 21,672 25,333
Margin (%) 26.5 22.6 23.2
PAT 15,449 16,239 16,994
EPS (Rs ) 19.2 20.2 21.2
Growth (%) 35.0 5.1 4.7
RoE (%) 18.5 16.7 15.3
PE (x) 21.0 20.0 19.1
P / BV (x) 3.6 3.1 2.7
EV / E (x) 14.7 14.8 12.4
Dr. Reddy’s Laboratories
Rating Accumulate
Price (Rs ) 2,532
Target Pri ce (Rs ) 2,737
M/Cap (Rs bn) 430.0
Shares o/s (m) 169.8
Key Figures (Rs m)
Y/e March FY13 FY14E FY15E
Net Sa les 116,266 130,218 144,308
EBITDA 24,762 29,950 33,479
Margin (%) 21.3 23.0 23.2
PAT 16,776 26,216 29,500
EPS (Rs ) 98.8 154.4 173.7
Growth (%) 17.5 56.3 12.5
RoE (%) 25.7 32.7 30.5
PE (x) 25.6 16.4 14.6
P / BV (x) 5.9 4.9 4.1
EV / E (x) 17.7 14.6 13.0

January 09, 2013 136
Oct-Dec 2013 Earnings Preview
With increase in our estimate of revenues at US$95/quarter and robust growth of 20% in domestic formulations, we expect 15% YoY growth in core sales in Q3FY14E. Approval in Topicort and launch of Maxalt MLT and Zomig ZMT would continue to lead US generics and acuisition of brnads to maitnain growth in EU generics. Semi-reg market sales may underperform in Q3FY14E due to very high base in Q3FY13 (67% YoY gr and 35% QoQ gr). EBITDA margin is espected at 21% in Q3FY14E.
Quarterly Table (Rs m)
Y/e MarchQ3
FY14E
Q3
FY13
YoY gr.
(%)
Q2
FY14
9M
FY14E
9M
FY13
YoY gr.
(%)
Net Sa les 15,264 13,813 10.5 14,630 42,276 36,771 15.0
EBITDA 3,150 3,198 (1.5) 3,153 8,780 8,109 8.3
Margin (%) 20.6 23.2 (252)bps 21.6 20.8 22.1 (128)bps
Reported PAT 1,642 2,132 (23.0) 1,573 4,521 4,512 0.2
PAT (Excl . Ex Items) 1,642 2,132 (23.0) 1,573 4,521 4,512 0.2
Operating Metrics
Generics 7,576 5,810 30.4 7,107 20,925 16,894 23.9
US Formulations 5,795 4,365 32.8 5,579 15,843 12,596 25.8
APIs 1,213 999 21.5 1,011 3,495 3,038 15.0
Branded 7,624 7,358 3.6 7,405 21,104 19,102 10.5
India Formulations 3,969 3,307 20.0 4,177 11,431 9,545 19.8
ROW Formulations 2,083 2,620 (20.5) 1,736 5,505 5,909 (6.8)
We expect Jubilant Life’s Q3FY14E revenues to grow at 11% YoY to Rs14.5bn, led by the global growht in Life Schience Ingredients (LSI) business and stabilisation of Methylprednisolone in US generics. We expect Pharma sales to contribute 48% with older portfolio and shrinking market share in Methyl prednisolone post entry of new generics. Warnings letters in two plants of CMO to impact sales and margin In Q3FY14 and also impact prospect of listing Pharma unit in Singapore exchange. We expect corrective measure to cost operating margin by 340bpd to 17% in Q3FY14E.
Quarterly Table (Rs m)
Y/e MarchQ3
FY14E
Q3
FY13
YoY gr.
(%)
Q2
FY14
9M
FY14E
9M
FY13
YoY gr.
(%)
Net Sa les 14,619 13,064 11.9 14,356 42,551 37,689 12.9
EBITDA 2,410 2,598 (7.2) 2,709 7,482 8,099 (7.6)
Margin (%) 16.5 19.9 (340)bps 18.9 17.6 21.5 (391)bps
Reported PAT (712) 267 NA (806) (2,044) 2,198 NA
PAT (Excl . Ex Items) 639 267 NA 696 1,921 1,727 NA
Operating Metrics
Pharmaceutica ls 6,982 6,652 5.0 6,913 20,408 19,560 4.3
LSI 7,518 6,412 17.3 7,443 22,024 18,136 21.4
Glenmark Pharmaceuticals
Rating Accumulate
Price (Rs ) 514
Target Pri ce (Rs ) 590
M/Cap (Rs bn) 139.2
Shares o/s (m) 270.9
Key Figures (Rs m)
Y/e March FY13 FY14E FY15E
Net Sa les 50,123 60,176 69,335
EBITDA 10,100 12,156 15,115
Margin (%) 20.1 20.2 21.8
PAT 6,147 7,338 9,256
EPS (Rs ) 22.7 27.1 34.2
Growth (%) 33.4 19.4 26.1
RoE (%) 23.8 23.7 24.1
PE (x) 22.6 19.0 15.0
P / BV (x) 5.0 4.1 3.3
EV / E (x) 15.2 12.6 10.1
Jubilant Life Sciences
Rating Accumulate
Price (Rs ) 127
Target Pri ce (Rs ) 158
M/Cap (Rs bn) 20.3
Shares o/s (m) 159.3
Key Figures (Rs m)
Y/e March FY13 FY14E FY15E
Net Sa les 51,610 57,656 62,893
EBITDA 10,373 10,378 11,384
Margin (%) 20.1 18.0 18.1
PAT 3,824 3,269 3,685
EPS (Rs ) 24.0 20.5 23.1
Growth (%) 5.3 (14.5) 12.7
RoE (%) 16.1 12.4 12.6
PE (x) 5.3 6.2 5.5
P / BV (x) 0.8 0.7 0.7
EV / E (x) 4.2 4.2 3.8
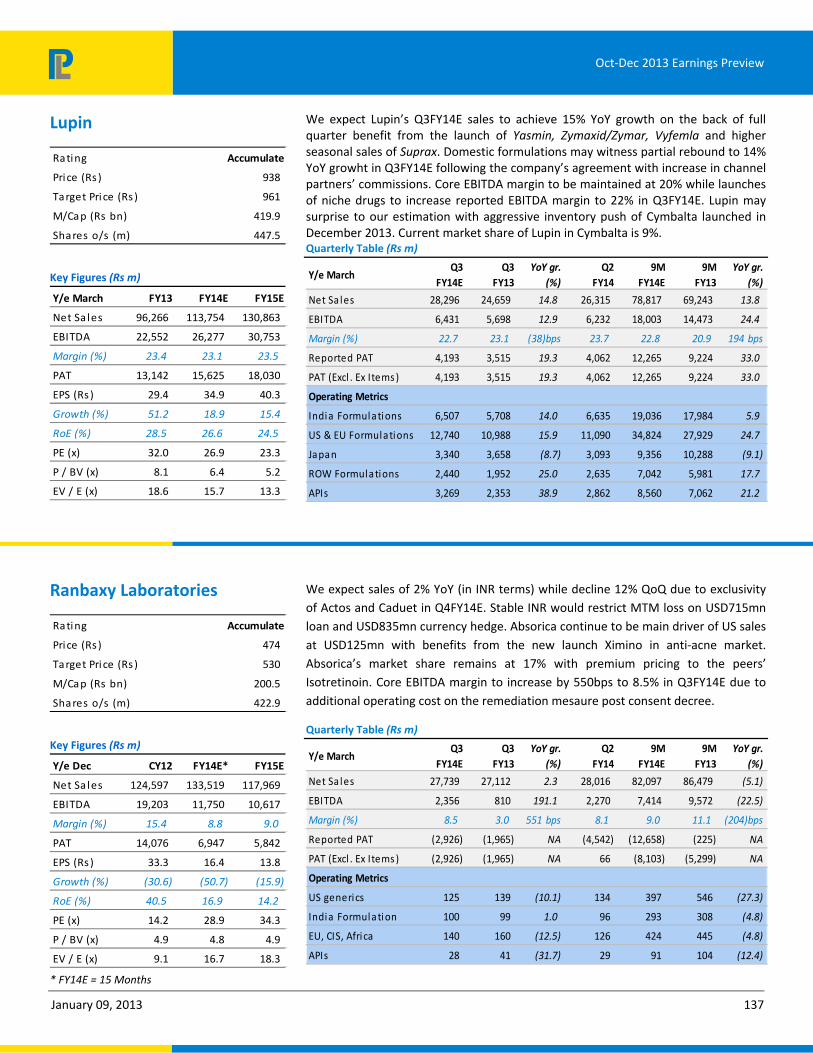
January 09, 2013 137
Oct-Dec 2013 Earnings Preview
We expect Lupin’s Q3FY14E sales to achieve 15% YoY growth on the back of full quarter benefit from the launch of Yasmin, Zymaxid/Zymar, Vyfemla and higher seasonal sales of Suprax. Domestic formulations may witness partial rebound to 14% YoY growht in Q3FY14E following the company’s agreement with increase in channel partners’ commissions. Core EBITDA margin to be maintained at 20% while launches of niche drugs to increase reported EBITDA margin to 22% in Q3FY14E. Lupin may surprise to our estimation with aggressive inventory push of Cymbalta launched in December 2013. Current market share of Lupin in Cymbalta is 9%. Quarterly Table (Rs m)
Y/e MarchQ3
FY14E
Q3
FY13
YoY gr.
(%)
Q2
FY14
9M
FY14E
9M
FY13
YoY gr.
(%)
Net Sa les 28,296 24,659 14.8 26,315 78,817 69,243 13.8
EBITDA 6,431 5,698 12.9 6,232 18,003 14,473 24.4
Margin (%) 22.7 23.1 (38)bps 23.7 22.8 20.9 194 bps
Reported PAT 4,193 3,515 19.3 4,062 12,265 9,224 33.0
PAT (Excl . Ex Items) 4,193 3,515 19.3 4,062 12,265 9,224 33.0
Operating Metrics
India Formulations 6,507 5,708 14.0 6,635 19,036 17,984 5.9
US & EU Formulations 12,740 10,988 15.9 11,090 34,824 27,929 24.7
Japan 3,340 3,658 (8.7) 3,093 9,356 10,288 (9.1)
ROW Formulations 2,440 1,952 25.0 2,635 7,042 5,981 17.7
APIs 3,269 2,353 38.9 2,862 8,560 7,062 21.2
We expect sales of 2% YoY (in INR terms) while decline 12% QoQ due to exclusivity of Actos and Caduet in Q4FY14E. Stable INR would restrict MTM loss on USD715mn loan and USD835mn currency hedge. Absorica continue to be main driver of US sales at USD125mn with benefits from the new launch Ximino in anti-acne market. Absorica’s market share remains at 17% with premium pricing to the peers’ Isotretinoin. Core EBITDA margin to increase by 550bps to 8.5% in Q3FY14E due to additional operating cost on the remediation mesaure post consent decree.
Quarterly Table (Rs m)
Y/e MarchQ3
FY14E
Q3
FY13
YoY gr.
(%)
Q2
FY14
9M
FY14E
9M
FY13
YoY gr.
(%)
Net Sa les 27,739 27,112 2.3 28,016 82,097 86,479 (5.1)
EBITDA 2,356 810 191.1 2,270 7,414 9,572 (22.5)
Margin (%) 8.5 3.0 551 bps 8.1 9.0 11.1 (204)bps
Reported PAT (2,926) (1,965) NA (4,542) (12,658) (225) NA
PAT (Excl . Ex Items) (2,926) (1,965) NA 66 (8,103) (5,299) NA
Operating Metrics
US generics 125 139 (10.1) 134 397 546 (27.3)
India Formulation 100 99 1.0 96 293 308 (4.8)
EU, CIS, Africa 140 160 (12.5) 126 424 445 (4.8)
APIs 28 41 (31.7) 29 91 104 (12.4)
Lupin
Rating Accumulate
Price (Rs ) 938
Target Pri ce (Rs ) 961
M/Cap (Rs bn) 419.9
Shares o/s (m) 447.5
Key Figures (Rs m)
Y/e March FY13 FY14E FY15E
Net Sa les 96,266 113,754 130,863
EBITDA 22,552 26,277 30,753
Margin (%) 23.4 23.1 23.5
PAT 13,142 15,625 18,030
EPS (Rs ) 29.4 34.9 40.3
Growth (%) 51.2 18.9 15.4
RoE (%) 28.5 26.6 24.5
PE (x) 32.0 26.9 23.3
P / BV (x) 8.1 6.4 5.2
EV / E (x) 18.6 15.7 13.3
Ranbaxy Laboratories
Rating Accumulate
Price (Rs ) 474
Target Pri ce (Rs ) 530
M/Cap (Rs bn) 200.5
Shares o/s (m) 422.9
Key Figures (Rs m)
Y/e Dec CY12 FY14E* FY15E
Net Sa les 124,597 133,519 117,969
EBITDA 19,203 11,750 10,617
Margin (%) 15.4 8.8 9.0
PAT 14,076 6,947 5,842
EPS (Rs ) 33.3 16.4 13.8
Growth (%) (30.6) (50.7) (15.9)
RoE (%) 40.5 16.9 14.2
PE (x) 14.2 28.9 34.3
P / BV (x) 4.9 4.8 4.9
EV / E (x) 9.1 16.7 18.3
* FY14E = 15 Months

January 09, 2013 138
Oct-Dec 2013 Earnings Preview
We expect Sun Pharma to grow at 49% YoY on the back of incorporation of DUSA and URL pharma, launch of Cymbalta, 15% growth in domestic formulations and aggressive sales of Prandin before the end of exclusivity in Q3FY14E. While loss of revenues in Topicort and Triamcinolone due to competitive intensity, we expect price rise in Desonate and Clomipramine would partially compensate revenue loss in Q3FY14E. We estimate sales of US$22m for DUSA and US$45m for URL pharma, on the back of seasonal benefits of DUSA’s anti-acne products and Doxycycline sales.
Quarterly Table (Rs m)
Y/e MarchQ3
FY14E
Q3
FY13
YoY gr.
(%)
Q2
FY14
9M
FY14E
9M
FY13
YoY gr.
(%)
Net Sa les 42,453 28,520 48.9 41,921 119,195 81,674 45.9
EBITDA 18,248 12,611 44.7 18,284 51,838 36,464 42.2
Margin (%) 43.0 44.2 (123)bps 43.6 43.5 44.6 (116)bps
Reported PAT 12,683 8,813 43.9 13,623 13,545 19,965 (32.2)
PAT (Excl . Ex Items) 12,683 8,813 43.9 13,623 38,719 25,801 50.1
Operating Metrics
Formulations 40,571 26,773 51.5 40,298 114,177 76,852 48.6
India Formulations 9,101 7,885 15.4 9,495 27,081 21,860 23.9
US Formulations 25,492 14,946 70.6 25,880 71,686 43,659 64.2
ROW Formulations 5,978 3,942 51.7 4,924 15,409 11,334 36.0
APIs 2,274 2,090 8.8 2,117 6,319 5,850 8.0
Sun Pharmaceuticals
Rating Accumulate
Price (Rs ) 601
Target Pri ce (Rs ) 646
M/Cap (Rs bn) 1,244.6
Shares o/s (m) 2,071.2
Key Figures (Rs m)
Y/e March FY13 FY14E FY15E
Net Sa les 112,999 161,328 183,470
EBITDA 48,962 70,662 80,727
Margin (%) 43.3 43.8 44.0
PAT 35,732 53,441 61,325
EPS (Rs ) 34.5 25.8 29.6
Growth (%) 31.3 (25.2) 14.8
RoE (%) 26.2 33.2 30.7
PE (x) 17.4 23.3 20.3
P / BV (x) 4.2 7.2 5.5
EV / E (x) 24.6 17.0 14.4

January 09, 2014 139
Oct-Dec 2013 Earnings Preview
Rupa Shah [email protected] +91-22-6632 2244
Top picks
None
Power
The situation in the Power segment remained stagnant QoQ in terms demand/deficit. Generation was almost 3-4% higher YoY for the months of October and November 2013. The peak power shortage in different parts of the country cooled off, especially in the Northern region. In October, the peak deficit was 3% or 3,845MW, as against 9.4% in the same month last year (2012). Peak electricity shortage in the month of November stood at 2.9% or 3,736MW, attributed to early winters.
Below are the regional deficit positions in first two months of Q3FY14E:
South registered a peak power deficit of 2.2% (738MW) and 6.8% (2,3328MW) in October and November 2013 respectively
Though negligible, West has deficit of 0.1% in October and 1.8% in November
North East deficit remained at 4.3% and 3.9% in October and November
North’s peak power shortage was at 6.3% and 1.1% in October and November
The power deficit in the East was at 1.3% during both the months
Power sector continued to experience a relatively weaker merchant tariff rate, average rate being Rs2.4/unit (2.4/unit in Q2FY14), which indicates that demand has been impacted by low slower economic activities. Capacity addition for October 2013 was 530MWs (Target: 250MWs), down from 1400MWs YoY. During November 2013, capacity addition stood at 1635MW (Target: 30MWs). Capacity addition YTD stands at 6,963MWs.
In October 2013, units generated stood at 79.4bn (down 3.7% QoQ and up 1.2% YoY growth). November saw MoM dip of 2.8% at 77.2bn units and up by 5.9% YoY. All India PLF stood at 64.1% YTD (2012-69.2% YTD). The short-term contracts comprised 11% of the generation.
Merchant Prices area wise
Areas Nov 13 Oct 13 Change. MoM
North East 2.41 2.44 ‐1%
East 2.41 2.44 ‐1%
North 2.56 2.48 3%
Punjab 2.56 2.48 3%
South-S1 3.50 4.15 ‐16%
South-S2 6.95 5.74 21%
West(W1,W2) 2.56 2.47 4%
West (W3) 2.30 2.41 ‐5%
MCP 2.78 2.71 3%
Source: CERC, PL Research

January 09, 2014 140
Oct-Dec 2013 Earnings Preview
Merchant Volumes Area Wise
BUY (MU) SELL(MU)
Nov Oct Nov Oct
North East 28.4 27.9 43.6 37.0
East 72.9 99.1 604.6 386.8
North 660.6 898.7 581.6 775.3
Punjab 305.0 349.3 0.6 0.0
West 1074.9 935.9 1098.7 1297.1
South 339.2 333.7 151.7 148.4
Source: CERC, PL Research
OTC contracts volumes‐ November
Range Mus
Less than Rs4/unit 132
More than Rs4/unit 1342
Source: CERC
Average Prices kw/hr
Months Bilateral IEX PXIL
Jun 12 4.11 4.11 4.10
Jul’12 4.03 4.51 4.54
Aug’12 4.22 3.89 3.53
Sep’12 4.37 2.98 2.34
Oct’12 4.41 4.03 3.76
Nov’12 4.43 3.62 2.89
Dec’12 4.39 3.50 3.08
Jan’13 4.42 3.65 3.66
Feb’13 4.46 2.90 2.40
Mar’13 4.48 3.68 2.76
Apr’13 4.55 3.74 2.71
May’13 4.54 2.50 3.26
June’13 4.36 2.00 2.52
July’13 4.27 2.05 2.54
Aug’13 4.15 2.07 1.89
Sep’13 4.41 2.98 2.82
Oct’13 4.00 3.00 2.00
Source: CERC
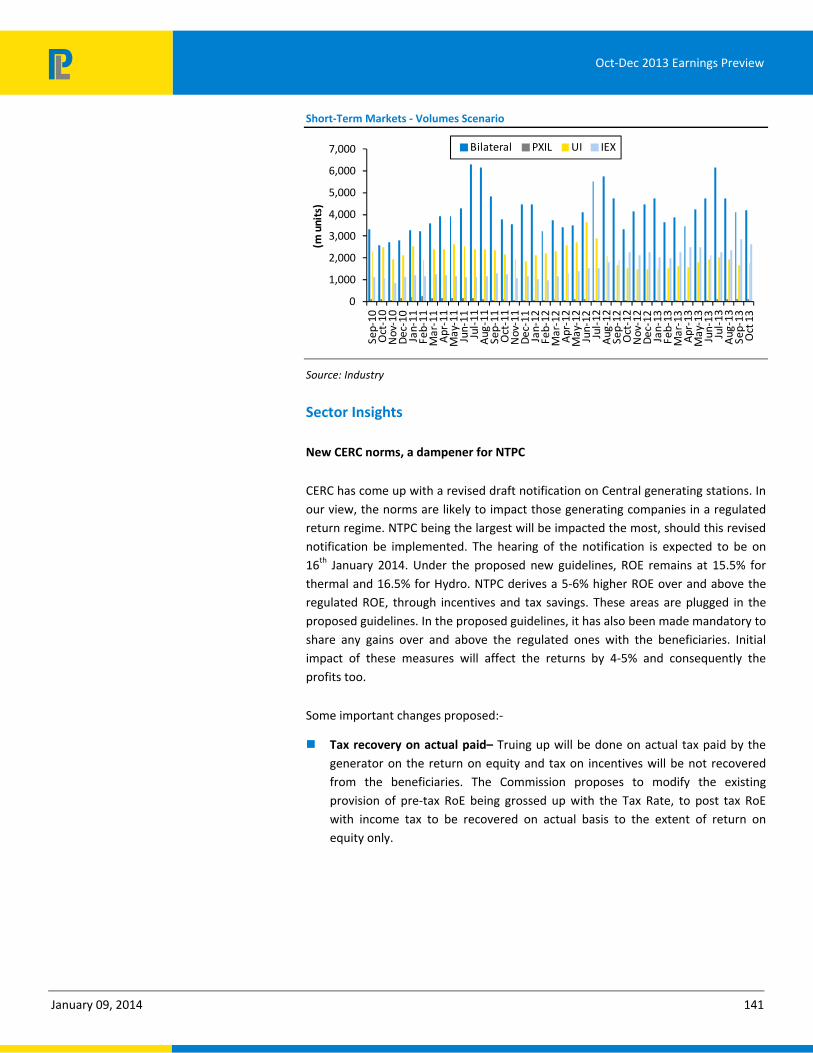
January 09, 2014 141
Oct-Dec 2013 Earnings Preview
Short‐Term Markets ‐ Volumes Scenario
0
1,000
2,000
3,000
4,000
5,000
6,000
7,000
Sep-
10O
ct-1
0N
ov-1
0D
ec-1
0Ja
n-11
Feb-
11M
ar-1
1A
pr-1
1M
ay-1
1Ju
n-11
Jul-
11A
ug-1
1Se
p-11
Oct
-11
Nov
-11
Dec
-11
Jan-
12Fe
b-12
Mar
-12
Apr
-12
May
-12
Jun-
12Ju
l-12
Aug
-12
Sep-
12O
ct-1
2N
ov-1
2D
ec-1
2Ja
n-13
Feb-
13M
ar-1
3A
pr-1
3M
ay-1
3Ju
n-13
Jul-
13A
ug-1
3Se
p-13
Oct
13
(m units)
Bilateral PXIL UI IEX
Source: Industry
Sector Insights
New CERC norms, a dampener for NTPC
CERC has come up with a revised draft notification on Central generating stations. In our view, the norms are likely to impact those generating companies in a regulated return regime. NTPC being the largest will be impacted the most, should this revised notification be implemented. The hearing of the notification is expected to be on 16th January 2014. Under the proposed new guidelines, ROE remains at 15.5% for thermal and 16.5% for Hydro. NTPC derives a 5-6% higher ROE over and above the regulated ROE, through incentives and tax savings. These areas are plugged in the proposed guidelines. In the proposed guidelines, it has also been made mandatory to share any gains over and above the regulated ones with the beneficiaries. Initial impact of these measures will affect the returns by 4-5% and consequently the profits too.
Some important changes proposed:-
Tax recovery on actual paid– Truing up will be done on actual tax paid by the generator on the return on equity and tax on incentives will be not recovered from the beneficiaries. The Commission proposes to modify the existing provision of pre-tax RoE being grossed up with the Tax Rate, to post tax RoE with income tax to be recovered on actual basis to the extent of return on equity only.

January 09, 2014 142
Oct-Dec 2013 Earnings Preview
Incentives‐ Incentives to a generating station shall be payable at a flat rate of 50 paise/kWh for ex-bus scheduled energy corresponding to scheduled generation in excess of ex-bus energy corresponding to NAPLF. Earlier the incentives were recovered on PAF of 86% and above even if the PLFs were lower. Now the recovery of incentives will be only if PLF is higher than 85%.With regard to thermal generating station, the Commission has proposed to fix the incentive rate of 50 paise/kWh and Hydro 90 paisa/kWh.
Heat Rate‐ The Commission revised the heat rate norms for 500 MW series units to 2375 kCal/kWh from the present norm of 2425 kCal/kWh.
Sharing gains‐ The financial gains by a generating company on account of controllable parameters (SHR, SFC, AUXC) shall be shared between generating company and the beneficiaries on monthly basis, in the ratio of 3:1 as per the prescribed formulae.
SEBs clear dues
UP Power Corporation (UPPCL) has cleared Rs 108bn pertaining to power purchase dues of various companies, including NTPC and private players such as Adani Power and PTC India. Major payments made by the UP discom include Rs 10bn to NTPC, Rs 8bn to Tehri Hydro Development Coproration (THDC), Rs 7.8bn to PTC India, Rs 5.5bn to PowerGrid and Rs 5bn to Adani Power.
Further, UPPCL has also cleared Rs 11bn of dues to discoms in Delhi. Tamil Nadu and Madhya Pradesh have also cleared their dues to power companies. Tamil Nadu discom has paid more than Rs 3bn in power dues to Lanco Infratech and NTPC Vidyut Vyapar Nigam, MP has cleared power purchase dues of Rs 800m. The discoms in three states of Andhra Pradesh, Jharkhand and Bihar, which owe more than Rs 70bn in dues to central generating stations like NTPC and NHPC, could also start clearing their dues once their debts are recast by lenders.
UMPPs get a breather, 2 of them to be awarded by February 2014
The Rs242bn Tamil Nadu UMPP would supply power to seven states including lead procurer Tamil Nadu (1,600 Mw). Other buyers include Karnataka (800 Mw), Andhra Pradesh (400 Mw), Kerala and Uttar Pradesh (300 Mw each) and Punjab (200 Mw). The Rs 252bn Odisha UMPP would supply power to Odisha (1,300 Mw). Other buyers include Punjab (500 Mw) and Haryana, Madhya Pradesh and Rajasthan (400 Mw each).
As many as 22 companies have submitted their bids for Odisha UMPP, including Jindal Power, CESC Ltd, Sterlite Energy, JSW Energy, Tata Power, NTPC Ltd, Torrent, Aditya Birla Power, L&T, Adani Power, GMR and GVK.

January 09, 2014 143
Oct-Dec 2013 Earnings Preview
Tariff hikes news
No tariif hike was undertaken by any SEB in Q3FY14. However Haryana's power distribution company UHBVN has not proposed any hike in power tariff for FY15 ARR; even as it has projected revenue gap of Rs22.5bn.Under the FRP scheme, the banks will fund operational deficit of the Discoms to the extent of 100% in FY13, 75% in FY14 and 50% in FY15. However, UHBVN has sought an "appropriate tariff increase" for financial year FY16 and FY17 "to meet its cash requirement" due to the repayment of the restructure and fresh loans under FRP. Earlier in the year Haryana government had decided to take over debt liabilities to the tune of Rs 81bn of its power utilities as part Centre's bailout package for discoms. With respect to distribution losses, UHBVN has projected to bring it down from 27.54 per cent in 2013-14 to 20 per cent in 2016-17.UHBVN has shown surplus in power as against the power requirement of 21,605 MU, it has shown the availability of 25,579 MU in 2014-15.
Tata Power’s UMPP tariff hike petition CERC hearing has been also postponed to mid January 2014. The company is asking for a tariff hike of Rs0.40/unit to cover its losses.
McCloskey Coal price movement
70
80
90
100
110
120
130
May
-11
Jul-
11Se
p-11
Nov
-11
Jan-
12M
ar-1
2M
ay-1
2Ju
n-12
Aug
-12
Oct
-12
Dec
-12
Feb-
13A
pr-1
3Ju
n-13
Aug
-13
Oct
-13
Dec
-13
(US$
/ Tonne)
Source: Bloomberg, PL Research
Indonesia Coal price movement
70
80
90
100
110
120
130M
ay-1
1Ju
l-11
Sep-
11N
ov-1
1Ja
n-12
Mar
-12
May
-12
Jul-
12Se
p-12
Nov
-12
Dec
-12
Feb-
13A
pr-1
3Ju
n-13
Aug
-13
Oct
-13
Dec
-13
(US$
/ Tonne)
Source: Bloomberg, PL Research
Stock Performance
1M 3M 6M 12M 1M 3M 6M 12M
GMR Infra s tructure 7.3 0.9 28.8 8.6 8.6 (2.8) 21.5 3.6
La nco Infra te ch 20.7 35.8 16.4 (44.4) 22.0 32.1 9.2 (49.4)
NHPC 3.8 (0.5) 1.9 (24.0) 5.1 (4.3) (5.4) (29.0)
NTPC (13.0) (10.3) (6.8) (16.9) (11.8) (14.0) (14.1) (21.9)
PTC Indi a (3.1) 20.5 24.8 (21.4) (1.8) 16.7 17.5 (26.4)
Re l i a nce Infra s tructure (6.6) 1.6 11.1 (27.8) (5.3) (2.1) 3.8 (32.8)
Re l i a nce Powe r (8.0) (2.2) (3.4) (28.7) (6.7) (5.9) (10.7) (33.7)
SJVN (1.9) 9.4 3.2 (0.5) (0.6) 5.7 (4.1) (5.5)
Ta ta Powe r (8.4) (3.7) (4.7) (26.0) (7.1) (7.4) (12.0) (31.0)
Absolute Relative to Sensex
Source: Bloomberg, PL Research
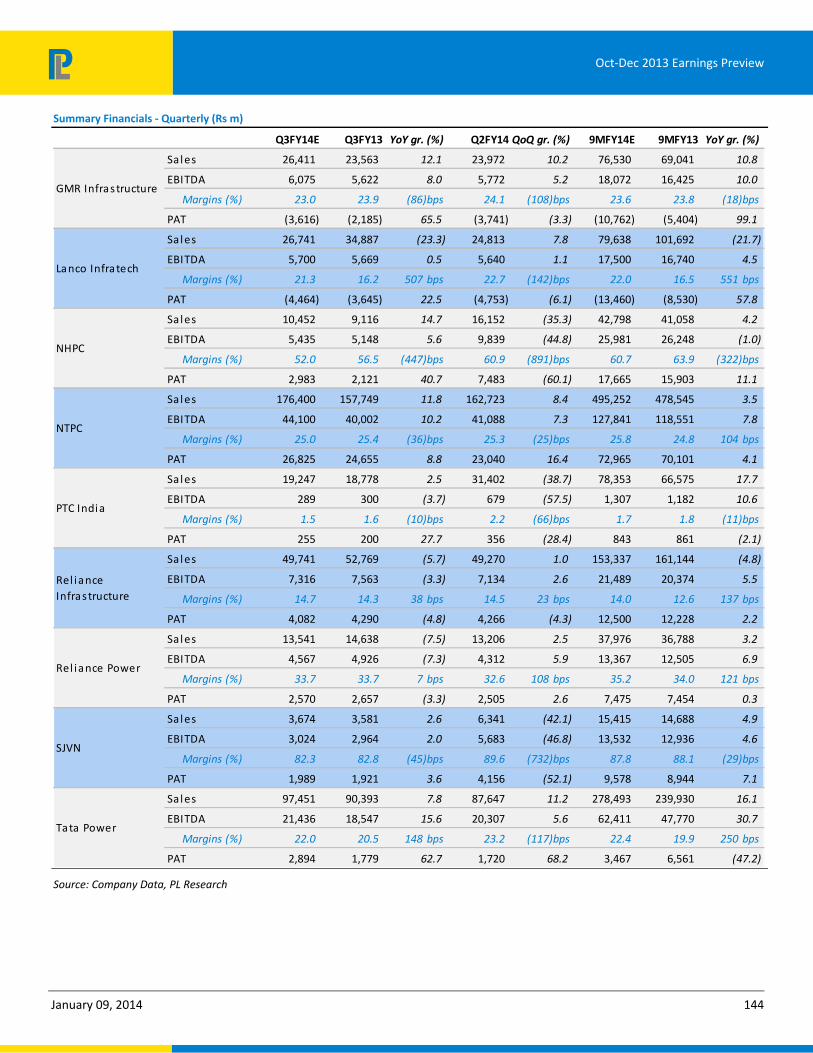
January 09, 2014 144
Oct-Dec 2013 Earnings Preview
Summary Financials ‐ Quarterly (Rs m)
Q3FY14E Q3FY13 YoY gr. (%) Q2FY14 QoQ gr. (%) 9MFY14E 9MFY13 YoY gr. (%)
Sales 26,411 23,563 12.1 23,972 10.2 76,530 69,041 10.8
EBITDA 6,075 5,622 8.0 5,772 5.2 18,072 16,425 10.0
Margins (%) 23.0 23.9 (86)bps 24.1 (108)bps 23.6 23.8 (18)bps
PAT (3,616) (2,185) 65.5 (3,741) (3.3) (10,762) (5,404) 99.1
Sales 26,741 34,887 (23.3) 24,813 7.8 79,638 101,692 (21.7)
EBITDA 5,700 5,669 0.5 5,640 1.1 17,500 16,740 4.5
Margins (%) 21.3 16.2 507 bps 22.7 (142)bps 22.0 16.5 551 bps
PAT (4,464) (3,645) 22.5 (4,753) (6.1) (13,460) (8,530) 57.8
Sales 10,452 9,116 14.7 16,152 (35.3) 42,798 41,058 4.2
EBITDA 5,435 5,148 5.6 9,839 (44.8) 25,981 26,248 (1.0)
Margins (%) 52.0 56.5 (447)bps 60.9 (891)bps 60.7 63.9 (322)bps
PAT 2,983 2,121 40.7 7,483 (60.1) 17,665 15,903 11.1
Sales 176,400 157,749 11.8 162,723 8.4 495,252 478,545 3.5
EBITDA 44,100 40,002 10.2 41,088 7.3 127,841 118,551 7.8
Margins (%) 25.0 25.4 (36)bps 25.3 (25)bps 25.8 24.8 104 bps
PAT 26,825 24,655 8.8 23,040 16.4 72,965 70,101 4.1
Sales 19,247 18,778 2.5 31,402 (38.7) 78,353 66,575 17.7
EBITDA 289 300 (3.7) 679 (57.5) 1,307 1,182 10.6
Margins (%) 1.5 1.6 (10)bps 2.2 (66)bps 1.7 1.8 (11)bps
PAT 255 200 27.7 356 (28.4) 843 861 (2.1)
Sales 49,741 52,769 (5.7) 49,270 1.0 153,337 161,144 (4.8)
EBITDA 7,316 7,563 (3.3) 7,134 2.6 21,489 20,374 5.5
Margins (%) 14.7 14.3 38 bps 14.5 23 bps 14.0 12.6 137 bps
PAT 4,082 4,290 (4.8) 4,266 (4.3) 12,500 12,228 2.2
Sales 13,541 14,638 (7.5) 13,206 2.5 37,976 36,788 3.2
EBITDA 4,567 4,926 (7.3) 4,312 5.9 13,367 12,505 6.9
Margins (%) 33.7 33.7 7 bps 32.6 108 bps 35.2 34.0 121 bps
PAT 2,570 2,657 (3.3) 2,505 2.6 7,475 7,454 0.3
Sales 3,674 3,581 2.6 6,341 (42.1) 15,415 14,688 4.9
EBITDA 3,024 2,964 2.0 5,683 (46.8) 13,532 12,936 4.6
Margins (%) 82.3 82.8 (45)bps 89.6 (732)bps 87.8 88.1 (29)bps
PAT 1,989 1,921 3.6 4,156 (52.1) 9,578 8,944 7.1
Sales 97,451 90,393 7.8 87,647 11.2 278,493 239,930 16.1
EBITDA 21,436 18,547 15.6 20,307 5.6 62,411 47,770 30.7
Margins (%) 22.0 20.5 148 bps 23.2 (117)bps 22.4 19.9 250 bps
PAT 2,894 1,779 62.7 1,720 68.2 3,467 6,561 (47.2)
Tata Power
Rel iance Power
SJVN
Rel iance Infrastructure
GMR Infrastructure
Lanco Infratech
NHPC
NTPC
PTC India
Source: Company Data, PL Research

January 09, 2014 145
Oct-Dec 2013 Earnings Preview
Consolidated Sectoral Data
Quarterly Table (Rs m)
Oct‐Dec'13 Oct‐Dec'12 YoY gr. (%) Jul‐Sep'13 QoQ gr. (%)
Net Sa les 423,658 405,474 4.5 415,525 2.0
EBITDA 97,941 90,742 7.9 100,453 (2.5)
Margin (%) 23.1 22.4 74 bps 24.2 (106)bps
PAT (Excl . Ex Items) 33,519 31,791 5.4 35,033 (4.3)
Note: Revenue, EBITDA and PAT numbers are arrived by totaling corresponding numbers of all companies under our coverage in this
sector.
Kamalanga TPP’s second unit got operational in November 2013. The company has entered into a MOU with IFC to develop 600MW hydro power plant in Nepal. Divestment plan met with some success in quarter also where the company divested its 40% stake in Istanbul Sabiha Gokcen airport and received Rs20bn for the same.
Quarterly Table (Rs m)
Y/e MarchQ3
FY14E
Q3
FY13
YoY gr.
(%)
Q2
FY14
9M
FY14E
9M
FY13
YoY gr.
(%)
Net Sales 26,411 23,563 12.1 23,972 76,530 69,041 10.8
EBITDA 6,075 5,622 8.0 5,772 18,072 16,425 10.0
Margin (%) 23.0 23.9 (86)bps 24.1 23.6 23.8 (18)bps
Reported PAT (3,616) (2,185) NA (3,931) (10,952) (4,921) NA
PAT (Excl. Ex Items) (3,616) (2,185) NA (3,741) (10,762) (5,404) NA
Operating Metrics
Airports (Rs m) 15,412 15,985 (3.6) 14,750 30,162 16,785 79.7
Power (Rs m) 3,874 5,206 (25.6) 6,636 10,510 12,307 (14.6)
Debt (Rs bn) 430 416 3.4 444 430 416 3.4
Int. as a % to sales 25.1 22.3 281 bps 28.5 20.8 19.8 100 bps
Key Figures (Rs m)
2013 2014E 2015E
Net Sales 1,652,077 1,718,818 2,023,481
Growth (%) 12.8 4.0 17.7
EBITDA 380,657 421,120 515,502
Margin (%) 23.0 24.5 25.5
PAT 141,906 145,939 191,190
Growth (%) 0.5 2.8 31.0
GMR Infrastructure
Ra ting Accumulate
Price (Rs ) 23
Ta rget Price (Rs ) 27
M/Ca p (Rs bn) 88.7
Sha res o/s (m) 3,892.1
Key Figures (Rs m)
Y/e March FY13 FY14E FY15E
Net Sa l es 98,719 107,196 154,525
EBITDA 23,952 23,715 35,892
Margin (%) 24.3 22.1 23.2
PAT (5,697) (12,449) 1,117
EPS (Rs ) (1.5) (3.2) 0.3
Growth (%) (22.3) 118.5 (109.0)
RoE (%) (6.8) (16.5) 1.9
PE (x) (15.6) (7.1) 79.5
P / BV (x) 1.0 1.5 1.5
EV / E (x) 18.0 18.9 11.8
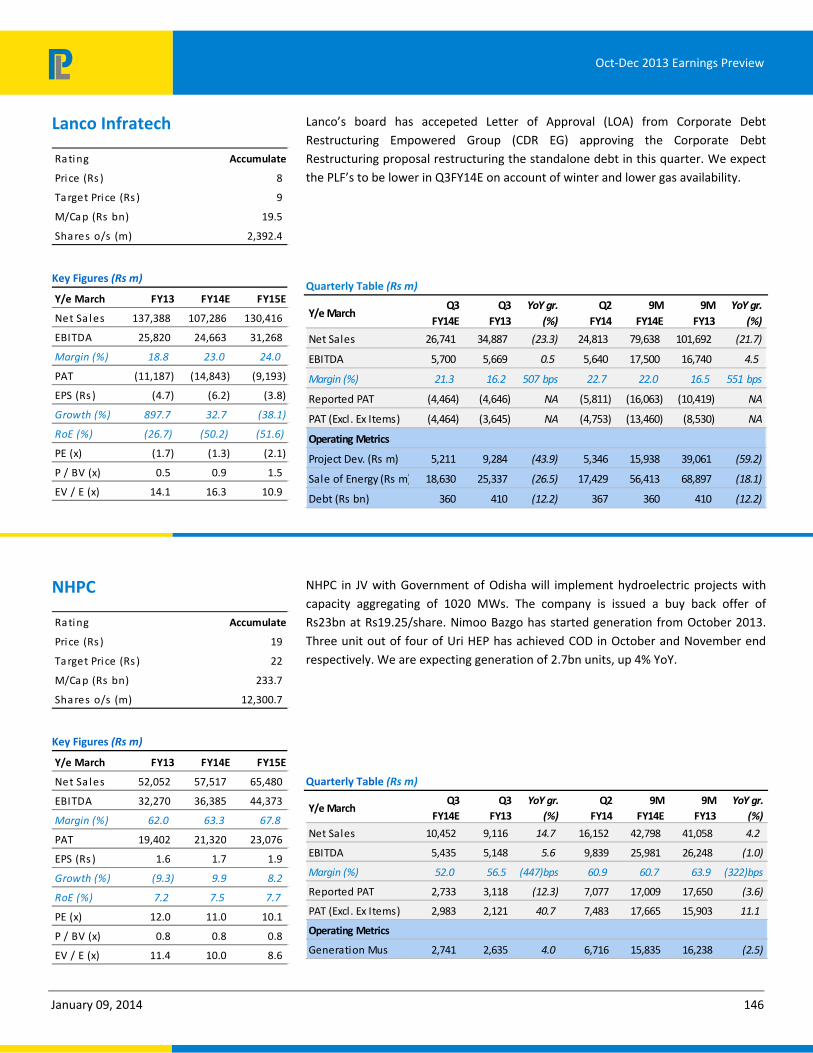
January 09, 2014 146
Oct-Dec 2013 Earnings Preview
Lanco’s board has accepeted Letter of Approval (LOA) from Corporate Debt Restructuring Empowered Group (CDR EG) approving the Corporate Debt Restructuring proposal restructuring the standalone debt in this quarter. We expect the PLF’s to be lower in Q3FY14E on account of winter and lower gas availability.
Quarterly Table (Rs m)
Y/e MarchQ3
FY14E
Q3
FY13
YoY gr.
(%)
Q2
FY14
9M
FY14E
9M
FY13
YoY gr.
(%)
Net Sales 26,741 34,887 (23.3) 24,813 79,638 101,692 (21.7)
EBITDA 5,700 5,669 0.5 5,640 17,500 16,740 4.5
Margin (%) 21.3 16.2 507 bps 22.7 22.0 16.5 551 bps
Reported PAT (4,464) (4,646) NA (5,811) (16,063) (10,419) NA
PAT (Excl. Ex Items) (4,464) (3,645) NA (4,753) (13,460) (8,530) NA
Operating Metrics
Project Dev. (Rs m) 5,211 9,284 (43.9) 5,346 15,938 39,061 (59.2)
Sale of Energy (Rs m) 18,630 25,337 (26.5) 17,429 56,413 68,897 (18.1)
Debt (Rs bn) 360 410 (12.2) 367 360 410 (12.2)
NHPC in JV with Government of Odisha will implement hydroelectric projects with capacity aggregating of 1020 MWs. The company is issued a buy back offer of Rs23bn at Rs19.25/share. Nimoo Bazgo has started generation from October 2013. Three unit out of four of Uri HEP has achieved COD in October and November end respectively. We are expecting generation of 2.7bn units, up 4% YoY.
Quarterly Table (Rs m)
Y/e MarchQ3
FY14E
Q3
FY13
YoY gr.
(%)
Q2
FY14
9M
FY14E
9M
FY13
YoY gr.
(%)
Net Sales 10,452 9,116 14.7 16,152 42,798 41,058 4.2
EBITDA 5,435 5,148 5.6 9,839 25,981 26,248 (1.0)
Margin (%) 52.0 56.5 (447)bps 60.9 60.7 63.9 (322)bps
Reported PAT 2,733 3,118 (12.3) 7,077 17,009 17,650 (3.6)
PAT (Excl. Ex Items) 2,983 2,121 40.7 7,483 17,665 15,903 11.1
Operating Metrics
Generation Mus 2,741 2,635 4.0 6,716 15,835 16,238 (2.5)
Lanco Infratech
Ra ting Accumulate
Price (Rs ) 8
Ta rget Price (Rs ) 9
M/Ca p (Rs bn) 19.5
Sha res o/s (m) 2,392.4
Key Figures (Rs m)
Y/e March FY13 FY14E FY15E
Net Sa l es 137,388 107,286 130,416
EBITDA 25,820 24,663 31,268
Margin (%) 18.8 23.0 24.0
PAT (11,187) (14,843) (9,193)
EPS (Rs ) (4.7) (6.2) (3.8)
Growth (%) 897.7 32.7 (38.1)
RoE (%) (26.7) (50.2) (51.6)
PE (x) (1.7) (1.3) (2.1)
P / BV (x) 0.5 0.9 1.5
EV / E (x) 14.1 16.3 10.9
NHPC
Ra ting Accumulate
Price (Rs ) 19
Ta rget Price (Rs ) 22
M/Ca p (Rs bn) 233.7
Sha res o/s (m) 12,300.7
Key Figures (Rs m)
Y/e March FY13 FY14E FY15E
Net Sa l es 52,052 57,517 65,480
EBITDA 32,270 36,385 44,373
Margin (%) 62.0 63.3 67.8
PAT 19,402 21,320 23,076
EPS (Rs ) 1.6 1.7 1.9
Growth (%) (9.3) 9.9 8.2
RoE (%) 7.2 7.5 7.7
PE (x) 12.0 11.0 10.1
P / BV (x) 0.8 0.8 0.8
EV / E (x) 11.4 10.0 8.6
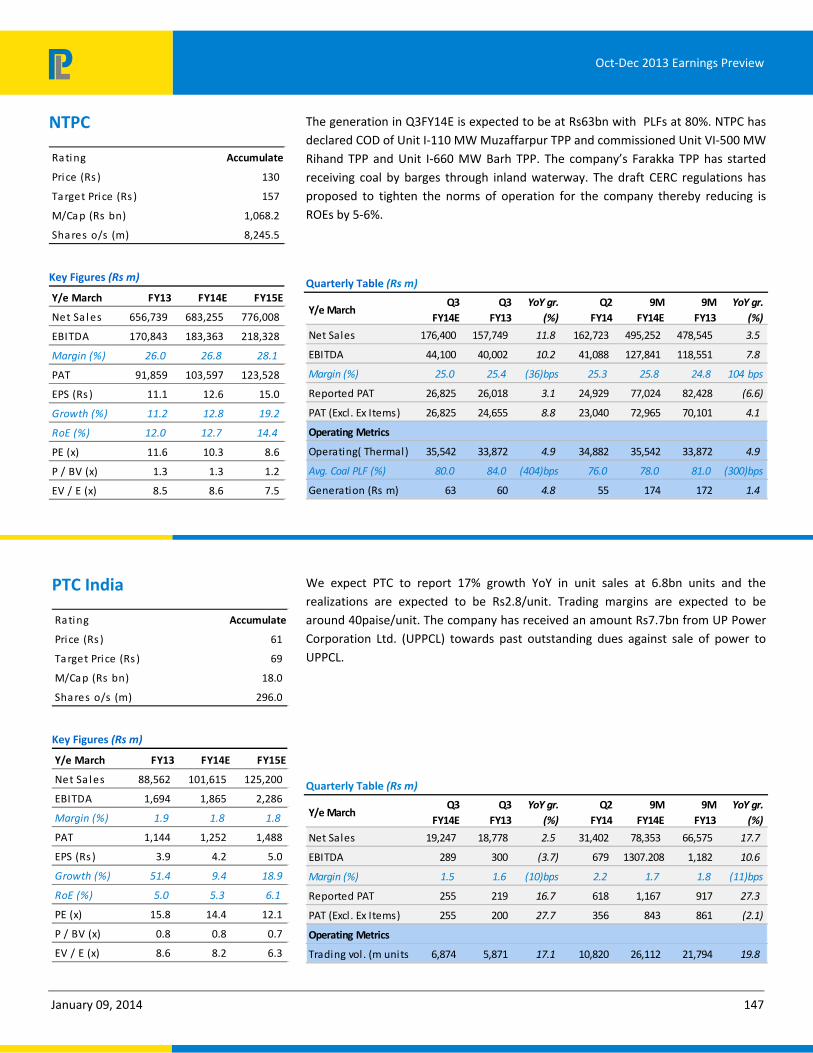
January 09, 2014 147
Oct-Dec 2013 Earnings Preview
The generation in Q3FY14E is expected to be at Rs63bn with PLFs at 80%. NTPC has declared COD of Unit I-110 MW Muzaffarpur TPP and commissioned Unit VI-500 MW Rihand TPP and Unit I-660 MW Barh TPP. The company’s Farakka TPP has started receiving coal by barges through inland waterway. The draft CERC regulations has proposed to tighten the norms of operation for the company thereby reducing is ROEs by 5-6%.
Quarterly Table (Rs m)
Y/e MarchQ3
FY14E
Q3
FY13
YoY gr.
(%)
Q2
FY14
9M
FY14E
9M
FY13
YoY gr.
(%)
Net Sales 176,400 157,749 11.8 162,723 495,252 478,545 3.5
EBITDA 44,100 40,002 10.2 41,088 127,841 118,551 7.8
Margin (%) 25.0 25.4 (36)bps 25.3 25.8 24.8 104 bps
Reported PAT 26,825 26,018 3.1 24,929 77,024 82,428 (6.6)
PAT (Excl. Ex Items) 26,825 24,655 8.8 23,040 72,965 70,101 4.1
Operating Metrics
Operating( Thermal) 35,542 33,872 4.9 34,882 35,542 33,872 4.9
Avg. Coal PLF (%) 80.0 84.0 (404)bps 76.0 78.0 81.0 (300)bps
Generation (Rs m) 63 60 4.8 55 174 172 1.4
We expect PTC to report 17% growth YoY in unit sales at 6.8bn units and the realizations are expected to be Rs2.8/unit. Trading margins are expected to be around 40paise/unit. The company has received an amount Rs7.7bn from UP Power Corporation Ltd. (UPPCL) towards past outstanding dues against sale of power to UPPCL.
Quarterly Table (Rs m)
Y/e MarchQ3
FY14E
Q3
FY13
YoY gr.
(%)
Q2
FY14
9M
FY14E
9M
FY13
YoY gr.
(%)
Net Sales 19,247 18,778 2.5 31,402 78,353 66,575 17.7
EBITDA 289 300 (3.7) 679 1307.208 1,182 10.6
Margin (%) 1.5 1.6 (10)bps 2.2 1.7 1.8 (11)bps
Reported PAT 255 219 16.7 618 1,167 917 27.3
PAT (Excl. Ex Items) 255 200 27.7 356 843 861 (2.1)
Operating Metrics
Trading vol. (m units 6,874 5,871 17.1 10,820 26,112 21,794 19.8
NTPC
Rating Accumulate
Price (Rs ) 130
Target Price (Rs ) 157
M/Cap (Rs bn) 1,068.2
Shares o/s (m) 8,245.5
Key Figures (Rs m)
Y/e March FY13 FY14E FY15E
Net Sa l es 656,739 683,255 776,008
EBITDA 170,843 183,363 218,328
Margin (%) 26.0 26.8 28.1
PAT 91,859 103,597 123,528
EPS (Rs ) 11.1 12.6 15.0
Growth (%) 11.2 12.8 19.2
RoE (%) 12.0 12.7 14.4
PE (x) 11.6 10.3 8.6
P / BV (x) 1.3 1.3 1.2
EV / E (x) 8.5 8.6 7.5
PTC India
Rating Accumulate
Price (Rs ) 61
Target Price (Rs ) 69
M/Cap (Rs bn) 18.0
Shares o/s (m) 296.0
Key Figures (Rs m)
Y/e March FY13 FY14E FY15E
Net Sa l es 88,562 101,615 125,200
EBITDA 1,694 1,865 2,286
Margin (%) 1.9 1.8 1.8
PAT 1,144 1,252 1,488
EPS (Rs ) 3.9 4.2 5.0
Growth (%) 51.4 9.4 18.9
RoE (%) 5.0 5.3 6.1
PE (x) 15.8 14.4 12.1
P / BV (x) 0.8 0.8 0.7
EV / E (x) 8.6 8.2 6.3

January 09, 2014 148
Oct-Dec 2013 Earnings Preview
RInfra’s 5mtpa cement capacity is has commissioned in October 2013. In November 2013 the company’s transmission SPV commissioned the 7th line in Maharashtra ahead of schedule. We expect EPC revenues to fall 32% YoY. Power sales will be hgher by 7.8% on account of tariff increses. The company has proposed to raise funds through NCD/FCCB to the extend of Rs25bn.
Quarterly Table (Rs m)
Y/e MarchQ3
FY14E
Q3
FY13
YoY gr.
(%)
Q2
FY14
9M
FY14E
9M
FY13
YoY gr.
(%)
Net Sales 49,741 52,769 (5.7) 49,270 153,337 161,144 (4.8)
EBITDA 7,316 7,563 (3.3) 7,134 21,489 20,374 5.5
Margin (%) 14.7 14.3 38 bps 14.5 14.0 12.6 137 bps
Reported PAT 4,082 7,279 (43.9) 4,266 12,500 15,217 (17.9)
PAT (Excl. Ex Items) 4,082 4,290 (4.8) 4,266 12,500 12,228 2.2
Operating Metrics
Electricity (Rs m) 35,589 33,016 7.8 35,252 106,872 102,148 4.6
EPC (Rs m) 12,411 18,410 (32.6) 12,790 41,897 55,130 (24.0)
Debt (Rs bn) 240 248 (3.2) 239 240 248 (3.2)
RPower has started generation of Unit 2-660 MW of Sasan Ultra Mega Power Project in December 2013. The company has also started with pre-commissioning activities of 100 MW CSP Project in Rajasthan.We are expecting a 65% growth in generation YoY.
Quarterly Table (Rs m)
Y/e MarchQ3
FY14E
Q3
FY13
YoY gr.
(%)
Q2
FY14
9M
FY14E
9M
FY13
YoY gr.
(%)
Net Sales 13,541 14,638 (7.5) 13,206 37,976 36,788 3.2
EBITDA 4,567 4,926 (7.3) 4,312 13,367 12,505 6.9
Margin (%) 33.7 33.7 7 bps 32.6 35.2 34.0 121 bps
Reported PAT 2,570 2,657 (3.3) 2,505 7,475 7,454 0.3
PAT (Excl. Ex Items) 2,570 2,657 (3.3) 2,505 7,475 7,454 0.3
Operating Metrics
Units Sold (m) 3,987 2,407 65.6 3,900 9,687 6,114 58.4
Reliance Infrastructure
Rating Accumulate
Price (Rs ) 410
Target Price (Rs ) 467
M/Cap (Rs bn) 107.7
Shares o/s (m) 263.0
Key Figures (Rs m)
Y/e March FY13 FY14E FY15E
Net Sa l es 222,276 212,805 248,215
EBITDA 28,117 35,485 42,665
Margin (%) 12.6 16.7 17.2
PAT 17,199 18,747 19,786
EPS (Rs ) 65.4 71.3 75.2
Growth (%) 18.9 9.0 5.5
RoE (%) 6.8 6.9 6.8
PE (x) 6.3 5.7 5.4
P / BV (x) 0.4 0.4 0.4
EV / E (x) 12.2 10.6 9.1
Reliance Power
Rating Accumulate
Price (Rs ) 69
Target Price (Rs ) 79
M/Cap (Rs bn) 193.1
Shares o/s (m) 2,805.1
Key Figures (Rs m)
Y/e March FY13 FY14E FY15E
Net Sa l es 49,266 52,096 74,641
EBITDA 17,129 19,705 34,124
Margin (%) 34.8 37.8 45.7
PAT 10,114 10,513 10,881
EPS (Rs ) 3.6 3.7 3.9
Growth (%) 16.7 3.9 3.5
RoE (%) 5.6 5.5 5.4
PE (x) 19.1 18.4 17.7
P / BV (x) 1.0 1.0 0.9
EV / E (x) 25.8 26.6 17.9

January 09, 2014 149
Oct-Dec 2013 Earnings Preview
The company’s 412MWs ( Unit 1) Rampur HEP has not commissioned in Q3FY14. The schedule commissioning of the first unit is in last week of January 2014. We are expecting generation of 1bn units in Q3FY14E, up by 8.5% YoY.
Quarterly Table (Rs m)
Y/e MarchQ3
FY14E
Q3
FY13
YoY gr.
(%)
Q2
FY14
9M
FY14E
9M
FY13
YoY gr.
(%)
Net Sales 3,674 3,581 2.6 6,341 15415 14,688 4.9
EBITDA 3,024 2,964 2.0 5,683 13531.8 12,936 4.6
Margin (%) 82.3 82.8 (45)bps 89.6 87.8 88.1 (29)bps
Reported PAT 1,989 1,921 3.6 4,156 9578 8,944 7.1
PAT (Excl. Ex Items) 1,989 1,921 3.6 4,156 9578 8,944 7.1
Operating Metrics
Units Sold Mus 1,000 922 8.4 3,165 6,494 5,105 27.2
Capacity MWs 1,500 1,500 0.0 1,500 1,500 1,500 0.0
Coal realisations have improved by 3.2% QoQ and flat YoY on an overall basis. Coal volumes are expected to remain flat YoY at 20mt. The company has signed MoU with Government of Vietnam for developing the Long Phu 2 HEP. The company’s UMPP lost 7 days of operation as its coal handling plant caiught fire in November 2013.
Quarterly Table (Rs m)
Y/e MarchQ3
FY14E
Q3
FY13
YoY gr.
(%)
Q2
FY14
9M
FY14E
9M
FY13
YoY gr.
(%)
Net Sales 97,451 90,393 7.8 87,647 278,493 239,930 16.1
EBITDA 21,436 18,547 15.6 20,307 62,411 47,770 30.7
Margin (%) 22.0 20.5 148 bps 23.2 22.4 19.9 250 bps
Reported PAT 2,894 (3,289) NA 793 2,540 (2,668) NA
PAT (Excl. Ex Items) 2,894 1,779 62.7 1,720 3,467 6,561 (47.2)
Operating Metrics
Units Sold Mus 3,641 3,998 (8.9) 3,762 11,539 12,460 (7.4)
Units Generated Mus 3,510 3,873 (9.4) 3,404 10,884 12,404 (12.3)
Avg Real. Rs/pu 5.3 5.0 6.0 5.2 5.2 4.9 6.1
Coal Sales (MTPA) 20.0 20.7 (3.4) 19.0 59.0 52.4 12.6
SJVN
Rating Accumulate
Price (Rs ) 21
Target Price (Rs ) 22
M/Cap (Rs bn) 86.5
Shares o/s (m) 4,136.6
Key Figures (Rs m)
Y/e March FY13 FY14E FY15E
Net Sa l es 16,821 19,300 23,821
EBITDA 14,508 16,717 21,130
Margin (%) 86.2 86.6 88.7
PAT 10,523 11,167 12,148
EPS (Rs ) 2.5 2.7 2.9
Growth (%) (2.7) 6.1 8.8
RoE (%) 13.0 12.8 12.8
PE (x) 8.2 7.7 7.1
P / BV (x) 1.0 0.9 0.9
EV / E (x) 6.2 5.0 4.2
Tata Power
Rating Accumulate
Price (Rs ) 81
Target Price (Rs ) 88
M/Cap (Rs bn) 192.2
Shares o/s (m) 2,373.3
Key Figures (Rs m)
Y/e March FY13 FY14E FY15E
Net Sa l es 330,254 377,747 425,175
EBITDA 66,323 79,222 85,436
Margin (%) 20.1 21.0 20.1
PAT 8,548 6,635 8,360
EPS (Rs ) 3.6 2.8 3.5
Growth (%) (22.3) (22.4) 26.0
RoE (%) 6.5 5.2 6.6
PE (x) 22.5 29.0 23.0
P / BV (x) 1.5 1.5 1.5
EV / E (x) 8.0 7.3 6.8

Oct-Dec 2013 Earnings Preview
January 09, 2014 150
Others Stock Performance
1M 3M 6M 12M 1M 3M 6M 12M
Zee Enterta inment 4.7 17.7 17.8 27.3 6.0 14.0 10.5 22.3
Absolute Relative to Sensex
Source: Company Data, PL Research
Summary Financials ‐ Quarterly (Rs m)
Q3FY14E Q3FY13 YoY gr. (%) Q2FY14 QoQ gr. (%) 9MFY14E 9MFY13 YoY gr. (%)
Sales 11,032 9,389 17.5 11,013 0.2 31,778 27,353 16.2
EBITDA 2,736 2,612 4.8 3,105 (11.9) 8,756 7,121 23.0
Margins (%) 24.8 27.8 (302)bps 28.2 (339)bps 27.6 26.0 152 bps
PAT 2,023 1,941 4.3 2,243 (9.8) 6,513 5,399 20.6
Zee Enterta inment
Source: Company Data, PL Research
Consolidated Sectoral Data
Quarterly Table (Rs m)
Oct‐Dec'13 Oct‐Dec'12 YoY gr. (%) Jul‐Sep'13 QoQ gr. (%)
Net Sa les 11,032 9,389 17.5 11,013 0.2
EBITDA 2,736 2,612 4.8 3,105 (11.9)
Margin (%) 24.8 27.8 (302)bps 28.2 (339)bps
PAT (Excl . Ex Items) 2,023 1,941 4.3 2,243 (9.8)
Note: Revenue, EBITDA and PAT numbers are arrived by totaling corresponding numbers of all companies under our coverage in this
sector.
Key Figures (Rs m)
2013 2014E 2015E
Net Sa les 36,996 43,243 49,376
Growth (%) 21.7 16.9 14.2
EBITDA 9,543 11,334 14,093
Margin (%) 25.8 26.2 28.5
PAT 7,196 8,554 10,518
Growth (%) 22.2 18.9 23.0
PE (x) 37.8 31.8 25.9

Oct-Dec 2013 Earnings Preview
January 09, 2014 151
We expect ad growth to remain strong at 20.0% YoY driven by strengthening of network ratings, increase in ad rates and India-SA series telecasted during the quarter. However, on the margins side we expect EBITDA margin decline of 300bps YoY due to new channel launches and telecast of India related cricket series during the quarter. We expect PAT at Rs2.0bn, 4.3% YoY with EPS of Rs2.1.
Quarterly Table (Rs m)
Y/e MarchQ3
FY14E
Q3
FY13
YoY gr.
(%)
Q2
FY14
9M
FY14E
9M
FY13
YoY gr.
(%)
Net Sa les 11,032 9,389 17.5 11,013 31,778 27,353 16.2
EBITDA 2,736 2,612 4.8 3,105 8,756 7,121 23.0
Margin (%) 24.8 27.8 (302)bps 28.2 27.6 26.0 152 bps
Reported PAT 2,023 1,941 4.3 2,243 6,513 5,399 20.6
PAT (Excl . Ex Items) 2,023 1,941 4.3 2,243 6,513 5,399 20.6
Zee Entertainment
Rating BUY
Price (Rs ) 285
Target Pri ce (Rs ) 330
M/Cap (Rs bn) 272.1
Shares o/s (m) 954.0
Key Figures (Rs m)
Y/e March FY13 FY14E FY15E
Net Sa les 36,996 43,243 49,376
EBITDA 9,543 11,334 14,093
Margin (%) 25.8 26.2 28.5
PAT 7,196 8,554 10,518
EPS (Rs ) 7.5 9.0 11.0
Growth (%) 22.8 18.9 23.0
RoE (%) 19.6 20.4 21.9
PE (x) 37.8 31.8 25.9
P / BV (x) 7.0 6.1 5.3
EV / E (x) 28.0 23.2 18.4

Oct-Dec 2013 Earnings Preview
January 09, 2013 152
Annexure
Auto
Nifty: Company & Sector Valuations
Wgt (%)
Mcap (Rs m)
No. of Shares (m)
CMP (Rs)
PAT (Rs m) EPS (Rs) PER (x)
2012 2013 2014 2015 2012 2013 2014 2015 2012 2013 2014 2015
1 Bajaj Auto 1.3% 555,093 289.4 1,918 31,375 29,116 34,598 39,230 108.4 100.6 119.6 135.6 17.7 19.1 16.0 14.1
Growth (%) 20.1 (7.2) 18.8 13.4 20.1 (7.2) 18.8 13.4
2 Hero Honda Motors 1.2% 412,285 199.7 2,065 23,782 21,100 21,902 30,168 119.1 105.7 109.7 151.1 17.3 19.5 18.8 13.7
Growth (%) 18.5 (11.3) 3.8 37.7 18.5 (11.3) 3.8 37.7
3 Mahindra & Mahindra 2.1% 559,600 615.9 909 27,706 32,622 37,420 41,160 42.3 49.8 57.2 62.9 17.6 14.9 13.0 11.8
Growth (%) 11.3 17.7 14.7 10.0 11.3 17.7 14.7 10.0
4 Maruti Suzuki India 1.1% 555,072 302.1 1,838 16,352 23,921 28,658 35,324 56.6 79.2 94.9 116.9 32.5 23.2 19.4 15.7
Growth (%) (30.5) 46.3 19.8 23.3 (30.5) 39.9 19.8 23.3
5 Tata Motors 3.3% 1,089,487 2,942.6 370 128,668 105,517 129,966 165,567 40.5 31.6 39.0 49.6 9.1 11.7 9.5 7.5
Growth (%) 42.3 (18.0) 23.2 27.4 43.0 (22.0) 23.2 27.4
Total 9.0% 3,171,537 4,349.6 227,884 212,275 252,543 311,450 13.9 14.9 12.6 10.2
Growth (%) 23.1 (6.8) 19.0 23.3
Source: Company Data, Bloomberg, PL Research
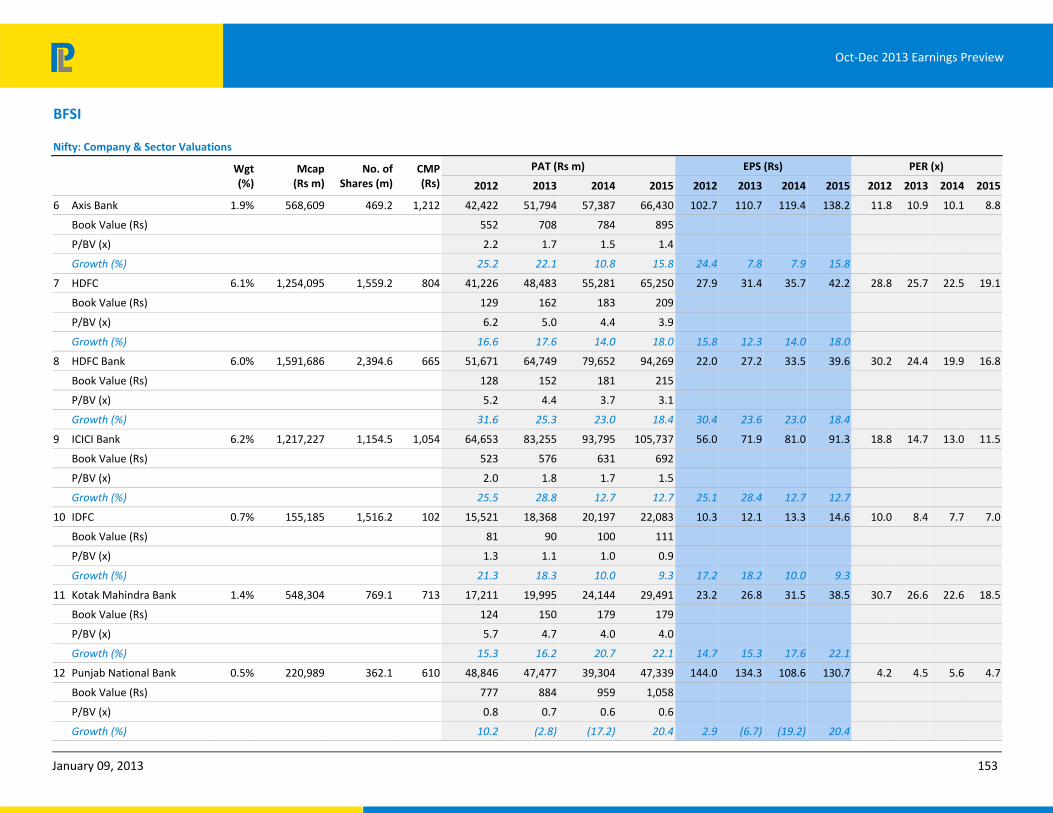
Oct-Dec 2013 Earnings Preview
January 09, 2013 153
BFSI
Nifty: Company & Sector Valuations
Wgt (%)
Mcap (Rs m)
No. of Shares (m)
CMP (Rs)
PAT (Rs m) EPS (Rs) PER (x)
2012 2013 2014 2015 2012 2013 2014 2015 2012 2013 2014 2015
6 Axis Bank 1.9% 568,609 469.2 1,212 42,422 51,794 57,387 66,430 102.7 110.7 119.4 138.2 11.8 10.9 10.1 8.8
Book Value (Rs) 552 708 784 895
P/BV (x) 2.2 1.7 1.5 1.4
Growth (%) 25.2 22.1 10.8 15.8 24.4 7.8 7.9 15.8
7 HDFC 6.1% 1,254,095 1,559.2 804 41,226 48,483 55,281 65,250 27.9 31.4 35.7 42.2 28.8 25.7 22.5 19.1
Book Value (Rs) 129 162 183 209
P/BV (x) 6.2 5.0 4.4 3.9
Growth (%) 16.6 17.6 14.0 18.0 15.8 12.3 14.0 18.0
8 HDFC Bank 6.0% 1,591,686 2,394.6 665 51,671 64,749 79,652 94,269 22.0 27.2 33.5 39.6 30.2 24.4 19.9 16.8
Book Value (Rs) 128 152 181 215
P/BV (x) 5.2 4.4 3.7 3.1
Growth (%) 31.6 25.3 23.0 18.4 30.4 23.6 23.0 18.4
9 ICICI Bank 6.2% 1,217,227 1,154.5 1,054 64,653 83,255 93,795 105,737 56.0 71.9 81.0 91.3 18.8 14.7 13.0 11.5
Book Value (Rs) 523 576 631 692
P/BV (x) 2.0 1.8 1.7 1.5
Growth (%) 25.5 28.8 12.7 12.7 25.1 28.4 12.7 12.7
10 IDFC 0.7% 155,185 1,516.2 102 15,521 18,368 20,197 22,083 10.3 12.1 13.3 14.6 10.0 8.4 7.7 7.0
Book Value (Rs) 81 90 100 111
P/BV (x) 1.3 1.1 1.0 0.9
Growth (%) 21.3 18.3 10.0 9.3 17.2 18.2 10.0 9.3
11 Kotak Mahindra Bank 1.4% 548,304 769.1 713 17,211 19,995 24,144 29,491 23.2 26.8 31.5 38.5 30.7 26.6 22.6 18.5
Book Value (Rs) 124 150 179 179
P/BV (x) 5.7 4.7 4.0 4.0
Growth (%) 15.3 16.2 20.7 22.1 14.7 15.3 17.6 22.1
12 Punjab National Bank 0.5% 220,989 362.1 610 48,846 47,477 39,304 47,339 144.0 134.3 108.6 130.7 4.2 4.5 5.6 4.7
Book Value (Rs) 777 884 959 1,058
P/BV (x) 0.8 0.7 0.6 0.6
Growth (%) 10.2 (2.8) (17.2) 20.4 2.9 (6.7) (19.2) 20.4
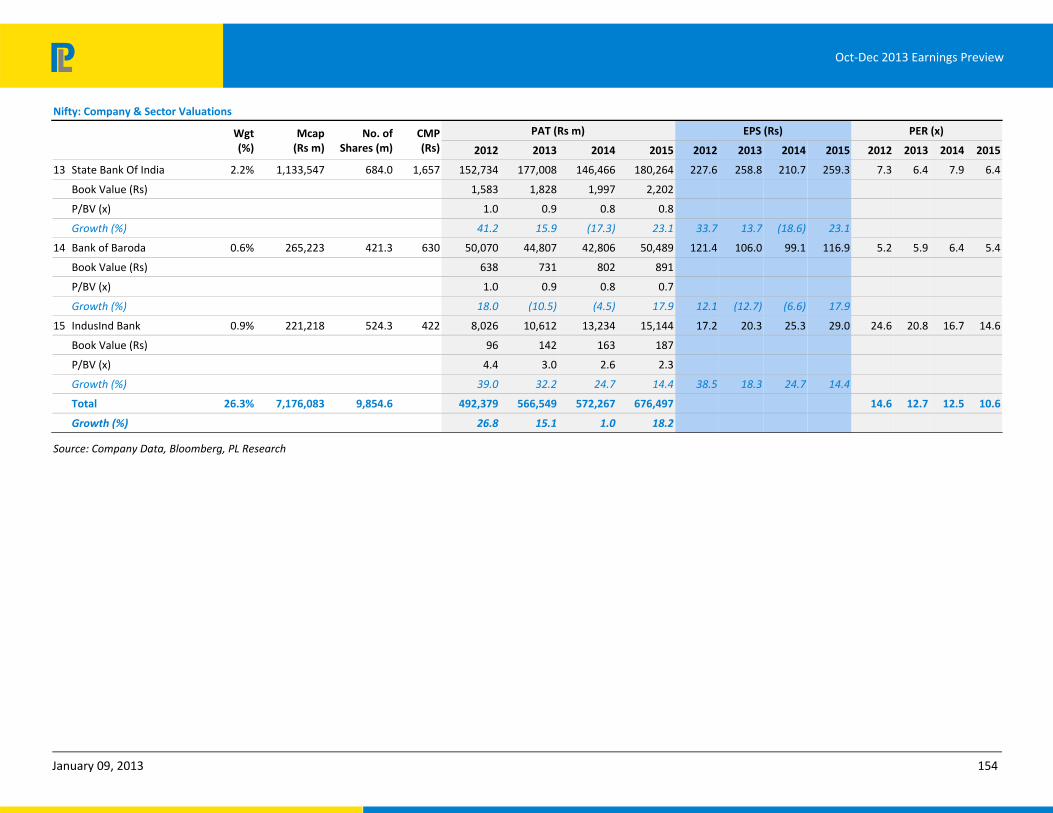
Oct-Dec 2013 Earnings Preview
January 09, 2013 154
Nifty: Company & Sector Valuations
Wgt (%)
Mcap (Rs m)
No. of Shares (m)
CMP (Rs)
PAT (Rs m) EPS (Rs) PER (x)
2012 2013 2014 2015 2012 2013 2014 2015 2012 2013 2014 2015
13 State Bank Of India 2.2% 1,133,547 684.0 1,657 152,734 177,008 146,466 180,264 227.6 258.8 210.7 259.3 7.3 6.4 7.9 6.4
Book Value (Rs) 1,583 1,828 1,997 2,202
P/BV (x) 1.0 0.9 0.8 0.8
Growth (%) 41.2 15.9 (17.3) 23.1 33.7 13.7 (18.6) 23.1
14 Bank of Baroda 0.6% 265,223 421.3 630 50,070 44,807 42,806 50,489 121.4 106.0 99.1 116.9 5.2 5.9 6.4 5.4
Book Value (Rs) 638 731 802 891
P/BV (x) 1.0 0.9 0.8 0.7
Growth (%) 18.0 (10.5) (4.5) 17.9 12.1 (12.7) (6.6) 17.9
15 IndusInd Bank 0.9% 221,218 524.3 422 8,026 10,612 13,234 15,144 17.2 20.3 25.3 29.0 24.6 20.8 16.7 14.6
Book Value (Rs) 96 142 163 187
P/BV (x) 4.4 3.0 2.6 2.3
Growth (%) 39.0 32.2 24.7 14.4 38.5 18.3 24.7 14.4
Total 26.3% 7,176,083 9,854.6 492,379 566,549 572,267 676,497 14.6 12.7 12.5 10.6
Growth (%) 26.8 15.1 1.0 18.2
Source: Company Data, Bloomberg, PL Research
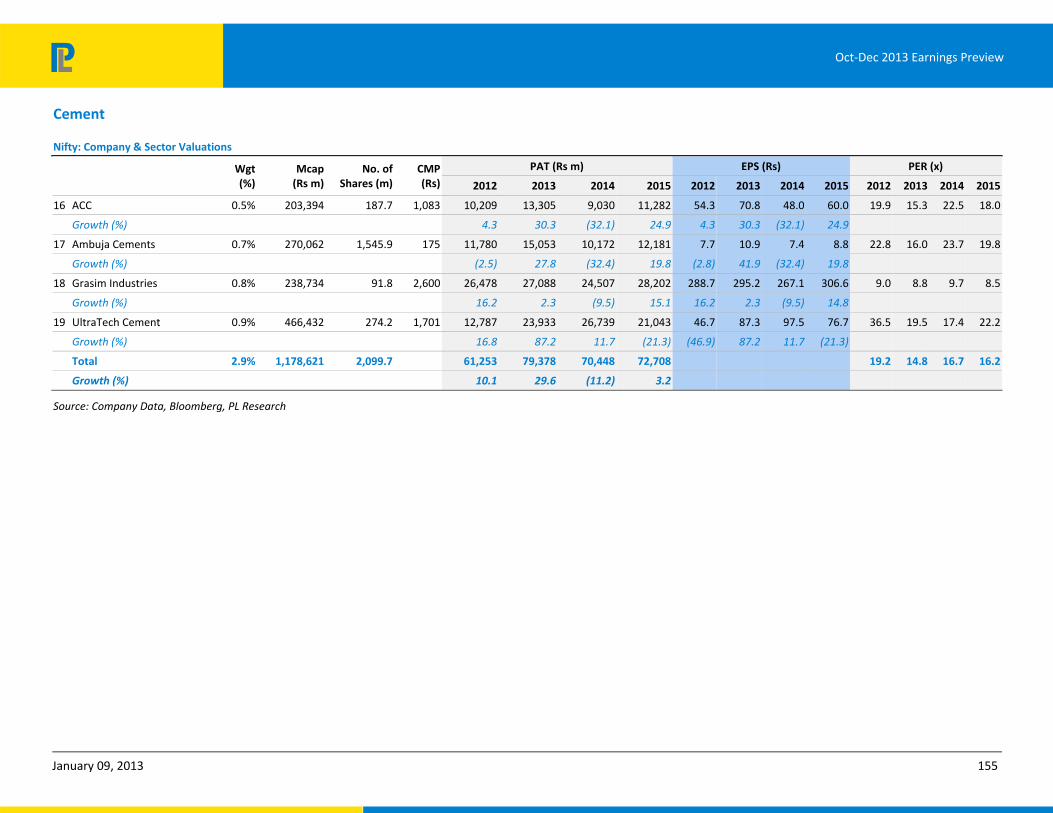
Oct-Dec 2013 Earnings Preview
January 09, 2013 155
Cement
Nifty: Company & Sector Valuations
Wgt (%)
Mcap (Rs m)
No. of Shares (m)
CMP (Rs)
PAT (Rs m) EPS (Rs) PER (x)
2012 2013 2014 2015 2012 2013 2014 2015 2012 2013 2014 2015
16 ACC 0.5% 203,394 187.7 1,083 10,209 13,305 9,030 11,282 54.3 70.8 48.0 60.0 19.9 15.3 22.5 18.0
Growth (%) 4.3 30.3 (32.1) 24.9 4.3 30.3 (32.1) 24.9
17 Ambuja Cements 0.7% 270,062 1,545.9 175 11,780 15,053 10,172 12,181 7.7 10.9 7.4 8.8 22.8 16.0 23.7 19.8
Growth (%) (2.5) 27.8 (32.4) 19.8 (2.8) 41.9 (32.4) 19.8
18 Grasim Industries 0.8% 238,734 91.8 2,600 26,478 27,088 24,507 28,202 288.7 295.2 267.1 306.6 9.0 8.8 9.7 8.5
Growth (%) 16.2 2.3 (9.5) 15.1 16.2 2.3 (9.5) 14.8
19 UltraTech Cement 0.9% 466,432 274.2 1,701 12,787 23,933 26,739 21,043 46.7 87.3 97.5 76.7 36.5 19.5 17.4 22.2
Growth (%) 16.8 87.2 11.7 (21.3) (46.9) 87.2 11.7 (21.3)
Total 2.9% 1,178,621 2,099.7 61,253 79,378 70,448 72,708 19.2 14.8 16.7 16.2
Growth (%) 10.1 29.6 (11.2) 3.2
Source: Company Data, Bloomberg, PL Research
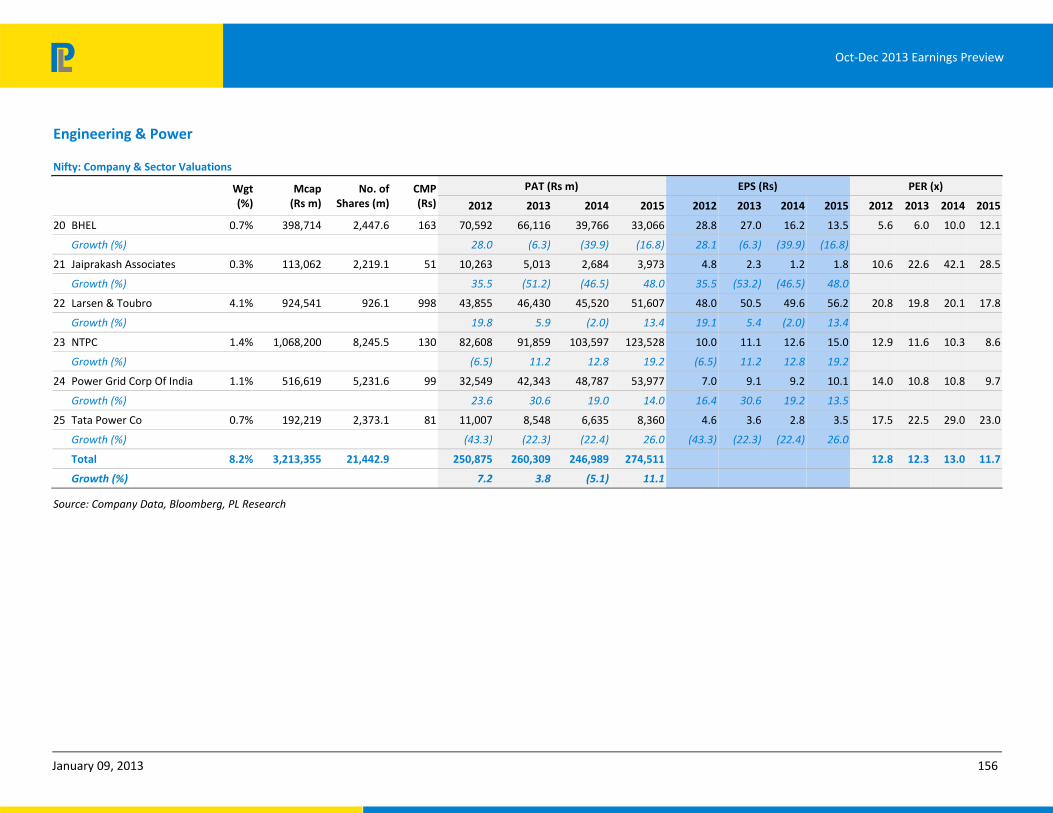
Oct-Dec 2013 Earnings Preview
January 09, 2013 156
Engineering & Power
Nifty: Company & Sector Valuations
Wgt (%)
Mcap (Rs m)
No. of Shares (m)
CMP (Rs)
PAT (Rs m) EPS (Rs) PER (x)
2012 2013 2014 2015 2012 2013 2014 2015 2012 2013 2014 2015
20 BHEL 0.7% 398,714 2,447.6 163 70,592 66,116 39,766 33,066 28.8 27.0 16.2 13.5 5.6 6.0 10.0 12.1
Growth (%) 28.0 (6.3) (39.9) (16.8) 28.1 (6.3) (39.9) (16.8)
21 Jaiprakash Associates 0.3% 113,062 2,219.1 51 10,263 5,013 2,684 3,973 4.8 2.3 1.2 1.8 10.6 22.6 42.1 28.5
Growth (%) 35.5 (51.2) (46.5) 48.0 35.5 (53.2) (46.5) 48.0
22 Larsen & Toubro 4.1% 924,541 926.1 998 43,855 46,430 45,520 51,607 48.0 50.5 49.6 56.2 20.8 19.8 20.1 17.8
Growth (%) 19.8 5.9 (2.0) 13.4 19.1 5.4 (2.0) 13.4
23 NTPC 1.4% 1,068,200 8,245.5 130 82,608 91,859 103,597 123,528 10.0 11.1 12.6 15.0 12.9 11.6 10.3 8.6
Growth (%) (6.5) 11.2 12.8 19.2 (6.5) 11.2 12.8 19.2
24 Power Grid Corp Of India 1.1% 516,619 5,231.6 99 32,549 42,343 48,787 53,977 7.0 9.1 9.2 10.1 14.0 10.8 10.8 9.7
Growth (%) 23.6 30.6 19.0 14.0 16.4 30.6 19.2 13.5
25 Tata Power Co 0.7% 192,219 2,373.1 81 11,007 8,548 6,635 8,360 4.6 3.6 2.8 3.5 17.5 22.5 29.0 23.0
Growth (%) (43.3) (22.3) (22.4) 26.0 (43.3) (22.3) (22.4) 26.0
Total 8.2% 3,213,355 21,442.9 250,875 260,309 246,989 274,511 12.8 12.3 13.0 11.7
Growth (%) 7.2 3.8 (5.1) 11.1
Source: Company Data, Bloomberg, PL Research

Oct-Dec 2013 Earnings Preview
January 09, 2013 157
FMCG
Nifty: Company & Sector Valuations
Wgt (%)
Mcap (Rs m)
No. of Shares (m)
CMP (Rs)
PAT (Rs m) EPS (Rs) PER (x)
2012 2013 2014 2015 2012 2013 2014 2015 2012 2013 2014 2015
26 Hindustan Unilever 1.9% 1,209,235 2,162.6 559 25,725 33,144 35,677 40,651 11.9 15.3 16.5 18.8 47.0 36.5 33.9 29.7
Growth (%) 18.4 28.8 7.6 13.9 18.3 28.8 7.6 13.9
27 ITC 8.6% 2,514,362 7,935.5 317 61,624 74,184 86,344 105,482 7.9 9.4 10.8 13.1 40.2 33.7 29.3 24.1
Growth (%) 23.1 20.4 16.4 22.2 21.9 19.1 15.4 21.3
28 Asian Paints 1.1% 470,486 959.2 491 9,887 11,139 13,012 15,819 10.3 11.6 13.6 16.5 47.6 42.2 36.2 29.7
Growth (%) 17.3 12.7 16.8 21.6 17.3 12.7 16.8 21.6
Total 11.6% 4,194,083 10,098.1 97,236 118,467 135,033 161,952 43.1 35.4 31.1 25.9
Growth (%) 35.5 21.8 14.0 19.9
Source: Company Data, Bloomberg, PL Research
Metals
Nifty: Company & Sector Valuations
Wgt (%)
Mcap (Rs m)
No. of Shares (m)
CMP (Rs)
PAT (Rs m) EPS (Rs) PER (x)
2012 2013 2014 2015 2012 2013 2014 2015 2012 2013 2014 2015
29 Hindalco Industries 0.8% 237,943 2,064.6 115 33,970 30,269 24,860 29,015 17.7 15.8 12.3 14.2 6.5 7.3 9.4 8.1
Growth (%) 38.3 (10.9) (17.9) 16.7 38.2 (10.9) (22.3) 15.8
30 Jindal Steel & Power 0.5% 241,517 934.8 258 40,585 34,842 23,133 27,439 43.4 37.3 24.7 29.4 6.0 6.9 10.4 8.8
Growth (%) 8.1 (14.2) (33.6) 18.6 8.0 (14.2) (33.6) 18.6
31 Sesa Sterlite 1.2% 567,735 2,964.7 192 26,955 22,803 70,117 88,939 31.0 26.2 23.7 30.1 6.2 7.3 8.1 6.4
Growth (%) (36.2) (15.4) 207.5 26.8 (36.9) (15.4) (9.7) 27.0
32 Tata Steel 1.3% 381,105 971.2 392 20,279 3,323 50,983 48,251 20.9 3.4 52.5 49.7 18.8 114.7 7.5 7.9
Growth (%) (65.8) (83.6) 1,434.4 (5.4) (66.3) (83.6) 1,434.4 (5.4)
33 Coal India 0.9% 1,824,166 6,316.4 289 147,209 179,742 162,119 184,282 23.3 28.5 25.7 29.2 12.4 10.1 11.3 9.9
Growth (%) 35.1 22.1 (9.8) 13.7 35.1 22.1 (9.8) 13.7
34 NMDC 0.5% 550,699 3,964.7 139 72,654 63,424 61,658 65,873 18.3 16.0 15.6 16.6 7.6 8.7 8.9 8.4
Growth (%) 11.8 (12.7) (2.8) 6.8 11.8 (12.7) (2.8) 6.8
Total 5.2% 3,803,166 17,216 341,651 334,402 392,870 443,800 11.1 11.4 9.7 8.6
Growth (%) 1.2 (2.1) 17.5 13.0
Source: Company Data, Bloomberg, PL Research

Oct-Dec 2013 Earnings Preview
January 09, 2013 158
Oil & Gas
Nifty: Company & Sector Valuations
Wgt (%)
Mcap (Rs m)
No. of Shares (m)
CMP (Rs)
PAT (Rs m) EPS (Rs) PER (x)
2012 2013 2014 2015 2012 2013 2014 2015 2012 2013 2014 2015
35 BPCL 0.4% 229,615 723.1 318 7,808 18,808 19,681 22,236 10.8 26.0 27.8 31.8 29.4 12.2 11.4 10.0
Growth (%) (52.2) 140.9 4.6 13.0 (52.2) 140.8 7.0 14.4
36 Cairn India 0.9% 625,787 1,910.8 328 79,377 120,564 117,433 111,470 41.7 63.2 61.5 58.3 7.9 5.2 5.3 5.6
Growth (%) 25.3 51.9 (2.6) (5.1) 25.0 51.4 (2.7) (5.2)
37 Gail India 0.8% 438,830 1,268.5 346 44,436 43,736 45,036 46,377 35.0 34.5 34.8 36.0 9.9 10.0 9.9 9.6
Growth (%) 10.5 (1.6) 3.0 3.0 10.5 (1.6) 1.0 3.5
38 ONGC 2.4% 2,337,360 8,555.5 273 281,436 242,196 259,524 317,143 32.9 28.3 30.3 37.3 8.3 9.7 9.0 7.3
Growth (%) 25.3 (13.9) 7.2 22.2 25.3 (13.9) 7.0 23.2
39 Reliance Industries 7.1% 2,743,489 3,231.2 849 197,240 208,790 223,270 258,395 66.1 70.8 71.4 82.0 12.8 12.0 11.9 10.3
Growth (%) 2.2 5.9 6.9 15.7 2.1 7.1 0.9 14.8
Total 11.7% 6,375,081 15,689.1 610,298 634,095 664,945 755,620 10.4 10.1 9.6 8.4
Growth (%) 13.6 3.9 4.9 13.6
Source: Company Data, Bloomberg, PL Research

Oct-Dec 2013 Earnings Preview
January 09, 2013 159
Pharma
Nifty: Company & Sector Valuations
Wgt (%)
Mcap (Rs m)
No. of Shares (m)
CMP (Rs)
PAT (Rs m) EPS (Rs) PER (x)
2012 2013 2014 2015 2012 2013 2014 2015 2012 2013 2014 2015
40 Cipla 1.0% 324,541 802.9 404 11,442 15,449 16,239 16,994 14.3 19.2 20.2 21.2 28.4 21.0 20.0 19.1
Growth (%) 15.6 35.0 1.4 16.0 15.6 35.0 1.7 16.7
41 Dr. Reddy's 1.6% 430,552 170.0 2,532 14,262 16,776 26,216 29,500 84.1 98.8 154.4 173.7 30.1 25.6 16.4 14.6
Growth (%) 30.2 29.0 20.9 14.2 30.0 28.7 20.4 14.2
42 Ranbaxy Laboratories 0.3% 200,854 423.7 474 20,228 14,076 6,947 5,842 47.9 33.3 16.4 13.8 9.9 14.2 28.9 34.3
Growth (%) (466.6) (70.1) 399.6 (19.7) (466.1) (61.5) 231.1 (7.2)
43 Sun Pharma 2.1% 1,244,525 2,071.1 601 27,211 35,732 53,441 61,325 26.3 34.5 25.8 29.6 22.9 17.4 23.3 20.3
Growth (%) 46.3 12.3 62.2 18.4 46.3 12.3 58.8 19.9
44 Lupin 1.1% 420,593 448.2 938 8,677 13,142 16,791 20,073 19.4 29.4 37.3 44.9 48.3 31.9 25.1 20.9
Growth (%) 0.6 51.5 27.8 19.5 0.4 51.2 27.1 20.3
Total 6.1% 2,621,065 3,916.0 81,820 95,174 119,634 133,734 32.0 27.5 21.9 19.6
Growth (%) 44.3 16.3 25.7 11.8
Source: Company Data, Bloomberg, PL Research
Real Estate
Nifty: Company & Sector Valuations
Wgt (%)
Mcap (Rs m)
No. of Shares (m)
CMP (Rs)
PAT (Rs m) EPS (Rs) PER (x)
2012 2013 2014 2015 2012 2013 2014 2015 2012 2013 2014 2015
45 DLF 0.4% 288,680 1,781.4 162 12,263 7,624 10,070 14,236 7.2 4.5 5.7 8.0 22.4 36.1 28.6 20.2
Growth (%) (20.5) (37.8) 32.1 41.4 (20.5) (37.8) 26.4 41.4
Total 0.4% 288,680 1,781.4 12,263 7,624 10,070 14,236 23.5 37.9 28.7 20.3
Growth (%) (20.5) (37.8) 32.1 41.4
Source: Company Data, Bloomberg, PL Research

Oct-Dec 2013 Earnings Preview
January 09, 2013 160
Technology
Nifty: Company & Sector Valuations
Wgt (%)
Mcap (Rs m)
No. of Shares (m)
CMP (Rs)
PAT (Rs m) EPS (Rs) PER (x)
2012 2013 2014 2015 2012 2013 2014 2015 2012 2013 2014 2015
46 HCL Technologies 1.6% 871,016 698.8 1,246 17,099 25,260 40,984 60,838 24.8 36.4 59.1 87.8 50.2 34.2 21.1 14.2
Growth (%) 31.5 47.7 62.2 48.4 28.0 46.7 62.2 48.4
47 Infosys Technologies 8.0% 1,968,539 574.2 3,428 83,160 94,210 102,679 122,874 145.4 164.7 179.5 214.8 23.6 20.8 19.1 16.0
Growth (%) 21.9 13.3 9.0 19.7 21.9 13.3 9.0 19.7
48 TCS 5.4% 4,373,154 1,958.7 2,233 106,996 140,122 195,995 224,566 54.7 71.6 100.1 114.7 40.8 31.2 22.3 19.5
Growth (%) 21.5 31.0 39.9 14.6 21.5 31.0 39.9 14.6
49 Wipro 1.8% 1,349,006 2,465.5 547 52,568 61,684 78,688 92,479 21.4 25.0 31.9 37.5 25.6 21.8 17.1 14.6
Growth (%) (0.8) 17.3 27.6 17.5 (1.0) 17.1 27.6 17.5
Total 16.8% 8,561,714 5,697.3 259,823 321,276 418,345 500,757 33.0 26.6 20.5 17.1
Growth (%) 16.9 23.7 30.2 19.7
Source: Company Data, Bloomberg, PL Research
Telecom
Nifty: Company & Sector Valuations
Wgt (%)
Mcap (Rs m)
No. of Shares (m)
CMP (Rs)
PAT (Rs m) EPS (Rs) PER (x)
2012 2013 2014 2015 2012 2013 2014 2015 2012 2013 2014 2015
50 Bharti Airtel 1.9% 1,328,736 3,997.4 332 42,594 22,757 37,630 63,478 11.2 6.0 9.5 16.0 29.6 55.4 34.9 20.8
Growth (%) (29.6) (46.6) 65.4 68.7 (29.6) (46.6) 58.7 68.2
Total 1.9% 1,328,736 3,997.4 42,594 22,757 37,630 63,478 31.2 58.4 35.3 20.9
Growth (%) (29.6) (46.6) 65.4 68.7
Source: Company Data, Bloomberg, PL Research
Total Nifty
Nifty: Company & Sector Valuations
Wgt (%)
Mcap (Rs m)
No. of Shares (m)
CMP (Rs)
PAT (Rs m) EPS (Rs) PER (x)
2010 2011 2012 2013 2010 2011 2012 2013 2010 2011 2012 2013
Grand Total* 100.0% 41,912,122 6,745.6 2,478,076 2,652,305 2,920,775 3,408,743 394.5 393.2 433.0 505.3 15.7 15.7 14.3 12.2
Growth (%) 14.5 7.0 10.1 16.7 14.6 (0.3) 10.1 16.7
Source: Company Data, Bloomberg, PL Research * Not based on Free Float Note: Telecom Nos. are Bloomberg Consensus / Sector Weightages are updated as on December 31, 2013

Oct-Dec 2013 Earnings Preview
January 09, 2014 161
THIS PAGE IS INTENTIONALLY LEFT BLANK
Oct-Dec 2013 Earnings Preview
January 09, 2014 162
THIS PAGE IS INTENTIONALLY LEFT BLANK

Oct-Dec 2013 Earnings Preview
January 09, 2014 163
THIS PAGE IS INTENTIONALLY LEFT BLANK

Oct-Dec 2013 Earnings Preview
January 09, 2014 164
Prabhudas Lilladher Pvt. Ltd.
3rd Floor, Sadhana House, 570, P. B. Marg, Worli, Mumbai-400 018, India
Tel: (91 22) 6632 2222 Fax: (91 22) 6632 2209
Rating Distribution of Research Coverage
25.0%
54.7%
18.8%
1.6%0%
10%
20%
30%
40%
50%
60%
BUY Accumulate Reduce Sell
% of Total Coverage
PL’s Recommendation Nomenclature
BUY : Over 15% Outperformance to Sensex over 12-months Accumulate : Outperformance to Sensex over 12-months
Reduce : Underperformance to Sensex over 12-months Sell : Over 15% underperformance to Sensex over 12-months
Trading Buy : Over 10% absolute upside in 1-month Trading Sell : Over 10% absolute decline in 1-month
Not Rated (NR) : No specific call on the stock Under Review (UR) : Rating likely to change shortly
This document has been prepared by the Research Division of Prabhudas Lilladher Pvt. Ltd. Mumbai, India (PL) and is meant for use by the recipient only as
information and is not for circulation. This document is not to be reported or copied or made available to others without prior permission of PL. It should not be
considered or taken as an offer to sell or a solicitation to buy or sell any security.
The information contained in this report has been obtained from sources that are considered to be reliable. However, PL has not independently verified the accuracy
or completeness of the same. Neither PL nor any of its affiliates, its directors or its employees accept any responsibility of whatsoever nature for the information,
statements and opinion given, made available or expressed herein or for any omission therein.
Recipients of this report should be aware that past performance is not necessarily a guide to future performance and value of investments can go down as well. The
suitability or otherwise of any investments will depend upon the recipient's particular circumstances and, in case of doubt, advice should be sought from an
independent expert/advisor.
Either PL or its affiliates or its directors or its employees or its representatives or its clients or their relatives may have position(s), make market, act as principal or
engage in transactions of securities of companies referred to in this report and they may have used the research material prior to publication.
We may from time to time solicit or perform investment banking or other services for any company mentioned in this document.