India Nepal - International University of Japan
47
COUNTRY REPORT 1st quarter 2000 The Economist Intelligence Unit 15 Regent St, London SW1Y 4LR United Kingdom FMr India Nepal The full publishing schedule for Country Reports is now available on our website at http://www.eiu.com/schedule
-
Upload
khangminh22 -
Category
Documents
-
view
0 -
download
0
Transcript of India Nepal - International University of Japan
COUNTRY REPORT
1st quarter 2000
The Economist Intelligence Unit15 Regent St, London SW1Y 4LRUnited Kingdom
FMr
India
NepalThe full publishing schedule for Country Reports is nowavailable on our website at http://www.eiu.com/schedule
The Economist Intelligence UnitThe Economist Intelligence Unit is a specialist publisher serving companies establishing and managingoperations across national borders. For over 50 years it has been a source of information on businessdevelopments, economic and political trends, government regulations and corporate practice worldwide.
The EIU delivers its information in four ways: through subscription products ranging from newsletters toannual reference works; through specific research reports, whether for general release or for particularclients; through electronic publishing; and by organising conferences and roundtables. The firm is amember of The Economist Group.
LondonThe Economist Intelligence Unit15 Regent StLondonSW1Y 4LRUnited KingdomTel: (44.20) 7830 1000Fax: (44.20) 7499 9767E-mail: [email protected]
New YorkThe Economist Intelligence UnitThe Economist Building111 West 57th StreetNew YorkNY 10019, USTel: (1.212) 554 0600Fax: (1.212) 586 1181/2E-mail: [email protected]
Hong KongThe Economist Intelligence Unit25/F, Dah Sing Financial Centre108 Gloucester RoadWanchaiHong KongTel: (852) 2802 7288Fax: (852) 2802 7638E-mail: [email protected]
Website: http://www.eiu.com
Electronic deliveryEIU ElectronicNew York: Alexander Bateman Tel: (1.212) 554 0600 Fax: (1.212) 586 1181London: Jan Frost Tel: (44.20) 7830 1183 Fax: (44.20) 7830 1023
This publication is available on the following electronic and other media:
Online databases
FT Profile (UK)Tel: (44.20) 7825 8000
DIALOG (US)Tel: (1.415) 254 7000
LEXIS-NEXIS (US)Tel: (1.800) 227 4908
M.A.I.D/Profound (UK)Tel: (44.20) 7930 6900
NewsEdge Corporation (US)Tel: (1.718) 229 3000
CD-ROM
The Dialog Corporation (US)SilverPlatter (US)
Microfilm
World Microfilms Publications(UK)Tel: (44.20) 7266 2202
Copyright© 2000 The Economist Intelligence Unit Limited. All rights reserved. Neither this publication norany part of it may be reproduced, stored in a retrieval system, or transmitted in any form or by anymeans, electronic, mechanical, photocopying, recording or otherwise, without the prior permissionof The Economist Intelligence Unit Limited.
All information in this report is verified to the best of the author's and the publisher's ability. However,the EIU does not accept responsibility for any loss arising from reliance on it.
ISSN 0269-5294
Symbols for tables“n/a” means not available; “–” means not applicable
Printed and distributed by Redhouse Press Ltd, Unit 151, Dartford Trade Park, Dartford, Kent DA1 1QB, UK

EIU Country Report 1st quarter 2000 © The Economist Intelligence Unit Limited 2000
Contents
3 Summary
India
5 Political structure
6 Economic structure
6 Annual indicators
7 Quarterly indicators
8 Outlook for 2000-01
12 The political scene
14 Economic policy
15 The domestic economy
15 Economic trends
18 Industry
19 Agriculture
21 Infrastructure and services
23 Finance
24 Foreign trade and payments
Nepal
28 Political structure
29 Economic structure
29 Annual indicators
30 Quarterly indicators
31 Outlook for 2000-01
32 The political scene
36 Economic policy and the domestic economy
36 Economic trends
39 Sectoral trends
40 Foreign trade and payments
43 Trade data
List of tables
8 India: forecast summary
15 India: growth in gross domestic product
16 India: industrial growth
16 India: economic results and forecasts
24 India: trade balance
2
EIU Country Report 1st quarter 2000 © The Economist Intelligence Unit Limited 2000
26 India: balance of payments (IMF series)
26 India: sources of overseas capital
36 Nepal: main economic indicators
39 Nepal: government finances, Jul 16th-Nov 15th 1999
List of figures
11 India: gross domestic product
11 India: Indian rupee real exchange
32 Nepal: gross domestic product
32 Nepal: Nepalese rupee real exchange rates
3
EIU Country Report 1st quarter 2000 © The Economist Intelligence Unit Limited 2000
Summary
1st quarter 2000
India
The ruling BJP will remain in power, and will present itself more as a modernparty purporting economic liberalism, globalisation and technologicaladvancement. State governments will, however, follow their own agenda,allowing a place for conservative party stalwarts. The outlook for growthremains positive: GDP is forecast to be above trend at 6% in 2000-01, withinflation picking up in 2000. Increases in world trade and liberalisation of thetariff regime will fuel export and import growth, with imports outpacingexports. The current-account balance will steadily deteriorate. Net portfolioinvestment is forecast to remain strong, but foreign direct investment may notimprove as quickly as expected. The failure of the Cogentrix project and thestill difficult operating environment will prove deterrents. The rupee willdepreciate to an average rate of around Rs50:$1 in 2001.
The ruling BJP alliance’s hold on power remains firm and a stable governmenthas had a positive impact. A logjam in parliament has been overcome and anumber of bills finally passed. However, the government’s handling of theIndian Airlines hostage crisis in December has drawn criticism and led to adeterioration in relations with Pakistan.
The central government’s fiscal deficit has continued to expand. Despiterecognising this as a problem, the government has yet to push implementationof the fiscal responsibility bill. Tariff reductions and subsidy cuts will continuein an effort to address the issue. Higher oil import prices will have generatedhigher revenue from customs duties and will have provided a reprieve. Exportshave also grown more quickly than expected, particularly in the software andgems industries.
• Until August 1999 the signs of industrial recovery were largely confined toconsumer durables and capital goods manufacturers, with solid growth in theproduction of intermediate goods. Since then most segments of industry havegrown quickly. The industrial production index was up by 8.4% year on year inSeptember and October.
• Agricultural output has suffered from a weak monsoon season, leading to aslight downgrading of high output estimates for the 1999/2000 harvests.Several years of bumper harvests have swelled buffer stocks, facilitating India’slow inflation environment.
• The plan to expand the private sector’s role in infrastructure investmenthas failed to resolve the problems of Cogentrix’s planned investment in Kerala,and has strengthened the governmen’s image of an inefficiently run mono-poly. Offsetting this failure is the success of India’s software and high-tech
February 22nd 2000
Outlook for 2000-01
The political scene
Economic policy
The domestic economy
4
EIU Country Report 1st quarter 2000 © The Economist Intelligence Unit Limited 2000
industries, and discussions are under way to change the weighting of thissector’s contribution to GDP.
Customs data show exports growing by around 21% in April-October 1999,and the Centre for Monitoring Indian Economy (CMIEE) registered year onyear export growth of 30% in November and 15% in December 1999. Importsgrew strongly as well, with the oil import bill increasing significantly. Netportfolio investment has expanded with the rise in the stockmarket andincreased confidence in the stability of government.
Nepal
The prime minister, Krishna Prasad Bhattarai, is on the verge of being pushedout by his own party. The economy is forecast to grow by 5.5-6% in the currentfiscal year, led by a strong rebound in agricultural production.
Around 60 Nepali Congress (NC) MPs have demanded Mr Bhattarai’s resig-nation, but he has won a reprieve at least until March. The reformist financeminister has resigned over the appointment of a new central bank governor.The NC sweeps three by-elections. The hijacking of an Indian airliner out ofKathmandu has strained Indo-Nepal relations.
• The World Bank has pilloried the government’s new central bank governorand its failure to pursue financial sector reform. Most businesses have nowregistered to pay VAT but collection of this and other taxes remain belowtarget. Inflation and credit growth have remained low.
• Kodak’s plans to export colour photo paper to India have foundered. Thegovernment is considering a more restrictive definition of manufacturing thatcould harm exports to India. Enron has inched closer to being awarded asurvey licence for a massive hydropower project.
Both exports and imports rose by more than 30% in the first four months ofthe current fiscal year. Increased imports have led to a return of a sizeablecurrent-account deficit, but the balance of payments remains positive.
Editor: Georgia BushAll queries: Tel: (44.20) 7830 1007 Fax: (44.20) 7830 1023
Next report: Our next Country Report will be published in June
Outlook for 2000-01
The political scene
Economic policy and thedomestic economy
Foreign trade andpayments
Foreign trade andpayments
India 5
EIU Country Report 1st quarter 2000 © The Economist Intelligence Unit Limited 2000
India
Political structure
Republic of India
Federal republic, 26 states and six union territories
President, currently Kocheril Raman Narayanan, indirectly elected for a five-year termby the national and state legislatures
The prime minister heads a Council of Ministers chosen from elected membersof parliament
Bicameral: upper house, Rajya Sabha, of 250 members (238 indirectly elected by statesand union territories and 12 appointed by the president); lower house, Lok Sabha, of543 members elected from single-member constituencies (79 seats reserved for scheduledcastes, 40 for scheduled tribes) and 2 appointed by the president
Uni- or bicameral, elected members, state governor appointed by the president
Based on the 1950 constitution and English common law
The Bharatiya Janata Party (BJP)-led coalition government, which assumed office onMarch 19th 1998, fell on April 17th 1999. A BJP-led coalition won a clear majority in theSeptember-October election and reinstalled Atal Bihari Vajpayee as prime minister
September-October 2004 (Lok Sabha)
Bharatiya Janata Party (BJP); Indian National Congress (Indira, Congress (I) or Congress);Communist Party of India (Marxist—CPI-M); Communist Party of India (CPI);Samajwadi Party; All-India Anna Dravida Munnetra Kazhagam (AIADMK);Rashtriya Janata Dal (RJD); Samata Party; Telegu Desam Party (TDP); Janata Dal;Dravida Munnetra Kazhagam (DMK); Bahujan Samaj Party (BSP)
Prime minister Atal Bihari Vajpayee (BJP)
Chemicals & fertiliser Surjit Singh Barnala (Akali Dal)Civil aviation Sharad Yadav (Janata Dal U)Commerce Murasoli Maran (DMK)Communications Ram Vilas Paswan (Janata Dal U)Defence George Fernandes (Janata Dal U)External affairs Jaswant Singh (BJP)Finance Yashwant Sinha (BJP)Home affairs Lal Krishna Advani (BJP)Human resources development Murli Manohar Joshi (BJP)Industry Manishar Joshi (Shiv Sena)Law, justice & company affairs Thambi Durai (AIADMK)Petroleum & natural gas Ram Naik (BJP)Power Rangarajan Kumaramangalam (BJP)Railways Mamata Bannerjee (Trinamool Congress)
Bimal Jalan
Official name
Form of state
Head of state
The executive
National legislature
State legislatures
Legal system
National government
National elections
Main political organisations
Council of Ministers
Key ministers
Central bank governor
6 India
EIU Country Report 1st quarter 2000 © The Economist Intelligence Unit Limited 2000
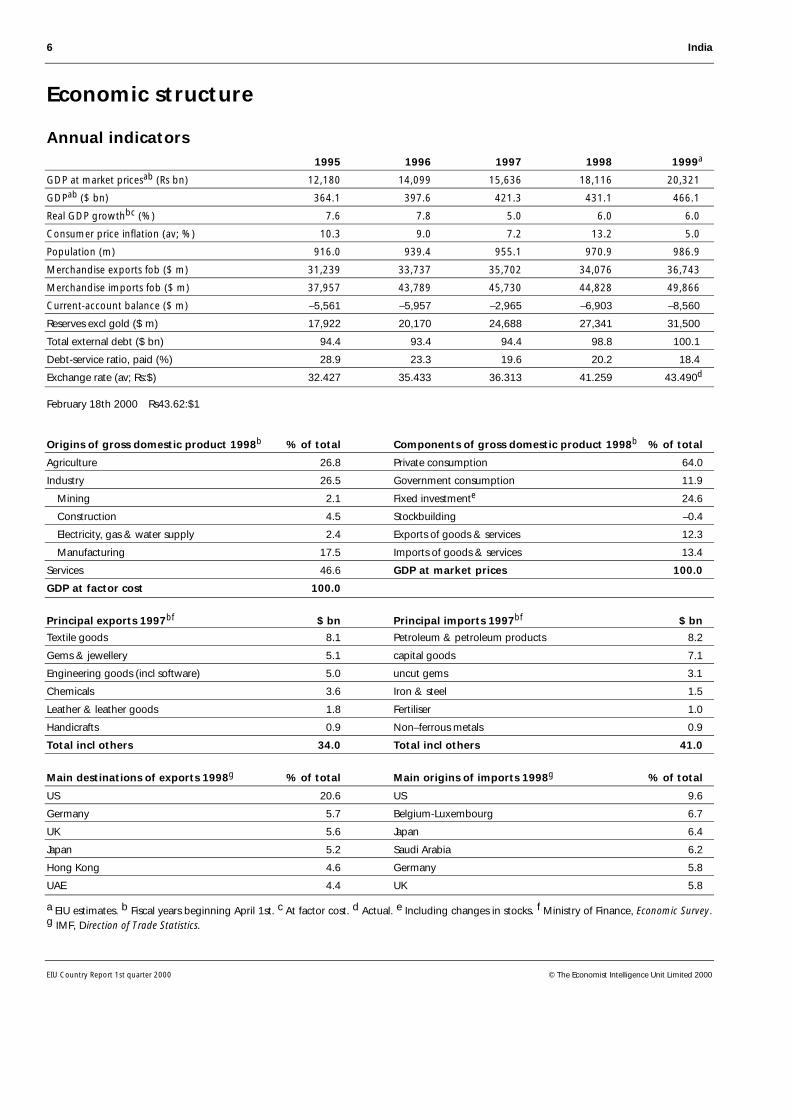
Economic structure
Annual indicators1995 1996 1997 1998 1999a
GDP at market pricesab (Rs bn) 12,180 14,099 15,636 18,116 20,321
GDPab ($ bn) 364.1 397.6 421.3 431.1 466.1
Real GDP growthbc (%) 7.6 7.8 5.0 6.0 6.0
Consumer price inflation (av; %) 10.3 9.0 7.2 13.2 5.0
Population (m) 916.0 939.4 955.1 970.9 986.9
Merchandise exports fob ($ m) 31,239 33,737 35,702 34,076 36,743
Merchandise imports fob ($ m) 37,957 43,789 45,730 44,828 49,866
Current-account balance ($ m) –5,561 –5,957 –2,965 –6,903 –8,560
Reserves excl gold ($ m) 17,922 20,170 24,688 27,341 31,500
Total external debt ($ bn) 94.4 93.4 94.4 98.8 100.1
Debt-service ratio, paid (%) 28.9 23.3 19.6 20.2 18.4
Exchange rate (av; Rs:$) 32.427 35.433 36.313 41.259 43.490d
February 18th 2000 Rs43.62:$1
Origins of gross domestic product 1998b % of total Components of gross domestic product 1998b % of total
Agriculture 26.8 Private consumption 64.0
Industry 26.5 Government consumption 11.9
Mining 2.1 Fixed investmente 24.6
Construction 4.5 Stockbuilding –0.4
Electricity, gas & water supply 2.4 Exports of goods & services 12.3
Manufacturing 17.5 Imports of goods & services 13.4
Services 46.6 GDP at market prices 100.0
GDP at factor cost 100.0
Principal exports 1997bf $ bn Principal imports 1997bf $ bn
Textile goods 8.1 Petroleum & petroleum products 8.2
Gems & jewellery 5.1 capital goods 7.1
Engineering goods (incl software) 5.0 uncut gems 3.1
Chemicals 3.6 Iron & steel 1.5
Leather & leather goods 1.8 Fertiliser 1.0
Handicrafts 0.9 Non–ferrous metals 0.9
Total incl others 34.0 Total incl others 41.0
Main destinations of exports 1998g % of total Main origins of imports 1998g % of total
US 20.6 US 9.6
Germany 5.7 Belgium-Luxembourg 6.7
UK 5.6 Japan 6.4
Japan 5.2 Saudi Arabia 6.2
Hong Kong 4.6 Germany 5.8
UAE 4.4 UK 5.8
a EIU estimates. b Fiscal years beginning April 1st. c At factor cost. d Actual. e Including changes in stocks. f Ministry of Finance, Economic Survey.g IMF, Direction of Trade Statistics.
India 7
EIU Country Report 1st quarter 2000 © The Economist Intelligence Unit Limited 2000
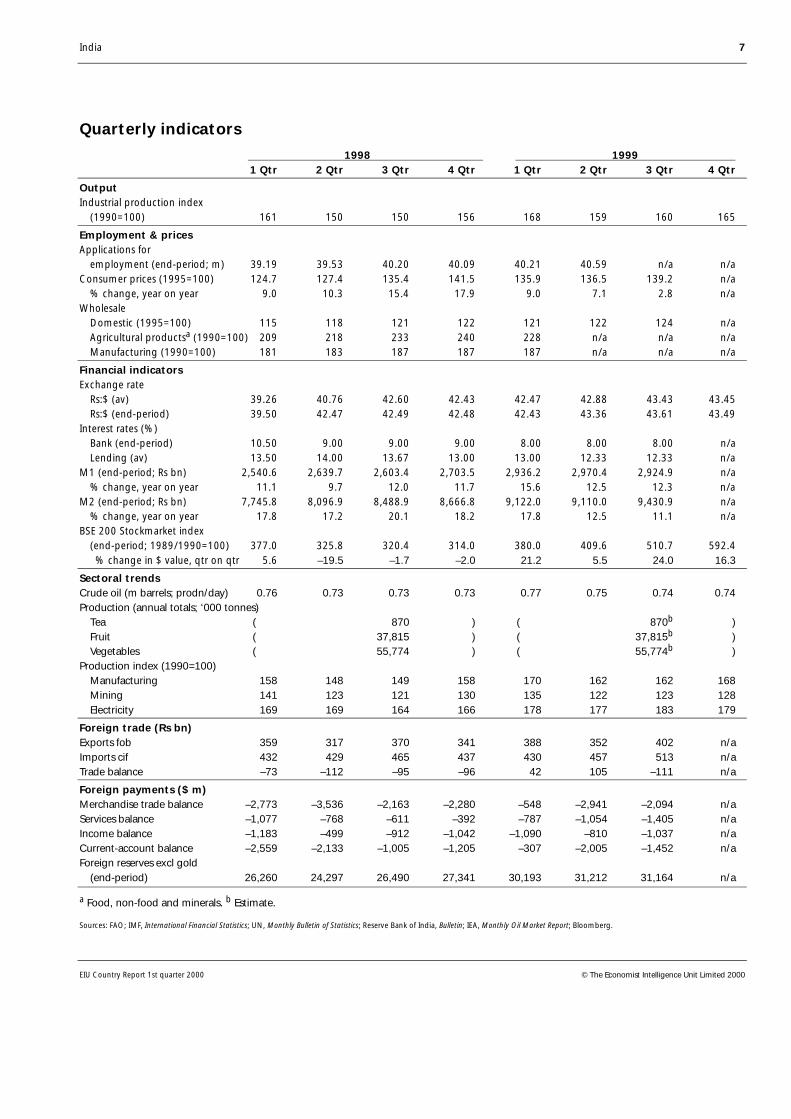
Quarterly indicators
1998 1999 1 Qtr 2 Qtr 3 Qtr 4 Qtr 1 Qtr 2 Qtr 3 Qtr 4 Qtr
OutputIndustrial production index (1990=100) 161 150 150 156 168 159 160 165
Employment & pricesApplications for employment (end-period; m) 39.19 39.53 40.20 40.09 40.21 40.59 n/a n/aConsumer prices (1995=100) 124.7 127.4 135.4 141.5 135.9 136.5 139.2 n/a % change, year on year 9.0 10.3 15.4 17.9 9.0 7.1 2.8 n/aWholesale Domestic (1995=100) 115 118 121 122 121 122 124 n/a Agricultural productsa (1990=100) 209 218 233 240 228 n/a n/a n/a Manufacturing (1990=100) 181 183 187 187 187 n/a n/a n/a
Financial indicatorsExchange rate Rs:$ (av) 39.26 40.76 42.60 42.43 42.47 42.88 43.43 43.45 Rs:$ (end-period) 39.50 42.47 42.49 42.48 42.43 43.36 43.61 43.49Interest rates (%) Bank (end-period) 10.50 9.00 9.00 9.00 8.00 8.00 8.00 n/a Lending (av) 13.50 14.00 13.67 13.00 13.00 12.33 12.33 n/aM1 (end-period; Rs bn) 2,540.6 2,639.7 2,603.4 2,703.5 2,936.2 2,970.4 2,924.9 n/a % change, year on year 11.1 9.7 12.0 11.7 15.6 12.5 12.3 n/aM2 (end-period; Rs bn) 7,745.8 8,096.9 8,488.9 8,666.8 9,122.0 9,110.0 9,430.9 n/a % change, year on year 17.8 17.2 20.1 18.2 17.8 12.5 11.1 n/aBSE 200 Stockmarket index (end-period; 1989/1990=100) 377.0 325.8 320.4 314.0 380.0 409.6 510.7 592.4 % change in $ value, qtr on qtr 5.6 –19.5 –1.7 –2.0 21.2 5.5 24.0 16.3
Sectoral trendsCrude oil (m barrels; prodn/day) 0.76 0.73 0.73 0.73 0.77 0.75 0.74 0.74Production (annual totals; ‘000 tonnes) Tea ( 870 ) ( 870b ) Fruit ( 37,815 ) ( 37,815b ) Vegetables ( 55,774 ) ( 55,774b )Production index (1990=100) Manufacturing 158 148 149 158 170 162 162 168 Mining 141 123 121 130 135 122 123 128 Electricity 169 169 164 166 178 177 183 179
Foreign trade (Rs bn)Exports fob 359 317 370 341 388 352 402 n/aImports cif 432 429 465 437 430 457 513 n/aTrade balance –73 –112 –95 –96 42 105 –111 n/a
Foreign payments ($ m)Merchandise trade balance –2,773 –3,536 –2,163 –2,280 –548 –2,941 –2,094 n/aServices balance –1,077 –768 –611 –392 –787 –1,054 –1,405 n/aIncome balance –1,183 –499 –912 –1,042 –1,090 –810 –1,037 n/aCurrent-account balance –2,559 –2,133 –1,005 –1,205 –307 –2,005 –1,452 n/aForeign reserves excl gold (end-period) 26,260 24,297 26,490 27,341 30,193 31,212 31,164 n/a
a Food, non-food and minerals. b Estimate.
Sources: FAO; IMF, International Financial Statistics; UN, Monthly Bulletin of Statistics; Reserve Bank of India, Bulletin; IEA, Monthly Oil Market Report; Bloomberg.
8 India
EIU Country Report 1st quarter 2000 © The Economist Intelligence Unit Limited 2000
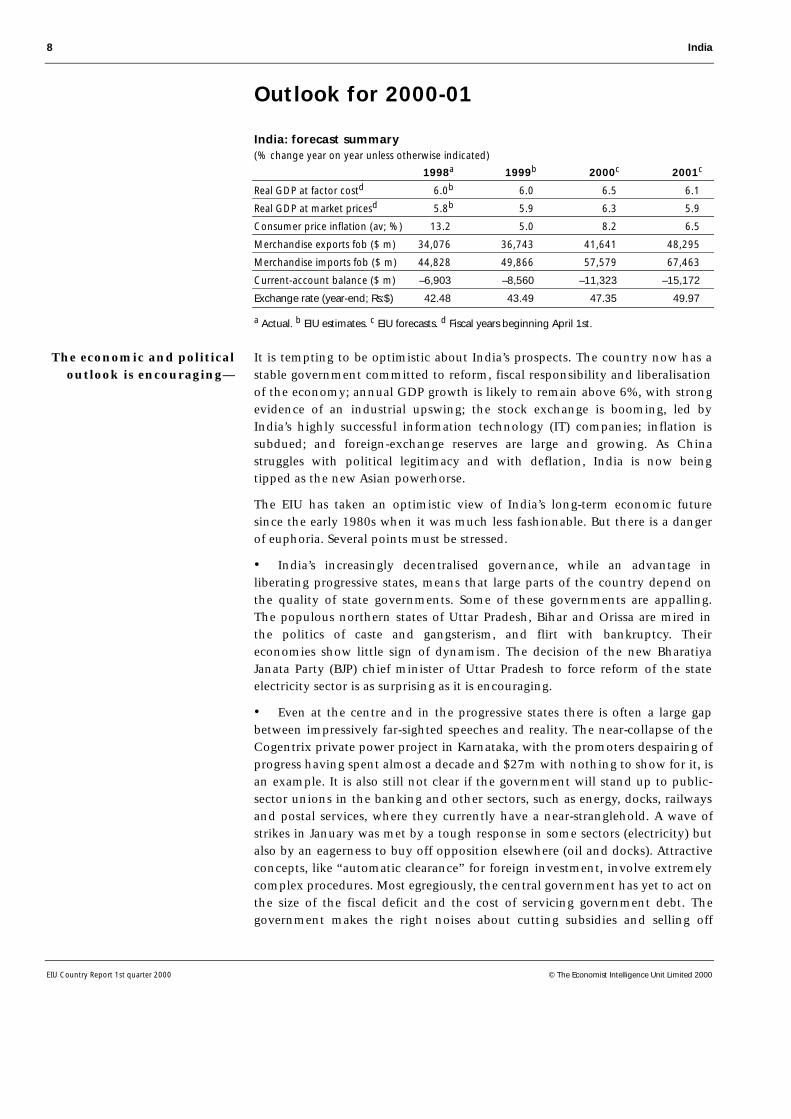
Outlook for 2000-01
India: forecast summary(% change year on year unless otherwise indicated)
1998a 1999b 2000c 2001c
Real GDP at factor costd 6.0b 6.0 6.5 6.1
Real GDP at market pricesd 5.8b 5.9 6.3 5.9
Consumer price inflation (av; %) 13.2 5.0 8.2 6.5
Merchandise exports fob ($ m) 34,076 36,743 41,641 48,295
Merchandise imports fob ($ m) 44,828 49,866 57,579 67,463
Current-account balance ($ m) –6,903 –8,560 –11,323 –15,172
Exchange rate (year-end; Rs:$) 42.48 43.49 47.35 49.97
a Actual. b EIU estimates. c EIU forecasts. d Fiscal years beginning April 1st.
It is tempting to be optimistic about India’s prospects. The country now has astable government committed to reform, fiscal responsibility and liberalisationof the economy; annual GDP growth is likely to remain above 6%, with strongevidence of an industrial upswing; the stock exchange is booming, led byIndia’s highly successful information technology (IT) companies; inflation issubdued; and foreign-exchange reserves are large and growing. As Chinastruggles with political legitimacy and with deflation, India is now beingtipped as the new Asian powerhorse.
The EIU has taken an optimistic view of India’s long-term economic futuresince the early 1980s when it was much less fashionable. But there is a dangerof euphoria. Several points must be stressed.
• India’s increasingly decentralised governance, while an advantage inliberating progressive states, means that large parts of the country depend onthe quality of state governments. Some of these governments are appalling.The populous northern states of Uttar Pradesh, Bihar and Orissa are mired inthe politics of caste and gangsterism, and flirt with bankruptcy. Theireconomies show little sign of dynamism. The decision of the new BharatiyaJanata Party (BJP) chief minister of Uttar Pradesh to force reform of the stateelectricity sector is as surprising as it is encouraging.
• Even at the centre and in the progressive states there is often a large gapbetween impressively far-sighted speeches and reality. The near-collapse of theCogentrix private power project in Karnataka, with the promoters despairing ofprogress having spent almost a decade and $27m with nothing to show for it, isan example. It is also still not clear if the government will stand up to public-sector unions in the banking and other sectors, such as energy, docks, railwaysand postal services, where they currently have a near-stranglehold. A wave ofstrikes in January was met by a tough response in some sectors (electricity) butalso by an eagerness to buy off opposition elsewhere (oil and docks). Attractiveconcepts, like “automatic clearance” for foreign investment, involve extremelycomplex procedures. Most egregiously, the central government has yet to act onthe size of the fiscal deficit and the cost of servicing government debt. Thegovernment makes the right noises about cutting subsidies and selling off
The economic and politicaloutlook is encouraging—
India 9
EIU Country Report 1st quarter 2000 © The Economist Intelligence Unit Limited 2000
shares in state enterprises but has yet to prove that it is serious. The 1999/2000budget, announced in February, says much about the government’s commit-ment. (Our next report will focus on the budget in detail.)
The prime minister and the key economic ministers acknowledge that theyhave an unrivalled opportunity to make their mark as economic reformers,building on the changes brought in by the Congress government and thefinance minister, Manmohan Singh, in the wake of the 1990/91 financial crisis.Initial progress has been good—19 bills that were stuck in the last parliamenthave now been passed.
Paradoxically, the government is moving more quickly and with the mostconfidence in the one area of reform where it originally had ideological pro-blemsreforms contradicting the BJP’s philosophy of economic nationalism.The government is moving rapidly to comply with World Trade Organisation(WTO) requirements by lifting quantitative import restrictions on many itemsand promising tariff cuts. It wishes to become WTO compliant with respect tointellectual property laws as soon as possible. The rules governing foreigninvestment are to be further relaxed to make clearance less bureaucratic and toincrease the share of foreign equity permitted in many sectors (includinginsurance where enabling legislation has been passed). Foreign borrowing bycorporates is also to be liberalised.
The next big issue to be tackled is privatisation. Minority shares have been soldoffoften to other state corporationsbut few state enterprises have beengenuinely put into private hands. So far the approach has been to allow privatecompanies to compete, usually at the margin, with state enterprise. This hashappened in the banking, insurance, airlines, oilupstream and down-streamand telecommunications industries. The only early test case of a moreradical approach is likely to be India Airlines, for which there is a planned sell-off. Privatising the state-owned banks will be a pivotal battle. If thegovernment is willing to take on the powerful bank unions over this issue itwill be a sign that it is truly serious.
Bringing the private sector into infrastructure will require a lengthy campaign.Private power generation is still mired in a quagmire of complex legal, regula-tory and financial problems involving India’s law courts as well as state andcentral government. There are ambitious plans for bringing private capital intoroadbuilding, ports and airports but, compared with many developing coun-tries, progress is painfully slow. The government has much to do to revitalisethe reform programme. It faces the serious handicap that some key ministers inthe coalitionas with railways and communicationshave no interest inreform or are actively opposed to it, siding with recalcitrant unions. Nonethe-less, compared with the last few years the circumstances are much more infavour of reform succeeding.
The 1999/2000 budget deficit, which we pessimistically assumed would deterio-rate from a target of 4% of GDP to around 6.5%, may turn out to be betterthan expected, for reasons of good luck as much as good management. The
and the reform agendais unfolding
Unwilling privatisationtargets include the
state banks—
and infrastructureproviders
The budget deficit is setto narrow
10 India
EIU Country Report 1st quarter 2000 © The Economist Intelligence Unit Limited 2000
sharp increase in world oil prices ratcheted up the tax take on ad valorumimport duties. The gradual replacement of import quotas with tariffs addsanother source of revenue. Increased growth in industry has boosted exciseduties on manufacturers as well as corporation tax receipts. But the govern-ment has failed to make any serious headway in divesting shares. A sell-off ofRs20bn ($458m) of shares of a state oil company in February increased annualreceipts to around one-third of the target of Rs100bn. The budget, due at theend of February, will be a crucial indicator of whether the government is goingto allow a continued drift in the government deficit.
The Indian economy shows signs of strong recovery, led by manufacturing. Weare forecasting GDP growth at factor cost of 6% for fiscal year 1999/2000(April-March). The international ratings agency Moody’s Investors Service hasupgraded its earlier 4.5% forecast to 5.5%. The government’s forecast is 5.9%growth. Industrial growth for the first seven months of 1999/2000 was 6.9%,compared with 3.4% in the same period of 1998/99. Industrial growth shouldaverage 7% over the April-March fiscal year (industry accounts for 27% ofGDP). Industrial expansion is driven by demand for consumer durables,intermediate and capital goods. The assumptions we have made in earlierreports in relation to services and agriculture remain sound, although qualitydata in these areas are less readily accessible. There has been some downwardadjustment in expectations for agricultural growth, to around 1% in 1999.
India’s underlying GDP growth rate is around 6% but this will accelerate as theindustrial sector moves into a higher gear. Parts of the service sector will re-spond to improved telecommunications and information technology (IT) andthe economy generally will respond to the stimulus of deregulation. The year-on-year variation in growth owes much to the nature of the monsoon seasonand its impact on harvests. The 1999 monsoon was above average, but a badmonsoon in 2000 could substantially affect growth in 2000/01. Our forecast,however, assumes a good monsoon, and we therefore expect real GDP growthof 6.3% in 2000/01.
To the surprise of many, inflation has come down to levels equivalent to thosein the EU and US. For 1999, year-end wholesale inflation was 2.4% year onyear. In November consumer price inflationnormally running at a muchhigher pace than wholesale price increasesactually came down to zero yearon year (compared with 19.7% in November 1998). The question is whetherthis heralds a nirvana of non-inflationary growth. In the short run, almostcertainly not. Upward pressure on costs is likely, in particular increased exciseduties on fuel and the wider impact of higher oil prices. Credit growth ofaround 18% per year also suggests future excess liquidity. However, some of thesame factors creating a low inflationary environment in the West are present inIndia. There is, generally speaking, a responsible, stable monetary policy and awillingness to legislate to give substance to fiscal targets, for example through aFiscal Responsibility Act. A more competitive environment is driving downmanufacturing prices and the computer/IT sector, with its low operating costsand knock-on impact on productivity, is spreading rapidly. Abundant foreign-exchange reserves also enable India to import raw materials and industrial
—and inflation willremain subdued
Growth has recovered

India 11
EIU Country Report 1st quarter 2000 © The Economist Intelligence Unit Limited 2000
commodities at prices which are highly competitive. However, because Indiaremains dependent on a capricious agricultural sector which experiences muchmore price volatility than manufacturing, we are forecasting an average annualinflation rate of around 8% in 2000, falling to 6.5% in 2001.
With rapidly rising demand for oil products and stagnating production, soaringoil prices are expected to raise the oil import bill from $6.4bn in 1998/99 (itwas $8.2bn in 1997/98 before prices crashed) to $13.8bn in 1999/2000. How-ever, exports are booming. The recovery of Asian markets, the strength of theUS market and the success of some Indian specialities like software and cutdiamonds have driven export earnings. As a result, the trade deficit is unlikelyto deteriorate significantly from its 1998 level of $10.7bn, despite this year’shigher oil costs. We estimate a deficit of $13.1bn for 1999. In 2000-01, as thegrowth of the manufacturing sector translates into higher imports of com-ponents, raw materials and capital goods, the trade deficit will widen.
The current-account deficit will move roughly in parallel with the trade deficitbut will widen as the services and income (interest, profit and dividends)deficits increase faster than the surplus on transfers (overseas remittances). Thegovernment-estimated current-account deficit of around $5bn in 1999/2000,or around 1.2% of GDP, is almost certainly conservative (we are estimating adeficit of 1.8% of GDP for 1999). We forecast that the current-account deficitwill widen over the forecast period to around 2-3% of GDP.
The signs are that private capital inflows will pick up over the forecast period.Foreign direct investment, after stagnating because of political uncertainty,should now rise to over $4bn a year. Portfolio inflows also dried up and turnednegative in mid-1999 but are now growing strongly and should reach $4bn ayear. Foreign borrowing, mainly by private or state-owned corporates, has beenstrong at around $9bn-10bn a year. Inflows are expected to rise because thegovernment has lifted ceilings on corporate borrowing, the country’s creditrating has improved, and the debt-service ratio (at around 18% of publiclyguaranteed debt) is sustainable. This should offset downward pressure on therupee arising from an expanding current-account deficit. We forecast a year-end exchange rate of Rs47:$1 for 2000, weakening to around Rs50:$1 in 2001.
The export will help tooffset the oil shock
Private capital inflowswill rise
12 India
EIU Country Report 1st quarter 2000 © The Economist Intelligence Unit Limited 2000
The political scene
At a meeting in Chennai (Madras) in December 1999 the Bharatiya JanataParty (BJP) sought to redefine its ideology away from its traditional pre-occupations with cultural nationalism (hindutva), political exclusiveness andeconomic self-sufficiency (swadeshi) towards a more modern stance compatiblewith being the party of government. The BJP now presents itself as a party ofeconomic liberalism, fully in tune with the demands of globalisation,modernisation, advanced technology and power sharing with other parties.After the political triumphs of the past year the party is receptive to thesechanges and the status of the prime minister, Atul Behari Vajpayee, who leadsthe modernising tendency, is largely unchallenged.
There will, however, be continued opposition from party diehards, fanned bythe many who have not succeeded in obtaining jobs which match their ownsense of importance. A potential rebel is the former chief minister of UttarPradesh, Kalyan Singh, who has been expelled from the party but retainssupport among the BJP’s lower-caste voters. His unprepossessing successor, RamPrakash Gupta, is trying to build up his position by raising the emotive issue ofreplacing the razed mosque at Ayodhya with a temple.
Elsewhere, state party machines have their own agenda. In Gujarat, the BJPstate government is encouraging its employees to join the RashtriyaSwayamsevak Sangh (RSS), the militantly communal cadre organisation whichhas long given the BJP its ideological backbone and frightened secularists. Aslong as Mr Vajpayee is seen to be a successful leader, the moderates will prevail,but the more sinister aspects of the BJP have not disappeared. In addition, thefact that most of the leadership talent of the BJP is now in the centralgovernment means there is a growing dearth of political talent in the states tomanage incipient conflicts.
The government has been criticised for its handling of the Indian Airlines hos-tage crisis in December: 154 passengers, kept for eight days in appalling condi-tions at Kandahar airport in Afghanistan, were released only after Indiareleased three jailed Kashmiri militants. The hijacking revealed the govern-ment’s lack of preparedness and slow response to emergencies of this kind.
The hijacking has plunged relations with the new military government inPakistan to a new low. Although there is no evidence that the hijacking wasplanned in Pakistan, the freed militants went there and promptly addressed amass rally in Karachi calling for the “destruction” of India. More seriously, thehijacking demonstrated the ruthlessness, fanaticism and sophistication of thenew generation of Kashmiri rebels who now have a deep source of support inPakistan and Afghanistan.
For many years governments have tiptoed around any aspect of reform thatcould create problems with the unions. This is why state-owned banks, rail-ways, airlines and other bastions of militant unionism have been treated withgreat deference by successive governments. The unions, most notably theCommunist-led Aituc and Citu (reflecting the two different strands in Indian
The BJP redefines itself
The hijacking is a reminderof Kashmir tensions
The unions decide tofight reforms

India 13
EIU Country Report 1st quarter 2000 © The Economist Intelligence Unit Limited 2000
communism), have now become alarmed that the government is serious aboutdivesting public assets, welcoming multinational investors, eliminating foodand other subsidies and shaking out heavily overmanned state enterprises. Therecent spate of strikes may be seen as a warning to the government.
In January a nation-wide strike of port workers lasted five days and was endedafter some rather vague government assurances over a five-year pay deal. Theauthorities in the BJP-ruled state of Uttar Pradesh dealt more aggressively witha subsequent strike of power workers opposed to World Bank-inspired struc-tural reform (leading to the splitting up of transmission, distribution andgeneration and to more realistic tariffs) with widespread lay-offs and arrests.The strike was halted after the state government agreed to defer the changes fora year, although it insists they will proceed. Postal and telecoms workers arealso restive and there are threats of an all-out public-sector strike.
In an unusual display of cross-party co-operation, the BJP government, withhelp from Congress, pushed through parliament 19 bills in 19 days lastDecember, including key reforms such as opening up the state-controlled in-surance sector to foreign investors, permitting derivatives trading and wateringdown strict laws governing foreign exchange. Three bills related to WTO com-pliance (trademark protection for services, copyright protection for performersand protection of geographical brands such as Darjeeling tea) were passed. Akey patent bill and another on plant breeders’ rights have been referred toparliamentary panels in an effort to reach consensus, as has an e-commercebill. Other legislation (for example on semi-conductor designs) has been passedby the upper house (Rajya Sabha) where Congress has a more dominantposition and has offered to co-operate.
Beyond these overdue bills, the government has set out its objectives for thenext period of government. There will be a serious move to divest equity, thatis to privatise. India Airlines has been named as a priority case with plans tosell over 50% of equity. A state company, Modern Foods, has been sold toHindustan Lever. The BJP state government of Uttar Pradesh has set up acommission to divest public enterprises at the state level.
There is to be a further opening to foreign investment with “automatic” clear-ance in all but a few cases. The latest sectors to be opened up include pharma-ceuticals (74% foreign ownership is now allowed, up from 51%) and mining(100% foreign ownership, up from 74%). Access has been improved for foreignlaw firms, advertisers and film industry ventures. The list of sectors from whichforeign investors continue to be banned mainly consists of defence and nuclearpower, cigarettes and alcohol. There is to be fast track “automated” proceduresfor almost all investors, although some controls will remain, most notably toensure that more foreign exchange is brought in than repatriated. Further tradeliberalisation is also on the agenda. Meantime, technology is gathering pacewith Internet share trading now authorised. The reformist climate seems to beimpressing prospective investors, with new commitments from HongkongShanghai Bank and the construction company ABB (power plants). The USpower company Cogentrixwhich has spent a large sum of money to set up inIndia with no resultsis also reconsidering its decision to withdraw.
The government sets outits reform programme
14 India
EIU Country Report 1st quarter 2000 © The Economist Intelligence Unit Limited 2000
Economic policy
With the Indian economy performing so well the government has room formanoeuvre in tackling the main problem: the budget deficit. The target for thecurrent fiscal year 1999/2000 (April-March) is 4% of GDP, following a shortfallof 6.5% in 1998/99. Most analysts see little prospect of this target beingrealised. The fiscal deficit at the end of November was 80% of the budgetestimate for the whole financial year. In the comparable eight-month period in1998/99, the deficit was only 75% of the annual target. The position has,however, improved lately and if the trend of the first two-thirds of the fiscalyear is sustained, the deficit will be around 5.3% of GDP. Whether this will beachieved remains uncertain.
In the first eight months of 1999/2000 only 48% of tax revenue predicted forthe entire financial year had been collected, while current spending was 60%of the annual target and planned (mainly investment) spending was 52% ofthe target. Higher oil import prices mean that there will be, in the last fewmonths of the year, a bonanza of customs duty receipts, at possibly Rs50bn(US$1.15bn) more than planned.
Indian prices are still regulated and tend to lag world prices; action by thegovernment is required to realign them and avoid a sharp increase in subsidiesof domestic prices. In response to the sharp rise in world oil prices, the govern-ment has increased sales taxes on fuel products: on petrol by 9% and diesel by1%. For the first time a 4% sales tax is being levied on kerosene and highertaxes will apply to cooking gas (liquefied petroleum gas, LPG). However, a 10%rise in diesel prices is still needed to bring domestic prices into line withimports and the decision to raise them is being deferred until the budget.
The figures for the past eight months of the financial year suggest that govern-ment borrowing is substantially above target: Rs640bn compared with a full-year target of Rs575bn. The debt is mostly in the form of Treasury bills. Themain reason for this borrowing is that planned divestment of state-ownedenterprises is substantially below target. The annual target was Rs100bn but byend-November only Rs14bn had been raised in the form of an internationalglobal depository receipts (GDR) issue by GAIL, the gas company, and adomestic issue by VSNL, the telecoms company. In the previous year Rs54bnwas raised, but this was largely a fictional exercise in swapping shares betweenstate enterprises.
The government knows that it has to jump-start the divestment programme.One approach mooted is to use state-owned mutual funds as “warehouses”until shares can be sold to the general public. However, successivegovernments have dithered over asset sales and in the process have missedopportunities to sell shares presented by markets over the past year or so.
The government does, however, seem more serious than its predecessors andhas appointed an energetic minister, Arun Jaitley, with the specific aim ofoverseeing divestment. The next big divestment is expected to be a series ofIndian Oil Corporation (IOC) shares, earmarked for domestic institutional in-
The budget deficit posesthe greatest challenge for
the government
Fuel prices are raised
Asset sales fail
India 15
EIU Country Report 1st quarter 2000 © The Economist Intelligence Unit Limited 2000
vestors, overseas GDR investors and retail investors (10%). The sale, which willreduce the government’s stake from 82% to 72%, is expected to raise Rs20bn.
In January interest rates on several small savings funds were cut by the govern-ment and the market now expects further moves to cut key benchmark ratessuch as the bank rate and the reserve bank discount rate. The government’smove triggered a fall in other rates: yields on government securities slumped tonew lows and state lending institutions like IDBI and ICICI have trimmedinterest rates by up to 1 percentage point. The move to lower interest rates isdriven by a need to reduce the costs of servicing government debt (a fiscalissue) rather than by a desire to stimulate demand for credit, which is alreadygrowing at 18% a year, leading to excessive liquidity.
The domestic economy
Economic trends
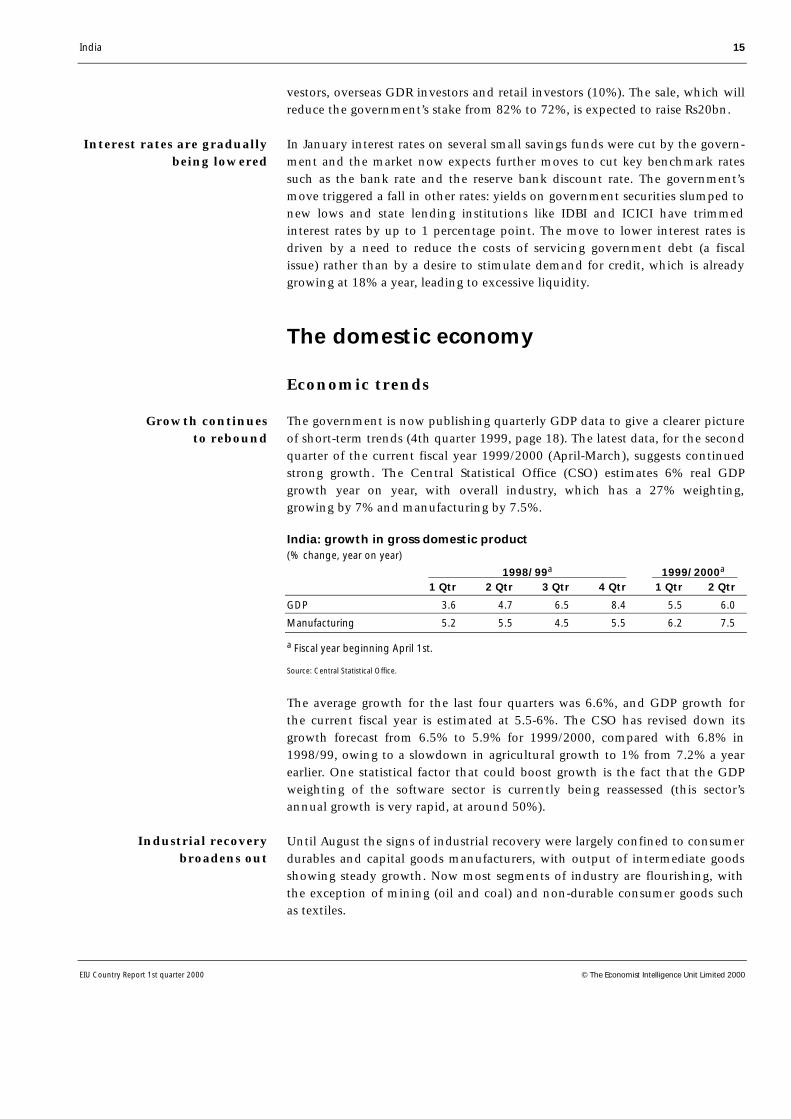
The government is now publishing quarterly GDP data to give a clearer pictureof short-term trends (4th quarter 1999, page 18). The latest data, for the secondquarter of the current fiscal year 1999/2000 (April-March), suggests continuedstrong growth. The Central Statistical Office (CSO) estimates 6% real GDPgrowth year on year, with overall industry, which has a 27% weighting,growing by 7% and manufacturing by 7.5%.
India: growth in gross domestic product(% change, year on year)
1998/99a 1999/2000a 1 Qtr 2 Qtr 3 Qtr 4 Qtr 1 Qtr 2 Qtr
GDP 3.6 4.7 6.5 8.4 5.5 6.0
Manufacturing 5.2 5.5 4.5 5.5 6.2 7.5
a Fiscal year beginning April 1st.
Source: Central Statistical Office.
The average growth for the last four quarters was 6.6%, and GDP growth forthe current fiscal year is estimated at 5.5-6%. The CSO has revised down itsgrowth forecast from 6.5% to 5.9% for 1999/2000, compared with 6.8% in1998/99, owing to a slowdown in agricultural growth to 1% from 7.2% a yearearlier. One statistical factor that could boost growth is the fact that the GDPweighting of the software sector is currently being reassessed (this sector’sannual growth is very rapid, at around 50%).
Until August the signs of industrial recovery were largely confined to consumerdurables and capital goods manufacturers, with output of intermediate goodsshowing steady growth. Now most segments of industry are flourishing, withthe exception of mining (oil and coal) and non-durable consumer goods suchas textiles.
Interest rates are graduallybeing lowered
Growth continuesto rebound
Industrial recoverybroadens out
16 India
EIU Country Report 1st quarter 2000 © The Economist Intelligence Unit Limited 2000
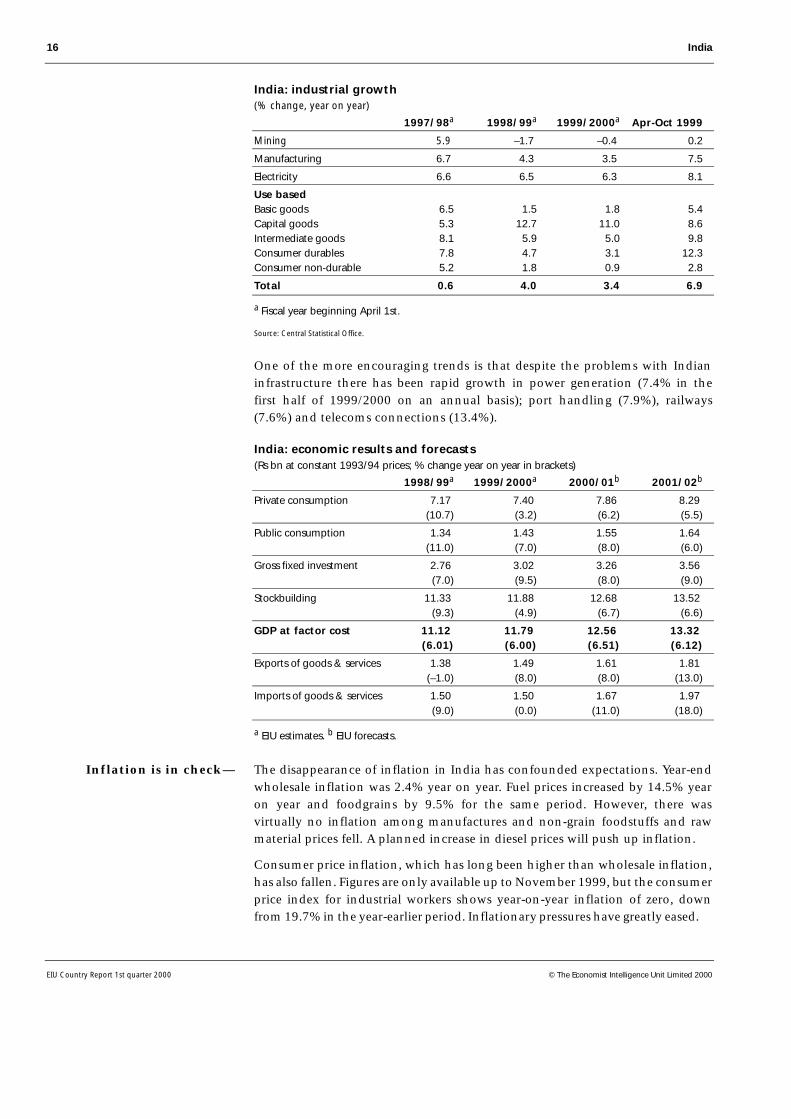
India: industrial growth(% change, year on year)
1997/98a 1998/99a 1999/2000a Apr-Oct 1999
Mining 5.9 –1.7 –0.4 0.2
Manufacturing 6.7 4.3 3.5 7.5
Electricity 6.6 6.5 6.3 8.1
Use basedBasic goods 6.5 1.5 1.8 5.4Capital goods 5.3 12.7 11.0 8.6Intermediate goods 8.1 5.9 5.0 9.8Consumer durables 7.8 4.7 3.1 12.3Consumer non-durable 5.2 1.8 0.9 2.8
Total 0.6 4.0 3.4 6.9
a Fiscal year beginning April 1st.
Source: Central Statistical Office.
One of the more encouraging trends is that despite the problems with Indianinfrastructure there has been rapid growth in power generation (7.4% in thefirst half of 1999/2000 on an annual basis); port handling (7.9%), railways(7.6%) and telecoms connections (13.4%).
India: economic results and forecasts(Rs bn at constant 1993/94 prices; % change year on year in brackets)
1998/99a 1999/2000a 2000/01b 2001/02b
Private consumption 7.17 7.40 7.86 8.29 (10.7) (3.2) (6.2) (5.5)
Public consumption 1.34 1.43 1.55 1.64 (11.0) (7.0) (8.0) (6.0)
Gross fixed investment 2.76 3.02 3.26 3.56 (7.0) (9.5) (8.0) (9.0)
Stockbuilding 11.33 11.88 12.68 13.52 (9.3) (4.9) (6.7) (6.6)
GDP at factor cost 11.12 11.79 12.56 13.32 (6.01) (6.00) (6.51) (6.12)
Exports of goods & services 1.38 1.49 1.61 1.81 (–1.0) (8.0) (8.0) (13.0)
Imports of goods & services 1.50 1.50 1.67 1.97 (9.0) (0.0) (11.0) (18.0)
a EIU estimates. b EIU forecasts.
The disappearance of inflation in India has confounded expectations. Year-endwholesale inflation was 2.4% year on year. Fuel prices increased by 14.5% yearon year and foodgrains by 9.5% for the same period. However, there wasvirtually no inflation among manufactures and non-grain foodstuffs and rawmaterial prices fell. A planned increase in diesel prices will push up inflation.
Consumer price inflation, which has long been higher than wholesale inflation,has also fallen. Figures are only available up to November 1999, but the consumerprice index for industrial workers shows year-on-year inflation of zero, downfrom 19.7% in the year-earlier period. Inflationary pressures have greatly eased.
Inflation is in check—
India 17
EIU Country Report 1st quarter 2000 © The Economist Intelligence Unit Limited 2000
India’s equity boom has been spectacular with share prices virtually doublingin the past year. The Bombay Sensex bottomed out in October 1998 at 2,812but by January 5th 2000 had risen to 5,420. There have been some spectaculardevelopments. IT companies’ share of stockmarket capitalisation has risen from10% to 25% over this period, having grown in value by over 500%, with theshare of telecoms companies appreciating by more than 900%. The stock-market boom, as in the US, has created a new corporate elite based oninformation technology (IT) and the media. The value of Wipro, a softwaresolutions company, has grown from Rs84bn ($1.93bn) to Rs670bn ($15.4bn)over a year. Infosys, a computer consultancy, has increased its value fromRs23bn to Rs473bn while Zee Telefilms has grown from Rs25bn to Rs430bn,dwarfing once mighty Indian corporates such as Tata Engineering and TataSteel, Indian Tobacco and the Birla companies, Grasim and Hindalco.Following behind is a group of companies—Satyam Computers, CIPLA,Visualsoft and Penta Four Software—which were unknown a year ago but arenow capitalised at well over $1bn each.
Several factors have propelled the market: strong growth of the real economy;falling inflation; a political consensus around economic reform; and positiveglobal factors. The immediate prospects are very favourable as the installationof a business-friendly, stable government has triggered a return of foreigninstitutional investors (who invested $650m in November-December and$1.56bn over 1999 as a whole, after net withdrawals of $340m in 1998).Beyond that, economic forecasts and computer profit prospects look good. Alarge pool of personal savings, of around $50bn, remains untapped: only 8% isinvested in equities compared with 2% in 1998 and 23% in the last great bullmarket of 1992/93. However, the market may overheat. Market capitalisation isrising more rapidly than earnings (100% compared with 10% a year). Price/earnings ratios are close to 30 and in some cases are wildly inflated. Forexample, Infosys has a price/earnings ratio of 270.
The spectacular growth of the stockmarket is only tangentially connected withthe performance of the primary market, where initial public offerings are sold.In principle, it should be easy to make new equity issues in a rising market.However, the halcyon days for new issues were in 1995 and 1996 when overthese two years 2,613 issues were floated, raising Rs196bn. In 1997 the marketwas virtually dead with 19 issues raising Rs3.6bn; in 1998 there was a moderateincrease to 38 issues raising Rs22.4bn. At present, demand for capital raised inthe markets is weak with alternative channels such as private placement, ven-ture capital and debt issues satisfying financing needs. But as the industrialboom continues and mutual funds (equity investment vehicles for India’s 32msmall investors) enter the market in a big way, there will be a market revival.
Another feature of the capital markets is a merger boom. The more competitiveproduct and services markets create winners and losers, the latter with sparecapacity to acquire. The larger, more sophisticated equity markets exposevariations in shareholder value. In 1999 merger activity grew by 25%, much ofwhich was centred on the cement industry.
while the stockexchange booms
The primary marketrevives
A merger boom getsunder way

18 India
EIU Country Report 1st quarter 2000 © The Economist Intelligence Unit Limited 2000
Industry
It is not easy to separate the hype over Infotech stocks, as they are called inIndia, and the reality of IT-driven activity (4th quarter 1999, page 22). ITcompanies accounted for around $25bn of the $135bn market capitalisation ofIndia’s stockmarkets at the end of September 1999. They currently account foraround 60% of the turnover of the market compared with 2% for the petro-chemicals sector and a mere 13% for the rest of manufacturing (and 2% for ITstocks five years ago). Wipro, with a capitalisation of $12bn, is India’s largestcompany in market capitalisation, with Infosys ($10bn) in third place and NIITand Satyam also among the top 15 companies. Wipro is diversified into hard-ware and software businesses and NIIT is the leading educational softwarehouse. A total of seven companies are expected to have US listings this year,and Satyam and Infosys have advanced software technology plus NASDAQlistings. Wipro’s founder, Azim Premji, is personally worth $9bn (on paper), byfar India’s wealthiest businessman.
The Infotech sector makes a more modest contribution to outputanestimated $5bn in software and hardware sales in fiscal 1999/2000, of whichjust over half is exported. Software exports are projected to soar to $6bn in2000/01. Growth forecasts are based on the assumption that the presentgeneration of around 1,000 IT companies employing 280,000 softwareengineers can break into the Internet and e-commerce software business.
Euphoria tends to lead to a glossing over of some real problems. Personalcomputer prices in India are still high (around $800) but are being drivendown by import competition. Internet use is expanding rapidly, with around1.6m users, but traffic is overloading the system. Some 30 Internet serviceproviders (ISPs) operate competitively over international gateways but theirservice is slow and erratic, and nine companies have sought permission to setup their own networks. Lack of band width is a serious problem because of alack of a high-speed, fibre-optic backbone.
In a very fast moving industry it is difficult to predict where the next genera-tion of dominant companies will come from. One possibly decisive move hasbeen the purchase by Satyam, the integrated Internet service provider, of theportal company India World. Each constitutes around 13m page views in com-plementary India markets, with India World having the most popular Indiansearch engine, Khoj. The main source of competition in portals is Rediff with29m page views. Satyam is the Indian AOL; Rediff, its Yahoo! Their hope is thatwhen India has tens of millions of Internet subscribers, one or the other willdominate the market.
India is positioning itself to be the leading emerging market not only in the ITworld but also in pharmaceuticals. Having long made a living by copyingWestern-developed drugs, Indian companies are now looking to patents toprotect their own intellectual property. Two companiesDr. Reddy’s Labs andRanbaxy Labshave become big players. Both companies have investedheavily in research and development. Ranbaxy spends about 5% of its $500m
Information technology(IT) takes over
The software sector willgrow quickly
followed bypharmaceuticals
India 19
EIU Country Report 1st quarter 2000 © The Economist Intelligence Unit Limited 2000
annual sales on research (one of its products, a delivery system for Cipio-floxacin, an antibiotic, was recently acquired by Bayer). Dr Reddy has a 230-strong research team and became the first Indian company to export pharma-ceuticals technology (a diabetes compound) under licence. India’s strength, aswith software, is an abundant supply of cheap but high-quality scientificmanpower. Other Indian companies are emergingCipla, Nicholas Piramaland Torrent to name a few. Global companies are setting up research sub-sidiaries in India. Pfizer has done so already and Glaxo Wellcome will followonce it is assured of intellectual property protection. Exports of generic drugsare becoming substantial, up from $450m in 1992/93 to $1.4bn in 1997/98 outof $4.5bn overall economic output. With the coming into effect of a newpatent law on March 31st, and with the relaxation of price controls, the Indianpharmaceuticals industry is, like software was a few years ago, set to boom.
One of the unintended consequences of India’s commitment to World TradeOrganisation (WTO) rules is that it will no longer be able to maintain importtariffs at current levels, exposing an industry in crisissteelto further compet-ition. With the single exception of the Tata steel company, TISCO, the industry isaccumulating heavy losses: in 1998/99 losses totalled Rs30bn. SAIL, the big statesteel company, lost Rs16bn in 1998/99 and another Rs14bn in the first half of1999/2000. All the new private millsNova Udyog, Essar Lloyds, Ispat, Jindaland Kalyaniare losing money and defaulting on loans. Another 13 plants invarying stages of planning or construction have poor financial prospects.
The four SAIL plants account for 11m tonnes of a total of 17.8m tonnes of inte-grated of primary steel capacity. Tata accounts for 3m tonnes, and Vizag 3mtonnes. This group produced 16.5m tonnes in 1997/98 and 15.8m tonnes in1998/99. There are, in addition, numerous small, mainly electrical producerswith 8.1m tonnes of output in 1997/98 and 7.5m tonnes in 1998/99, out of atotal of 12.5m tonnes capacity. A large secondary steel sector presses finishedsteel as hot or cold rolled coil or sheets. Newer plants such as the 2m-tonneEssar steel hot strip mill blur the distinction between primary and secondaryproducers. The sector as a whole has been hit by sluggish demand and imports(1.5m tonnes of raw steel in 1997/98; 1.1m tonnes in 1998/99). Exports haveprovided some relief (1.9m tonnes in 1997/98; 1.8m tonnes in 1998/99) buthave met with resistance in Western markets also suffering from excess capacity.
The recovery of the industrial sector generally should help the beleagueredsteel industry in the short term (with steel consumption expected to rise from22m tonnes to 24m tonnes in 1999/2000, boosting finished steel production to26m tonnes from 24m tonnes) but the longer-term requirement is for painfulrestructuring and rationalisation, the closure of a good proportion of high-costcapacity and the writing-off of investments made when the domestic marketseemed to enjoy indefinite protection from external competition.
Agriculture
One of the factors behind India’s low inflation environment is the abundanceof stocks of staple foodstuffs. India now has publicly held stocks which are far
Trade liberalisation willchallenge the struggling
steel industry
India’s granariesare bulging
20 India
EIU Country Report 1st quarter 2000 © The Economist Intelligence Unit Limited 2000
in excess of normal buffer stock requirements. At the beginning of November1999 there were 32.3m tonnes of grain (19.5m tonnes of wheat and 12.8mtonnes of rice) compared with 25.3m tonnes in the same month in 1998.
Behind the abundance of stocks is a succession of good harvests. The Centrefor Monitoring Indian Economy (CMIEE) estimates the rice harvest for1999/2000 is estimated at 12m tonnes following a record 12.7m tonnes in1998/99 (of the total production, 2.2m tonnes of high-quality basmati isexported, the rest is domestically consumed). The latest wheat figures suggest aharvest for the year of 71m tonnes, following 71m tonnes in 1998/99 and 66mtonnes in 1997/98. The abundance of wheat and excess stocks have led thegovernment to impose a 50% duty on imported wheat to prevent traderstaking advantage of the lower cost of imported wheat relative to the Indianprice. With the phasing in of WTO rules on food products, this kind ofintervention will become increasingly difficult and the government will needto address the issue of artificially high domestic prices.
The most recent cotton production estimates of the Cotton Advisory Bureauare for 17.5m bales for crop year 1999/2000 (October-September); the millsestimate is 16.8m-17m bales. Mills traditionally exaggerate shortfalls to make acase for imports and domestic growers argue the opposite. The basis of themore pessimistic projection is a shrinkage of area under cultivation, but there issome anecdotal evidence of a spurt in productivity. India’s productivity rate, at300 kg/ha, is currently one of the world’s lowest. In any case, output willexceed last year’s level of 16.3m bales.
Jute output for the 1999/2000 (July-June) season is forecast to fall from 10.2mbales in the previous season to 9m bales. But as demand is 8.5m bales andthere were carryover stocks of 2.5m bales, the supply position is comfortable.
As in the case of wheat, the Indian government has capitulated to pressurefrom domestic sugar and oil producers to use tariffs to firm up domestic prices.Under pressure from oilseed crushers, which have 65% unused capacity, thegovernment has jacked up duties on refined vegetable oils from 1% to 27.5%.The reason given is that for the last crop year 1998/99 (November-October) oilimports rose to 4m tonnes against a supply/demand gap of 1.5m tonnes.Despite the tariff, imports will continue at a high level into 1999/2000 partlybecause of a serious decline in domestic oil seed production to a five-year lowof 23.3m tonnes, with groundnuts especially badly affected. Oil imports areprojected at around 5m tonnes.
Sugar mills have also successfully lobbied the government to keep out im-ported sugar. A large overhang of excess supply threatens prices. Inheritedstocks of white sugar for the 1999/2000 season (October-September) totalled6.9m tonnes and production is expected to increase to 16m tonnes from 15.6mtonnes in 1998/99. Predicted consumption of 15m tonnes is not enough toabsorb the surplus stock which accumulated in response to two previous yearsof shortage and 3m tonnes of imports. As a result of lobbying, sugar millershave managed to get the government to raise customs duty from 27.5% to50%. This represents a dramatic increase, although the level is relatively low by
Cotton expectationsimprove
Tariffs will protect oilseedand sugar interests
India 21
EIU Country Report 1st quarter 2000 © The Economist Intelligence Unit Limited 2000
international standards. The political force of the sugar pressure group can beassessed by the fact that there are 45m sugar farmers plus numerous labourersand 500,000 workers in sugar refineries.
Production of tea in calendar year 1999 is estimated to have fallen at least100m kg, from 870m kg in 1998. Imports were expected to reach 185m-190m kg, down from 207mkg in 1998. This will expose serious shortages in thepipeline during 2000, driving up prices in the next few months.
The outlook for coffee, however, is provisionally positive, with productionrising from 265,000 tonnes in 1998/99 (October-September) to an expected282,000 tonnes in 1999/2000 and exports increasing from 211,000 tonnes in1998/99 to 225,000 tonnes in 1999/2000. Some growers feel that even theseestimates are too conservative and that output in the current crop year couldreach 310,000 tonnes.
Infrastructure and services
Ministerial speeches promising a warm welcome to foreign investors ringhollow after the final debacle of the Cogentrix “fast track” energy project. Forten years the US company has been attempting to launch a 1,000-mw thermalpower project in Karnataka, at Mangalore, encouraged by the promises of asuccession of national and state governments that they would smooth the way.But the company has been dogged by state-level politics, endless court caseslaunched by environmental groups, all of which it eventually won; charges ofcorruption, which were eventually thrown out of the Supreme Court; andendless administrative delays. The company finally decided to pull out inDecember. This caused a frantic rush to conclude the formalities of acounterguarantee by the central government and a finalised power purchaseagreement by the state authorities (which had had to go through 27interministerial committees). Cogentrix was not impressed. It is determined toleave, having spent $27m with no return. The state remains short of 4,000 mwof generating capacity.
The Cogentrix case is not unique. Of the eight fast track projects approved in1992, only three are operating. Three have received counterguarantees but haveyet to start generation. Two projects, apart from Cogentrix, still await counter-guarantees: AES in the Ib Valley and Spectrum at Kakinada. The Ib Valley projectwas provisionally cleared in December 1999. In a wider context, India has atotal power generating capacity of around 93,000 mw. Private producers haveadded 4,760 mw since 1990 and 15 more projects are likely to produce a further4,900 mw by 2002, mainly captive power stations. This modest actual contribu-tion from private power contrasts with initial approvals of 28,800-mw capacity.
A consortium that has plans to build two 5m-tonne liquefied natural gas (LNG)plants in India (at Dahej and Kochi) has finalised complex negotiations on theownership structure. Gaz de France and Rasgas of Qatar will each have a 17.5%stake, five India state corporations will have 10% each, and other partners will
Plantation crops yieldmixed results
The collapse of theCogentrix project is anational humiliation
An ownership structure isagreed for the LNG project

22 India
EIU Country Report 1st quarter 2000 © The Economist Intelligence Unit Limited 2000
hold 15%. Nine companies, including the world’s top engineering groups, havebid for the construction work.
India’s controlled system of energy prices is singularly ill-suited to anenvironment in which prices fluctuate on international markets. Progress hasbeen made towards a more market-based system, but this progress has beenslow. The result is that in the wake of big international price increases fordiesel, Indian prices, even after some increases, are below world levels.Kerosene prices have been pegged for ten years. Consequently, kerosene pricelevels in India are well below diesel prices and kerosene prices in neighbouringcountries, leading to rampant smuggling. The petroleum minister, Ram Naik,wants a wholesale review of the price and subsidy structure, in particular totackle the differential between diesel and kerosene prices. The subsidy burdenof low kerosene prices is Rs120bn ($1.84bn) in 1999/2000 compared withRs83bn in 1998/99. But because revenue from duties on petroleum imports isalso rising this year by about Rs60bn, the costs of the oil subsidy are beinghidden and necessary decisions postponed.
As in the power sector, private roads have been long promised but plansremain largely at the drawing board stage. The problems here are as muchpractical and economicthe problem of toll collectionas political. The latestgovernment appraisal of 26 engineering projects comprising 4,885 kmconcluded that only six are financially viable, earning an internal return ofover 20%. The others need subsidies to be viable, even with tolls. Meanwhile, aWorld Bank project to upgrade the 1,000 km Delhi-Calcutta road to expresswaystandard has excluded almost every Indian company from bidding because ofstringent prequalification rules.
The appalling road network provides a good marketing strategy for the railwaysystem. The railway minister, Mamata Banarjee, in a populist flourish, has helddown rail freight prices while diesel prices paid by truckers are expected to riseby 40%. During April-November 1999 rail traffic grew by 7.4% over the sameperiod in 1998, mainly owing to big increases in the amount of cement, foodgrains and fertilisers transported. This growth should lead to total traffic of450m tonnes for the whole year compared with 421m tonnes in 1998/99 (a 2%decline on the 430m tonnes of 1997/98). The primary cargo of the railways,accounting for over half of its freight business, is coal. This staple load is set todecline with the spread of gas power and “captive” power generators. Newbusiness is crucial for the railways.
The telecoms regulator, TRAI, has been fighting a losing battle to keep its inde-pendence (4th quarter 1999, page 24). The government has now promised toremedy the situation by creating an appellate tribunal with judicial powers anda regulator with more clearly defined powers. The former is crucial since TRAIhas lost a series of court rulings trying to defend its powers (for example whenit tried to invalidate the government’s policy to open Internet services to ISPsand to award a cellular licence to the state-owned MTNL, and when it tried toset interconnection charges). In the future the special tribunal will adjudicatedisputes between the government and service providers and hear appeals
Fuel prices awaitrationalisation
Progress on private roadsis slow—
—but railways take upthe slack
The telecoms regulator is tobe reformed
India 23
EIU Country Report 1st quarter 2000 © The Economist Intelligence Unit Limited 2000
against TRAI. Its rulings can only be overturned by the Supreme Court. Asregards regulatory authority, TRAI will have a clear and binding mandate to fixinterconnection charges and tariffs and to set quality standards. But TRAI willnot have licensing powers, which will remain with the state, although it cangive advice. TRAI will be cut from seven to five members and will be staffed bymanagers and economists, not lawyers and retired bureaucrats. The reaction ofprivate companies has been mixed; the concern in particular is that the weakpowers of TRAI over licensing will bring back the bad old days of politicised andcorrupt licence allocation.
Finance
There are few steps which would more clearly signal a change in economicphilosophy than a reversal of Indira Gandhi’s impetuous bank nationalisationof the early 1970s. This issue, however, has to be approached carefully sincethere are now powerful vested interests in the status quo in the form ofhundreds of thousands of bank employees and numerous borrowers whowould not satisfy commercial credit assessment.
The government has stated that it wants to reduce state ownership to below51%. This would happen if the government were to force the banks to recapi-talise by seeking funding themselves. The three weakest banksIndian Bank,Uco Bank and United Bankneed an estimated Rs55bn ($1.26bn) to recapit-alise and to deal with non-performing assets. The government is saying that itwill not provide the money, forcing the banks to seek equity in the market. Themore ambitious banks that are seeking an international profile could welcomea move to private ownership in any event.
Parliament has finally ended six years of political stalemate and decades of stateownership by approving legislation to open the insurance sector to privatecompetition, including allowing 26% foreign ownership in joint ventures. Noless significant than the BJP’s determination to pass the legislation was the con-structive support of the Congress party. In this way the government was able toface down 200,000 insurance employees who bitterly opposed the change.
The new law is unlikely to open the door freely to foreign investors. They willstill face a stiff restriction of 26% maximum equity, but most have acceptedthat there will be limits and the big names in the industry such as Cigna,American International Group, Metropolitan Life, Sun Life, Zurich, Prudentialand ING Insurance are waiting to participate in life, general and healthinsurance joint ventures. The market is substantial$8bn and growing at 20%a yearand private insurers believe that they can provide a much better servicethan the state-owned companies that have dominated the market to date. Thepace of liberalisation will however depend on the new insurance regulator (theIRDA) and the interpretation of some of the small print in the legislationwhich, inter alia, requires insurers to commit themselves in the “social sector”and gives priority to health insurance.
Tiptoeing to bankprivatisation
Insurance opens up
24 India
EIU Country Report 1st quarter 2000 © The Economist Intelligence Unit Limited 2000
The driving force behind all financial sector reform is the vast pot of Indianprivate savings which total an estimated $400bn. Nearly half ($177bn) is inbank deposits, and almost all of these are with state-owned banks. Around$20bn is in mutual funds, of which only 15% are privately owned. Anotherlarge pot of savingsaround $95bnis in the postal savings system and pen-sion funds, again largely state-owned. At the margin there is a strong shift toprivately owned institutions. For example, two-thirds of all new money goinginto mutual funds (unit trusts) are going into privately owned funds as saversseek better returns and greater efficiency.
Another impetus is the government’s need to shed some of its obligations.Those include the guaranteedand subsidisedreturn on savings and pensionfunds, the hidden subsidies paid in recapitalising state-owned banks andbailouts of the state-owned unit trusts. Also, smaller margins and lower interestrates would come with privatisation, an important improvement for thoseseeking capital.
Foreign trade and payments
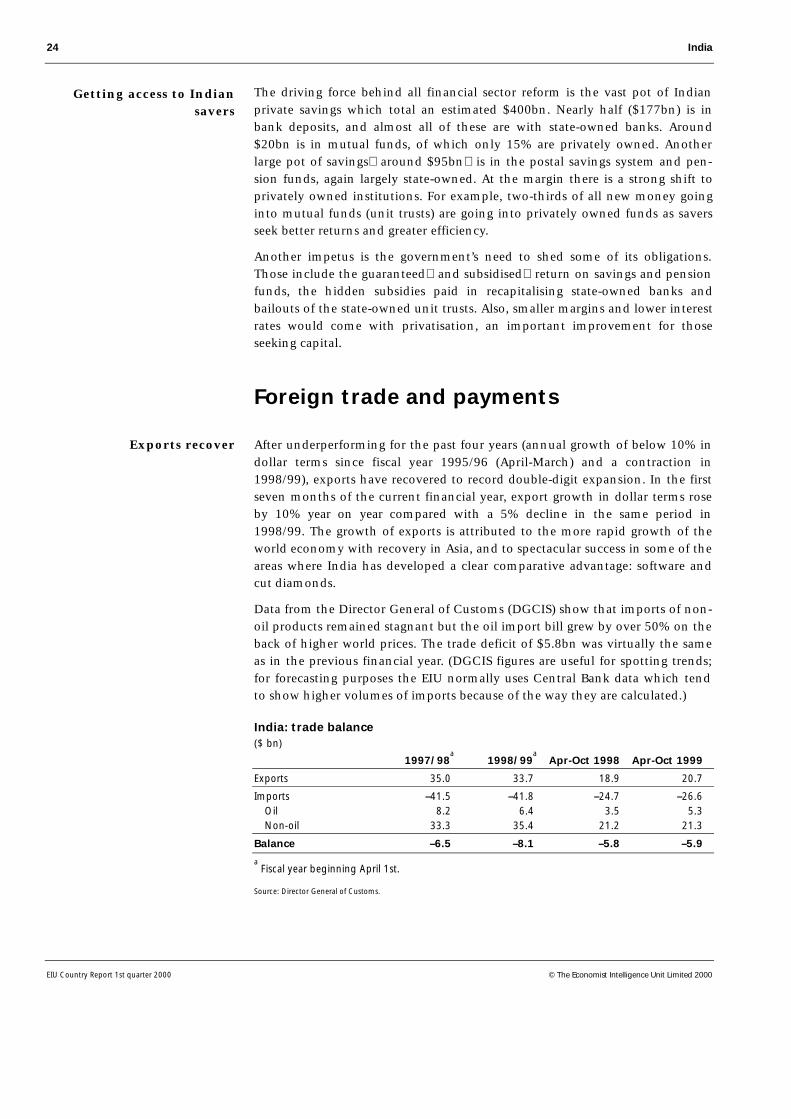
After underperforming for the past four years (annual growth of below 10% indollar terms since fiscal year 1995/96 (April-March) and a contraction in1998/99), exports have recovered to record double-digit expansion. In the firstseven months of the current financial year, export growth in dollar terms roseby 10% year on year compared with a 5% decline in the same period in1998/99. The growth of exports is attributed to the more rapid growth of theworld economy with recovery in Asia, and to spectacular success in some of theareas where India has developed a clear comparative advantage: software andcut diamonds.
Data from the Director General of Customs (DGCIS) show that imports of non-oil products remained stagnant but the oil import bill grew by over 50% on theback of higher world prices. The trade deficit of $5.8bn was virtually the sameas in the previous financial year. (DGCIS figures are useful for spotting trends;for forecasting purposes the EIU normally uses Central Bank data which tendto show higher volumes of imports because of the way they are calculated.)
India: trade balance($ bn)
1997/98a
1998/99a
Apr-Oct 1998 Apr-Oct 1999
Exports 35.0 33.7 18.9 20.7
Imports –41.5 –41.8 –24.7 –26.6 Oil 8.2 6.4 3.5 5.3 Non-oil 33.3 35.4 21.2 21.3
Balance –6.5 –8.1 –5.8 –5.9
a Fiscal year beginning April 1st.
Source: Director General of Customs.
Getting access to Indiansavers
Exports recover
India 25
EIU Country Report 1st quarter 2000 © The Economist Intelligence Unit Limited 2000
India’s chronic inability to maximise its oil production potential will cost thecountry dearly this year. With crude oil prices moving from $10/barrel toalmost $30/b within a year, India’s dependence on imports of both crude andpetroleum products is being exposed rather brutally. In 1998/99 the oil importbill was $6.4bn; planning for this year assumed a bill of $6bn based on crudeprices of $16/b. Although India has benefited from contracts below currentspot prices, oil costs this year are rising steeply because of higher prices andgreater consumption. The oil minister estimated in mid-January that theannual bill for 1999/2000 could rise to $13.8bn, an increase on the Decemberestimate of $12.5bn. Previously, a sudden deterioration in the terms of tradecosting the country almost $8bn in a single year would be a major concern buta combination of rapid export growth and the stagnation of non-oil importswill offset the increase in import costs.
Since the balance-of-payments position is comfortable and the budget balanceis not, much attention has been given to the positive impact of the oil pricerise in boosting customs revenue. Customs revenue is expected to rise from aprojected Rs95bn ($2.18bn) to Rs140bn.
Customs revenue looks set to rise overall since Indian compliance with WorldTrade Organisation (WTO) rules on import quotas means that the importregime will switch from quotas to tariffs. India has agreed with the US to phaseout quota restrictions on 1,429 items by April 2001 and of these 714 will go byApril 2000. This follows the ruling of a WTO dispute panel, and India’scompliance is now two years ahead of schedule. The government is raisingtariffs on consumer goods (for example textiles) and agricultural items by 10%over the next few months in line with eliminating quotas. Wheat, sugar andedible oil have already seen tariff increases. The immediate impact will not belarge but the combination of quota liberalisation and tariffs will boost importvolumes and tariff revenue in the long term. The overall effect of trade policyon customs revenue is more difficult to predict since India has also made acommitment to reduce its tariffs from an average of 26% to 13% by 2002.
India should be able to generate significant income from tourism. Its history,beaches, nature reserves and exotic experiences give it an advantage over thetourism industries of many other countries. But, with the exception of Goa,India remains largely outside the international tourist circuit, and the vastmajority of its tourists are overseas Indians or low-spending backpackers.Earnings stagnated at $2.8bn a year in 1997, 1998 and 1999. In fact Indianstravelling abroad (3m a year) now exceed the number of visitors (2.25m) andtourism is therefore, in aggregate, a drain on foreign exchange.
As suggested above, India’s trade statistics give rise to some confusion. Inaddition to differences in calculation methods, many types of transactions, suchas gold imports, have until recently been illegal and others (defence) have beenhidden. Also major items such as the remittances of Indians working overseas orworking in the rapidly growing labour services areas like software, global backoffices and accountancy do not fall comfortably into conventional categories.(Software “exports”, for example, provide visible exports, invisible exports and
Oil imports willescalate costs—
Tourism remains theneglected export
Statistics are patchy
—but will boostcustoms duty
26 India
EIU Country Report 1st quarter 2000 © The Economist Intelligence Unit Limited 2000
capital inflows from repatriated savings of software analysts temporarilyoverseas.) How the numbers are divided up is arbitrary, and there are now vastdiscrepancies between different estimates of the trade and current-accountbalance.
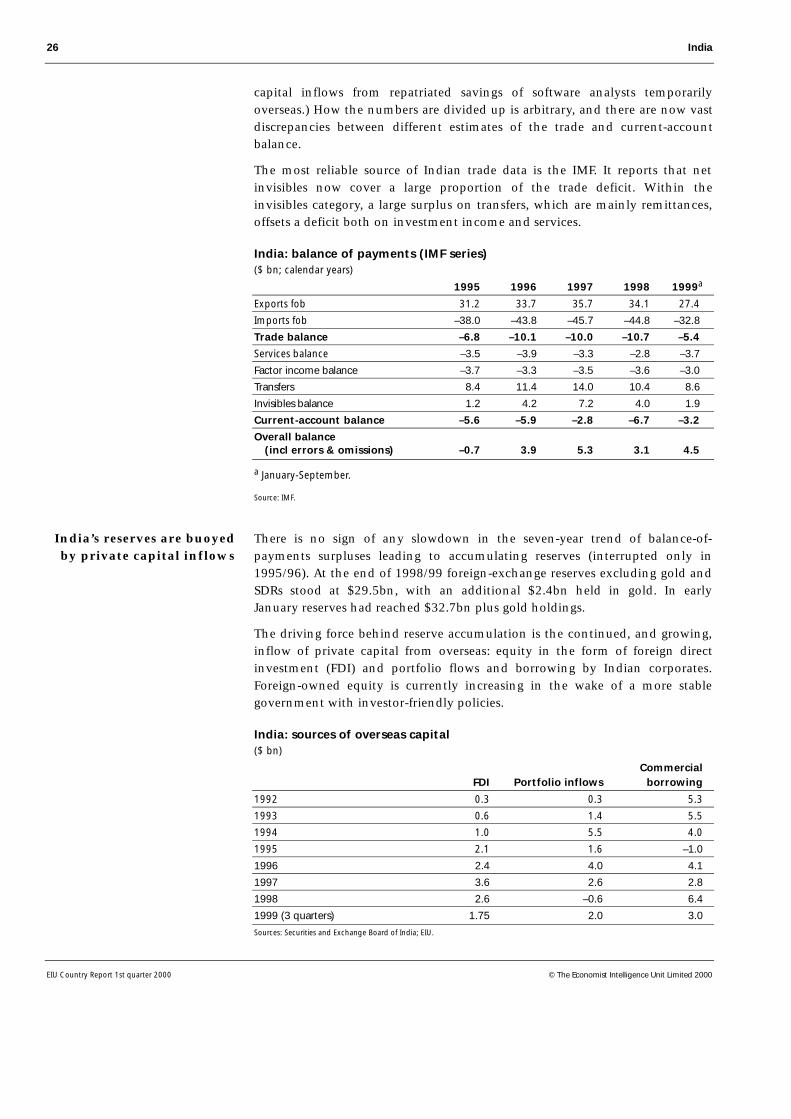
The most reliable source of Indian trade data is the IMF. It reports that netinvisibles now cover a large proportion of the trade deficit. Within theinvisibles category, a large surplus on transfers, which are mainly remittances,offsets a deficit both on investment income and services.
India: balance of payments (IMF series)($ bn; calendar years)
1995 1996 1997 1998 1999a
Exports fob 31.2 33.7 35.7 34.1 27.4
Imports fob –38.0 –43.8 –45.7 –44.8 –32.8
Trade balance –6.8 –10.1 –10.0 –10.7 –5.4
Services balance –3.5 –3.9 –3.3 –2.8 –3.7
Factor income balance –3.7 –3.3 –3.5 –3.6 –3.0
Transfers 8.4 11.4 14.0 10.4 8.6
Invisibles balance 1.2 4.2 7.2 4.0 1.9
Current-account balance –5.6 –5.9 –2.8 –6.7 –3.2
Overall balance (incl errors & omissions) –0.7 3.9 5.3 3.1 4.5
a January-September.
Source: IMF.
There is no sign of any slowdown in the seven-year trend of balance-of-payments surpluses leading to accumulating reserves (interrupted only in1995/96). At the end of 1998/99 foreign-exchange reserves excluding gold andSDRs stood at $29.5bn, with an additional $2.4bn held in gold. In earlyJanuary reserves had reached $32.7bn plus gold holdings.
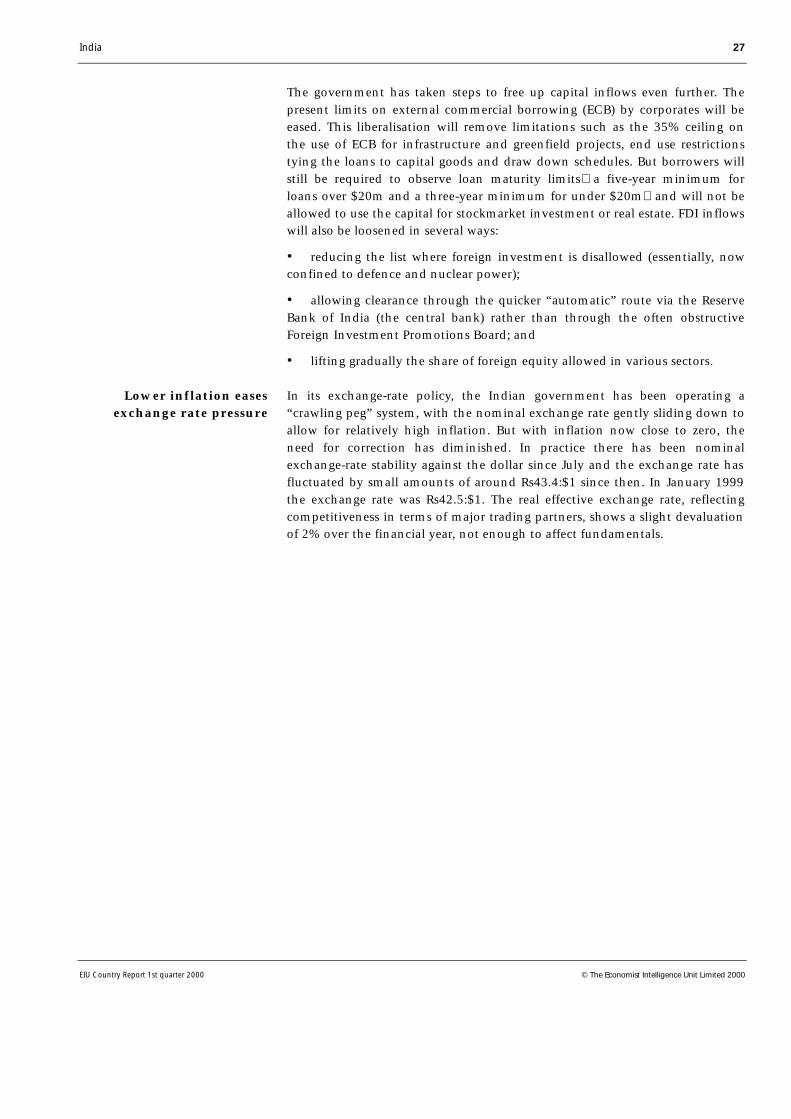
The driving force behind reserve accumulation is the continued, and growing,inflow of private capital from overseas: equity in the form of foreign directinvestment (FDI) and portfolio flows and borrowing by Indian corporates.Foreign-owned equity is currently increasing in the wake of a more stablegovernment with investor-friendly policies.
India: sources of overseas capital($ bn)
CommercialFDI Portfolio inflows borrowing
1992 0.3 0.3 5.3
1993 0.6 1.4 5.5
1994 1.0 5.5 4.0
1995 2.1 1.6 –1.0
1996 2.4 4.0 4.1
1997 3.6 2.6 2.8
1998 2.6 –0.6 6.4
1999 (3 quarters) 1.75 2.0 3.0
Sources: Securities and Exchange Board of India; EIU.
India’s reserves are buoyedby private capital inflows
India 27
EIU Country Report 1st quarter 2000 © The Economist Intelligence Unit Limited 2000
The government has taken steps to free up capital inflows even further. Thepresent limits on external commercial borrowing (ECB) by corporates will beeased. This liberalisation will remove limitations such as the 35% ceiling onthe use of ECB for infrastructure and greenfield projects, end use restrictionstying the loans to capital goods and draw down schedules. But borrowers willstill be required to observe loan maturity limitsa five-year minimum forloans over $20m and a three-year minimum for under $20mand will not beallowed to use the capital for stockmarket investment or real estate. FDI inflowswill also be loosened in several ways:
• reducing the list where foreign investment is disallowed (essentially, nowconfined to defence and nuclear power);
• allowing clearance through the quicker “automatic” route via the ReserveBank of India (the central bank) rather than through the often obstructiveForeign Investment Promotions Board; and
• lifting gradually the share of foreign equity allowed in various sectors.
In its exchange-rate policy, the Indian government has been operating a“crawling peg” system, with the nominal exchange rate gently sliding down toallow for relatively high inflation. But with inflation now close to zero, theneed for correction has diminished. In practice there has been nominalexchange-rate stability against the dollar since July and the exchange rate hasfluctuated by small amounts of around Rs43.4:$1 since then. In January 1999the exchange rate was Rs42.5:$1. The real effective exchange rate, reflectingcompetitiveness in terms of major trading partners, shows a slight devaluationof 2% over the financial year, not enough to affect fundamentals.
Lower inflation easesexchange rate pressure
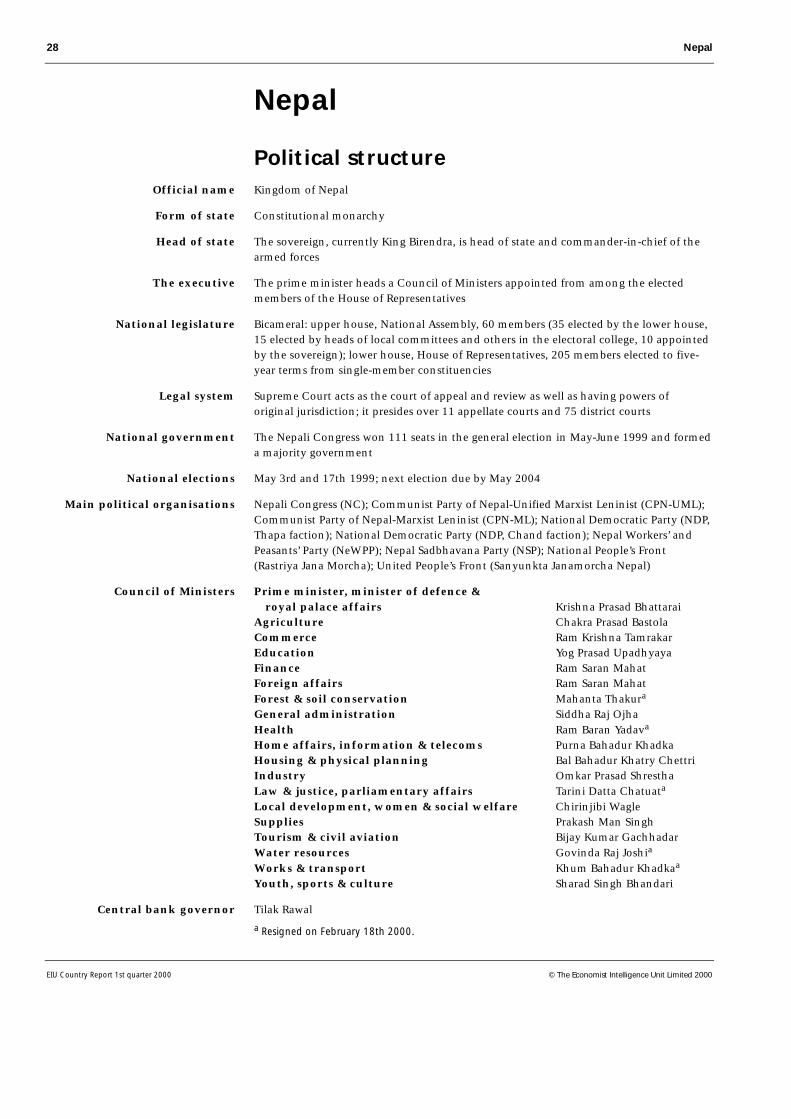
28 Nepal
EIU Country Report 1st quarter 2000 © The Economist Intelligence Unit Limited 2000
Nepal
Political structureKingdom of Nepal
Constitutional monarchy
The sovereign, currently King Birendra, is head of state and commander-in-chief of thearmed forces
The prime minister heads a Council of Ministers appointed from among the electedmembers of the House of Representatives
Bicameral: upper house, National Assembly, 60 members (35 elected by the lower house,15 elected by heads of local committees and others in the electoral college, 10 appointedby the sovereign); lower house, House of Representatives, 205 members elected to five-year terms from single-member constituencies
Supreme Court acts as the court of appeal and review as well as having powers oforiginal jurisdiction; it presides over 11 appellate courts and 75 district courts
The Nepali Congress won 111 seats in the general election in May-June 1999 and formeda majority government
May 3rd and 17th 1999; next election due by May 2004
Nepali Congress (NC); Communist Party of Nepal-Unified Marxist Leninist (CPN-UML);Communist Party of Nepal-Marxist Leninist (CPN-ML); National Democratic Party (NDP,Thapa faction); National Democratic Party (NDP, Chand faction); Nepal Workers’ andPeasants’ Party (NeWPP); Nepal Sadbhavana Party (NSP); National People’s Front(Rastriya Jana Morcha); United People’s Front (Sanyunkta Janamorcha Nepal)
Prime minister, minister of defence & royal palace affairs Krishna Prasad BhattaraiAgriculture Chakra Prasad BastolaCommerce Ram Krishna TamrakarEducation Yog Prasad UpadhyayaFinance Ram Saran MahatForeign affairs Ram Saran MahatForest & soil conservation Mahanta Thakura
General administration Siddha Raj OjhaHealth Ram Baran Yadava
Home affairs, information & telecoms Purna Bahadur KhadkaHousing & physical planning Bal Bahadur Khatry ChettriIndustry Omkar Prasad ShresthaLaw & justice, parliamentary affairs Tarini Datta Chatuata
Local development, women & social welfare Chirinjibi WagleSupplies Prakash Man SinghTourism & civil aviation Bijay Kumar GachhadarWater resources Govinda Raj Joshia
Works & transport Khum Bahadur Khadkaa
Youth, sports & culture Sharad Singh Bhandari
Tilak Rawal
a Resigned on February 18th 2000.
Council of Ministers
Official name
Form of state
Head of state
The executive
National legislature
Legal system
National government
National elections
Main political organisations
Central bank governor
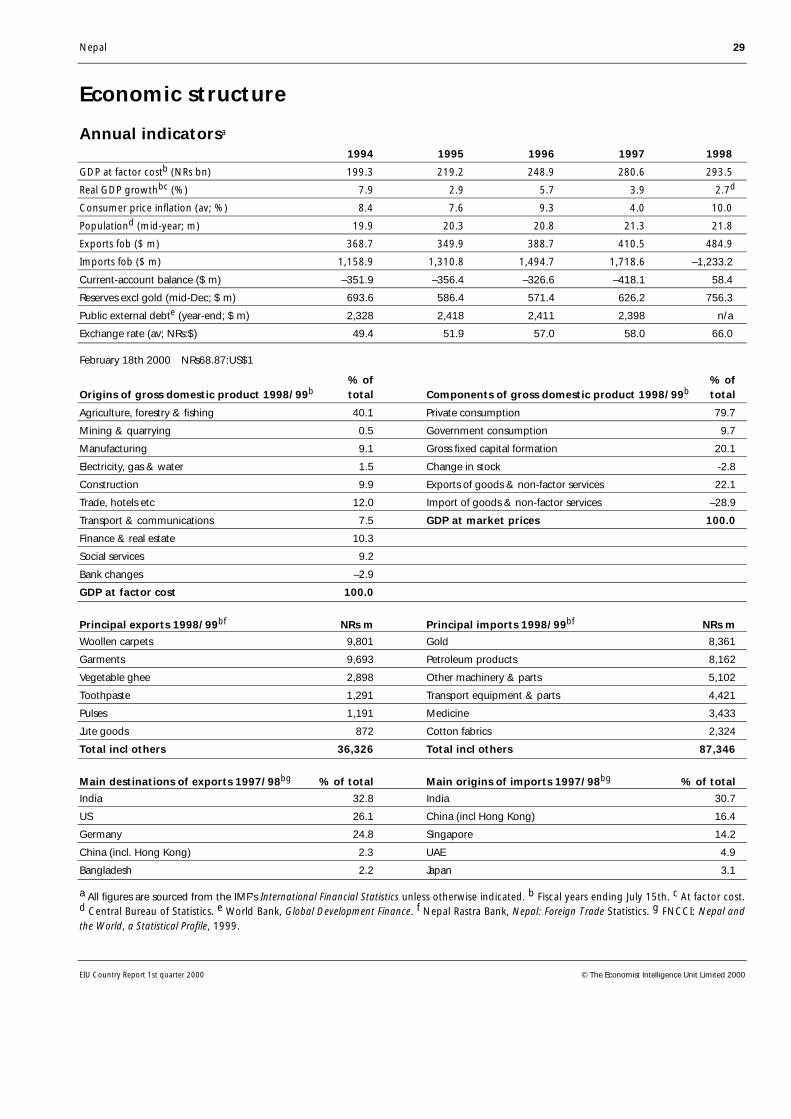
Nepal 29
EIU Country Report 1st quarter 2000 © The Economist Intelligence Unit Limited 2000
Economic structure
Annual indicatorsa
1994 1995 1996 1997 1998
GDP at factor costb (NRs bn) 199.3 219.2 248.9 280.6 293.5
Real GDP growthbc (%) 7.9 2.9 5.7 3.9 2.7d
Consumer price inflation (av; %) 8.4 7.6 9.3 4.0 10.0
Populationd (mid-year; m) 19.9 20.3 20.8 21.3 21.8
Exports fob ($ m) 368.7 349.9 388.7 410.5 484.9
Imports fob ($ m) 1,158.9 1,310.8 1,494.7 1,718.6 –1,233.2
Current-account balance ($ m) –351.9 –356.4 –326.6 –418.1 58.4
Reserves excl gold (mid-Dec; $ m) 693.6 586.4 571.4 626.2 756.3
Public external debte (year-end; $ m) 2,328 2,418 2,411 2,398 n/a
Exchange rate (av; NRs:$) 49.4 51.9 57.0 58.0 66.0
February 18th 2000 NRs68.87:US$1
% of % ofOrigins of gross domestic product 1998/99b total Components of gross domestic product 1998/99b total
Agriculture, forestry & fishing 40.1 Private consumption 79.7
Mining & quarrying 0.5 Government consumption 9.7
Manufacturing 9.1 Gross fixed capital formation 20.1
Electricity, gas & water 1.5 Change in stock -2.8
Construction 9.9 Exports of goods & non-factor services 22.1
Trade, hotels etc 12.0 Import of goods & non-factor services –28.9
Transport & communications 7.5 GDP at market prices 100.0
Finance & real estate 10.3
Social services 9.2
Bank changes –2.9
GDP at factor cost 100.0
Principal exports 1998/99bf NRs m Principal imports 1998/99bf NRs m
Woollen carpets 9,801 Gold 8,361
Garments 9,693 Petroleum products 8,162
Vegetable ghee 2,898 Other machinery & parts 5,102
Toothpaste 1,291 Transport equipment & parts 4,421
Pulses 1,191 Medicine 3,433
Jute goods 872 Cotton fabrics 2,324
Total incl others 36,326 Total incl others 87,346
Main destinations of exports 1997/98bg % of total Main origins of imports 1997/98bg % of total
India 32.8 India 30.7
US 26.1 China (incl Hong Kong) 16.4
Germany 24.8 Singapore 14.2
China (incl. Hong Kong) 2.3 UAE 4.9
Bangladesh 2.2 Japan 3.1
a All figures are sourced from the IMF's International Financial Statistics unless otherwise indicated. b Fiscal years ending July 15th. c At factor cost.d Central Bureau of Statistics. e World Bank, Global Development Finance. f Nepal Rastra Bank, Nepal: Foreign Trade Statistics. g FNCCI: Nepal andthe World, a Statistical Profile, 1999.
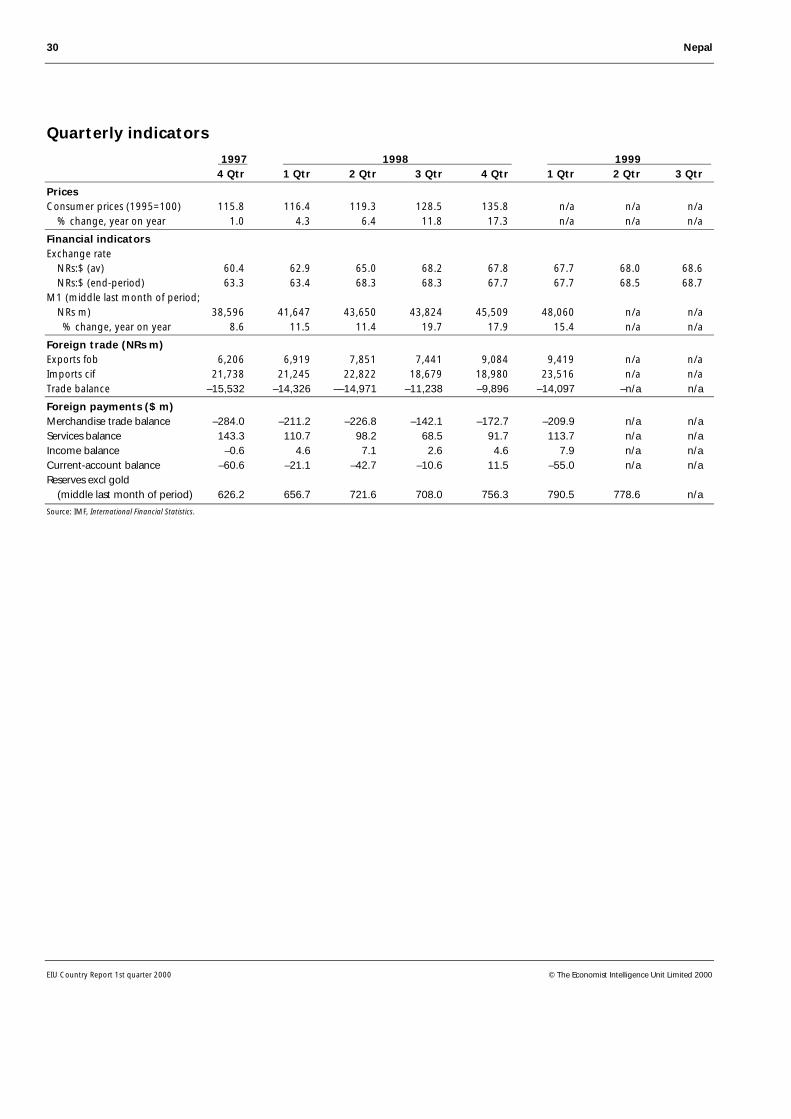
30 Nepal
EIU Country Report 1st quarter 2000 © The Economist Intelligence Unit Limited 2000
Quarterly indicators
1997 1998 1999 4 Qtr 1 Qtr 2 Qtr 3 Qtr 4 Qtr 1 Qtr 2 Qtr 3 Qtr
PricesConsumer prices (1995=100) 115.8 116.4 119.3 128.5 135.8 n/a n/a n/a % change, year on year 1.0 4.3 6.4 11.8 17.3 n/a n/a n/a
Financial indicatorsExchange rate NRs:$ (av) 60.4 62.9 65.0 68.2 67.8 67.7 68.0 68.6 NRs:$ (end-period) 63.3 63.4 68.3 68.3 67.7 67.7 68.5 68.7M1 (middle last month of period; NRs m) 38,596 41,647 43,650 43,824 45,509 48,060 n/a n/a % change, year on year 8.6 11.5 11.4 19.7 17.9 15.4 n/a n/a
Foreign trade (NRs m)Exports fob 6,206 6,919 7,851 7,441 9,084 9,419 n/a n/aImports cif 21,738 21,245 22,822 18,679 18,980 23,516 n/a n/aTrade balance –15,532 –14,326 ––14,971 –11,238 –9,896 –14,097 –n/a n/a
Foreign payments ($ m)Merchandise trade balance –284.0 –211.2 –226.8 –142.1 –172.7 –209.9 n/a n/aServices balance 143.3 110.7 98.2 68.5 91.7 113.7 n/a n/aIncome balance –0.6 4.6 7.1 2.6 4.6 7.9 n/a n/aCurrent-account balance –60.6 –21.1 –42.7 –10.6 11.5 –55.0 n/a n/aReserves excl gold (middle last month of period) 626.2 656.7 721.6 708.0 756.3 790.5 778.6 n/a
Source: IMF, International Financial Statistics.
Nepal 31
EIU Country Report 1st quarter 2000 © The Economist Intelligence Unit Limited 2000
Outlook for 2000-01
Nepal’s political outlook in 2000 will be dominated by the issue of whether theprime minister, Krishna Prasad Bhattarai, can remain in power, and the con-sequences if he does not. Mr Bhattarai has lost the confidence (if indeed heever possessed it) of a substantial proportion—perhaps a majority—of themembers of the ruling Nepali Congress (NC). Renewed demands forMr Bhattarai to step down will shorten his term in office. He may go as early asMarch.
But it is now no longer a matter of whether Mr Bhattarai will hang on, but aquestion of how his nemesis, the president of the NC, Girija Prasad Koirala, willchoose to administer the coup de grâce. A compromise agreement reached bythe two leaders in party meetings in February suggests that Mr Bhattarai maystep down “voluntarily” as early as the close of the next session of parliamentin March. The meetings came after a mass resignation of cabinet ministers. Thequestion for Mr Koirala will be whether it would be better to present himself asthe alternative prime minister (which would be risky given still-fresh memoriesof his strife-torn term in 1991-94) or to govern via a younger proxy premier.
To a large degree, it does not matter which of the two leaders calls the shots.There had been some hope that Mr Bhattarai’s government—commanding afirm majority in parliament and boasting some solidly reformist ministers,notably the finance minister, Mahesh Acharya—would at last focus onrevitalising the policy agenda after the inertia of five years of coalitiongovernments.
But Mr Bhattarai’s inability to control his party, or articulate any compellingpolicy vision, has dashed these hopes. Mr Koirala, a Machiavellian schemerwith few interests beyond the attainment of power, is unlikely to govern better.Policy paralysis is likely to continue for as long these two politicians commandcentre-stage. This could well be until the end of the present government’s termin 2004.
Despite political mayhem, the economy is experiencing a solid recovery. Thelatest projections by the Central Bureau of Statistics (CBS) forecast that GDPwill grow by 5.5-6% in the current fiscal year 1999/2000 (ending July 15th), ledby a substantial rebound in agricultural production. Agriculture, whichaccounts for 40% of GDP, is expected to grow by 4% (up from 1.1% last year),following a bumper harvest in late 1999.
The CBS forecasts growth in the non-agricultural sectors at 7%. The maindrivers of growth are robust foreign trade and increased development ex-penditure. In the first quarter of the current fiscal year total trade grew by nearly35% year on year, and development expenditure rose by a similar amount.According to the National Planning Commission, agriculture, trade anddevelopment expenditure together account for 95% of Nepal’s GDP growth.
The prime minister barelyclings to power
Mr Bhattarai has run anineffective government—
—and his rival will dolittle better
An economic recovery iswell under way—
—with strong growth intrade and development
expenditure
32 Nepal
EIU Country Report 1st quarter 2000 © The Economist Intelligence Unit Limited 2000
The political scene
The Punch and Judy show starring the prime minister, Krishna PrasadBhattarai, and his rival, the Nepali Congress (NC) president, Girija PrasadKoirala, headed for a climax in mid-February, when 58 NC members ofparliament (MPs) signed a no-confidence petition, asserting that Mr Bhattaraiwas an ineffective leader and asking him to step down immediately. The partyscheduled a confidence vote on Mr Bhattarai’s government for February 21st.
On February 18th Mr Bhattarai’s woes deepened when 11 members of hiscabinet resigned en masse. However, he refused to resign and over the weekendhe and his allies brokered a compromise under which the no-confidence votewas postponed until February 26th. There were also reports that Mr Bhattaraihas agreed to step down “voluntarily” at some unspecified time.
Aside from the mass ministerial resignations, the episode was a reprise of aneruption in December 1999, when about 60 of the NC MPs signed a petitionasking Mr Bhattarai to step down as leader of the parliamentary party andhence as prime minister. The petition charged Mr Bhattarai with failing tocontrol the Maoist insurgency, allowing corruption to continue unchecked,and permitting unreasonable increases in diesel, kerosene and electricity prices.
At a meeting of the party’s central working committee in the week ofDecember 20th, however, the two factions reached a murky compromise underwhich Mr Bhattarai agreed to step down “at the right time”. No one said whatthat time might be, although some party functionaries got busy spreading therumour that it would be immediately following the next session of parliament,scheduled for March.
From Mr Koirala’s point of view, the agreement seemed to achieve his goal ofousting Mr Bhattarai, while minimising the party’s public disarray andeliminating the need for a potentially divisive open vote of confidence in the
Mr Koirala almost knocksout MrBhattarai—
—who ducks the punch—
—for the second time
The prime minister willresign “at the right time”
Mr Koirala hopes to avoid adivisive vote
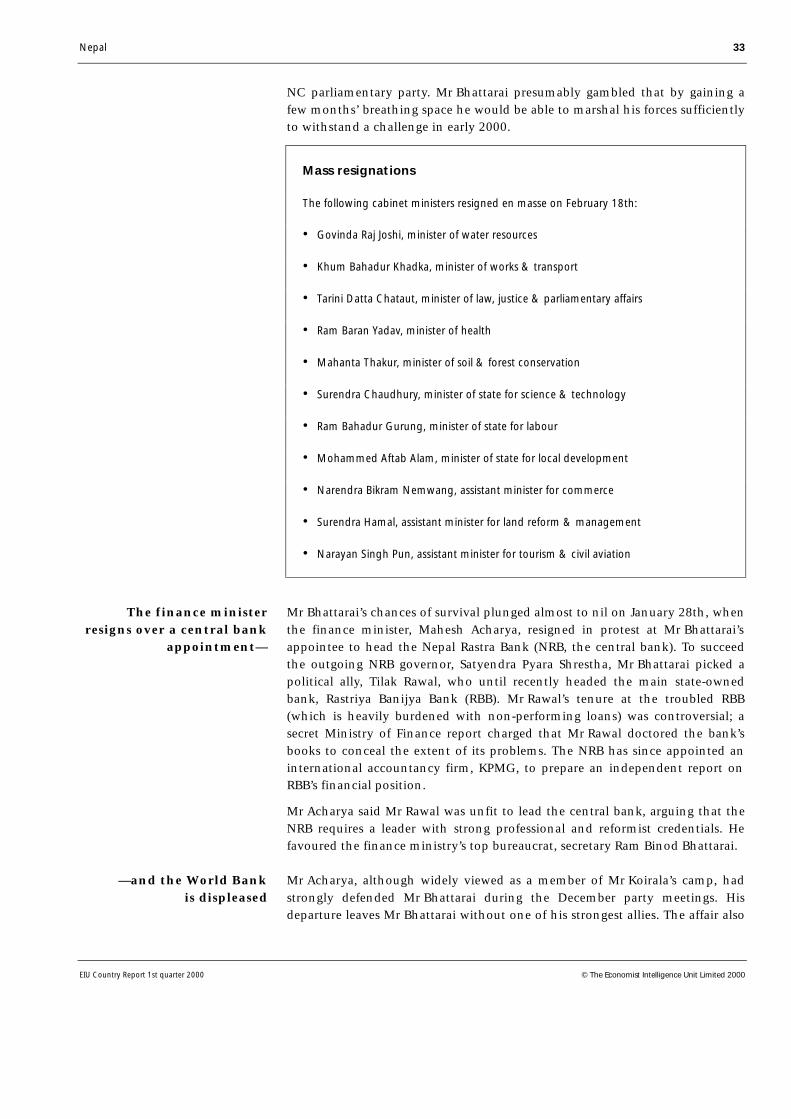
Nepal 33
EIU Country Report 1st quarter 2000 © The Economist Intelligence Unit Limited 2000
NC parliamentary party. Mr Bhattarai presumably gambled that by gaining afew months’ breathing space he would be able to marshal his forces sufficientlyto withstand a challenge in early 2000.
Mass resignations
The following cabinet ministers resigned en masse on February 18th:
• Govinda Raj Joshi, minister of water resources
• Khum Bahadur Khadka, minister of works & transport
• Tarini Datta Chataut, minister of law, justice & parliamentary affairs
• Ram Baran Yadav, minister of health
• Mahanta Thakur, minister of soil & forest conservation
• Surendra Chaudhury, minister of state for science & technology
• Ram Bahadur Gurung, minister of state for labour
• Mohammed Aftab Alam, minister of state for local development
• Narendra Bikram Nemwang, assistant minister for commerce
• Surendra Hamal, assistant minister for land reform & management
• Narayan Singh Pun, assistant minister for tourism & civil aviation
Mr Bhattarai’s chances of survival plunged almost to nil on January 28th, whenthe finance minister, Mahesh Acharya, resigned in protest at Mr Bhattarai’sappointee to head the Nepal Rastra Bank (NRB, the central bank). To succeedthe outgoing NRB governor, Satyendra Pyara Shrestha, Mr Bhattarai picked apolitical ally, Tilak Rawal, who until recently headed the main state-ownedbank, Rastriya Banijya Bank (RBB). Mr Rawal’s tenure at the troubled RBB(which is heavily burdened with non-performing loans) was controversial; asecret Ministry of Finance report charged that Mr Rawal doctored the bank’sbooks to conceal the extent of its problems. The NRB has since appointed aninternational accountancy firm, KPMG, to prepare an independent report onRBB’s financial position.
Mr Acharya said Mr Rawal was unfit to lead the central bank, arguing that theNRB requires a leader with strong professional and reformist credentials. Hefavoured the finance ministry’s top bureaucrat, secretary Ram Binod Bhattarai.
Mr Acharya, although widely viewed as a member of Mr Koirala’s camp, hadstrongly defended Mr Bhattarai during the December party meetings. Hisdeparture leaves Mr Bhattarai without one of his strongest allies. The affair also
The finance ministerresigns over a central bank
appointment—
—and the World Bankis displeased
34 Nepal
EIU Country Report 1st quarter 2000 © The Economist Intelligence Unit Limited 2000
damaged the prime minister’s credibility among donor nations and agencies.The day after Mr Acharya’s resignation a World Bank spokesman said theimbroglio would “seriously jeopardise” the annual meeting of Nepalgovernment officials with donor agency officials in Paris, scheduled for March(see Economic policy and the domestic economy).
Following Mr Acharya’s resignation Mr Bhattarai carried out a minor cabinetreshuffle to shore up his position. The foreign minister, Ram Sharan Mahat,who was finance minister in a previous government and is a friend ofMr Rawal’s, was given the finance portfolio as well, although this is understoodto be on an interim basis. Another ally, a former parliamentary speaker,Ramchandra Poudel, became deputy prime minister and took over the Ministryof Information.
Despite its internal travails, the NC continues to do well at the polls. It sweptby-elections in three parliamentary constituencies—Morang-1, Jhapa-6 andRautahat-4—held on December 10th and 12th 1999. Morang-1 is an NCstronghold and one of two constituencies won by Girija Prasad Koirala in theMay general election. The other two, however, are traditional bastions of themain opposition party, the Communist Party of Nepal-Unified Marxist-Leninist(CPN-UML). Rautahat-4 was one of two constituencies won in the May generalelection by the CPN-UML general secretary, Madhav Kumar Nepal. As a resultof the by-elections the NC now holds 113 of the 205 seats in the lower house,the House of Representatives.
While the ruling party vacillates between melodrama and farce, the oppositionparties have contented themselves with playing spectator. The CPN-UMLsucceeded in getting a special session of parliament for a week in mid-December to discuss the unpopular hikes in diesel, kerosene and electricityprices announced in November (see Economic policy and the domesticeconomy). However, its bill demanding that the price increases be eliminatedfailed to carry. Instead the house passed an amended bill put forth by the NC,which rather meaninglessly requires the government to minimise the impactof the price increases on ordinary citizens.
Meanwhile, a series of strikes planned by the CPN-UML in protest at the tariffincreases fizzled out, owing to lack of interest and the party’s fear of losingpopularity if it disrupted the midwinter wedding season.
The long-standing rift in the royalist National Democratic Party (NDP) wasclosed for a second time as Lokendra Bahadur Chand brought his faction backunder the wing of the main NDP, headed by Surya Bahadur Thapa. The Thapaand Chand factions of the NDP operated as separate parties from 1991 to 1994,united for the 1994 elections, but split again in 1997. In the 1999parliamentary polls the NDP-Thapa won 11 seats while Mr Chand’s faction wasshut out. Just to confuse matters, however, a few intransigent membersof Mr Chand’s faction refused to follow him, and the now Chand-less NDP-Chand continues its official existence under a new chairman, RajeshwarDevkota.
Dr Mahat returns asfinance minister
The NC sweeps threeby-elections
The CPN-UML’s protestmeasures are so far
ineffective
The NDP factions get backtogether—again
Nepal 35
EIU Country Report 1st quarter 2000 © The Economist Intelligence Unit Limited 2000
The Maoist insurgency in the country’s western districts continued to simmer,with skirmishes between rebels and police taking place weekly. The biggestconfrontation in recent months came in Jumla district on January 3rd, when alarge band of Maoists exploded a bomb at a police strike force centre and thenwaged a pitched battle with the police there for several hours before capturingthe post and killing nine officers. The police death toll in the nearly four-year-old insurgency now stands at 74; the government estimates that 650 Maoistshave been killed in the same period. Additional casualties—including inno-cents killed by both Maoists and police—brings the total death toll to over1,000, of which 80% have been killed by the police.
That event signalled an escalation in the Maoists' attacks, apparently incommemoration of the fourth anniversary of the beginning of their “people'swar”, on February 13th. That the government still has no effective strategy forending the rebellion was underlined in a report released by the internationalhuman rights organisation Amnesty International on February 13th, whichwarned that Nepal risks becoming the next South Asian war zone, following SriLanka and Kashmir. Noting that Nepal’s courts are ill-equipped to handle trialsof suspected Maoists, Amnesty claims that police have “deliberately executed”400 people who could have been brought to trial and have caused thedisappearance of 44 others.
Nepal’s relations with its southern Asian neighbours have taken a beating. First,the long-awaited seventh summit of the South Asian Association for RegionalCo-operation (SAARC), scheduled for Kathmandu at the end of November, wasindefinitely postponed owing to India’s refusal to countenance the presence ofthe new Pakistani leader, General Pervez Musharraf, who took power in a coupd’état in October 1999.
The postponement was a severe blow to the Kathmandu-based SAARC, whichin recent years has focused on economic issues, notably trade liberalisation andelectricity-sharing. (It was also a financial blow to Nepal’s foreign ministry,which had spent a considerable sum of money on summit preparations.)Despite brave words by various of the region’s foreign ministers, the currentabysmal state of Indo-Pakistani relations means that no SAARC summit islikely to come off this year.
To add insult to injury, Nepal found itself in the middle of another Indo-Pakistani row when an Indian Airlines jet was hijacked shortly after departingKathmandu’s Tribhuvan International Airport (TIA) on December 24th. Thedrama ended only a week later when India freed three imprisoned Islamicmilitants in exchange for the release of the 155 hostages on the plane, whichby then had arrived in Kandahar in Afghanistan. This was the first hijacking ofan international flight from TIA.
The hijacking brought immediate economic and political consequences toNepal, all of them negative. Nepalese public opinion was inflamed byerroneous Indian press reports—reiterated by the Indian foreign minister,
Kathmandu loses aSAARC summit
An Indian Airlines jet ishijacked out of
Kathmandu—
—leading to heightenedtensions between India
and Nepal
The Maoist insurgencycontinues to simmer—
—drawing a warning fromAmnesty International
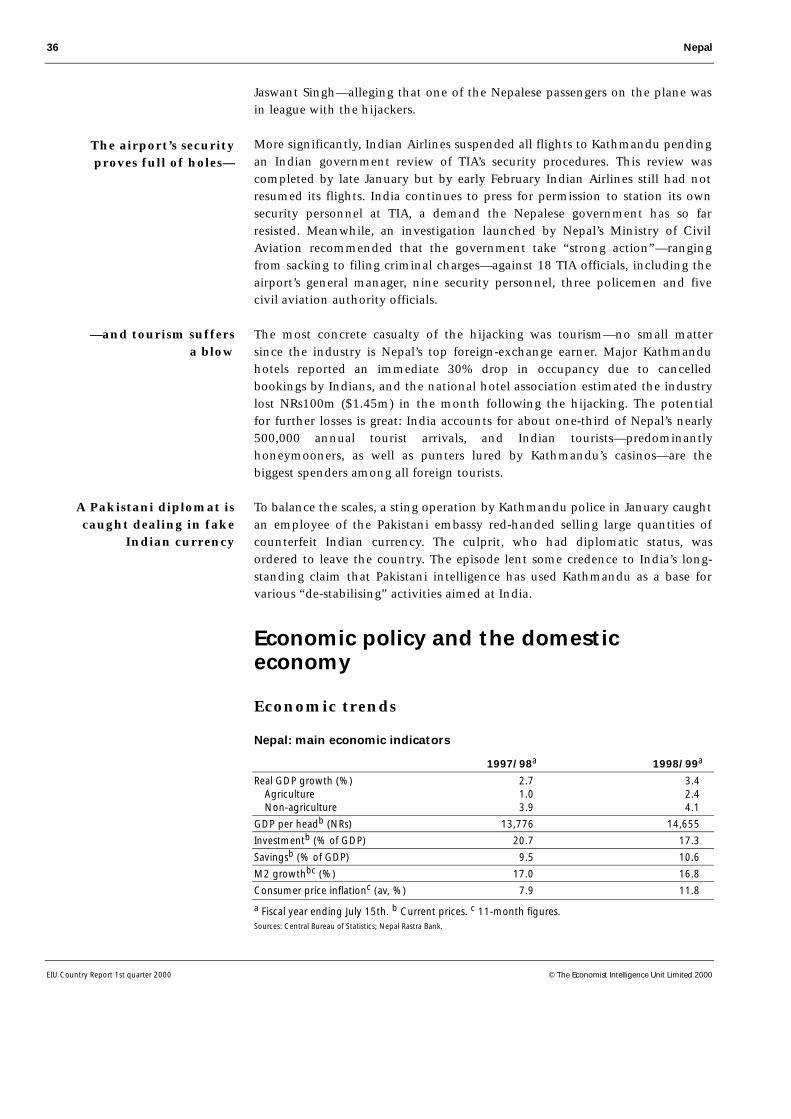
36 Nepal
EIU Country Report 1st quarter 2000 © The Economist Intelligence Unit Limited 2000
Jaswant Singh—alleging that one of the Nepalese passengers on the plane wasin league with the hijackers.
More significantly, Indian Airlines suspended all flights to Kathmandu pendingan Indian government review of TIA’s security procedures. This review wascompleted by late January but by early February Indian Airlines still had notresumed its flights. India continues to press for permission to station its ownsecurity personnel at TIA, a demand the Nepalese government has so farresisted. Meanwhile, an investigation launched by Nepal’s Ministry of CivilAviation recommended that the government take “strong action”—rangingfrom sacking to filing criminal charges—against 18 TIA officials, including theairport’s general manager, nine security personnel, three policemen and fivecivil aviation authority officials.
The most concrete casualty of the hijacking was tourism—no small mattersince the industry is Nepal’s top foreign-exchange earner. Major Kathmanduhotels reported an immediate 30% drop in occupancy due to cancelledbookings by Indians, and the national hotel association estimated the industrylost NRs100m ($1.45m) in the month following the hijacking. The potentialfor further losses is great: India accounts for about one-third of Nepal’s nearly500,000 annual tourist arrivals, and Indian tourists—predominantlyhoneymooners, as well as punters lured by Kathmandu’s casinos—are thebiggest spenders among all foreign tourists.
To balance the scales, a sting operation by Kathmandu police in January caughtan employee of the Pakistani embassy red-handed selling large quantities ofcounterfeit Indian currency. The culprit, who had diplomatic status, wasordered to leave the country. The episode lent some credence to India’s long-standing claim that Pakistani intelligence has used Kathmandu as a base forvarious “de-stabilising” activities aimed at India.
Economic policy and the domesticeconomy
Economic trends
Nepal: main economic indicators
1997/98a 1998/99a
Real GDP growth (%) 2.7 3.4 Agriculture 1.0 2.4 Non-agriculture 3.9 4.1
GDP per headb (NRs) 13,776 14,655
Investmentb (% of GDP) 20.7 17.3
Savingsb (% of GDP) 9.5 10.6
M2 growthbc (%) 17.0 16.8
Consumer price inflationc (av, %) 7.9 11.8
a Fiscal year ending July 15th. b Current prices. c 11-month figures. Sources: Central Bureau of Statistics; Nepal Rastra Bank.
The airport’s securityproves full of holes—
—and tourism suffersa blow
A Pakistani diplomat iscaught dealing in fake
Indian currency
Nepal 37
EIU Country Report 1st quarter 2000 © The Economist Intelligence Unit Limited 2000
The almost complete disarray of the government’s economic policy apparatusbecame evident in the January dispute over the appointment of a newgovernor for the Nepal Rastra Bank (NRB, the central bank). Under theprevious governor, Satyendra Pyara Shrestha (whose term expired at the end of1999), the NRB was seen as an ineffective regulator of Nepal’s rickety financialsystem. The appointment of a strong, reform-minded new governor was seenby domestic reformers and donor agencies alike as the key to jump-startingdesperately needed financial sector reform.
As noted above (see The political scene), the prime minister, Krishna PrasadBhattarai, plumped for a political ally of dubious qualifications, Tilak Rawal,over the finance minister, Mahesh Acharya’s, preferred candidate of the financesecretary, Ram Binod Bhattarai. As a result Mr Acharya, who as a juniorminister was the architect of Nepal’s first round of privatisations in the early1990s, resigned.
Reaction from donor agencies was swift. A World Bank spokesman said thatfailure to appoint “somebody sensible” to lead the NRB, combined withMr Acharya’s departure, would probably lead to the fifth successive cancel-lation of the notionally annual meeting in Paris between Nepal governmentofficials and major donors scheduled for March 15th-17th. Previous meetingshad been cancelled due to the instability of the various coalition governments.The unstated corollary was that substantial new commitments of aid areunlikely until the government can persuade donors that it has a coherenteconomic policy.
The main concern of the World Bank and other donors is that the governmenthas yet to take any action on the financial sector reforms proposed byMr Acharya in his maiden budget last July. Steps included passing a strongerNepal Rastra Bank Act, moving towards privatisation of the Rastriya BanijyaBank, and raising the 50% ceiling on foreign ownership of joint-venture banks.
Efforts to improve the government’s revenue base through value-added tax(VAT) have met with mixed success. Originally imposed in November 1997 toreplace the previous one-stage sales tax, VAT initially met with widespreadresistance from businesses. In May 1999 only 8,700 businesses had submittedVAT registrations to the government, about half of the number estimated tohave some tax liability.
But Mr Acharya’s hard-nosed drive to force businesses to register (3rd quarter1999, page 44) has borne fruit. By the end of January registrations had risen to15,600, or about 90% of the estimated pool.
So far VAT collection, however, has fallen slightly short. The governmenthoped to raise NRs10.5bn ($153m) from the tax in the current fiscal year1999/2000 (ending July 15th), up by 30% over last year’s figure, but throughthe first five months collections only totalled NRs3.9bn. At this rate collectionsfor the full year will reach just NRs9.4bn. The government hopes for a much
An unhappy choice ofcentral bank governor—
—prompts the financeminister to resign—
—and draws swift criticismfrom the World Bank
Financial sector reformremains undone
Registration is up—
—but not collections
VAT implementation hasmixed success
38 Nepal
EIU Country Report 1st quarter 2000 © The Economist Intelligence Unit Limited 2000
stronger rate of collection in the second half, as revenue starts to pour in fromthe 5,000 businesses which registered between September and December.
Overall, the government remains woefully behind target in revenue collection.During the first four months of 1999/2000 (to November 16th 1999), domesticrevenue collection rose by just 8.6%, to NRs10.3bn. This is well below the 16%growth in revenue recorded in the previous fiscal year, and even further belowthe rather unrealistic revenue growth target of 21% set in the current budget.Overall resources available to the government, including foreign grants andloans, grew by a sluggish 5.8%, to NRs12.9bn.
The revenue shortfall has not prevented expenditure from rising sharply, by18% to NRs12.9bn. The major increase was in development expenditure,which rose 42% year on year during the four-month period, to NRs2.5bn. Thisis not as irresponsible as it seems: development expenditure fell sharply duringthe political turmoil of the previous two years, when many much-neededprojects simply went on hold. The current increase mostly reflects the long-overdue release of this pent-up expenditure.
More worrying is the increase in regular expenditure (dominated by bureau-cratic salaries and administrative costs), which rose by 10.2% to NRs9.3bn,although this growth rate is slower than the 18% and 15% growth registered inthe previous two fiscal years. But in real terms the growth this year is com-parable, if not higher, owing to a substantially lower inflation rate.
The October rises in prices for diesel and kerosene (4th quarter 1999, page 39)were followed on November 17th by a controversial decision by the NepalElectricity Authority (NEA) to raise electricity tariffs by 30%. The cost of theaverage power tariff is now 9.5 cents per kwh, easily the highest in South Asiaand is among the highest in the world. The main reason for this high cost isNEA’s extreme inefficiency. Officially 23% of the power it generates is lost,although private estimates put the true figure at around 35%. The agency hasno procedures for collecting overdue bills: government offices and state-ownedenterprises alone owe NEA NRs330m. Finally, NEA’s financial structure is amess: it has virtually no sources of finance other than electricity tariffs, and asa result funds investment in new power plants mostly out of current revenue.
Overall inflation remains muted, although the latest available figures from theNRB are only available to mid-November and so do not capture the effect ofenergy price increases. The NRB’s National Urban Consumer Price Index(NUCPI) rose by just 2% year on year in the October-November period(October 16th-November 15th). This compares with a rise of 18.5% in the year-earlier period. On a month-on-month basis, prices actually declined by 0.1% inOctober-November.
The main factor as usual was food and beverage prices, which make up 62% ofthe index. These rose by just 0.7% year on year (dramatically down from the26% rate a year earlier). Inflation in non-food items remained basically steady
The government faces arevenue shortfall
Development expenditurerises sharply—
—as does regularexpenditure
A rate increase makesNepal’s electricity thecostliest in the region
Inflation remains low—
—thanks to stablefood prices
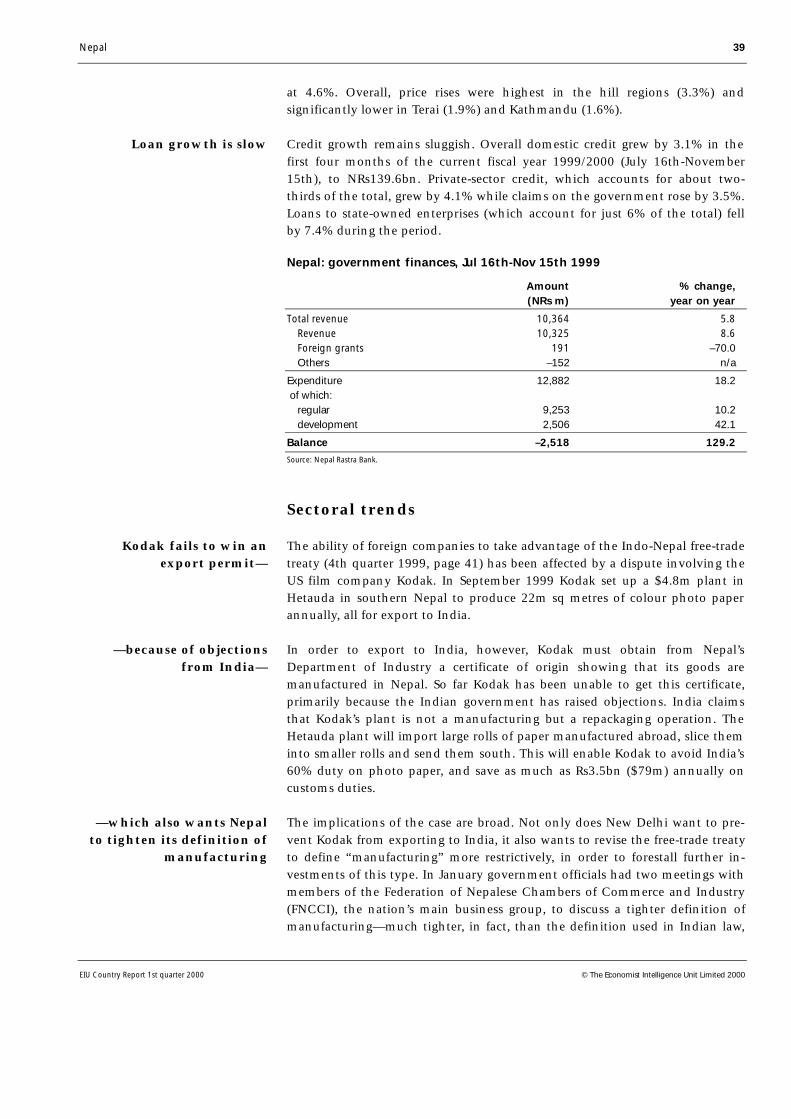
Nepal 39
EIU Country Report 1st quarter 2000 © The Economist Intelligence Unit Limited 2000
at 4.6%. Overall, price rises were highest in the hill regions (3.3%) andsignificantly lower in Terai (1.9%) and Kathmandu (1.6%).
Credit growth remains sluggish. Overall domestic credit grew by 3.1% in thefirst four months of the current fiscal year 1999/2000 (July 16th-November15th), to NRs139.6bn. Private-sector credit, which accounts for about two-thirds of the total, grew by 4.1% while claims on the government rose by 3.5%.Loans to state-owned enterprises (which account for just 6% of the total) fellby 7.4% during the period.
Nepal: government finances, Jul 16th-Nov 15th 1999
Amount % change,(NRs m) year on year
Total revenue 10,364 5.8 Revenue 10,325 8.6 Foreign grants 191 –70.0 Others –152 n/a
Expenditure 12,882 18.2 of which: regular 9,253 10.2 development 2,506 42.1
Balance –2,518 129.2
Source: Nepal Rastra Bank.
Sectoral trends
The ability of foreign companies to take advantage of the Indo-Nepal free-tradetreaty (4th quarter 1999, page 41) has been affected by a dispute involving theUS film company Kodak. In September 1999 Kodak set up a $4.8m plant inHetauda in southern Nepal to produce 22m sq metres of colour photo paperannually, all for export to India.
In order to export to India, however, Kodak must obtain from Nepal’sDepartment of Industry a certificate of origin showing that its goods aremanufactured in Nepal. So far Kodak has been unable to get this certificate,primarily because the Indian government has raised objections. India claimsthat Kodak’s plant is not a manufacturing but a repackaging operation. TheHetauda plant will import large rolls of paper manufactured abroad, slice theminto smaller rolls and send them south. This will enable Kodak to avoid India’s60% duty on photo paper, and save as much as Rs3.5bn ($79m) annually oncustoms duties.
The implications of the case are broad. Not only does New Delhi want to pre-vent Kodak from exporting to India, it also wants to revise the free-trade treatyto define “manufacturing” more restrictively, in order to forestall further in-vestments of this type. In January government officials had two meetings withmembers of the Federation of Nepalese Chambers of Commerce and Industry(FNCCI), the nation’s main business group, to discuss a tighter definition ofmanufacturing—much tighter, in fact, than the definition used in Indian law,
Loan growth is slow
—because of objectionsfrom India—
—which also wants Nepalto tighten its definition of
manufacturing
Kodak fails to win anexport permit—
40 Nepal
EIU Country Report 1st quarter 2000 © The Economist Intelligence Unit Limited 2000
which includes assembly and repackaging. Many companies fear that a hastilyadopted definition could virtually stop the export of Nepalese manufactures toIndia, since most of these are very low value-added products.
The on-again, off-again 10,800-mw Karnali-Chisapani hydroelectric projecttook a tentative step forward in December when a working party representingthe four biggest political parties agreed in principle to issue a survey licence tothe American energy corporation Enron, which made its second application fora licence in February 1999. (It had withdrawn an earlier application in 1998,because of impatience over the approval process.) In order to get the licence,however, Enron must first carry out a preliminary study showing what thebenefits of the project will be for the downstream country (India); specifyinghow clean drinking water, sanitation and other social infrastructure will beensured at the project site; and guaranteeing that the project would requireWorld Bank funding. So far Enron has not acceded to these conditions.
Also inching forward is the opening of Nepal’s insurance industry, currently astate monopoly. The Insurance Board on January 24th offered to issue a licenceto American Life Insurance Company (ALICO), a unit of the US insurance giantAIG. But there are conditions: ALICO must pay a foreign-currency depositequivalent to NRs50m (US$730,000). In addition, its Nepal branch will belimited to two foreign employees for the first three years of operation, afterwhich all employees must be Nepalese. So far ALICO has made no officialresponse to the offer.
Foreign trade and payments
The rapid growth in Nepal’s merchandise trade continues unabated. During thefirst four months of fiscal year 1999/2000 (July 16th-November 15th 1999),exports rose by 33.5% year on year, to NRs13.8bn ($200m), and imports roseby 30.4%, to NRs30.9bn. The resulting trade deficit of NRs17.1bn was 28%higher than in the year-earlier period.
Leading the boom in exports were garments, the share of which increased byan extraordinary 78% to NRs4bn, and pashmina shawls which, with a value ofNRs1.15bn, became the nation’s third-biggest export product. Growth in theother mainstay product, woollen carpets, increased by a more modest 8.6%, toNRs3.3bn.
Strictly speaking, pashmina is Mongolian cashmere wool. In practice, manyshawls labelled as “pashmina” are blends containing various types of naturaland synthetic fibres. Pashmina shawls are a high-priced fashion item whichhave gained popularity as an alternative to even finer—but now widelybanned—shatoosh shawls. (Shatoosh wool can only be produced by killing thewild Tibetan chiru, an endangered species of antelope.)
The sustainability of the pashmina boom is open to question. Pashminaexports dived in December, partly for seasonal reasons—December-February,
Exports continue to boom—
—with garments andpashmina shawls leading
the way
Pashmina exports may notbe sustainable—
The first foreign insurancelicence may soon be issued
Enron is offered a surveylicence for the Karnali
dam project

Nepal 41
EIU Country Report 1st quarter 2000 © The Economist Intelligence Unit Limited 2000
after Christmas orders have been filled, is the industry’s traditional off-season.This put pressure on many newer producers who are undercapitalised and didnot put aside sufficient reserves to tide them over the annual dry spell.
More broadly, the recent surge is partly attributable to a spate of articles onpashmina in the Western fashion press, but perhaps more to the collapse ofKashmir's pashmina industry following last year's Indo-Pakistani skirmishes onthe border of that disputed territory. It is not clear how long Nepal willcontinue to benefit from these factors. In addition, the bulk of Nepal'spashmina industry is controlled by Indian investors who employ mostlyIndian labourers in their factories. They import the raw cashmere from China,paying US dollars, then export the finished product to Indian for Indian rupees(in India the shawls are labelled and then exported to the West). So, onbalance, Nepal loses foreign exchange and reaps no employment benefit.
Trade with India continues to grow far faster than trade with other countries.Exports to India grew by 57% in July-November, totalling NRs5.7bn, whileexports to third countries rose by 21%. India now accounts for almost 42% ofNepal’s exports. While big-ticket items like garments, carpets and pashmina aremostly exported to third countries, India is Nepal’s major market for low-endconsumer goods such as toothpaste, soap and detergent.
The same holds true on the import side. Imports from India rose by 38%during the four-month period, to NRs11.8bn, while those from other countriesincreased by 26%, to NRs19.1bn.
After a surprising surplus at the end of 1998, Nepal’s current account fell backinto deficit in the first two months of the current fiscal year (July 16th-September 15th 1999). The increased merchandise trade deficit offset increasesin the surpluses on services and transfers. The current-account deficit wasNRs1.9bn in mid-September, substantially more than the NRs833m deficitregistered in the comparable year-earlier period.
The fob/cif merchandise trade deficit during the two-month period wasNRs9.5bn, an increase of nearly 50% on the year-earlier period. But thesurpluses on services also rose by close to 50%, to NRs4.2bn, mainly owing to alarge increase (to NRs2.5bn from NRs1.1bn) in the catch-all “other services”category, which partly reflects cash inflows resulting from smuggling of goodsto India. Net transfer income rose by about 25% year on year, to NRs3.4bn,largely because of an increase of NRs800m in private transfers, reflectingincreased remittances from Nepalis working abroad.
Further increases in remittance income are likely as a result of a recent Britishgovernment decision to increase substantially pension rates for veterans ofNepalese units in the British Army (commonly known as Gurkhas). EffectiveApril 1st 2000, pension rates will be increased by between 100% and 192% forall veterans. The move follows several years of lobbying by the Nepalesegovernment to have Gurkha pensions raised at least to the level of pensions
Trade with India growsthe fastest
The current accountreturns to deficit—
—although service andtransfer income rises
The increase in Gurkhapension rates will raise
remittance income
—and mostly benefitIndian entrepreneurs
42 Nepal
EIU Country Report 1st quarter 2000 © The Economist Intelligence Unit Limited 2000
paid to Indian veterans of the British army. The pension increase will raiseNepal’s annual remittance income by about NRs1bn.
The overall balance of payments, however, remained in surplus; at mid-September 1999 the balance amounted to NRs543m. An increase in net foreignloans (to NRs2.2bn from NRs1.4bn) comfortably covered the current-accountdeficit. Also encouraging was an increase in foreign direct investment (FDI),which has been moribund for the last two fiscal years. FDI totalled NRs210mduring the two-month period, more than one-third of the entire FDI inflow forthe full 1998/99 fiscal year.
The balance of paymentsremains positive
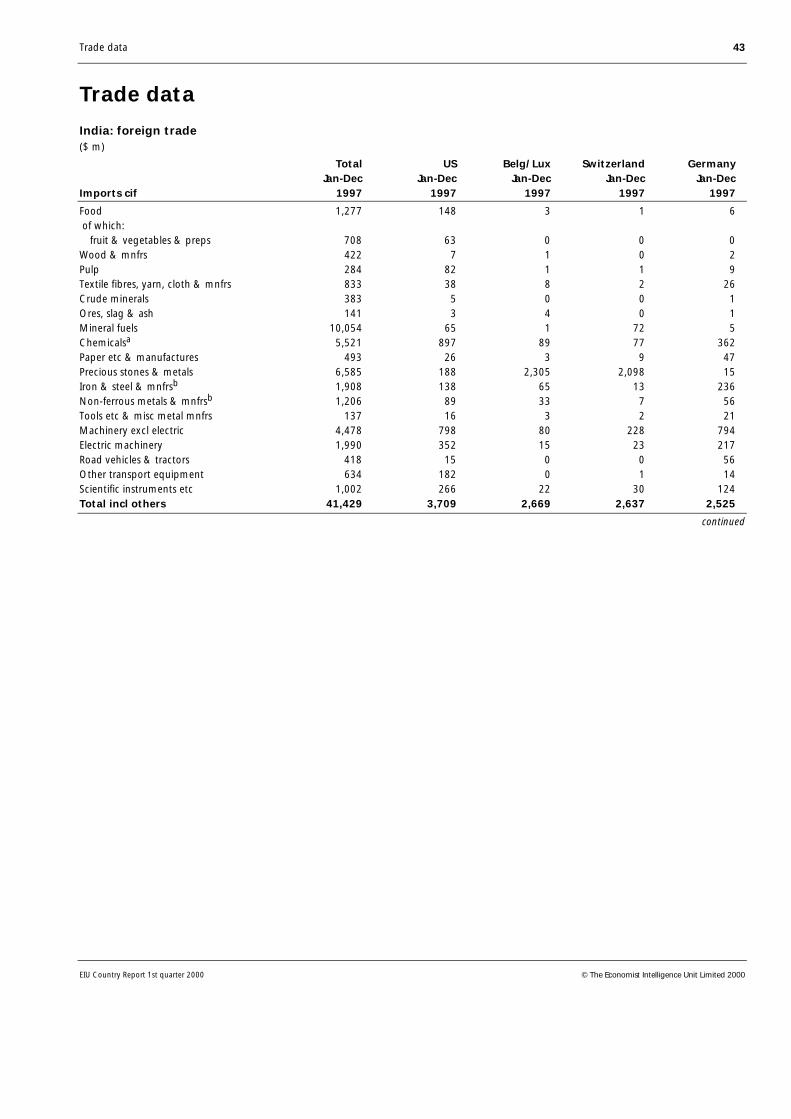
Trade data 43
EIU Country Report 1st quarter 2000 © The Economist Intelligence Unit Limited 2000
Trade data
India: foreign trade($ m)
Total US Belg/Lux Switzerland GermanyJan-Dec Jan-Dec Jan-Dec Jan-Dec Jan-Dec
Imports cif 1997 1997 1997 1997 1997
Food 1,277 148 3 1 6 of which: fruit & vegetables & preps 708 63 0 0 0Wood & mnfrs 422 7 1 0 2Pulp 284 82 1 1 9Textile fibres, yarn, cloth & mnfrs 833 38 8 2 26Crude minerals 383 5 0 0 1Ores, slag & ash 141 3 4 0 1Mineral fuels 10,054 65 1 72 5Chemicalsa 5,521 897 89 77 362Paper etc & manufactures 493 26 3 9 47Precious stones & metals 6,585 188 2,305 2,098 15Iron & steel & mnfrsb 1,908 138 65 13 236Non-ferrous metals & mnfrsb 1,206 89 33 7 56Tools etc & misc metal mnfrs 137 16 3 2 21Machinery excl electric 4,478 798 80 228 794Electric machinery 1,990 352 15 23 217Road vehicles & tractors 418 15 0 0 56Other transport equipment 634 182 0 1 14Scientific instruments etc 1,002 266 22 30 124Total incl others 41,429 3,709 2,669 2,637 2,525
continued
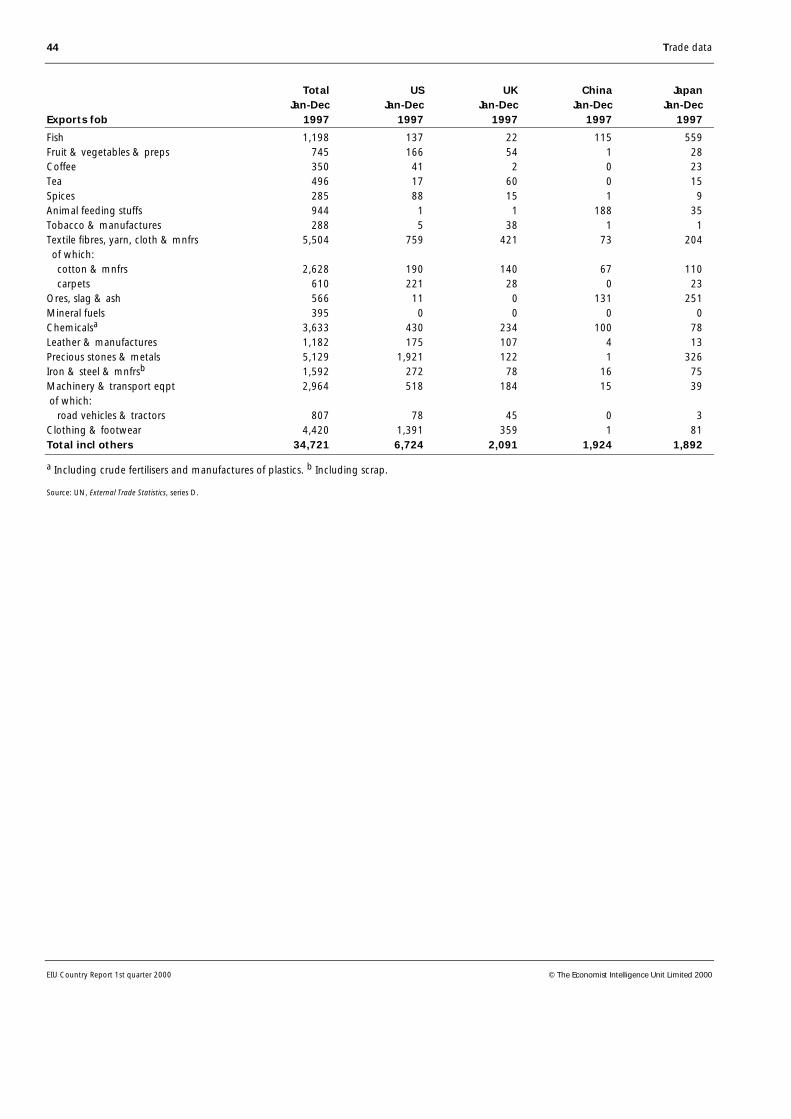
44 Trade data
EIU Country Report 1st quarter 2000 © The Economist Intelligence Unit Limited 2000
Total US UK China JapanJan-Dec Jan-Dec Jan-Dec Jan-Dec Jan-Dec
Exports fob 1997 1997 1997 1997 1997
Fish 1,198 137 22 115 559Fruit & vegetables & preps 745 166 54 1 28Coffee 350 41 2 0 23Tea 496 17 60 0 15Spices 285 88 15 1 9Animal feeding stuffs 944 1 1 188 35Tobacco & manufactures 288 5 38 1 1Textile fibres, yarn, cloth & mnfrs 5,504 759 421 73 204 of which: cotton & mnfrs 2,628 190 140 67 110 carpets 610 221 28 0 23Ores, slag & ash 566 11 0 131 251Mineral fuels 395 0 0 0 0Chemicalsa 3,633 430 234 100 78Leather & manufactures 1,182 175 107 4 13Precious stones & metals 5,129 1,921 122 1 326Iron & steel & mnfrsb 1,592 272 78 16 75Machinery & transport eqpt 2,964 518 184 15 39 of which: road vehicles & tractors 807 78 45 0 3Clothing & footwear 4,420 1,391 359 1 81Total incl others 34,721 6,724 2,091 1,924 1,892
a Including crude fertilisers and manufactures of plastics. b Including scrap.
Source: UN, External Trade Statistics, series D.
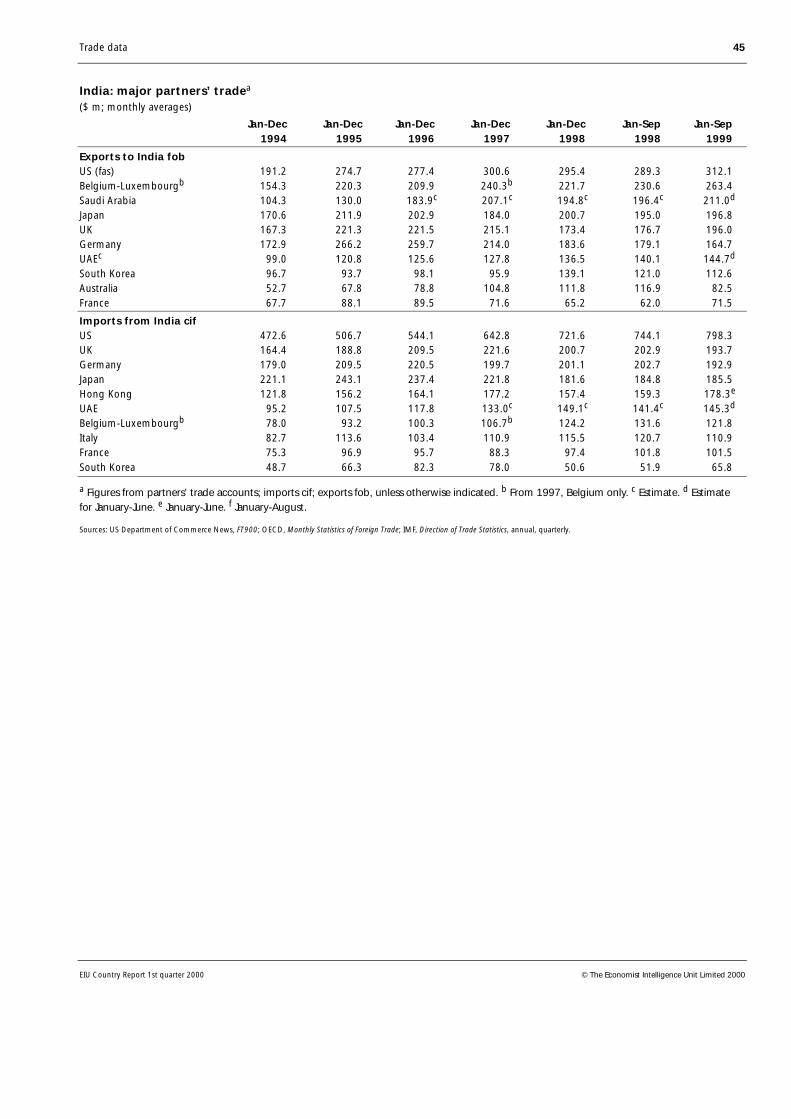
Trade data 45
EIU Country Report 1st quarter 2000 © The Economist Intelligence Unit Limited 2000
India: major partners’ tradea
($ m; monthly averages)
Jan-Dec Jan-Dec Jan-Dec Jan-Dec Jan-Dec Jan-Sep Jan-Sep 1994 1995 1996 1997 1998 1998 1999
Exports to India fobUS (fas) 191.2 274.7 277.4 300.6 295.4 289.3 312.1 Belgium-Luxembourgb 154.3 220.3 209.9 240.3b 221.7 230.6 263.4 Saudi Arabia 104.3 130.0 183.9c 207.1c 194.8c 196.4c 211.0d
Japan 170.6 211.9 202.9 184.0 200.7 195.0 196.8 UK 167.3 221.3 221.5 215.1 173.4 176.7 196.0 Germany 172.9 266.2 259.7 214.0 183.6 179.1 164.7 UAEc 99.0 120.8 125.6 127.8 136.5 140.1 144.7d
South Korea 96.7 93.7 98.1 95.9 139.1 121.0 112.6 Australia 52.7 67.8 78.8 104.8 111.8 116.9 82.5 France 67.7 88.1 89.5 71.6 65.2 62.0 71.5
Imports from India cifUS 472.6 506.7 544.1 642.8 721.6 744.1 798.3 UK 164.4 188.8 209.5 221.6 200.7 202.9 193.7 Germany 179.0 209.5 220.5 199.7 201.1 202.7 192.9 Japan 221.1 243.1 237.4 221.8 181.6 184.8 185.5 Hong Kong 121.8 156.2 164.1 177.2 157.4 159.3 178.3e
UAE 95.2 107.5 117.8 133.0c 149.1c 141.4c 145.3d
Belgium-Luxembourgb 78.0 93.2 100.3 106.7b 124.2 131.6 121.8 Italy 82.7 113.6 103.4 110.9 115.5 120.7 110.9 France 75.3 96.9 95.7 88.3 97.4 101.8 101.5 South Korea 48.7 66.3 82.3 78.0 50.6 51.9 65.8
a Figures from partners’ trade accounts; imports cif; exports fob, unless otherwise indicated. b From 1997, Belgium only. c Estimate. d Estimatefor January-June. e January-June. f January-August.
Sources: US Department of Commerce News, FT900; OECD, Monthly Statistics of Foreign Trade; IMF, Direction of Trade Statistics, annual, quarterly.