increasing the electricity generation capacity from solar ...
97
INCREASING THE ELECTRICITY GENERATION CAPACITY FROM SOLAR RESOURCES AT DUKE UNIVERSITY By: Jun Zhang, Ricardo Zaragoza Castillo Dr. Dalia Patino-Echeverri, Faculty Advisor Dr. Lincoln Pratson, Faculty Advisor April 27, 2018 Masters project submitted in partial fulfillment of the requirements for the Master of Environmental Management degree in the Nicholas School of the Environment of Duke University
-
Upload
khangminh22 -
Category
Documents
-
view
1 -
download
0
Transcript of increasing the electricity generation capacity from solar ...

INCREASING THE ELECTRICITY GENERATION
CAPACITY FROM SOLAR RESOURCES AT DUKE
UNIVERSITY
By: Jun Zhang, Ricardo Zaragoza Castillo
Dr. Dalia Patino-Echeverri, Faculty Advisor
Dr. Lincoln Pratson, Faculty Advisor
April 27, 2018
Masters project submitted in partial fulfillment of the
requirements for the Master of Environmental Management degree in
the Nicholas School of the Environment of
Duke University

Disclaimer
This 2018 student paper was prepared in partial completion of the graduation requirements for the
Master of Environmental Management at the Nicholas School of the Environment at Duke University.
The research, analysis, and recommendations contained in this paper are the work of the students who
authored the document and do not represent the official or unofficial views of the Nicholas School of
the Environment or of Duke University. The author may have relied in many instances on data provided
by different unpublished sources and cannot guarantee its accuracy

Acknowledgment
The completion of this project could not have been possible with the support of:
Dalia Patino-Echeverri, Gendell Associate Professor of Energy Systems and Public Policy, the
Nicholas School of the Environment (NSOE), Duke University (master project client & advisor)
Lincoln Pratson, Gendell Family Professor of Energy and the Environment, NSOE, Duke University
(master project client & advisor)
We also appreciate the valuable input from:
Casey Collins, Energy Engineer, Duke Facilities Management Department (data support & valuable
information)
John Fay, Instructor, Geospatial Analysis Program, NSOE, Duke University (data support)
John Robinson, Assistant Dean for Information Services, NSOE, Duke University (data support)
Jim Gaston, Director of the Duke Smart Home Program, Duke University (valuable information)
Tim Johnson, Associate Professor of the Practice in Energy and the Environment & Chair of the
Nicholas School Energy and Environment Program, NSOE, Duke University (valuable information)
Bandar Alqahtani, Ph.D. Candidate, NSOE, Duke University (model technical support)
Edgar Virguez Rodriguez, Ph.D. Student, NSOE, Duke University (tech support & valuable
information)
Tallman Trask III, Executive Vice President, Duke University (valuable information)
Claire Wang & Tamasha Pathirathna, Duke University (support from Duke Climate Coalition)
We also like to acknowledge the support from the National Council for Science and Technology
(CONACYT), and the Mexican Secretariat of Energy (SENER), which sponsored Ricardo Zaragoza-
Castillo’s master studies.

Table of Contents
Disclaimer .................................................................................................................................................... 2
Acknowledgment ........................................................................................................................................ 3
Figures ......................................................................................................................................................... 7
Tables .......................................................................................................................................................... 9
Executive Summary ................................................................................................................................... 10
Introduction .............................................................................................................................................. 11
Overview ............................................................................................................................................... 11
Objectives .............................................................................................................................................. 13
Duke University’s Energy Needs and Sustainability Goals ........................................................................ 14
Overview ............................................................................................................................................... 14
Duke’s Goal of Becoming Carbon Neutral by 2024 ............................................................................... 15
Technical Potential of Solar PV Capacity on Duke University System ...................................................... 17
Rooftop .................................................................................................................................................. 17
Data and Methods ............................................................................................................................. 17
Solar PV Technical Potential .............................................................................................................. 25
Parking Lots ........................................................................................................................................... 27
System-wide Impact Analysis.................................................................................................................... 31
Characteristics of Duke Energy Carolinas & Duke Energy Progress (DEC/DEP) .................................... 31
Trends in Energy Demand and Status of the Energy System ............................................................ 31
Possible Update, Retirement, and New Resource Addition Plan by 2030 ........................................ 33
Data and Methods ................................................................................................................................. 35
Simulation of System Operation (DAUC/DAED/RTED) ...................................................................... 35
Results & Discussion .............................................................................................................................. 39

Generation Mix .................................................................................................................................. 39
System Costs ...................................................................................................................................... 39
CO2e, NOX, and SO2 Emissions .......................................................................................................... 42
Reliability ........................................................................................................................................... 44
Review of Regulatory Framework ............................................................................................................. 45
Public Utility Regulatory Policies Act (PURPA) ...................................................................................... 45
Investment Tax Credit and Rebates Programs ...................................................................................... 46
Renewable Energy Efficiency Portfolio Standard (RPS) ........................................................................ 47
Renewable Energy Certificates (RECs) .................................................................................................. 48
Interconnection and Net Metering ....................................................................................................... 49
Power Purchase Agreement (PPA) ........................................................................................................ 50
Conclusions............................................................................................................................................ 51
Economic Performance and Financing Alternatives ................................................................................. 53
Costs of Developing the Solar PV Generation Potential at Duke University ........................................ 53
PV Rooftop ......................................................................................................................................... 53
Beyond Rooftop ................................................................................................................................. 54
Economic Benefits of Developing the Solar PV Generation Potential .................................................. 56
Scenario Analysis ............................................................................................................................... 58
Sustainability Cost-Effectiveness Assessment .......................................................................................... 61
Purchasing RECs .................................................................................................................................... 62
Carbon Offset Projects .......................................................................................................................... 62
Reevaluate the Cost of Electricity under Carbon Tax Scenarios ........................................................... 64
Best Practices in other Universities....................................................................................................... 66
Arizona State University (ASU) .......................................................................................................... 67
UC Riverside & UC Davis .................................................................................................................... 68
Harvard University ............................................................................................................................. 69
Best-Practice Takeaways ................................................................................................................... 70
Conclusions ............................................................................................................................................... 72
Conclusions............................................................................................................................................ 72
Opportunities & Challenges .................................................................................................................. 73
Opportunities ..................................................................................................................................... 73
Challenges .......................................................................................................................................... 74
Limitations and Future Research Focuses ............................................................................................. 75
Appendix ................................................................................................................................................... 77
Appendix 1. Model Assumptions -- Power System Operation Model .................................................. 77
Appendix 2. Parking Lots Available Area for PV Installation ................................................................. 79
References ................................................................................................................................................ 90

Figures
Figure 1. Duke University has reduced 24% since 2007, but still, need to reduce 21% and offset 55% in
the next 6 years [2] ................................................................................................................................... 11
Figure 2. Data of FY2017 shows that electricity consumption is the largest contributor, accounting for
36% of the total annual expenses. ............................................................................................................ 14
Figure 3. Duke University emissions (2007 to 2047) ................................................................................ 16
Figure 4. Proposed solar panels on Research Drive Garage. .................................................................... 16
Figure 5. The process followed to estimate the technical potential capacity of rooftop solar PV on
Duke’s campus .......................................................................................................................................... 18
Figure 6. Duke University Buildings (as of 2016) ...................................................................................... 19
Figure 7. Flat roofs are unaffected by building orientation, while sloped roofs are assumed to have 50%
of the south-facing area. ........................................................................................................................... 20
Figure 8. Duke University’s roof area is featured with a high percentage of flat roofs and a noticeable
share of gothic sloped roofs, which are hard to utilize in solar PV development. Data of flat and sloped
roof area are estimated based on our parameter assumptions, which comes from visual investigation
and literature reviews. .............................................................................................................................. 21
Figure 9. Shading effect parameters for Duke University are obtained from Google Project Sunroof
database. ................................................................................................................................................... 24
Figure 10. Comparison of three solar output modeling methods (System Size = 51.5 MWdc) ............... 27
Figure 11. Averaged Hourly Solar Output (System Size = 51.5 MWdc) .................................................... 27
Figure 12. Duke University Parking Lots on Campus, excluding parking garages .................................... 28
Figure 13. Shapes and extensions of different parking lots differ, and rectangular parking lots are more
suitable for installing solar PV systems. .................................................................................................... 29
Figure 14. Parking lots in the west (left) and central campus (right) are close to substations ................ 29
Figure 15. West and Medical Campuses own the largest technical potential. ........................................ 30
Figure 16. Durham County, where Duke University is located in, is one of the overlapping counties
between DEC and DEP .............................................................................................................................. 32
Figure 17. Resource Plan over the 15-Year Planning Horizon. ................................................................. 34
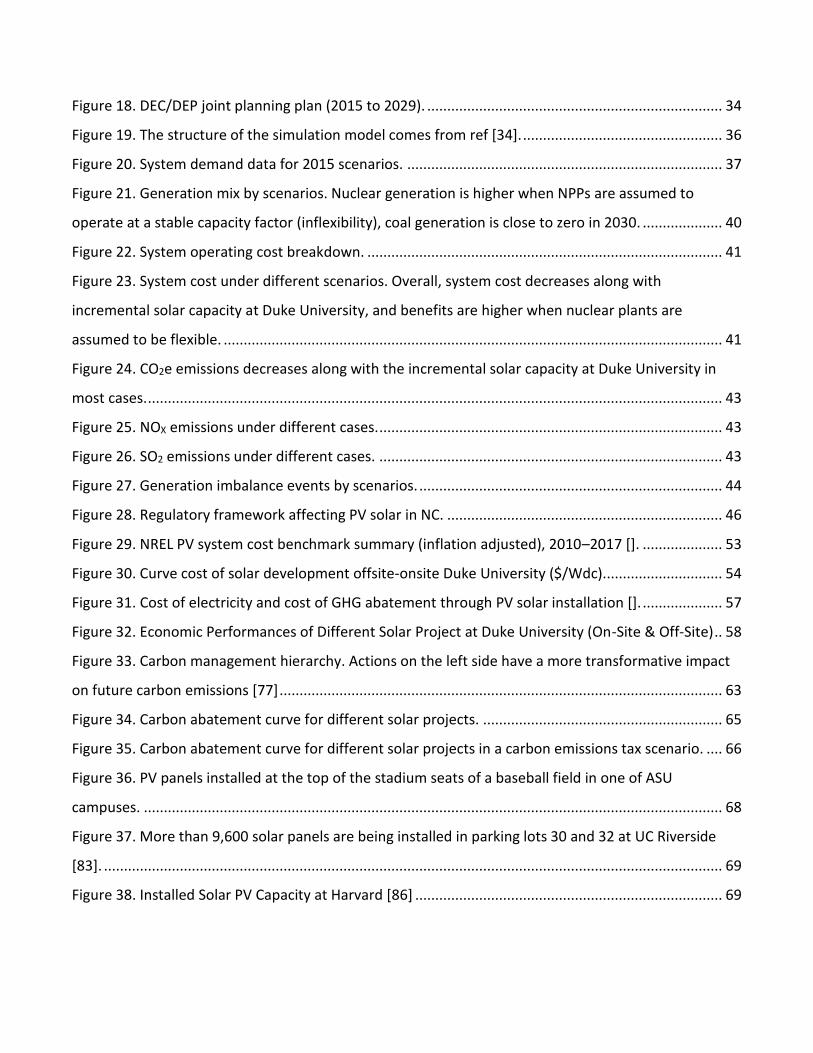
Figure 18. DEC/DEP joint planning plan (2015 to 2029). .......................................................................... 34
Figure 19. The structure of the simulation model comes from ref [34]. .................................................. 36
Figure 20. System demand data for 2015 scenarios. ............................................................................... 37
Figure 21. Generation mix by scenarios. Nuclear generation is higher when NPPs are assumed to
operate at a stable capacity factor (inflexibility), coal generation is close to zero in 2030. .................... 40
Figure 22. System operating cost breakdown. ......................................................................................... 41
Figure 23. System cost under different scenarios. Overall, system cost decreases along with
incremental solar capacity at Duke University, and benefits are higher when nuclear plants are
assumed to be flexible. ............................................................................................................................. 41
Figure 24. CO2e emissions decreases along with the incremental solar capacity at Duke University in
most cases. ................................................................................................................................................ 43
Figure 25. NOX emissions under different cases. ...................................................................................... 43
Figure 26. SO2 emissions under different cases. ...................................................................................... 43
Figure 27. Generation imbalance events by scenarios. ............................................................................ 44
Figure 28. Regulatory framework affecting PV solar in NC. ..................................................................... 46
Figure 29. NREL PV system cost benchmark summary (inflation adjusted), 2010–2017 []. .................... 53
Figure 30. Curve cost of solar development offsite-onsite Duke University ($/Wdc).............................. 54
Figure 31. Cost of electricity and cost of GHG abatement through PV solar installation []. .................... 57
Figure 32. Economic Performances of Different Solar Project at Duke University (On-Site & Off-Site) .. 58
Figure 33. Carbon management hierarchy. Actions on the left side have a more transformative impact
on future carbon emissions [77] ............................................................................................................... 63
Figure 34. Carbon abatement curve for different solar projects. ............................................................ 65
Figure 35. Carbon abatement curve for different solar projects in a carbon emissions tax scenario. .... 66
Figure 36. PV panels installed at the top of the stadium seats of a baseball field in one of ASU
campuses. ................................................................................................................................................. 68
Figure 37. More than 9,600 solar panels are being installed in parking lots 30 and 32 at UC Riverside
[83]. ........................................................................................................................................................... 69
Figure 38. Installed Solar PV Capacity at Harvard [86] ............................................................................. 69

Tables
Table 1. Summary of building orientation reduction factor for each building type. ............................... 23
Table 2. Key Assumptions of Solar PV System .......................................................................................... 25
Table 3. Summary of data sources ............................................................................................................ 36
Table 4. Parameters for conventional generators [34]. ........................................................................... 37
Table 5. Model Scenarios Description ...................................................................................................... 38
Table 6. Investment Tax Credits for solar PV systems, by year of starting construction. ........................ 51
Table 7. Electricity Generation from PV on parking lots. ......................................................................... 59

10
Executive Summary
Duke University has set the goal of achieving carbon neutrality by 2024. This study explores the
alternative of contributing to this target through the installation of solar photovoltaic systems (PV)
from environmental, technical, regulatory, economic, and financial perspectives. It estimates the
technical potential of on-site PV on the main Duke Campus and assesses the opportunities and
challenges posed by federal and state regulations. We found out that the maximum technical potential
of solar PV systems is 51.5 MWdc when being installed on rooftops and 35.6 MWdc when being
installed atop parking lots. Together, Duke University owns 87.1 MWdc on-site PV technical potential.
Our power system operation analysis illustrates that the on-site solar capacity addition at Duke
University would incrementally reduce the system cost and emissions, while the 300-MWdc solar farm
would negatively impact the power system economics and grid reliability. The costs of installation on
parking lots are lower than on rooftops, but due to economies of scale, the most economical option to
reduce emissions is to install off-site solar farms. For the cost-effectiveness of sustainability, this study
also estimates the carbon abatement costs (COA) of carbon-abating strategies including PV, carbon
offset, and Renewable Energy Credits (RECs) that Duke University could apply at this stage under
business-as-usual (BAU) and carbon-tax scenarios.
We also find that state regulations severely limit the benefits of on-campus PV development given a)
the lack of programs allowing the participation of third-party energy providers, b) the limitation of
standard Power Purchase Agreements for solar energy facilities to less than 1 MWdc, and c) the lack of
certainty on the value of RECs.
Advisor: Dr. Dalia Patino-Echeverri
11
Introduction
Overview
On October 15, 2009, Duke University released its Climate Action Goal and thus established its goals
and possible pathways to becoming a carbon-neutral campus by 2024 [1]. To achieve this goal, Duke
University has planned to reduce its GHG emissions by nearly 45% relative to 2007 baseline (333k
MTCO2e1) and offset 183k MTCO2e to through several carbon-offset projects, as shown in Figure 1. As
of 2017, Duke has reduced 24% of its carbon emissions relative to a 2007 baseline by switching to
cleaner fuels and improving energy efficiency [2], and by benefiting from the fact that the electricity
provided by the Duke Energy Carolinas – Duke Energy Progress (DEC/DEP) company through the grid is
now coming from less carbon-intensive sources [3]. To continue a path of GHG emissions reductions it
will be necessary to either decrease electricity, steam and chilled water consumption or switch to more
environmentally friendly energy sources. Therefore, developing renewable energy is widely discussed
as one of the potential solutions to reduce the use of purchased electricity. One approach is to develop
solar photovoltaic (PV) systems.
Figure 1. Duke University has reduced 24% since 2007, but still, need to reduce 21% and offset 55% in the next 6 years [2]
Recently, Duke has begun construction of solar PV arrays atop Research Drive Parking Garage, which
will produce 1.3M kWh electricity annually once completed [4]. As of the end of 2017, the only other
1 metric tons of carbon dioxide equivalent (MTCO2e).

12
rooftop PV systems on campus are in the Nicholas School’s Environment Hall and the Smart Home.
These on-site solar installations have a combined nominal power generation capacity of 46.7 kWdc,
only contributing less than 0.01% to the total campus electricity demand2. According to the Climate
Action Plan [1], by installing solar PV atop three existing parking garages and the Smith Warehouse, the
solar power generation capacity would increase to 4 MWdc and would produce 4.7M kWh per year,
assuming a 13.3% capacity factor, which is the average for the state of North Carolina [5]. This
investment would cover a bit more than 1% of the annual electricity consumption and would have a
total cost of $12 million (2008USD). Assuming a lifetime of between 10 and 15 years, and zero discount
a rate, these PV arrays would generate electricity at a cost of ¢17/kWh to ¢26/kWh, which is about 2.4-
3.6 times the price currently charged for grid electricity by Duke Energy, the regulated utility in this
region. However, with dropping prices and growing efficiency, the cost-effectiveness of solar PV on-site
has also increased and hence, it is worthwhile to examine the option of increasing PV solar capacity in
more detail.
Apart from its impacts on Duke’s costs of electricity developing more solar power capacity will also
affect the reliability, cost, and emissions of the power system [6] where the campus is located in. If
Duke’s reduced electricity consumption resulted in lower utilization of coal-fired power plants at all
times, the system-wide effects would be positive. However, if Duke’s production of solar PV electricity
resulted in an increased ramp of the demand for the system, and necessitated of increased utilization
of combustion turbines, its overall environmental impact would be negative. Hence, looking at the
system-wide effects is necessary for a thorough assessment of the environmental sustainability of solar
PV development. The methodology for analyzing system-wide impacts is straightforward as presented
in studies that assess how territory-wide roof-top solar system development affect the entire power
system including PJM [7], CAISO [8] and Duke Energy Carolinas (DEC)/ Duke Energy Progress (DEP)
system [34].
However, only a few studies pay attention to local cases. Take Duke University as an example; despite
2 calculated from Duke University’s internal energy consumption data (not public available).

13
its flat roofs, parking lots, and an open space stadium suitable for on-site solar PV installation,
developing solar may not be an economic strategy due to low current electricity prices, the regulated
electricity market in NC, interconnection costs, and distribution costs. To fill this gap, this study
examines the technical, regulatory, environmental, and economic opportunities and challenges of
increasing solar generation capacity through developing on-site solar PV system in the Durham campus
& Health System of Duke University (Duke University System, DUS) and its effects on the reliability,
cost of electricity, and air emissions of the DEC/DEP power system. The option of developing solar PV
generation capacity on site is compared different strategies for reducing GHG emissions, including the
development of solar off-site, and the purchase of Renewable Energy Certificates (RECs) and carbon
offsets. The goals of this analysis are as follows:
1) Through the power system operation analysis, we hope to inform DEC/DEP about the effect that a
large consumer embracing on-site solar generating capacity may have on the entire power system.
This analysis will also allow Duke University to estimate the environmental impact of its actions and
calculate the cost per unit of GHG emissions abated;
2) Through the financial and regulatory analysis, we expect to uncover opportunities and challenges in
the complex solar integration issue at Duke University System regarding reliability, regulations, and
cost-effectiveness, from which we support Duke University System in its individual decision making
on developing renewables;
3) Through the comparison of different GHG reductions alternatives, we hope to inform Duke’s
decisions related to its climate and sustainability goals.
Objectives
The goal of this project is to estimate the impact that development of all the potential for solar PV
power generation capacity on campus may have on the reliability, cost of electricity and carbon
emissions of the DEP/DEC power system, and then evaluate financial and regulatory opportunities and
challenges of pursuing this alternative.

14
Duke University’s Energy Needs and Sustainability Goals
Overview
The GHG footprint of Duke University is associated to the water and energy consumption of all its
research and educational facilities, the medical center, food services, and transportation system [9],
and to its waste generation and treatment. As shown in Figure 2, direct electricity consumption
accounts for 36.6% of the annual energy cost in 2017, followed by the cost of chilled water and the
cost of steam.
Figure 2. Data of FY2017 shows that electricity consumption is the largest contributor, accounting for 36% of the total annual expenses.
In this study, we focus on direct electricity consumption, and as Figure 1 shows, for the financial year
2017 (FY20173), the electricity bill represented 36.6% of the total Duke’s expenditures on energy and
water services followed by the expenses on steam and chilled water with 26.5% and 24.1%, water &
sewer (6.4%), stormwater (3.6%), emergency power (1.7%), and hot water (1.5%). We focus on
electricity consumption because it is provided by the local utility (DEP/DEC) and the integration of solar
3 FY 2017 = July 2016 to Jun 2017
Electric36%
Chilled water26%
Steam24%
Water & Sewer7%
Storm Water
4%
Emergency Power
2% Hot Water1%Other
7%
Energy Cost Breakdown (FY2017)

15
PV system would affect this consumption, as well as the utilities’ system. The electricity consumed in
FY2017 was 444M kWh at a cost of $0.07/kWh which represented a total expenditure of $31M
(according to Duke Facilities Management). Based on the 2017 Greenhouse Gas Accounting from Duke
Office of Sustainability [2], the generation of this electricity caused the emission of 258k MTCO2e. This
number is close to the 260k MT CO2e estimated using the average System’s emissions reported by the
Duke Energy 2016 Sustainability Report [10] of 0.585 MTCO2e/MWh. The difference between the two
estimates may be explained by the differences in the years taken to estimate them, and the difference
between fiscal and calendar years.
Duke’s Goal of Becoming Carbon Neutral by 2024
Duke University committed to becoming carbon neutral by 2024 by signing the American College and
University President's Climate Commitment in 2007 and then developing a map road published on
2009. This commitment is rooted in the understanding that climate change is a real fact, that human
activity has contributed to it, and that the University needs to raise awareness about the need of being
carbon neutral in all its students, academic staff and employees.
To achieve its goal, Duke University has been implementing a strategic plan that includes offsetting its
GHG emissions through biogas generation, reforestation, and implementation of energy efficiency
measures. Biogas [11] generated in the Loyd Ray Farms has eliminated methane emissions while
generating renewable energy and reducing side effects of the open-air lagoon waste disposal. Duke has
also planted trees in urban areas [12] throughout North Carolina, Arizona, and New York; and has
implemented energy efficiency measures for reducing the energy consumption of buildings. Also, Duke
has implemented strategies to reduce its water footprint, restore natural areas, improve its
transportation system, procure sustainable food, and reduce the overall waste stream on Duke
campus.
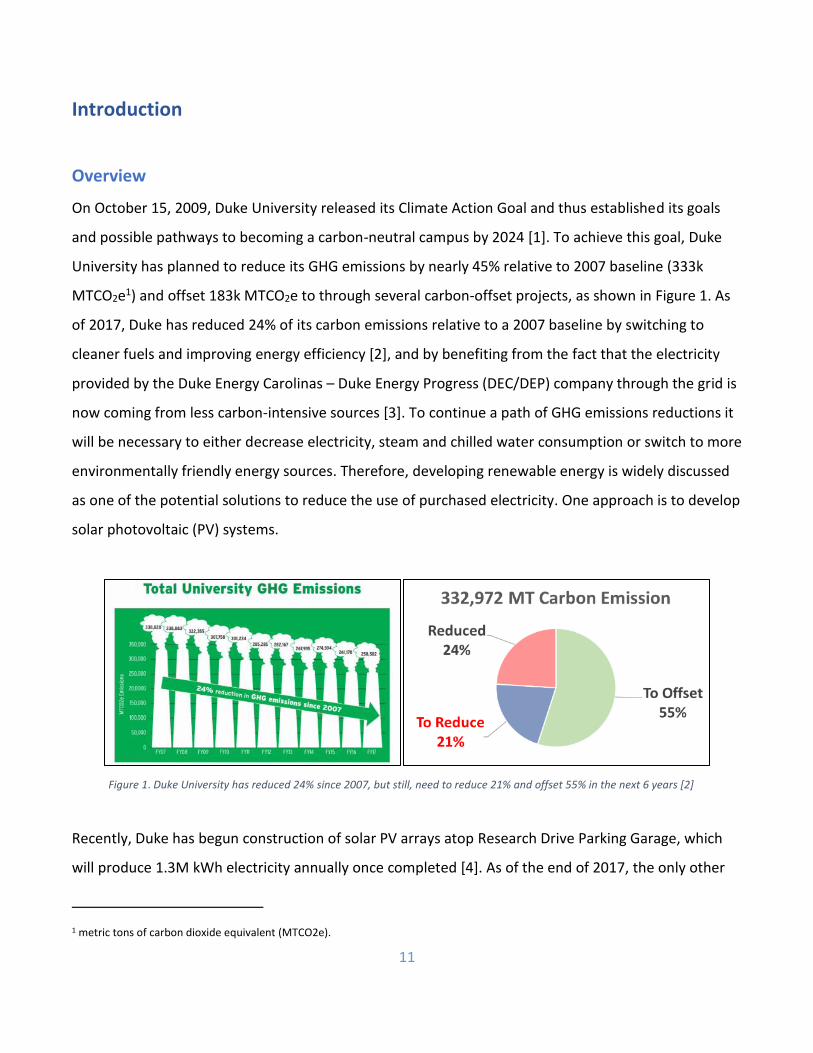
Figure 3 shows the gradual reduction of emissions offsets of Duke by cleaning its energy source and
transportation system. The main reductions would be reached by around 2019 and 2030, and then a
constant reduction until 2050 where it will reach around 50k MTCO2e emitted.
16
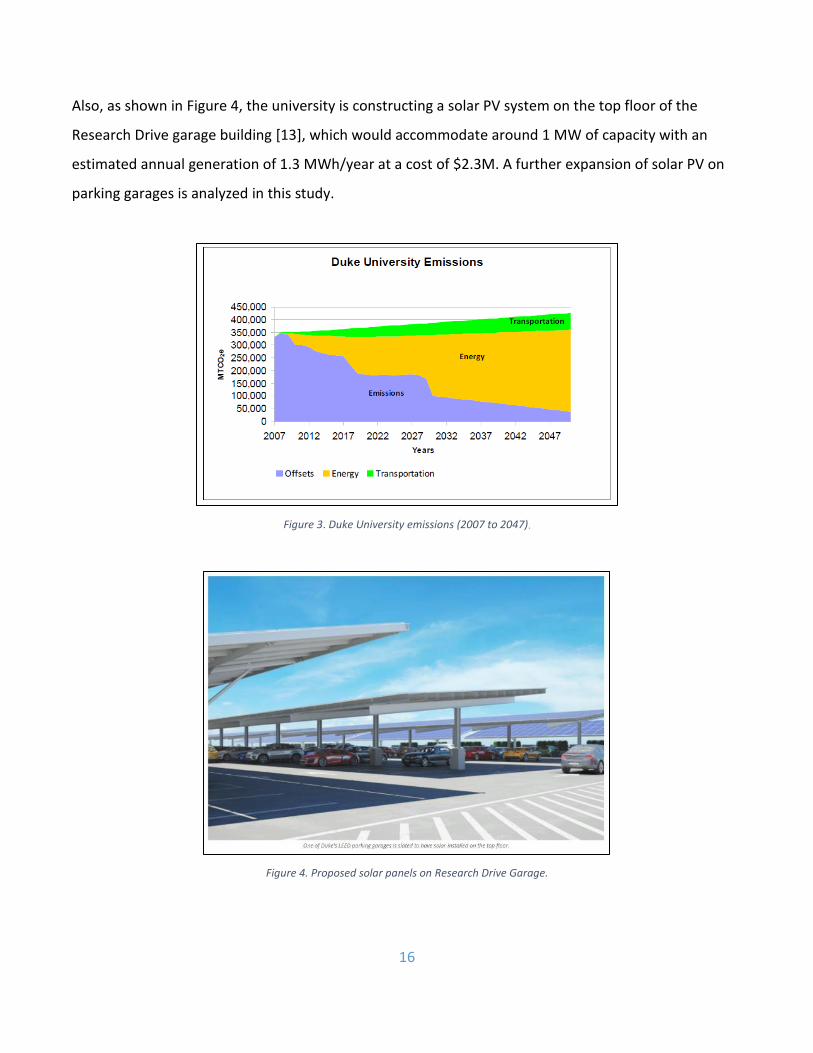
Also, as shown in Figure 4, the university is constructing a solar PV system on the top floor of the
Research Drive garage building [13], which would accommodate around 1 MW of capacity with an
estimated annual generation of 1.3 MWh/year at a cost of $2.3M. A further expansion of solar PV on
parking garages is analyzed in this study.
Figure 3. Duke University emissions (2007 to 2047).
Figure 4. Proposed solar panels on Research Drive Garage.

17
Technical Potential of Solar PV Capacity on Duke University System
Technical potential refers to the maximum system size atop the rooftop area suitable for solar PV
installation, assuming economics and grid integration are not a constraint. There are many definitions
of technical potential, and other explanations may affect results by 25% or more [14]. In this study, the
description of technical on-site solar potential meets the following criteria:
1) South-facing
2) shade-free area
3) Obstacle-free area
When estimating the technical potential, we assume a perfect layout of solar PV arrays, which
indicates that all available area will be used for panel installations. Considering the difference in data
sources, we applied different methods to estimate the technical potential of solar PV capacity on the
rooftop and in parking lots separately. For the technical potential of solar PV capacity on rooftops,
since we already obtained roof area data from Duke Libraries [15], we determined 44% of the total
roof area is available for installing solar PV, which can install at most 51.5 MWdc solar generating
capacity. Regarding parking lots, due to lack of area data, we identified the available area in Google
Maps. A total area of over 177k m2 in various parking lots can provide 35.6 MWdc solar generating
capacity. In total, Duke has the technical potential of installing 87.1 MWdc solar PV systems on-
campus.
Rooftop
Data and Methods
A three-step procedure has been applied in this study to analyze available rooftop area for installing
solar PV arrays, as shown in Figure 5. The availability of official roof data of Duke University System
from Duke Libraries has facilitated this assessment. We conducted field validations to validate the data
accuracy and then discounted the total roof area by applying reduction factors to account for the

18
effects of shading, orientation, and the presence of other objects (e.g. water tanks, solar water-
heaters). After estimating the available roof area, we calculated the maximum technical potential of
solar PV, and then estimate hourly generation based on historical generation data of the solar PV
system atop Environment Hall and on the simulation results of PVWatts [16] and Hybrid Optimization
of Multiple Energy Resources (HOMER) [17]. Estimates from these three methods are compared and
averaged and used in the analysis of the system-wide effects.
Several studies are quantifying rooftop solar PV potential of a given region, city, or country and several
analytical methods have been developed to estimate available rooftop area [18] [19] [20]. As shown in
Figure 6. , in our study, we use official GIS layers of Duke Campus buildings4 obtained from Duke
Libraries [15], validated with field observations and then applied area reduction factors. From the
estimates of rooftops’ area, we estimate the solar PV system size and corresponding hourly
generation.
Figure 5. The process followed to estimate the technical potential capacity of rooftop solar PV on Duke’s campus
Field Validation
We conducted a field inspection of a subsample of the available roofs to measure the accuracy of the
area data in the GIS layer file; and to obtain an estimate of how much this area should be reduced to
4 area data: official blueprint shapefile (current buildings & future construction plan)
total roof print area
Step 1:
field validation
Step 2:
apply reduction
factors
available rooftop area for solar PV
Step 3:
estimation of solar PV potential
(size, generation)

19
account for shading, orientation, and other objects on rooftops [21].
Reduction
For rooftops, not all roof print area can be utilized for installing PV arrays because of the shading
effects, the overhead water tanks, and the chimneys. As mentioned above, the technical solar
potential examined in this study only considers areas that are south-facing, shade-free, and obstacle-
free. Correspondingly, in this stage, total roof area will be reduced by the factors of orientation,
shades, and obstacles.
With limited time and resources, we determined the values of these parameters based on 1) field
surveys of sample roofs, 2) satellite image analysis, and 3) literature reviews. It is worth noting that we
assume that green roofs (i.e., gardens planted atop rooftops) do not affect the ability to install solar PV
arrays. This assumption is consistent with the installation of the PV solar panels in Environment Hall,
where developers used racking structures to hold the PV panels atop the vegetables and herbs garden.
These structures provide useful shade for this garden.
Figure 6. Duke University Buildings (as of 2016)

20
Building Orientation
The optimal azimuth for maximizing the electricity production of solar PV in the Northern Hemisphere
is south-facing because this orientation ensures the panel will receive the most solar irradiance. For
this reason, building orientation affects the viability of installing qualified solar PV in this case. In this
study, we applied the principle of the method in ref [21] and further develop it to estimate the effect
of building orientation on DUS. To be more specific, flat buildings are unaffected by the building
orientation (𝐵𝑓𝑙𝑎𝑡 = 1), as flat-placed PV arrays are free from the effects of sun azimuth, and tilted PV
arrays can be ensured to face south on flat roofs. In contrast, buildings with sloped/gable roofs in this
study are considered to have only 50% of the roofs suitable for solar PV installations (𝐵𝑠𝑙𝑜𝑝𝑒𝑑 = 0.5),
as we assume only half of the roof can be south-facing (Figure 7. ).
Figure 7. Flat roofs are unaffected by building orientation, while sloped roofs are assumed to have 50% of the south-facing area.
To estimate the building orientation reduction factor, it is necessary to break down the roof types at
Duke University. Considering that different types of campus buildings have various ratios of flat and
sloped roofs, we estimate the fraction of properly oriented roof area (ROF) by types of campus
buildings. Within each building type, if this type contains gothic buildings, buildings are further broken

21
down into buildings inaugurated in 1940 or earlier and those inaugurated after 1940. This is a simple
but effective method to distinguish gothic buildings from all other campus buildings. At the next stage,
buildings are further classified into flat buildings and sloped buildings.
Figure 8. Duke University’s roof area is featured with a high percentage of flat roofs and a noticeable share of gothic sloped roofs, which
are hard to utilize in solar PV development. Data of flat and sloped roof area are estimated based on our parameter assumptions, which
comes from visual investigation and literature reviews.
1) Academic Buildings
According to the official roof data, 32% of the total roof area are academic building roofs, while 22% of
the academic building roof area is identified as gothic sloped roofs as they are opened before 1940.
Within the rest of academic building roofs, 5% of them are considered sloped roofs and 95% as flat
roofs. This estimation is based on our visual investigation of sample roofs in google maps, field, and
ArcGIS.
2) Athletic Buildings
Athletic buildings account for 10% of the total roof area. Among this type, only the Cameron Stadium
(1971.6 m2) was identified as having a gothic sloped roof (because it is inaugurated before 1940). In
0 20,000 40,000 60,000 80,000 100,000 120,000 140,000 160,000 180,000 200,000
Academic
Medical Center
Athletic
Housing
Auxiliaries
Garage
Others
Under Construction
Area (m2)
Cat
ego
rie
s
DUKE University Roof Area Breakdown (2016)

22
this case, 4% of the total athletic building roof area is sloped, and 96% of its roof is flat.
3) Auxiliary Buildings
Auxiliary buildings make up 7% of the total roof area. Almost all are flat except for the Washington
Duke Inn (9802 m2) which is assumed to have 50% flat roof area and 50% sloped roof area. As a result,
11% of the auxiliaries building roof area is estimated to be sloped, while 89% is assumed to be flat.
4) Under Construction, Housing, and Medical Center Buildings
Buildings under construction only account for 0.5% of the total roof area, and all of them are assumed
to be flat roofs. Parking garages, which make up 7.2% of the total roof area, are perfectly suitable for
installing solar PV arrays, as 100% of the garage roofs are flat. Housing buildings are mostly constituted
by gothic dormitories (23,883 m2, 39%) and central campus apartments (36,828 m2, 61%), and hence
nearly all of them have sloped roofs. Specifically, for gothic dormitories, all roofs are sloped, while 15%
of the roofs in the central campus apartments are sloped-flat roofs, which we regard as identical to flat
roofs in our study. The medical center buildings have many small and large buildings and account for
31.8% of the total roof area. Based on our visual investigation, we assume 5% of them are sloped roofs,
and 95% are flat roofs.
5) Unspecified Buildings
Finally, 1.1% of the total roof area is unspecified in the official roof data. After reviewing the dataset,
we found that these roofs include miscellaneous buildings and proposed buildings (built in the future).
We assume that, for this category, its ratio of flat roofs to sloped roofs is the same as the weighted
average ratio of all other building types discussed above (78% flat roofs and 22% sloped roofs).
In this study, spreadsheet modeling, google maps, and ArcGIS are used for visually investigating and
calculating the ratio of flat to sloped roofs for all campus-building types. The final area estimation is
presented in Figure 8. , while the overall ROF is given by Equation 1 and Table 1 below:

23
Equation 1
𝑹𝑶𝑭 = 𝑷𝑨𝑪𝑨 ∗ (𝑩𝑨𝑪𝑨𝒇𝒍𝒂𝒕 ∗ 𝑹𝑨𝑪𝑨𝒇𝒍𝒂𝒕
+ 𝑩𝑨𝑪𝑨𝒑𝒆𝒂𝒌𝒆𝒅 ∗ 𝑹𝑨𝑪𝑨𝒑𝒆𝒂𝒌𝒆𝒅
) + … + 𝑷𝑶𝑻𝑯 ∗
(𝑩𝑶𝑻𝑯𝒇𝒍𝒂𝒕 ∗ 𝑹𝑶𝑻𝑯𝒇𝒍𝒂𝒕
+ 𝑩𝑶𝑻𝑯𝒑𝒆𝒂𝒌𝒆𝒅 ∗ 𝑹𝑶𝑻𝑯𝒑𝒆𝒂𝒌𝒆𝒅
) = 𝟖𝟗. 𝟔%
Table 1. Summary of building orientation reduction factor for each building type.
Shading Effects & Other Uses
The next two factors that we must take into consideration are the shading effects and other uses
(obstacles). Different researchers use different values of the fraction of available roof area in their
research initiatives such as [20] [22] [23]. In our study, we adopted the method used by the Google
Project Sunroof [14], which estimates the percentage of qualified area for solar PV (where “qualified”
refers to slightly different criteria than the one used in this study). According to their estimation, for
the city of Durham, 63% of the total roof area is qualified (less shady or shade-free). Because data for
Duke’s zip code 27708 is not available, we use city-level data as a proxy. According to Google Sunroof
(Figure 9. ), the shading effect in Duke University System is below the city-level average. For
simplification, we assume that 0.65 is the reduction factor of shading effect (Rshading = 0.65).
Building Type Area Proportion (P) Roof Type Ratio (R) Roof Proportion
Building
Orientation
Effect (B)
Overall ROF
Flat 74% 23.8% 1
Peaked 26% 8.3% 0.5
Flat 96% 9.3% 1
Peaked 4% 0.3% 0.5
Flat 89% 6.5% 1
Peaked 11% 0.8% 0.5
Flat 100% 0.5% 1
Peaked 0% 0.0% 0.5
Flat 100% 7.2% 1
Peaked 0% 0.0% 0.5
Flat 9% 0.9% 1
Peaked 91% 9.5% 0.5
Flat 95% 30.2% 1
Peaked 5% 1.6% 0.5
Flat 78% 0.9% 1
Peaked 22% 0.2% 0.5
TOTAL 100% - - 100.0% - -
89.6%
Medical Center
Others
32.1%
9.6%
7.3%
0.5%
7.2%
10.4%
31.8%
1.1%
Academic
Athletic
Auxilaries
Under Construction
Garage
Housing

24
Precisely determining the reduction factor to represent the effect of obstacles on available roof area
requires comprehensive field investigations, which we did not perform due to limited time, building
accesses, and resources. According to previous research, different researchers applied different values
for the reduction factor of other uses, including water tanks, open space, and equipment. Ref [24]
suggests that 20% - 25% of total roof area in a residential block in Pakistan was identified as an area
with obstacles that are not available for PV installation. Based on our field investigation of 10 sample
roofs within the Duke campus, 5% - 45% of total roof area is occupied by water tanks and other
equipment. Therefore, we moderately assume that the reduction factor of obstacles is 0.75
(𝑅𝑜𝑏𝑠𝑡𝑎𝑐𝑙𝑒 = 0.75)5. After determining necessary reduction factors, the available roof area for PV
installations (𝐴𝑎𝑣𝑎𝑖𝑙𝑎𝑏𝑙𝑒) is calculated by Equation 2:
Equation 2
𝑨𝒂𝒗𝒂𝒊𝒍𝒂𝒃𝒍𝒆 = 𝑨𝒕𝒐𝒕𝒂𝒍 ∗ 𝑹𝑶𝑭 ∗ 𝑹𝒔𝒉𝒂𝒅𝒊𝒏𝒈 ∗ 𝑹𝒐𝒃𝒔𝒕𝒂𝒄𝒍𝒆 = 𝑨𝒕𝒐𝒕𝒂𝒍 ∗ 𝟎. 𝟖𝟗𝟔 ∗ 𝟎. 𝟔𝟓 ∗ 𝟎. 𝟕𝟓
= 𝑨𝒕𝒐𝒕𝒂𝒍 ∗ 𝟎. 𝟒𝟒
Figure 9. Shading effect parameters for Duke University are obtained from Google Project Sunroof database.
5 Please note that this assumption is not sound and required more investigation in the future.
25
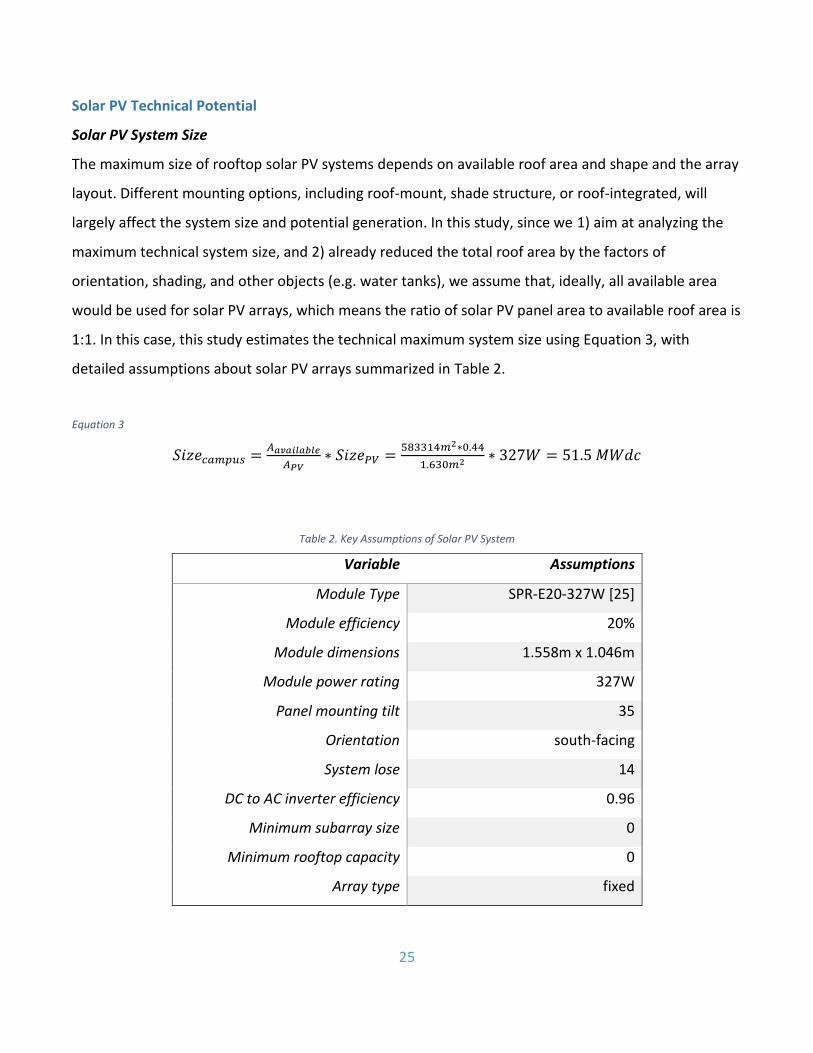
Solar PV Technical Potential
Solar PV System Size
The maximum size of rooftop solar PV systems depends on available roof area and shape and the array
layout. Different mounting options, including roof-mount, shade structure, or roof-integrated, will
largely affect the system size and potential generation. In this study, since we 1) aim at analyzing the
maximum technical system size, and 2) already reduced the total roof area by the factors of
orientation, shading, and other objects (e.g. water tanks), we assume that, ideally, all available area
would be used for solar PV arrays, which means the ratio of solar PV panel area to available roof area is
1:1. In this case, this study estimates the technical maximum system size using Equation 3, with
detailed assumptions about solar PV arrays summarized in Table 2.
Equation 3
𝑆𝑖𝑧𝑒𝑐𝑎𝑚𝑝𝑢𝑠 =𝐴𝑎𝑣𝑎𝑖𝑙𝑎𝑏𝑙𝑒
𝐴𝑃𝑉∗ 𝑆𝑖𝑧𝑒𝑃𝑉 =
583314𝑚2∗0.44
1.630𝑚2 ∗ 327𝑊 = 51.5 𝑀𝑊𝑑𝑐
Table 2. Key Assumptions of Solar PV System
Variable Assumptions
Module Type SPR-E20-327W [25]
Module efficiency 20%
Module dimensions 1.558m x 1.046m
Module power rating 327W
Panel mounting tilt 35
Orientation south-facing
System lose 14
DC to AC inverter efficiency 0.96
Minimum subarray size 0
Minimum rooftop capacity 0
Array type fixed

26
Annual Generation
The hourly electricity generation data from on-site solar PV is estimated by three different modeling
methods, including historical data, PVWatts [16], and HOMER [17]. Regarding interpolation, with the
availability of the 15-min-interval historical production data of the installed 45-kW PV system atop the
Environmental Hall, this study interpolated the generation of a 1-MW solar PV system by Equation 46.
In PVWatts and HOMER, for data consistency, this study applied the parameters summarized in Table
2. Key Assumptions of Solar PV System to estimate hourly generation from a 1-MW solar PV system in
the Raleigh-Durham region7. It is worth noting that the model in HOMER considers more parameters,
including efficiency downgrade effect8 and monthly averaged ambient temperature9 [26].
Equation 4
𝑬𝟏𝑴𝑾(𝒕) = 𝑬𝑬𝑯𝟐𝟎𝟏𝟓(𝒕) ∗ 𝑺𝒊𝒛𝒆𝟏𝑴𝑾
𝑺𝒊𝒛𝒆𝑬𝑯𝟐𝟎𝟏𝟓
The comparison of the three estimation methods is presented in Figure 10. , where the data is
multiplied by 51.5 to represent a 51.5-MW PV system. Due to the difference of weather data and solar
irradiance data that each model used, coupled with different assumptions, the differences in hourly
estimations of three models are noticeable if we compare the daily load profile in the daily level and
monthly level. The Figure 10. below, however, shows that daily load profiles from the three models
are generally consistent with each other at the annual level. Estimates are averaged for further system-
wide impact analysis. This study considered the average data as the final estimate of hourly solar
generation, as shown in Figure 11.
6 due to technical issue, only in 2015 did the PV system atop Environmental Hall has completed electricity production data, which is likely
to be inaccurate.
7 it is the closest geographical region that can be used to represent Durham city.
8 default setting
9 default setting

27
Figure 10. Comparison of three solar output modeling methods (System Size = 51.5 MWdc)
Figure 11. Averaged Hourly Solar Output (System Size = 51.5 MWdc)
Parking Lots
In addition to rooftop, the installation of PV systems on the parking lots of Duke University System
represents a great opportunity for taking advantage of the extensive land that the University uses for
parking purposes and foreseeing an increase of electric vehicles (EVs) float on campus and meeting the
need for charging stations. We consider 44 different parking lots, excluding parking garages which are
regarded as rooftop, suitable for installing solar PV systems. As far as PVWatts estimations are in
between the extrapolated data from PV system atop EH and simulation from the HOMER model, for
the parking lots, we use PVWatts’ parameters and information to estimate the electricity generation.
For fixed systems, we assume roof mount as these should be on elevated structures, as well as we
28
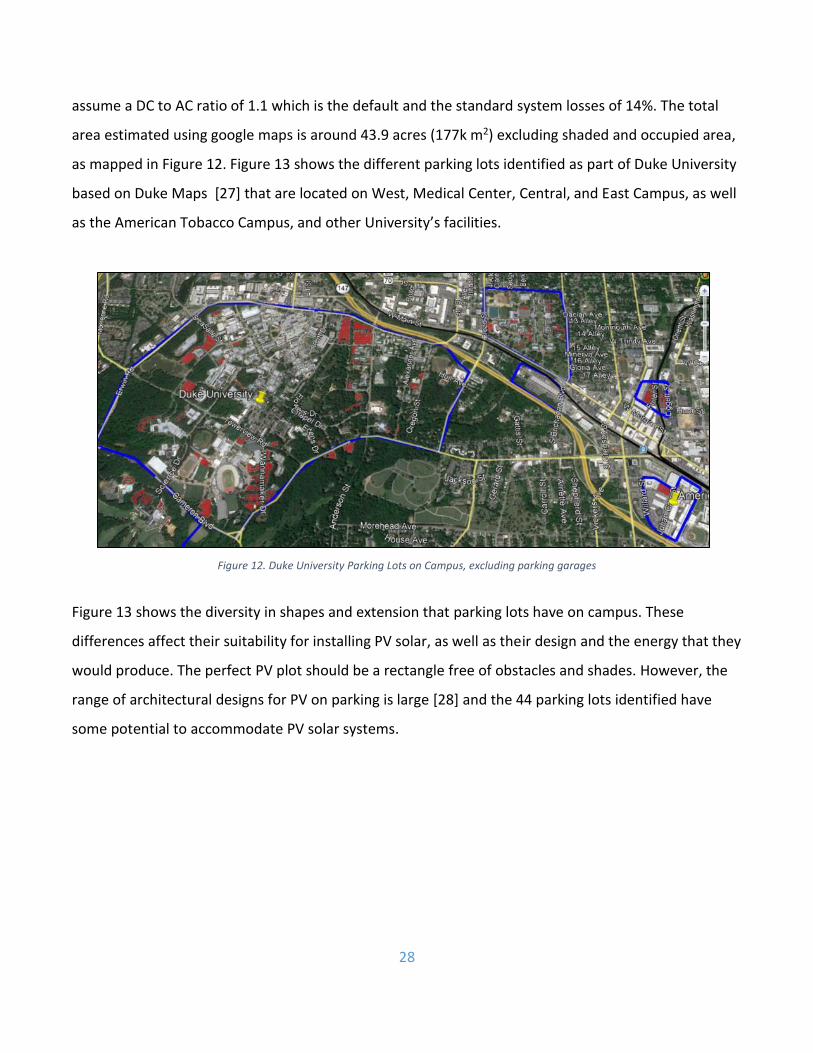
assume a DC to AC ratio of 1.1 which is the default and the standard system losses of 14%. The total
area estimated using google maps is around 43.9 acres (177k m2) excluding shaded and occupied area,
as mapped in Figure 12. Figure 13 shows the different parking lots identified as part of Duke University
based on Duke Maps [27] that are located on West, Medical Center, Central, and East Campus, as well
as the American Tobacco Campus, and other University’s facilities.
Figure 12. Duke University Parking Lots on Campus, excluding parking garages
Figure 13 shows the diversity in shapes and extension that parking lots have on campus. These
differences affect their suitability for installing PV solar, as well as their design and the energy that they
would produce. The perfect PV plot should be a rectangle free of obstacles and shades. However, the
range of architectural designs for PV on parking is large [28] and the 44 parking lots identified have
some potential to accommodate PV solar systems.

29
Figure 13. Shapes and extensions of different parking lots differ, and rectangular parking lots are more suitable for installing solar PV
systems.
In general, parking lots in West and Central Campus are nearby a substation, as illustrated in Figure 14.
This means that the PV solar arrays on parking lots can be connected to these substations reducing the
connection costs.
Figure 14. Parking lots in the west (left) and central campus (right) are close to substations
In this sense, Figure 15 shows that the Central and West Campus have around 61.8% of the total
potential for PV solar, around 22 MWdc. Also, these campuses have the 5 substations mentioned
above, and most of the largest, rectangle shaped, obstacles free, and shade free parking lots.

30
Figure 15. West and Medical Campuses own the largest technical potential.

31
System-wide Impact Analysis
Looking at the system-wide effects is necessary for a thorough assessment of solar PV development.
With its zero-marginal-cost and zero-carbon-emission rate, if properly integrated, solar PV capacity can
reduce the cost and emissions of the power system. However, unlike traditional generators which are
dispatched to meet demand with their power supply, renewable energy resources are non-
dispatchable, and their power output varies by the time of day, the season of the year, and weather
patterns [29]. The variability and uncertainty of solar energy pose a challenge to the grid operation by
increasing the need to turn generates on/off and ramp them up/down to follow the net load. These
operation challenges may disrupt the grid stability and under certain circumstances could increase the
system cost and emissions. Therefore, as a large customer within the DEC/DEP service territory who
has a large technical potential of on-site solar PV, it is necessary to investigate the impact of solar PV
integration on Duke University System at the operation performance of DEC/DEP system. In this
section, we quantified this impact from economic, environmental, and reliability perspectives by
estimating the changes in system cost, carbon emission, and generation imbalance events for the year
2015 and 2030 under scenarios that differ in assumptions of fuel prices, nuclear power plant flexibility,
and solar PV system additions. In other words, we considered the solar addition at Duke University
System as the marginal addition to the grid (“the last straw” or a “pulse on the baseline”).
Characteristics of Duke Energy Carolinas & Duke Energy Progress (DEC/DEP)
Trends in Energy Demand and Status of the Energy System
As of Dec 2016, DEC and DEP provided electricity service to approximately 4M residential commercial
and industrial customers over a 56,000-square-mile service territory [30]. Figure 16. [31] shows that
the Durham County is one of the overlapping counties between DEC and DEP. Therefore, we combined
DEC and DEP as a bundle to simplify the research. Overall, according to DEC/DEP IRP reports, we
assume that DEC/DEP owns 31,410 MW (summer) and 31,689 MW (winter) in 2015, and 36,591 MW
(summer) and 36,079 MW (winter) in 2030. We estimate the most-likely fleet in 2015 and 2030 based
on 2014 fleet and update, retirement, and addition plans reported in joint integrated resource plans.

32
Figure 16. Durham County, where Duke University is in, is one of the overlapping counties between DEC and DEP
Specifically, for DEC, the peak load with energy efficiency (EE) program in 2015 was projected to be
18,486 MW in summer and 17,303 MW in winter [32], while the peak load with EE in 2030 is
forecasted to be 22,517 MW in summer and 21,693 MW in winter [33]. As of the end of 2014, its
winter generation capacity in winter was 22,351 MW [33], which included:
• Three nuclear-generating stations with a combined winter capacity of 7,294 MW;
• Five coal-fired stations with a combined winter capacity of 7,281 MW;
• 29 hydroelectric stations10 with a combined winter capacity of 3,238 MW;
• Six CT stations and two CC stations with a combined winter capacity of 4,534 MW.
For DEP, the peak load with EE in 2015 was projected to be 12,924 MW in summer and 12,429 MW in
winter [33], while the peak load with EE in 2030 was forecasted to be 14,074 MW is summer and
14,386 MW in winter [33]. As of the end of 2014, DEP’s owned winter generation capacity in winter
was 14,057 MW [33]. The 2014 fleet included: 7 coal-fired generating stations with a combined
capacity of 3,581 MW, 36 combustion turbine generating stations with a combined capacity of 3,560
10 including two pumped-storage facilities.

33
MW, 13 combined-cycle generating stations with a combined capacity of 2,991 MW, 15 hydroelectric
stations with a combined capacity of 227 MW, and 4 nuclear generating stations with a combined
capacity of 3,698 MW.
Possible Update, Retirement, and New Resource Addition Plan by 2030
With the growth in peak demand forecasted by DEC and DEP’ IRPs for 2029, as well as the economic
and environmental concern on electricity generation, it is necessary to consider the planned updates,
retirements, and additions that will occur in the planning horizon. The joint summary of the DEC and
DEP’ IRP for 2029, including future updates, retirements, and new resource addition, is presented in
Figure 17. below. This summary captures the characteristics of the generation fleet in 2015 and the
most likely scenario of future generation fleet in 2030, as shown in Figure 18.
Please note that the label “renewable energy resources” in Figure 17. refers exclusively to the wind
and solar. Since wind data is not available, this study neglected wind capacity development. While the
DEC/DEP do not own all the ownership of solar capacity within the territory, we still included all solar
(compliance and non-compliance) into the graph to present the changes in the capacity mix from a
high-level system perspective.

34
Figure 17. Resource Plan over the 15-Year Planning Horizon1112.
Figure 18. DEC/DEP joint planning plan (2015 to 2029).
11 In this study: all oil and NG/oil power plans are regarded as CT power plants due to the lack of detailed data; all NG power plants are
considered as NGCC; renewable energy resources only include solar and wind (150 MW in 2030).
12 solar energy resource refers to all types of PV resources, including utility-scale and distributed, compliance and non-compliance;
demand-side management (DSM) and energy efficiency gain (EE) are also not considered in this study.

35
Data and Methods
Simulation of System Operation (DAUC/DAED/RTED)
Model Description
The system operators in both US regulated markets and deregulated markets apply optimization
models to figure out the least-cost generation schedule that meets the demand and all other
constraints including but not limited to transmission, security, and reliability. More specific, system
operators use the day-ahead unit-commitment (DAUC) model, the day-ahead economic-dispatch
model (DAED), and the real-time economic dispatch (RTED) to simulate the hourly electric dispatch
operation in different time-scale. In this study, we use the DAUC/DAED/RTED model developed by ref
[34] with updated assumptions and parameters to simulate the operation of DEC/DEP power system in
365 days for the year of 2015 and 2030 under each scenario at the least possible cost.
The entire model requires input data described in Table 3 to prescribe a day-ahead and then a real-
time hourly generator schedule. Outputs include the daily least possible generation cost, generator
status (on/off), outputs levels (MW), spinning reserves (MW), start-up and shut-down events, and the
system imbalance events (whenever the hourly supply is not equal to the hourly load) for every
operation hour, all of which allow estimating the system costs and CO2 emissions. The system cost here
refers to the annual system operation costs for each scenario, which includes generation costs and
imbalance penalty costs. We also assumed the solar forecast error is a random variable following a
normal distribution with mean 0% and 15% standard deviation, which usually ranges from 10% to 30%.
This assumption is consistent with ref [34].
This study obtained system hourly load data in 2015 and 2030 from DEC/DEP IRP reports [32]. The load
data in the 2015 reference case is consistent with the hourly load observed in 2015, while the hourly
load in all 2030 cases are assumed to be equal to the future projection in the IRP report. Under each
scenario, the net-demand is calculated by total hourly load subtracting the solar PV hourly generation.
Although the reduction of demand may ease the transmission system congestion and thus reduce costs
and energy losses, transmission constraints are not considered in this study for simplification.
Transmission constraints will be considered when the advanced analysis is available in the schedule.

36
Figure 19. The structure of the simulation model comes from ref [34].
Data and Assumptions
The majority of assumptions is consistent with ref [34] and its supporting information [35], except that
some parameters are updated with updated data sources. Table 3 summarizes the sources of data this
study used in the hourly power system operation simulation model. Table 4 includes detailed
parameters for conventional generators (i.e. coal, NGCC, NGCT). Figure 20 demonstrates the system
demand data we use in the simulation model. The system demand is obtained from EIA via API and
integrated from three balancing authorities including Duke Energy Carolinas, Progress West, and
Progress East (DEC/DEP). This study used 2017 system demand data as a proxy of 2015 demand data,
due to the lack of granulated historical data.
Table 3. Summary of data sources
Data Data sources
2015 hourly system demand EIA (forecast net load & actual net load), used 2017 as a proxy
2030 hourly system demand estimated by using the peak-demand increase to scale up 2015 system demand to 2030
Solar PV generation PVWatts/ HOMER/ interpolation
Generation fleet Winter capacity in 2015 and 2029 (as a proxy of 2030) from integrated resource plans (IRPs)
Generation operational parameters and costs
Consistent with ref [44] and its supporting information [36], (see Table 4)

37
Table 4. Parameters for conventional generators [34].
parameter unit conventional plant type
coal NGCC NGCT
maximum capacity MW nameplate capacity (NPC) reported in eGrid [5]
minimum generation MW 0.1295*NPC1.1749 [37] 0.25*NPC
[38] 0.25*NPC
[38]
start-up heat rate [39] MMBtu/MW 16.5 2 3.5
average heat rate MMBtu/MW annual heat rate in eGrid [5]
minimum down time [37] hours 9 3 2
minimum up time [37] hours 15 4 2
maximum ramp rate [40][38] MW/hr 0.85NPC/hr NPC/hr NPC/hr
CO2 emission rate lb/MWh
reported in eGrid [5] NOX emission rate lb/MWh
SO2 emission rate lb/MWh
fixed costs [41] $/kW/year 35 10 9
start-up costs [39] $/Kw 94 35 36
Figure 20. System demand data for 2015 scenarios.
38
Scenario Description
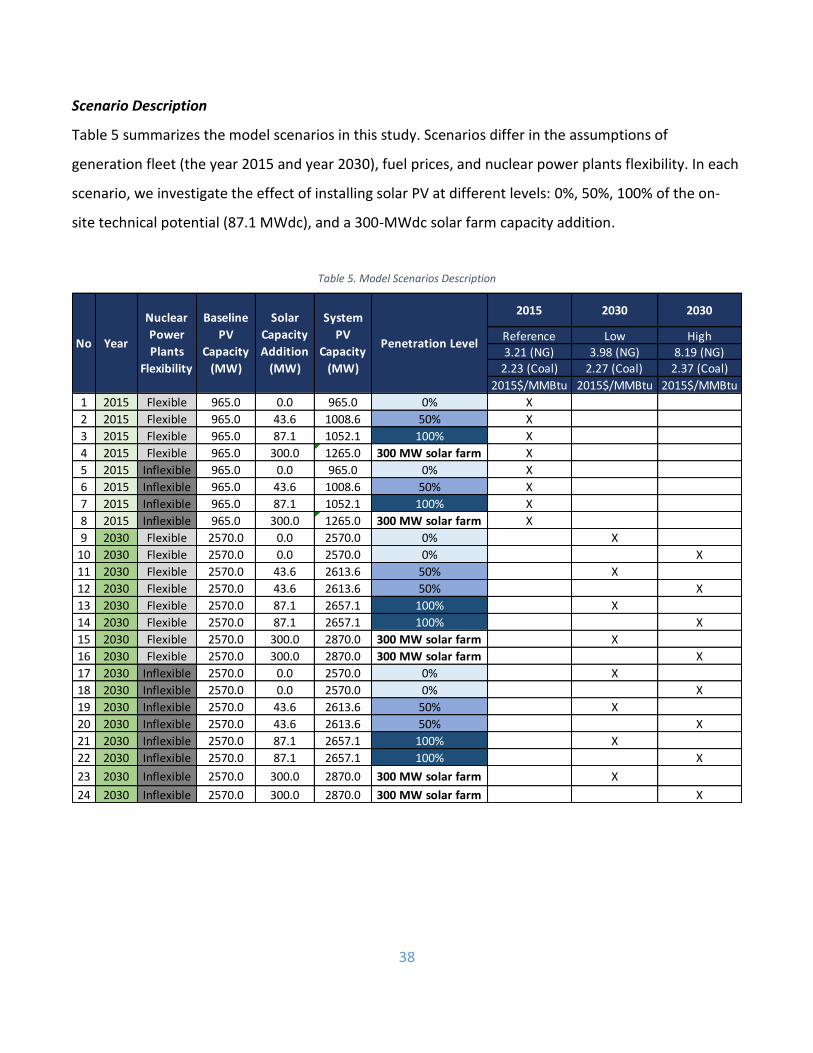
Table 5 summarizes the model scenarios in this study. Scenarios differ in the assumptions of
generation fleet (the year 2015 and year 2030), fuel prices, and nuclear power plants flexibility. In each
scenario, we investigate the effect of installing solar PV at different levels: 0%, 50%, 100% of the on-
site technical potential (87.1 MWdc), and a 300-MWdc solar farm capacity addition.
Table 5. Model Scenarios Description
2015 2030 2030
Reference Low High3.21 (NG) 3.98 (NG) 8.19 (NG)
2.23 (Coal) 2.27 (Coal) 2.37 (Coal)
2015$/MMBtu 2015$/MMBtu 2015$/MMBtu
1 2015 Flexible 965.0 0.0 965.0 0% X
2 2015 Flexible 965.0 43.6 1008.6 50% X
3 2015 Flexible 965.0 87.1 1052.1 100% X
4 2015 Flexible 965.0 300.0 1265.0 300 MW solar farm X
5 2015 Inflexible 965.0 0.0 965.0 0% X
6 2015 Inflexible 965.0 43.6 1008.6 50% X
7 2015 Inflexible 965.0 87.1 1052.1 100% X
8 2015 Inflexible 965.0 300.0 1265.0 300 MW solar farm X
9 2030 Flexible 2570.0 0.0 2570.0 0% X
10 2030 Flexible 2570.0 0.0 2570.0 0% X
11 2030 Flexible 2570.0 43.6 2613.6 50% X
12 2030 Flexible 2570.0 43.6 2613.6 50% X
13 2030 Flexible 2570.0 87.1 2657.1 100% X
14 2030 Flexible 2570.0 87.1 2657.1 100% X
15 2030 Flexible 2570.0 300.0 2870.0 300 MW solar farm X
16 2030 Flexible 2570.0 300.0 2870.0 300 MW solar farm X
17 2030 Inflexible 2570.0 0.0 2570.0 0% X
18 2030 Inflexible 2570.0 0.0 2570.0 0% X
19 2030 Inflexible 2570.0 43.6 2613.6 50% X
20 2030 Inflexible 2570.0 43.6 2613.6 50% X
21 2030 Inflexible 2570.0 87.1 2657.1 100% X
22 2030 Inflexible 2570.0 87.1 2657.1 100% X
23 2030 Inflexible 2570.0 300.0 2870.0 300 MW solar farm X
24 2030 Inflexible 2570.0 300.0 2870.0 300 MW solar farm X
Penetration Level
Solar
Capacity
Addition
(MW)
No Year
Nuclear
Power
Plants
Flexibility
Baseline
PV
Capacity
(MW)
System
PV
Capacity
(MW)

39
Results & Discussion
After preliminarily simulating the hourly operation of DEC/DEP power system in 2015 and 2030, this
study estimates the impact of solar capacity addition at Duke University System on the DEC/DEP
system from economic, environmental, and reliability perspectives by using corresponding metrics,
including system costs, system emissions (CO2e, SO2, NOX), and generation imbalance events13 for all
scenarios based on least-cost generation schedules.
Generation Mix
Figure 21 indicates that PV capacity addition has only a minor effect on the overall generation mix in
DEC/DEP system. The share of NPP generation is higher when NPPs are assumed to operate without
flexibility (scenario group B, E, F), as a flexible system (scenario A, C, D) will adjust the power output
from NPPs to accommodate load variability, merit orders of marginal costs, as well as the variability
and uncertainty brought by PV capacity. In scenario group E and F, coal generation only accounts for
less than 2% of the total generation. It may result from the fact that coal and nuclear are both base-
load generation energy resources. When the nuclear output is locked-in, the share of coal generation
decreases.
System Costs
PV capacity addition reduces system operating cost
System costs in this study refer to the annual system operating costs, which include marginal cost (i.e.
fuel cost), generator start-up cost, and the penalty for over and under generation (i.e. generation
imbalance). As illustrated in Figure 22 & Figure 23 (PV capital costs are not included in system
operating costs), preliminary results indicate that the PV capacity addition incrementally reduces
system costs with flexible nuclear power plants (NPPs) (scenario groups A, C, D). On the contrast, when
NPPs are assumed to be inflexible (scenario groups B, E, F), adding a 300-MW off-site solar farm in the
DEC/DEP system increases the system cost, compared with taking 100% advantages of Duke
University’s on-site PV potential (87.1 MWdc). More specifically, when NPPs are flexible, PV addition
13 automated by Python.

40
will incrementally reduce the system cost by reducing start-up costs and fuel costs. When NPPs are
assumed to be inflexible, the start-up cost will increase when a 300-MW PV capacity is integrated into
the grid as the net load requires more ramping capability. This finding is consistent with ref [34], which
estimated that the maximum solar penetration level for the DEC/DEP system is 5% when NPPs are
inflexible, and 9% when NPPs flexible. In scenario group E and F, adding a 300-MW solar capacity in the
baseline solar capacity will make the solar capacity exceed the ceiling of 5%, thus leading an increasing
system cost. In conclusion, as shown in Figure 23, moderate solar addition in a flexible system will
reduce the system cost as the electricity from solar capacity displaces the electricity from marginal
generators (the most expensive electricity in every hour).
Figure 21. The generation mix by scenarios. Nuclear generation is higher when NPPs are assumed to operate at a stable capacity factor
(inflexibility), coal generation is close to zero in 2030.
A B C D E F

41
Figure 22. System operating cost breakdown.
Figure 23. System cost under different scenarios. Overall, system cost decreases along with incremental solar capacity at Duke University,
and benefits are higher when nuclear plants are assumed to be flexible.
A B C D E F
A B C D E F
42
CO2e, NOX, and SO2 Emissions
As demonstrated in Figure 24, Figure 25, and Figure 26, solar addition at Duke University System will
incrementally reduce CO2e, NOX, and SO2 emissions in nearly all scenario groups, except in the scenario
group C. Moreover, they indicate that cost reduction will be higher when NPPs are assumed to be
flexible (scenario groups A, D). It is worth mentioning that CO2e emissions are not reduced in
proportion to increasing PV penetration. For example, in scenario groups B, E, F where NPPs are
assumed to be inflexible, going from 50% to 100% of the maximum technical potential we estimated
above (87.1 MWdc), the carbon emission reduces in a range from -3.45% to -13.29%, while going from
87.1 MWdc to 300 MWdc only reduces carbon emissions in a range from -10.72% to 4.23% (increase
carbon emissions). The decoupling of carbon reduction and PV penetration mainly results from the
increasing start-up activities of conventional thermal generators, which consumes more fossil fuel
resources than operating in a normal condition. This finding is consistent with ref [34].
For the cases of NOX and SO2 emissions, as shown in Figure 25 and Figure 26, results are more
straightforward as the emission rates of these two air pollutants reduce in all scenario groups, due to
the reduced consumption of coal and oil (oil/gas-fired NGCTs, see Figure 21). For estimating NOX and
SO2 emissions, we use average emissions rates of each plant reported in eGrid [5]. If the data for a
specific plant is not found, we use emission rate data for Richmond Power Plant, as this plant
generates the most electricity in this system (dominant effect). For imported electricity, we use
national emission rate as the SO2 and NOX emission rates. To deal with the discrepancies between the
nameplate capacity data in eGrid and in the IRPs, we chose data from IRPs for consistency.

43
Figure 24. CO2e emissions decreases along with the incremental solar capacity at Duke University in most cases.
Figure 25. NOX emissions under different cases.
Figure 26. SO2 emissions under different cases.
A B C D E F
A B C D E F
A B C D E F

44
Reliability
This study uses imbalance events to serve as the metric to quantify the impact of PV capacity
integration on the grid reliability. Imbalance events refer to any under or over generation events in an
hour that are larger than 1 MW. As can be seen in Figure 27, results for scenario groups A and B show
that the grid reliability is slightly negatively impacted by PV integration, while scenario groups C and D
indicates that when NPPs are assumed flexible in 2030, solar integration improves the grid reliability,
which could not be explained by this preliminary study at this stage. Scenario groups E and F suggest
that a 300-MWdc PV capacity addition, if regarded as the marginal addition in 2030 (‘the last straw’), is
unfeasible and will bring negative impact to the grid reliability14. However, given that the current PV
penetration level is only 2-3% of the total installed capacity, adding a solar farm in the next 5 years, as
shown in scenario A and B, will not pose challenges to the grid operation.
Figure 27. Generation imbalance events by scenarios.
14 Note that the number and size of events highly sensitive to the actual realizations of PV capacity interconnection and actual demand.
The changes in data sources and assumptions will largely change the results.
A B C D E F

45
Review of Regulatory Framework
From the analysis presented above, we concluded that the energy system to which Duke University is
connected has room to accommodate the maximum PV potential that can be developed on campus. It
is to say, the PV solar that Duke could add would have a positive impact on the cost, reliability, and air
emissions. Thus, we can focus on the local case and the other elements that affect such development.
The laws and regulations in place from Federal, State, and local level directly shape the options of Duke
for reaching its goal of carbon neutrality by developing its solar capacity. These laws and regulations
establish what is legal and put in place incentives and limitations that drive the development of
renewables in the United States, and specifically PV solar in North Carolina. Here we analyze the
Federal and State level regulatory framework.
Public Utility Regulatory Policies Act (PURPA)
To challenge the economics-financials and the reliability of well-established technology systems is
hardly difficult for new technologies even though if these have been evaluated as more convenient for
society. This is the case of renewable energy generation technologies for being integrated in the U.S.
grid. Ref [42] defines these entry barriers established by dominant fossil technologies as a “carbon
lock-in” where a framework for keeping the status quo has been developed along several decades,
creating economic-financial, political-regulatory, and technological drivers that discourage the
adoption and development of a new system.
However, external events can detonate the need for a change. In the case of the U.S. energy system,
the OPEP embargo of 1973 played such a role. As a result, the Public Utility Regulatory Policies Act was
enacted in 1978. The PURPA broke by facto the “natural” monopoly over electricity generation
allowing independent small renewable power producers, and cogeneration facilities to enter the
market by deploying renewable generation technologies which production must be bought by utilities
at their avoided cost under standard contracts. PURPA established a threshold of 80 MW for defining
small power production facilities and defines as renewable fuel hydro, wind, solar, biomass, waste, or

46
geothermal resources. In the case of cogenerating facilities, there is no size limitation, and are defined
as these producing electricity and heat or steam used for industrial, commercial, and residential
applications [43].
Although PURPA established the framework for the development and integration of renewables into
the US grid, the economics and financials of renewables are unable to contest these from the
predominant fossil fuel technologies, and incentives are needed at the federal and state level.
Investment Tax Credit and Rebates Programs
As shown in Figure 28., the incentives signal and the certainty offered by PURPA, and which has
become uncertain in the recent years as many argue it is no more necessary, was not enough for
breaking additional barriers imposed by fossil fuel technologies which have accumulated large
investments over decades to establish the current techno-economic energy system [42]. At the Federal
level, additional support for renewables development was granted with the Business Energy
Investment Tax Credit (ITC) introduced by the Energy Policy Act of 2005 with a 30% credit for PV solar
systems operating by 12/31/2019, 26% that start operations between 01/01/2020 and 31/12/2020,
22% for which start between 01/01/2021 and 12/31/2021 a tax credit of 22%, and 10% for systems
that start operating afterward; such rebate cannot be more than 50% of annual tax liability applicable
for 5 years, or 10 years if it was not completely offset by the first five years [44].
Figure 28. Regulatory framework affecting PV solar in NC.
At the State level, North Carolina established an Investment Tax Credit of 35% valid until 2015, with an
extension for systems with specific characteristics until 2016. Nevertheless, the House Bill 589 of 2017

47
mandates that all public utilities with more than 150 thousand customers in North Carolina should
offer incentives to residential and nonresidential customers for the installation of solar up to 10 kW for
residential and 100 kW for nonresidential, until December 2022, enjoying tax credits and electricity
rates that allow them to recover the costs. However, these rebates are generally insufficient to cover
the demand in the State [45].
Renewable Energy Efficiency Portfolio Standard (RPS)
In addition, a Renewable Energy Efficiency Portfolio Standard (RPS) has been established by 30 states
in the U.S. In the case of North Carolina, its RPS was established on August 2007 (Senate Bill 3) with the
aim of providing more reliable energy resources for the consumers, increase the energy security of the
state, and reduce the air emissions from electricity generation. This established a requirement for the
Electric Public Utilities to procure from renewables a percentage of the retail energy they sell, 3% in
2011, 6% in 2014, 10% in 2018, and 12.5% in 2020 and thereafter. These requirements can be met by
deploying renewable energy generating resources by utilities themselves, buying from third parties
with renewable energy generating facilities guaranteeing that the Renewable Energy Certificates15
(RECs) derived from such energy are not double counted, through the implementation of energy saving
measures or “electricity demand reduction” up to 25% of their requirements until 2020, and up to 40%
thereafter, and buying in-state or out-state RECs to cover a maximum of 25% of utilities requirements
if the utility had 150,000 retail customers or more in North Carolina in 2006. The requirements for
Electric Membership Corporations and Municipalities are to procure electricity from renewables for
their retail sales of 3% in 2011, 6% in 2014, and 10% for 2017 and thereafter. These corporations and
municipalities can comply by generating renewable energy, reducing energy consumption by demand-
side management or energy efficiency measures, buying the electricity from a third party, and using
“saved” credits from the previous year generated by all the previously described measures. Their
portfolio of renewables sources cannot contain more than 30% of hydroelectric power, and cannot
cover more than 25% by buying in-state or out-state RECs [46, 47].
15 A REC is equal to one megawatt hour of electricity supplied by a renewable energy facility, or one megawatt hour reduced using energy
efficiency measures.

48
Among the renewable energy resources used for complying with the REPS, the Senate Bill 3 established
that 0.02% in 2010, 0.07% in 2012, 0.14% in 2015, and 0.20% since 2018 of the retail sales should be
sourced from new solar electric facilities and new metered solar thermal energy facilities [46]. The
North Carolina Utilities Commission (the Commission) declined to establish penalties or alternative
compliance penalties (ACP) in case of not compliance by the obligated subjects [48]. Though the carve-
out for solar energy is relatively low, to comply with the REPs, the utilities can choose the deployment
of solar resources or to buy from third-party developers, and as mentioned before, also buying RECs.
Renewable Energy Certificates (RECs)
The Renewable Energy Certificates’ market in North Carolina is obscure. The regulation specifies that 1
MW generated from renewable resources is equal to one certificate, it is to say every megawatt
generated from renewable resources generates a certificate that “warranties” its clean properties, and
it cannot be double counted for compliance purposes. Also, it allows the trade of RECs in-state and or
out-state for covering a maximum of 25% of utilities’ requirements for these with 150,000 or more
retail customers in North Carolina in 2006. In addition, as the regulation does not establish penalties
for noncompliance with the REPS, there is not a market indicator for pricing the RECs [46, 47].
Moreover, there is no available information about the transactions in the market, nor how many
certificates are traded at which price, nor how many are bought in other states. Thus, a marketable
product for renewable developers is not in place as there is not information for incorporating RECs
price into the financials of projects, which could offer a long-term incentive and stability for projects’
developers [49].
Gaul & Carley [50] reported that there is no public information about REC’s transactions in North
Carolina, but based on interviews carried on in 2011 they concluded that REC from solar generation
facilities transactions is generally private and bilateral with contracts from 5 to 10-20 years. When
utilities participate in long-term contracts, typically they do it with large-scale systems’ owners as
small-scale generate few RECs [50].

49
To avoid double counting, all renewable energy facilities require to register with the Commission for
using the RECs in complying with the REPS with the exemption of self-generation, and non-utility
owned renewable generation up to 2 MW, also need an electric meter supplied and read by an electric
power supplier with the exception for those with systems behind the meter (ANSI-certified electric
meter) generation up to one megawatt, and for thermal energy [48]. The Commission established an
online REC tracking system in order to verify the compliance of electric power suppliers with the REPS’
requirements [51], the North Carolina Renewable Energy Tracking System (NC-RETS) which is a tool for
North Carolina Electric Utilities to demonstrate compliance with the REPS [52].
Interconnection and Net Metering
Net metering as the difference between consumption and generation was granted by the Commission
for any customers with solar photovoltaic systems up to 1,000 kW and shall interconnect and operate
in parallel with the utility’s distribution system. Nonresidential customers can choose a Time of Use
demand (TOU-demand), or retail electric service pursuant rate schedule. In the retail electric service
pursuant rate, when the customer has a kilowatt-hour credit it shall be applied to the following
monthly bill period, but it will set back to zero at the beginning of each summer billing season with the
associated RECs of such positive balance granted to the utility, this scheme applies to residential
customers with all RECs associated with electric generation assigned to the utility [46, 48].
However, nonresidential customers have the option of selecting a Time of Use demand (TOU-demand)
rate and retain the RECs associated with the electricity generated. This rate is a differentiated
electricity bill based on peak and non-peak energy consumption, and general service is offered to
customers with loads under 1,000 kW, the final rate depends on the ownership of step-down
transformation facilities [46, 51].
This interconnection and net metering arrangement affect the economics of residential and
nonresidential photovoltaics (PV) as far as the electricity rates are advantageous for the utility. The
reset of any favorable surplus for the customer at the beginning of the summer season can affect the
payback period of the PV system importantly, the RECs claimed by the utility could also generate a

50
virtual-cash stream to improve the financials of generation assets. Additionally, in the case of
nonresidential customers that op to have a TOU-demand rate for retaining the RECs, the utility can
limit interconnection on a basis first come first serve “up to an aggregate limit of 0.2% if the utility’s
North Carolina jurisdictional retail peak load for the previous year” [48, 53].
Power Purchase Agreement (PPA)
A Power Purchase Agreement (PPA) is a contract or agreement between two or more parties for
purchase and generate-sell electricity. In the case of North Carolina, these agreements are only legal
between an electricity generation entity and public utilities, as far as third-party energy providers are
not allowed. The standard PPA was established by PURPA which granted that the utility must buy the
electricity from renewable energy facilities at the avoided cost of electricity. This standard contract and
the general characteristics of PURPA are adopted by NC state’s regulation, offering the standard
contract only to small producers with generation facilities up to 5 MW, which was cut down to 1 MW
with the House Bill 589 of 2017 after a cap of 100 MW per utility is reached. In the case of facilities
over 1 MW, these have the option of negotiating the terms of the contract, including the price of the
electricity [54].
In a third-party model, a third-party owner uses a PPA to transfer the upfront cost of the PV system to
a developer. Then, the developer is the constructor and owner of the PV system, which is sited on the
customer’s property, while the customer buys the power generated by such system. The price of this
power should offer savings on the electricity bill for the customer and a return to recover the
investment and a premium for the developer; this premium is sometimes the claim of ITCs offered at
the Federal or State level [50].
In addition, this PPA arrangement transfers the obligations for the support and maintenance of the
solar PV system and the dealing for net metering with public utilities, if allowed, which is convenient
for both parties as the owner lacks the expertise and scale economies the developer has [55].
Nevertheless, the prohibition of third-party energy providers in North Carolina, as far as the upfront
cost is high and the benefits cannot be easily measured, has contributed to a limited development of

51
the midscale market for PV systems, along with other key barriers like unaligned incentives of tenant
and landlord, the difference between building lease and PV financing terms, and relatively high
transaction costs [56].
However, co-investment and co-participation in PPAs is still a useful instrument for renewable energy
projects development. In the case of Duke University, it represents an attractive strategy to lower the
upfront cost and share the risk of PV installation with interconnection into the grid, like in the case of
solar PV on parking lots. In this case, Duke could co-invest in the development of parking lots PV
systems where the electricity would be sold to DEP/DEC at a rate agreed with the utility which should
allow the co-investor to recover the investment claiming the ITCs, while Duke University claims the
RECs. Another option is that Duke leases the space of the parking lots for the development of solar PV
systems, also securing the property of the RECs, and as far as there is no market for RECs in North
Carolina, these are a low-value co-product of renewable energy generation. In both proposed cases,
companies with enough tax liability could take advantage of the Federal Tax Credit based on the year
that construction starts, as illustrated in Table 6.
Table 6. Investment Tax Credits for solar PV systems, by year of starting construction.
2018 2019 2020 2021 2022
Federal ITC 30.0% 30.0% 26.0% 22.0% 10.0%
State ITC, NC State’s solar tax credit expired at the end of 2015
Total 30.0% 30.0% 26.0% 22.0% 10.0%
Conclusions
The Federal, and North Carolina’s regulations have promoted the development and integration of
renewable energy. However, North Carolina in comparison with other states has not enacted a
favorable regulation for the development of the RECs market. Also, the existence of third-party energy
providers is not allowed, limiting the pace at which residential, industrial and commercial solar PV
grows, and the overall size of the solar market and its dynamics. This impacts the speed at which
market prices drop for solar technologies and limits the available options for the integration of solar PV

52
on Duke campus. In addition, the net metering system in place plays in favor of the utilities and
reduces the financial benefits of installing solar panels. Also, the House Bill 589 aims to increase the
competition among solar projects developers for providing electricity to the system at the lowest cost.

53
Economic Performance and Financing Alternatives
Costs of Developing the Solar PV Generation Potential at Duke University
PV Rooftop
The cost of PV systems has dropped dramatically over the last years as illustrated in Figure 29., which
shows NREL benchmark study’s results. As shown, current prices are 30% for residential, 34% for
Commercial, and 20% for utility-scale tracking systems of the price that these presented in 2010. In
addition, it is remarkable that the soft costs have decreased in a much lower rate in comparison with
the costs of modules, and that the costs of these last are similar for all scales of development.
Figure 29. NREL PV system cost benchmark summary (inflation adjusted), 2010–2017 [57].
We used the NREL benchmark study’s results for pricing the cost of solar development onsite and
offsite Duke. In the case of the tracking systems, we use the fixed systems’ price and added 10% based
on the price differential for the utility-scale systems. It is important to mention that along the country
there is a large range of cost for PV systems, NREL costs used here are the Installed cost of these

54
modules, as demonstrated in Figure 30.
Figure 30. Curve cost of solar development offsite-onsite Duke University ($/Wdc).
Beyond Rooftop
PV Parking Lots
As mentioned before, the available area in parking lots for accommodating PV is up to 177k m2. For
estimating the project cost we took the average in North Carolina of $3.31/Wdc [58], the $2.67/Wdc
used in the rooftop estimates, and $2.03/Wdc reported by the National Renewable Energy Laboratory
(NREL) [59], and for the cost of the tracking system we assume that it follows the same over price for
parking lots than for utility-scale solar which is around 10%-15% extra cost resulting in $2.33/WdC [57].
The results of PVWatts show that the generation from solar PV systems on Duke Campus’ parking lots
could be between 14.55 MWh/year and 49.85 MWh/year with fixed tilt roof mount systems, and
between 17.74 MWh/year and 60.80 MWh/year with one-axis tracking systems.
The development of solar PV on parking lots on Duke campus presents some specific challenges as
most of the parking lots have irregular shapes and trees which are not ideal for the deployment of PV
solar. However, the development of such is possible, and we estimate that 35.6 MWdc is highly
feasible to be accommodated on the 44 parking lots identified. As mentioned before, Duke University
can opt for a co-investment scheme, or could lease the parking lots to a solar developer securing the
$-
$0.50
$1.00
$1.50
$2.00
$2.50
$3.00
Utility ScaleFixed
Utility ScaleTracking
ParkingFixed
ParkingTracking
Rooftop
$1.03 $1.11
$2.03
$2.33
$2.67
Solar PV option
Co
st (
$/W
dc)

55
claim for the RECs derived from the electricity generation. The installation of fixed or tracking system
need to be assessed individually on each of the parking lots, though the one-axis tracking systems’ cost
has dropped on the last years and are only around 10% more expensive with an extra generation of
about 25%, however, the superior generation is partially offset by the price and by the extra land space
needed to accommodate them which in the case of parking lots could be negligible due to design,
however, we will look at the general financials of such systems.
Also, the final decisions about the specific design of such systems would correspond to Duke
University’s management, which can select designs that fit better the architecture of the Campus or
the standard canopy system. Based on the $2.03/Wdc and $2.33/Wdc corresponding to the minimum
cost for the fixed and tracking system, the cost of such system would be between $21.6M and $82.9M.
Off-site PV Solar Farm
For the development of a solar farm, we assume that Duke University establishes an agreement with a
solar developer, and an equity investor with tax liability for taking advantage of the Federal ITC and the
RECs related to the renewable energy generation for reducing the overall cost of the solar
development.
A solar developer can provide the expertise to the University reducing the risks of engaging in an
unsuccessful project, as well as helps to involve a tax equity investor. If Duke University wanted an
amount of solar PV electricity equal to its 2017 annual consumption of 444.6k MWh, assuming the
PVWatts estimates, it would need to develop a solar PV farm of 317.7 MWdc. This facility would need
to be interconnected to the utility’s grid to ensure compliance with state regulations, it is also worth
noting that this calculation does not consider the technical implications of meeting Duke’s energy
needs 24/7 and only guarantees the electricity Duke University consumes would be injected to the grid
from the solar farm, but at different times. As a result, assuming that 8 acres can accommodate 1
MWAC tracking systems, and 6 acres are needed for fixed-tilt systems [60], the land required for
satisfying the annual electricity consumption of Duke University would be around 2,311 acres using
tracking systems (1,733 acres if using fixed-tilt), which represents about 1.8 times the total surface of

56
total Duke Campus, or 32% of Duke Forest [58] [61].
Due to state regulations, any PV solar development needs to be connected into the grid, and for such
interconnection, a PPA between the energy facility (the investors like Duke University, the developer,
and the equity investor) and the Utility must be signed. For this PPA we assume an electricity price of
$0.069/kWh which is the price that Duke pays to DEC/DEP, an installed cost of the solar farm of
$1.11/Wdc for one-axis tracking system, a $1.03/Wdc for a fixed mount system, a discount rate of 7%,
an applicable 30% Federal ITC, a tilt of 36° based on the assumption of Raleigh’s irradiance, and Array
Azimuth of 180°, and a 1.1 DC/AC ratio.
With these parameters, we estimate that the development of a solar farm could cost around $318.4M
for a fixed-tilt system and $297.8M for a tracking system, before applying the 30% tax credit. And
$229.7M and $208.7M after applying the ITC. This approximates the costs to give a sense of such
based-on market pricing by 2017, and it does not consider the effects of taxes on imported solar PV
panels which, according to some developers could increase by 10% the overall cost of solar farm
development [62].
We are assuming that the price of electricity that the energy facility receives is the price that Duke pays
to the Utility, in order to make this alternative comparable with different options of PV development.
In addition, to be conservative, we are assuming an interconnection cost in the range of upgrading 4
miles, despite that Elizabeth, Isshu, & Bella, 2018 [63] estimates that around 20 sites in Durham County
could accommodate 300 MWdc or more within a distance of 2 miles from transmission lines. Thus, the
interconnection cost is estimated by a charge of $250,000 plus $100,000 per upgraded mile, giving a
total cost of $650,000 [64].
Economic Benefits of Developing the Solar PV Generation Potential
The main purpose of developing renewable generation on campus is advance towards the goal of
becoming carbon neutral by 2024. However, this development has a high cost that contrasts sharply
with the low electricity rates of $0.069/kWh that Duke University currently receives from Duke energy.
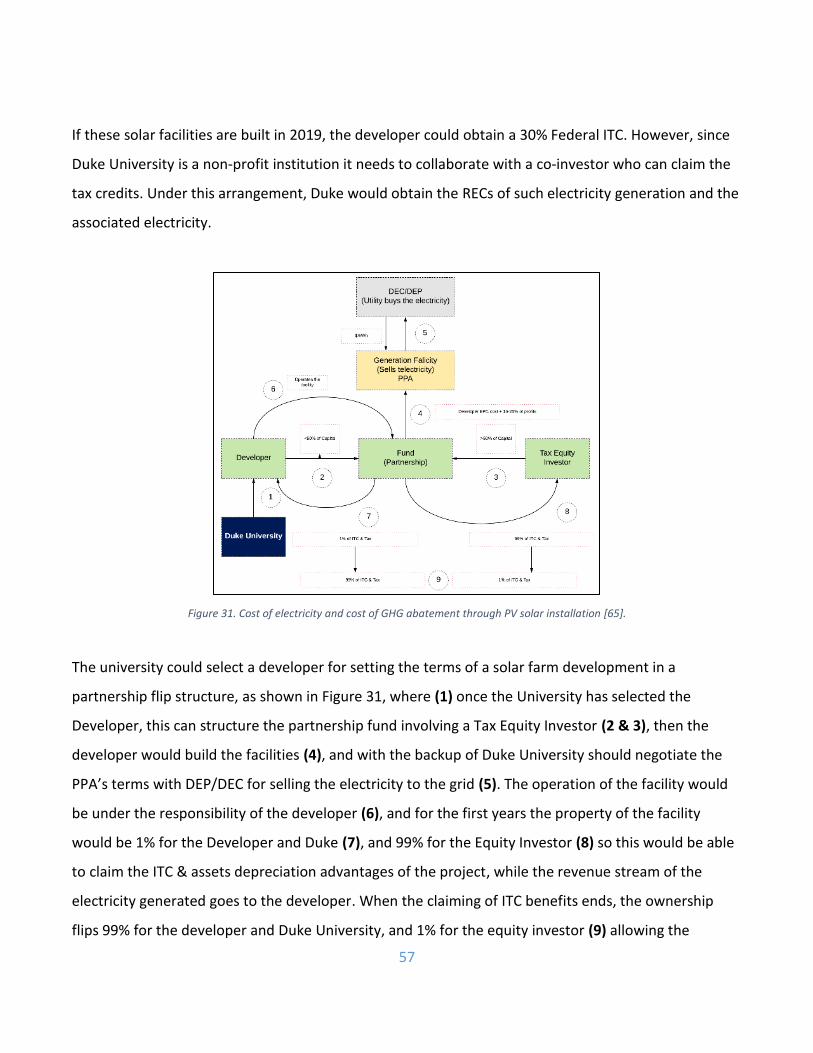
57
If these solar facilities are built in 2019, the developer could obtain a 30% Federal ITC. However, since
Duke University is a non-profit institution it needs to collaborate with a co-investor who can claim the
tax credits. Under this arrangement, Duke would obtain the RECs of such electricity generation and the
associated electricity.
Figure 31. Cost of electricity and cost of GHG abatement through PV solar installation [65].
The university could select a developer for setting the terms of a solar farm development in a
partnership flip structure, as shown in Figure 31, where (1) once the University has selected the
Developer, this can structure the partnership fund involving a Tax Equity Investor (2 & 3), then the
developer would build the facilities (4), and with the backup of Duke University should negotiate the
PPA’s terms with DEP/DEC for selling the electricity to the grid (5). The operation of the facility would
be under the responsibility of the developer (6), and for the first years the property of the facility
would be 1% for the Developer and Duke (7), and 99% for the Equity Investor (8) so this would be able
to claim the ITC & assets depreciation advantages of the project, while the revenue stream of the
electricity generated goes to the developer. When the claiming of ITC benefits ends, the ownership
flips 99% for the developer and Duke University, and 1% for the equity investor (9) allowing the
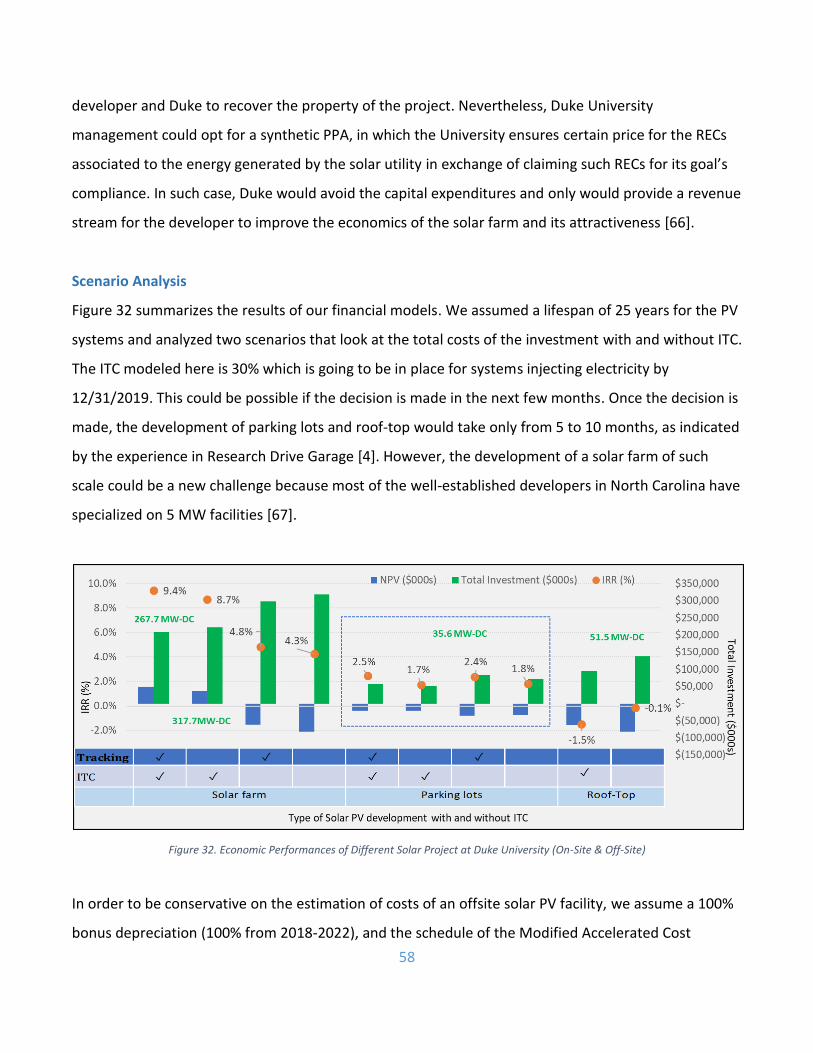
58
developer and Duke to recover the property of the project. Nevertheless, Duke University
management could opt for a synthetic PPA, in which the University ensures certain price for the RECs
associated to the energy generated by the solar utility in exchange of claiming such RECs for its goal’s
compliance. In such case, Duke would avoid the capital expenditures and only would provide a revenue
stream for the developer to improve the economics of the solar farm and its attractiveness [66].
Scenario Analysis
Figure 32 summarizes the results of our financial models. We assumed a lifespan of 25 years for the PV
systems and analyzed two scenarios that look at the total costs of the investment with and without ITC.
The ITC modeled here is 30% which is going to be in place for systems injecting electricity by
12/31/2019. This could be possible if the decision is made in the next few months. Once the decision is
made, the development of parking lots and roof-top would take only from 5 to 10 months, as indicated
by the experience in Research Drive Garage [4]. However, the development of a solar farm of such
scale could be a new challenge because most of the well-established developers in North Carolina have
specialized on 5 MW facilities [67].
Figure 32. Economic Performances of Different Solar Project at Duke University (On-Site & Off-Site)
In order to be conservative on the estimation of costs of an offsite solar PV facility, we assume a 100%
bonus depreciation (100% from 2018-2022), and the schedule of the Modified Accelerated Cost

59
Recovery System (MACRS) applicable to solar assets [68]. As mentioned before, our estimates of
Engineering, Procurement and Construction costs, and the land requirement are based on the NREL,
2017 benchmark [57]. We also assume the panels have a degradation of 0.3% with a lifespan of 25
years. Other assumptions include: a price of electricity equal to the price Duke pays to the $0.069/kWh
with an escalator of 2% per year, an O&M cost of $8/kWdc/year, a land rent in the case of solar farms
of $900/acre-year which is the median in the state ($600-$1400/acre/year) and could be reduce by
purchasing the land. We considered an inflation rate of 2.5% and an interconnection cost of $650,000.
Also, we assume that when the ITC is applicable, a 50% tax abatement and an 8% tax millage, tax on
the property leased where millage refers to the amount per $1,000 of the property’s value [69], is also
in place. We estimate that the maximum potential of parking lots for accommodating solar PV arrays is
up to 177,477 m2, however, we consider 3 scenarios of electricity generation with 100%, 50%, and 30%
of such area as effectively available for setting PV arrays under PVWatts parameters. Accordingly, the
area available for PV arrays is 43.9, 21.9, and 13.2 acres, and based on the Equation 4 used above for
rooftop. Available area is estimated from google maps, which in the case of 100% is equal to 177,477
m2, 50% is equal to 88,739 m2, and 30% is equal to 53,243 m2 are able to accommodate around 35,604
kWdc, 17,802 kWdc, and 10,681 kWdc, respectively. The 30% scenario is considered the most plausible
for incorporating daylighting needs, pedestrian flows, discounting for parking lots not suitable for PV
[70]. This 30% scenario with tracking system would require a total investment of $24.9M before ITC, as
summarized in Table 7.
Table 7. Electricity Generation from PV on parking lots.
System Costs ($/W)
Fixed Tilt Tracking
Annual Generation (kWh) $ 3.31 $ 2.67 $ 2.03 $ 2.33
kWdc m2 Fixed Tracking Total system cost
35,604 177,477 49,850,597 60,802,577 $ 117,850,172 $ 95,063,432 $ 72,098,670 $ 82,913,471
17,802 88,739 24,244,350 29,570,746 $ 58,925,086 $ 47,531,716 $ 36,049,335 $ 41,456,735
10,681 53,243 14,546,338 17,742,116 $ 35,355,052 $ 28,519,030 $ 21,629,601 $ 24,874,041
The results show that in the case of pursuing the development of the utility-scale solar farm, Duke
would have positive returns and make money while reducing the GHG emissions associated with its

60
electricity consumption. Thus, assuming a farm with one-axis tracking solar PV system, the investment
would have a Net Present Value (NPV) of $48.7M. In contrast, if solar PV systems are installed on
campus, the total cost would be $20.8M assuming a tracking system on parking lots and income from
the ITC. If the ITC is not available, the cost could be $35.0M. In the case of atop roofs, the cost would
be $63.3M and $81.8M, respectively.

61
Sustainability Cost-Effectiveness Assessment
This study also examined the cost-effectiveness of the PV projects in abating GHG emissions and
calculated for each project a cost of avoided emissions in $/MTCO2e. If the only goal of Duke University
was to obtain profits from an investment in a solar PV farm, then the economic performance analysis
presented in the previous section would indicate that only in the case that an investment tax credit
(ITC) is available, the university should embark on the construction of an off-site solar farm.
Nevertheless, because Duke University’s goal is to reduce carbon emissions, it is worth to explore the
costs of different carbon-abating projects per unit of GHG emissions abated. The carbon abatement
cost (COA) is an effective metric to evaluate the cost-effectiveness of carbon-abating projects. This
metric requires dividing the lifetime costs of the project by the total number of tons of GHG emissions
avoided by the project, according to Equation 5 below:
Equation 5
𝑪𝒐𝑨 =𝒑𝒓𝒐𝒋𝒆𝒄𝒕 𝒍𝒊𝒇𝒆𝒕𝒊𝒎𝒆 𝒄𝒐𝒔𝒕($)
𝒍𝒊𝒇𝒆𝒕𝒊𝒎𝒆 𝒂𝒗𝒐𝒊𝒅𝒆𝒅 𝒄𝒂𝒓𝒃𝒐𝒏 𝒆𝒎𝒊𝒔𝒔𝒊𝒐𝒏𝒔 (𝑻𝑪𝑶𝟐𝒆)=
𝑳𝑪𝑶𝑬($
𝒌𝑾𝒉)
𝒈𝒓𝒊𝒅 𝒆𝒎𝒊𝒔𝒔𝒊𝒐𝒏 𝒓𝒂𝒕𝒆 (𝑻𝑪𝑶𝟐𝒆
𝒌𝑾𝒉)
To estimate the project lifetime costs, we use the assumptions mentioned in the economic analysis. To
estimate the emissions avoided, we assume that each MWh of PV generation reduces GHG emissions
equivalent to the average emissions rate of the grid electricity provided by DEC/DEP. A more rigorous
estimate of the avoided carbon emissions would require simulating the operations of the DEC/DEP and
quantify the reduction in CO2 during each hour when the PV system at Duke University is generating
electricity.
The 24% carbon emission reduction that Duke University has achieved during the past 11 years relative
to the 2007 baseline is the result of efforts to increase on-campus energy efficiency and switch to a
cleaner fuel to power the on-campus steam plants, as well as a product of the fact that the grid
electricity has become cleaner, which is mainly due to the retirement of coal-fired power plants and

62
their replacement with natural gas and nuclear [32]. There may be more energy efficiency projects that
the university could conduct at a relatively low carbon abatement cost16 but identifying and analyzing
them is beyond the scope of this project. Instead, we look at the cost-effectiveness of various PV
project configurations for Duke University and look at their impacts on carbon abatement. The results
show that a solar farm has a negative carbon abatement cost (i.e., the university can both reduce
carbon emissions and obtain a profit) if the facility can be built on time and in a way that the ITC can be
claimed. The other most economic ways to abate carbon are a) purchasing or generating carbon offset
credits, b) installing solar PV systems in parking lots P, d) purchasing RECs, and e) installing solar PV
systems on rooftops on campus, as shown in Figure 34. Although on-site PV is not economic, there
may be some non-monetized benefits, such as the ability to tangibly and visibly showcase the
university’s effort on on-campus sustainability. Further discussions of these carbon-abating strategies
are as follows:
Purchasing RECs
The undeveloped market of RECs in North Carolina makes possible that if the electric utility that
purchases the electricity from solar (or any renewable) facilities does not claim the RECs, the market
price of these RECs is close to 0 $/MWh. Hence, developers usually sell these unclaimed RECs for
whatever they can make as a premium. In this case, negotiations for purchasing RECs from local
developers at a more convenient price should be relatively easy. However, there are developed
markets for buying Solar Renewable Energy Certificates (SRECs) through intermediaries with a base
price from 4 $/MWh in Ohio to 410 $/MWh in Washington DC, with expectations for prices to decrease
in the future [71].
Carbon Offset Projects
A carbon offset is defined by Duke Carbon Offset Initiative (DCOI) as the GHG emission reduction
16 the carbon abatement cost of on-campus energy efficiency projects could be negative, indicating that these projects generate net cost
savings.

63
outside of Duke University’s own carbon footprint [72]. As mentioned in this report, according to its
climate action plan [1], Duke University plans to reduce 55% of its campus total annual GHG emissions
(185k MTCO2e/year) by voluntary carbon offset projects [73]. As of 2016, these projects included
forestation17, energy efficiency workshops for communities, and swine waste management (i.e. Lloyd
Ray Farms which generated 1.8k MTCO2e carbon offset and 299 RECs in 2016) [74]. According to Duke
Carbon Offset Initiative’s 2015 annual report, carbon offset cost for Duke University is estimated to be
$13.8/MTCO2e in 2024 and $15.4/MTCO2e in 2040 [75]. In 2007, the average cost of voluntary carbon
offset projects was $18.2/MTCO2e in 2007 (equivalent to $21.7 in 2018) [76]. In general, purchasing or
generating carbon offset credits is more economical than on-site PV projects (e.g. rooftop, parking
lots), and generating carbon offset is cheaper than purchasing from external projects at this stage.
However, according to the carbon management hierarchy shown in Figure 33, offset should be
implemented after maximizing the efforts on avoiding18, reducing19, and replacing20 GHG emissions
[77]. This concept is consistent with Duke’s Climate Action Plan [1], which stated that generating and
purchasing carbon offset should be the final approach of carbon neutralization after ‘maximizing all
feasible energy efficiency and renewable energy options’ [77]. That being said, carbon offset and on-
site solar PV is not in an either/or position. It is more cost-effective to implement carbon offset along
with low-cost on-campus carbon-abating measures (e.g. on-campus energy efficiency). Once the ‘low-
hanging fruit’ has been picked, high-cost measures, namely rooftop and parking-lot PV, are necessary
and inevitable in the pathway to a carbon neutral campus by 2024.
Figure 33. Carbon management hierarchy. Actions on the left side have a more transformative impact on future carbon emissions [77]
17 40 trees as of 2016, and 400 trees as of 2017.
18 lower the carbon-intensity (e.g. more efficient lighting)
19 energy conservation, reduce the unnecessary use of energy.
20 displace carbon-intensive energy sources with low-carbon or zero-carbon energy sources.

64
Reevaluate the Cost of Electricity under Carbon Tax Scenarios
Even if we assume that greenhouse gases, and in particular CO2 emissions effects, are uncertain on
climate change patterns, and that it would be difficult to know where these changes are going to have
the strongest effects, there is still enough scientific evidence that demonstrates that the environmental
impacts are multiple and that the increase in the average temperature due to the accumulation of such
greenhouse gases is expected to be around 3.5°C-4.0°C by 2100 in comparison with pre-industrial era.
Most of the experts agree that the best instrument for reducing CO2 emissions should be a tax of $30/
MTCO2e in 2012 prices for reducing the emission at the level of an increase on the earth’s overall
temperature in the range of 2.0°C-2.5°C, and $40/MTCO2e if accounting for the social cost of carbon in
2015 prices [78].
Updating these values to 2017 prices accounting for the general inflation [79], we had that for the first
scenario the tax should be $32/MTCO2e, and for considering the social cost of carbon $41.4/MTCO2e.
Then we estimate the price of electricity assuming an emissions rate in the electric grid of North
Carolina of 0.58 MTCO2e/MWh, and we assume a passthrough tax cost scenario. As result, we had that
given the relatively clean energy matrix of North Carolina, the price of the electricity applying a tax of
$41.4/MTCO2e would increase the price of electricity is $0.024/kWh.

65
Figure 34. Carbon abatement curve for different solar projects.
The BAU scenario illustrated by Figure 29 shows what would be the CO2e abatement cost for Duke by
the different options of solar PV development proposed, and by carbon offset and RECs strategies, and
as mentioned above we assume the 0.585MTCO2e/MWh reported by Duke Energy, 2016 Sustainability
Report. In the case of solar farms and claiming the ITC, Duke would have a negative carbon abatement
cost with a positive return of $7.76 and $4.66/MTCO2e, respectively. Then, a solar farm still is the
cheapest option even without ITC with a cost of $9.91/ MTCO2e for the tracking system, and
$13.13/MTCO2e for a fixed-tilt, followed by carbon offsets with a cost of $13.83/MTCO2e. The PV
development on parking lots with a cost from $32.26/MTCO2e to $49.09/MTCO2e represent the next
option price-wise, followed by RECs $61.54/MTCO2e followed by the most expensive PV on roof-tops
with $63.96/MTCO2e and $82.65/MTCO2e.

66
Figure 35. Carbon abatement curve for different solar projects in a carbon emissions tax scenario.
On the other hand, the comparison between figure 29 & 30 illustrates the differences in the carbon
abatement cost by project types considering the BAU and the tax scenario of $41.4/MTCO2e. The
comparison of the results showed an important impact of the tax on the reduction of the carbon
abatement cost with the maximum impact on the solar farm with fixed-tilt with ITC which reduces 3.9
times, in the case of the most expensive option evaluated, the roof-top without ITC, the reduction in
the cost is 26.3%, going down from $82.65/MTCO2e to $60.91/MTCO2e, thus buying RECs would be a
more expensive way of abatement with a cost of $61.54/MTCO2e.
Best Practices in other Universities
When comparing the cost-effectiveness of carbon abatement through PV projects with other carbon-
mitigation strategies, this study also reviewed pilot projects from other universities or colleges in the
US which have been progressive in on-site and/or off-site PV projects. The best-practice suggestions
for Duke University concluded from these case projects will be presented at the end of this section.

67
Arizona State University (ASU)
In September 2009, ASU issued a Carbon Neutrality Action Plan, which commits the university to
eliminating GHG from building energy sources by 2025, and from all sources by 2035 [80]. As of June
30, 2017, ASU has installed 24.1 MWdc equivalent solar capacity of the on-site solar system, including
82,456 PV panels, 8,640 CPV modules, and 7,840 solar thermal collectors, from 90 systems on five
campuses. Especially, PV panels have covered many facilities and building rooftops on these locations,
including Wells Fargo Arena, parking spaces, and stadium seats of baseball fields (Figure 36). The on-
site solar capacity together generated 41k MWh electricity in FY2017. Assuming a region-averaged
emission rate of 0.949 lbCO2e/kWh [5], these solar capacity reduced carbon emissions by 17.7k
MTCO2e in 2017.
Partnership
It is worth noting that solar projects at ASU have received various financial incentives. More than 12
MWdc of the solar capacity on the Tempe campus is from the partnership with NRG Energy, Inc, which
takes advantages of its PowerParasol® [81] parking structure product. In addition, more than 28.8
MWdc off-site equivalent solar capacity has been involved in the collaboration with the Arizona Public
Service (APS). The partnership with Arizona Public Service's Renewable Energy Incentive Program21
financed solar projects in three main campuses. Moreover, a partnership with Salt River Project's SRP
EarthWise Commercial Energy Incentive Program22 also provided financial incentives to promote the
solar projects on the Polytechnic campus and ASU Research Park.
Challenges
Regarding the challenges in design and implementation, the project posed several challenges including
“aesthetics, installation on the non-flat roof areas, and minimizing the disruption to students, faculty,
and staff” [82].
21 The program is funded by APS customers and approved by the Arizona Corporation Commission.
22 The program is funded by SRP customers and approved by the Arizona SRP Board.

68
Figure 36. PV panels installed at the top of the stadium seats of a baseball field in one of ASU campuses.
UC Riverside & UC Davis
Solar PPA & Parking Lots
The on-site solar capacity in parking lots at UCR has reached at 4.3 MWdc [83]. These $14.4 million PV
systems are fully built and financed by SunPower. In this case, UCR purchases the generated electricity
from these solar canopies from SunPower under a third-party power purchase agreement (PPA).
Solar PPA & Solar Farm
UC Davis developed a 16.3-MW solar farm, which is estimated to generate 14% of the campus
electricity demand and reduce 14k MTCO2e/year. This behind-the-meter (BTM) solar farm was also
designed and built by SunPower, which owns the property and sells electricity to UC Davis under a
power purchase agreement [84]. In addition, UC Davis also has 1 MW on-site solar capacity from PV
panels on the top of canopy structures and rooftops.

69
Figure 37. More than 9,600 solar panels are being installed in parking lots 30 and 32 at UC Riverside [83].
Harvard University
Strong Climate Action Goal
Motivated by its goal of achieving fossil fuel-neutrality by 2026 and fossil fuel-free by 2050 [85], the
capacity of on-site solar PV has surged from lower than 0.2 MWdc in 2011 to nearly 1.6 MWdc in 2018.
Assuming a state-averaged capacity factor of 13.3% and a region-averaged emission rate of 0.955
lbCO2e/kWh [5], the on-site solar capacity on Harvard University’s campus could generate 1836 MWh
electricity and reduce carbon emissions by 797 MTCO2e in 2018.
Figure 38. Installed Solar PV Capacity at Harvard [86]

70
Best-Practice Takeaways
Seeking for external collaboration opportunities and financial incentives
As we described above, ASU received a large number of external partnerships which provide enough
financial incentives to reduce up-front capital cost and increase the project economics. UC Davis and
UC Riverside purchase electricity from on-site or off-site PV systems under different types of PPAs. In
these two cases, universities do not own the property of solar panels, thus avoiding capital expenditure
while at the same time are still able to claim RECs when they consume electricity from renewable
energy. Regarding the policy environment in NC where third-party electricity sales are not allowed, co-
investment, as we mentioned before in the section of Regulatory Framework, is a good strategy to
claim both the RECs and investment tax credit as one of the developers of the solar PV project.
Taking advantages of PV potential in parking lots
According to the estimation conducted by Duke University Facilities Management Department, the
practical potential of installing solar PV panels on every campus building is around 16 MWdc about
30% of the rooftop technical PV potential estimated in this study considering layout, technical barriers,
and installation challenges) would only cover 4% of the campus annual energy demand, which reduce
14k MTCO2e/year, 4% of the 2007 carbon emission baseline [87]. However, estimated by this study
(35.6 MWdc at Duke University) and evidenced by best practices from UC Davis and ASU, parking lots
could provide a huge PV potential and is more economic than rooftop PV system. In the case of Duke
University, PV potential in parking lots should be paid enough attention in the future.
Easier to implement when on-site renewables are considered in the building design phase
It is also worth mentioning that a noticeable proportion of PV projects in these universities mentioned
above are facilitated by incorporating PV during the building design phase (e.g. Tennis Center at
Harvard University). By considering on-site renewable projects in building design, the net benefit of
new buildings will be optimized by the building energy demand, the available area for PV installations,
cost of installation, operation, and maintenance. Regarding Duke University, the recent proposal on
relocating students off Central Campus [88] illustrates a possible opportunity for Duke to incorporate
on-site renewable energy resources into consideration when designing the new central campus.

71
Challenges: how to minimize disruption to school activities during the implementation phase?
Challenges and barriers are also demonstrated by these pilot project. One of the most significant
challenges refers to the disruption of school activities and parking lots functionality during the
implementation phase of on-site PV projects [80]. Since the stakeholders of this problem include nearly
every member in the Duke community, as well as the limited time and resources of this Master Project,
this problem is beyond the research scope of this study and would be considered if further research
opportunities permit.

72
Conclusions
Conclusions
This study has been motivated by our examination of Duke University Climate Action Plan, in which
Duke has committed to achieving carbon neutrality by 2024, but there is a lack of PV solar integration
strategy. Therefore, apart from offsetting 55% of the total GHG emission relative to 2007 baseline, to
achieve the rest 21% emission reduction goal by 2024, we identify that solar capacity will play an
important role in the pathway to a carbon-neutral campus. This study explores alternatives of
contributing to this target through the installation of solar photovoltaic systems (PV). It estimates 51.5
MWdc when installing on rooftops and 35.6 MWdc when installed atop parking lots as technical
potential of on-site PV on Duke Campus and conclude that even though the federal and state
regulations are not optimal for supporting the development of a system that competes with a fossil
fuel system supported over decades for offering its current reliability and price wise characteristics,
there is an important room for developing Duke’s solar PV potential.
The state’s regulations limit the benefits of on-campus PV development given a) the lack of programs
allowing the participation of third-party energy providers, b) the limitation of standard Power Purchase
Agreements for solar energy facilities to less than 1 MWdc, and c) the lack of certainty on the value of
Renewable Energy Credits (RECs).
Regarding the system-wide impact of the solar capacity addition at Duke University, an hourly system
operation simulation analysis accounting for the technical constraints of this complex DEC/DEP system
shows that the solar capacity at Duke University would decrease the system cost and emissions (CO2e,
NOX, SO2) in most scenarios. At the same time, grid reliability would be slightly negatively impacted.
In the case of the project economics and financing alternatives, the costs of installation on parking lots
are lower than on rooftops, but due to economies of scale, the most economical option to reduce
emissions is to install off-site solar farms. Investment tax credit, if successfully claimed by co-investing
solar projects with external business partners, could significantly improve the project economics for all
73
the PV development options.
In terms of the cost-effectiveness of sustainability, this study estimates the carbon abatement cost
(COA) for different types of carbon-abating strategies that Duke University could apply at this stage
under business-as-usual (BAU) and carbon-tax scenarios. Under the BAU scenario, the solar farm has a
negative COA as they are profitable. The carbon offset is the second cheapest options, followed by
parking-lot PV and then RECs. Roof-top PV is the most expensive option, but more tangible and visible
than RECs to showcase Duke University’s ambition and efforts on combating climate change. Under the
carbon-tax scenarios, the COAs of all PV projects reduce, thus leading RECs to be the most expensive
option. Rooftop PV becomes competitive compared with RECs, while parking-lot PV also become more
competitive compared with purchasing or generating carbon offset credits.
Nevertheless, an objective evaluation would consider what is the best strategy to pursue given the
context of Duke University connected to a relatively clean grid with some mechanisms in place that are
pushing for an even cleaner energy matrix, and where the development of solar PV could have a
marginal impact on the system’s trajectory, but would show Duke’s commitment by a large
deployment of PV solar on campus. Or by a less notorious strategy as dedicating such economic
resources to protect the Amazon rainforest, or to support efforts that provide access to a clean and
reliable energy source to developing countries’ populations from India or Nigeria, for instance.
Opportunities & Challenges
Opportunities
DEC/DEP system is not saturated
According to our model analysis, the solar addition would incrementally reduce the system cost and
emissions, while only slightly impacts the reliability of power supply, which indicates that DEC/DEP
system can still accommodate a noticeable amount of renewable energy resources without largely
affecting the reliability.

74
Flat roofs & parking lots
According to our estimation, nearly 78% of the roof area at Duke University System is flat, which is
perfect for solar PV installation. Moreover, Duke University owns a huge PV potential atop parking lots,
which could at most provide 35.6 MWdc solar generating capacity.
Challenges
Low grid electricity cost
Since Duke University enjoys lower electricity cost from Duke Energy, any alternative energy project is
relatively expensive because the annual avoided electricity cost is low, which also entails a larger or
even infinite payback period.
Gothic buildings
More than 10% of the total roof area at Duke University System is gothic roofs23. Installing solar PV
panels on gothic roofs is neither economically nor aesthetically feasible.
Regulated market
Since Duke Energy is a regulated utility, the financial incentives of renewable energy resources are
relatively low compared with CA and other states. This largely increases the project cost and
contributes to a poorer project economics.
Implementation barriers
As we mentioned before, the ownership of the campus distribution system belongs to Duke Energy,
which indicates extra interconnection costs.
Cheaper solar farm
According to our economic and sustainability analysis, developing off-site solar farm is profitable and
has negative carbon abatement cost, while installing PV system on rooftop and parking lots are among
23 if we exclude roof area from medical center, which is nearly all flat, this number will largely increase.

75
the most expensive options at this stage, even investment tax credit (ITC) is considered.
Undeveloped RECs market
As discussed previously, RECs price is uncertain in NC when the market is not developed, the price of
RECs applied in comparison of COA is the state average, however, the price deviation is huge. In this
case, purchasing RECs involves resources and efforts on price negotiation, which eventually increase
the total cost of RECs. Compared with on-site solar, the cost advantage of RECs is weakened by its price
uncertainty and is intangibility to the public to showcase the efforts to address the challenges of
climate change.
Carbon abatement cost will increase
As shown in Equation 5, COA is calculated by dividing project’s LCOE by grid electricity emission rate.
Qualitatively, it is safe to say that grid electricity would be cleaner in the future, thus leading to a lower
emission in CO2e, NOX, SO2, and other pollutants. Therefore, with the same amount of grid electricity
consumption replaced by on-site or off-site solar energy, the COA will increase annually.
Limitations and Future Research Focuses
More comprehensive economic model
The accuracy of the economic model in this study is limited as it did not include cost savings from
reduced demand charges. The next step of this project would consider improving the
comprehensiveness of the economic model.
Consider energy storage
When a net-metering program in NC is not favorable towards consumers, PV plus energy storage
equipment could be a feasible strategy to balance supply from solar capacity and campus energy
needs. In addition, to meet the reliability needs of Duke University, energy storage would play a key
role when coupled with PV solar integration.

76
Comprehensive sustainability assessment
Metrics used for assessing sustainability is not limited to COA, which we apply in this study. The next
step of research would focus on how to compare PV with following carbon-abating alternatives in the
context of sustainability from multi-dimensional perspectives, including their ancillary services, ability
to facilitate on-campus steam supply and chilled water supply, as well as improving the power
reliability that Duke Health System and Medical Center give the top priority. And going further, a life
cycle assessment of the different options would be needed for a more comprehensive evaluation.
• Waste management
• Energy efficiency
• Community projects
• Combined Heat and Power Plants (CHP)
Another most-likely future generation fleet scenario
According to Duke Energy Carolinas 2017 IRP report [89], updated resource plans are proposed, which
aims at reducing nuclear capacity. This proposal provides another most-likely future scenario under
which the patterns of power system economics and environmental impact are likely to be largely
altered.
77
Appendix
Appendix 1. Model Assumptions -- Power System Operation Model
Since this study is built on ref [34], the majority of assumptions are inherited from ref [34]. while we
also updated and revised some of the assumptions. Key assumptions are listed below, for detailed
model information, please refers to ref [34] and its supporting information [35].
➢ Transmission constraints are not considered in this study;
➢ Over-generation and under-generation penalties are considered, which indicates that DEC/DEP
system could address imbalance events with monetary costs. The penalty is $10 000/MWh [34].
➢ Nuclear power plants (NPPs) are assumed to operate constantly at the capacity factor of 89.2%,
which is the average capacity factor of NPPs in DEC/DEP system, obtained from eGrid2014 [5].
The marginal cost of nuclear plant in 2015 is 24.4$/MWh, and 30.96$/MWh in 2030, assuming a
1.6% annual increase from 2015 to 2030 [34].
➢ Hydroelectric plants are aggregated as one plant for simplification. Being Consistent we assume
this hydroelectric plant to have a minimum uptime of 1 hour and a minimum downtime of 1
hour. This assumption enables the plant to start and shut down without any other constraints
quickly. However, this model also assumed the hydroelectric plant to operate only from 7 AM
to 8 PM and meet the water availability constraint [34].
➢ The assumptions of conventional thermal generators are also consistent with [34].
➢ Solar capacity includes both compliance and non-compliance solar as compliance solar.
➢ In our study, we use DEC/DEP’s IRP report for 2029 to serve as a proxy of 2030, since the
capacity plan will not change substantially in one year.
➢ This study obtained actual demand by forecast demand plus forecast error from EIA, which is
represented by a random variable following a normal distribution with a mean of 0 and 5% of
standard deviation.
➢ Solar generation is considered in the total annual generation.
➢ This study neglected NGFB, pumped storage and wind in the system operation planning model
(0 MW now and only 150 MW in the baseline 2030).

78
➢ This study also assumed that imported electricity from other balancing authorities is the most
expensive resource in the system, the cost of which is determined by 110% * max electricity
price among all generators owned by DEC/DEP.
➢ All fuel prices forecast data are obtained from AEO2018, including coal delivered price in power
sector and natural gas delivered price in power sector [90].
➢ All prices are converted to 2015USD by CPI index [91] (2014 to 2015: 0.00%; 2016 to 2015: -
1.01%).
➢ Emission rates for air pollutants (NOX, SO2) are obtained from the eGrid database [5].

79
Appendix 2. Parking Lots Available Area for PV Installation
Table A 1. Available area atop parking lots at Duke University System.
Parking Lot PV Area
1 CENTER FOR LIVING (CFL)
2 Old Credit Union Lot
3 Dialysis Center Lot
4 Washington Duke Hotel Lot
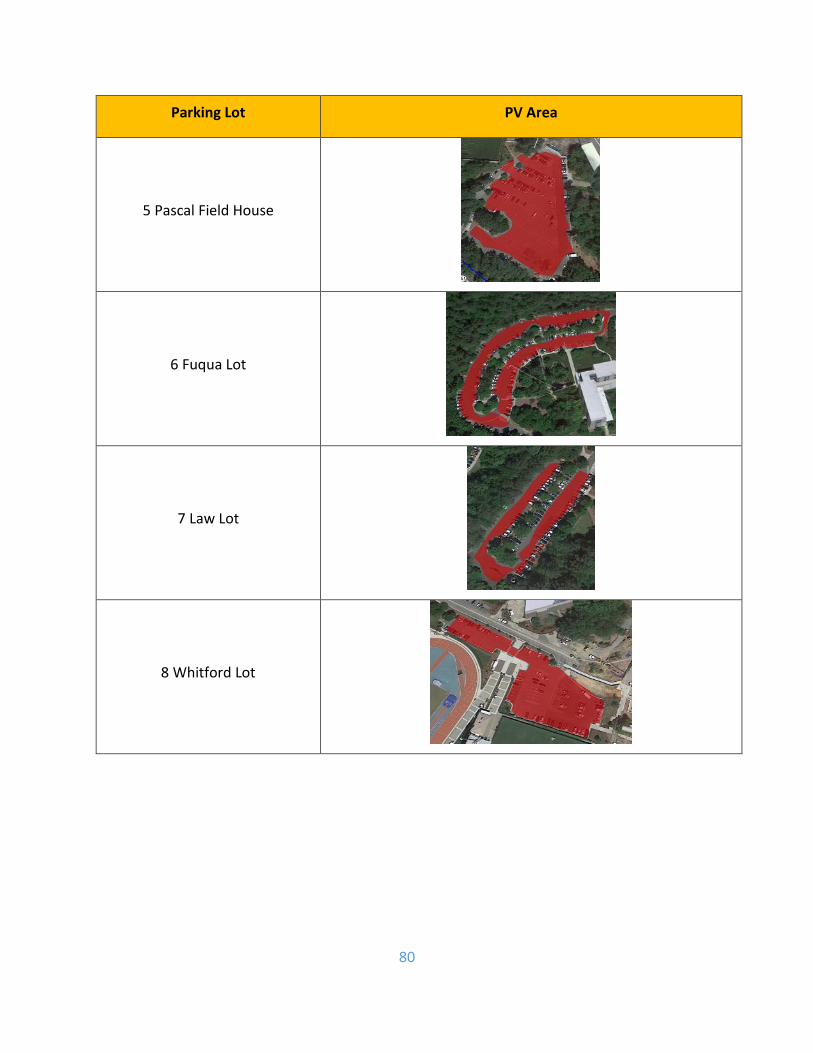
80
Parking Lot PV Area
5 Pascal Field House
6 Fuqua Lot
7 Law Lot
8 Whitford Lot

81
Parking Lot PV Area
9 Blue Zone
10 IM (Intramural) Lot
11 Card Gym Lot
12 Duke University Road Lot #1

82
Parking Lot PV Area
13 Duke University Road Lot #2
14 Alumni House Lot
15 Nasher Museum of Art Lot 1
16 Nasher Museum of Art Lot 2
17 Campus Drive Lot
(Undergraduate Admissions)

83
Parking Lot PV Area
18 Duke Gardens Lot
19 Duke Police
20 402-406 Oregon Lot
21 Central Campus Lots

84
Parking Lot PV Area
22 H Lot
23 Graduate Center (GC) Lot
24 American Tobacco Campus
Garages
25 Power House Lot

85
Parking Lot PV Area
26 Carmichael Lot
27 Epworth Lot
28 Crowell-Wilson Lot
29 Brown/Bassett Lot

86
Parking Lot PV Area
30 Pegram Lot
31 Bivins Lot
32 Randolph Lot
33 Gilbert-Addoms Lot

87
Parking Lot PV Area
34 Carr Lot
35 GA Loop
36 Southgate Lot
37 Global Health Research
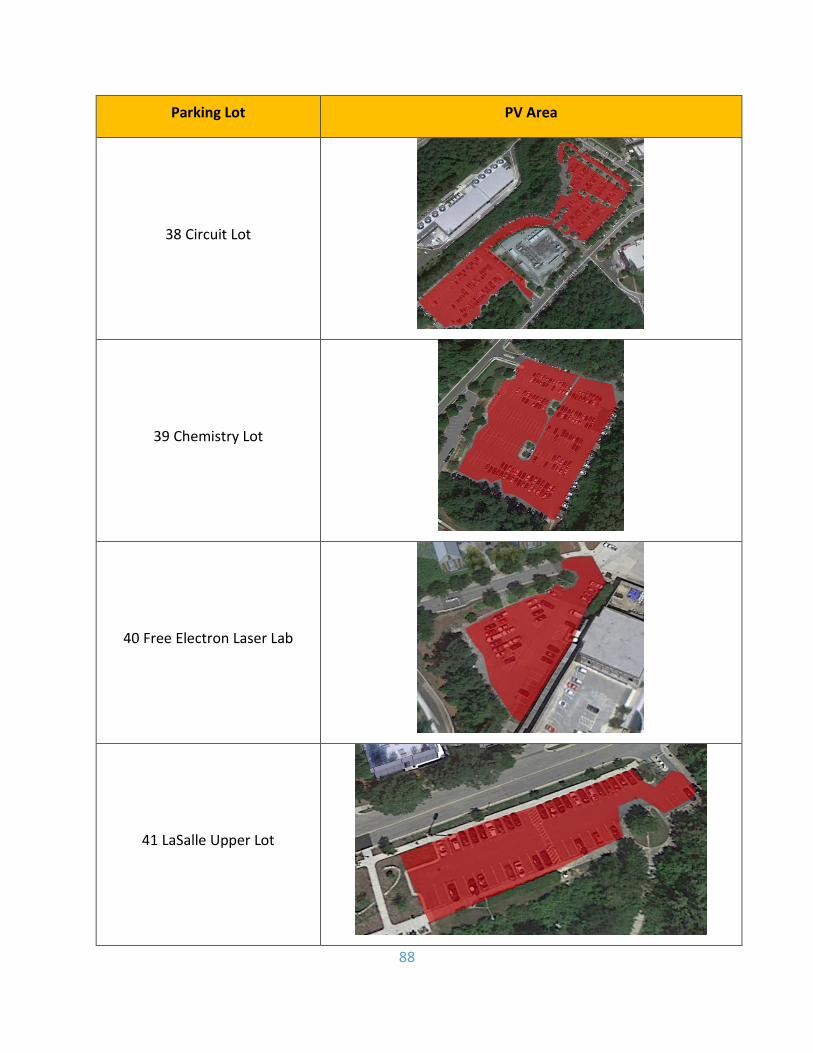
88
Parking Lot PV Area
38 Circuit Lot
39 Chemistry Lot
40 Free Electron Laser Lab
41 LaSalle Upper Lot

89
Parking Lot PV Area
42 Bryan Center Lot
43 Faculty Club Lot
44 Unnamed Parking lot

90
References
[1] “Duke Climate Action Plan.” 2018. Accessed April 24. https://sustainability.duke.edu/sites/default/files/2009dukecap.pdf.
[2] “Greenhouse Gas Accounting.” 2018. Greenhouse Gas Accounting | Sustainability. Accessed April 25. https://sustainability.duke.edu/metrics/ghg.
[3] “Duke Energy - 2016 Sustainability Report.” 2018. Environmental Performance Metrics | Duke Energy 2016 Sustainability Report. Accessed April 25. https://sustainabilityreport.duke-energy.com/operations/environmental-performance-metrics/.
[4] “Research Drive Garage Goes Solar.” 2018. Duke Today. Accessed April 25. https://today.duke.edu/2018/03/research-drive-garage-goes-solar.
[5] “Emissions & Generation Resource Integrated Database (EGRID).” 2018. EPA. Environmental Protection Agency. March 13. https://www.epa.gov/energy/emissions-generation-resource-integrated-database-egrid.
[6] Fleten, S, K Maribu, and I Wangensteen. 2007. “Optimal Investment Strategies in Decentralized Renewable Power Generation under Uncertainty.” Energy 32 (5): 803–15. doi:10.1016/j.energy.2006.04.015.
[7] “Renewable Integration Study Reports.” 2018. PJM© . Accessed April 25. http://www.pjm.com/committees-and-groups/subcommittees/irs/pris.aspx.
[8] Lave, Matthew, Jan Kleissl, and Ery Arias-Castro. 2012. “High-Frequency Irradiance Fluctuations and Geographic Smoothing.” Solar Energy 86 (8): 2190–99. doi:10.1016/j.solener.2011.06.031.
[9] “2017 Progress Report.” 2018. Sustainability Strategic Plan | Sustainable Duke. Accessed April 25. https://forms.hr.duke.edu/sustainability/ssp2017/.
[10] “Duke Energy 2016 Sustainability Report.” 2018. Accessed April 25. https://sustainabilityreport.duke-energy.com/downloads/16-duke-sr-complete.pdf.
[11] “Swine Waste-to-Energy (Loyd Ray Farms).” 2018. Swine Waste-to-Energy (Loyd Ray Farms) | Sustainability. Accessed April 25. https://sustainability.duke.edu/offsets/projects/lrf.
[12] “Urban Forestry.” 2018. Urban Forestry | Sustainability. Accessed April 25. https://sustainability.duke.edu/offsets/projects/forestry.
[13] “Research Drive Garage Goes Solar.” 2018. Duke Today. Accessed April 25.

91
https://today.duke.edu/2018/03/research-drive-garage-goes-solar.
[14] “Project Sunroof - Solar Calculator.” 2018. Google. Google. Accessed April 25. https://www.google.com/get/sunroof.
[15] “Duke Campus GIS Data.” 2010. Duke University Libraries Blogs. May 11. https://blogs.library.duke.edu/blog/2010/05/11/duke-campus-gis-data/.
[16] “PVWatts.” 2018. PVWatts Calculator. Accessed April 25. http://pvwatts.nrel.gov/.
[17] “Microgrid Decisions Simplified.” 2018. HOMER - Hybrid Renewable and Distributed Generation System Design Software. Accessed April 25. https://www.homerenergy.com/.
[18] Singh, Rhythm, and Rangan Banerjee. 2015. “Estimation of Rooftop Solar Photovoltaic Potential of a City.” Solar Energy 115: 589–602. doi:10.1016/j.solener.2015.03.016.
[19] Sun, Yan-Wei, Angela Hof, Run Wang, Jian Liu, Yan-Jie Lin, and De-Wei Yang. 2013. “GIS-Based Approach for Potential Analysis of Solar PV Generation at the Regional Scale: A Case Study of Fujian Province.” Energy Policy 58: 248–59. doi:10.1016/j.enpol.2013.03.002.
[20] Wiginton, L.k., H.t. Nguyen, and J.m. Pearce. 2010. “Quantifying Rooftop Solar Photovoltaic Potential for Regional Renewable Energy Policy.” Computers, Environment and Urban Systems 34 (4): 345–57. doi:10.1016/j.compenvurbsys.2010.01.001.
[21] Khan, Jibran, Arsalan, and Mudassar Hassan. 1970. “Estimation of Rooftop Solar Photovoltaic Potential Using Geo-Spatial Techniques: A Perspective from Planned Neighborhood of Karachi – Pakistan, by Khan, Jibran; Arsalan, Mudassar Hassan.” Renewable Energy. Elsevier. January 1. https://ideas.repec.org/a/eee/renene/v90y2016icp188-203.html.
[22] Izquierdo, Salvador, Marcos Rodrigues, and Norberto Fueyo. 2008. “A Method for Estimating the Geographical Distribution of the Available Roof Surface Area for Large-Scale Photovoltaic Energy-Potential Evaluations.” Solar Energy 82 (10): 929–39. doi:10.1016/j.solener.2008.03.007.
[23] Lehmann, Harry, and Stefan Peter. “Assessment of roof & façade potentials for solar use in Europe.” Institute for sustainable solutions and innovations (ISUSI): Aachen, Germany (2003).
[24] Khan, Jibran, and Mudassar Hassan Arsalan. 2016. “Estimation of Rooftop Solar Photovoltaic Potential Using Geo-Spatial Techniques: A Perspective from Planned Neighborhood of Karachi – Pakistan.” Renewable Energy 90: 188–203. doi:10.1016/j.renene.2015.12.058.
[25] “E-Series Residential Solar Panels - SunPower.” 2018. Accessed April 25. https://us.sunpower.com/sites/sunpower/files/media-library/data-sheets/ds-e20-series-327-

92
residential-solar-panels.pdf.
[26] Data, US Climate. 2018. “Temperature - Precipitation - Sunshine - Snowfall.” Climate Durham - North Carolina and Weather Averages Durham. Accessed April 25. https://www.usclimatedata.com/climate/durham/north-carolina/united-states/usnc0192.
[27] “Duke University Maps.” 2018. Duke University Maps. Accessed April 25. http://maps.duke.edu/.
[28] “SunPower Solar Parking Solutions - Home Solar Panels ...” 2018. Accessed April 25. https://us.sunpower.com/sites/sunpower/files/media-library/spec-sheets/sp-sunpower-solar-parking-canopies-solutions.pdf.
[29] Larsen, K., and J. Russo. “Integrating renewable electricity on the grid.” American Physical Society (2013).
[30] “Fact Sheet - Duke Energy.” 2018. Accessed April 25. https://www.duke-energy.com/_/media/pdfs/our-company/duke-energy-fast-facts.pdf?la=en.
[31] “North Carolina’s Public Utility Infrastructure & Regulatory Climate” 2018. Accessed April 25. http://www.ncuc.commerce.state.nc.us/overview/overview.pdf.
[32] “2014 Duke Energy Carolinas Integrated Resource Plan (Annual Report).” 2014. September 2. http://starw1.ncuc.net/NCUC/ViewFile.aspx?Id=c3c5cbb5-51f2-423a-9dfc-a43ec559d307.
[33] 2018. Integrated Resource Plans. Accessed April 25. http://www.energy.sc.gov/node/3048 .
[34] Alqahtani, Bandar Jubran, Kyra Moore Holt, Dalia Patiño-Echeverri, and Lincoln Pratson. 2016. “Residential Solar PV Systems in the Carolinas: Opportunities and Outcomes.” Environmental Science & Technology 50 (4): 2082–91. doi:10.1021/acs.est.5b04857.
[35] Jubran Alqahtani, Bandar. 2018. “Supplementary Information.” Accessed April 25.
https://pubs.acs.org/doi/suppl/10.1021/acs.est.5b04857/suppl_file/es5b04857_si_001.pdf.
[36] Jubran Alqahtani, Bandar. 2018. “Supplementary Information.” Accessed April 25.
https://pubs.acs.org/doi/suppl/10.1021/acs.est.5b04857/suppl_file/es5b04857_si_001.pdf.
[37] “RTO Unit Commitment Test System.” 2018. Accessed April 25. https://www.ferc.gov/legal/staff-
reports/rto-COMMITMENT-TEST.pdf.
[38] Fenton, F. 1982. “Survey of Cyclic Load Capabilities of Fossil-Steam Generating Units.” IEEE
Transactions on Power Apparatus and Systems PAS-101 (6): 1410–19. doi:10.1109/tpas.1982.317188.

93
[39] Lew, Debra, Greg Brinkman, Nikhil Kumar, Steve Lefton, Gary Jordan, and Sundar Venkataraman.
2013. “Finding Flexibility: Cycling the Conventional Fleet.” IEEE Power and Energy Magazine 11 (6): 20–
32. doi:10.1109/mpe.2013.2277988.
[40] “Cost and Performance Assumptions for Modeling Electricity Generation
Technologies” 2018. Accessed April 25. https://www.nrel.gov/docs/fy11osti/48595.pdf .
[41] “Capital Cost Review of Power Generation Technologies.” 2018. Accessed April 25.
https://www.wecc.biz/Reliability/2014_TEPPC_Generation_CapCost_Report_E3.pdf.
[42] Unruh, Gregory C. 2000. “Understanding Carbon Lock-In.” Energy Policy28 (12): 817–30. doi:10.1016/s0301-4215(00)00070-7.
[43] “Public Utility Regulatory Policies Act of 1978 (PURPA).” 2018. Department of Energy. Accessed April 25. https://www.energy.gov/oe/services/electricity-policy-coordination-and-implementation/other-regulatory-efforts/public.
[44] “ENERGY POLICY ACT OF 2005.” 2018. Accessed April 25. https://www.gpo.gov/fdsys/pkg/PLAW-109publ58/pdf/PLAW-109publ58.pdf.
[45] “Duke Energy Rebate 2018.” 2018. Sun Dollar Energy, LLC. Accessed April 25. http://www.sundollarenergy.com/duke-energy-rebate-2018.
[46] NC General Assembly. 2018. “North Carolina General Assembly.” NCGA - North Carolina General Assembly. Accessed April 25. http://www.ncga.state.nc.us/gascripts/BillLookUp/BillLookUp.pl?Session=2007&BillID=S3&votesToView=all.
[47] NORTH CAROLINA UTILITIES COMMISSION. 2011. “Annual Report Regarding Renewable Energy and Energy Efficiency Portfolio Standard in North Carolina.” October 1. http://www.ncuc.commerce.state.nc.us/reports/repsreport.pdf.
[48] NORTH CAROLINA UTILITIES COMMISSION. 2008. “Annual Report Regarding Renewable Energy and Energy Efficiency Portfolio Standard in North Carolina.” October 1. http://starw1.ncuc.net/NCUC/ViewFile.aspx?Id=9ceb5fea-c51f-4f08-9ea4-26c15d1c5949
[49] Chambers, Andrea, and Trevor Stiles. “Report of the Renewable Energy Committee.” Energy Law Journal 34, no. 1 (2013): 477.
[50] Gaul, Chip, and Sanya Carley. 2012. “Solar Set Asides and Renewable Electricity Certificates: Early Lessons from North Carolinas Experience with Its Renewable Portfolio Standard.” Energy Policy 48:

94
460–69. doi:10.1016/j.enpol.2012.05.043.
[51] NORTH CAROLINA UTILITIES COMMISSION. 2009. “Annual Report Regarding Renewable Energy and Energy Efficiency Portfolio Standard in North Carolina.” October 1. http://starw1.ncuc.net/NCUC/ViewFile.aspx?Id=336c641c-23bb-4257-b535-523584e41b3c
[52] NORTH CAROLINA UTILITIES COMMISSION. 2015. “Annual Report Regarding Renewable Energy and Energy Efficiency Portfolio Standard in North Carolina.” October 1. http://www.ncuc.commerce.state.nc.us/reports/repsreport2015.pdf
[53] Tian, Tian, Chang Liu, Eric Oshaughnessy, Shivani Mathur, Alison Holm, and John Miller. 2016. “Midmarket Solar Policies in the United States: A Guide for Midsized Solar Customers,” January. doi:10.2172/1328358.
[54] “GENERAL ASSEMBLY OF NORTH CAROLINA SESSION 2017 SESSION ...” 2018. Accessed April 25. https://www.ncleg.net/Sessions/2017/Bills/House/PDF/H589v6.pdf.
[55] “Solar PV Project Financing: Regulatory and Legislative ...” 2018. Accessed April 25. https://www.nrel.gov/docs/fy10osti/46723.pdf.
[56] Bird, Lori, Pieter Gagnon, and Jenny Heeter. 2016. “Expanding Midscale Solar: Examining the Economic Potential, Barriers, and Opportunities at Offices, Hotels, Warehouses, and Universities,” January. doi:10.2172/1326896.
[57] “U.S. Solar Photovoltaic System Cost Benchmark: Q1 2017.” 2018. Accessed April 25. https://www.nrel.gov/docs/fy17osti/68925.pdf.
[58] Mayer, Lauren. 2017. “2018 Cost of Solar Panels in Durham, North Carolina | EnergySage.” Solar News. EnergySage. September 6. https://news.energysage.com/much-solar-panels-cost-durham-north-carolina/.
[59] “Distributed Generation Renewable Energy Estimate of Costs.” 2018. Distributed Generation Renewable Energy Estimate of Costs | Energy Analysis | NREL. Accessed April 25. https://www.nrel.gov/analysis/tech-lcoe-re-cost-est.html.
[60] “Land-Use Requirements for Solar Power Plants in the United ...” 2018. Accessed April 25. https://www.nrel.gov/docs/fy13osti/56290.pdf.
[61] “About the Campus.” 2018. Duke University Facilities Management. Accessed April 25. http://fmd.duke.edu/campus/index.php.
[62] Eckhouse, Brian, Ari Natter, Christopher Martin, and Bloomberg. 2018. “Trump's Tariffs on Solar Mark Biggest Blow to Renewables Yet (1).” SFGate. Bloomberg. January 23.

95
https://www.sfgate.com/business/article/Trump-Taxes-Solar-Imports-in-Biggest-Blow-to-12516130.php.
[63] Isshu Kikuma, E.J.R., and Xuebei Tan, Siting of Utility-Scale Solar in North Carolina, in Nicholas School of the Environment. 2018, Duke University: https://dukespace.lib.duke.edu/dspace/handle/10161/52 .
[64] “Utility-Scale Photovoltaic Procedures and Interconnection Requirements” 2018. Accessed April 25. http://energy.sandia.gov/wp-content/gallery/uploads/PV_Interconnection-SAND2012-2090.pdf.
[65] Joshi, John, and Jamie. 2017. “Tax Equity 101: Structures.” Woodlawn Associates. February 9.
http://www.woodlawnassociates.com/tax-equity-101/.
[66] “Introduction to Virtual Power Purchase Agreements - US EPA.” 2018. Accessed April 25. https://www.epa.gov/sites/production/files/2016-09/documents/webinar_kent_20160928.pdf.
[67] “April 2017 North Carolina Solar and Agriculture.” 2018. Accessed April 25. https://energync.org/wp-content/uploads/2017/04/NCSEA_NC_Solar_and_Agriculture_4_19.pdf.
[68] “Tax Reform Increases Bonus Depreciation for 2017 Taxes – Byrne | Zizzi.” 2018. Byrne | Zizzi. January 15. http://byrnezizzi.com/tax-reform-increases-bonus-depreciation-2017-taxes-2/.
[69] Staff, Investopedia. 2006. “Millage Rate.” Investopedia. Investopedia. October 17. https://www.investopedia.com/terms/m/millagerate.asp.
[70] “LowEnergy Parking Structure Design Owners Design Teams.” 2018. Accessed April 25. https://www.nrel.gov/docs/fy13osti/52025.pdf.
[71] Richardson, Luke. 2018. “2018 SREC Prices: How to Sell Your RECs in the U.S. | EnergySage.” Solar News. EnergySage. March 19. https://news.energysage.com/srec-prices-explaining-u-s-srec-solar-market/.
[72] “What Is a Carbon Offset?” 2018. What Is a Carbon Offset? | Sustainability. Accessed April 25. https://sustainability.duke.edu/offsets/about/what-carbon-offset.
[73] “About the Duke Carbon Offsets Initiative.” 2018. About the Duke Carbon Offsets Initiative | Sustainability. Accessed April 25. https://sustainability.duke.edu/offsets/about.
[74] “Duke Carbon Offsets Initiative 2016 Annual Report.” 2018. Accessed April 25. https://sustainability.duke.edu/sites/default/files/annualreport2016.pdf.
[75] “Duke Carbon Offsets Initiative 2015 Annual Report.” 2018. Accessed April 25.

96
https://sustainability.duke.edu/sites/default/files/annualreport2015.pdf
[76] “EXPLAINING THE PRICE OF VOLUNTARY CARBON OFFSETS.” 2018. Accessed April 25. http://environment.yale.edu/kotchen/pubs/explain.pdf.
[77] Kazarov, Elena, Baehr, Ellis, Tan, Jing, Zhang, Yee, and Ashley. 2015. “AN ANALYSIS OF RENEWABLE ENERGY, ENERGY EFFICIENCY, AND CARBON OFFSETS AT DUKE UNIVERSITY.” DukeSpace. April 24. https://dukespace.lib.duke.edu/dspace/handle/10161/9655.
[78] “Implementing a US Carbon Tax: Challenges and Debates:” 2016. IMF ELibrary: October 30. http://www.elibrary.imf.org/view/IMF071/21375-9781138825369/21375-9781138825369/21375-9781138825369.xml.
[79] “Consumer Price Index for All Urban Consumers: All Items.” 2018. FRED. April 11. https://fred.stlouisfed.org/series/CPIAUCSL.
[80] “ASU Solar.” 2018. Business and Finance. March 28. https://cfo.asu.edu/solar.
[81] “Home.” 2018. PowerParasol. Accessed April 25. https://powerparasol.com/.
[82] NRG Energy, Inc. 2018. “NRG Case Studies.” NRG Energy. Accessed April 25. http://www.nrg.com/renewables/projects/business/arizona-state-university/.
[83] Martinez, Sandra Baltazar. 2018. “UC Riverside No. 2 Syste MWide for Renewable Energy.” UCR Today. Accessed April 25. https://ucrtoday.ucr.edu/48733.
[84] “UC Davis, SunPower Dedicate University of California's Largest Campus Solar Power Plant.” 2016. UC Davis. May 12. https://www.ucdavis.edu/sunpower-dedication/.
[85]”Our Plan.” 2018. Sustainability at Harvard. February 7. https://green.harvard.edu/campaign/our-plan.
[86] “Renewable Energy.” 2018. Sustainability at Harvard. April 20. https://green.harvard.edu/topics/climate-energy/renewable-energy.
[87] Berko, Katherine. 2018. “Duke Climate Forum Considers Ways to Meet 2024 Neutrality Goal.” The Chronicle. April 12. http://www.dukechronicle.com/article/2018/04/duke-climate-forum-considers-ways-to-meet-2024-neutrality-goal.
[88] Ballentine, Claire. 2017. “Those Buildings Are Ready to Be Retired.” The Chronicle. October 11. http://www.dukechronicle.com/article/2017/10/those-buildings-are-ready-to-be-retired.
[89]”Duke Energy Carolinas South Carolina 2017 Integrated Resource Plan (Annual Report)” 2018.

97
Accessed April 25. http://www.energy.sc.gov/files/view/2017%Duke%Energy%Carolinas%Integrated%Resource%Plan.pdf.
[90] “U.S. Energy Information Administration - EIA - Independent Statistics and Analysis.” 2018. EIA -
Annual Energy Outlook 2018. Accessed April 25. https://www.eia.gov/outlooks/aeo/.
[91] “CPI Home.” 2018. U.S. Bureau of Labor Statistics. U.S. Bureau of Labor Statistics. Accessed April
25. https://www.bls.gov/cpi/.