Increasing physical activity, but persisting social gaps among middle-aged people: trends in...
10
Increasing physical activity, but persisting social gaps among middle- aged people: trends in Northern Sweden from 1990 to 2007 Nawi Ng 1,2,3 *, Kerstin So ¨ derman 4 , Margareta Norberg 1,2,3 and Ann O ¨ hman 1,2,5 1 Department of Public Health and Clinical Medicine, Division of Epidemiology and Global Health, Umea ˚ University, Umea ˚ , Sweden; 2 Umea ˚ Centre for Global Health Research, Umea ˚ University, Umea ˚, Sweden; 3 Centre for Population Studies, Ageing and Living Conditions Programme, Umea ˚ University, Umea ˚ , Sweden; 4 Department of Community Medicine and Rehabilitation, Physiotherapy, Umea ˚ University, Umea ˚ , Sweden; 5 Umea ˚ Centre for Gender Studies, Umea ˚ University, Umea ˚ , Sweden Background: Physical activity is identified as one important protective factor for chronic diseases. Physical activity surveillance is important in assessing healthy population behaviour over time. Many countries lack population trends on physical activity. Objective: To present trends in physical activity levels in Va ¨sterbotten County, Sweden and to evaluate physical activity among women and men with various educational levels. Methods: Population-based cross-sectional and panel data from the Va ¨sterbotten Intervention Programme (VIP) during 19902007 were used. All individuals in Va ¨sterbotten County who turned 40, 50, or 60 years old were invited to their local primary health care for a health screening. Physical activity during commuting, recreational activities, physical exercise, and socio-demographic datawere collected using a self-administered questionnaire. Respondents were categorised as sedentary, moderate physically active, or physically active. Results: The prevalences of physically active behaviours increased from 16 to 24.2% among men and from 12.6 to 30.4% among women. Increases are observed in all educational groups, but gaps between educational groups widened recently. The level of sedentary behaviour was stable over the time period studied. The 10- year follow-up data show that the prevalences of physically active behaviours increased from 15.8 to 21.4% among men and 12.7 to 23.3% among women. However, 10.2% of men and 3.8% of women remained sedentary. Conclusion: Despite the promising evidence of increasing physical activity levels among the population in Va ¨sterbotten County, challenges remain for how to reduce the stable levels of sedentary behaviours in some subgroups. Persisting social gaps in physical activity levels should be addressed further. An exploration of people’s views on engaging in physical activity and barriers to doing so will allow better formulation of targeted interventions within this population. Keywords: physical activity; sedentary lifestyle; health promotion; educational status; longitudinal studies; Sweden Received: 9 February 2011; Revised: 13 June 2011; Accepted: 20 June 2011; Published: 21 July 2011 P hysical activity is increasingly promoted globally as a healthy lifestyle behaviour (1, 2). The World Health Organisation (WHO) emphasises the need and importance of regular physical activity across all age spans (1). Regular physical activity improves cardiore- spiratory fitness, enhances cognitive function, lowers overall premature mortality, and decreases the risk of cardiovascular diseases, some cancers, musculoskeletal diseases, neurodegenerative diseases, and depression (13). The WHO recommends that ‘‘Adults aged 1864 should do at least 150 minutes of moderate-intensity aerobic physical activity throughout the week or do at least 75 minutes of vigorous-intensity aerobic physical activity throughout the week or an equivalent combina- tion of moderate- and vigorous-intensity activity.’’ Additional health benefits can be obtained if adults do (page number not for citation purpose) æ Special Volume: VIP Global Health Action 2011. # 2011 N. Ng et al. This is an Open Access article distributed under the terms of the Creative Commons Attribution- Noncommercial 3.0 Unported License (http://creativecommons.org/licenses/by-nc/3.0/), permitting all non-commercial use, distribution, and reproduction in any medium, provided the original work is properly cited. 1 Citation: Global Health Action 2011, 4: 6347 - DOI: 10.3402/gha.v4i0.6347
-
Upload
independent -
Category
Documents
-
view
0 -
download
0
Transcript of Increasing physical activity, but persisting social gaps among middle-aged people: trends in...

Increasing physical activity, butpersisting social gaps among middle-aged people: trends in NorthernSweden from 1990 to 2007Nawi Ng1,2,3*, Kerstin Soderman4, Margareta Norberg1,2,3 andAnn Ohman1,2,5
1Department of Public Health and Clinical Medicine, Division of Epidemiology and Global Health,Umea University, Umea, Sweden; 2Umea Centre for Global Health Research, Umea University, Umea,Sweden; 3Centre for Population Studies, Ageing and Living Conditions Programme, Umea University,Umea, Sweden; 4Department of Community Medicine and Rehabilitation, Physiotherapy, UmeaUniversity, Umea, Sweden; 5Umea Centre for Gender Studies, Umea University, Umea, Sweden
Background: Physical activity is identified as one important protective factor for chronic diseases. Physical
activity surveillance is important in assessing healthy population behaviour over time. Many countries lack
population trends on physical activity.
Objective: To present trends in physical activity levels in Vasterbotten County, Sweden and to evaluate
physical activity among women and men with various educational levels.
Methods: Population-based cross-sectional and panel data from the Vasterbotten Intervention Programme
(VIP) during 1990�2007 were used. All individuals in Vasterbotten County who turned 40, 50, or 60 years old
were invited to their local primary health care for a health screening. Physical activity during commuting,
recreational activities, physical exercise, and socio-demographic data were collected using a self-administered
questionnaire. Respondents were categorised as sedentary, moderate physically active, or physically active.
Results: The prevalences of physically active behaviours increased from 16 to 24.2% among men and from
12.6 to 30.4% among women. Increases are observed in all educational groups, but gaps between educational
groups widened recently. The level of sedentary behaviour was stable over the time period studied. The 10-
year follow-up data show that the prevalences of physically active behaviours increased from 15.8 to 21.4%
among men and 12.7 to 23.3% among women. However, 10.2% of men and 3.8% of women remained
sedentary.
Conclusion: Despite the promising evidence of increasing physical activity levels among the population in
Vasterbotten County, challenges remain for how to reduce the stable levels of sedentary behaviours in some
subgroups. Persisting social gaps in physical activity levels should be addressed further. An exploration of
people’s views on engaging in physical activity and barriers to doing so will allow better formulation of
targeted interventions within this population.
Keywords: physical activity; sedentary lifestyle; health promotion; educational status; longitudinal studies; Sweden
Received: 9 February 2011; Revised: 13 June 2011; Accepted: 20 June 2011; Published: 21 July 2011
Physical activity is increasingly promoted globally as
a healthy lifestyle behaviour (1, 2). The World
Health Organisation (WHO) emphasises the need
and importance of regular physical activity across all age
spans (1). Regular physical activity improves cardiore-
spiratory fitness, enhances cognitive function, lowers
overall premature mortality, and decreases the risk of
cardiovascular diseases, some cancers, musculoskeletal
diseases, neurodegenerative diseases, and depression
(1�3). The WHO recommends that ‘‘Adults aged 18�64
should do at least 150 minutes of moderate-intensity
aerobic physical activity throughout the week or do at
least 75 minutes of vigorous-intensity aerobic physical
activity throughout the week or an equivalent combina-
tion of moderate- and vigorous-intensity activity.’’
Additional health benefits can be obtained if adults do
(page number not for citation purpose)
�Special Volume: VIP
Global Health Action 2011. # 2011 N. Ng et al. This is an Open Access article distributed under the terms of the Creative Commons Attribution-Noncommercial 3.0 Unported License (http://creativecommons.org/licenses/by-nc/3.0/), permitting all non-commercial use, distribution, and reproductionin any medium, provided the original work is properly cited.
1
Citation: Global Health Action 2011, 4: 6347 - DOI: 10.3402/gha.v4i0.6347
twice as much as recommended (1). In 2008, the US
government also used the same level of recommendation
to promote regular physical activity among the US
population (2). Increasing levels of sedentary behaviour,
particularly among youth and people living in urban
areas, have become a growing public health concern in
many high income countries in Europe and the United
States (4, 5).
Physical activity surveillance is important in assessing
population health over time. However, surveillance activ-
ities and repeated cross-sectional studies of physical
activity using a standardised and consistent instrument
over time and across countries are lacking, even in
European countries (6, 7). The Eurobarometer survey
collects information on different issues including health
among members of the European Union (EU). The
special Eurobarometer 246, conducted in 27 EU coun-
tries in 2005, showed that 51% of EU citizens reported
very little vigorous physical activity at work. The
proportions who reported a lot of physical activity at
work ranged from 10% in Malta and Italy to 27% in
Poland, the Netherlands, and Lithuania (8). The WHO
MONICA study, a multinational study to monitor the
trends and determinants in cardiovascular diseases as-
sessed physical activity as an optional section of its
questionnaire. Therefore, trend data are not available for
many of the 21 WHO MONICA participating countries
(9). In addition, many countries only have cross-sectional
data available.
The aim of this study is to describe trends in physical
activity levels using population based, cross-sectional,
and longitudinal panel data with a particular focus on
differences in physical activity levels among men and
women across educational groups in Sweden.
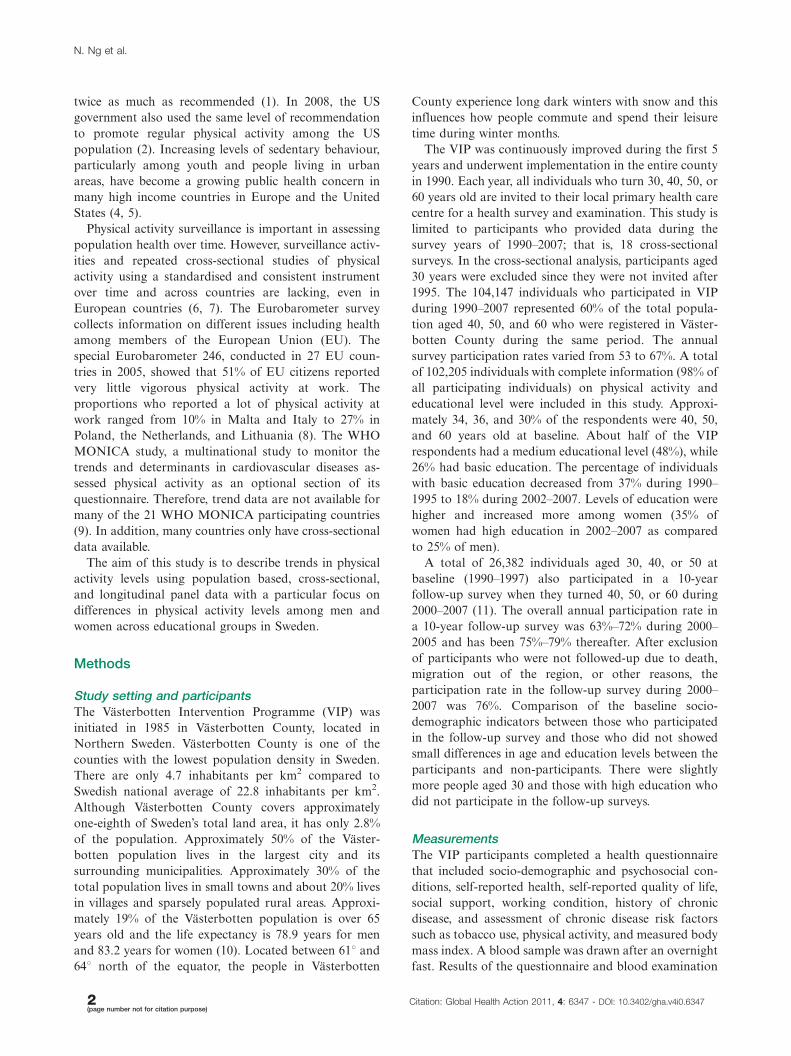
Methods
Study setting and participantsThe Vasterbotten Intervention Programme (VIP) was
initiated in 1985 in Vasterbotten County, located in
Northern Sweden. Vasterbotten County is one of the
counties with the lowest population density in Sweden.
There are only 4.7 inhabitants per km2 compared to
Swedish national average of 22.8 inhabitants per km2.
Although Vasterbotten County covers approximately
one-eighth of Sweden’s total land area, it has only 2.8%
of the population. Approximately 50% of the Vaster-
botten population lives in the largest city and its
surrounding municipalities. Approximately 30% of the
total population lives in small towns and about 20% lives
in villages and sparsely populated rural areas. Approxi-
mately 19% of the Vasterbotten population is over 65
years old and the life expectancy is 78.9 years for men
and 83.2 years for women (10). Located between 618 and
648 north of the equator, the people in Vasterbotten
County experience long dark winters with snow and this
influences how people commute and spend their leisure
time during winter months.
The VIP was continuously improved during the first 5
years and underwent implementation in the entire county
in 1990. Each year, all individuals who turn 30, 40, 50, or
60 years old are invited to their local primary health care
centre for a health survey and examination. This study is
limited to participants who provided data during the
survey years of 1990�2007; that is, 18 cross-sectional
surveys. In the cross-sectional analysis, participants aged
30 years were excluded since they were not invited after
1995. The 104,147 individuals who participated in VIP
during 1990�2007 represented 60% of the total popula-
tion aged 40, 50, and 60 who were registered in Vaster-
botten County during the same period. The annual
survey participation rates varied from 53 to 67%. A total
of 102,205 individuals with complete information (98% of
all participating individuals) on physical activity and
educational level were included in this study. Approxi-
mately 34, 36, and 30% of the respondents were 40, 50,
and 60 years old at baseline. About half of the VIP
respondents had a medium educational level (48%), while
26% had basic education. The percentage of individuals
with basic education decreased from 37% during 1990�1995 to 18% during 2002�2007. Levels of education were
higher and increased more among women (35% of
women had high education in 2002�2007 as compared
to 25% of men).
A total of 26,382 individuals aged 30, 40, or 50 at
baseline (1990�1997) also participated in a 10-year
follow-up survey when they turned 40, 50, or 60 during
2000�2007 (11). The overall annual participation rate in
a 10-year follow-up survey was 63%�72% during 2000�2005 and has been 75%�79% thereafter. After exclusion
of participants who were not followed-up due to death,
migration out of the region, or other reasons, the
participation rate in the follow-up survey during 2000�2007 was 76%. Comparison of the baseline socio-
demographic indicators between those who participated
in the follow-up survey and those who did not showed
small differences in age and education levels between the
participants and non-participants. There were slightly
more people aged 30 and those with high education who
did not participate in the follow-up surveys.
MeasurementsThe VIP participants completed a health questionnaire
that included socio-demographic and psychosocial con-
ditions, self-reported health, self-reported quality of life,
social support, working condition, history of chronic
disease, and assessment of chronic disease risk factors
such as tobacco use, physical activity, and measured body
mass index. A blood sample was drawn after an overnight
fast. Results of the questionnaire and blood examination
N. Ng et al.
2(page number not for citation purpose)
Citation: Global Health Action 2011, 4: 6347 - DOI: 10.3402/gha.v4i0.6347

were provided to the participants at the time of the
survey. Detailed descriptions of the background, design,
and methods of VIP are described elsewhere (11, 12). In
this study, we used the information on physical activity
and educational levels.
The highest completed level of education was used to
assess participant educational level. Participants who
completed only elementary and the comprehensive com-
pulsory 9-year school were categorised as having basic
education. Graduates from a residential college for adult
education or high school were categorised as having
medium education. Graduates from college or higher
level of education were categorised as having high
education.
The questionnaire section on physical activity assesses
physical activities on commuting, recreational time, and
physical exercise. The following questions are asked:
How do you usually travel to and from work each of
the four seasons? And what is the distance to your
work?
How often do you participate in recreational
activities that require some physical effort?
Two activities were asked about, i.e. walking and
bicycling.
How often have you worked out or exercised in your
training clothes during the last 3 months with the
purpose of improving your physical condition and/
or your well-being?
We only assessed mode of travel to work during winter,
because we think that people who walk or use their
bicycle to travel to work during the snowy and icy winter
will also probably do that the rest of the year. The
information about distance to work was used only if the
respondent walked or cycled to their work. Responses
from these three questions were combined and used to
categorise the respondents as sedentary, moderately
active, or physically active (Table 1).
Statistical analysesThe age-adjusted prevalences of physical activity levels
were analysed for each sex and educational level. The
population trends in physical activity level were presented
using the 18 years of cross-sectional data. Simple linear
regression analysis using the prevalence of physical
activity level (dependent variable) over the year (inde-
pendent variable) was done to estimate the annual change
in the prevalence. The regression coefficient represents
the change in prevalence over one year. As the survey
invites people aged 40, 50, and 60 years every year, no age
adjustment was conducted in comparing the physical
activity levels across time. Physical activity levels at
baseline and 10-year follow-up for men and women in
each educational group were compared using the panel
data. As the sample size was large, a p-value of B0.01
was required for statistical significance. Data analyses
were performed using STATA Version 11 (STATA
Corporation, Texas).
Ethical considerationThe regional Research Ethics Board in Umea approved
this study. Individuals provided consent prior to each
health survey.
Table 1. Definitions of physical activity levels
Questions on physical activity
Levels of physical
activities Mode of travel to and from work (Q1) Recreational activity (Q2) Physical exercise (Q3)
Sedentary By bus or car during winter OR cycled or
walked less than 2 km each way during
winter
OR Walked or cycled less than
3�4 times per month
OR Never exercised during the last
3 months
Moderately active Cycled or walked at 2�5 km each way
during winter
OR Walked or cycled at least 2
times per week
OR Exercised, but not regularly,
during the last 3 months
Physically active Cycled or walked at least 5 km each way
during winter
OR Walked or cycled every day OR Exercised at least 2�3 times per
week during the last 3 months
Note: The following three questions were used in the questionnaire:
(Q1). ‘How do you usually travel to and from work each of the four seasons? And what is the distance to your work?’
(Q2). ‘How often do you participate in recreational activities that require some physical effort?’ Two activities were asked about, i.e.
walking and bicycling.
(Q3). ‘How often have you worked out or exercised in your training clothes during the last 3 months with the purpose of improving your
physical condition and/or your well-being?’
We assumed that people who commute by walking or biking during winter with its cold, ice, and snow also do that the rest of the year.
Physical activity patterns in Sweden
Citation: Global Health Action 2011, 4: 6347 - DOI: 10.3402/gha.v4i0.6347 3(page number not for citation purpose)

Results
Trends of physical activity in cross-sectional dataIn general, the population became more physically active
during the study period. Prevalences of physically active
behaviour increased from 16 to 24.2% in men and 12.6 to
30.4% in women between 1990 and 2007. Fig. 1 presents
detailed descriptions of the observed annual trends across
educational groups. The proportion of physically active
people increased in all educational groups, although this
was most obvious among the high educational group,
especially after 1999.
During 1990�2007, the prevalences of physically active
behaviour were consistently higher in men and women
with high education compared to those with basic
education (Table 2). During 2002�2007, only 16.6% of
men and 18.7% of women with basic education were
physically active, as compared to 32.6% of men and 32%
of women with high education. Increases in the preva-
lence of physically active behaviour were observed in all
educational groups and more marked among women and
those with high education. The gaps between educational
groups have consequently widened in recent years. The
prevalence increased from 12.9 to 32% among women
with high education as compared to 11.7 to 18.7% among
women with basic education. During the same period, the
prevalence of physically active behaviour increased by 123
and 148% in women with medium and high education,
respectively. The increases in the prevalence of physically
active behaviour were observed in parallel with a
decreased prevalence of moderate activity and a stable
prevalence of sedentary behaviour (Table 2).
Sedentary behaviour was more prevalent among men
in all educational groups compared to women, but this
was most marked among those with basic education.
During 1990�2007, the gender gap in prevalence of
sedentary behaviour was four percentage points in the
highly educated group compared to 12 percentage points
among those with basic education (Table 2). During the
18 years of observation, prevalence of sedentary beha-
viour was stable and the small decreases among people
with medium and high education were not statistically
significant. There was an increase in sedentary behaviour
among men with basic and medium educations, though
the prevalence was statistically significant only among
men with basic education (Table 2).
Changes in physical activity behaviour betweenbaseline and follow-upFig. 2 shows changes in physical activity patterns between
baseline and 10-year follow-up. The proportions of those
physically active increased from 16 to 21% among men
and 13 to 23% among women. The proportion of
sedentary behaviour changed marginally from 23 to
21% in men and 13 to 11% in women. Prevalences of
sedentary behaviour decreased in all age cohorts and
educational groups except among the 30-year cohort of
men with medium and high education. An increase in the
prevalence of sedentary behaviour was observed in this
group (Fig. 3). Similar to the cross-sectional data and
irrespective of the reduction of sedentary behaviours, the
panel data reveal that sedentary behaviours were more
prevalent in all age groups among men with lower
educational level compared to higher. The differences
between educational groups were small among women in
all ages as shown in Fig. 3.
When the participants were grouped by physical activity
patterns at baseline and follow-up, 10.2% of men and 3.8%
of women remained sedentary after 10 years. Change in
activity from moderately active to sedentary over 10 years
was 10.1% among men and 6.4% among women. The 10-
year change from moderately active to physically active
was most pronounced among women (11.5% in men vs.
15.9% in women) (Table 3).
Discussions
Growing proportion of physically active behaviourand stagnant level of sedentary behaviourDuring the 18-year study period, the population of
Vasterbotten County became more physically active.
Our findings align with the Swedish national patterns
of physical activity. There has been a trend of increased
physical activity among Swedish adults during the last
two decades (13). In the 1980s, 47% of men and 43% of
women aged 16�74 years reported being physically active
on a regular basis during leisure time. These proportion
increased to 58% among men and 60% among women in
2002 (14). Another important finding is the overall
persistent level of prevalence of sedentary behaviours,
particularly among men and those with basic education.
While people who were moderately active become more
active, the sedentary group remained sedentary. At the
national level, physically inactive behaviours decreased
slowly from 14% among men and women in the 1980s to
12% among men and 10% among women in 2002 (14).
The sex difference in prevalence of sedentary behaviour
was much larger in our study compared to the 2002
national report.
Widening social gaps in physical activity over timeThere was a gradient of physical activity levels across
educational groups and the gaps widened during the 18-
year study. People with high education were more physi-
cally active and became more active than those with basic
education. The widening gap was mainly due to a stable
level of sedentary behaviour and sedentary behaviour
increased among men with basic education. These data
confirm the 2006 Swedish National Health Institute report
that showed socio-demographic differences in physical
N. Ng et al.
4(page number not for citation purpose)
Citation: Global Health Action 2011, 4: 6347 - DOI: 10.3402/gha.v4i0.6347

Fig. 1. Physical activity level trends in Northern Sweden from 1990 to 2007 among men and women and by educational levels. Cross-sectional data from the Vasterbotten
Intervention Programme.
Physic
alactivity
patte
rns
inS
wed
en
Cita
tion:
Glo
balH
ealth
Actio
n2011,
4:
6347
-D
OI:
10.3
402/g
ha.v4
i0.6
347
5(p
ag
en
um
ber
no
tfo
rcita
tion
pu
rpo
se)

activity levels by occupation and educational levels. Most
of the physically inactive were blue collar workers and
people with basic education (14). Similar social gaps were
also observed in obesity levels (15) and diabetes mellitus
prevalence (16) in this population in northern Sweden. The
widening gaps in levels of chronic diseases risk factors
between social groups points out the important challenges
in ensuring good health for the entire Swedish population.
Public health implicationsPhysical inactivity is a well-established causal factor in
the development of many chronic diseases and is
associated with reduced quality of life and increased
mortality (3, 5, 17�20). The greatest improvements in
health are seen among those who change from sedentary
to even a low level of physical activity (21, 22). However,
it is difficult to motivate people with sedentary lifestyles
to adopt more physically active behaviours. The level of
sedentary behaviour in our study population (cross-
sectional data) did not change significantly during
the study period. The panel data was contrary and
showed a decreasing level of sedentary behaviour except
among 30-year-old men with medium education. Beha-
vioural modification is often difficult to achieve,
particularly among those who lack motivation to change.
Further studies using qualitative approaches should
be conducted to increase our understanding of how
people think about engaging in physical activity. Preven-
tion efforts aimed at increasing physical activity should
be a priority task for policy makers at all societal levels
and should focus on those who are sedentary (1).
In industrialised countries such as Sweden, leisure time
activities and modes of travel play important roles in
influencing overall physical activity levels in the popula-
tion. With its widespread geographical area and harsh long
winters, many in the Vasterbotten population commute by
car or public buses. Public transportation is not developed
to reach remote areas in the county and therefore
commuting with cars is common (23). Those who work
farther from home are more likely to commute by car. In
Table 2. Prevalence of physical activity levels among men and women by year and education, adjusted for age
Levels of education
Basic education Medium education High education
Time period Men Women Men Women Men Women
Sedentary (%)
1990�1995 26.4 14.9 22.2 12.6 13.8 10.5
1996�2001 28.1 15.7 24.4 14.1 14.9 11.6
2002�2007 28.4 13.9 23.1 11.8 12.6 8.4
1990�2007 27.3 15.2 23.4 12.7 13.7 9.8
Annual percentage changes (p-value) 0.30
(p�0.02)
�0.02
(p�0.85)
0.16
(p�0.14)
�0.08
(p�0.34)
�0.03
(p�0.78)
�0.15
(p�0.06)
Cumulative percentage changes, 1990�2007 (%) 7.6 �6.7 4.1 �6.3 �8.7 �20.0
Moderate activity (%)
1990�1995 62.0 73.2 64.4 76.4 67.5 76.7
1996�2001 60.8 73.7 62.7 74.7 64.2 73.2
2002�2007 55.1 67.3 55.2 63.2 54.7 59.4
1990�2007 59.9 72.3 59.8 70.3 60.8 67.7
Annual percentage changes (p-value) �0.64
(pB0.001)
�0.56
(pB0.001)
�0.79
(pB0.001)
�1.03
(pB0.001)
�1.06
(pB0.001)
�1.40
(pB0.001)
Cumulative percentage changes, 1990�2007 (%) �11.1 �8.1 �14.3 �17.3 �19.0 �22.6
Physically active (%)
1990�1995 11.5 11.7 13.4 11.1 18.8 12.9
1996�2001 11.0 10.1 12.9 11.2 20.9 15.2
2002�2007 16.6 18.7 21.5 24.8 32.6 32.0
1990�2007 12.8 12.4 16.7 17.0 25.5 22.5
Annual percentage changes (p-value) 0.36
(p�0.02)
0.60
(p�0.005)
0.62
(pB0.001)
1.09
(pB0.001)
1.07
(pB0.001)
1.53
(pB0.001)
Cumulative percentage changes, 1990�2007 (%) 44.3 59.8 60.4 123.4 73.4 148.1
N. Ng et al.
6(page number not for citation purpose)
Citation: Global Health Action 2011, 4: 6347 - DOI: 10.3402/gha.v4i0.6347

contrast, people who work closer to home usually travel
short distances by cycling or walking to work. Wennberg
and colleagues reported that Vasterbotten residents who
regularly commute to work by car had an increased risk of
myocardial infarction compared to those who rode the bus,
bicycled, or walked (24). Most individuals with high
education live in the Umea municipality, which is the
county centre of education and business. This municipality
has a well-developed infrastructure of biking and walking
lanes that provides safer and more convenient transporta-
tion and thus allows for more physical activity. Even
during winter, many people bike or walk to work.
The VIP provides health counselling for participants
including counselling on the importance of leading a
physically active life. In recent years, a prescription of
physical activity by physicians, physiotherapists, and
nurses was introduced as a method to implement
recommendations for increasing physical activity. Recent
reports show that it is possible to incorporate the habit of
physical activity prescription into routine primary care
and leads to an increased physical activity level in the
population (25). The panel data in our study show
decreasing sedentary behaviour at 10-year follow-up.
This might be a result of the advice given at the first
VIP examination. Similar to trends in BMI development
where an increasing trend of weight stability was
demonstrated in a longitudinal analysis (26) before the
slowing of the BMI increase was seen around 2000 in the
cross-sectional analysis (15). It is possible that a cohort
effect of decreasing sedentary behaviours is not yet
apparent in the cross-sectional prevalences. The increas-
ing trends of physically active behaviour and decreasing
sedentary behaviour in the longitudinal analysis might be
part of the explanation for this slowing of the obesity
epidemic in northern Sweden. Our panel data are based
on 1990�1997 VIP participants. During these years,
results were provided to the participant by more direct
counselling and based on a risk factor profile focused on
biomedical measurements. Since 1990, all VIP nurses are
trained in motivational interviewing in order to enable
reinforcement of lifestyle changes that are aligned to
individual preferences and possibilities. This allows the
focus to be shifted towards lifestyle modification (11).
Future studies need to assess whether this increases
motivation to reduce sedentary behaviours.
Strengths and limitations of the studyThis study has strengths of being long-standing, targeting
the whole middle-aged population, and integrating into
ordinary health care activities thus allowing evaluation of
a large longitudinal population database. The study also
has reasonable participation rates (about 70%) with
minimal differences between participants and non-parti-
cipants in both the cross-sectional (27) and longitudinal
analyses. This rate is much higher than any other
questionnaire survey in Sweden with current rates of
about 40%. Our physical activity variable was created to
capture both commuting activity and moderate and high
intensity leisure time physical activity. The same ques-
tions have been used since the inception of VIP, allowing
comparison of results over time, and contributes reliable
data on population trends of physical activity.
However, the questionnaire did not assess physical
activity during working hours and this might be a source
of bias for those with manual occupations. We also did
not attempt to quantify the distance people travelled on
foot or on bike in their recreational time. Nor did we try
to measure hours people spent on physical exercise. In
addition, these self-reported questions on physical activ-
ity were not complemented with objective measures of
physical activity. In this study, we observed a gradient of
higher levels of biological risk factors (such as blood
glucose, cholesterol, and systolic blood pressure) among
those who are sedentary compared to those with higher
levels of physical activity. For these reasons, we are
confident that the physical activity measurement is valid.
Fig. 2. Ten-year changes in prevalence of sedentary behaviour at the individual level by sex and education. Cohort data from the
Vasterbotten Intervention Programme.
Physical activity patterns in Sweden
Citation: Global Health Action 2011, 4: 6347 - DOI: 10.3402/gha.v4i0.6347 7(page number not for citation purpose)

Fig. 3. Ten-year changes in prevalence of sedentary behaviour at the individual level by sex and education. Cohort data from the Vasterbotten Intervention Programme.
N.
Ng
et
al.
8(pag
en
um
ber
no
tfo
rcita
tion
pu
rpo
se)
Cita
tion:
Glo
balH
ealth
Actio
n2011,
4:
6347
-D
OI:
10.3
402/g
ha.v4
i0.6
347

ConclusionDespite the promising evidence of increasing physical
activity levels among the population in Vasterbotten
County, challenges remain for how to reduce the stable
levels of sedentary behaviours in some subgroups as well
as the increasing social gap between educational groups
with regard to physical activity. A better understanding
of how to motivate physically active behaviours �particularly among the sedentary population � will allow
better formulation of targeted public health interventions.
Acknowledgements
This research was supported by the Umea Centre for Global Health
Research with support from FAS, the Swedish Council for Working
Life and Social Research (grant no. 2006-1512). The research is
included in the Ageing and Living Conditions Programme, Centre
for Population Studies, Umea University, funded by the Swedish
Research Council’s ‘Linnestod,’ no 2006-21576-36119-66.
Conflict of interest and fundingThe authors have declare no conflict of interest
References
1. World Health Organisation. Global recommendations on phy-
sical activity for health. Geneva: World Health Organisation;
2010.
2. US Department of Health and Human Services. 2008 physical
activity guidelines for Americans. Washington: US Department
of Health and Human Services; 2008.
3. Hillman CH, Erickson KI, Kramer AF. Be smart, exercise your
heart: exercise effects on brain and cognition. Nat Rev Neurosci
2008; 9: 58�65.
4. Haskell WL, Lee IM, Pate RR, Powell KE, Blair SN, Franklin
BA, et al. Physical activity and public health: updated recom-
mendation for adults from the American College of Sports
Medicine and the American Heart Association. Med Sci Sports
Exerc 2007; 39: 1423�34.
5. World Health Organisation Regional Office for Europe. A
European framework to promote physical activity for health.
Copenhagen: World Health Organisation Regional Office for
Europe; 2007.
6. World Health Organisation Regional Office for Europe. Physical
activity and health in Europe: evidence for action. Copenhagen:
World Health Organisation Regional Office for Europe; 2006.
7. World Health Organisation. Report of the workshop on
integration of data on physical activity patterns. Geneva: World
Health Organisation; 2010.
8. European Commission. Special Eurobarometer � health and
food. Brussels: European Commission; 2006.
9. World Health Organisation. MONICA monograph and multi-
media sourcebook. Geneva: World Health Organisation; 2005.
10. County Administrative Board of Vasterbotten. Facts about
Vasterbotten. Lulea: Pantzare Information AB; 2010. Available
from: http://helsinkidesignlab.org/files/601/original.pdf [cited 3
May 2011].
11. Norberg M, Wall S, Boman K, Weinehall L. The Vasterbotten
Intervention Programme: background, design and implications.
Global Health Action 2010; 3. DOI: 10.3402/gha.v3i0.4643.
12. Vasterbotten Intervention Programme. Manual of Vasterbotten
intervention programme. Umea: Vasterbotten County Council;
2004.
13. Persson G, Danielsson M, Rosen M. Alexanderson K, Lund-
berg O, Lundgren B, et al. Health in Sweden: the national public
health report 2005. Scand J Public Health Suppl 2006; 67: 3�10.
14. Bostrom G. Chapter 9: habits of life and health. Scand J Public
Health Suppl 2006; 67: 199�228.
15. Norberg M, Lindvall K, Stenlund H, Lindahl B. The obesity
epidemic slows among the middle-aged population in Sweden
while the socioeconomic gap widens. Global Health Action
2010; 3. DOI: 10.3402/gha.v3i0.5149.
16. Lindahl B, Stenlund H, Norberg M. Increasing glucose
concentrations and prevalence of diabetes mellitus in northern
Sweden, 1990�2007. Global Health Action 2010; 3. DOI:
10.3402/gha.v3i0.5222.
17. World Health Organisation. Global strategy on diet, physical
activity and health. Geneva: World Health Organization; 2004.
18. World Health Organisation. Preventing chronic diseases � a vital
investment. Geneva: World Health Organisation; 2005.
19. US Department of Health and Health Services and Centers for
Disease Control. Physical activity and health: a report of the
Surgeon General. Washington, DC: US Department of Health
and Health Services and Centers for Disease Control; 1996.
20. Pate RR, Pratt M, Blair SN, Haskell WL, Macera CA,
Bouchard C, et al. Physical activity and public health. A
recommendation from the Centers for Disease Control and
Prevention and the American College of Sports Medicine.
JAMA 1995; 273: 402�7.
21. Franks PW, Ekelund U, Brage S, Wong MY, Wareham NJ. Does
the association of habitual physical activity with the metabolic
syndrome differ by level of cardiorespiratory fitness? Diabetes
Care 2004; 27: 1187�93.
22. Warburton DE, Nicol CW, Bredin SS. Health benefits of
physical activity: the evidence. CMAJ 2006; 174: 801�9.
23. Vasterbotten County Council. Fact about Vasterbotten, 2008.
Umea: Vasterbotten County Council; 2008.
24. Wennberg P, Lindahl B, Hallmans G, Messner T, Weinehall L,
Johansson L, et al. The effects of commuting activity and
occupational and leisure time physical activity on risk of
myocardial infarction. Eur J Cardiovasc Prev Rehabil 2006;
13: 924�30.
Table 3. Age-adjusted proportion of physical activity pat-
terns at baseline and 10-year follow-up among men and
women (N�26,382)
Baseline 10-year follow-up
Sedentary Moderate
activity
Physically
active
Men (%)
Sedentary 10.2 11.3 1.8
Moderate activity 10.1 39.4 11.5
Physically active 1.1 6.6 8.1
Women (%)
Sedentary 3.8 8.0 1.4
Moderate activity 6.4 51.8 15.9
Physically active 0.6 6.0 6.1
Note: Numbers represent percentage within each sex group.
Physical activity patterns in Sweden
Citation: Global Health Action 2011, 4: 6347 - DOI: 10.3402/gha.v4i0.6347 9(page number not for citation purpose)

25. Kallings LV, Leijon M, Hellenius ML, Stahle A. Physical
activity on prescription in primary health care: a follow-up of
physical activity level and quality of life. Scand J Med Sci Sports
2008; 18: 154�61.
26. Nafziger AN, Lindvall K, Norberg M, Stenlund H, Wall S,
Jenkins PL, et al. Who is maintaining weight in a middle-aged
population in Sweden? A longitudinal analysis over 10 years.
BMC Public Health 2007; 7: 108.
27. Weinehall L, Hallgren CG, Westman G, Janlert U, Wall S.
Reduction of selection bias in primary prevention of cardio-
vascular disease through involvement of primary health care.
Scand J Prim Health Care 1998; 16: 171�6.
*Nawi NgDepartment of Public Health and Clinical MedicineDivision of Epidemiology and Global HealthUmea UniversitySE-901 87 Umea, SwedenEmail: [email protected]
N. Ng et al.
10(page number not for citation purpose)
Citation: Global Health Action 2011, 4: 6347 - DOI: 10.3402/gha.v4i0.6347