Increased sow nutrition during midgestation affects muscle fiber development and meat quality, with...
40
A. Cerisuelo, M. D. Baucells, J. Gasa, J. Coma, D. Carrión, N. Chapinal and R. Sala meat quality with no consequences on growth performance Increased sow nutrition during mid-gestation affects muscle fiber development and published online Oct 24, 2008; J Anim Sci http://jas.fass.org located on the World Wide Web at: The online version of this article, along with updated information and services, is www.asas.org by on May 11, 2011. jas.fass.org Downloaded from
-
Upload
independent -
Category
Documents
-
view
2 -
download
0
Transcript of Increased sow nutrition during midgestation affects muscle fiber development and meat quality, with...
A. Cerisuelo, M. D. Baucells, J. Gasa, J. Coma, D. Carrión, N. Chapinal and R. Sala
meat quality with no consequences on growth performanceIncreased sow nutrition during mid-gestation affects muscle fiber development and
published online Oct 24, 2008; J Anim Sci
http://jas.fass.orglocated on the World Wide Web at:
The online version of this article, along with updated information and services, is
www.asas.org
by on May 11, 2011. jas.fass.orgDownloaded from
1
Running head: Maternal nutrition and fetal development 1
2
Title: Increased sow nutrition during mid-gestation affects muscle fiber 3
development and meat quality with no consequences on growth performance1. 4
Names: A. Cerisuelo*, M. D. Baucells
*, J. Gasa
*,
J. Coma†, D. Carrión
‡, N. 5
Chapinal*and R. Sala
*2 6
* Animal Nutrition, Management and Welfare Research Group, Universitat Autònoma 7
de Barcelona, 08193 Bellaterra, Spain. 8
† Vall Companys Group, 25191 Lleida, Spain 9
‡Pig Improvement Company, S.A., 08190 Sant Cugat del Vallès, Spain 10
11
12
1The authors gratefully acknowledge the help and very useful comments and also 13
technical assistance of Dr. Marta Gil (IRTA, Monells, Spain) and Dr. Charlotte Rehfeldt 14
(FBN, Dummerstorf, Germany). Appreciation is also expressed to the Generalitat de 15
Catalunya for the financial support. 16
2Corresponding author: [email protected] 17
R. Sala, Universitat Autònoma de Barcelona, 08193 Bellaterra, Spain (tel.: +34 93 581 18
18 97; fax: +34 93 581 14 94) 19
20
21
22
23
24
25
Page 1 of 39 Journal of Animal Science
Published Online First on October 24, 2008 as doi:10.2527/jas.2007-0677 by on May 11, 2011. jas.fass.orgDownloaded from
2
ABSTRACT: Pregnant sow nutrition has potential effects on the progeny muscle fibers 26
development in utero. A total of 199 Landrace x Large White sows from parities 0 to 6 27
and their offspring were used to evaluate the effects of increasing feeding level during 28
mid-pregnancy on muscle tissue, growth performance and meat quality of the progeny. 29
The experiment was divided into 2 study replicates and in each replicate sows were 30
assigned to 1 of the 2 treatments: 1) control group (C-sows) was fed 2.5 to 3.0 kg/d 31
(feed: 12.1 MJ ME/kg and 0.62 % lysine) throughout gestation; 2) high group (H-sows) 32
received an extra feed allowance of 1.5 kg/d for gilts and 2.0 kg/d for multiparous sows 33
above the C level from d 45 to 85 of gestation (period of secondary muscle fibers 34
formation). Sow backfat was recorded on d 40 and 85 of gestation. Sow performance 35
(litter size and piglet weight) at farrowing and on d 18 of lactation was measured. At 36
weaning, pigs were divided into 5 weight groups/treatment and progeny growth 37
performance was measured during the nursery (n = 958) and the growing-finishing (n = 38
636) periods. At slaughter, carcass and meat quality traits (lean content, main cut 39
weight, pH, Minolta color and drip loss) were recorded from the second lightest group 40
at weaning (weight group 4; n = 90) and samples from the Longissimus thoracis muscle 41
were taken to study muscle fiber characteristics (n = 70). Extra nutrition from d 45 to d 42
85 of gestation did not lead to differences in litter size nor in piglet weight at farrowing 43
and on d 18 of lactation. Pigs born from H mothers had fewer muscle fibers and fewer 44
estimated primary and secondary fibers than in C pigs (P < 0.05). However, postnatal 45
growth performance was not consistently affected by the maternal treatment. Fewer 46
muscle fibers found in the H group of pigs was associated with a fewer type IIB fibers 47
(P < 0.05) with greater cross-sectional areas (P < 0.10), which might be connected with 48
the significantly higher meat pH at 24 h postmortem and the lower L* values recorded 49
in the H group of pigs. Results from the present study confirm the existence of effects of 50
Page 2 of 39Journal of Animal Science
by on May 11, 2011. jas.fass.orgDownloaded from

3
maternal nutrition on fetal development at least in terms of muscle tissue development 51
and meat quality, although with no beneficial effects on the postnatal growth 52
performance of the progeny. 53
54
Key words: growth performance, meat quality, muscle fibers, pregnancy feeding, sow 55
56
57
58
59
60
61
62
63
64
65
66
67
68
69
70
71
72
73
74
75
Page 3 of 39 Journal of Animal Science
by on May 11, 2011. jas.fass.orgDownloaded from
4
INTRODUCTION 76
The knowledge of how maternal nutrition during pregnancy affects fetal growth and 77
muscle fiber development is of great interest to the pig industry. Positive effects on 78
number of muscle fibers and postnatal growth have been reported when extra feed was 79
provided to sows during primary (Pr) fibers formation (d 25 to 50 of gestation; Dwyer 80
et al., 1994; Gatford et al., 2003). However, in recent studies, feed supplementation 81
during this part of gestation has shown no clear or even disadvantageous effects on the 82
progeny (Nissen et al., 2003; Bee, 2004; Heyer et al., 2004). Nissen et al. (2003) 83
speculated that extra feeding from d 50 to 70 of gestation, covering the period of 84
secondary (Sc) muscle fibers formation, might overrule this disadvantage. In fact, Sc 85
muscle fibers are reported to be more susceptible to environmental factors such as 86
maternal nutrition than Pr (Wigmore and Stickland, 1983; Gatford et al., 2003). Effects 87
of maternal nutrition during this time window of gestation on fetal muscle fiber 88
development have been poorly documented. Also, there is lack of information about the 89
effects of this feeding strategy on carcass and meat quality traits. 90
91
Evidence exists suggesting that muscle growth processes might affect meat quality. 92
Total number of muscle fiber has been positively correlated to lean meat percentage 93
(Larzul et al., 1997). Also, based on their metabolic and contractile properties both 94
muscle fiber morphology and type may also influence postmortem metabolic changes in 95
the conversion of muscle to meat and, thereby, meat quality (Karlsson et al., 1999; 96
Franck et al., 2007). The relationship of fiber type composition to meat quality is not 97
fully established and validated in pigs (Lefaucheur, 2006) 98
99
Page 4 of 39Journal of Animal Science
by on May 11, 2011. jas.fass.orgDownloaded from
5
The present study assessed the implications of increased feed allowance to sows from d 100
45 to 85 of gestation on muscle fiber development and postnatal performance of the 101
progeny. Additionally, its effects on carcass and meat quality traits were studied. 102
103
MATERIALS AND METHODS 104
105
Animals and Treatments 106
107
The experimental protocols used in this study received previous approval from the 108
Animal Protocol Review Committee of the Universitat Autònoma de Barcelona (Spain). 109
Management, housing and husbandry conditions conformed to European Union 110
Guidelines. The study was performed in 2 study replicates (R) conducted under 111
identical conditions. A total of 199 Camborough PIC sows (Landrace x Large White; 112
L02*L03 PIC line, R1: 103; R2: 96) from parities 0 to 6 were allotted into 2 113
experimental groups at d 40 of pregnancy. Sows were blocked by parity, day of mating 114
and body reserves [backfat thickness (BF) and body condition score (BCS)], and 115
randomly assigned to 1 of 2 treatment groups (Control, C-sows or High, H-sows). Body 116
condition score was measured according to the 1 to 5 scale suggested by Close and Cole 117
(2003). Table 1 shows sow parity distribution across treatments. The boar line used for 118
mating was the White Duroc (Large White x Duroc; L-8 PIC line). The 2 groups of 119
sows differed in the feeding level that was allowed during mid-gestation of a standard 120
commercial sow feed (12.1 MJ ME/kg of feed, 14.6 % protein and 0.62 % lysine, Table 121
2). Control sows (R1: n = 49; R2: n = 46) were fed at a level of 2.5 to 3.0 kg/d 122
according to their BCS at mating, throughout gestation. High sows (R1: n = 54; R2: n = 123
50) received an extra allowance of the same feed of 1.5 kg/d for gilts (Parity 0) and 2.0 124
Page 5 of 39 Journal of Animal Science
by on May 11, 2011. jas.fass.orgDownloaded from

6
kg/d for multiparous sows above the C level from d 45 to 85 of gestation. During 125
gestation, sows were housed in individual stalls, fed twice daily (0800 and 1430) with 126
dry feed, and had free access to water. All sows were maintained under identical feeding 127
conditions from mating to d 45 of gestation and from d 85 of gestation to parturition. 128
129
Routine farm management procedures were followed in caring for the sow and litter 130
during parturition and lactation. Table 2 shows the lactation diet composition. Pigs were 131
counted and individually weighed at parturition and on d 18 ± 1 of lactation. Litter size 132
was adjusted 10 to 11 pigs per litter at 24 h post-farrowing. Because only the male pig 133
progeny was followed during the nursery and the growing-finishing periods, cross-134
fostering was only allowed for female piglets and between sows from the same 135
treatment. No creep feeding was provided to the piglets. Male piglets were castrated on 136
d 7 after birth. 137
138
After weaning at 3 wk of age, all pigs were phase-fed identically to exceed NRC 139
nutrient requirements for their specific weights until market weight (NRC, 1998, Table 140
2). The male progeny [(Landrace x Large white) x Duroc] of C and H sows were 141
followed during the nursery (n = 958; C: 476, H: 482) and growing-finishing periods (n 142
= 636 barrows; C: 318, H: 318). The nursery period lasted 6 wk and the growing-143
finishing phase lasted 13 (R1) and 16 (R2) wk. At the beginning of the nursery period, 144
pigs were classified according to body weight into 5 weight groups (G) per treatment 145
(G1, 8.8 ± 0.56 kg; G2, 7.8 ± 0.39 kg; G3, 7.0 ± 0.39 kg; G4, 6.3 ± 0.55 kg; and G5, 5.0 146
± 0.41 kg) and organized according to G and maternal treatment in 20 pens/R of 20 to 147
26 pigs/pen. Weight groups included representatives from several litters. Pigs were 148
maintained within the same G through the growing-finishing period until slaughter. In 149
Page 6 of 39Journal of Animal Science
by on May 11, 2011. jas.fass.orgDownloaded from
7
the growing-finishing period, pigs were allocated in 20 to 30 pens/R of 12 to 13 animals 150
each. 151
152
Sows and Pig Performance 153
154
At the beginning and end of the experimental period (on d 45 and d 85 of gestation), 155
ultrasonic BF was measured in sows at the P2 position (above the last rib at 156
approximately 6.0 to 6.5 cm from the midline) using an A-mode ultrasound device 157
(Renco sonograder 4.2, Renco Corporation, Minneapolis, MN). 158
159
For the postweaning growth performance study, pigs were weighed every wk in the 160
nursery and every 3 wk in the growing-finishing phase in order to calculate ADG by 161
pen. Average daily feed intake and G:F were obtained from all pens in the nursery 162
period and in G3 and G4 in the growing-finishing period. 163
164
Carcass and Meat Quality Measurements and Muscle Sample Collection 165
166
Carcass, meat quality and muscle fiber characteristics were studied at market weight in 167
pigs from G4 (carcass and meat quality: n = 90; muscle fibers study: n = 70). The 168
reason for selecting this weight group (G4) was that, although not significant, the 169
smallest weight groups (G4 and G5) showed the greatest growth performance between 170
treatments during the nursery period. Pigs from G5 were avoided because this group 171
might include runt or less healthy pigs. 172
173
Page 7 of 39 Journal of Animal Science
by on May 11, 2011. jas.fass.orgDownloaded from
8
Pigs from G4 were slaughtered at an average BW of 104.1 ± 1.16 kg in R1 and 120.9 ± 174
2.65 kg in R2. Carcass weight, percentage of lean meat content (Fat-O-Meat’er, SFK, 175
Denmark) and mid-line fat thickness at the gluteus medius level were measured 176
immediately after slaughter, before the chilling process. At 45 min post-mortem, pH 177
(pH45) was measured at the level of the last rib in the left Longissimus thoracis (LT) 178
and Semimembranosus (SM) muscles using a hand held Crison micropH 2001 meter 179
with a xerolite electrode. Left ham and loin were then removed from the carcass and 180
weighted; weight of the SM muscle also was recorded. Three consecutive cranial slices 181
of the LT muscle were taken from the last rib level. The first slice (from the last rib to 182
the interface between 12th
and 13th
ribs) was used to perform the meat quality 183
measurements (pH and meat color) and to obtain samples for histochemistry (addressed 184
below); the second slice was photographed in order to measure muscle cross-sectional 185
area using an image analysis system (Digital Image System, S.L., Spain), and the third 186
slice was taken in order to determine water holding capacity, measured as drip loss 187
percentage. 188
189
At 24 h post-mortem, meat reflectance (Minolta Chroma Meter CR300) and pH (pH24) 190
measurements were obtained. Meat color determinations were made in the transverse 191
cut of the LT muscle using the Comission Internationale de l’Eclairage (CIE, 1976) 192
values (L*: lightness, a*: redness and b*: yellowness). The instrument was calibrated 193
according to manufacturer instructions. The pH24 was measured in the SM muscle and at 194
the level of the last rib in the LT muscle. Drip loss was measured over 24 h on a 195
cylindrical sample of approximately 2.5 cm of diameter maintained at 4ºC using the 196
plastic tub method described by Rasmussen and Andersson (1996). 197
198
Page 8 of 39Journal of Animal Science
by on May 11, 2011. jas.fass.orgDownloaded from
9
In addition, in R2, one more 4 cm wide slice caudal to the last rib was obtained from the 199
LT muscle of each animal, frozen immediately at -20ºC and kept at this temperature 200
until performing the texture profile analysis test (TPA, Bourne, 1978). The TPA 201
analysis was performed using a TA-TX2 Texture Analyzer (State Micro System, 202
Survey, UK). Each slice of LT was thawed for 24 h at 4ºC and cooked in a gas oven. A 203
total of 6 to 8 sample cubes (1x1.5x1.5 cm3) per slice were used for the analysis. The 204
study of the curve force-time resulting led to the extraction of 6 textural parameters: 205
cohesiveness, adhesiveness (g/s), springiness, hardness (g), gumminess (g) and 206
chewiness (g). Mean values for each animal were obtained averaging all the samples per 207
animal (n = 6 to 8). 208
209
Histochemistry 210
211
Five cube shaped muscle samples (≈ 1cm3) evenly distributed over the cross-sectional 212
area of the portion of LT were taken according to Cerisuelo et al. (2007). The cubes 213
were cut parallel to the longitudinal myofiber axis, placed on a cork surface, embedded 214
in optimum control temperature embedding medium (OCT, TissueTeck®) and talcum 215
powder, snap frozen in liquid nitrogen, and stored in a -80ºC ultracold freezer until 216
histochemical analyses. 217
218
Transverse serial sections (10 µm) were cut in a cryostat (Leica CM 1900, Nussloch, 219
Germany) at -15ºC, placed on silane treated microscope slides and allowed to thaw and 220
dry at room temperature for 1-2 h. The sections were then stained for myosin adenosine 221
triphosphatase activity (mATP-ase) after alkaline (pH 10.3) and acid (pH 4.40 and pH 222
4.45) incubation, according to the method described by Latorre et al. (1993). This 223
3.5A
Page 9 of 39 Journal of Animal Science
by on May 11, 2011. jas.fass.orgDownloaded from
10
allowed classification of muscle fibers as type I, IIA and IIB depending on their pH 224
lability. Alkaline incubated sections were used to calculate the number and mean area of 225
fiber type I, IIA and IIB through a computer-assisted image analysis system (Digital 226
Image System, S.L., Spain). All measurements were made by the same person in order 227
to reduce any potential subjective variability to a minimum. For each sample (5 228
samples/animal), measurements were made on at least 300 fibers (at least 1500 229
fibers/animal). These data were then used to calculate the percentage of type I, IIA and 230
IIB fibers and mean area of each fiber type. Also, total number of fibers was estimated 231
as the number of fibers counted per animal (sum of the 5 samples) multiplied by the 232
muscle cross-sectional area (cm2), all divided by the sum of the areas of the fibers 233
counted per animal (cm2). 234
235
The number of developmental Pr and Sc fibers was estimated on the basis of the type I 236
clusters. Previous studies (Wigmore and Stickland, 1983) suggested that in the pig, one 237
of the central slow fibers in each cluster was a Pr myofiber, whereas all others 238
developed as Sc fibers. Therefore, it is possible to estimate the number of Pr and Sc 239
fibers formed prenatally through the number of type I clusters in the adult animal (= Pr) 240
and their subtraction from the estimated total number of fibers (= Sc). 241
242
Statistical Analyses 243
244
Data were analyzed using SAS System Software (SAS Inst. Inc., Cary, NC). In all 245
cases, gestation feeding level served as the treatment factor. Study R and the interaction 246
between maternal treatment and study R were tested for significance. As the interaction 247
between maternal treatment and study R was not significant (P > 0.10), R was included 248
Page 10 of 39Journal of Animal Science
by on May 11, 2011. jas.fass.orgDownloaded from
11
as a block factor in all analyses performed. In the post-weaning growth performance 249
analysis, G was considered a class factor, and the interaction between maternal 250
treatment and G was included in the statistical model. 251
252
In maternal data analyses, sow was considered the experimental unit. Backfat levels and 253
changes were analyzed using ANOVA (GLM procedure), in which backfat levels on d 254
45 were used as a covariate. Number of total born, born alive, stillborn and pigs on d 18 255
of lactation were analyzed through a statistical model for count data (GENMOD 256
procedure). Average piglet weights at birth and at d 18 of lactation were evaluated 257
through a one-way ANOVA (GLM procedure); litter size was used as a covariate term 258
for average piglet weight. For piglet weight on d 18 of lactation, piglet weight after 259
cross-fostering was used as a covariate. Intra-litter variation was tested through the CV 260
(%). 261
262
Pen was considered the experimental unit for post-weaning growth performance (ADG, 263
ADFI and G:F) whereas for carcass, meat quality and muscle fiber traits analysis the 264
experimental unit was the pig. Growth performance was analyzed through a two-way 265
ANOVA (GLM procedure). Differences in carcass, meat quality and muscle fiber 266
measurements were tested through a one-way ANOVA (GLM procedure). For muscle 267
fiber type analysis, when data were expressed as percentages, they were subjected to a 268
square-root arcsine transformation to achieve a normalized distribution before ANOVA. 269
Pearson correlation coefficients (CORR procedure) were calculated in order to examine 270
the relationships between diverse meat quality traits and muscle fiber characteristics. 271
272
Statistical significance level was α ≤ 0.05, and 0.05 > α < 0.10 was considered a trend. 273
Page 11 of 39 Journal of Animal Science
by on May 11, 2011. jas.fass.orgDownloaded from
12
274
RESULTS 275
276
Sows Performance 277
278
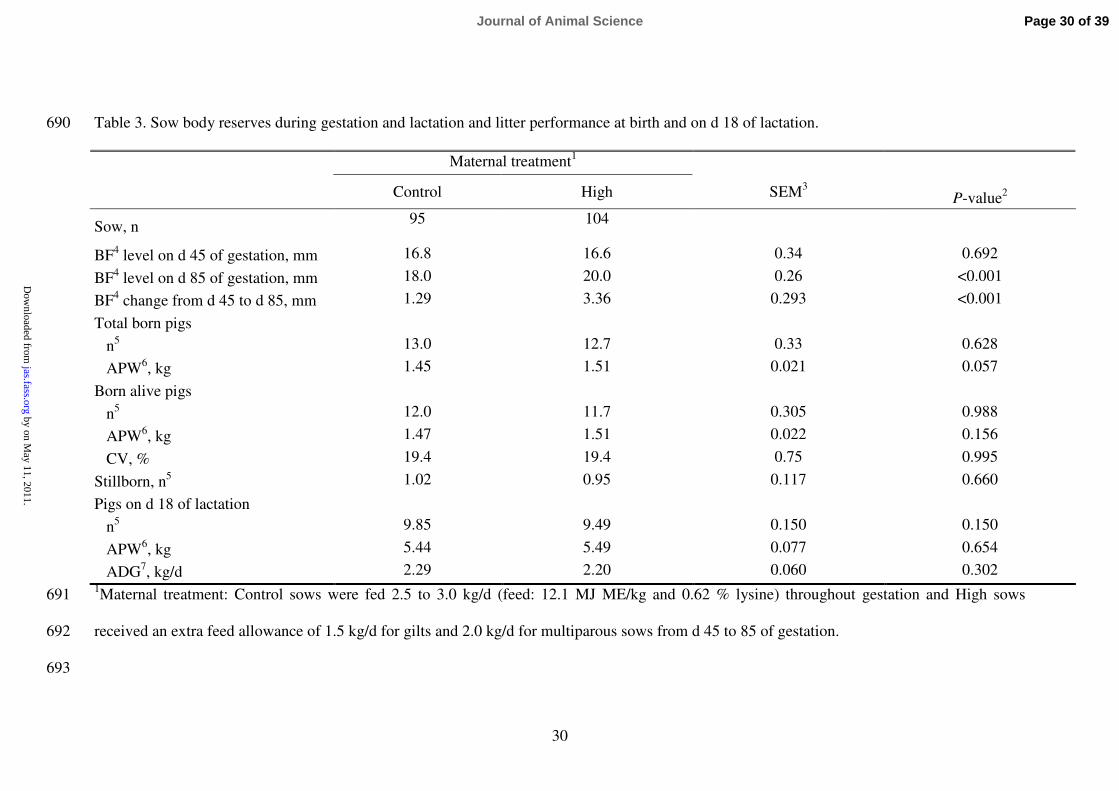
Sow productivity and body-reserve balances during gestation are recorded in Table 3. In 279
general, H sows gained more (P < 0.001) BF during the experimental period (from d 45 280
to 85 of gestation), leading to greater BF on d 85 of gestation compared with C sows (P 281
< 0.001). 282
283
No consistent differences were found in the number of pigs at birth (total, born alive 284
and stillborn) and on d 18 of lactation. The H group of sows showed a tendency to a 285
greater piglet weight of total born at birth (P = 0.057) which was not observed for pigs 286
born alive and pigs on d 18 of lactation. The intra-litter piglet weight variation (CV) at 287
birth and ADG of litters during lactation were neither different between treatments. 288
289
Postweaning Growth Performance 290
291
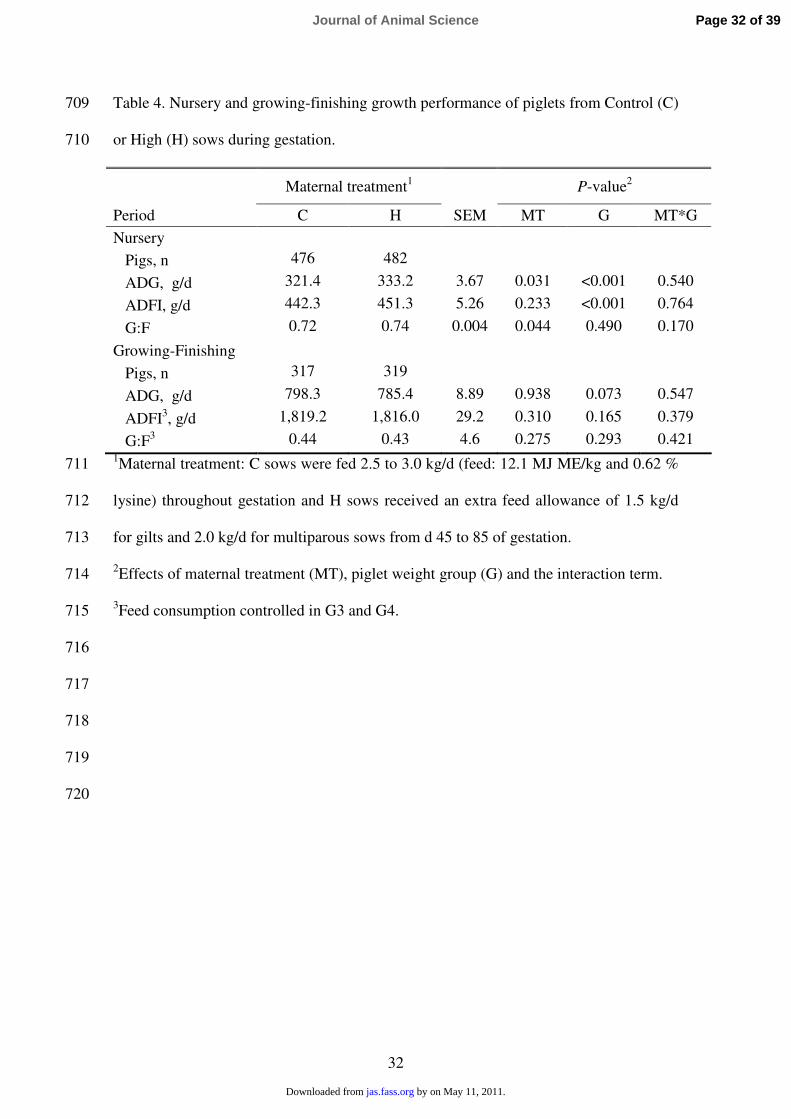
Growth performance throughout the nursery and growing-finishing periods is recorded 292
in Table 4. During the nursery period, pigs born from H sows showed higher ADG and 293
G:F than in pigs born from C sows (P < 0.05). However, these differences between 294
treatments disappeared in the growing-finishing phase. 295
296
During the nursery period, the G factor exerted a strong effect, regardless of the 297
treatment, on ADG rates and feed consumption (P < 0.001, Table 4). Initially, the 298
Page 12 of 39Journal of Animal Science
by on May 11, 2011. jas.fass.orgDownloaded from
13
heavier the pigs were (G1), the higher their growth and feed intake. In this regard, pigs 299
from G1 showed daily gains and daily intakes of 380 g/d and 520 g/d, while pigs from 300
G5 showed daily gains of 276 g/d and 375 g/d, respectively. However, no consistent 301
differences were found between G in G:F efficiency. In the growing-finishing phase, 302
differences in ADG between G were still evident but lower than in the nursery period (P 303
= 0.07). 304
305
The interaction term between maternal treatment and weight group was not significant 306
in any of the growth performance traits measured (P > 0.10). However, during the 307
nursery phase, a trend towards a higher benefit of the maternal feed supplementation in 308
pigs from the lightest G (G4 and G5) for G:F (P = 0.095, data not shown) was observed. 309
310
Carcass and Meat Quality 311
312
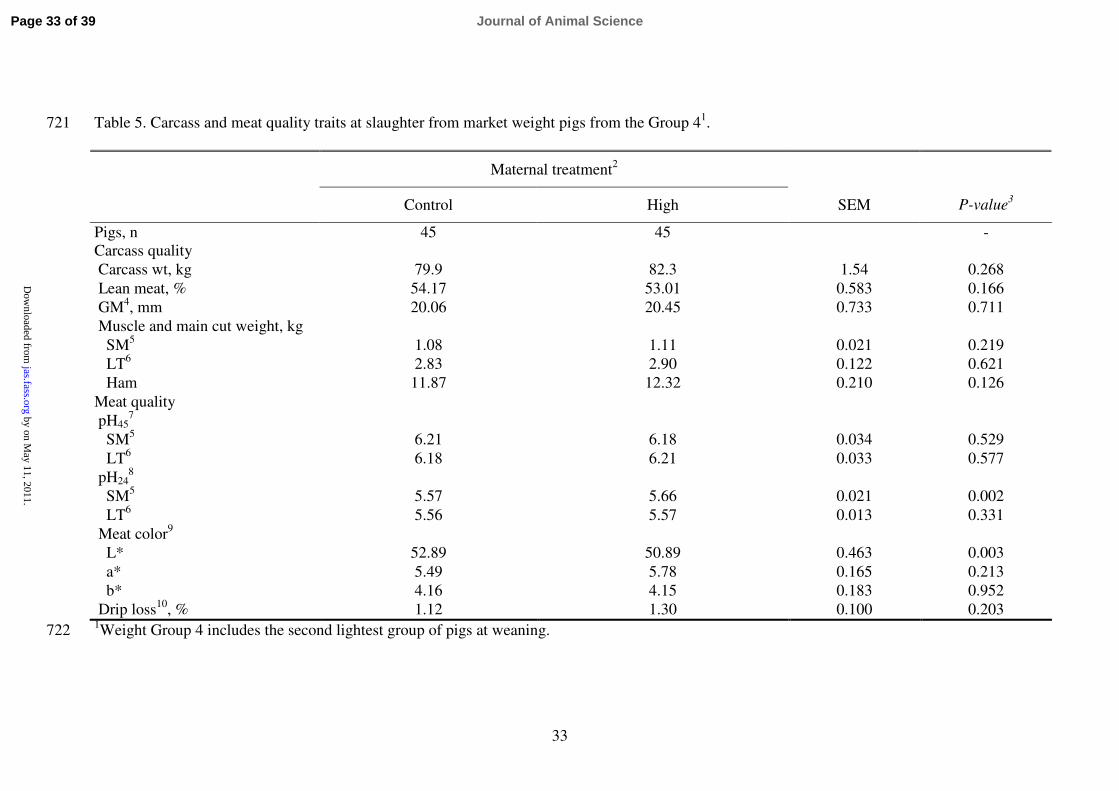
The most important carcass (weight, lean meat percentage and mid-line fat thickness at 313
gluteus medius) and meat quality traits (pH, color and water holding capacity) measured 314
from the selected pigs are summarized in Table 5. Increased maternal feed intake during 315
mid-pregnancy did not lead to differences in carcass weight, lean meat content, mid-line 316
fat thickness at the gluteus medius and main cut weight of the progeny. Regarding meat 317
quality traits, values of pH measured at 24 h post-mortem (pH24) and meat color traits 318
were influenced by the maternal treatment. Pigs from the H group showed significantly 319
higher pH24 levels (P < 0.01) in the SM muscle. In addition, H pigs showed lower 320
lightness (L*) values in the LT muscle (P < 0.01). No differences were found on water 321
holding capacity (drip loss values) between treatments. A correlation analysis of this 322
data showed that pH24 was negatively related to both L* (r = -0.41, P < 0.001) and drip 323
Page 13 of 39 Journal of Animal Science
by on May 11, 2011. jas.fass.orgDownloaded from
14
loss (r = -0.33, P = 0.003), and L* was positively associated with drip loss 324
measurements (r = 0.24, P = 0.030). 325
326
Results from the TPA performed in a cooked portion of the LT muscle showed no 327
differences between treatment groups in any of the instrumental texture variables 328
measured (Table 6). 329
330
Muscle Fiber Characteristics 331
332
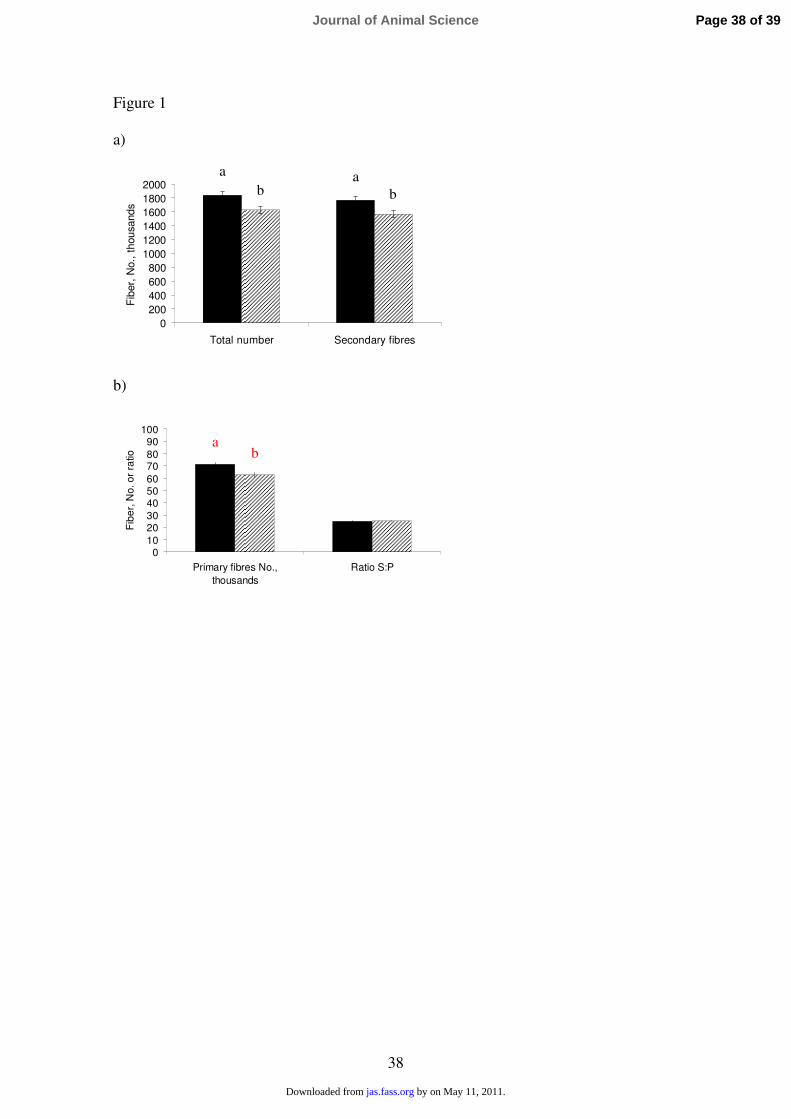
Estimated total number of muscle fibers and number of Pr and Sc fibers formed in the 333
prenatal period (estimated through the number of type I clusters) are recorded in Figure 334
1. Increased maternal feeding level during mid-pregnancy led to a lower total number of 335
muscle fibers in the LT muscle of the progeny compared with the C group of sows [C 336
(x103) = 1837.8 and H (x10
3) = 1627.9, P = 0.01]. Maternal supplemented pigs showed 337
fewer number of both, Pr and Sc fibers, than in pigs born from C sows (P < 0.01). This 338
led to a similar Sc to Pr fibers ratio (around 24-25 Sc fibers per Pr fiber) between 339
treatments. 340
341
Maternal treatment applied during mid-gestation (from d 45 to 85 of gestation, Table 7) 342
led to fewer estimated number of type IIB fibers (P < 0.01), not affecting the number of 343
type I and type IIA fibers. From the calculated proportions of each fiber type, pigs from 344
H sows had a lower percentage of type IIB fibers (P < 0.01) and a higher percentage of 345
type I and IIA fibers (P < 0.05) compared with those pigs from the C sows. 346
347
Page 14 of 39Journal of Animal Science
by on May 11, 2011. jas.fass.orgDownloaded from
15
Lower number of muscle fibers in the H pigs (Figure 1) was linked to a higher mean 348
cross-sectional area of those fibers (Table 7). Overall, mean cross-sectional area of 349
muscle fibers was higher (P < 0.05) in H pigs than in C. This difference between 350
treatments derived from the observed larger IIB fibers in the LT muscle of H pigs 351
(Table 7, P < 0.01). 352
353
DISCUSSION 354
355
Maternal Feeding Level and Sow Performance 356
357
All sows gained BF during the experimental period, but extra feed offered during mid-358
gestation led to higher BF gains in the H than in C sows (+ 2.1 mm, P < 0.01). 359
However, this feeding strategy did not significantly affect farrowing output and 360
performance during the suckling period. Consequently, no impact of maternal feed 361
supplementation on milk production was detected. Several studies have reported that in 362
well managed sows, birth weight is not generally affected by increasing sow feeding 363
levels (complete diet, energy + protein) in different stages of pregnancy, and even 364
during the last month of gestation when fetal requirements are the highest (Dwyer et al., 365
1994; Miller et al., 2000; Heyer et al., 2004). Supplementary feeding in these cases 366
increased maternal tissue accretion but did not affect the composition of the products of 367
conception (Speer, 1990; Miller et al., 2000). 368
369
Dwyer et al. (1994) reported that a consequence of increasing sow feed intake in 370
gestation would be a decrease in the distribution of piglet weights at birth within a litter. 371
The reason is that increasing feed allowance to the mother would increase fetal growth 372
Page 15 of 39 Journal of Animal Science
by on May 11, 2011. jas.fass.orgDownloaded from
16
and fiber numbers of the nutritionally disadvantaged pigs at birth, but not affecting the 373
largest pigs in the litter. This hypothesis could not be confirmed by the results on the 374
intra-litter CV obtained in the present study, since no differences between treatments 375
were obtained. 376
377
Maternal Feeding Level, Muscle Fiber Development and Post-weaning Performance 378
379
In mammals, muscle fiber hyperplasia is completed around birth and postnatal muscle 380
growth is hypertrophic (Swatlands and Cassens, 1973; Wigmore and Stickland, 1983). 381
Myogenesis in the pig is a biphasic phenomenon which consists on a sequential 382
formation of two fiber populations. Primary fibers develop from d 35 to 60 of gestation. 383
Secondary muscle fibers are formed thereafter (d 54 to 90-95 of gestation) using Pr 384
fibers as templates (Swatland and Cassens, 1973; Wigmore and Stickland, 1983). 385
Despite the hypothesis that increasing maternal feeding level during gestation has 386
positive effects on postnatal growth, its real effects remain controversial. Dwyer et al. 387
(1994) and Gatford et al. (2003) reported improvements in the number of Sc muscle 388
fibers when increasing maternal feed allowance from d 25 to 50 of gestation. 389
Additionally, positive effects were described in these studies on progeny growth rates 390
after 70 d of age (Dwyer et al., 1994) and until 27 d of age (Gatford et al., 2003). 391
However, other more recent studies have described no consistent effects and even 392
negative effects in some cases on muscle fiber number development (Nissen et al., 393
2003; Bee, 2004) and growth performance (Nissen et al., 2003; Heyer et al., 2004; 394
Musser et al., 2006; Lawlor et al., 2007) when increasing feed allowance during the 395
same period of gestation. Factors such as the time period and duration of treatment 396
during gestation, type and magnitude of nutrient changes involved, litter size and sow 397
Page 16 of 39Journal of Animal Science
by on May 11, 2011. jas.fass.orgDownloaded from
17
parity have been suggested as important factors causing variation between studies (Bee, 398
2004). 399
400
Most of the studies mentioned above involved the period prior to the Sc muscle fiber 401
formation (d 25 to 50 of gestation) or the entire myogenesis period (d 25 to 90 of 402
gestation) in their investigations. In the present research, increased feeding allowance 403
covered the period of the Sc muscle fibers formation and, contrary to what was 404
expected, led to a lower number of muscle fibers in the LT muscle of the progeny 405
compared with pigs born from C sows. This reduction in the number of fibers affected 406
both the Sc and Pr fiber populations. 407
408
In spite of the greater susceptibility of Sc fibers to variations in the uterine environment 409
(Wigmore and Stickland, 1983; Gatford et al., 2003), little evidence is provided in the 410
literature regarding the impact on fetal muscle tissue of maternal nutrition during the 411
time window studied in the present experiment. Dwyer et al. (1994) included this time 412
frame in their investigation and found not significant differences on the number of 413
fibers in the Semitendinosus muscle when feed supplementation was provided from d 50 414
to 80 of gestation compared with control [C (x103) = 371.0 and H (x10
3) = 360.4]. In a 415
more recent study (Hoshi et al., 2005), effects of ractopamine to pregnant sows from d 416
50 to d 80 of gestation resulted in a fewer calculated total number of muscle fibers in 417
the Semitendinosus muscle compared to control [C (x103) = 396.6 and H (x10
3) = 418
388.8]. Thus, giving an extra feed supplementation to sows involving the period of Sc 419
muscle fiber generation might be detrimental for muscle fiber hyperplasia of the fetus. 420
421
Page 17 of 39 Journal of Animal Science
by on May 11, 2011. jas.fass.orgDownloaded from
18
The diminution in muscle fiber number in the present study involved both Pr and Sc 422
developmental fiber populations. As Pr fibers constitute the framework for Sc fibers to 423
be formed, it is speculated that the effect of maternal nutrition could have been directed 424
to Pr muscle fibers formation. Wigmore and Stickland (1983) studied the evolution of 425
fetal muscle fiber development throughout pregnancy and established the number of Pr 426
fibers was fixed on d 60 of gestation. Increasing nutrient availability during this time 427
could have both, prevented final Pr fiber formation or induced degeneration of the 428
existing Pr fibers. With less Pr fibers, a lesser number of Sc fibers will be subsequently 429
developed. The real cause of this consistent effect needs further investigation. Studies 430
on maternal transference of metabolites to the fetus, or the understanding of the 431
epigenetic alterations caused by the maternal nutritional status on the fetal genome (Wu 432
et al., 2004), may help to elucidate the underlying mechanisms involved. Also it would 433
be necessary to address whether sow parity and other related factors, that could 434
contribute to differences on maternal metabolism may play a role on this effect. 435
436
Despite the differences observed in the number of muscle fibers between treatments, no 437
consistent effects on postnatal piglet growth performance were detected in the current 438
study. Although differences in growth performance between groups of treatment 439
appeared in the nursery period, they disappeared thereafter and did not seem linked with 440
muscle fiber number. However, muscle mass and muscle growth does not only depend 441
on the number of muscle fibers but also on the rate of hypertrophy of the individual 442
fibers (Henckel et al., 1997; Larzul et al., 1997; Rehfeldt et al, 2000). In the present 443
study, total number of fibers and their mean cross-sectional area were negatively 444
associated and similar to other reports (Rehfeldt et al., 2000). Therefore, the lower 445
number of muscle fibers found in the maternal supplemented pigs could have been 446
Page 18 of 39Journal of Animal Science
by on May 11, 2011. jas.fass.orgDownloaded from
19
compensated by a higher hypertrophy of these fibers during the growing period. This 447
would give then a suitable explanation to the lack of differences in growth performance 448
during the growing-finishing phase, despite the differences found in number of muscle 449
fibers between treatments. As a result, final carcass lean content at market weight was 450
not affected by maternal treatment. Similarly, Nissen et al. (2003) and Heyer et al. 451
(2004) found no effects of increasing maternal feed intake during gestation on carcass 452
composition of the progeny at slaughter. 453
454
Although effects on growth performance were not found, the pigs that were smaller in 455
utero seemed to benefit the most from maternal treatment, with better feed conversion 456
rates. This led us to select pigs from G4 in order to carry out the carcass, meat quality 457
and muscle fiber measurements planned in the present study. Dwyer et al. (1994) and 458
Rehfeldt et al. (2001) also stated that the lightest pigs in the litter, which are mainly the 459
pigs allocated in G4 and G5 in the present study, showed the highest response to 460
maternal feeding or maternal treatment, respectively, during pregnancy. 461
462
Maternal Feeding Level, Muscle Fiber Development and Meat Quality 463
464
The different feed allowance provided to the sows in the present study resulted in meat 465
quality differences that were consistent in both study R. To our knowledge, other 466
studies in which a supplemental feeding strategy has been applied during early gestation 467
(d 25 to 50, approximately) or covering both Pr and Sc muscle fibers formation (25 to 468
70-80 d approximately), did not report differences on meat quality traits at slaughter 469
(Nissen et al., 2003; Heyer et al., 2004). In the present study, pigs born from H sows 470
showed higher ultimate pH values in the SM muscle (pH24) and darker LT meats (lower 471
Page 19 of 39 Journal of Animal Science
by on May 11, 2011. jas.fass.orgDownloaded from
20
L* values) than pigs born from C sows. These differences between treatments were not 472
followed by differences in drip loss percentages. Histochemical and biochemical 473
properties of a given muscle, such as the number of muscle fibers, mean area or fiber 474
type composition (oxidative and glycolytic capacities and glycogen and lipid contents), 475
are factors which influence meat quality (Larzul et al., 1997; Karlsson et al., 1999; 476
Oksbjerg et al., 2000; Rehfeldt et al., 2004). However, the relationship of fiber type 477
composition to meat quality is not fully established and validated for pigs (Lefaucheur 478
et al., 2006). In the present study, apart from the above mentioned differences in number 479
and size of the muscle fibers, different maternal feed allowances during mid-gestation 480
impacted muscle composition. Pigs born from H sows showed fewer type IIB fibers and 481
a lower percentage of type IIB fibers together with a higher percentage of type I and IIA 482
fibers compared to C pigs. In agreement with the glycolytic potential and the “white” 483
color of the type IIB fibers, dark color and higher ultimate pH of the H animals’ meat 484
might have originated from the lower total number and proportion of this type of muscle 485
fibers (Larzul et al., 1997; Depreux et al., 2002). In fact, in the present experiment, the 486
estimated total number of type IIB fibers was positively related to lightness (r = 0.32, P 487
< 0.05), and negatively associated with the ultimate pH (r = -0.30, P < 0.05). 488
489
Experiments focused on the effects of genetic selection for lean content on muscle fiber 490
characteristics have reported that an increase in the proportion of type IIB fibers may be 491
one of the causes of the lower meat quality characteristics reported for the new leaner 492
genotypes (Larzul et al., 1997; Oksbjerg et al., 2000). Due to their glycolytic 493
metabolism and fewer capillary networks, type IIB fibres seem to be detrimental to pork 494
quality, and particularly susceptible to pale soft and exudative (PSE) development 495
(Lefaucheur et al., 2002 and 2003; Franck et al., 2007). As a whole, through changes 496
Page 20 of 39Journal of Animal Science
by on May 11, 2011. jas.fass.orgDownloaded from
21
caused in fiber type proportions, the feeding strategy carried out in the current study 497
might help to improve meat quality and prevent PSE condition in the H pigs. However, 498
it is important to highlight that results in all the meat quality traits measured in the 499
present experiment, either in the H or in the C group, lay within the normal values 500
suggested for pork (Joo et al. 1995 and 1999). 501
502
Muscle fiber size also has been negatively related to meat quality, in particular with 503
decreased water holding capacity and tenderness (Karlsson et al., 1999; Rehfeldt et al., 504
1999; Gondret et al., 2006). Strong fiber hypertrophy reduces the capacity of fibers to 505
adapt to activity-induced demands, which in turn may be associated with poor meat 506
quality in modern meat-type pigs (Henckel et al., 1997; Rehfeldt et al., 1999). In the 507
present study, H pigs showed type IIB fibers with higher mean cross-sectional areas 508
compared with C pigs, although neither drip loss nor meat tenderness (TPA test) were 509
apparently affected by sow nutrition during mid-gestation. 510
511
Concluding remarks 512
Overall, feeding pregnant sows above requirements during the period of Sc muscle fiber 513
formation impacted muscle fiber characteristics (number, size and type proportion). 514
Thus, the results support the theory of “fetal programming of postnatal performance” 515
reported by Wu et al. (2004) and Foxcroft et al. (2006) among others, at least in terms 516
of muscle tissue development. However, results obtained were not consistent with the 517
hypothesis tested. Morphologically, extra feed supplemented during mid-pregnancy led 518
to fewer but larger (in area) muscle fibers and a lower percentage of type IIB fibers. 519
These changes did not lead to clear and beneficial effects on postnatal growth 520
performance of the progeny but caused an effect on some meat quality traits. However, 521
Page 21 of 39 Journal of Animal Science
by on May 11, 2011. jas.fass.orgDownloaded from
22
the underlying mechanism for this effect and whether it is consistent in pigs from other 522
less disadvantaged groups of weight remains unknown and need further investigations. 523
524
LITERATURE CITED 525
526
Bee, G. 2004. Effect of early gestation feeding, birth weight, and gender of progeny on 527
muscle fiber characteristics of pigs at slaughter. J. Anim. Sci. 82:826-836. 528
Bourne, M. C. 1978. Texture profile analysis. Food Technology 72:62-66. 529
Cerisuelo, A., R. Sala, G. Nürnberg, M. D. Baucells, and C. Rehfeldt. 2007. How many 530
muscle samples are required to obtain reliable estimations of muscle fibre 531
characteristics from pig longissimus muscle? Meat Sci. 76:583-587. 532
Close, W. H. and D. J. A. Cole. 2003. Nutrition of sows and boars. Nottingham 533
University Press, Nottingham, UK. 534
Depreux, F. F. S., A. L. Grant, and D. E. Gerrard. 2002. Influences of halothane 535
genotype and body-weight on myosin heavy chain composition in pig muscle as 536
related to meat quality. Livestock Prod. Sci. 73:265-273. 537
Dwyer, C. M., N. C. Stickland, and J. M. Fletcher. 1994. The influence of maternal 538
nutrition on muscle fiber number development in the porcine fetus and on 539
subsequent postnatal growth. J. Anim. Sci. 72:911-917. 540
Foxcroft, G. R., W. T. Dixon, S. Novak, C. T. Putman, S. C. Town, and M. D. A. 541
Vinsky. 2006. The biological basis for prenatal programming of postnatal 542
performance in pigs. J. Anim. Sci. 84 (Suppl. E):E105-E112. 543
Franck, M., P. Figwer, C. Godfraind, M. T. Poirel, A. Khazzaha, and M. M. Ruchoux. 544
2007. Could the pale, soft, and exudative condition be explained by distinctive 545
histological characteristics? J. Anim. Sci. 85:746-753. 546
Page 22 of 39Journal of Animal Science
by on May 11, 2011. jas.fass.orgDownloaded from
23
Gatford, K. L., J. E. Ekert, K. Blackmore, M. J. De Blasio, J. M. Boyce, J. A. Owens, R. 547
G. Campbell, and P. C. Owens. 2003. Variable maternal nutrition and growth 548
hormone treatment in the second quarter of pregnancy in pigs alter 549
semitendinosus muscle in adolescent progeny. Br. J. Nutr. 90:283-293. 550
Gondret, F., L. Lefaucheur, H. Juin, I. Louveau, and B. Lebret. 2006. Low birth weight 551
is associated with enlarged muscle fiber area and impaired meat tenderness of 552
the longissimus muscle in pigs. J. Anim. Sci. 84:93-103. 553
Henckel P., N. Oksbjerg, E. Erlandsen, P. Barton-Gade, and C. Bejerholm. 1997. Histo-554
and biochemical characteristics of the longissimus dorsi muscle in pigs and their 555
relationships to performance and meat quality. Meat Sci. 47:311-312. 556
Heyer, A., H. K. Andersson, J. E. Lindberg, and K. Lundström. 2004. Effects of extra 557
maternal feed supply in early gestation on sow and piglet performance and 558
production and meat quality of growing/finishing pigs. Acta Agricult. Scand. A, 559
54:44-55. 560
Hoshi, E. H., Fonseca N.A.N., Pinheiro J.W., Bridi A.M., and da Silva C.A. 2005. 561
Muscle fibre number and growth performance of pigs from sows treated with 562
ractopamine. Asian Australas. J. Anim. Sci. 18:1492-1497. 563
Joo, S. T., R. G. Kauffman, B. C. Kim, and C. J. Kim. 1995. The relationship between 564
color and water holding capacity in prostigor porcine longissimus muscle. J. 565
Muscle Foods 6:211-226. 566
Joo, S. T., R. G. Kaufman, B. C. Kim, and G. B. Park. 1999. The relationship fof 567
sarcoplasmic and myofirbillar protein solubility to colour and water-holding 568
capacity in porcine longissimus muscle. Meat Sci. 52:291-297. 569
Karlsson, A. H., R. E. Klont, and X. Fernandez. 1999. Skeletal muscle fibres as factors 570
for pork quality. Livestock Prod. Sci. 60:255-269. 571
Page 23 of 39 Journal of Animal Science
by on May 11, 2011. jas.fass.orgDownloaded from
24
Larzul, C., L. Lefaucheur, P. Ecolan, J. Gogue, A. Talmant, P. Sellier, P. Le Roy, and 572
G. Monin. 1997. Phenotypic and genetic parameters for longissimus muscle 573
fiber characteristics in relation to growth, carcass, and meat quality traits in large 574
white pigs. J. Anim. Sci. 75:3126-3137. 575
Latorre, R., F. Gil, J. M. Vazquez, F. Moreno, F. Mascarello, and G. Ramirez. 1993. 576
Skeletal muscle fibre types in the dog. J. Anat. 182:329-337. 577
Lawlor, P. G., P. B. Lynch, M. K. O’Connell, L. McNamara, P. Reid, and N. C. 578
Stickland. 2007. The influence of over feeding sows during gestation on 579
reproductive performance and pig growth to slaughter. Arch. Tierz. Special 580
Issue 50:82-91. 581
Lefaucheur, L., P. Ecolan, L. Plantard, and N. Gueguen. 2002. New insights into muscle 582
fiber types in the pig. J. Histochem. Cytochem. 50:719-730. 583
Lefaucheur, L., P. Ecolan, E. M. Barzic, J. Marion, and J. Le Dividich. 2003. Early 584
postnatal food intake alters myofibers maturation in pig skeletal muscle. J. Nutr. 585
133:140-147. 586
Lefaucheur, L. 2006. Myofibre typing and its relationships to growth performance and 587
meat quality. Arch. Tierz. 49:04-17. 588
Miller, H. M., G. R. Foxcroft, and F. X. Ahene. 2000. Increasing food intake in late 589
gestation improved sow condition throughout lactation but did not affect piglet 590
viability or growth rate. Anim. Sci. 71:141-148. 591
Musser R., D. L. Davis, M. D. Tokach, J. L. Nelssen, S. S. Dritz, and R. D. Goodband. 592
2006. Effects of high feed intake during early gestation on sow performance and 593
offspring growth and carcass characteristics. Anim. Feed Sci. Technol. 127:187-594
199. 595
Page 24 of 39Journal of Animal Science
by on May 11, 2011. jas.fass.orgDownloaded from
25
NRC. 1998. Nutrient Requirements of Swine. 10th
rev. ed. Natl. Acad. Press, 596
Washington, DC. 597
Nissen, P. M., V. O. Danielsen, P. F. Jorgensen, and N. Oksbjerg. 2003. Increased 598
maternal nutrition of sows has no beneficial effects on muscle fiber number or 599
postnatal growth and has no impact on the meat quality of the offspring. J. 600
Anim. Sci. 81:3018-3027. 601
Oksbjerg, N., J. S. Petersen, I. L. Sorensen, P. Henckel, M. Vestergaard, P. Ertbjerg, A. 602
J. Moller, C. Bejerholm, and S. Stoier. 2000. Long-term changes in performance 603
and meat quality of Danish Landrace pigs: a study on a current compared with 604
an unimproved genotype. Anim. Sci. 71:81-92. 605
Rasmussen, A. and J. R. Andersson. 1996. New method for determination of drip loss in 606
pork muscles. Pages 286-287 in Proc. 42nd Int. Congr. Meat Sci. Technol., 607
Norway. 608
Rehfeldt, C., N. C. Stickland, I. Fiedler, and Wegner J. 1999. Enviromental and genetic 609
factors as sources of variation in skeletal muscle fiber number. Basic Appl. 610
Myol. 9:235-253. 611
Rehfeldt, C., I. Fiedler, G. Dietl, and K. Ender. 2000. Myogenesis and postnatal muscle 612
cell growth as influenced by selection. Livestock Prod. Sci. 66:177-188. 613
Rehfeldt, C., G. Kuhn, J. Vanselow, R. Furbass, I. Fiedler, G. Nurnberg, A. K. Clelland, 614
N. C. Stickland, and K. Ender. 2001. Maternal treatment with somatotropin 615
during early gestation affects basic events of myogenesis in pigs. Cell Tissue 616
Res. 306:429-440. 617
Rehfeldt, C., I. Fiedler, and N. C. Stickland. 2004. Number and size of muscle fibres in 618
relation to meat production. Pages 1-23 in Muscle development of Livestock 619
Page 25 of 39 Journal of Animal Science
by on May 11, 2011. jas.fass.orgDownloaded from
26
Animals. M. F. W. te Pas, M. E. Everts, and H. P. Haagsman, eds. CABI 620
publishing, Oxfordshire,UK. 621
Speer, V. C. 1990. Partitioning nitrogen and amino acids for pregnancy and lactation in 622
swine: a review. J. Anim. Sci. 68:553-561. 623
Swatland, H. J. and R. G. Cassens. 1973. Prenatal development, histochemistry and 624
innervation of porcine muscle. J. Anim. Sci. 36:343-354. 625
Wigmore, P. M. and N. C. Stickland. 1983. Muscle development in large and small pig 626
fetuses. J. Anat. 137:235-245. 627
Wu, G., F. W. Bazer, T. A. Cudd, C. J. Meininger, and T. E. Spencer. 2004. Maternal 628
nutrition and fetal development. J. Nutr. 134:2169-2172. 629
630
631
632
633
634
635
636
637
638
639
640
Page 26 of 39Journal of Animal Science
by on May 11, 2011. jas.fass.orgDownloaded from
27
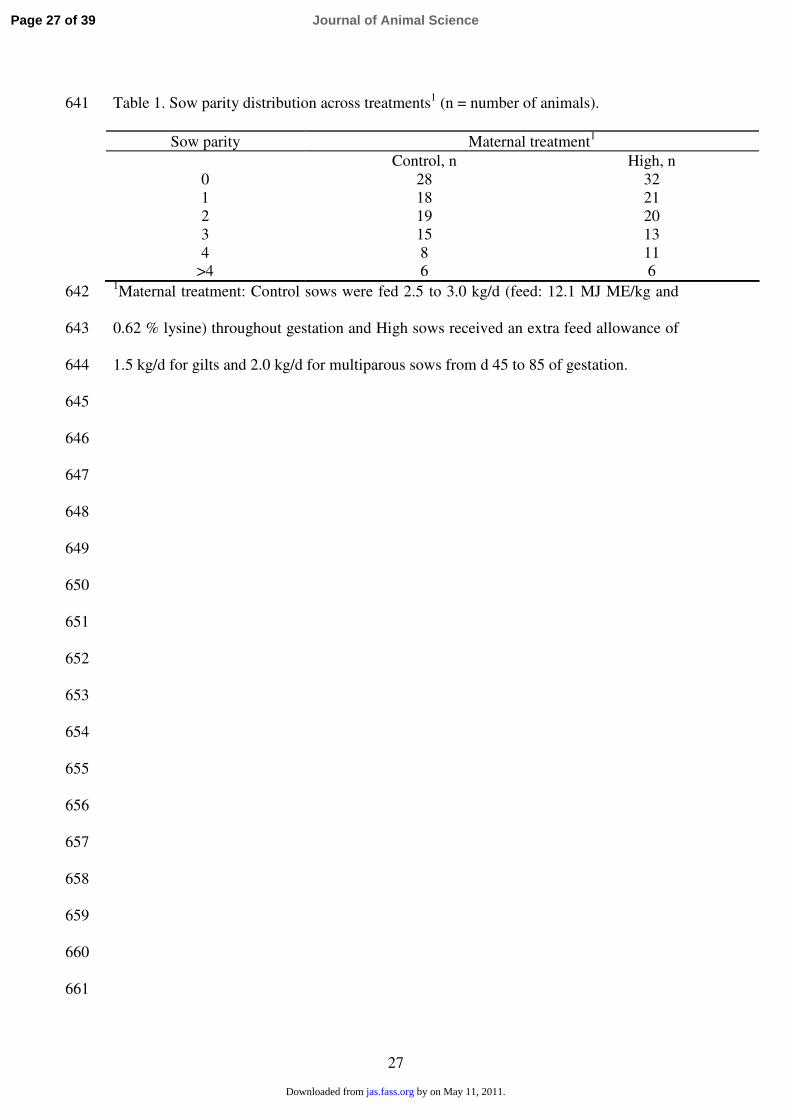
Table 1. Sow parity distribution across treatments1 (n = number of animals). 641
Sow parity Maternal treatment1
Control, n High, n
0 28 32
1 18 21
2 19 20
3 15 13
4 8 11
>4 6 6 1Maternal treatment: Control sows were fed 2.5 to 3.0 kg/d (feed: 12.1 MJ ME/kg and 642
0.62 % lysine) throughout gestation and High sows received an extra feed allowance of 643
1.5 kg/d for gilts and 2.0 kg/d for multiparous sows from d 45 to 85 of gestation. 644
645
646
647
648
649
650
651
652
653
654
655
656
657
658
659
660
661
Page 27 of 39 Journal of Animal Science
by on May 11, 2011. jas.fass.orgDownloaded from
28
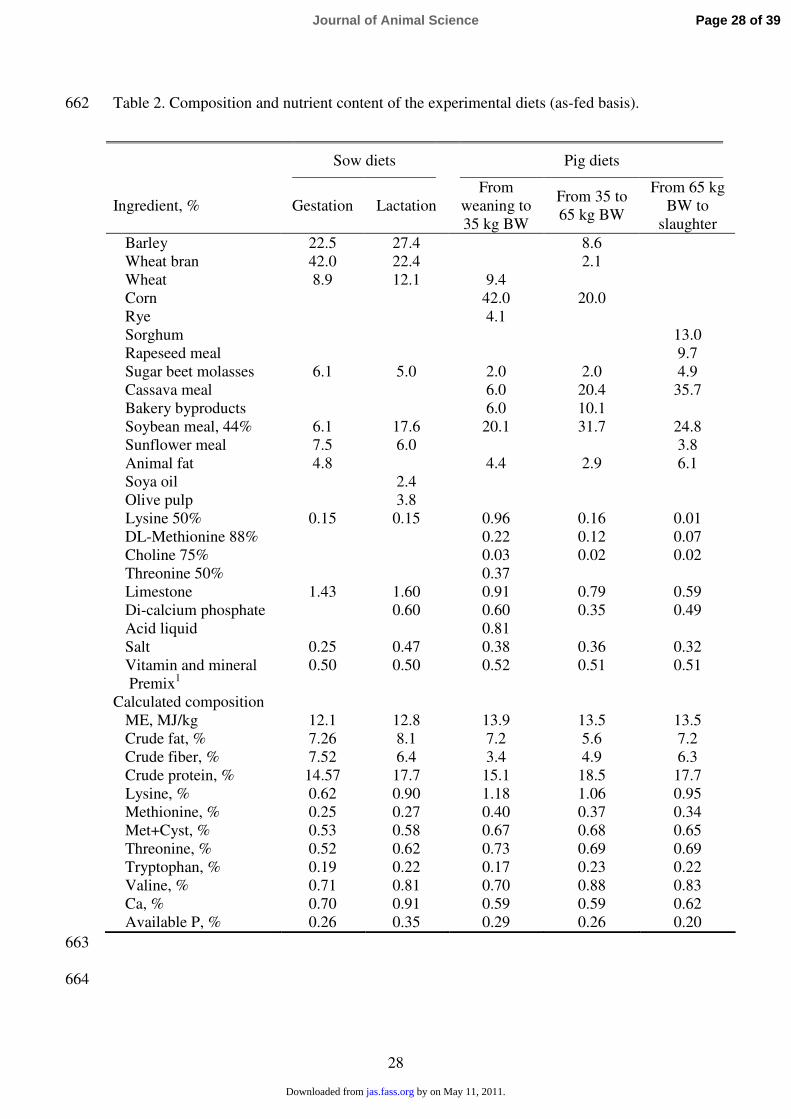
Table 2. Composition and nutrient content of the experimental diets (as-fed basis). 662
663
664
Sow diets Pig diets
Ingredient, % Gestation Lactation
From
weaning to
35 kg BW
From 35 to
65 kg BW
From 65 kg
BW to
slaughter
Barley 22.5 27.4 8.6
Wheat bran 42.0 22.4 2.1
Wheat 8.9 12.1 9.4
Corn 42.0 20.0
Rye 4.1
Sorghum 13.0
Rapeseed meal 9.7
Sugar beet molasses 6.1 5.0 2.0 2.0 4.9
Cassava meal 6.0 20.4 35.7
Bakery byproducts 6.0 10.1
Soybean meal, 44% 6.1 17.6 20.1 31.7 24.8
Sunflower meal 7.5 6.0 3.8
Animal fat 4.8 4.4 2.9 6.1
Soya oil 2.4
Olive pulp 3.8
Lysine 50% 0.15 0.15 0.96 0.16 0.01
DL-Methionine 88% 0.22 0.12 0.07
Choline 75% 0.03 0.02 0.02
Threonine 50% 0.37
Limestone 1.43 1.60 0.91 0.79 0.59
Di-calcium phosphate 0.60 0.60 0.35 0.49
Acid liquid 0.81
Salt 0.25 0.47 0.38 0.36 0.32
Vitamin and mineral
Premix1
0.50 0.50 0.52 0.51 0.51
Calculated composition
ME, MJ/kg 12.1 12.8 13.9 13.5 13.5
Crude fat, % 7.26 8.1 7.2 5.6 7.2
Crude fiber, % 7.52 6.4 3.4 4.9 6.3
Crude protein, % 14.57 17.7 15.1 18.5 17.7
Lysine, % 0.62 0.90 1.18 1.06 0.95
Methionine, % 0.25 0.27 0.40 0.37 0.34
Met+Cyst, % 0.53 0.58 0.67 0.68 0.65
Threonine, % 0.52 0.62 0.73 0.69 0.69
Tryptophan, % 0.19 0.22 0.17 0.23 0.22
Valine, % 0.71 0.81 0.70 0.88 0.83
Ca, % 0.70 0.91 0.59 0.59 0.62
Available P, % 0.26 0.35 0.29 0.26 0.20
Page 28 of 39Journal of Animal Science
by on May 11, 2011. jas.fass.orgDownloaded from
29
1 Provided per kilogram of feed: 10000 IU of vitamin A; 2000 IU of vitamin D3; 40 mg 665
of vitamin E; 6 mg of vitamin K; 1 mg of vitamin B1; 6 mg of vitamin B2; 0.02 mg of 666
vitamin B12; 29 mg of nicotinic acid; 11.71 mg of pantothenic acid; 0.5 mg of folic 667
acid, 0.06 mg of biotin; 80 mg of Fe; 25 mg of Cu; 0.40 mg of Co; 100 mg of Zn; 43.20 668
mg of Mn; 2.25 mg of I and 0.09 mg of Se. 669
670
671
672
673
674
675
676
677
678
679
680
681
682
683
684
685
686
687
688
689
Page 29 of 39 Journal of Animal Science
by on May 11, 2011. jas.fass.orgDownloaded from
30
Table 3. Sow body reserves during gestation and lactation and litter performance at birth and on d 18 of lactation. 690
Maternal treatment1
Control High SEM
3
P-value2
Sow, n 95 104
BF4 level on d 45 of gestation, mm 16.8 16.6 0.34 0.692
BF4 level on d 85 of gestation, mm 18.0 20.0 0.26 <0.001
BF4 change from d 45 to d 85, mm 1.29 3.36 0.293 <0.001
Total born pigs
n5 13.0 12.7 0.33 0.628
APW6, kg
1.45 1.51 0.021 0.057
Born alive pigs
n5 12.0 11.7 0.305 0.988
APW6, kg 1.47 1.51 0.022 0.156
CV, % 19.4 19.4 0.75 0.995
Stillborn, n5 1.02 0.95 0.117 0.660
Pigs on d 18 of lactation
n5 9.85 9.49 0.150 0.150
APW6, kg 5.44 5.49 0.077 0.654
ADG7, kg/d
2.29 2.20 0.060 0.302 1Maternal treatment: Control sows were fed 2.5 to 3.0 kg/d (feed: 12.1 MJ ME/kg and 0.62 % lysine) throughout gestation and High sows 691
received an extra feed allowance of 1.5 kg/d for gilts and 2.0 kg/d for multiparous sows from d 45 to 85 of gestation. 692
693
Page 30 of 39Journal of Animal Science
by on May 11, 2011.
jas.fass.orgD
ownloaded from

31
2P-value refers to effects of maternal treatment 694
3SEM was extracted from the ANOVA analysis in count data (number of total born, born alive, stillborn and number of pigs on d 18 of lactation) 695
4BF = backfat thickness at the level of the last rib at approximately 6.0 to 6.5 cm from the midline 696
5n =
number of pigs/litter 697
6APW = average piglet weight 698
7Average daily gain/litter during lactation (after cross-fostering to d 18 of lactation) 699
700
701
702
703
704
705
706
707
708
Page 31 of 39 Journal of Animal Science
by on May 11, 2011.
jas.fass.orgD
ownloaded from
32
Table 4. Nursery and growing-finishing growth performance of piglets from Control (C) 709
or High (H) sows during gestation. 710
Maternal treatment1
P-value2
Period C H SEM MT G MT*G
Nursery
Pigs, n 476 482
ADG, g/d 321.4 333.2 3.67 0.031 <0.001 0.540
ADFI, g/d 442.3 451.3 5.26 0.233 <0.001 0.764
G:F 0.72 0.74 0.004 0.044 0.490 0.170
Growing-Finishing
Pigs, n 317 319
ADG, g/d 798.3 785.4 8.89 0.938 0.073 0.547
ADFI3, g/d 1,819.2 1,816.0 29.2 0.310 0.165 0.379
G:F3 0.44 0.43 4.6 0.275 0.293 0.421
1Maternal treatment: C sows were fed 2.5 to 3.0 kg/d (feed: 12.1 MJ ME/kg and 0.62 % 711
lysine) throughout gestation and H sows received an extra feed allowance of 1.5 kg/d 712
for gilts and 2.0 kg/d for multiparous sows from d 45 to 85 of gestation. 713
2Effects of maternal treatment (MT), piglet weight group (G) and the interaction term. 714
3Feed consumption controlled in G3 and G4. 715
716
717
718
719
720
Page 32 of 39Journal of Animal Science
by on May 11, 2011. jas.fass.orgDownloaded from
33
Table 5. Carcass and meat quality traits at slaughter from market weight pigs from the Group 41. 721
Maternal treatment2
Control High SEM
P-value3
Pigs, n 45 45 -
Carcass quality
Carcass wt, kg 79.9 82.3 1.54 0.268
Lean meat, % 54.17 53.01 0.583 0.166
GM4, mm 20.06 20.45 0.733 0.711
Muscle and main cut weight, kg
SM5
1.08 1.11 0.021 0.219
LT6
2.83 2.90 0.122 0.621
Ham 11.87 12.32 0.210 0.126
Meat quality
pH457
SM5
6.21 6.18 0.034 0.529
LT6
6.18 6.21 0.033 0.577
pH248
SM5
5.57 5.66 0.021 0.002
LT6
5.56 5.57 0.013 0.331
Meat color9
L* 52.89 50.89 0.463 0.003
a* 5.49 5.78 0.165 0.213
b* 4.16 4.15 0.183 0.952
Drip loss10
, % 1.12 1.30 0.100 0.203 1Weight Group 4 includes the second lightest group of pigs at weaning.
722
Page 33 of 39 Journal of Animal Science
by on May 11, 2011.
jas.fass.orgD
ownloaded from
34
2Maternal treatment: Control sows were fed 2.5 to 3.0 kg/d (feed: 12.1 MJ ME/kg and 0.62 % lysine) throughout gestation and High sows 723
received an extra feed allowance of 1.5 kg/d for gilts and 2.0 kg/d for multiparous sows above the C level from d 45 to 85 of gestation. 724
3P-value refers to effects of maternal treatment. 725
4GM = Mid-line fat thickness at gluteus medius. 726
5SM = Semimembranosus muscle. 727
6LT = Longissimus thoracis muscle. 728
7pH45 = pH at 45 minutes postmortem. 729
8pH24 = pH at 24 h postmortem.
730
9Meat color (L*: lightness; a*: redness; b*: yellowness)
measured at 24 h post-mortem in LT muscle. 731
10Measured at 24 h postmortem in LT muscle. 732
733
734
735
736
737
Page 34 of 39Journal of Animal Science
by on May 11, 2011.
jas.fass.orgD
ownloaded from
35
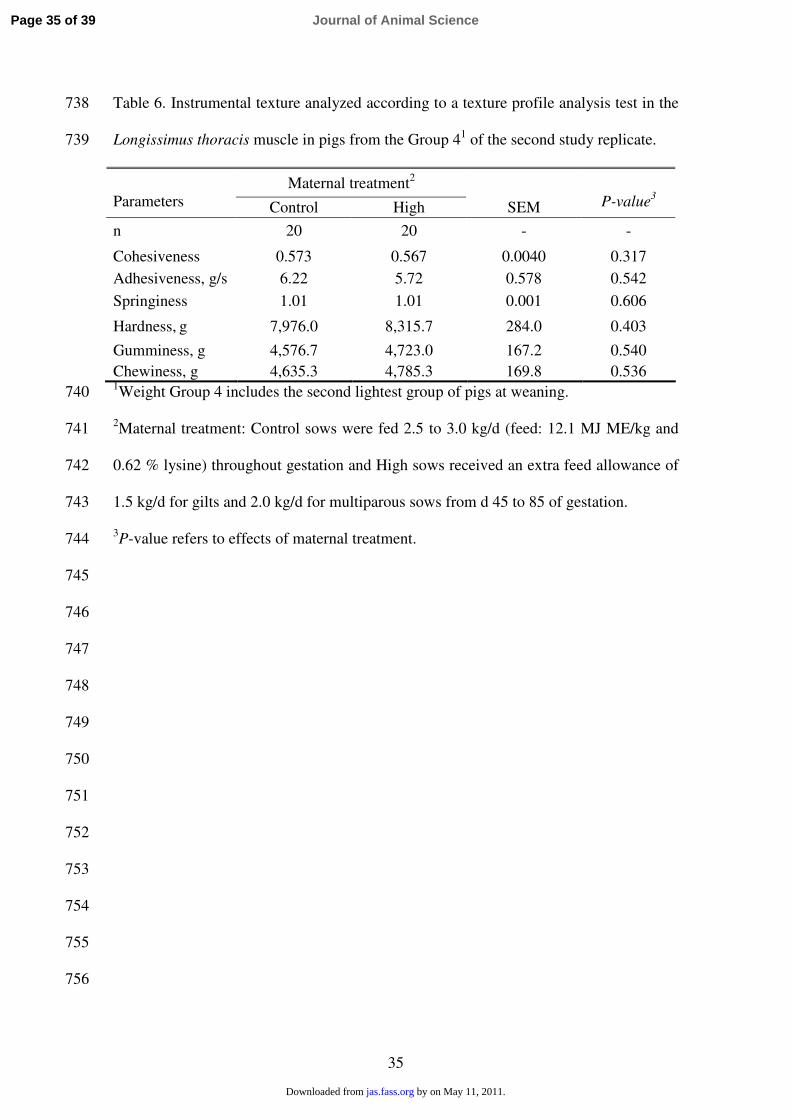
Table 6. Instrumental texture analyzed according to a texture profile analysis test in the 738
Longissimus thoracis muscle in pigs from the Group 41 of the second study replicate. 739
Maternal treatment2
Parameters Control High SEM
P-value3
n 20 20 - -
Cohesiveness 0.573 0.567 0.0040 0.317
Adhesiveness, g/s 6.22 5.72 0.578 0.542
Springiness 1.01 1.01 0.001 0.606
Hardness, g 7,976.0 8,315.7 284.0 0.403
Gumminess, g 4,576.7 4,723.0 167.2 0.540
Chewiness, g 4,635.3 4,785.3 169.8 0.536 1Weight Group 4 includes the second lightest group of pigs at weaning.
740
2Maternal treatment: Control sows were fed 2.5 to 3.0 kg/d (feed: 12.1 MJ ME/kg and 741
0.62 % lysine) throughout gestation and High sows received an extra feed allowance of 742
1.5 kg/d for gilts and 2.0 kg/d for multiparous sows from d 45 to 85 of gestation. 743
3P-value refers to effects of maternal treatment. 744
745
746
747
748
749
750
751
752
753
754
755
756
Page 35 of 39 Journal of Animal Science
by on May 11, 2011. jas.fass.orgDownloaded from
36
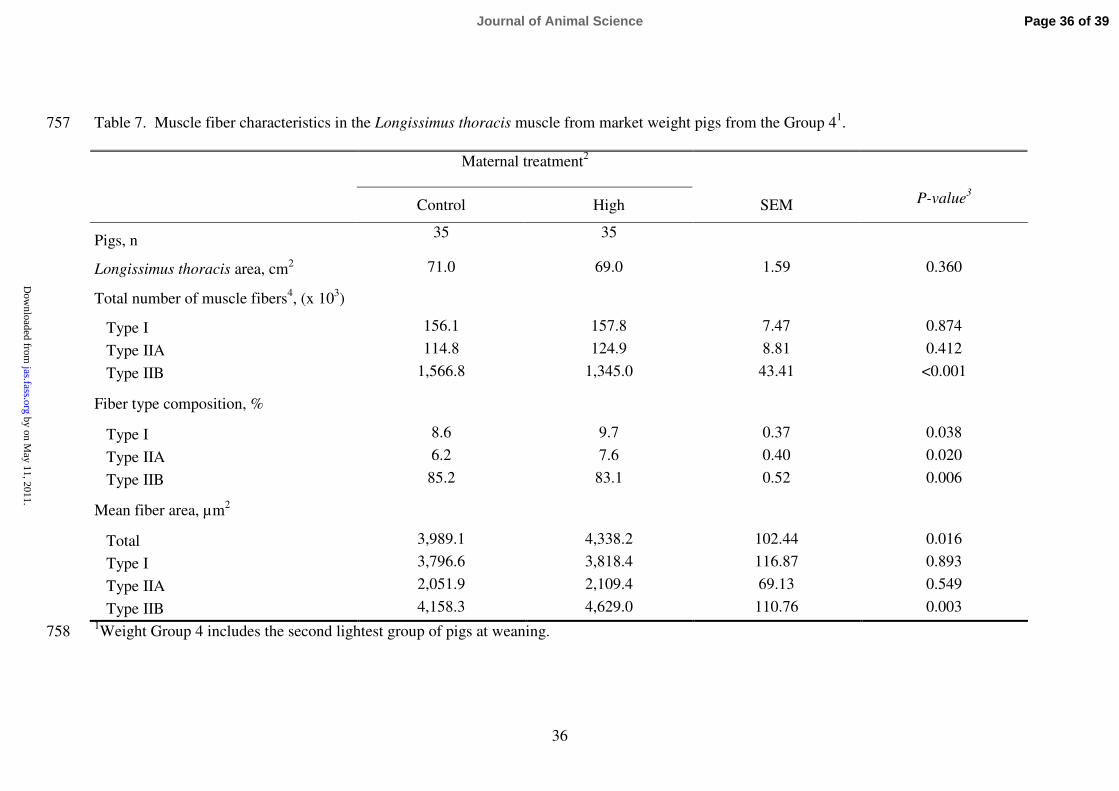
Table 7. Muscle fiber characteristics in the Longissimus thoracis muscle from market weight pigs from the Group 41. 757
Maternal treatment2
Control High SEM
P-value3
Pigs, n 35 35
Longissimus thoracis area, cm2 71.0 69.0 1.59 0.360
Total number of muscle fibers4, (x 10
3)
Type I 156.1 157.8 7.47 0.874
Type IIA 114.8 124.9 8.81 0.412
Type IIB 1,566.8 1,345.0 43.41 <0.001
Fiber type composition, %
Type I 8.6 9.7 0.37 0.038
Type IIA 6.2 7.6 0.40 0.020
Type IIB 85.2 83.1 0.52 0.006
Mean fiber area, µm2
Total 3,989.1 4,338.2 102.44 0.016
Type I 3,796.6 3,818.4 116.87 0.893
Type IIA 2,051.9 2,109.4 69.13 0.549
Type IIB 4,158.3 4,629.0 110.76 0.003 1Weight Group 4 includes the second lightest group of pigs at weaning.
758
Page 36 of 39Journal of Animal Science
by on May 11, 2011.
jas.fass.orgD
ownloaded from

37
2Maternal treatment: Control sows were fed 2.5 to 3.0 kg/d (feed: 12.1 MJ ME/kg and 0.62 % lysine) throughout gestation and High sows 759
received an extra feed allowance of 1.5 kg/d for gilts and 2.0 kg/d for multiparous sows from d 45 to 85 of gestation. 760
3P-value refers to effects of maternal treatment. 761
4Estimated total number of muscle fibers calculated as [(total number of fibers counted x muscle cross-sectional area) / the area occupied by the 762
fibers counted]. 763
Page 37 of 39 Journal of Animal Science
by on May 11, 2011.
jas.fass.orgD
ownloaded from
38
Figure 1
a)
0
200
400
600
800
1000
1200
1400
1600
1800
2000
Total number Secondary fibres
Fib
er,
No.,
thousands
b)
010
2030
405060
7080
90100
Primary fibres No.,
thousands
Ratio S:P
Fib
er,
No
. o
r ra
tio
a
b a
a
b
b
Page 38 of 39Journal of Animal Science
by on May 11, 2011. jas.fass.orgDownloaded from
39
Figure 1. Muscle fiber characteristics in the Longissimus thoracis muscle from pigs
born from Control sows (fed conventionally throughout gestation; solid bars) and High
sows (provided 1.5 kg/d and 2.0 kg/d extra for gilts and multiparous, respectively, from
d 45 to 85 of gestation; hashed bars). a) Estimated total number of muscle fibers (P =
0.005) and total number of embryonic secondary fibers (P = 0.005). b) Total number of
embryonic primary fibers (P = 0.007) and secondary to primary fibers ratio (Ratio S:P,
P = 0.725).
Page 39 of 39 Journal of Animal Science
by on May 11, 2011. jas.fass.orgDownloaded from