Increased interleukin-10 associated with low IL-6 concentration correlated with greater survival...
19
Increased interleukin-10 associated with low IL-6 concentration correlated with greater survival rates in mice infected by rabies virus vaccinated against it and immunomodulated with P. acnes J. Megid a, * , R. Kaneno b , C.N. Nozaki a , C.J.C. Brito a , M.F. Almeida c a Faculdade de Medicina Veterina ´ria, Department of Veterinary Hygiene and Public Health, UNESP, Botucatu SP, Brazil b Instituto de Cie ˆncias Biolo ´gicas, Department of Microbiology and Immunology, UNESP, Botucatu, SP, Brazil c Centro de Controle de Zoonoses, Sa ˜o Paulo, SP, Brazil Accepted 19 December 2003 Abstract Macrophage activity, cytokines serum concentration, serum neutralizing antibodies and lethality by rabies were evaluated in swiss mice experimentally infected with street rabies virus and submitted or not to antirabies vaccination and immunomodulation with P. acnes. Animals were killed at different times and serum was collected in order to evaluate cytokines concentration; peritonial and splenic macrophages were collected for macrophage activity evaluation. Greater survival rates higher IL-10 and low IL-6 serum concentration were observed in vaccinated animals treated using P. acnes. q 2004 Elsevier Ltd. All rights reserved. Keywords: Rabies; Cytokines; Immunomodulation; Vaccine; Macrophage; IL-10; IL-6 Re ´sume ´ L’activite ´ des macrophages, la concentration se ´rique des cytokines, le taux d’anticorps neutralisants et le taux de mortalite ´ ont e ´te ´e ´value ´s chez des souris infecte ´es par le virus rabique des rues et soumises ou non a ` une vaccination antirabique et a ` une immunomodulation avec P. acnes. Les animaux ont e ´te ´ sacrifie ´s a ` des temps diffe ´rents et le se ´rum a e ´te ´ collecte ´ afin d’e ´valuer la concentration en cytokines. Les macrophages pe ´ritone ´aux et sple ´niques ont e ´te ´ collecte ´s afin d’e ´valuer l’activite ´ macrophagique. 0147-9571/$ - see front matter q 2004 Elsevier Ltd. All rights reserved. doi:10.1016/j.cimid.2004.01.002 Comparative Immunology, Microbiology & Infectious Diseases 27 (2004) 393–411 www.elsevier.com/locate/cimid * Corresponding author. E-mail address: [email protected] (J. Megid).
-
Upload
independent -
Category
Documents
-
view
2 -
download
0
Transcript of Increased interleukin-10 associated with low IL-6 concentration correlated with greater survival...

Increased interleukin-10 associated with low IL-6
concentration correlated with greater survival rates
in mice infected by rabies virus vaccinated against
it and immunomodulated with P. acnes
J. Megida,*, R. Kanenob, C.N. Nozakia, C.J.C. Britoa, M.F. Almeidac
aFaculdade de Medicina Veterinaria, Department of Veterinary Hygiene and Public Health,
UNESP, Botucatu SP, BrazilbInstituto de Ciencias Biologicas, Department of Microbiology and Immunology, UNESP, Botucatu, SP, Brazil
cCentro de Controle de Zoonoses, Sao Paulo, SP, Brazil
Accepted 19 December 2003
Abstract
Macrophage activity, cytokines serum concentration, serum neutralizing antibodies and lethality
by rabies were evaluated in swiss mice experimentally infected with street rabies virus and
submitted or not to antirabies vaccination and immunomodulation with P. acnes. Animals were
killed at different times and serum was collected in order to evaluate cytokines concentration;
peritonial and splenic macrophages were collected for macrophage activity evaluation. Greater
survival rates higher IL-10 and low IL-6 serum concentration were observed in vaccinated animals
treated using P. acnes.
q 2004 Elsevier Ltd. All rights reserved.
Keywords: Rabies; Cytokines; Immunomodulation; Vaccine; Macrophage; IL-10; IL-6
Resume
L’activite des macrophages, la concentration serique des cytokines, le taux d’anticorps
neutralisants et le taux de mortalite ont ete evalues chez des souris infectees par le virus rabique
des rues et soumises ou non a une vaccination antirabique et a une immunomodulation avec P. acnes.
Les animaux ont ete sacrifies a des temps differents et le serum a ete collecte afin d’evaluer la
concentration en cytokines.
Les macrophages peritoneaux et spleniques ont ete collectes afin d’evaluer l’activite
macrophagique.
0147-9571/$ - see front matter q 2004 Elsevier Ltd. All rights reserved.
doi:10.1016/j.cimid.2004.01.002
Comparative Immunology, Microbiology
& Infectious Diseases 27 (2004) 393–411
www.elsevier.com/locate/cimid
* Corresponding author.
E-mail address: [email protected] (J. Megid).

Un taux de survie plus eleve et un taux de concentration plus eleve en IL10 et moins eleve en IL6
ont ete observes chez les animaux vaccines et traites avec P acnes.
q 2004 Elsevier Ltd. All rights reserved.
Mots-cle: Rage; Cytokine; Immunomodulation; Vaccin; Macrophage; IL-10; IL-6
1. Introduction
Several researchers [1–4] have studied the role of macrophages in rabies in relation to
virus sequestration, greater activity in susceptible animals and persistence of rabies virus
inside them [4].
The possible role of cytokines in rabies pathogenesis in relation to the concentration of
IL-1a, IL-1b and TNF-a and their brain receptors has been evaluated by other researchers
[5–7].
The use of immunomodulators, antiviral drugs and interferon in rabies was reported by
some authors [8–11]. The mechanism of immunomodulating using Propionibacterium
acnes (P. acnes) has been studied by several researchers [12–14] both in human and
animal models of infectious diseases [15,16].
P. acnes action was evaluated in mice infected by rabies virus and researchers
observed greater survival rates in animals treated with the immunomodulator and
antirabies vaccine. This greater survival was not related to serum neutralizing antibodies,
interferon gamma concentration and cellular immunity evaluated by the Macrophage
Inhibition Test [17] but it was correlated with higher Natural Killer activity in infected
mice treated using P. acnes [18].
Considering the action of P. acnes in macrophages activity and its possible role in the
protection against rabies, the aim of the present trial was to evaluate macrophage activity
and cytokine concentration in mice infected by rabies virus, vaccinated against it and
submitted to treatment with P. acnes (Corynebacterium parvum).
2. Material and methods
2.1. Animals
Outbred, female, swiss albino mice, approximately four weeks old, from the Central
Laboratory Animal Facility at UNESP-Botucatu.
2.2. Rabies virus
Virus sample used was isolated from the brain of a rabid dog positive for rabies both by
the fluorescent antibody test (FAT) and the mouse inoculation test (MIT). The virus
sample was maintained using one intracerebral and one IM passage in mice and stored at
220 8C. Virus titration was accomplished by 0.03 ml IM inoculation of serial 10-fold viral
dilutions in diluent using 10 mice per dilution. Viral titer was 1021.29 DL50/0.03 ml IM.
J. Megid et al. / Comp. Immun. Microbiol. Infect. Dis. 27 (2004) 393–411394

2.3. Immunomodulator
P. acnes produced by Laboratorio Farmaceutico do Estado de Pernambuco (LAFEPE),
constituted of 4 mg/2 ml of P. acnes (formerly C. parvum), dose used was 0.2 ml (0.4 mg)
per animal.
2.4. Vaccine
Fuenzalida-Palacios anti-rabies vaccine produced by TECPAR (Instituto de Tecnologia
do Parana), dose used was 40 ml in the left foot pad.
2.5. Animal inoculation
Performed according to the methodology described by Koprowsky [19], with small
modification related to the route of inoculation (IM route into the right hind limb).
2.6. Evaluation of macrophage activity
Hydrogen peroxide was evaluated through the technique by Reed et al. [20] and nitrite
production was performed according to Green et al. [21]. Results, expressed in mM, were
evaluated in splenic and peritonial macrophages non-stimulated or stimulated using
Interferon-g (IFNg-).
2.7. Serum neutralization (SN)
The technique adopted was described by Favoretto et al. [22], using in PV strain and
BHK21 cell culture; sera were first diluted 1:5 and then used in two-fold serial dilutions up
to 1:40. SN titers were expressed in IU/ml.
2.8. Cytokine assay
Tumour Necrosis Factor-a (TNF-a), interferon-g (IFN-g), Interleukin 1a (IL1a), Inter-
leukin1b (IL1b), Interleukin-2 (IL-2), Interleukin 3 (IL-3), Interleukin 4 (IL-4),
Interleukin 5 (IL-5), Interleukin 6 (IL-6), Interleukin 10 (IL-10) and Interleukin 12 (IL-12)
were evaluated through ELISA test, using pooled sera from three mice for each colletion
time, according the methodology recommended by the manufacturer (R and D Systems).
2.9. Statistical analysis
Performed by Kruskall–Wallis [23].
J. Megid et al. / Comp. Immun. Microbiol. Infect. Dis. 27 (2004) 393–411 395

3. Experimental procedures
This trial was conducted using six experimental groups with 300 mice in each; animals
were submitted to the following treatments.
Infected group. Intramuscularly (IM) injected using 0.03 ml of rabid mouse brain
suspension.
Infected P. acnes group. IM inoculation with 0.03 ml of rabid mouse brain suspension
and treated 24 h after inoculation with 0.2 ml P. acnes suspension by (IP) route.
Infected vaccinated P. acnes: group. IM inoculation with 0.03 ml of rabid mouse brain
suspension and 24 h after that, vaccinated using 0.04 ml Fuenzalida-Palacios anti-rabies
vaccine IM and treated with 0.2 ml P. acnes IP.
Vaccinated: group: IM inoculation with 0.03 ml of normal mouse brain suspension and
vaccinated using 0.04 ml Fuenzalida-Palacios anti-rabies vaccine IM.
Control group. 0.03 ml IM injection of normal mouse brain suspension (NBS).
P. acnes control group. 0.03 ml IM injection of NBS and treated with P. acnes
suspension by IP route, 24 h after inoculation.
After immunomodulator treatment (24 h after infection) 15 mice were killed after 24 h,
7,14 and 21 d. A pool of serum from three mice colleted at these different times was
promptly submitted to cytokine assay. For the macrophage activity evaluation peritonial
macrophagos were obtained by perfusion and spleen samples were colleted for adherent
cells at the same time.
4. Results
Greater survival rate were observed in the group treated using P. acnes and anti-rabies
vaccine (50%) followed by the group only treated with P. acnes (29.2%) and infected
animals (25%). Survival rate are presented in Fig. 1.
The highest titers of serum neutralizing antibodies, correlated with clinical symptoms
in the animals, were detected after 14th day in all infected groups (Table 1; Fig. 2) Results
were not statistically significant ðp . 0:05Þ:
Production of nitrite was not detected in spleen macrophages of any groups. Higher
production was observed in IFNg stimulated peritonial macrophages of the P. acnes
Fig. 1. Survival rate of infected mice submitted to different treatments.
J. Megid et al. / Comp. Immun. Microbiol. Infect. Dis. 27 (2004) 393–411396

control group on the 7th day compared to control group ðp , 0:01Þ (Table 2).
No difference was observed in non-stimulated peritonial macrophages ðp . 0:05Þ
(Table 3).
Hydrogen peroxide production of non-stimulated and IFNg stimulated peritonial
macrophage was similar in all moments and groups ðp . 0:05Þ (Tables 4 and 5).
In non-stimulated spleen macrophages, higher peroxide production was observed in the
P. acnes control group, compared to control group at 24 h ðp , 0:05Þ: Inversely, the P:acnes
control group ðp , 0:01Þ and the vaccinated group ðp , 0:05Þ presented the lowest
macrophage activity on the 7th day when compared to the infected groups submitted or not
to immunomodulation and vaccination. On the 14th day, greater activity was verified in the
vaccinated group ðp , 0:05Þ and the lowest activity in P. acnes control group ðp , 0:001Þ:
No difference was verified on the 21st day ðp . 0:05Þ:
When stimulated using IFN-g, the greatest activity was observed in the P. acnes control
group, in the infected, and infected P. acnes groups when compared to the control group
ðp , 0:05Þ at 24 h. On the 7th day the highest peroxide production was detected in all
infected groups (submitted or not to vaccination and immunomodulation) compared to
non-infected ones ðp , 0:001–0:05Þ: Highest activity was detected on the 14th day in
the group only vaccinated compared to the control ones ðp , 0:01Þ and compared to
the infected, vaccinated group ðp , 0:05Þ: No difference was verified on the 21st day
ðp . 0:05Þ: Results are presented in Tables 4 and 5.
Table 1
Serum Neutralizing antibodies in infected mice submitted to different treatments. Results expressed as median
(mean ^ standard deviation) of IU
24 h 7 d 14 d 21 d
Infected 0.18(0.256 ^ 0.170) 0.56(0.904 ^ 0.831) 1.04(0.806 ^ 0.323) 0.78(0.747 ^ 0.360)
Infected/P. acnes 0.23(0.23 ^ 0.094) 0.203(0.226 ^ 0.095) 0.813(0.906 ^ 0.382) 0.64(0.64 ^ 0.08)
Infected vaccine/
P. acnes/
0.14(0.185 ^ 0.085) 0.36(0.585 ^ 0.435) 1.04(0.981 ^ 0.244) 0.91(0.857 ^ 0.204)
Fig. 2. Serum neutralizing antibody titers expressed in IU/ml, in mice infected by rabies and submitted or not to
anti-rabies vaccination and P. acnes treatment (median).
J. Megid et al. / Comp. Immun. Microbiol. Infect. Dis. 27 (2004) 393–411 397

Table 2
Activity of interferon stimulated macrophages evaluated by nitrite production in the different groups and moments. Results expressed as median (mean þ standard
deviation)
Macrophages Day Control Control P. Acnes Infected Infected P. acnes Infected
Vaccinated
P. acnes
Vaccinated
Peritoneal 24 h 0 (42.369 þ 88.099) 0 (0 þ 0) 0 (0.009 þ 0.0145) 0 (10.203 þ 27.886) 0 (0.167 þ 0.047) 0 (29.781 þ 78.133)
7 d 0 (12.675 þ 43.910) 163.039 (180.154 þ 158.504) 0 (109.439 þ 295.486) 0 (54.041 þ 116.058) 0 (37.321 þ 58.163) 3.193 (29.368 þ 55.394)
14 d 0 (38.023 þ 60.354) 0 (50.108 þ 82.107) 0 (8.583 þ 18.335) 0 (33.411 þ 74.709) 0 (36.221 þ 78.836) 0 (29.396 þ 51.588)
21 d 0 (31.602 þ 71.809) 0 (65.548 þ 126.600) 0 (15.857 þ 38.931) 0 (69.069 þ 89.922) 0 (27.487 þ 48.627) 0 (12.597 þ 25.360)
Spleen 24 h 0 (0 þ 0) 0 (0 þ 0) 0 (0.002 þ 0.006) 0 (0.005 þ 0.0101) 0 (0.008 þ 0.013) 0 (0 þ 0)
7 d 0 (0 þ 0) 0 (0 þ 0) 0 (4.551 þ 20.354) 0 (3.683 þ 11.347) 0 (0 þ 0) 0 (0 þ 0)
14 d 0 (0 þ 0) 0 (0 þ 0) 0 (0 þ 0) 0 (0 þ 0) 0 (0 þ 0) 0 (0 þ 0)
21 d 0 (0 þ 0) 0 (0 þ 0) 0 (0 þ 0) 0 (0 þ 0) 0 (0 þ 0) 0 (0 þ 0)
J.M
egid
eta
l./
Co
mp
.Im
mu
n.
Micro
bio
l.In
fect.D
is.2
7(2
00
4)
39
3–
41
13
98

Table 3
Activity of non-stimulated macrophages evaluated by nitrite production in the different groups and moments. Results expressed as median (mean þ standard deviation)
Macrophages Day Control Control P. acnes Infected Infected P. acnes Infected
vaccinated
P. acnes
Vaccinated
Peritoneal 24 h 0 (29.80 þ 77.800) 0 (0 þ 0) 0 (0.101 þ 0.015833) 0 (2.926 þ 11.667) 0 (0.007 þ 0.014) 0 (5.170 þ 11.856)
7 d 0 (11.637 þ 40. 313) 0 (66.223 þ 119.576) 0 (26.231 þ 81.793) 0 (42.661 þ 88.255) 0 (30.735 þ 55.358) 0 (23.133 þ 53.098)
14 d 0 (16.262 þ 36.298) 0 (43.641 þ 83.788) 0 (6.028 þ 13.479) 0 (29.078 þ 65.020) 0 (23.465 þ 62.082) 2.371 (50.402 þ 69.119)
21 d 0 (13.218 þ 45.127) 0 (61.875 þ 131.574) 0 (14.396 þ 36.192) 30.209 (73.203 þ 95.553) 0 (24.921 þ 55.210) 0 (5.601 þ 17.712)
Spleen 24 h 0 (0 þ 0) 0 (0 þ 0) 0 (0.002 þ 0.004) 0 (0.005 þ 0.0120) 0 (0.009 þ 0.015) 0 (0 þ 0)
7 d 0 (0 þ 0) 0 (0 þ 0) 0 (2.419 þ 6.344) 0 (2.582 þ 11.548) 0 (0 þ 0) 0 (0 þ 0)
14 d 0 (0 þ 0) 0 (0 þ 0) 0 (0 þ 0) 0 (0 þ 0) 0 (0 þ 0) 0 (0 þ 0)
21 d 0 (0 þ 0) 0 (0 þ 0) 0 (0 þ 0) 0 (0 þ 0) 0 (0 þ 0) 0 (0 þ 0)
J.M
egid
eta
l./
Co
mp
.Im
mu
n.
Micro
bio
l.In
fect.D
is.2
7(2
00
4)
39
3–
41
13
99

Table 4
Activity of non-stimulated macrophages evaluated by hydrogen peroxide production in the different groups and moments. Results expressed as median
(mean þ standard deviation)
Macrophages Day Control Control P. acnes Infected Infected P. acnes Infected Vaccinated
P. acnes
Vaccinated
Peritonial 24 h 0 (0 þ 0) 0 (0.008 þ 0.020) 0.001 (0.141 þ 0.253) 0 (0.065 þ 0.155) 0 (5.170 þ 11.856)
7 d 0.078 (0.088
þ 0.0844)
0.004 (0.007 þ 0.012) 0.05 (0.348 þ 0.545) 0.003 (0.270 þ 0.582) 0 (0.311 þ 0.372) 0 (23.133 þ 53.098)
14 d 0.046 (0.085
þ 0.092)
0.015 (0.155 þ 0.058) 0.027 (2.474 þ 6.441) 0 (1.165 þ 2.787) 0.031 (2.655 þ 5.903) 2.372 (50.402
þ 69.119)
21 d 0 (0 þ 0) 0 (0.0004 þ 0.0012) 0 (0.024 þ 0.072) 0 (0.040 þ 0.060) 0 (0,040 þ 0.110) 0 (5,601 þ 17,712)
Spleen 24 h 0 (0 þ 0) 0.111 (0.116 þ 0.039) 0 (0.040 þ 0.093) 0.0003 (0.0971
þ 0.1675)
0.0003 (0.099 þ 0.135) 0 (0.463 þ 0.984)
7 d 0.003 (0.047
þ 0.070)
0.00004 (0.002
þ 0.002)
0.1695 (0.239
þ 0.293)
0.066 (0.231 þ 0.386) 0.0275 (0.259 þ 0.406) 0 (0.040 þ 0.119)
14 d 0 (0.030 þ 0.042) 0 (0 þ 0.0121) 0 (1.928 þ 3.814) 0 (1.827 þ 4.484) 0,001 (1.845 þ 4,322) 0,233 (0.235
þ 0.045)
21 d 0 (0.040 þ 0.080) 0 (0.002 þ 0.009) 0.0007 (0.0401
þ 0.0619)
0.015 (0.042 þ 0.061) 0 (0.002 þ 0.008) 0 (0.004 þ 0.008)
J.M
egid
eta
l./
Co
mp
.Im
mu
n.
Micro
bio
l.In
fect.D
is.2
7(2
00
4)
39
3–
41
14
00

Table 5
Activity of interferon stimulated macrophages evaluated by hydrogen peroxide production in the different groups and moments. Results expressed as median
(mean þ standard deviation)
Macrophages Day Control Control P. acnes Infected Infected P. acnes Infected Vaccinated
P. acnes
Vaccinated
Peritoneal 24 h 0 (0 þ 0) 0.004 (0.021 þ 0.030) 0.0005 (0.2192
þ 0.4238)
0 (0.381 þ 0.995) 0 (0.154 þ 0.335) 0 (29.781 þ 78.133)
7 d 0.069 (0.077
þ 0.080)
0.004 (0.004 þ 0.004) 0.064 (0.313 þ 0.404) 0 (0.297 þ 0,345) 0.006 (0.253 þ 0.384) 3.193(29.368 þ 55.394)
14 d 0.201 (0.211
þ 0.188)
0 (0.164 þ 0.116) 0.146 (1.348 þ 3.272) 0.023 (0.582 þ 1.195) 0.001 (3.911 þ 6.659) 0 (29.396 þ 51.588)
21 d 0 (0 þ 0) 0 (0.001 þ 0.003) 0 (0.039 þ 0.0601) 0 (0.062 þ 0.085) 0 (0.035 þ 0.073) 0 (12.597 þ 25.360)
Spleen 24 h 0 (0 þ 0) 0.083 (0.117 þ 0.093) 0.124 (0.242 þ 0.355) 0.072 (0.210 þ 0.263) 0.002 (0.152 þ 0.263) 0.048 (0.803 þ 2.32)
7 d 0.003 (0.057
þ 0.100)
0.002(0.0067 þ 0.010) 0.091 (0.282 þ 0.333) 0.067 (0.310 þ 0.489) 0.04 (0.349 þ 0.691) 0 (0.0006 þ 0.0018)
14 d 0 (0.057
þ 0.076)
0.016 (0.016 þ 0.049) 0.092 (0.732 þ 2.127) 0.036 (0.807 þ 2.546) 0.001 (1.730 þ 4.618) 0.21725 (0.218 þ 0.072)
21 d 0 (0.012967
þ 0.048317)
0.002 (0.086 þ 0.219) 0.003 (0.061 þ 0.080) 0.048 (0.064 þ 0.098) 0 (0.012 þ 0.030) 0 (0.005 þ 0.010)
J.M
egid
eta
l./
Co
mp
.Im
mu
n.
Micro
bio
l.In
fect.D
is.2
7(2
00
4)
39
3–
41
14
01

Table 6
Results of IL-1 b, IL-2, IL-4, IL-5, IL-6, IL-10 and TNF-a in the different groups and moments. Values expressed as median (mean and standard deviation) pg/ml,
Botucatu-SP, 2000
Test Day Control Control P. acnes Infected Infected P. acnes Infected
vaccinated
P. acnes
Vaccinated
IL-1b 24 h 0 (7.584 þ 9.572) 5.19 (6.326
þ 5.799)
17.7 (9.862
þ 14.442)
4.79 (19.479
þ 22.018)
3.84 (13.737
þ 18.226)
25.164 (29.462
þ 9.304)
7 d 2.8 (5.170 þ 6.303) 4.51 (13.218
þ 24.859)
1.53 (4.889
þ 7.696)
29.58 (16.518
þ 24.418)
32.92 (6.428
þ 9.113)
6.444 (8.662
þ 5.739)
14 d 0 (6.754 þ 10.572) 202.55 (202.557
þ 247.152)
2.55 (3.210
þ 5.749)
0 (7.432
þ 9.022)
0 (2.902
þ 4.044)
35.147 (32.928
þ 6.528)
21 d 8.79 (7.614
þ 7.369)
1.78 (122.067
þ 262.885)
8.58(4.523
þ 5.580)
6.98 (10.161
þ 10.870)
2.44 (4.767
þ 5.198)
16.428 (19.617
þ 10.158)
IL-2 24 h 0 (3.927
þ 6.580)
0 (1.202
þ 3.602)
0 (1.314
þ 3.488)
0 (1.524
þ 3.139)
7.29 (9.614
þ 6.875)
0 (0 þ 0)
7 d 0 (7.353
þ 13.847)
0 (5.227
þ 12.909)
0 (7.602
þ 23.904)
0 (1.927
þ 3.165)
43.55 (5.008
þ 3.405)
0 (0 þ 0)
14 d 37.23 (37.915
þ 36.720)
0.88 (0.884
þ 1.250)
0 (2.516
þ 5.036)
0 (0 þ 0) 0 (3.148
þ 5.329)
0 (0 þ 0)
21 d 1.58(2.527
þ 2.941)
0 (8.107
þ 9.929)
3.32 (9.580
þ 11.599)
6.55 (0.022
þ 0.055)
5.44 (6.803
þ 7.565)
5.262 (8.845
þ 11.079)
IL-4 24 h 0 (0 þ 0) 0 (0 þ 0) 0 (0 þ 0) 0 (0 þ 0) 0 (0 þ 0) 0 (0 þ 0)
7 d 0 (0 þ 0) 0 (0 þ 0) 0 (0 þ 0) 0 (0 þ 0) 0 (0 þ 0) 0 (0 þ 0)
14 d 0 (0 þ 0) 0 (0 þ 0) 0 (0 þ 0) 0 (0 þ 0) 0 (0 þ 0) 0 (0.971
þ 1.681)
21 d 0 (0 þ 0) 0 (0 þ 0) 0 (0 þ 0) 0 (0 þ 0) 0 (0 þ 0) 1.372 (3.770
þ 5.070)
IL-5 24 h 0 (0 þ 0) 0 (0 þ 0) 0 (0 þ 0) 0 (0 þ 0) 0 (0 þ 0) 0 (0 þ 0)
7 d 0 (0 þ 0) 0 (0 þ 0) 0 (0.907
þ 2.487)
0 (0 þ 0) 0 (0.718
þ 2.155)
0 (0 þ 0)
14 d 0 (0 þ 0) 0 (0 þ 0) 0 (0.144 þ 0.479) 0 (0 þ 0) 0 (0.895
þ 1.822)
0 (1.595
þ 2.763)
J.M
egid
eta
l./
Co
mp
.Im
mu
n.
Micro
bio
l.In
fect.D
is.2
7(2
00
4)
39
3–
41
14
02

21 d 0 (0 þ 0) 0 (0 þ 0) 0 (15.422
þ 32.283)
0 (0 þ 0) 0 (0.801
þ 1.316)
0 (12.346
þ 21.385)
IL-6 24 h 0 (102.880
þ 394.541)
0 (115.005
þ 201.726)
111.62 (150.503
þ 146.124)
135.44 (243.794
þ 250.935)
0 (203.294
þ 424.354)
283.95 (256.413
þ 118.342)
7 d 0 (0 þ 0) 0 (39.659
þ 99.589)
11.87 (85.518
þ 185.202)
6.66 (27.632
þ 54.595)
0 (0.536
þ 1.932)
112.74 (161.763
þ 191.051)
14 d 0 (22.568
þ 38.048)
1.47 (1.473
þ 2.083)
76.64 (104.757
þ 158.328)
0 (290.072
þ 540.049)
0 (32.275
þ 76.991)
110.74 (224.877
þ 232.565)
21 d 0 (0 þ 0) 8.093 (8.093
þ 26.841)
9.64 (43.995
þ 102.543)
0 (22.432
þ 30.121)
0 (16.429
þ 32.645)
332.58 (374.103
þ 281.769)
IL-10 24 h 0 (1.820
þ 7.051)
0 (5.238
þ 11.396)
0 (0.556
þ 1.478)
0 (3.267
þ 7.715)
56.97 (44.023
þ 40.904)
0 (0.715
þ 1.238)
7 d 0 (0.465 þ 0.928) 0 (1.091
þ 2.342)
0 (2.288
þ 6.287)
0 (2.808
þ 5.720)
0 (27.097
þ 27.593)
108.7 (107.299
þ 42.778)
14 d 7.12 (27.539
þ 39.819)
0 (0 þ 0) 0 (2.672
þ 4.871)
0 (0 þ 0) 0 (83.829
þ 106.840)
118.52 (105.432
þ 23.890)
21 d 0 (7.484
þ 20.370)
0 (8.395
þ 26.028)
0 (3.759
þ 10.239)
0 (0 þ 0) 25.80 (48.630
þ 47.521)
142.35 (141.883
þ 6.322)
TNF-a 24 h 0 (2418.6
þ 9367.1)
8 (10.505
þ 25182.9)
0 (5022.154
þ 12643.37)
0 (7297.8
þ 14653.79)
0 (24.151
þ 63.898)
0 (0 þ 0)
7 d 0 (0 þ 0) 0 (0 þ 0) 22 (276
þ 1203.056)
0 (4169.382
þ 8690.956)
0 (2835.231
þ 7872.247)
0 (29.941
þ 51.859)
14 d 0 (0 þ 0) 0 (0 þ 0) 0 (0 þ 0) 0 (0 þ 0) 0 (62.295
þ 196.994)
0 (0 þ 0)
21 d 0 (0 þ 0) 0 (0.086 þ 0) 0 (0 þ 0) 0 (42.965
þ 67.807)
0 (0 þ 0) 18.424 (53.438
þ 77.153)
J.M
egid
eta
l./
Co
mp
.Im
mu
n.
Micro
bio
l.In
fect.D
is.2
7(2
00
4)
39
3–
41
14
03

IFN-g, IL-1 b, IL-2, IL-4, IL-5, IL-6, IL-10 and TNF-a were evaluated in all groups.
IL-1a, IL-3 and IL-12 were not evaluated in the vaccinated group.
IFN-g was not detected in any moment and group (results not shown).
Compared to all the other groups, the infected, vaccinated group presented higher IL-2
concentration at 24 h (Table 6 and Fig. 3); higher IL-10 concentration in all moments
Fig. 3. IL2 concentration (pg/ml) of different groups and at different moments. Values expressed in Mean of Ranks.
Fig. 4. IL-10 serum concentration (pg/ml) of different groups and at different moments. Values expressed in Mean
of Ranks.
J. Megid et al. / Comp. Immun. Microbiol. Infect. Dis. 27 (2004) 393–411404
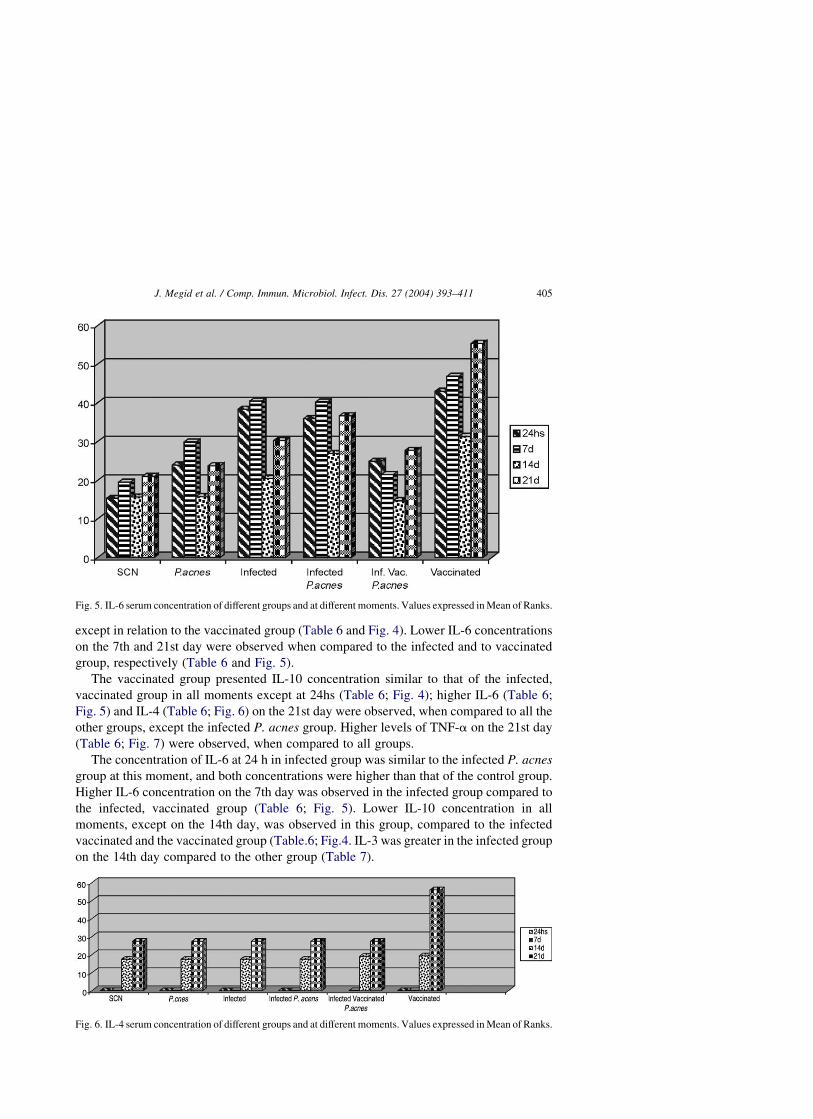
except in relation to the vaccinated group (Table 6 and Fig. 4). Lower IL-6 concentrations
on the 7th and 21st day were observed when compared to the infected and to vaccinated
group, respectively (Table 6 and Fig. 5).
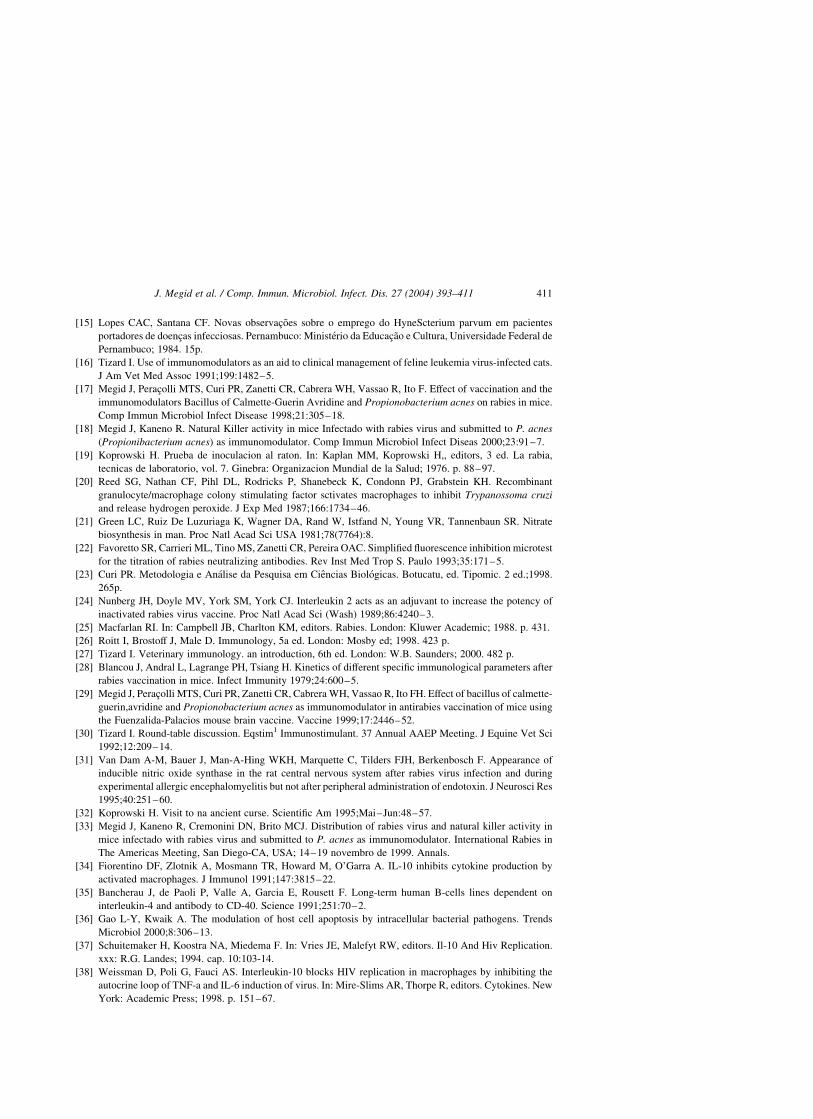
The vaccinated group presented IL-10 concentration similar to that of the infected,
vaccinated group in all moments except at 24hs (Table 6; Fig. 4); higher IL-6 (Table 6;
Fig. 5) and IL-4 (Table 6; Fig. 6) on the 21st day were observed, when compared to all the
other groups, except the infected P. acnes group. Higher levels of TNF-a on the 21st day
(Table 6; Fig. 7) were observed, when compared to all groups.
The concentration of IL-6 at 24 h in infected group was similar to the infected P. acnes
group at this moment, and both concentrations were higher than that of the control group.
Higher IL-6 concentration on the 7th day was observed in the infected group compared to
the infected, vaccinated group (Table 6; Fig. 5). Lower IL-10 concentration in all
moments, except on the 14th day, was observed in this group, compared to the infected
vaccinated and the vaccinated group (Table.6; Fig.4. IL-3 was greater in the infected group
on the 14th day compared to the other group (Table 7).
Fig. 5. IL-6 serum concentration of different groups and at different moments. Values expressed in Mean of Ranks.
Fig. 6. IL-4 serum concentration of different groups and at different moments. Values expressed in Mean of Ranks.
J. Megid et al. / Comp. Immun. Microbiol. Infect. Dis. 27 (2004) 393–411 405

The infected P. acnes group presented higher IL-6 concentration at 24 h compared to
the control group, and similar IL-6 concentration compared to the vaccinated group on the
21st day (Table 6; Fig. 5). Lower IL-10 concentration in all moments (Table 6; Fig. 4) was
observed when compared to the infected vaccinated and the only vaccinated groups.
Higher concentration of TNF-a was observed in this group on the 14th day in relation to
all groups except the vaccinated one (Table 6; Fig. 7).
Higher IL-1a at 24 h was observed in all infected groups submitted or not to P:acnes
treatment and anti-rabies vaccine. The infected vaccinated P. acnes group presented the
highest concentration of this cytokine on the 14th day (Table 7; Fig. 8).
IL-1b (Table 6), IL-5 (Table 6) and IL-12 (Table 7) concentration was similar in all
moments and for all groups.
5. Discussion
A greater survival rate was observed in the animals treated using P. acnes and anti-
rabies vaccine, with not relation with the levels of serum neutralizing antibodies, what is in
agreement with the reports of several researchers [24,25]. In previous trials, survival rates
of mice infected by rabies virus, submitted to anti-rabies vaccine, and treated with P. acnes
or anti-rabies vaccine associated with P. acnes as post-exposure treatment, were studied,
and similar results were obtained in this experiment; the best survival rate was observed in
the vaccinated P. acnes treated group, followed by the P. acnes immunomodulated group;
the vaccinated group presented the lowest survival rate [17].
Higher levels of IL-10 in all moments except 24 h, IL-6 on the 7th day, and IL-4 on the
21st day were observed in the vaccinated group, what characterizes anti-rabies vaccine
induced Th2 response and antibody production [26,27]. The production of hydrogen
peroxide associated with higher levels of TNFa serum concentration on the 14th and 21st
days, respectively, suggest that macrophage activity stimulation induced by anti-rabies
vaccine occurs, what is in agreement with the report by Blancou et al. [28] who described
Fig. 7. TNF a serum concentration of different groups and at different moments. Values expressed in Mean of
Ranks.
J. Megid et al. / Comp. Immun. Microbiol. Infect. Dis. 27 (2004) 393–411406

Table 7
Results of IL-1a, IL-3 and IL-12 in the different groups and moments. Values expressed as median (mean and standard deviation) pg/ml, Botucatu-SP, 2000
Test Day Control control P. acnes Infected Infected P. acnes Infected vaccinated P. acnes
IL 1 a 24 h 29.09 (30.658 þ 26.713) 2406 (47.640 þ 57.315) 50.06 (69.797 þ 20.870) 73.323 (63.890 þ 38.274) 58.63 (68.192 þ 54.853)
7 d 13.92 (33.354 þ 41.940) 34.67 (31.938 þ 22.92) 14.68 (45.802 þ 29.688) 46.99 (32.242 þ 31.093) 33.15 (62.193 þ 44.163)
14 d 22.67 (25.866 þ 26.058) 45.72 (45.725 þ 54.387) 31.54 (38.378 þ 16.577) 40.28 (28.809 þ 15.406) 65.63 (74.528 þ 29.937)
21 d 25.84 (65.526 þ 95.927) 8.58 (15.906 þ 18.713) 38.89 (43.660 þ 17.375) 43.74 (44.687 þ 18.349) 54.93 (58.735 þ 28.821)
IL 3 24 h 0 (0 þ 0) 0 (0 þ 0) 0 (0 þ 0) 0 (0 þ 0) 0 (0 þ 0)
7 d 0 (0 þ 0) 0 (0 þ 0) 0 (0 þ 0) 0 (10,496 þ 37,847) 0 (0 þ 0)
14 d 0 (0 þ 0) 0 (0 þ 0) 0 (0 þ 0) 0 (39,108 þ 99,688) 0 (0 þ 0)
21 d 0 (0 þ 0) 0 (0 þ 0) 0 (0 þ 0) 0 (0 þ 0) 0 (0 þ 0)
IL 12 24 h 9.11 (12.946 þ 11.544) 0 (18.078 þ 40.424) 16.82 (8.601 þ 13.389) 0 (28.334 þ 32.373) 0 (22.472 þ 32.911)
7 d 0 (0.381 þ 0.852) 0 (34.099 þ 49.242) 12.01 (2.073 þ 2.931) 2.07 (59.558 þ 93.984) 3.66 (32.858 þ 51.173)
14 d 36.89 (55.441 þ 70.114) 0 (0 þ 0) 0 (20.447 þ 41.867) 0 (28.772 þ 57.545) 59.68 (77.900 þ 78.157)
21 d 0 (41.64 þ 93.109) 0 (21.229 þ 32.486) 50.78 (8.355 þ 13.733) 0 (52.490 þ 48.846) 0 (13.487 þ 33.0374)
J.M
egid
eta
l./
Co
mp
.Im
mu
n.
Micro
bio
l.In
fect.D
is.2
7(2
00
4)
39
3–
41
14
07

delayed hypersensitivity in anti-rabies vaccinated mice, and Megid et al. [29] who
observed macrophage activity induced by anti-rabies vaccine in mice on the 6th and 14th
days post vaccination.
Peritonial and splenic macrophage activity induced by P. acnes was verified in P. acnes
control group on the 7th and at 24 h, respectively, associated to higher IL-6 levels
compared to control group what suggests macrophage activity stimulation induced by the
immunomodulator. These results are corroborated by Tizard [30] whot have described
P. acnes activity on macrophages, with IL-1, TNF-a and IL-6 liberation few hours after
administration.
Macrophage activation is response to virus infection observed in the infected group
submitted or not to vaccination and immunomodulation as evidenced by the serum levels
of IL-1a, are in agreement with Marquette et al. [6] who described IL-1a concentration in
central nervous system, in correlation with rabies virus replication.
The greatest spleen macrophage activity correlated with clinical symptoms in the
animals was observed in all infected groups on the 14th day, what suggest a correlation
between macrophagic activity and rabies symptoms. Although the infected vaccinated
P. acnes group was treated with anti-rabies vaccine and P. acnes, which are both
responsible for macrophage stimulation, this group presented lower macrophage activity
associated with lower IL-6 and higher IL-10 levels, compared to the others infected groups
on the 14th day. This group presented the greatest survival rate. As these cytokines can
inhibit macrophage function [27], it may be considered that protection against rabies may
be connected to the suppression of macrophage activity.
The role of macrophages on rabies pathogenesis has been discussed by several
researchers and associated with mononuclear cell infiltration, production of nitric
Fig. 8. IL-1a concentration of different groups and at different moments. Values expressed in Mean of Ranks.
J. Megid et al. / Comp. Immun. Microbiol. Infect. Dis. 27 (2004) 393–411408

oxide [31] and toxicity in central nervous system [32]. Higher levels of brain IL-1a
associated with clinical symptoms, and correlated with the induction of ACTH release and
glucocorticoid production with consequent immunossupression observed in rabies was
described by Marquette et al. [6]. Additionally, higher concentration of brain TNF-a was
described by Marquette et al. [7], and correlated with severe brain inflamatory response
and rabies encephalopathy, with consequent neuronal dysfunction.
Higher levels of IL-2 at 24 h associated to higher IL-10 and lower IL-6 levels at all
times, together with the greater survival rate, were observed in the infected, vaccinated
P. acnes treated group, compared to the other infected groups. The levels of IL-2 and IL-
10 may have induced by the anti-rabies vaccine, once their levels were greater than in the
not vaccinated group. Although the vaccinated group presented higher IL-6 leves
indicating cytokine induction by anti-rabies vaccine, the infected vaccinated P. acnes
group presented the lowest concentration of this cytokine, only similar to control groups,
suggesting IL-6 inhibition induced by anti-rabies vaccine, rabies infection and P. acnes
association.
These observations suggested that the association of P. acnes and anti-rabies vaccine
induced a stronger antigenic stimulus with consequent IL-2 production, what may lead to
Natural Killer and Lymphokine-Activated Killer (LAK) cells stimulation, CTL activation
and T cells proliferation [26]. In previous trials it was observed that Natural Killer cells
(NK) stimulation induced by P. acnes in mice infected by rabies virus was correlated with
higher TNF-a serum concentration [18]. Inversely, when anti-rabies vaccine was
associated with P. acnes as post-exposure treatment, the activity of NK cells was lower
than in the group treated only with P. acnes, but it was higher than in the infected group,
suggesting Natural Killer activity stimulation induced by P. acnes and probably CTL cells
activation, induced by anti-rabies vaccine [33].
IL-10 can be induced by bacterial lipopolysaccharide [34], but in the present trial,
similar levels of this cytokine in the groups submitted or not to P. acnes were observed.
IL-10 concentration was directly related to anti-rabies vaccination, once it was greater in
vaccinated groups. This suggests a Th2 response.
Although similar leves of anti-rabies serum neutralizing antibodies were observed in
the infected groups, the higher IL-10 levels observed in the infected vaccinated P. acnes
group could be responsible for most immunoglobulins isotypes produced, which could, in
their twin, be responsible for better serum neutralizing activities, as report by Bancherau
et al. [35].
Production of IL-10 by macrophages infected with virulent strains of Mycobacterium
tuberculosis, with subsequent switch from Th1 cell mediated to Th2 immune response was
described and correlated with the persistence of the intracellular bacteria and formation of
granulomatous lesion [36]. The action of IL-10 on Th1 response may explain the low IL-6
levels observed in the infected, vaccinated P. acnes group suggesting suppression of this
cytokine when anti-rabies vaccine and P. acnes were associated as post-exposure anti-
rabies treatment.
Several trials with HIV (Human Immunodeficiency Virus) have demonstrated that
IL-10 inhibits TNF-a and IL-6 production by infected monocytes. These cytokines are
responsible for facilitating HIV virus replication [37,38]. It may be hypothesize that the
same mechanisms involved in HIV replication may be occur in rabies virus, once virus
J. Megid et al. / Comp. Immun. Microbiol. Infect. Dis. 27 (2004) 393–411 409

infection of macrophage, replication and persistence was reported by Ray et al. [4] and
King et al. [2], and correlated with a longer incubation period with possibility of
subsequent virus replication and productive infection induced by cytokine. This possibility
may be reinforced by the observation of higher percentile of positivity in FAT in several
lymphoid tissues, together with low virus titer in brain of mice infected by rabies,
vaccinated and treated using P. acnes described in a previous trial [33].
The results demonstrated that the association between P. acnes and Fuenzalida-
Palacios anti-rabies vaccine in mice infected by rabies virus induce a higher levels of
IL-10 and low levels of IL-6 aspects correlated to higher percentage of survival in rabies.
Acknowledgements
Financial support by FAPESP.
References
[1] Turner GS, Ballard R. Interaction of mouse peritonial macrophages with fixed rabies virus in vivo and in
vitro. J Gen Virol 1976;30:223–31.
[2] King AA, Sands JJ, Porterfiled JS. Antibody-mediated enhancement of rabies virus infection in a mouse
macrophage cell line (P388D1). J Gen Virol 1984;65:1091–3.
[3] Consales CA, Mendonca RZ, Lucchiari MA, Vassao RC, Pereira C. Macrophage activity in rabies
virus infection of genetically selected high and low antibody responder lines of mice. Res Virol 1990;
141:57–67.
[4] Ray BN, Ewalt LC, Lodmell DL. Rabies virus replication in primary murine bone marrow macrophages and
in human and murine macrophage-like cell lines: implications for viral persistence. J Virol 1995;69:
764–72.
[5] Haour F, Marquette C, Ban E, Crumeyrolle-Arias M, Rostene W, Tsiang H, Fillion G. Receptors
for interleukin-1 in the central nervous and neuroendocrine systems. Ann D’Endrocrinol 1995;56:
173–9.
[6] Marquette C, Ceccaldi PE, Ban E, Weber P, Tsiang H, Haour F. Alteration of interleukin-1a and interleukin-
1a binding sites in mouse brain during rabies infection. Arch Virol 1996;141:573–85.
[7] Marquette C, Van Dam A-M, Ceccaldi PE, Weber P, Haour F, Tsiang H. Induction of immunoreactive
interleukin-1b and tumor necrosis factor-a in of rabies the brains virus infected rats. J Neuroimmunol 1996;
68:45–51.
[8] Bussereau F, Picard M, Malick C, Teze A, Blancou J. Efficacy of heteropolyanions against rabies virus
infection in mice. Ann Institut Pasteur Virol 1986;137E:391–400.
[9] Chavali SR, Campbell JB. Immunomodulatory effects of orally-administered saponins and nospecific
resistance against rabies infection. Int Arch Allergy Appl Immunol 1987;84:129–34.
[10] Maharaj I, Froh KJ, Campbell JB. Immune responses of mice to inactivated rabies vaccine administered
orally: potentiation by Quillaja saponin. Can J Microbiol 1986;32:414–20.
[11] Sodja I. Experimental chemotherapy of rabies: preliminary results. Acta Virol 1986;30:63–8.
[12] Al-Izzi SA, Maxie MG. Effect of Corynebacterium parvum on bone marrow macrophage colony
production, peripheral blood leucocytes, and histologic changes of tissues in calves. Am J Vet Res 1982;43:
2244–7.
[13] Cox WI. Examining the immunologic and hematopoietic properties of na immunostimulant. Vet Med 1988;
83:424–8.
[14] Fudenberg HH, Whitten HD. Immunostimulation: synthetic and biological modulators of immunity. Ann
Rev Pharmacol Toxicol 1984;24:147–74.
J. Megid et al. / Comp. Immun. Microbiol. Infect. Dis. 27 (2004) 393–411410
[15] Lopes CAC, Santana CF. Novas observacoes sobre o emprego do HyneScterium parvum em pacientes
portadores de doencas infecciosas. Pernambuco: Ministerio da Educacao e Cultura, Universidade Federal de
Pernambuco; 1984. 15p.
[16] Tizard I. Use of immunomodulators as an aid to clinical management of feline leukemia virus-infected cats.
J Am Vet Med Assoc 1991;199:1482–5.
[17] Megid J, Peracolli MTS, Curi PR, Zanetti CR, Cabrera WH, Vassao R, Ito F. Effect of vaccination and the
immunomodulators Bacillus of Calmette-Guerin Avridine and Propionobacterium acnes on rabies in mice.
Comp Immun Microbiol Infect Disease 1998;21:305–18.
[18] Megid J, Kaneno R. Natural Killer activity in mice Infectado with rabies virus and submitted to P. acnes
(Propionibacterium acnes) as immunomodulator. Comp Immun Microbiol Infect Diseas 2000;23:91–7.
[19] Koprowski H. Prueba de inoculacion al raton. In: Kaplan MM, Koprowski H,, editors, 3 ed. La rabia,
tecnicas de laboratorio, vol. 7. Ginebra: Organizacion Mundial de la Salud; 1976. p. 88–97.
[20] Reed SG, Nathan CF, Pihl DL, Rodricks P, Shanebeck K, Condonn PJ, Grabstein KH. Recombinant
granulocyte/macrophage colony stimulating factor sctivates macrophages to inhibit Trypanossoma cruzi
and release hydrogen peroxide. J Exp Med 1987;166:1734–46.
[21] Green LC, Ruiz De Luzuriaga K, Wagner DA, Rand W, Istfand N, Young VR, Tannenbaun SR. Nitrate
biosynthesis in man. Proc Natl Acad Sci USA 1981;78(7764):8.
[22] Favoretto SR, Carrieri ML, Tino MS, Zanetti CR, Pereira OAC. Simplified fluorescence inhibition microtest
for the titration of rabies neutralizing antibodies. Rev Inst Med Trop S. Paulo 1993;35:171–5.
[23] Curi PR. Metodologia e Analise da Pesquisa em Ciencias Biologicas. Botucatu, ed. Tipomic. 2 ed.;1998.
265p.
[24] Nunberg JH, Doyle MV, York SM, York CJ. Interleukin 2 acts as an adjuvant to increase the potency of
inactivated rabies virus vaccine. Proc Natl Acad Sci (Wash) 1989;86:4240–3.
[25] Macfarlan RI. In: Campbell JB, Charlton KM, editors. Rabies. London: Kluwer Academic; 1988. p. 431.
[26] Roitt I, Brostoff J, Male D. Immunology, 5a ed. London: Mosby ed; 1998. 423 p.
[27] Tizard I. Veterinary immunology. an introduction, 6th ed. London: W.B. Saunders; 2000. 482 p.
[28] Blancou J, Andral L, Lagrange PH, Tsiang H. Kinetics of different specific immunological parameters after
rabies vaccination in mice. Infect Immunity 1979;24:600–5.
[29] Megid J, Peracolli MTS, Curi PR, Zanetti CR, Cabrera WH, Vassao R, Ito FH. Effect of bacillus of calmette-
guerin,avridine and Propionobacterium acnes as immunomodulator in antirabies vaccination of mice using
the Fuenzalida-Palacios mouse brain vaccine. Vaccine 1999;17:2446–52.
[30] Tizard I. Round-table discussion. Eqstim1 Immunostimulant. 37 Annual AAEP Meeting. J Equine Vet Sci
1992;12:209–14.
[31] Van Dam A-M, Bauer J, Man-A-Hing WKH, Marquette C, Tilders FJH, Berkenbosch F. Appearance of
inducible nitric oxide synthase in the rat central nervous system after rabies virus infection and during
experimental allergic encephalomyelitis but not after peripheral administration of endotoxin. J Neurosci Res
1995;40:251–60.
[32] Koprowski H. Visit to na ancient curse. Scientific Am 1995;Mai–Jun:48–57.
[33] Megid J, Kaneno R, Cremonini DN, Brito MCJ. Distribution of rabies virus and natural killer activity in
mice infectado with rabies virus and submitted to P. acnes as immunomodulator. International Rabies in
The Americas Meeting, San Diego-CA, USA; 14–19 novembro de 1999. Annals.
[34] Fiorentino DF, Zlotnik A, Mosmann TR, Howard M, O’Garra A. IL-10 inhibits cytokine production by
activated macrophages. J Immunol 1991;147:3815–22.
[35] Bancherau J, de Paoli P, Valle A, Garcia E, Rousett F. Long-term human B-cells lines dependent on
interleukin-4 and antibody to CD-40. Science 1991;251:70–2.
[36] Gao L-Y, Kwaik A. The modulation of host cell apoptosis by intracellular bacterial pathogens. Trends
Microbiol 2000;8:306–13.
[37] Schuitemaker H, Koostra NA, Miedema F. In: Vries JE, Malefyt RW, editors. Il-10 And Hiv Replication.
xxx: R.G. Landes; 1994. cap. 10:103-14.
[38] Weissman D, Poli G, Fauci AS. Interleukin-10 blocks HIV replication in macrophages by inhibiting the
autocrine loop of TNF-a and IL-6 induction of virus. In: Mire-Slims AR, Thorpe R, editors. Cytokines. New
York: Academic Press; 1998. p. 151–67.
J. Megid et al. / Comp. Immun. Microbiol. Infect. Dis. 27 (2004) 393–411 411