Income and happiness across Europe: Do reference values matter?
28
Income and happiness across Europe: Do reference values matter? Guglielmo Maria Caporale a Yannis Georgellis a Nicholas Tsitsianis b Ya Ping Yin b a Brunel University, London b University of Hertfordshire May 2007 Abstract Using data from the European Social Survey (ESS), we examine the link between income and subjective well-being. We find that, for the whole sample of nineteen European countries, although income is positively correlated with both happiness and life satisfaction, reference income exerts a negative effect on individual well-being, a result consistent with the relative utility hypothesis. Performing separate analyses for some Eastern European countries, we also find some evidence of a ‘tunnel effect’, in that reference income has a positive impact on subjective well-being. Our findings support the view that in environments with stable income and employment, reference income serves as a basis for social comparisons, whereas in relatively volatile environments, it is used as a source of information for forming expectations about future status. JEL classification: I31 PsycINFO classification: 3100 Personality Psychology Keywords: Comparison income; Reference groups; Happiness; Life satisfaction. Corresponding author: Professor Guglielmo Maria Caporale, Centre for Empirical Finance, Brunel University, Uxbridge, Middlesex UB8 3PH, UK. Tel.: +44 (0)1895 266713. Fax: +44 (0)1895 269770. Email: [email protected]
Transcript of Income and happiness across Europe: Do reference values matter?

Income and happiness across Europe: Do reference values matter?
Guglielmo Maria Caporalea
Yannis Georgellisa
Nicholas Tsitsianisb
Ya Ping Yinb
a Brunel University, London b University of Hertfordshire
May 2007
Abstract
Using data from the European Social Survey (ESS), we examine the link between income and subjective well-being. We find that, for the whole sample of nineteen European countries, although income is positively correlated with both happiness and life satisfaction, reference income exerts a negative effect on individual well-being, a result consistent with the relative utility hypothesis. Performing separate analyses for some Eastern European countries, we also find some evidence of a ‘tunnel effect’, in that reference income has a positive impact on subjective well-being. Our findings support the view that in environments with stable income and employment, reference income serves as a basis for social comparisons, whereas in relatively volatile environments, it is used as a source of information for forming expectations about future status. JEL classification: I31 PsycINFO classification: 3100 Personality Psychology Keywords: Comparison income; Reference groups; Happiness; Life satisfaction. Corresponding author: Professor Guglielmo Maria Caporale, Centre for Empirical Finance, Brunel University, Uxbridge, Middlesex UB8 3PH, UK. Tel.: +44 (0)1895 266713. Fax: +44 (0)1895 269770. Email: [email protected]

Income and happiness across Europe: Do reference values matter?
1. Introduction
Whether income can buy happiness remains one of the most vexed and fundamental
issues in economics and the social sciences in general. Whilst philosophers have
debated on what happiness is and how to pursue it for thousands of years, in modern
economic theory, economists have focused on approximate measures of happiness
and its relationship with measurable socio-economic and demographic variables.
Although neoclassical economic theory portrays utility or wellbeing as synonymous
to consumption and absolute income, the notion of relative utility could be traced
back to the works of Adam Smith, Karl Marx, Veblen, and Duesenberry, and it is,
once again, receiving considerable attention in the recent economic literature.
Some early empirical evidence that real income growth does not necessarily
imply higher reported happiness levels is provided in the seminal work of Easterlin
(1974). This finding has received further support from numerous subsequent studies
(see, for example, Heady, 1991; Diener, et. al., 1993; Frey and Stutzer, 2000;
Easterlin, 2001; van Praag and Ferrer-i-Carbonell, 2004). By and large, such studies
confirm that, despite the growth in real incomes in industrialized countries, happiness
levels remained “flat” - this is known as the Easterlin Paradox (Easterlin, 1995).
However, a number of recent studies conclude that income can, after all, buy
happiness, especially in Eastern European countries (e.g., Frijters et al., 2004).
One possible explanation for these recent findings, which appear at first sight
to contradict the Easterlin Paradox, is that relative, instead of absolute income, is what
determines utility. How individuals feel about their income depends on their income
relative to others around them, rather than their absolute income per se. Indeed, social
1

norms, social comparisons, and reference values influence individuals’ subjective
evaluation of their economic situation, weakening the relationship between income
and happiness one could observe based only on absolute income. As Clark and
Oswald (1996) show, using regression analysis and controlling for standard individual
and demographic characteristics, utility depends on income relative to some reference
or comparison income, based on the predicted income of ‘people like you’. Defining
the reference group to include those with similar education, similar age and living in
the same region, Ferrer-I-Carbonell (2005) finds that income of the reference group is
as important as own income for individuals’ happiness. McBride (2001) uses all
those in the same age group, within 5 years younger or older than the individual
concerned, while Easterlin (1995) implicitly assumes that individuals compare
themselves with all the other citizens of the same country. In an earlier study, Van de
Stadt et al. (1985) define the reference group according to education level, age and
employment status. Rizzo and Zeckhauser (2003) and Mas (2006) are notable
examples of recent studies highlighting the importance of reference points as
determinants of actual behavior.
An alternative explanation focuses on individuals’ comparisons with their own
income or economic situation in the past. As Easterlin (2001) argues, individuals
adapt to their economic circumstances so that changes in income have only transitory
effects on well-being. This is consistent with a large body of research in psychology
providing evidence of adaptation, following Brickman and Campbell’s (1971)
'hedonic treadmill' hypothesis. Although Van Praag (1971) and Van Praag and
Kapteyn (1973) were the first economists to explore this hypothesis, or, as they called
it, the “preference drift” phenomenon, the notion of adaptation was not embraced with
the same enthusiasm in the economics literature. Nevertheless, there is an increasing
2

consensus that understanding the process of adaptation and changing aspirations is
important for our understanding of economic behaviour (see Kahneman and Krueger,
2006.1 Recent evidence by Stutzer (2004) shows that higher income aspirations,
influenced by both individuals’ past income and the average income in their
community, reduce utility. Interestingly, Easterlin (2005) also finds that aspirations
about economic wealth and other pecuniary aspects of one’s well-being tend to
change with the level of actual circumstances, suggesting almost complete
adaptation.2 Clark et al. (2006) provide a comprehensive and insightful review of the
main issues in the debate about the relationship between income and happiness.
The study by Rojas (2007) is particularly notable, as it explains the weak
relationship between income and happiness using the conceptual-referent theory of
happiness (CRT). According to CRT, individuals have different notions about what a
happy life is and, therefore, different evaluations of their subjective well-being. As
Rojas argues, this heterogeneity in beliefs about a happy life extends to the
relationship between income and happiness. A weak relationship between income
and happiness may be explained partially by the fact that income might be less
important for individuals with conceptual referents for happiness with an inner
orientation, as opposed to an outer orientation.3
In this paper, we use data from the first two waves of the European Social
Survey (ESS) to examine the link between income and subjective well-being, as
measured by self-reported happiness and life satisfaction scores, across 19 European
1 The influence of past values of income and consumption on current levels of consumption or utility has also been incorporated into the recent main-stream economic literature on habit formation in investor and consumer behaviour (e.g., Abel, 1990; Campbell and Cochrane, 1999; Fuhrer, 2000). 2 In contrast, Easterlin (2005) finds that this is not the case with marriage, number of children and other non-pecuniary aspects of one’s life. 3 As Rojas (2007, p. 12) points out, individuals with an inner orientation tend to accept things as they are (stoicism), acting properly in their relations with others and with themselves, living a tranquil life, not looking beyond what is attainable.
3

countries. While many studies assume happiness and life satisfaction to be
synonymous, there is a considerable body of literature showing that measures of
happiness and satisfaction are not strongly correlated (see Cummings, 1998).4 In
general, life satisfaction refers to cognitive states of consciousness, whereas happiness
is emotional and mainly concerns intimate matters of life. Indeed recent evidence
(e.g., Gundelach and Kreiner, 2004) reinforces Michalos’s (1991) view that while
happiness and satisfaction form part of a subjective well-being construct, it is
heuristically useful to measure and analyse them separately.
After controlling for standard personal and demographic characteristics, our
emphasis is on assessing whether social comparisons and reference groups exert a
significant influence on individuals’ subjective well-being. Perhaps not surprisingly,
we find that absolute income has a positive effect on both happiness and life
satisfaction. Nevertheless, we also find that such a relationship weakens when we
include an individual’s reference income as an explanatory variable. Using two
different operational definitions of reference income, we find that this has a negative
impact on subjective well-being for the nineteen European countries as a whole. In
this respect, our results provide additional support to the idea of relative utility and the
importance of reference groups in influencing subjective evaluation of well-being.
Interestingly, performing separate analyses for some Eastern European countries, we
find some evidence that reference group’s income exerts a positive influence on
individual happiness and life satisfaction, which lends support to Hirschman’s (1973)
‘tunnel effect’ conjecture. Therefore, it seems that in these countries reference income
does not influence individuals’ well-being through social comparisons, but rather
4 It is worth noting that, whilst most studies find that the correlation between happiness and life satisfaction is in the range of 50 to 60 percent (e.g. Diener et al., 1995), other studies report much lower values for some population sub-groups.
4

through their informational content, which individuals use in order to form
expectations about their future economic situation.5
The layout of the remainder of the paper is as follows. Section 2 describes the
data and the empirical framework. Section 3 presents the empirical findings and
discusses their policy implications. Section 4 offers some concluding remarks.
2. Data and empirical framework
Our empirical analysis is based on data for nineteen European countries from the first
two waves (2003 and 2004) of the European Social Survey (ESS). The European
Commission, the European Science Foundation and scientific funding bodies in each
of the participating countries fund the ESS jointly. Data on the following 19 countries
are analyzed: Austria, Belgium, Czech Republic, Denmark, Finland, Germany,
Greece, Hungary, Ireland, Luxembourg, Netherlands, Norway, Poland, Portugal,
Slovenia, Spain, Sweden, Switzerland, and the United Kingdom.
The ESS data contains information on happiness and life satisfaction, the
dependent variables in our analysis, which allows us to test whether social
comparisons and reference groups exert an important influence on individuals’
subjective well-being. The question on life satisfaction is formulated as follows: “All
things considered, how satisfied are you with your life as a whole nowadays? Please
answer using this card, where 0 means extremely dissatisfied and 10 means extremely
satisfied.” Similarly, the question on happiness is: “Taking all things together, how
happy would you say you are?” with responses on a scale 0 to 10 with 0 Extremely
Unhappy and 10 Extremely Happy. We use these two variables as dependent
5 Senik (2004) is the first study to test formally the ‘tunnel effect’ hypothesis using large-scale data.
5

variables in our regressions.
Due to the ordinal nature of the happiness and life satisfaction variables, we
estimate ordered probit models, assuming that a latent and continuous measure of the
dependent variable, a proxy for utility, is given by:
, (1) iii ezS += '* β
where is a vector of explanatory variables describing individual and firm
characteristics,
iz
β is a vector of parameters to be estimated and is a random error
term, normally distributed.
ie
The observed and coded discrete dependent variabl iS is determined from
the model as follow
e
s:
⎪⎪⎪⎪⎪
⎩
⎪⎪⎪⎪⎪
⎨
⎧
∞≤<
≤<
≤<
≤≤∞−
=
*10
3*
2
2*
1
1*
10
.
.
.2
1
0
i
i
i
i
i
Sif
Sif
Sif
Sif
S
µ
µµ
µµ
µ
(1a)
where iµ represents thresholds to be estimated (along with the parameter vector β ).
Positive signs for the estimated parameters β indicate higher levels of life
satisfaction as the value of the associated variable increases.6
The ESS data provides also information on a rich set of standard demographic
and labour market characteristics that we use as controls in our life satisfaction and
happiness regressions. Such controls include personal characteristics, education,
6 For a discussion of the ordered probit model see McKelvey and Zavoina (1975)
6

labour force status, establishment size, income and health. Information on past
unemployment experience is also used to evaluate whether individuals’ perceptions
about their current economic situation is influenced by past income shocks, usually
associated with unemployment. To measure reference income, our main variable of
interest, we use two main proxies. First, following McBride (2001), we define the
reference group to include all individuals who are in the age range of 5 years younger
and 5 years older than the individual concerned (Proxy 1). Second, we define the
reference group to contain all individuals with a similar education level, inside the
same age bracket, and living in the same country, as suggested by Ferrer-i-Carbonnell
(2005). Education is divided into five different categories according to the highest
educational attainment: up to primary school, lower secondary, upper secondary, post
secondary but not tertiary and tertiary and beyond. The age brackets are: younger
than 25, 25–34, 35–44, 45–65, and 66 or older. We refer to this measure of reference
income as Proxy 2.7 The definitions and sample means of all variables used in our
analysis are in Appendix 1. We limit our sample to full-time salaried employees,
which yields 30,285 observations fairly equally split between 2002 and 2004.
Appendix 2 shows the number of observations by country and by year.
Figure 1 shows the distribution of happiness and life satisfaction for the 19
European countries under consideration. Clearly there is a close, but non-exact,
correlation between happiness and life satisfaction. Both measures indicate a high
level of happiness or satisfaction among the respondents from the 19 participating EU
countries, with the mode well-being score of 8. The distribution of happiness is also
clearly skewed towards the high end. Moreover, there is little variation in the
expression of happiness over the two reporting periods.
7 These measures of reference income are based on a “cell means” approach. An alternative approach
7

However, once we examine the level of happiness across countries, then some
variations start to emerge, as shown in Figure 2. Using either measure, Denmark
achieved the highest score at over 8, whilst Greece, Hungary, Poland and Portugal
recorded the lowest scores during the reporting periods. In general, Western
European countries score higher than Eastern European ones. Such differences are
apparent also in Appendix 3, reporting the mean scores of life satisfaction and
happiness. Although the comparability of responses across individuals in different
countries might call for caution in interpreting these stylised facts, mounting evidence
supports the use and reliability of subjective well-being variables in economic
research (see Clark et al., 2006). As Clark (2005) asserts, a small body of research in
economics and psychology finds evidence of causation between the cross-sectional
distribution of subjective scores and subsequent labour market outcomes.
3. Empirical findings
Table 1 reports the results for life satisfaction regressions. Column (1) reports the
regression results with reference income being excluded as an explanatory variable.
As the estimated coefficients in column 1 show, the results are generally consistent
with those of previous studies and hardly surprising. As the estimated coefficients
reveal, men tend to report lower satisfaction than women, while life satisfaction
exhibits a U-shaped relationship with age. This is a pattern, well documented in the
literature, reflecting life-cycle aspects of individuals’ social, family and economic
circumstances (e.g. Alesina et al., 2004; Blanchflower and Oswald, 2004;
is to use a regression approach as introduced by Clark and Oswald (1996). For a summary of the various methods to calculate reference income in the literature, see Clark et al. (2006).
8

Blanchflower and Oswald, 2006).8 Being married has a positive effect on life
satisfaction, while the opposite is true for divorce, separation and widowhood. The
results also reveal a negative effect of the presence of children on life satisfaction. As
expected, good health has a significant positive effect. There is some weak evidence
that higher education qualifications tend to exert a negative impact on life satisfaction,
with the estimated coefficient of ‘Post tertiary’ education being negative and
statistically significant. This result is similar to the findings in earlier studies such as
Campbell et al. (1976) and Fernandez and Kulik (1981). A possible explanation could
be that education raises aspirations not easily fulfilled. There is no clear pattern in the
link between life satisfaction and firm size.
Past unemployment has a positive effect on life satisfaction, with such an
effect being stronger for more recently experienced unemployment (in the last twelve
months) as opposed to unemployment in the more distant past (in the last five years).
It is possible that the well-being of the currently employed exceeds their reference or
aspiration value, which may have been reduced by the recently experienced
unemployment shock.9 As countries with generous social welfare systems dominate
our sample, the positive effect of unemployment on happiness may reflect also the
influence of social welfare systems on individual well-being during the period of
unemployment. For example, in countries with poor social protection, unemployment
is expected to have a stronger negative impact on individual wellbeing, a conjecture
supported by running separate regressions for sub-groups of countries with different
levels of social protection. The effect of recent unemployment (in the past 12
8 For a review of the factors that affect subjective well-being over the life cycle see Easterlin (2006). 9 Clark et al (2001) find that unemployment experience in the past three years reduces life satisfaction of the currently employed (i.e. unemployment ‘scars’ psychologically). However, they also find some evidence of habituation - people may get used to unemployment. According to Lucas et al. (2004), adaptation to unemployment is slow and incomplete.
9

months) on well-being is strongly positive and statistically significant for the
Scandinavian countries, and weakly positive but statistically insignificant for the
Western European countries. In contrast, such an effect is very weakly positive and
statistically insignificant for the Southern European countries, and strongly negative
and statistically significant for the Eastern European countries. Differences regarding
the negative well-being effect of unemployment across European countries can be
attributed also to differences in the extent to which unemployment across these
countries has become a social norm.10
Higher absolute income is associated with higher life satisfaction, with a clear
pattern of the estimated coefficients for incomes above the income bracket above 350-
460 Euros (the omitted category) being positive and statistically significant, while the
coefficients for incomes below the 350 Euros being negative. Therefore, it appears
that, across Europe, “income buys happiness”.11 In columns (2) and (3), we re-
examine this conjecture by controlling for relative income, and to assess the extent at
which comparison effects may weaken the link between income and happiness. As
shown in column (2), reference income (Proxy 1) has a negative and significant
effect, suggesting that comparison effects in life satisfaction are present. The same
result emerges using an alternative proxy for relative income (Proxy 2) in column (3).
In Table 2, we repeat the analysis using self-reported happiness scores as the
dependent variable instead of life satisfaction. Results are generally similar to those
for life satisfaction in Table 1, with only slight differences in the size of the estimated
10 This is a point that Clark (2005) makes convincingly with evidence that supports the view that the negative well-being effect of unemployment is less severe, when unemployment has become more socially acceptable. Our findings of a significantly negative effect of unemployment on happiness for Eastern European countries are very similar to the findings in Hayo and Seifert (2003). 11 Focusing on Eastern European countries, Hayo and Seifert (2003) find a strong link between life satisfaction and subjective economic well-being.
10

coefficients. It is worth noting, for example, that income coefficients in the happiness
regression tend to be ‘smaller’ than those in the life satisfaction regressions. This is
consistent with the view that happiness is “ a broader” concept than life satisfaction,
with perhaps the impact of economic factors on happiness being mitigated by the
influence of factors affecting individuals’ well-being in the life domain. In this
respect, the larger coefficient of being married (a positive life event/state) in the
happiness regression compared to that in the life satisfaction regression is not
surprising. In the same spirit, the negative coefficient for the presence of children is
smaller than that in Table 1. Interestingly, comparison effects are stronger in the case
of happiness than in the case of life satisfaction regressions. As reported in columns
(2) and (3), the estimated coefficients of reference income are significantly higher
than those in Table 1.
When repeating the analysis, by limiting our sample to the Eastern European
countries (see Table 3) any evidence of comparison effects seems to disappear. This
effect is more prominent in Table 4, where we re-estimate the happiness regression
for the Eastern European countries. In this case, there is some evidence not only that
comparison effects disappear, but also that reference income exerts a positive and
significant effect on happiness, suggesting the presence of a “tunnel effect” (see
Senic, 2004). The rapid growth of income that certain segments of the population
experienced during the period of economic transition increased the expectations of the
remainder of the population for higher incomes in the future. In a sense, pockets of
high income and prosperity in the economy offer an optimistic outlook for those who
are yet to catch up. As Hayo and Seifert (2003) highlight, during the early 1990s,
there was a general climate of optimism among Eastern Europeans that their
economic situation would improve, or at least not deteriorate, in the next five years.
11

During these early years of reform, catching-up with the well-being levels of
industrialised countries would dominate any relative income effects. Therefore, one
should expect that such “tunnel effects” might be short-lived as those at the lower end
of the income distribution realise that the gap between their economic position and
that of the high earners widens without any prospects of ever catching up with them.
If this conjecture is valid, then in the economies of transition in Eastern Europe we
should expect ‘tunnel effects’ to be more prominent during the early years of
economic reform and starting to weaken as time passes by in a non-monotonic
fashion. Given that our sample is based on data almost ten years after the ex-
communist Eastern European countries embarked on a programme of economic
reforms towards free market economies, evidence of ‘tunnel effects’ might not be as
strong as ‘tunnel effects’ in the earlier years of economic transition.
4. Conclusions
In recent years, support for the notion that reference values are important in affecting
individuals’ behaviour has become widespread both in the psychology and the
economics literature. Economists, in particular, tend to agree that the decision makers
evaluate the options available to them not on the basis of absolute values of wealth or
welfare but on relative values instead, implying that utility is relative in nature. Van
de Stadt et. al. (1985) provide some early evidence consistent with the relative utility
hypothesis, while, more recently, Clark and Oswald (1996) show that utility depends
on income relative to some reference or comparison income. In the same vein, Ferrer-
I-Carbonell (2005) provides evidence that reference income is as important as own
income for individuals’ happiness.
12

In this paper, we have re-examined the link between income and subjective
well-being for a number of European countries, paying particular attention to whether
relative income is indeed an important determinant of subjective well-being. Our
results tend to support the relative utility hypothesis, in that the income of a reference
group exerts a negative effect on well-being, even after controlling for absolute
income and other personal and demographic characteristics. More intriguing,
perhaps, is the fact that such social comparison effects tend to disappear when we
limit our analysis to the Eastern European countries. In the case of Eastern Europe,
reference income has a positive effect on happiness, consistently with the presence of
a ‘tunnel effect’. To the extent that the ‘pursuit of happiness’ enters the political
agenda, our results highlight the existence of a clear wedge between Western and
Easter European countries that can have important implications for the design of
welfare reforms and income redistribution policies. If, as our results seem to imply,
an increasing income gap between the rich and poor reduces well-being due to social
comparisons, alleviating income inequality moves higher up in the policy agenda. In
contrast, if higher inequality raises the expectations of the poor that they are to enjoy
higher incomes in the future (i.e. ‘tunnel effect’), then increased income inequality
during rapid growth at the early stages of reforms becomes socially and politically
more acceptable.
13

References
Abel, A.B. (1990). Asset Prices under Habit Formation and Catching up with the
Joneses. American Economic Review, 80(2), 38-42.
Alesina, A., DiTella, R., & MacCulloch, R. (2004). Inequality and happiness: Are
Europeans and Americans different? Journal of Public Economics, 88, 2009-
2042.
Blanchflower, D., & Oswald, A. (2004). Wellbeing over time in Britain and the USA.
Journal of Public Economics, 88, pp. 1359-1386.
Blanchflower, D., & Oswald, A. (2006). Is Wellbeing U-shaped over the life cycle?,
mimeo, University of Warwick.
Brickman, P., & Campbell, D. (1971). Hedonic relativism and planning the good
society. In: Appley, M.H. (Ed.): Adaptation-level theory: A symposium.
Academic Press, New York.
Brickman, P., Coates, D., & Janoff-Bulman, R. (1978). Lottery winners and accident
victims: is happiness relative? Journal of Personality and Social Psychology
36, 917-927.
Campbell, J., & Cochrane, J. H. (1999). By Force of Habit: A Consumption-Based
Explanation of Aggregate Stock Market Behavior. Journal of Political
Economy, 107(2), 205 - 51.
Campbell, A., Converse, P.E. & Rogers, W.L. (1976). The Quality of American Life:
Perceptions, Evaluations, and Satisfactions, Russel Sage, New York.
Clark, A. (2005). Your money or your life: Changing job quality in OECD countries,
British Journal of Industrial Relations 43, 377-400.
Clark, A. & Oswald, A. (1996). Satisfaction and comparison income. Journal of
Public Economics, 61, 359-81.
14

Clark, A. (2000). Is Utility Absolute or Relative? Revue Economique 51: 459-71.
Clark, A., Frijters, P., & Shields, M. (2006). Income and happiness: Evidence,
Explanations and Economic Implications, working paper, PSE, Paris.
Clark, A., Georgellis, Y., & Sanfey, P. (2001). Scarring: The Psychological Impact of
Past Unemployment. Economica, 68 (270): 221-42.
Cummings, R. (1998). The second approximation to an international standard for life
satisfaction. Social Indicators Research, 43, 307–334.
Diener, E., Sandvik, E., Seidlitz, L., & Diener, M. (1993). The relationship between
income and subjective wellbeing: Relative or absolute? Social Indicators
Research, 28, 195–223.
Diener, E., Diener, M., & Diener, C. (1995). Factors predicting the subjective well-
being of nations. Journal of Personality and Social Psychology, 69, 851–864.
Duesenberry, J. S. (1949). Income, Saving and the Theory of Consumer Behavior,
Harvard, University of Harvard Press.
Easterlin, R. (1974). Does economic growth improve the human lot? Some empirical
evidence. In P. A. David & M. W. Reder (Eds), Nations and households in
economic growth (pp.89-125). Academic Press.
Easterlin, R. (1995). Will raising the income of all increase the happiness of all?
Journal of Economic Behavior and Organization, 27(1): 35-47.
Easterlin, R. (2001). Income and happiness: Toward a unified theory. Economic
Journal 111, 464-84.
Easterlin, R. (2005). A puzzle for adaptive theory. Journal of Economic Behavior
and Organization 56, 513-21.
15

Easterlin, R. (2006). Life cycle happiness and its sources: Intersections of
psychology, economics and demography. Journal of Economic Psychology
27, 463-482.
Fernandez, R., Kulik, J. (1981). A Multilevel Model of Life satisfaction: Effects of
Individual Characteristics and Neighborhood Composition. American
Sociological Review, 46, 840-50.
Ferrer-i-Carbonell, A. (2005). Income and well being: an empirical analysis of the
comparison income effect. Journal of Public Economics, 89, 997-1019.
Frey, B., & Stutzer, A. (2000). Happiness, economy and institutions. Economic
Journal, 110, 918–938.
Frijters, P., Haisken-DeNew, J.P., & Shields, M.A. (2004). Money Does Matter!
Evidence from Increasing Real Income and Life Satisfaction in East Germany
Following Reunification. American Economic Review, 94(3), 730-740.
Furher, J.C. (2000). Habit Formation in Consumption and Its Implications for
Monetary-Policy Models. American Economic Review, 90(3), 367-90.
Gundelach, P., & Kreiner, S. (2004). Happiness and life satisfaction in advanced
European countries. Cross-Cultural Research, 38(4): 359-386.
Hayo, B., & Seifert, W. (2003). Subjective economic well-being in Eastern Europe.
Journal of Economic Psychology, 24, 329-348.
Heady, B. (1991). An economic model of subjective well-being: Integrating
economic and psychological theories. Social Indicators Research, 28, 97–
116.
Hirschman, A. (1973). The changing tolerance for income inequality in the course of
economic development. Quarterly Journal of Economics 87(4), 544–566.
16

Kahneman, D., & Tversky, A. (1979). Prospect theory: an analysis of decision under
risk. Econometrica, 47, 263-291.
Kahneman, D., & Krueger, A. (2006). Developments in the Measurement of
Subjective Well-being. Journal of Economic Perspectives, 20(1), 3-24.
Lucas, R., Clark, A., Georgellis, Y., & Diener, E. (2004). Unemployment alters the
set point of life satisfaction. Psychological Science, 15(1), 8-13.
Mas, A. (2006). Pay, reference points, and police performance. Quarterly Journal of
Economics, 121(3): 783-821.
McBride, M. (2001). Relative-income effects on subjective well-being in the cross-
section. Journal of Economic Behavior and Organization, 45, 251-78.
McKelvey, R., & Zavoina, W. (1975). A statistical model for the analysis of ordinal
level dependent variables. Journal of Mathematical Sociology, 4, 103-20.
Michalos, A. C. (1991). Global report on student well-being, Vol.: Life Satisfaction
and Happiness (Springer Verlag, New York).
Rizzo, J., & Zeckhauser, R. (2003). Reference incomes, loss aversion, and physician
behavior. Review of Economics and Statistics, 85, 909-22.
Rojas, M. (2007). Heterogeneity in the relationship between income and happiness:
A conceptual-referent-theory explanation. Journal of Economic Psychology,
28, 1-14.
Senic, C. (2004). When information dominates comparison: Learning from Russian
subjective panel data. Journal of Public Economics, 88, 2099-2123.
Solberg, E.C., Diener, E., Wirtz, D., & Lucas, R. (2002). Wanting, having, and
satisfaction: Examining the role of desire discrepancies in satisfaction with
income. Journal of Personality and Social Psychology 83, 725-34.
17

Stutzer, A. (2004). The role of income aspirations in individual happiness. Journal of
Economic Behavior and Organization, 54, 89-109.
Van de Stadt, H., Kapteyn, A., & van de Geer, S. (1985). The relativity of utility:
Evidence from panel data. Review of Economics and Statistics, 67(2), 179-87.
Van Praag, B.M.S., (1971). The welfare function of income in Belgium: An empirical
investigation. European Economic Review, 2, 337-69.
Van Praag, B.M.S. & Ferrer-i-Carbonell, A. (2004), Happiness quantified: A
satisfaction calculus approach. Oxford University Press.
Van Praag, B.M.S. &, Kapteyn, A. (1973). Further evidence on the individual
welfare function of income: An empirical investigation in the Netherlands.
European Economic Review, 4, 33-62.
18

Table 1: Life satisfaction regressions (Ordered probit)
(1) (2) (3) Coeff. |t-ratio| Coeff. |t-ratio| Coeff. |t-ratio| Male -0.123 10.16 -0.124 10.18 -0.123 10.17 Age -0.042 13.08 -0.028 3.62 -0.034 8.07 Age2 0.050 14.86 0.033 3.76 0.041 9.09 Married 0.212 11.37 0.213 11.43 0.212 11.39 Separated -0.288 5.95 -0.287 5.91 -0.287 5.93 Divorced -0.067 2.61 -0.065 2.53 -0.066 2.54 Widowed -0.066 1.98 -0.066 1.98 -0.067 2.01 Children -0.027 1.87 -0.026 1.80 -0.027 1.87 Good Health 0.358 46.19 0.358 46.16 0.358 46.18 EDUCATION Low Secondary -0.005 0.20 -0.004 0.18 0.051 1.63 High Secondary -0.028 1.22 -0.029 1.24 0.077 1.71 Post Secondary -0.011 0.35 -0.011 0.35 0.132 2.17 Tertiary -0.022 0.86 -0.023 0.89 0.163 2.24 Post Tertiary -0.058 1.78 -0.059 1.80 0.128 1.69 UNEMPLOYMENT In the last 12 months 0.023 3.40 0.023 3.40 0.023 3.38 In the last 5 years 0.009 1.38 0.009 1.37 0.010 1.41 FIRM SIZE 25-99 0.023 1.52 0.023 1.52 0.023 1.52 100-499 -0.002 0.11 -0.002 0.14 -0.002 0.14 500++ 0.004 0.20 0.003 0.17 0.003 0.16 INCOME[weekly] < 40 Euros -0.481 7.68 -0.483 7.70 -0.481 7.68 Euros 40-70 -0.328 8.20 -0.328 8.20 -0.328 8.21 Euros70-120 -0.226 6.96 -0.226 6.95 -0.226 6.95 Euros 120-230 -0.150 5.74 -0.151 5.75 -0.150 5.73 Euros 230-350 -0.063 2.61 -0.062 2.59 -0.062 2.60 Euros 460-580 0.042 1.76 0.043 1.80 0.043 1.80 Euros 580-690 0.118 4.80 0.119 4.84 0.119 4.84 Euros 690-1150 0.153 6.69 0.154 6.76 0.155 6.78 Euros 1150-1730 0.209 7.18 0.212 7.27 0.213 7.30 Euros 1730-2310 0.187 4.19 0.190 4.23 0.191 4.27 > 2310 Euros 0.221 3.77 0.223 3.81 0.225 3.85 REFERENCE INCOME Proxy 1 -0.077 1.96 Proxy 2 -0.067 2.72 Year dummy 2004 -0.018 1.47 -0.015 1.18 -0.018 1.42 Country Dummies Yes Yes Yes Log-likelihood -56788.39 -56786.88 -56786.08 Number of observations 30285 30285 30285
Notes:
19

Table 2: Happiness regressions (Ordered probit)
(1) (2) (3) Coeff. |t-ratio| Coeff. |t-ratio| Coeff. |t-ratio| Male -0.122 10.06 -0.123 10.08 -0.122 10.06 Age -0.040 12.48 -0.022 2.79 -0.028 6.65 Age2 0.043 12.85 0.021 2.40 0.030 6.61 Married 0.322 17.25 0.324 17.33 0.323 17.28 Separated -0.249 5.11 -0.246 5.07 -0.247 5.08 Divorced -0.055 2.11 -0.052 2.01 -0.052 2.01 Widowed -0.185 5.56 -0.185 5.56 -0.186 5.62 Children -0.017 1.18 -0.016 1.08 -0.017 1.18 Good Health 0.348 44.73 0.347 44.70 0.348 44.72 EDUCATION Low Secondary 0.024 1.00 0.025 1.03 0.111 3.50 High Secondary -0.037 1.61 -0.038 1.63 0.125 2.77 Post Secondary -0.070 2.29 -0.070 2.28 0.151 2.47 Tertiary -0.053 2.06 -0.054 2.10 0.234 3.20 Post Tertiary -0.092 2.81 -0.093 2.83 0.196 2.58 UNEMPLOYMENT In the last 12 months 0.018 2.69 0.018 2.69 0.018 2.66 In the last 5 years 0.006 0.84 0.006 0.84 0.006 0.89 FIRM SIZE 25-99 0.014 0.92 0.014 0.92 0.014 0.91 100-499 -0.005 0.29 -0.005 0.32 -0.005 0.32 500++ 0.002 0.13 0.002 0.09 0.001 0.07 INCOME[weekly] < 40 Euros -0.310 4.95 -0.312 4.98 -0.310 4.95 Euros 40-70 -0.269 6.71 -0.269 6.71 -0.270 6.73 Euros70-120 -0.189 5.79 -0.188 5.78 -0.188 5.79 Euros 120-230 -0.116 4.41 -0.116 4.43 -0.116 4.40 Euros 230-350 -0.050 2.08 -0.050 2.06 -0.050 2.07 Euros 460-580 0.039 1.62 0.041 1.68 0.041 1.69 Euros 580-690 0.093 3.79 0.094 3.84 0.095 3.84 Euros 690-1150 0.086 3.77 0.089 3.87 0.090 3.92 Euros 1150-1730 0.165 5.68 0.169 5.79 0.171 5.87 Euros 1730-2310 0.102 2.27 0.105 2.33 0.108 2.40 > 2310 Euros 0.114 1.95 0.118 2.01 0.122 2 .08 REFERENCE INCOME Proxy 1 -0.103 2.61 Proxy 2 -0.103 4.20 Year dummy 2004 -0.013 1.05 -0.008 0.67 -0.012 0.98 Country Dummies Yes Yes Yes Log-likelihood -53516.82 -53513.88 -53509.81 Number of observations 30285 30285 30285
Notes:
20

Table 3: Life satisfaction regressions: Eastern Europe (Ordered probit)
(1) (2) (3) Coeff. |t-ratio| Coeff. |t-ratio| Coeff. |t-ratio| INCOME[weekly] < 40 Euros -0.705 7.18 -0.708 7.21 -0.704 7.17 Euros 40-70 -0.458 6.26 -0.459 6.27 -0.458 6.26 Euros70-120 -0.279 4.23 -0.279 4.22 -0.279 4.23 Euros 120-230 -0.172 2.76 -0.172 2.76 -0.172 2.76 Euros 230-350 -0.037 0.55 -0.036 0.54 -0.037 0.55 Euros 460-580 -0.023 0.25 -0.023 0.25 -0.023 0.25 Euros 580-690 0.064 0.52 0.066 0.53 0.064 0.51 Euros 690-1150 -0.009 0.07 -0.011 0.09 -0.009 0.07 Euros 1150-1730 -0.384 1.64 -0.393 1.68 -0.384 1.64 Euros 1730-2310 0.421 1.23 0.429 1.25 0.421 1.23 > 2310 Euros -0.342 0.58 -0.332 0.56 -0.342 0.58 REFERENCE INCOME Proxy 1 0.096 0.99 Proxy 2 0.008 0.87 Log-likelihood -10214.02 -10213.53 -10214.02 Number of observations 4913 4913 4913
Notes: Other regressors as in Table 1.
21

Table 4: Happiness regressions: Eastern Europe (Ordered probit)
(1) (2) (3) Coeff. |t-ratio| Coeff. |t-ratio| Coeff. |t-ratio| INCOME[weekly] < 40 Euros -0.349 3.57 -0.349 3.57 -0.353 3.61 Euros 40-70 -0.235 3.21 -0.235 3.21 -0.236 3.22 Euros70-120 -0.155 2.34 -0.155 2.34 -0.155 2.34 Euros 120-230 -0.090 1.44 -0.090 1.44 -0.089 1.42 Euros 230-350 0.002 0.03 0.002 0.03 0.002 0.03 Euros 460-580 0.157 1.69 0.157 1.69 0.158 1.71 Euros 580-690 0.088 0.71 0.088 0.71 0.092 0.74 Euros 690-1150 0.080 0.61 0.080 0.62 0.079 0.61 Euros 1150-1730 -0.144 0.61 -0.144 0.61 -0.146 0.62 Euros 1730-2310 0.411 1.20 0.410 1.19 0.412 1.20 > 2310 Euros -0.248 0.42 -0.248 0.42 -0.235 0.40 REFERENCE INCOME Proxy 1 0.065 1.65 Proxy 2 0.073 1.63 Log-likelihood -9623.48 -9622.48 -9622.84 Number of observations 4913 4913 4913
Notes: Other regressors as in Table 1.
22

APPENDIX 1: Variables definitions and sample means
Definition Mean 2002 2004 Male Dummy Variable: 1=Male; 0 otherwise. 0.499 0.493 Age Age in years. 45.853 48.238 Married Dummy Variable: 1=Married; 0 otherwise. 0.616 0.611 Separated Dummy Variable: 1=Separated; 0 otherwise 0.016 0.016 Divorced Dummy Variable: 1=Divorced; 0 otherwise. 0.087 0.090 Widowed Dummy Variable: 1=Widowed; 0 otherwise. 0.051 0.051 Never Married Dummy Variable: 1=Never Married; 0 otherwise. 0.227 0.229 Children Dummy Variable: 1=Children in household; 0 otherwise. 0.466 0.457
Good Health Subjective General Health, Ordinal Variable: 1=Very Bad, 2=Bad, 3=Fair, 4=Good, 5=Very Good 3.874 3.888
EDUCATION Primary Dummy Variable: 1=Primary; 0 otherwise. 0.116 0.132 Low Secondary Dummy Variable: 1=Low Secondary; 0 otherwise. 0.204 0.177 High Secondary Dummy Variable: 1=High Secondary; 0 otherwise. 0.377 0.392 Post Secondary Dummy Variable: 1=Post Secondary; 0 otherwise. 0.086 0.062 Tertiary Dummy Variable: 1=Tertiary; 0 otherwise. 0.160 0.193 Post Tertiary Dummy Variable: 1=Post Tertiary; 0 otherwise. 0.061 0.056 UNEMPLOYMENT In the last 12 months Number of periods of unemployment within last 12 months. 4.615 4.606 In the last 5 years Number of periods of unemployment within last 5 years. 4.734 4.615 FIRM SIZE Less than 25 Dummy Variable: 1= Less than 25 employees; 0 otherwise 0.198 0.210 25-99 Dummy Variable: 1= Between 25-99 employees; 0 otherwise. 0.245 0.253 100-499 Dummy Variable: 1= Between 100-499 employees; 0 otherwise. 0.198 0.188 500++ Dummy Variable: 1= More than 500 employees; 0 otherwise. 0.158 0.136 INCOME [weekly] (Household's Total Net Income, All Sources) < 40 Euros Dummy Variable: 1=Less than 40 Euros; 0 otherwise. 0.015 0.005 Euros 40-70 Dummy Variable: 1=Between 40-70 Euros; 0 otherwise. 0.040 0.026 Euros70-120 Dummy Variable: 1=Between 70-120 Euros; 0 otherwise. 0.064 0.054 Euros 120-230 Dummy Variable: 1=Between 120-230 Euros; 0 otherwise. 0.107 0.106 Euros 230-350 Dummy Variable: 1=Between 230-350 Euros; 0 otherwise. 0.125 0.113 Euros 350-460 Dummy Variable: 1=Between 350-460 Euros; 0 otherwise. 0.125 0.124 Euros 460-580 Dummy Variable: 1=Between 460-580 Euros; 0 otherwise. 0.121 0.113 Euros 580-690 Dummy Variable: 1=Between 580-690 Euros; 0 otherwise. 0.111 0.122 Euros 690-1150 Dummy Variable: 1=Between 690-1150 Euros; 0 otherwise. 0.184 0.208 Euros 1150-1730 Dummy Variable: 1=Between 1150-1730 Euros; 0 otherwise. 0.072 0.086 Euros 1730-2310 Dummy Variable: 1=Between 1730-2310 Euros; 0 otherwise. 0.020 0.024 > 2310 Euros Dummy Variable: 1=More than 2310 Euros; 0 otherwise. 0.010 0.013 REFERENCE INCOME
Proxy 1 All individuals who are in the age range of 5 years younger and 5 years older than the individual concerned, (by year by country) 6.347 6.368
Proxy 2 All individuals with a similar education level, inside the same age bracket, and living in the same country (by year) 6.428 6.464
23

Appendix 2. ESS 2002-2004: Number of Employees in European Countries
COUNTRIES 2002 2004 Total Austria 865 714 1579 Belgium 821 841 1662 Switzerland 1061 1084 2145 Czech Republic 424 970 1394 Germany 1529 1305 2834 Denmark 881 783 1664 Spain 341 414 755 Finland 1047 1082 2129 Britain 634 519 1153 Hellas 535 383 918 Hungary 437 359 796 EIRE 748 616 1364 Luxemburg 546 608 1154 Netherlands 1335 968 2303 Norway 1333 1067 2400 Poland 818 636 1454 Portugal 515 537 1052 Sweden 1144 1116 2260 Slovenia 685 584 1269 Total 16577 13708 30285
24

APPENDIX 3. Average Life Satisfaction and Happiness LIFE SATISFACTION HAPPINESS
COUNTRIES 2002 2004 2002 2004 Austria 7.570 7.323 *** 7.608 7.437 * Belgium 7.471 7.374 *** 7.782 7.704 ** Switzerland 7.956 7.977 7.986 8.036 Czech Republic 6.296 6.318 ** 6.710 6.782 * Germany 6.780 6.699 ** 7.144 7.091 * Denmark 8.482 8.504 8.359 8.344 Spain 6.904 7.165 ** 7.268 7.332 * Finland 7.891 7.980 * 8.035 8.059 * Britain 7.012 7.001 * 7.517 7.483 Hellas 6.219 6.346 * 6.390 6.702 *** Hungary 5.519 5.539 * 6.244 6.319 *** Ireland 7.459 7.687 ** 7.893 7.936 *** Luxembourg 7.751 7.666 * 7.878 7.698 ** Netherlands 7.616 7.434 * 7.791 7.649 * Norway 7.783 7.665 * 7.897 7.900 Poland 5.754 6.122 *** 6.383 6.658 ** Portugal 5.653 5.408 ** 6.773 6.439 ** Sweden 7.786 7.860 ** 7.873 7.854 * Slovenia 6.494 6.911 ** 6.900 7.215 ** * : significant different by year at the 10% level; ** : significant different by year at the 5% level; *** : significant different by year at the 01% level
25
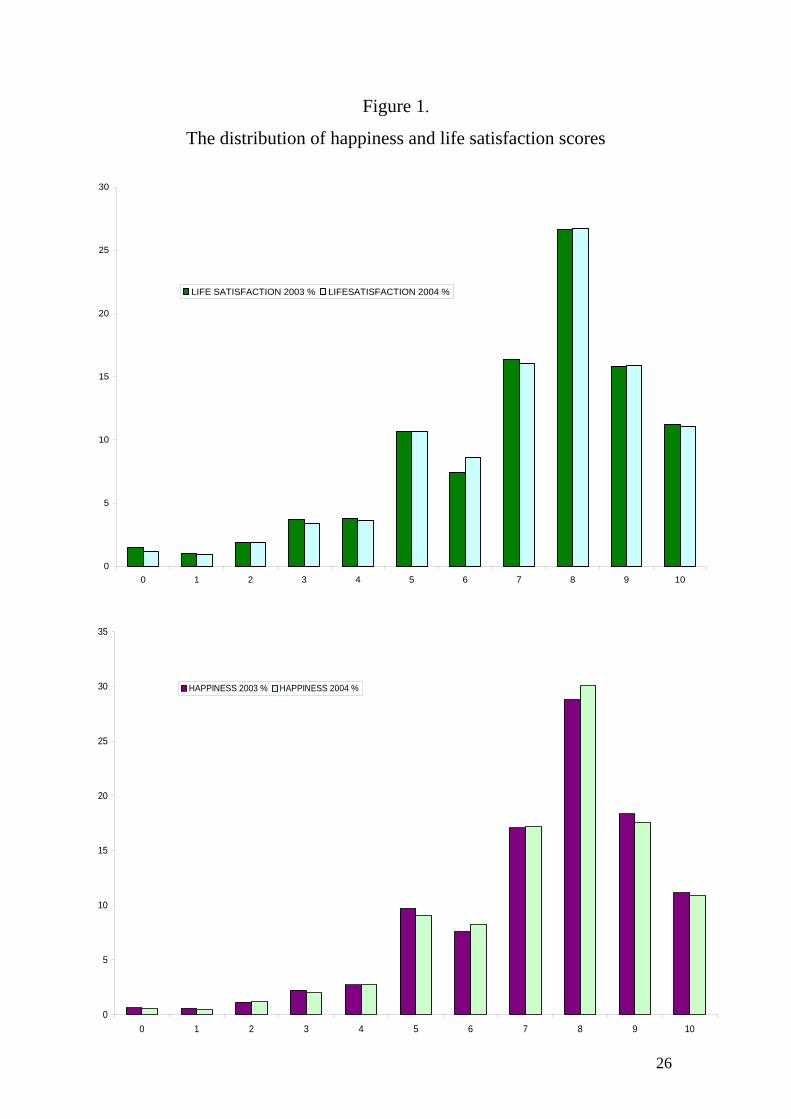
Figure 1.
The distribution of happiness and life satisfaction scores
0
5
10
15
20
25
30
0 1 2 3 4 5 6 7 8 9 10
LIFE SATISFACTION 2003 % LIFESATISFACTION 2004 %
0
5
10
15
20
25
30
35
0 1 2 3 4 5 6 7 8 9 10
HAPPINESS 2003 % HAPPINESS 2004 %
26

Figure 2.
Income and subjective well-being across Europe
0
1
2
3
4
5
6
7
8
9
AUT BEL CH CZE DEU DNK ESP FIN GB HEL HUN IRL LU NTL NOR POL PRT SVE SLO
LIFESATISFACTION 2003 LIFE SATISFACTION 2004
0
1
2
3
4
5
6
7
8
9
AUT BEL CH CZE DEU DNK ESP FIN GB HEL HUN IRL LU NTL NOR POL PRT SVE SLO
HAPPINESS 2003 HAPPINESS 2004
27