LEADing to a Better World and Customer Happiness
324
LEADing to a Better World and Customer Happiness KB Financial Group Annual Report 2019 Toward the Shared Goal of Sustainability KB Insurance KB Credit Information KB Kookmin Bank KB Life Insurance KB Data Systems KB Investment KB Asset Management KB Securities KB Savings Bank KB Real Estate Trust KB Kookmin Card KB Capital
-
Upload
khangminh22 -
Category
Documents
-
view
0 -
download
0
Transcript of LEADing to a Better World and Customer Happiness

LEADing to a Better World and Customer Happiness
KB Financial Group Annual Report
2019
Toward the Shared Goal of Sustainability
KB Insurance
KB Credit Information
KB Kookmin Bank
KB Life Insurance
KB Data Systems
KB Investment
KB Asset Management
KB Securities
KB Savings Bank
KB Real Estate Trust
KB Kookmin Card
KB Capital

KB Financial Group Annual Report 2019 L.E.A.D. 2020
CEO Message
Company Profile
Financial Highlights
Shareholder Information
Vision & Strategy
Corporate Governance
Awards & Recognitions
002
010
014
016
018
020
022
025
INTRODUCTION
Risk Management
Synergy Creation
Digital Finance
Global Business
ESG Management
Social Contribution
027
030
032
036
040
043
CORE COMPETENCY
KB Kookmin Bank
KB Securities
KB Insurance
KB Kookmin Card
KB Asset Management
KB Capital
KB Life Insurance
KB Real Estate Trust
KB Savings Bank
KB Investment
KB Data Systems
KB Credit Information
054
060
062
064
066
067
068
069
070
071
072
073
OPERATION REVIEW
FINANCIAL SECTION
Consolidated Financial Statements
Separate Financial Statements
075
256
APPENDIX
Company Directory
Overseas Network
Forward Looking Statements
317
317
320
MANAGEMENT'S DISCUSSION & ANALYSIS
048

LEADing to a Better World and Customer HappinessToward the Shared Goal of Sustainability
In 2019, KB Financial Group solidified its position as a leading financial group taking another step forward in establishing a truly One-Firm KB framework by leveraging the organic collaboration among its 12 subsidiaries to deliver more convenient financial services and greater customer satisfaction from the customer-centric perspective.
In 2019, KB Financial Group’s total assets posted a KRW 38.9 trillion YoY growth to KRW 518.5 trillion, and its net income amounted to KRW 3,311.8 billion, which made the group the first in the domestic financial industry to exceed the KRW 3 trillion mark in net income for three consecutive years. With more than 34 million customers that we serve at the group-wide level, we are further consolidating our position as Korea’s leading financial group.
Looking to 2020, KB Financial Group will remain true to its mission of ‘Financial Services Delivering Changes - Happier Life & Better World’ in order to maximize customer value as their lifelong financial partner and establish its status as an unrivaled leading financial group. To this end, we set forth ‘L.E.A.D. 2020’ as our strategic cue to guide our business directions and will conduct business accordingly.
The following represents our initiatives to be undertaken in accordance with L.E.A.D. 2020
As Korea's leading financial group,
we are committed to maximizing customer
value and pursuing sustainable growth with
all of our shareholders.
Level up the Core Level up KB Financial Group’s core competitive edge
Expansion of the Territory Expand the territory of our business operations
Active & Creative KB Create an active and creative KB culture
Digital Innovation Customer-Centric Pursue customer-centric digital innovation
This will surely enable KB Financial Group to seek bold customer-centric innovation to solidify the basis for sustainable growth in 2020.

MANAGEMENT STRATEGY L.E.A.D.2020
KB Financial Group will ensure that each of its subsidiaries strengthens
competitiveness in their core business areas with a focus on key subsidiaries of
KB Kookmin Bank, KB Securities, KB Kookmin Card, and KB Insurance as a way
to rebuild a robust and efficient business model and become as an unrivaled
No.1 financial group with dominant market leadership.
LEVEL UP THE CORELKB KOOKMIN BANK Reinforce business portfolio and innovate the cost structure KB Kookmin Bank continues to strengthen its business portfolio by diversifying revenue sources and innovate its cost structure to secure solid earnings fundamental.
KB SECURITIES
Focus capabilities on key growth business areas KB Securities will expand market dominance and enhance profitability in IB and WM business, strengthen its competitive edge, and innovate global investment services in order to reinforce future sustainable growth engines.
KB INSURANCE
Secure a ‘Value-driven Management’ with a focus on embedded value and value of new business KB Insurance will continue to advance customer & value-driven management, and maximize synergy among its subsidiaries, financial planners, and channels through the strength of KB Financial Group’s broad range of businesses.
KB KOOKMIN CARD
Diversify the revenue sources through new & global businessesKB Kookmin Card will further fine-tune its products and services through new digital technology and expand its new overseas business opportunities to diversify revenue sources.
002

003
KB Kookmin Bank’s Net Income
No. 1Ranked top in Net Income
KB Kookmin Bank’s Market Position
No. 1Ranked top in Loans in Won & Deposit in Won
KB Securities’ Market Position
No. 1 for
9consecutive years Ranked top in the Debt Capital Market
KB Insurance’s EV growth
+ 35.1%KRW 6,639 billion in Embedded Value in 2019
KB Kookmin Card’s Market Position
No. 1 for
9consecutive years
KRW 34.9 trillion in check card transaction volume
Strengthen cross collaboration business
Diversify custom
er channels(Including non-face-to-face channels)
Build customer-centric processes
Reinforce integrated group-w
ide marketing
Group Total Assets (Incl. AUM)
789.6 trillion
731.8 trillion
671.7 trillion
Number of KB Financial Group Customers
34.8 million
No. 1
Unit : KRW
2017 2018 2019

· Seek the expansion of our business territory to develop the group portfolio and secure new revenue sources
· Pursue a range of M&A opportunities to strengthen the group business portfolio and take bold and prompt action when promising opportunities arise
EXPAND THE BUSINESS TERRITORY
STRENGTHEN THE GLOBAL BUSINESSES
· Follow the two-track strategy in Southeast Asia and advanced markets to broaden our global business presence
· Take a differentiated inorganic growth strategy to strengthen our network while continuing with an organic expansion strategy
MANAGEMENT STRATEGY L.E.A.D.2020
KB Financial Group acquired a 70% stake in PRASAC Microfinance, the largest MDI in Cambodia, and
signed an SPA to acquire an 80% stake in PT Finansia Multi Finance, a local credit finance business in
Indonesia, to accelerate its advancement into the previously-untapped Southeast Asian markets and
to secure future growth engines. Going forward, KB Financial Group will pursue sustainable growth
opportunities in the years ahead through continued channel expansion.
EXPANSION OF THE TERRITORYE004

Cambodia’s Largest MDI
PRASACAcquired a 70% stake (approximately USD 603 million)
Indonesian Specialized Credit Finance Business
PT Finansia Multi FinanceSigned a SPA to acquire an 80% stake (approximately USD 81 million)
Liiv KB Cambodia
98,000 users
Fintech mobile bank service in Cambodia
KB Securities Vietnam
10th place
Ranked 10th securities companyin terms of equity in Vietnam
Target Global Net Income Contribution within the Group
20% within the next Decade
005

MANAGEMENT STRATEGY L.E.A.D.2020
KB Financial Group has pursued innovative changes in the way it conducts
business to promptly reflect a broad range of customer needs while embracing
an agile organization system to promote prompt decision-making and execution
with an aim to build an active and creative corporate culture. We will continue
to disseminate an organizational culture driven by creativity and equality and to
strengthen ESG management to serve as a leader in fulfilling social responsibility
and generating future value.
ACTIVE & CREATIVE KBA006

We pursue innovative transformation to promptly reflect a broad range of customer need
KCGS
A+ Korean ESG rating, rated Most Excellent in Corporate Governance for 2 consecutive years
RPA adopted within the Group in 2019
754,623 hours saved Work satisfaction improved through the automation of repetitive tasks
DJSI Highest-level DJSI World Index
Listed for 4 consecutive years
Bloomberg Gender-Equality Index
First Korean company to be listed
Issued USD 450 millionby KB Kookmin Bank
Asia’s First Subordinated Sustainability Bonds
∙ KB Clear Sky Installment Savings Deposit
∙ 280 Days for My Baby Installment Deposit
∙ KB X BTS Installment Deposit
LAUNCH NEW SPECIALTY PRODUCTS THAT CATER TO TARGETED CUSTOMERSWe deliver products that reflect the needs of shifting demographics and social trends to stay current with our customer base and act with agility and boldness to become truly dynamic
ESTABLISH ESG MANAGEMENT SYSTEM We proactively join global initiatives to strengthen our ESG global leadership, and take the lead in fulfilling corporate social responsibility and creating future value
∙ UNEP FI ∙ Carbon Disclosure Project
AGILE ORGANIZATION ‘ACE’ACE teams are structured in a way that breaks down departmental silos and embrace a streamlined decision-making process to swiftly detect changes and flexibly respond to them
∙ Liiv Talk Talk ∙ Star Link ∙ CMS: Star CMS
007

Select 76 high-tech startups as ‘KB Starters’ who push the limits to create innovative services and provide intensive support by connecting these fintech businesses with KB Financial Group subsidiaries (which has been ongoing since the HUB’s initiation in March 2015).
KB Innovation HUBKB Mobile Certificate
Launch the KB Mobile Certificate to allow for log-ins and electronic signatures without any physical security medium(security card, OTP) in order to improve the user convenience of mobile financial transactions
We deliver a differentiated user experience and value through
customer-centric digital innovation.
Upgrade the cloud-based innovation platform CLAYON to create a stable financial cloud environment that serves as the basis to facilitate external collaboration
Develop the financial cloud CLAYON
Leverage the latest technologies of artificial intelligence, big data, and cloud to develop an innovative IT infrastructure
Undertake the ‘The K Project’ to develop a next-generation IT system
MANAGEMENT STRATEGY L.E.A.D.2020
In 2019, KB Financial Group reinforced its IT infrastructure including the group-
wide integrated certificate and cloud and became the industry’s first to unveil
the MVNO-based Liiv M service as a way to offer more innovative services
to customers. Going forward, we will be committed to deliver differentiated
customer experience and value through customer-centric digital innovation.
DIGITAL INNOVATIONDLaunch Liiv M
Become the financial industry’s first to unveil the MVNO based finance and telecommunications service Liiv M that serves as a total finance and telecommunications platform capable of delivering high quality telecommunications services as well as convenient and secure financial transactions
008

009
KB Star Banking App MAU
No. 1KB Kookmin Bank’s flagship mobile app
KB Mobile Certificate Members
2.5+million mark
In just 6 months following its launching in July 2019
KB Innovation HUB
KRW 32.6billion / 113cases
Investment support / No. of business cooperation with startups
KB Cha Cha Cha
No. 1
Preowned car trading platform exceeding the 120,000 mark in number of preowned cars registered for sale
Liiv M
Mobile Virtual Network Operator (MVNO)Korea's first finance and telecommunicationsmobile service

KB Financial Group Annual Report 2019010
CEO Message
KB Financial Group has been fully aligned across the board to drive
financial innovation and broaden the scope of its business presence
with an aim to secure sustainable future growth engines.

011
Dear esteemed customers, shareholders and investors !
I would like to begin by extending my heartfelt gratitude for the
unwavering trust and support you have provided to KB Financial
Group.
Throughout 2019 we have faced a difficult business environment
that continues to be characterized by weak economic growth
and lingering uncertainties in global financial markets. Despite
such challenging conditions, we have channeled our group-wide
resources to drive financial innovation and expand the scope of
our businesses.
In the past year, we became the nation’s first financial institution
to launch an MVNO (Mobile Virtual Network Operator) service.
In successfully launching our MVNO services, “Liiv M”, we were
able to strengthen our digital capabilities by creating a platform
that combines finance with telecommunication technology. In
addition, we have introduced new services and products to meet
the challenges presented by Korea’s rapidly aging society and the
growing demand of our customers for services after retirement.
For example, we have opened senior care and assisted living
facilities in urban areas that offer premium services similar to
those in advanced nations.
Our investment banking business has also been significantly
enhanced with the acquisition of the Financial Services
Commission’s mega investment banking license, allowing us to
issue promissory notes with greater leverage and thus improving
our funding capabilities.
On the global business front, we have expanded our network
in Southeast Asia. Following our acquisition of shares in Bank
Bukopin of Indonesia in 2018, we have acquired shares of
PRASAC Microfinance Limited, a leading provider of microfinance
and deposit-taking services in Cambodia. We have also acquired
major stakes in PT. Finansia Multi Finance and Sunindo Primasura
Finance in Indonesia. In established capital markets such as
London, Hong Kong, and New York, we have made significant
strides in solidifying our IB business network.
In our continuing efforts to reinvent our branch banking network
we have successfully implemented a broad foundation for our
“PG 2.0” project, our transformation to a branch network that
is more optimized than ever before in meeting the demands
of each local community. We have also improved the services
of our digital channels by introducing new platforms in auto
financing and unsecured loans. Internally, we have completed
various projects such as implementing next-generation digital
systems, introducing digital procedures to our traditional branch
operations and developing new and efficient HR systems. In
undertaking these digital initiatives, we are highly confident that
we will remain a leading financial services provider in an ever-
changing and competitive environment.
Behind our improved performance is the
unfailing support of our customers and
shareholders and the firm commitment of
our employees. Each and every one of us
at KB Financial Group will do our utmost
to progress even further through sustained
transformation and innovation.
CEO Message

KB Financial Group Annual Report 2019012
Now I would like to briefly review our financial performance in
2019.
In 2019, KB Financial Group posted KRW 3,311.8 billion in net
profits. This is an increase of KRW 250.6 billion from the previous
year, primarily attributable to interest income from solid loan
growth as well as improvements in non-interest income,
increased operational efficiencies and good asset quality
performance.
Total assets of the Group increased by KRW 39.0 trillion from the
previous year to KRW 518.5 trillion. Loans showed well-balanced
growth with increases in key household products and to prime
customers in SOHO and SME. In our efforts to diversify our
sources of income, we also expanded our investment portfolio in
securities.
Our improved financial performance, highlighted by expansion
in our net profit and total assets, is a result made possible by the
unfailing support from our customers and shareholders, as well
as the strong commitment shown by our employees. Each and
every one of us at KB Financial Group will maintain our strong
dedication to innovation and continue to deliver sustainable
progress.
We continue to face mounting concerns over the global
economy and growing volatility in global financial markets. As
forecasted by many, we expect the Korean banking sector to be
challenged by low interest rates, low growth and low inflation.
There is also the ongoing competition from tech giants who are
advancing into the financial industry on the back of their digital
platforms.
First, we will “level up” the core competitive
edge of KB Financial Group to establish a more
robust and efficient business model.
We will strengthen our core competitiveness to generate solid
income contribution from our main subsidiaries and key business
areas. In facing an economic environment that continues to be
slow in growth, we will innovate our cost structure and reinforce
our crisis management system to readily address potential crisis
situations both in Korea and abroad.
In overcoming these challenges and emerging as a genuine
leader in the financial services industry, we at KB Financial Group
have created the acronym ‘L.E.A.D.’ as our strategic blueprint
to guide our journey in 2020. As we aspire to be the life-long
financial partner deeply trusted by our customers for our market
leadership and unrivaled services, we vow to focus our group-
wide capabilities on the following initiatives.
Second, we will expand our business territory
and markets through strategic M&As, both
at home and abroad, to strengthen and diversify
our business portfolio and secure new growth
momentum.
Our ‘Two Track’ strategy of pursuing expansion in Southeast Asia
and advanced markets will continue. In addition, we will continue
our efforts to discover new opportunities, such as in My Data and
MVNO, to promote sustainable future growth.

Third, we will expedite our pace of
transformation and innovation to establish and
reinforce an “active and creative” corporate
culture.
We are continuing to create and internalize a corporate culture
that encourages fast decision-making and execution and a
culture that values creativity and openess. We also aim to
establish an ESG management system that is on level with
global standards to lead the way in fulfilling corporate social
responsibility and creating sustainable social value.
Fourth, we will pursue customer-centric
“digital innovation” to improve the customer
experience in our digital channels.
CEO Message
As we continue to diversify and widen the reach of our digital
platforms and channels through expanded digital marketing,
we will build our seamless digital network by drawing on internal
as well as external data to provide customized services to our
customers.
Through KB Innovation Hub Center, we also plan to expand our
strategic partnerships with start-ups and fintech companies to
create KB’s own digital ecosystem.
With many uncertainties surrounding the economy and
our industry we are expecting many challenges in the year
ahead. Even so, we at KB Financial Group are determined to
collectively overcome these challenges, setting us apart from
the competition and reinforcing our status as a leading financial
group dedicated to Innovation driven growth.
We look forward to your continued support for KB Financial
Group and we wish you and your loved ones good health and
happiness.
Thank you. Jong Kyoo Yoon
Chairman & CEOKB Financial Group Inc.
KB Financial Group created the acronym
- L.E.A.D – as our strategic blueprint to
guide our journey in 2020 to become the
life-long financial partner deeply trusted
by customers for our dominant market
leadership and unrivaled services.
013

KB Financial Group Annual Report 2019014
Insurance
KB InsuranceYour Lifetime Hope PartnerKB Insurance provides optimal risk cover-age and comprehensive financial consulting service while leveraging its industry-leading digital capability to offer a range of financial products and services.
KB Life InsuranceYour Lifetime Happiness Partner KB Life Insurance provides customer-centric financial/insurance services through wide- ranging sales channels with a focus on its bancassurance channel.
Company ProfileAs a leading financial group with the largest customer base and the most extensive branch network in Korea, KB Financial Group is committed to delivering one-stop comprehensive financial services that truly cater to a broad range of customer needs through organic cooperation among 12 subsidiaries. KB Financial Group and its subsidiaries are uniting with a relentless spirit of challenge to drive KB Financial Group’s evolution into becoming a lifelong financial partner that its customers can count on. It will do so with its differentiated competitive edge that comes from its robust capital strength and extensive network as well as its operational and risk management expertise accumulated through years of experience. With our firm belief in customer-centric management and group mission of ‘Financial Services Delivering Changes-Happier Life & Better World’, we will ceaselessly pursue innovation while providing differentiated products and services through consistent innovation based on prompt decision-making and agile execution. KB Financial Group plans to continue to solidify our market position as korea’s leading financial group.
Specialized Credit
KB Capital Your Personal Finance PartnerAs Korea’s leading auto installment financing provider, KB Capital is ranked second in the industry based on asset size. KB Capital is diversifying its portfolio to pursue sustainable growth and advance into new markets while expanding its global presence and building digital competitiveness.
Ownership 100%
Financial Investment
KB Asset Management Your Lifetime Asset Management PartnerKB Asset Management provides customers with top-performing fund products based on its diversified investment portfolio.
KB Real Estate TrustYour Lifetime Financial PartnerKB Real Estate Trust leverages its wide-ranging real estate development portfolio to deliver optimal real estate financial solutions to customers. As a specialized real estate trust business, KB Real Estate Trust became the first in the industry to launch completion guarantee management land trust products, and is maintaining its steadfast market status in the urban regeneration and REITs sectors.
KB Investment Your Lifetime Financial PartnerAs a leading venture investor focused on corporate investment, KB Investment faith-fully fulfills its role as an investment partner that assists small/mid-size venture compa-nies with exceptional technology in starting and incubating their business and pursuing growth in so doing.
100%
100%
100%
Securities
KB Securities Your Lifetime Investment Partner As a mega-size Investment Bank with KRW 4 trillion in equity capital, KB Securities has ranked first in corporate bonds, ABSs, and the wider DCM sector for nine consecutive years to demonstrate its unrivaled competitive edge. On the strength of its best-in-class product line-up and operational competitiveness, KB Securities delivers the best-possible financial solutions optimized for customer needs.
100%
KB Data Systems Your Trusted Financial IT PartnerOn the strength of its industry-leading expertise and experience in the IT sector, KB Data Systems serves as an IT partner for KB Financial Group, and assists the group’s IT and digital innovation strategy across the cloud, artificial intelligence and blockchain sectors.
KB Credit Information Your Lifetime Financial Partner KB Credit Information serves as the control tower of KB Financial Group’s post-loan management operations through debt collection and lease investigation. KB Credit Information ensures that financial trans-actions are made seamlessly along the financial cycle based on its industry-leading computing systems, outstanding workforce, and nation-wide organizational network.
Others
100%
100%
100%
Credit Card
KB Kookmin CardYour Trusted Happy Life PartnerKB Kookmin Card provides credit cards, debit cards, installment financing and other diverse financial services, and leverages big data and blockchain to launch innovative customer-centric products and services.
100%
100%
Bank
KB Kookmin BankYour Lifetime Financial PartnerAs Korea’s leading bank with the nation’s largest customer base(31.6 million) and a vast network of 1,051 branches, KB Kookmin Bank sets the trend for digital finance and delivers differentiated financial products and services through innovative financial services.
100%
100%
100%KB Savings Bank Your Good Finance Partner As a leading financial institution that endorses inclusive finance, KB Savings Bank operates tailor-made products and services for the working class to practice inclusive finance while delivering diverse services enabled by digital innovation to advance ‘Good Finance’ for the working class.
Savings Bank
KB Financial Group

015001 Introduction026 Core Competency048 Management’s Discussion & Analysis053 Operation Review074 Financial Section317 Appendix
Company Profile
Group Senior Management
Yun Sang Song· Senior Managing Director· Insurance Business Unit
Jae Young Choi· Head of Pension Business
Division
Jin Gyu Maeng· Head of the Office of Planning
and Coordination
Jin Soo Yoon· Chief Data Officer
Sang Hyeon Woo· Senior Managing Director· Corporate and Investment
Banking Business Unit
Chai Hyun Sung· Senior Executive
Vice President· Retail Customer Business Unit
Jeong Ha· Senior Managing Director· Capital Market Business Unit
Jong Kyoo Yoon· Chairman &
Chief Executive Officer
Chang Kwon Lee· Deputy President· Chief Strategy Officer· Head of Global Business Unit
Nam Jong Seo· Deputy President· Chief Risk Management
Officer
Ki Hwan Kim· Deputy President· Chief Finance Officer
Pil Kyu Im· Deputy President· Chief Human Resources Officer
Kyung Yup Cho· Deputy President· Head of KB Research
Nam Hoon Cho· Senior Managing Director· Chief Global Strategy Officer
Young Hyuk Jo· Deputy President· Head of Audit Department
Chan Il Park· Managing Director· Chief Compliance Officer
Seok Mun Choi· Managing Director· Head of the Office of
Board of Directors
Jeong Rim Park· Head of Capital Market
Business Unit
Soon Bum Kwon· Managing Director· Research on Finance
Industry
Sung Hyun Kim· Head of Corporate and
Investment Banking Business Unit
Jong Hee Yang· Head of Insurance
Business Unit
Young Gil Kim· Head of Wealth Management
Business Unit
Dong Cheol Lee· Head of Retail
Customer Business Unit
Woon Tae Kim· Head of Small and Medium
Enterprise Business Unit
Mun Cheol Jeong· Chief Public Relation
Officer
Woo Yeul Lee· Chief Information
Technology Officer
Dong Whan Han· Chief Digital Innovation
Officer
Credit Ratings ESG Ratings
*Long-term foreign currency issuer ratings & outlook
Moody’s
A1 / Stable A
KCGS MSCI
A+S & P
A / Stable
(As of March 31, 2020)

Financial Highlights
Key Financial Figures
PROFITABILITY (KRW in billions)
FINANCIAL POSITION (KRW in trillions)
ASSET QUALITY (%)
CAPITAL ADEQUACY (%)
Gross operating income
Net operating income
Net profit 1)
ROA (%)
ROE (%)
Cost-income ratio (%)
Assets
Liabilities
Shareholders’ equity
NPL ratio
NPL coverage ratio
Credit cost ratio (%)
BIS ratio
Tier 1 ratio
CET 1 ratio
2018
10,859.7
4,267.5
3,061.2
0.7
8.8
54.5
479.6
443.9
35.7
0.59
139.4
0.21
14.6
14.0
14.0
2019
11,431.9
4,490.6
3,311.8
0.7
8.9
54.9
518.5
479.4
39.1
0.48
149.2
0.20
14.5
13.9
13.6
In 2019, KB Financial Group posted KRW 3,311.8 billion in net income. This was mainly driven by the solid growth in net interest income and net fee & commission income maintaining robust fundamentals even amid the economic slowdown. KB Financial Group’s top priority for 2019 was to focus on asset quality and profitability, which prompted our endeavors to pursue quality loan growth, manage our net interest margin, and improve performance in our non-interest income. This, in return, allowed us to maintain highly steadfast fundamentals in generating income. KB Financial Group’s credit cost ratio recorded to 0.20% in 2019 which remained subnormal level attributable to quality-driven loan growth and preemptive risk management. As of the end of 2019, the group BIS ratio and CET1 ratio posted 14.5% and 13.6% respectively demonstrating the highest level of capital strength in the Korean financial industry.
By subsidiary, KB Kookmin Bank recorded KRW 2,439.1 billion in net income, KB Securities KRW 257.9 billion, KB Insurance KRW 234.3 billion, and KB Kookmin Card KRW 316.6 billion, which account for 98.1% of the group total income. Overall improvement in performance was witnessed in other subsidiaries as well, with KB Asset Management posting KRW 48.9 billion in net income, KB Capital KRW 117.0 billion, KB Life Insurance KRW 16.0 billion, KB Real Estate Trust KRW 61.7 billion, and KB Savings Bank KRW 16.3 billion.
As we move into 2020, KB Financial Group will further strengthen its core business competitive edge and pursue bold customer-centric innovation in order to solidify its basis for sustainable growth and take a renewed step forward to become leading financial group.
Note 1) Profit attributable to controlling interests
KB Financial Group Annual Report 2019016

Financial Highlights
Net Operating Income(KRW in billions)
Net Profit(KRW in billions)
Total Assets(KRW in trillions)
+8.1% +8.2%
+5.2%
ROE
10.28.8
8.9%
2017 2018 2019
Capital Ratios 2019
BIS 14.5%
Tier1 13.9%
CET1 13.6%
2017
3,311.4
2018
3,061.2
2019
3,311.8
2017
4,015.3
2018
4,267.5
2019
4,490.6
2017
436.8
2018
479.6
2019
518.5
017001 Introduction026 Core Competency048 Management’s Discussion & Analysis053 Operation Review074 Financial Section317 Appendix

KB Financial Group Annual Report 2019018
Shareholder Information
Total shares issued
Treasury shares
Shares outstanding
Year-end share price
Market capitalization (in trillions)
Dividend per shares
Book value per share
Basic earnings per share
2019
415,807,920
26,173,585
389,634,335
47,650
19.8
2,210
91,871
8,451
2018
418,111,537
22,415,468
395,696,069
46,500
19.4
1,920
83,266
7,721
Stock Information
Share Ownership
Domestic
35.8%
Foreign
64.2%2019
Name of shareholder
Korean National Pension Service
JPMorgan Chase Bank (ADR Depositary)
The Government of Singapore
Samsung Asset Management
Vanguard Total International Stock Index
Peoples Bank of China
Mirae Asset Global Investments
Fidelity Investment Trust
Number of shares owned
41,468,003
26,622,633
1,279,233
7,795,567
6,075,212
4,844,987
4,575,008
4,418,815
9.97
6.40
2.47
1.87
1.46
1.17
1.10
1.06
Ownership
(Shares, %)
(Shares, KRW)

019001 Introduction026 Core Competency048 Management’s Discussion & Analysis053 Operation Review074 Financial Section317 Appendix
Shareholder Information
2017
1,920
2018
1,920
2015
980
2016
1,250
2019
2,21023.2
28.8
24.8
31.8
22.3
23.2
56.6
26.0
34.3
Dividend
Share Buyback & Cancellation
(KRW, %)
Dividend Payout RatioTotal Shareholder Return
Dividend per Share
Share Buyback
26.2 million shares
Share Cancellation
2.3 million shares
of total outstanding shares issued share buybacks
for recent four years (2016-2019)
6.3 % KRW1.4 trillion 4 times
bank holding company in Korea to cancel
shares
First

KB Financial Group Annual Report 2019020
Level Up the Core
First, we will “level-up” our core competitive edge to establish a robust and efficient business model.
Our core competitiveness will be strengthened to generate solid profits from main subsidiaries and key business areas. In preparation for an era of continued low growth, our cost structure will be strategically innovated and our response system will be reinforced to readily address any possible situation both in Korea and abroad.
Expansion of the Territory
Second, we will further complete our business portfolio through strategic M&As both at home and abroad, and secure growth momentum in line with changing business conditions.
A range of M&A opportunities will be actively reviewed and implemented to bolster our business portfolio while the ‘Two-Track’ strategy will be executed to advance into Southeast Asian and mature markets to broaden our global business presence. Furthermore, My Data, MVNO and other new business opportunities will be extensively explored to generate future sustainable growth.
Group Mission & Vision
KB Financial Group defined its mission as “Financial Services Delivering Changes – Happier Life & Better World” to embody its firm commitment to leveraging finance to assist customers in designing a more flourishing future and to bring greater convenience and progress to the world. Its vision “Driven by world-class talents and bold innovation, to become your trusted financial partner for a lifetime” will guide the group’s endeavors to become a lifelong financial group by leading innovation that shifts the financial paradigm with best professionals. With prompt decision-making and agile executional capabilities, we relentlessly pursue innovation to provide differentiated products and services that will ultimately solidify our position as the most trusted and recognized
leading financial group.
2019 Key Activities and Achievements
Business Unit System for organizational operation to increase group-wide collaborative synergy
Following the expansion of the Business Unit from the three units of WM, CIB, Capital Market to seven with the addition of Digital Transformation, Retail Customer, SME, and Insurance in 2019, Global Business Unit was newly created in 2020. This helped boost our execution of global business operations, thus increasing the number of units under this operational system to a total of eight. Our employees are also allowed to hold additional positions in related subsidiary organizations as a way to increase synergy from respective Business Units through the ‘One-Firm’ approach and improve management accountability. Going forward, KB Financial Group will reinforce the Business Unit System to maximize synergy among subsidiaries and promote efficiency in organizational operation.
Balanced growth and synergy generation between banking & non-banking business
Over the past four years, we have leveraged M&As in securities, insurance and capital operations, which were traditionally the weaker components of our business portfolio, to reinforce our non-banking business and realign our business portfolio. This brought our net income ratio between banking and non-banking business from 8:2 to 7:3. Our mid to long-term goal is to eventually reach 6:4 to secure sustainable growth momentum by enhancing the inherent competitiveness of respective subsidiaries and strengthening our non-banking business through M&As.
Broader global business presence and stronger competitiveness
Our global business approach takes into account a range of factors, from country-specific regulatory conditions, demographic structures, and financial industry infrastructure to developmental characteristics of respective financial sectors and the growing overseas investment needs of domestic investors, and is focused on the four areas of CIB, retail banking, digital business, and asset management. Our recent advancement into the digital banking, auto finance, MFI, and securities business in Cambodia, Laos, Myanmar, and Vietnam has allowed us to develop our understanding of and experience in these Southeast Asian markets. To effectively use our business resources, a limited number of countries will be selected as hub candidates and nurtured as new ‘Mother Markets’.
As part of this strategy, we acquired a 70% stake in PRASAC Micro Finance, Cambodia’s largest Microfinance Deposit-taking Institution (MDI), in December 2019. With a local business network of 11 locations, PRASAC has an unrivaled market dominance in the Cambodian market as the third largest lender in the local financial market while posting high profitability with KRW 90.7 billion in net income and 29.4% in ROE as of 2018. KB Financial Group’s post-acquisition plan is to share its exceptional retail capabilities with PRASAC while retaining its core competitive edge at the maximum possible level and swiftly transform PRASAC into a commercial bank. PRASAC could then go on to become an unrivaled leading bank in Cambodia, which will surely lay the basis for KB Financial Group to expand its global business presence across the entire Southeast Asian region.
Management Strategy to Achieve Goals of 2020
In line with mounting concerns over the global economic recession and continued uncertainties in the global financial market, the domestic economy is expected to suffer low interest rates, low growth, and low inflation for an extended period of time. This is further aggravated by the emergence of new competitors and threats, ranging from the full-fledged implementation of open banking to tech giants advancing into the financial industry with their powerful platforms.
To evolve into a true “Leader” who reliably pioneers the market as Korea’s top-notch financial group even in the most trying of times , KB Financial Group determined the management keyword “L.E.A.D.” as the strategy direction to guide its journey in 2020, and will focus group-wide capabilities to become a trusted financial partner for a lifetime, known for its market leadership and unrivaled service.
Vision & Strategy
L
E

021001 Introduction026 Core Competency048 Management’s Discussion & Analysis053 Operation Review074 Financial Section317 Appendix
Vision & Strategy
Group Corporate Structure (As of March.31, 2020)
Active & Creative KB
Third, we will ramp up our pace of transformation and innovation to establish an organizational culture befitting the title of Active & Creative KB.
A corporate culture that values creativity and equality will be developed to enable prompt decision-making and execution. We will also establish an ESG management system on par with global standards to serve as a leader in fulfilling corporate social responsibility and creating future value.
A Digital Innovation Customer-Centric
Fourth, we will provide customer-centric digital innovation to deliver a differentiated user experience and value.
Our customer contact points will continue to strengthen through diversified channels and broader digital marketing activities. A wide array of channels will be aligned to reinforce our seamless service delivery system while refined analysis of internal/external data will be performed to offer personalized products and services. With the KB Innovation HUB Center playing a pivotal role, we will expand our strategic partnership with fintech companies to create a digital ecosystem where KB services are situated at the hub.
D
KB Research
Office of the Board of Directors
Risk Management Committee
Evaluation and Compensation Committee
Non- executive Director Nominating Committee
Audit Committee Member Nominating Committee
Audit
Audit Committee
CEO Nominating Committee
Subsidiaries’ CEO Director Nominating Committee
ESG Committee
Board of Directors
CEO
Group Management Executive Committee
Holding Co. Management Committee
Business Unit (BU)
Corporate Center
IT Planning
IT Tech Innovation Center
Data Strategy
Information Security
Digital Strategy
Pension Planning
KB
Inn
ova
tion
HU
B Center
Wealth M
anagement
Planning
CITO CDOCDIO
Corporate & Investm
ent Banking Planning
Senior Managing Director, CIB BU
Corporate & Investment Banking BU
Capital M
arket Planning
Senior Managing Director, CM BU
Capital Market
BU
Retail Custom
er Planning
Deputy President,
Retail Customer
BU
Retail Customer
BU
Small &
Medium
Enterprise Planning
Small & Medium
Enterprise BU
Digital Transformation
BU
Wealth Management
BU
Global Strategy
CGSO
Global BU
Insurance Strategy
Senior Managing Director, Insurance
BU
Insurance BU
Pension Business Division
Brand Strategy
ESG Strategy
Design Unit CPRO
CHOGroup HRD Center
HR
Accounting
IR
CFO
Financial Planning
CSO
Strategic Planning
One-firm Strategy
Office of Planning & Coordination
CRO Risk Management
Model Validation Unit
Secretariat
Legal Affair Unit
Chief Compliance
Officer
Compliance Supporting

KB Financial Group Annual Report 2019022
PrinciplesThe Board of Directors of KB Financial Group serves as the supreme decision-making body to deliberate and decide on major management issues of the Group and other subsidiaries. As of the end of 2019, the Board of Directors consisted of a total of nine directors - seven non-executive directors, one executive director and one non-standing director - with non-executive directors accounting for the majority, faithfully fulfilling their role to hold the management in check.
The Chairman and CEO of KB Financial Group is appointed at the general shareholder meeting as stipulated in the Articles of Incorporation. Candidates for this position are selected and their qualifications are examined in accordance with fair and rigorous procedures at the CEO Nominating Committee, which is composed solely of non-executive directors, prior to their nomination to the general shareholder meeting.
At KB Financial Group, the Board of Directors defined ‘shareholder representation, professionalism, and diversity’ as the core principles in appointing non-executive directors. As such, a pool of non-executive director candidates is managed year-round in the detailed segments of ‘financial business, accounting, finance, law/regulation, risk management, HR, IT, and consumer protection’. Their nomination process consists of the three steps of candidate pooling, evaluation and nomination, which are operated in complete isolation to ensure the independence and fairness of this process. The candidate pool is regularly managed on a semi-annual basis and is created based on the recommendations from shareholders and external search firms. Notably, any shareholder who owns one or more shares of KB Financial Group can recommend candidates and KB Financial Group is the first in the financial industry to institute such a practice. Furthermore, external advisor panels participates in this process to ensure objectivity in assessing candidates, and the results are used, along with reference checks, to select the final candidates at the Non-Executive Director Nominating Committee. These candidates are evaluated for their qualifications at the committee meeting in accordance with the criteria set by relevant regulations and the Articles of Incorporation before they are nominated to the general shareholder meeting.
In conformity with the Articles of Incorporation, the Chairman of the Board of Directors is appointed among non-executive directors: the chairman is mandated to preside over the board of directors meetings and ensure that the board of directors is operated in accordance with the principles of checks and balances.
Committees of the Board of Directors Committees under the board are delegated to perform a portion of the board of directors functions as stipulated in governmental regulations and the Articles of Incorporation, and are composed of directors who bring their expertise in the relevant field to the table.
Audit CommitteeThe Audit Committee performs audits on the business operations and assets of the holding company and its subsidiaries while deliberating and deciding on related issues in order to audit the performance of directors.
Risk Management CommitteeThe Risk Management Committee serves as the top decision-making body to develop risk management strategies and policies in order to swiftly identify, measure, supervise and control overall risks that may occur across the entire business conduct of the holding company and its subsidiaries.
Evaluation & Compensation Committee
The Evaluation & Compensation Committee develops compensation policies for the holding company and its subsidiaries and supervises the planning and operation of their performance compensation systems.
Non-Executive Director Nominating Committee
The Non-Executive Director Nominating Committee regularly manages the pool of non-executive director candidates and nominates candidates to the general shareholder meeting.
Audit Committee Members Nominating Committee
The Audit Committee Members Nominating Committee nominates Audit Committee member candidates to be appointed at the general shareholder meeting.
Subsidiaries’ CEO Director Nominating Committee
The Subsidiaries’ CEO Director Nominating Committee regularly manages the pool of subsidiary CEO candidates while establishing and revising management succession plans concerning subsidiary CEOs.
CEO Nominating Committee
The CEO Nominating Committee regularly manages the pool of group CEO candidates, and is mandated to develop and revise management succession plans for the group CEO and implement the CEO succession process.
ESG Committee
The ESG Committee serves as the top decision-making body to develop and approve group-wide ESG-related strategies and policies and to monitor and supervise their implementation.
Corporate Governance
Enhancement ofCorporate Value
+Realization of
Shareholders’ Value
Enhancementof Management
Transparency
EfficientOperation of
AuditingOrganization
Protection ofShareholders’
Rights
SecuringIndependenceof the Board of
Directors
Corporate Governance Goal

023001 Introduction026 Core Competency048 Management’s Discussion & Analysis053 Operation Review074 Financial Section317 Appendix
Corporate Governance
2019 The Board of Directors Meeting: Major Resolutions and Other Achievements In 2019, the board of directors met 14 times to deliberate on 24 decision items and 33 reporting items. The board of directors decided on the ‘Issuance of write-down contingent convertible bonds’ as a hybrid instrument to improve the group’s capital adequacy in March, and decided on the ‘Retirement of treasury shares’, for the first time as a bank holding company, to elevate shareholder & corporate value. Furthermore, another decision was made on ‘Equity acquisition of Cambodia’s microfinance deposit-taking institution by KB Kookmin Bank, which ultimately broadened the group’s retail network in Southeast Asia.
At regular the board of directors meetings held on a quarterly basis, directors were briefed of business results and discussed the pending issues of the group. At the ad-hoc meeting hosted in December 2019, management plans and budgets for 2020 were finalized.
Plans for 2020 KB Financial Group aims to establish a stable corporate governance and lay the basis for quality-focused management over the mid to long term in order to promote sustainable growth, enhance corporate value, and protect the interests of shareholders and other stakeholders. In 2020, KB Financial Group vows to further elevate its corporate value and shareholder value through a reasonable and transparent decision-making.
Governance Structure (As of March 31, 2020)
General Meeting of Shareholders
Board of Directors
Chairman & CEO
4 non-executive directorsRisk Management Committee
4 non-executive directorsEvaluation & Compensation Committee
4 non-executive directorsNon-Executive Director Nominating Committee
7 non-executive directorsAudit Committee Members Nominating Committee
4 non-executive directorsAudit Committee
1 executive director, 1 non-standing director and 3 non-executive directors
Subsidiaries’ CEO Director Nominating Committee
1 executive director, 1 non-standing director and 7 non-executive directorsESG Committee
7 non-executive directorsCEO Nominating Committee

KB Financial Group Annual Report 2019024
Myung Hee ChoiStuart B. Solomon
Board of Directors (As of March 31, 2020)
· Chairman, Board of Directors, KB Financial Group· Chairperson, CEO Nominating Committee· Member, Evaluation and Compensation Committee· Member, Non-Executive Director Nominating
Committee· Member, Subsidiaries’ CEO Director Nominating
Committee· Member, ESG Committee
Suk Ho Sonu
· Chairperson, Evaluation and Compensation Committee
· Member, Non-Executive Director Nominating Committee
· Member, CEO Nominating Committee· Member, Audit Committee · Member, ESG Committee
Kou Whan Jeong Kyung Ho Kim
· Chairperson, Risk Management Committee · Member, Evaluation and Compensation Committee· Member, CEO Nominating Committee· Member, Subsidiaries’ CEO Director Nominating
Committee· Member, ESG Committee
2002-2003
2006-2009
2013-2014
2016-Present
Branch Chief Prosecutor of Bucheon Branch Office of the Incheon District Prosecutor’s OfficeChairperson of Consumer Dispute Settlement Commission, Korea Consumer AgencyStanding Mediator, Korea Medical Dispute Mediation and Arbitration AgencyNambujeil Law and Notary Office Inc. President Attorney at Law
1991-20202000-2003
2004-2010
2007
2015-2019 2017-2018
Professor, Hongik UniversityVice President, Korea Accounting Standards BoardNon-executive Director, Shinhan Investment Corp.President, The Korean Association for Government AccountingNon-executive Director, Citibank Korea, Inc.Vice President, Hongik University
2013
2013-2016
Head of Risk Management Division, Industrial Bank of KoreaChairman & CEO, Industrial Bank of Korea
Seon Joo Kwon
· Chairperson, ESG Committee· Member, Risk Management Committee · Member, CEO Nominating Committee· Member, Audit Committee
Gyu Taeg Oh Jong Kyoo Yoon
· Member, Subsidiaries’ CEO Director Nominating Committee
· Member, ESG Committee
1991-19952010-2012
2011-2015
2018-2020
1995-Present
Assistant Professor, University of IowaNon-executive Director, Kiwoom Securities Co., Ltd.Public Funds Oversight Committee Member, Sub-Committee Chair, Financial Services CommissionNon-executive director, Moa Savings BankProfessor, School of Business Administration, Chung-Ang University
2002-2004
2004
2005-20102010-2013
2014-20172014-Present
Senior Executive Vice President, Finance & Strategic Planning Division, Kookmin BankSenior Executive Vice President & Head of Retail Banking Group, Kookmin BankSenior Advisor, Kim & CharyDeputy President & Chief Financial Officer, KB Financial GroupPresident & CEO, Kookmin BankChairman & CEO, KB Financial Group
2013-2014
2015
2016
2017- Present
Managing Director, Credit Analysis Division, Kookmin BankSenior Managing Director, Strategy and Finance Planning Group, Kookmin BankSenior Executive Vice President, Sales Group, Kookmin BankPresident & CEO, Kookmin Bank
Yin Hur
· Member, Risk Management Committee· Member, Non-Executive Director Nominating
Committee· Member, CEO Nominating Committee· Member, ESG Committee
· Chairperson, Non-Executive Director Nominating Committee
· Member, Evaluation and Compensation Committee· Member, CEO Nominating Committee· Member, Audit Committee · Member, ESG Committee
2007-20072009-2010
2011-2013
2017-2019
2017-Present
President, Korea Finance AssociationPresident, Korea Money and Finance AssociationDean, Graduate School of Business Administration, Hongik UniversityVisiting Professor, Business School, Seoul National UniversityVisiting Professor, School of Business Administration, Hongik University
1998-2000
2000-2001
2001-2009
2009-2011
Executive Managing Director, MetLife Insurance Co. of KoreaExecutive Vice President and Representative Director, MetLife Insurance Co. of KoreaPresident & CEO, MetLife Insurance Co. of KoreaChairman, MetLife Insurance Co. of Korea.
1974-1991
2003-2005
2005-20092011-Present
Senior Operation Officer, Citibank Korea Inc., Seoul BranchDirector, Financial Supervisory ServiceAuditor, Korea Exchange BankVice President, Korea Internal Control Assessment Institute
Non-executive Director Executive Director Non-standing Director
· Chairperson, Audit Committee · Member, Risk Management Committee · Member, CEO Nominating Committee· Member, Subsidiaries’ CEO Director Nominating
Committee· Member, ESG Committee
· Chairman & CEO, KB Financial Group· Member, Subsidiaries’ CEO Director Nominating
Committee· Member, ESG Committee

Awards & Recognitions
Awards & Recognitions
Chairman Jong Kyoo Yoon awarded the best CEO
of the year at the ‘51st Korean CEO Awards’
Korea Management Association
Won the Grand Prize at the ‘2nd Korean Accounting
Awards 2019’
Maeil Business Newspaper
Named for the Carbon Management Sector Honors
in the financial sector for exceptional performance in
responding to climate change at the ‘CDP Climate Change 2018’
for two consecutive years
Carbon Disclosure Project
Chairman Jong Kyoo Yoon won the Iron Tower Industrial Medal on the 2nd Day of Accounting
Korea Accounting Association
Listed in the 2019 DJSI World Index for four consecutive years
S&P Dow Jones Indices, RobecoSAM
Ranked first in the 2019 governance evaluation performed
by the Korea Corporate Governance Service for two consecutive yearsKorea Corporate Governance Service
KB Financial Group
Ranked first at the National Brand Competitive Index
in the banking sector for 16 consecutive years
Korea Productivity Center Won the Grand Prize at the ‘Maekyung Securities
Awards 2019’
Maeil Economic Daily
Awarded at the ‘Korea Consumer Trust Leading Brand Awards 2019’ in the banking
sector for 13 consecutive years
Korea Brand Management Association
Won the Korea Financial Investment Association
Chairman Award at the ‘10th Korea IB Awards’
in the DCM sector
Korea Economic Daily
Awarded at the Customer Impression Awards 2019 in the finance/securities sector
Korea Economic Daily
Won the Best IB Deal Award at the ‘16th Korea IB Awards’
Money Today
Ranked first in the ‘National Consumer Satisfaction Index 2019’ for 13 years
Korea Productivity Center
KB Kookmin Bank KB Securities
KB Good Loan awarded at the ‘National Service Awards 2019’
in the mid-range interest rate loan sector for two consecutive years
Institute for Industrial Policy Studies
Won the Presidential Award at the ‘Labor-Management Culture Awards 2019’
Ministry of Employment and Labor
Won the Prime Minister’s Citation on the ‘13th Day of
Anti-Money Laundering Day’
Financial Intelligence Unit
Awarded at the ‘National Service Awards 2019’
in the mobile app card sector
Institute for Industrial Policy Studies
KB Good Banking awarded at the ‘National Consumer-
Centered Brand Awards 2019’ in the savings bank sector
Dong-A Daily
Awarded at the ‘Korea Creative Management
Awards 2019’ in the customer satisfaction management
sector
JoongAng Daily
KB Kookmin Card KB Savings Bank
025001 Introduction026 Core Competency048 Management’s Discussion & Analysis053 Operation Review074 Financial Section317 Appendix

026
KB Financial Group will be committed
to assist its subsidiaries in strengthening
their respective core competitive edge
to further complete its group business
portfolio and to relentlessly broaden its
global business presence.
Furthermore, KB Financial Group will
establish an ESG management system in
compliance with global standards so as
to set the trend for social transformation
and future value creation.
CORE COMPETENCY
Risk Management
Synergy Creation
Digital Finance
Global Business
ESG Management
Social Contribution
027
030
032
036
040
043

001 Introduction026 Core Competency048 Management’s Discussion & Analysis053 Operation Review074 Financial Section317 Appendix
027Risk Management
Risk Management
Risk Governance
The Risk Management Committee is mandated to set risk management strategies, determine acceptable levels of risk appetite, review the status of group-wide risk management, and approve the application of risk management systems, methodologies and major improvements.
The Risk Management Council consists of Risk Management Officers from the holding company and subsidiaries, and is responsible for deliberating on the matters delegated by the Risk Management Committee and consulting on detailed risk management issues.
The Risk Management Department of the holding company monitors and manages the status of group-wide risk operations and the limits of internal capital by developing risk management policies and operating relevant processes.
Credit Risk Management
KB Financial Group defines credit risks as expected and unexpected losses that may occur due to the default or declining creditworthiness of the counterparty.
Credit Policy DirectionKB Financial Group develops credit policies in consideration of the economic outlook, business conditions, asset quality trends, and risk management capabilities, and operates sector-specific loan policies accordingly in household, corporate, and credit card sectors. The
primary goal of its credit policy is to maintain asset quality and minimize mid to long-term credit cost volatility in order to maximize the value of KB Financial Group.
Credit Risk Measurement & ManagementTo measure credit risks related to Capital at Risk or CaR concerning on/off balance sheet assets, KB Financial Group takes the Internal Ratings Based Approach developed in compliance with supervisory standards. CaR calculated as such refers to the maximum possible losses from business operations that may arise at a certain confidence level due to changes in creditworthiness of the borrower or counterparty. Our CaR calculations reflect any possibility of insolvency on the part of the borrower, possible losses and remaining maturity of exposure, and economic correlations. Furthermore, we identify, measure and monitor credit concentration risks that may additionally occur due to the disproportionate focus on specific borrowers or sectors within the group-level portfolio.
Total Exposure Limit ManagementKB Financial Group’s Total Exposure Limit Management System aims to prevent excessive risk exposure and risk concentration in specific sectors and optimize the credit portfolio through stable asset management. The Risk Management Department of the holding company is responsible for periodically monitoring our total exposure limit and reporting outcomes to the Risk Management Committee.
KB Kookmin Bank KB Life Insurance
KB Insurance KB Savings Bank
KB Asset Management KB Data Systems
KB Securities KB Real Estate Trust
KB Kookmin Card KB Investment
KB Capital KB Credit Information
Risk Management Committee
Set risk appetite & internal capital limits Develop group-level risk policies
Risk Management Council
Consult on the matters delegated by the Risk Management Committee and pending
risk management issues
KB Financial Group is focused on improving group risk transparency, preventing risk transfer among subsidiaries, and proactively responding to the rapidly-shifting financial landscape in an aim to efficiently support its mid to long-term strategy and business decision-making.
Risk Management Organization
Risk Management Departments

KB Financial Group Annual Report 2019028
Market Risk Management
KB Financial Group defines market risks as possible losses from its trading positions in line with interest rates, exchange rates, stock prices and other market fluctuations, and identifies, measures, monitors, controls and reports such market risks inherent in bonds, foreign currencies, securities, and derivatives. Serving as an indicator to quantify the risks inherent in trading accounts, Market VaR(Value at Risk) refers to the maximum possible losses that may occur within a certain period of time at a certain confidence level. Our subsidiaries that operate trading accounts verify the adequacy of our VaR model through the daily comparative analyses performed on actual and virtual profits/losses and VaR calculations. For assets or subsidiaries to which this model is not applicable, KB Financial Group utilizes its standard methodology in compliance with supervisory regulations to manage market risks.
Interest Rate Risk Management
We defines interest rate risks as possible decreases in net asset value or Net Interest Income(NII) attributable to unfavorable fluctuations in market rates. The goal of interest rate risk management is to comprehensively manage our assets and liabilities to maximize our net interest income within the acceptable risk range while minimizing any losses in net interest margins that may occur due to changing interest rates.
Liquidity Risk Management
We defines liquidity risks as risks that may arise due to maturity mismatches or any failure to respond to unexpected demand and supply of funds. A systemic approach is taken to manage liquidity risks to meet the demand for cash outflows – deposit withdrawals, the pending maturity of financial bonds, and the repayment of borrowings – while securing liquidity for asset management including lending and bond investments.
Operational Risk Management
We defines operational risks as any and all financial and non-financial risks that may negatively impact its capital management through business operations. Our operational risk management aims to satisfy the regulatory purposes of supervising authorities and to disseminate a risk management culture across the board through strengthened internal controls and improved processes.
Internal Capital Management
Internal capital is required to prevent economic insolvency caused by unexpected losses at the target confidence level. KB Financial Group manages group-wide capital adequacy by measuring, allocating, and managing the internal capital of respective subsidiaries. The Risk Management Committee sets group-level risk appetite and then allocates internal capital by risk type and subsidiary while each subsidiary conducts business within the allocated capital limit.
Stress Testing
Stress tests are performed to analyze the potential vulnerabilities of our portfolio and develop countermeasures accordingly under possible scenarios created based on economic forecasts. KB Financial Group conducts such tests at least semi-annually and sometimes more frequently by reflecting economic cycles and prospects in order to analyze how its operations may be impacted by abrupt changes across the business landscape and to respond to them proactively. Test results are reported to the top management and the Risk Management Committee to help set group-wide risk appetite and limits and promote the decision-making process.
Basel III Internal Ratings Based Approach for Group Credit Risk Management
Following the introduction of the Basel III framework by the Korean Financial Services Commission, KB Financial Group fully prepared the development of the necessary human/physical infrastructure to address such regulatory changes and has adopted these Basel standards in calculating its risk-weighted assets and capital adequacy ratios since December of 2013.
To elevate the level of risk management across subsidiaries, we developed the group-level, single model-based Internal Ratings Based Approach approved by the Korean Financial Supervisory Services through rigorous assessments, which has been under operation since the end of 2016 to calculate group-wide BIS ratios.
This approach is expected to further advance KB Financial Group’s risk management system spanning from risk management methodology and system development to data management and control structure, and establish a risk management culture in addition to improving its capital adequacy, which will in turn strengthen its risk management performance, increase global creditworthiness, and enhance the quality of its business operations across the board.
2020 Risk Management Directions With escalating possibilities of a prolonged global economic slowdown, the domestic economy is also forecast to suffer a continued downturn cycle caused by structural factors that perpetuate low growth. Our awareness of these deteriorating conditions at home and abroad and their resulting potential risks that may threat our endeavors to improve soundness and profitability as a financial institution, helps our risk management focus on minimizing such risks.
As such, KB Financial Group will strengthen the monitoring of subsidiaries so that they maintain their asset quality at the highest possible level among industry peers while promoting proactive risk management of respective subsidiaries concerning volatility in interest rates, exchange rates, stock prices and other market factors to fully address uncertainties in the market. Our risk management will also be further enhanced through proactive response to and monitoring of subsidiaries advancing into the global market and launching new businesses.

001 Introduction026 Core Competency048 Management’s Discussion & Analysis053 Operation Review074 Financial Section317 Appendix
029
Emerging Risk Management
KB Financial Group defines emerging risks as possible upcoming risks posed by economic, environmental, and social changes which may have a grave long-term impact on its business operations, and takes proactive countermeasures to reduce such risks. Primary emerging risks that we identified include “demographic changes caused by low birth rates and aging populations” and “changes in our way of conducting business driven by the innovation of digital finance”. The following illustrates the detailed definition of these risks, their long-term impact on our business, and our countermeasures.
Impact on Businesses
Emerging Risks
Risk Reduction Countermeasures
Demographic changes caused by low birth rates
and aging populations
Change in our way of conducting business driven by the innovation
of digital finance
Population aging and other demographic changes are expected to cause decreases in savings rates and in income levels as elderly borrowers become economically inactive, which will ultimately deteriorate our asset quality.
The asset quality analyses performed on household credit loan borrowers by age group demonstrate that asset quality deteriorates with age.
As the average age of borrowers in our loan portfolio is forecast to increase to face a high probability of income reduction, we are proactively refining our risk management process in preparation for any decline in asset quality caused by the decreasing income levels of the elderly (e.g. operating credit guidelines that consider borrowers’ income and debt burden levels by life cycle stage)
While financial institutions may create innovation-driven growth oppor-tunities through new technology and financial innovation, they may fail to swiftly respond to such changes or be left behind while facing increasing risks in relation to IT, information protection and fraud that may arise with emerging new technology and innovative finance.
New technology or new finance driven by digital financial innovation is widely penetrating the entire value chain of the traditional financial business to change the way we conduct business and create new business models, products and services.
We are taking a stronger proactive risk management approach by intensively analyzing and identifying potential risks and developing countermeasures in preparation for the emergence of new risks from digital financial innovation while fully utilizing new technology from big data to machine learning in improving our risk management infrastructure in order to elevate our core competitive edge in risk management.
Risk Management

KB Financial Group Annual Report 2019030
KB Financial Group is wholeheartedly committed to further improving the intrinsic competitive edge of respective subsidiaries, maximizing synergy through organic collaboration and delivering differentiated and unique comprehensive one-stop services. In 2019, we took a broad range of actions to efficiently create synergistic effects in order to practice customer-oriented management.
Synergy Creation
Group Synergy Strategy
KB Financial Group’s synergy strategy aims to strengthen its competitive edge under the One-Firm philosophy to build a group structural competitive advantage. To this end, we are taking a multi-faceted approach to advancing our One-Firm culture by developing customer-centric processes to enrich customer experiences, reinforcing integrated group-level marketing, and facilitating referral sales across subsidiaries. In 2020, we will identify new business areas on the basis of organic collaboration among subsidiaries, develop integrated group-wide services, and strengthen the seamless alignment between face-to-face and non-face-to-face channels to continue with our endeavors to build a stronger synergistic edge.
Building Customer-centric Processes to Enrich Customer Experience
KB Financial Group enabled customers to purchase the core services of multiple subsidiaries through connected non-face-to-face channels and developed one-stop processes to deliver its financial products, which ultimately improved customer convenience and their product purchase ratio. Our ‘Star Banking’ app allows customers to open their bank account and be issued credit and check cards simultaneously, and our ‘Startable’ app ensures that customers who open their securities account can also apply for card issuance at the same time. This has undoubtedly helped subsidiaries broaden their non-face-to-face product sales channels.
Furthermore, we opened the ‘KB Easy Loan’ service that allows customers to use the ‘Liiv Mate’ app to check their credit loan limits and interest rates simultaneously and even receive recommendations for tailored products and take out loans accordingly across the four banking, credit card, capital, and savings bank subsidiaries. This service diversified our product line-up to cater to wide-ranging customers from those with excellent credit scores to those with mid-to-low scores while streamlining the customer document submission process and adopting a user-centric UI/UX to improve customer convenience. The ‘KB Car Easy Integrated Limit Check’ service was also launched to assist customers in purchasing our products with greater convenience: using our used car trading platform ‘KB Cha Cha Cha’, customers can check their auto loan limits and interest rates, and apply for membership cards and car insurance plans across the three banking, credit card, and capital subsidiaries.
Launching Diverse Products and Services to Generate Synergy
Our wide-ranging package products aim to swiftly respond to the shifting domestic/global financial landscape represented by
demographic shifts and financial consumer behaviors. These products also work to deliver financial products and services that cater to diversifying customer needs. By launching a total of four package products, including a package that emphasizes the social trends of ‘women, retirees, and the environment’ and ‘BTS Collaboration’ that targets youth customers, we strive to elevate KB Financial Group’s One-Firm brand and strengthen customer relationships.
Notably, our Environmental Keeper Action package designed to reflect social concerns over increasing Micro dust issues exceeded 300,000 in the number of accounts sold for nine months, and donations were made to help with urban forestation. Our KBXBTS Package Ⅱ(installment savings and check card), created through collaboration with the world-acclaimed boy band BTS to build our own youth customer base, posted nearly 100,000 in the number of purchases in
34,822 thousand
KB Easy Loan
Reach a total of 34,822 thousand of customers as a result of commitment to customer-centric management
based on synergy creation within the Group
Provide one-stop access to diverse auto financing products within KB Financial Group
Number of Group Customer
One-stop Process Development

001 Introduction026 Core Competency048 Management’s Discussion & Analysis053 Operation Review074 Financial Section317 Appendix
031Synergy Creation
just four months following its release. KB Financial Group intends to gather customer feedback through market research and KB Tribunus Plebis to develop group-level package products that meet financial needs in a more refined manner.
Strengthening Integrated Group-level Marketing
Since we became the first financial institution to establish a joint advertisement process among subsidiaries, we launched another joint mobile advertisement campaign through social network channels to continue with our efforts to strengthen integrated group-level marketing. TVs, digital windows and ATMs installed at our bank branches that are easily accessible by our customers will readily provide information on the products and services offered by our securities and insurance subsidiaries to further broaden synergistic activities undertaken among subsidiaries.
Furthermore, we became the first Korean financial holding company to create promotional contents that publicize the features provided by the major mobile apps of five of our subsidiaries – KB Kookmin Bank’s Liiv Talk Talk, KB Securities’ M-able, KB Insurance’s Mobile Direct, KB Kookmin Card’s Liiv Mate, and KB Capital’s KB ChaChaCha – in order to produce a joint video commercial available on social network channels. The commercial presented a single story that illustrated how to use the respective apps provided by five subsidiaries, and its script was written in a movie scenario format in order to increase viewer ratings. This video commercial received a total of 2.41 million views of Youtube, as of December 2019, and contributed to solidifying our corporate image as a youthful and vibrant business that is willing to pursue change and try something new.
Facilitating Referral Sales and Disseminating the One-Firm Culture
As a way to facilitate referral sales, we migrated subsidiary-specific synergy management systems into an online version to improve the convenience of field sales operations, and expanded employee exchange programs across subsidiaries to further disseminate our One-Firm culture. Notably, the recently renewed group-wide ‘Synergy Performance Management System(2.0)’ was customized with an aim to increase employee convenience: the system makes it easier to identify and manage employees’ synergy activities and utilizes a digital window to streamline the process to request referral sales consent, laying the basis to promote referral sales among subsidiaries.
In addition, ‘Department Head Community’ and ‘Synergy RM Workshop’ are operated to promote interactions among employees across subsidiaries and share major issues related to synergy creation, paving the way for subsidiaries to collaborate on key group-wide initiatives.
10,283 thousand
45.8%
Reach 10,283 thousand of cross-subsidiary customers, up by 333 thousand from the previous year
to significantly expand the customer base
Ratio of customers who use products and services of more than two main subsidiaries
Number of Active Cross-selling Customers
Cross-selling Ratio in 2019
70Number of WM Multi-service Branches
9Improve bank-securities sales efficiency in serving
SME customers at CIB centers – creating synergy among subsidiaries
Number of CIB Multi-service Branches
WM
Broaden the WM coverage between banking and securities

KB Financial Group Annual Report 2019032
Digital Finance
KB Financial Group takes a customer-centric approach in its pursuit of digital innovation. In November 2019, KB Financial Group became the first-ever financial institution to launch its hybrid service dubbed “Liiv M” that combines finance with telecommunication, demonstrating its full commitment to broadening KB’s financial ecosystem and developing a differentiated competitive edge.
In addition, KB Financial Group made 18 applications to create innovative financial services in accordance with the financial regulatory sandbox, and three of them were approved including KB Kookmin Card’s ‘online safe payment service based on credit card points’. In 2020, we plan to make 12 additional applications to continue our pursuit of financial innovation.
Laying the basis for a KB-driven digital ecosystem through proactive collaboration with external tech players
KB Financial Group is reinforcing the competitive edge of its digital platform through collaboration with wide-ranging tech players. More than 373 open APIs were developed to support the seamless alignment between our financial services and external platforms, and CLAYON, a cloud-based innovation platform, was further advanced to pave the way to create a wide array of financial services in the cloud. Specifically, CLAYON became the first in the financial industry to pass the safety test performed on cloud service businesses. This helped to showcase its achievement in building a stable financial cloud environment that will promote external collaboration. We also upgraded our non-face-to-face log collection system to strengthen our customer behavior analytics as a way to facilitate external collaboration and the development of data-enabled digital financial services.
In January 2019, KB Financial Group and LG Group signed an agreement to conduct joint business on the basis of new digital technology: KB’s bank accounts were connected with the blockchain-based local currency pilot service launched within the LG Science Park in Magok, Seoul, to create a platform that allows for real-time charging, payment, and settlement through block sharing with KB blockchain. This was followed by the signing of MOUs with such diverse IT companies as SK C&C, Atomrigs Lab, and Microsoft to develop AI, blockchain and cloud technology.
Furthermore, KB Finnacial Group operates the ‘KB Innovation HUB’ to identify and support startups with high growth potential. Since its launch in March 2015, the KB Innovation HUB has selected high-tech startups as ‘KB Starters’ for their endeavors to create innovative services, and
Delivering an innovative customer experience through non-face-to-face channels from the customer-centric standpoint
KB Financial Group continues to advance its major platform apps – KB Star Banking, Liiv, Liiv ON/Liiv Mate/KB Cha Cha Cha – by improving their UX/UI for increased customer convenience. Notably, the ‘Open Banking’ service, which allows customers to register their accounts at other banks for account checks, transfers and other financial transactions, was adopted for our Star Banking, internet banking, Liiv, and Liiv Talk Talk. The KB My Money was further upgraded to help respond to the shifting data industry landscape and to strengthen our competitive edge as an asset manager. Furthermore, our AI-based customer counseling chatbot service was launched to improve user experiences from financial business counseling to financial term explanations and product recommendations.
To deliver a fresh new and convenient user experience in mobile financial transactions, we unveiled the “KB Mobile Certificate” which enables customers to log in and use their e-signatures without cumbersome physical security measures such security cards or OTPs. The KB Mobile Certificate proved to be an extraordinary success, surpassing 2.5 million users in just six months following its release in July 2019. This new certificate system is set to extend its application from our banking to other subsidiaries in the insurance, card, and securities businesses.
Pursuing diverse financial innovation through deregulatory opportunities allowed within the financial regulatory sandbox
Fully utilizing the financial regulatory sandbox provided by the Korean government, we advanced into the telecommunications business last November, becoming the first Korean financial institution to make such a move, and launched an MVNO based hybrid service dubbed “Liiv M” that combines finance with telecommunications. This service is expected to create new added value through the abundant data generated both from telecommunications and financial industries.
2.5+ million
Surpass 2.5 million of users in just 6 months after launching
Number of Mobile Certificate Users
Liiv MFinancial industry’s first-ever MVNO- based finance-telecommunications hybrid service to generate new added value

033001 Introduction026 Core Competency048 Management’s Discussion & Analysis053 Operation Review074 Financial Section317 Appendix
Digital Finance
intensively nurtured them by connecting these fintech businesses with KB Financial Group subsidiaries. As tangible outcomes were achieved through this initiative over the years, the number of KB Starters reached 76, the cumulative number of partnerships amounted to 113, and investments made through CVC funds and others were valued at nearly KRW 33 billion. In July 2019, the KB Starters became the first in the Korean financial industry to partner with the global accelerator PLUG & PLAY(PNP) to advance into the global market. As such, KB Financial Group continues to support innovative businesses so that promising high-tech startups in Korea can go global and evolve into unicorn companies.
Strengthening core capabilities to advance digital transformation
To swiftly reflect varying customer needs, KB Financial Group is pursuing innovation in the way it conducts business. Diverse devices
are used to digitalize teller operations while an AI-enabled chatbot counseling service was introduced to offer easily accessible and convenient 24/7 counseling in a bid to improve work efficiency and provide high-quality financial counseling to customers. Furthermore, the adoption of Robotics Process Automation(RPA) was expanded to address simple and repetitive processes within subsidiaries, which saved a total of 754,623 hours of work during 2019.
Wide-ranging training programs were provided to assist employees in strengthening their digital competency across all digital-related areas, from digital and IT to data and information protection. The ‘KB Digital Finance ACE Academy’, and ‘Blockchain Expert Training Course’ were operated to secure a core digital workforce, and the recruitment of professionals was increased in the areas of new technology(blockchain, AI, etc.) and app design & planning.
Major Applications of KB Financial Group
KB Kookmin Bank
KB Star Banking
Lliv
Liiv Talk Talk
KB Star Alarm
KB Real Estate Liiv ON
KB My Money
KB Star Corporate Banking
Provide full banking services to retail customers
Provide convenient financial services including currency exchange and remittance
Provide interactive banking and messenger services
Provide financial information notifications
Provide real estate information and relevant specialized services
Provide integrated mobile asset management services
Provide banking services to corporate customers including fund and payment management
KB Kookmin Card
KB Kookmin Card
KB Kookmin App Card (Easy Pay) Kmotion
Liiv Mate
KB Kookmin Card Life #
Support card-related business and financial service contents
Enable on and offline payments and account checks
Provide customer-engaging services including Pointree and day-to-day consumption
Provide card-related collateral services on travel, shopping, and culture
KB Life Insurance KB Life Insurance Provide insurance plan explanations and support contract management services
KB Savings Bank KB Good Banking Support banking and loan services through convenient authentication
KB Insurance KB Insurance
Mobile Direct
Support mobile-only insurance financial services
Support non-face-to-face sales of insurance plans and calculations
KB Securities M-able Provide trading, financial product, and business services
KB Capital KB Cha Cha Cha Provide a platform for online preowned car transaction and other services related to car sales
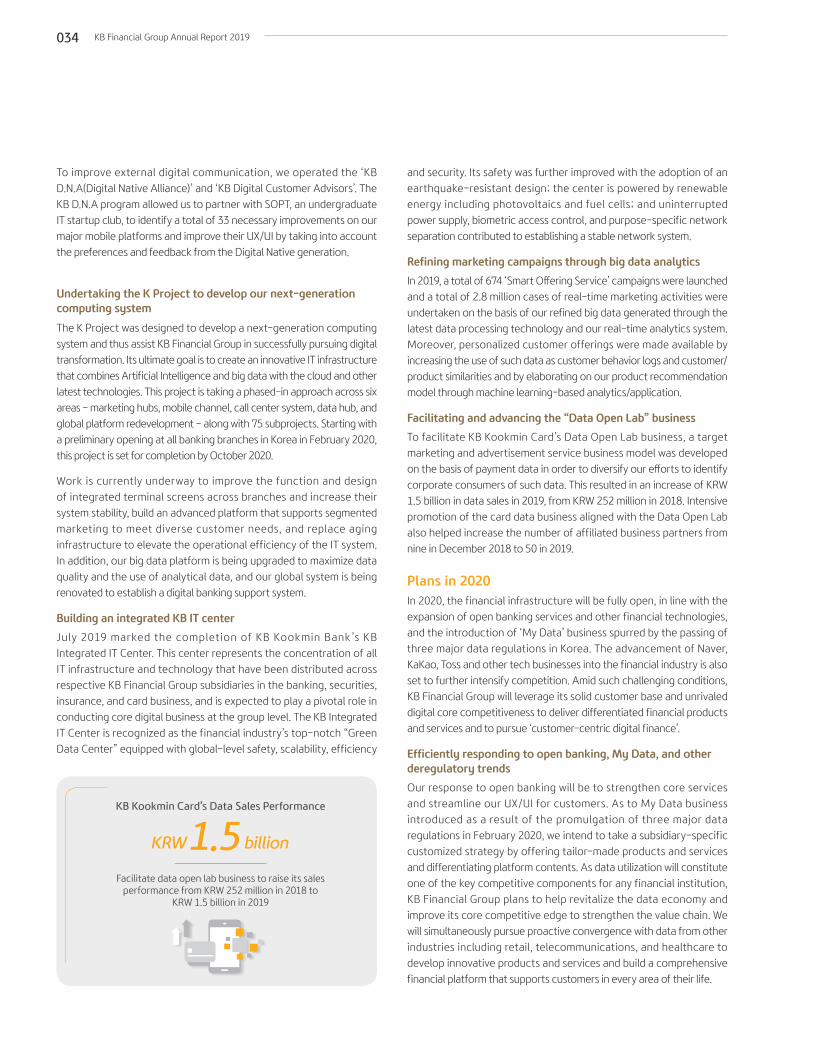
KB Financial Group Annual Report 2019034
Undertaking the K Project to develop our next-generation computing system
The K Project was designed to develop a next-generation computing system and thus assist KB Financial Group in successfully pursuing digital transformation. Its ultimate goal is to create an innovative IT infrastructure that combines Artificial Intelligence and big data with the cloud and other latest technologies. This project is taking a phased-in approach across six areas – marketing hubs, mobile channel, call center system, data hub, and global platform redevelopment – along with 75 subprojects. Starting with a preliminary opening at all banking branches in Korea in February 2020, this project is set for completion by October 2020.
Work is currently underway to improve the function and design of integrated terminal screens across branches and increase their system stability, build an advanced platform that supports segmented marketing to meet diverse customer needs, and replace aging infrastructure to elevate the operational efficiency of the IT system. In addition, our big data platform is being upgraded to maximize data quality and the use of analytical data, and our global system is being renovated to establish a digital banking support system.
Building an integrated KB IT center
July 2019 marked the completion of KB Kookmin Bank’s KB Integrated IT Center. This center represents the concentration of all IT infrastructure and technology that have been distributed across respective KB Financial Group subsidiaries in the banking, securities, insurance, and card business, and is expected to play a pivotal role in conducting core digital business at the group level. The KB Integrated IT Center is recognized as the financial industry’s top-notch “Green Data Center” equipped with global-level safety, scalability, efficiency
and security. Its safety was further improved with the adoption of an earthquake-resistant design; the center is powered by renewable energy including photovoltaics and fuel cells; and uninterrupted power supply, biometric access control, and purpose-specific network separation contributed to establishing a stable network system.
Refining marketing campaigns through big data analytics
In 2019, a total of 674 ‘Smart Offering Service’ campaigns were launched and a total of 2.8 million cases of real-time marketing activities were undertaken on the basis of our refined big data generated through the latest data processing technology and our real-time analytics system. Moreover, personalized customer offerings were made available by increasing the use of such data as customer behavior logs and customer/product similarities and by elaborating on our product recommendation model through machine learning-based analytics/application.
Facilitating and advancing the “Data Open Lab” business
To facilitate KB Kookmin Card’s Data Open Lab business, a target marketing and advertisement service business model was developed on the basis of payment data in order to diversify our efforts to identify corporate consumers of such data. This resulted in an increase of KRW 1.5 billion in data sales in 2019, from KRW 252 million in 2018. Intensive promotion of the card data business aligned with the Data Open Lab also helped increase the number of affiliated business partners from nine in December 2018 to 50 in 2019.
Plans in 2020In 2020, the financial infrastructure will be fully open, in line with the expansion of open banking services and other financial technologies, and the introduction of ‘My Data’ business spurred by the passing of three major data regulations in Korea. The advancement of Naver, KaKao, Toss and other tech businesses into the financial industry is also set to further intensify competition. Amid such challenging conditions, KB Financial Group will leverage its solid customer base and unrivaled digital core competitiveness to deliver differentiated financial products and services and to pursue ‘customer-centric digital finance’.
Efficiently responding to open banking, My Data, and other deregulatory trends
Our response to open banking will be to strengthen core services and streamline our UX/UI for customers. As to My Data business introduced as a result of the promulgation of three major data regulations in February 2020, we intend to take a subsidiary-specific customized strategy by offering tailor-made products and services and differentiating platform contents. As data utilization will constitute one of the key competitive components for any financial institution, KB Financial Group plans to help revitalize the data economy and improve its core competitive edge to strengthen the value chain. We will simultaneously pursue proactive convergence with data from other industries including retail, telecommunications, and healthcare to develop innovative products and services and build a comprehensive financial platform that supports customers in every area of their life.
KRW1.5 billion Facilitate data open lab business to raise its sales
performance from KRW 252 million in 2018 to KRW 1.5 billion in 2019
KB Kookmin Card’s Data Sales Performance
To improve external digital communication, we operated the ‘KB D.N.A(Digital Native Alliance)’ and ‘KB Digital Customer Advisors’. The KB D.N.A program allowed us to partner with SOPT, an undergraduate IT startup club, to identify a total of 33 necessary improvements on our major mobile platforms and improve their UX/UI by taking into account the preferences and feedback from the Digital Native generation.

001 Introduction026 Core Competency048 Management’s Discussion & Analysis053 Operation Review074 Financial Section317 Appendix
035
Leveraging big data to develop and sell products and services
We will further refine our customer targeting through the combination of our structured or non-structured data to broaden real-time tailor-made customer marketing. To this end, we plan to build a data analytics platform and perform big data analyses through wide-ranging channels in order to create new added value. A data governance system will be developed to improve data user convenience, and the use of data assets will be upgraded through improved accessibility. Customer Mind Research that uses search data will be conducted to plan personalized contents and identify new contents based on the intention of potential customers, and a KB data collaborative platform will be created as a new type of data-enabled collaboration system. By fully implementing ‘Liiv M’, our MVNO-based finance-telecommunication hybrid service unveiled in the 2nd half of 2019, we plan to secure new customers and differentiate our platform service. Furthermore, we will strengthen the group-level alignment of financial products and services and leverage the KB Mobile Certificate and USIM to reinforce the connection of mobile platforms across subsidiaries.
Using digital technology to improve efficiency
We will continue to identify the new applications of RPA while combining RPA with wide-ranging digital technologies to improve work efficiency. The Integration of RPA with AI and other digital technologies will help extend the scope of RPA introduction and automate front office operations. Meanwhile, The K project will enable us to deliver an innovative experience to customers and efficient work conditions for employees. To flexibly respond to the rapidly-shifting financial landscape, we plan to establish a horizontal and efficient corporate culture and strengthen internal training to develop a professional IT technology workforce.
Furthermore, cloud, blockchain and other varying digital technologies will be combined to facilitate open innovation and push the boundary of financial services. CLAYON will be equipped with a multi-cloud architecture structure through our contract with AWS and other global cloud service providers to improve its performance while reinforcing its stability.
Cloud-enabled KB Digital Infrastructure
Collaborative development
Affiliation & association
Independent development
Cloud-based collaborative platform
Startup & affiliate
API
API
Star CMS Affiliates
Galaxy KB Star
Liiv Talk Talk (messenger)
Liiv ON (interior
contents)
Liiv (travel
contents)
Liiv (contents)
New product Asset management
Customer management
Transaction/report
Outbound counseling
Branches
Subsidiaries
Savings bank
Capital Card Insurance Securities
Global CMS
Mobile KB
Digital Finance
Phone E-mail Counseling reservation
Chatbot
Counseling center
Chat
Retail customer
Corp
orat
e custo
mer
Global custo
mer

KB Financial Group Annual Report 2019036
Global Business
KB Financial Group takes a multi-faceted approach to strengthen its global business capability and position. We leverage the assets owned by respective subsidiaries and the business capabilities we have developed in retail banking and other diverse areas while comprehensively considering new types of market entry made available with the development of digital technology in order to broaden our global business presence in a way that suits country-specific market conditions.
Over the years, KB Financial Group has advanced into digital banking, auto financing, MFI, and securities businesses in Cambodia, Laos, Myanmar, Vietnam, and Indonesia to further understand and experience these Southeast Asian markets. While we strike the right balance between organic growth based on our existing network and inorganic growth promoted through subsidiary-level M&As to effectively use our resources, we also focus on a limited number of hub candidates, rather than multiple countries, to transform these target countries into our ‘Mother Markets’. In parallel, we also opened IB Units in Hong Kong, London and New York as our regional IB operation hub to broaden our business line-up in mature markets and explore diverse global market entry options. As such, we follow a two-track strategy to tap into both emerging and advanced markets.
In October 2019, KB Financial Group signed an MOU to form a strategic alliance with Stifel Financial, a U.S.-based firm with multiple subsidiaries in the securities, banking, and asset management businesses, to promote mutual investment cooperation. This will serve to develop a close collaboration system in each other’s business areas – CIB, WM,
Accelerating Globalization
and asset management – and jointly explore diverse collaborative and new business opportunities. Starting with U.S. stock brokerage and research that draws growing interest from domestic institutional and retail customers, our collaboration will extend its scope into other areas including but not limited to IB deals, financial investment product sourcing, and PI investments.
In January 2020, KB Kookmin Bank signed a stock purchase agreement to acquire a 70% stake in PRASAC Microfinance, Cambodia’s largest Microfinance Deposit-taking Institution(MDI). With a local network of 117 locations, PRASAC represents the nation’s largest MDI and is ranked third in loan market share. KB Kookmin Bank plans to transform PRASAC into a commercial bank to transfer its exceptional retail capabilities and help PRASAC evolve into a leading bank in Cambodia in order to broaden its business presence in Southeast Asia.
KB Kookmin Bank’s Hanoi Office in Vietnam and its Gurugram Office in India were transformed into branches following the preliminary approval granted from the local financial authorities, and initiated their operation in February 2019. Specifically, we are keeping an eye on the Indian market as India is home to the world’s second largest population, is posting continued high economic growth in the 7% range, and is rapidly growing its trade with Korea, and we plan to continuously expand our branch network in the country to accelerate our advancement into the Indian market.
KB Securities’ local Vietnamese subsidiary KB Securities Vietnam(KBSV) opened its 4th Vietnamese branch in Saigon in January 2019, and
2016
2017
2018
2019
Cambodia
Launched Liiv KB Cambodia(digital banking)
Vietnam
Acquired Maritime Securities Incorporation(MSI), a local securities firm
Laos
Established KB KOLAO Leasing (auto financing)
Myanmar
Established KB MFI Myanmar
Indonesia
Acquired a 22% stake in Bank Bukopin
Cambodia
Launched KB Daehan Specialized Bank as a credit finance business
Vietnam
Launched KB Securities Vietnam, formerly known as MSI
Cambodia
· Acquired 70% stake in PRASAC, the largest local MDI
· Liiv KB Cambodia reached 98 thousand users
· KB Daehan Specialized Bank recorded USD 0.29 million net income for three quaters 2019
Vietnam
KB Securities Vietnam raised KRW 70 billion of capital and ranked 10th largest securities company in Vietnam

Global Business Strategy
ORGANIC INORGANIC
KB network expansion M&As
KB MFI Myanmar
KB KOLAO LeasingKB Kookmin Bank’s
overseas branch network
PRASAC Microfinance
Institution Limited
Maritime Securities
Incorporation
Tomato Specialized
Bank
Bank Bukopin
001 Introduction026 Core Competency048 Management’s Discussion & Analysis053 Operation Review074 Financial Section317 Appendix
037Global Business
Plans in 2020To expand its global business presence, KB Financial Group will follow a two-track strategy to focus on ‘Southeast Asia expected to achieve high growth’ and ‘U.S. and other advanced markets known for their high investment stability and favored by Korean customers as an overseas investment destination’.
In Southeast Asia, we will target Vietnam, a country posting rapid economic growth and attracting numerous Korean businesses, Indonesia, the region’s largest market, and the three countries of Myanmar, Cambodia, and Laos situated along the Mekong River. To broaden our global business in these countries, we will continue with M&As on the subsidiary level and pursue the organic growth of the existing network.
In the U.S. and other mature markets, our market entry and expansion strategy will focus on ‘securing stable growth drivers across the group portfolio’ and ‘developing global capabilities in the WM/CIB/asset management sectors’.
increased its capital by nearly KRW 70 billion to join the top 10 local businesses based on the size of equity capital. KBSV plans to focus on its retail operations and strengthen IB capabilities and improve S&T profits as part of its growth strategy through collaboration with KB Securities head office in Korea.
In November 2019, KB Kookmin Card signed a stock purchase agreement to acquire an 80% stake in ‘PT Finansia Multi Finance’, a local Indonesian credit finance company conducting business in auto, motorbike, and durable goods installment financing in Jakarta, Indonesia. KB Kookmin Card plans to expand installment financing products that cater to local customer needs to focus on high-quality assets while partnering with local mobile platform operators to expand digitally-based non-face-to-face operational channels.
In February 2019, KB Capital signed an agreement to acquire an 85% stake in ‘PT Sunindo Parama Finance’ in Indonesia. This will enable KB Capital to expand its installment finance business from new car purchases into used cars and consumer goods as well as the car rental business.
Target ratio of the group net income
20% within 10 years

KB Financial Group Annual Report 2019038
Global NetworkKB Financial Group is accelerating its advancement into the global market to overcome the growth limits in the domestic financial market, pursue sustainable growth, and realize its value creation potential. Notably, these endeavors to expand our global presence are focused on CIB, retail banking, digitalization, and asset management, and a business-specific approach is taken in consideration of a full range of factors, from local regulatory environments and demographics to financial industry infrastructure and growing offshore investment demand among domestic investors.
KB Kookmin Bank
38KB Securities
7 KB Insurance
10 KB Kookmin Card
2 KB Asset Management
3 KB Capital
1
Overseas Network 61
U.K. KB Kookmin Bank 1
India KB Kookmin Bank 1
ChinaKB Kookmin Bank 6KB Securities 1 KB Insurance 2 KB Asset Management 1
New ZealandKB Kookmin Bank 1
JapanKB Kookmin Bank 1

001 Introduction026 Core Competency048 Management’s Discussion & Analysis053 Operation Review074 Financial Section317 Appendix
039Global Network
U.S. KB Kookmin Bank 1
KB Securities 1 KB Insurance 3
Net income from global operations (USD in millions)
Total assets of global operations (USD in millions)
* Excluding non-recurring items (Including changes in criteria used to calculate banking reserves)
2017 2018 2019
6.5
51.5
44.1
2017 2018 2019
6,208
7,645
10,891
Primary Countries of Focus
Over the years, KB Financial Group has made inroads into the digital banking, auto financing, microfinance, and securities sectors in Cambodia, Laos, Myanmar, and Vietnam. Our strategy is to develop understanding and accumulate experience in these Southeast Asian markets and to focus on a select number of target countries.
Acquired a 70% stake
PRASACDevelop PRASAC into Cambodia’s leading bank to broaden our business presence across Southeast Asia
Cambodia
Recent Achievements
Signed a SPA to acquire an 80% stake
PT Finansia Multi FinanceExpand installment financing product line-ups that cater to local customer characteristics as well as non-face-to-face digital channels
Indonesia
Southeast Asia
Myanmar KB Kookmin Bank 18 KB Kookmin Card 1
CambodiaKB Kookmin Bank 6KB Kookmin Card 1
Laos KB Capital 1
VietnamKB Kookmin Bank 2 KB Securities 4 KB Insurance 2KB Asset Management 1
Singapore KB Asset Management 1
Indonesia KB Kookmin Bank 1 KB Insurance 3
Hong Kong KB Kookmin Bank 1 KB Securities 1
KB Financial Group added four new locations in 2019 to reach a total of 42 in its Southeast Asian network.
38.4*

KB Financial Group Annual Report 2019040
In pursuit of responsible finance that cares for the environment and society, KB Financial Group adopted ESG standards across the entire business conduct to establish and operate a sustainability management system. We have set the three key strategic directions of promoting ESG-based innovative growth for sustainable finance, advancing our climate change strategy for the environment, and internalizing accountability management, and are committed to fulfilling our role as a financial leader in ESG management both in Korea and abroad.
Strengthening global ESG leadership by proactively endorsing international initiatives
KB Financial Group is committed to fulfilling its leading role in ESG by proactively joining global initiatives and international organizations. In September 2019, we signed up for ‘The Principles for Responsible Banking’ of the UNEP Finance Initiative (UNEP FI), which were presented to the banking industry to reach the social goals set under the UN Sustainable Development Goals and the Paris Agreement.
We are the only Korean financial business to join the ‘UNEP Collective Commitment to Climate Action’ which, as a follow-up implementation program for the signatories to the above-mentioned principles, was attended by 31 institutions to take climate-friendly actions by reducing carbon-intensive business in corporate operations while increasing the ratio of green business. In addition to the UNEP FI, we are also actively participating in the UN Global Compact, Carbon Disclosure Project, Task Force on Climate-related Financial Disclosures and other global initiatives on sustainability management. We have also recently assisted in the development of the UNEP FI and EU Taxonomy guidelines for banks designed to adopt a global green investment classification system in performing banking credit reviews.
Furthermore, we officially endorsed the Women’s Empowerment Principles (WEPs) to create a corporate culture that respects gender equality, inclusiveness and diversity.
Pursuing sustainable finance by playing a leading role in the ESG financial market
KB Financial Group is an active player in undertaking renewable energy projects, and is working to make our society greener. Since 2007, we have served as a financial advisor and syndicated loan underwriter on wide-ranging renewable energy projects including photovoltaics, wind, and fuel cells. As a leading financial institution in the renewable energy sector, we were chosen as a financial advisor and lead arranger for such large-scale renewable power generation projects as Jeju Hanlim offshore wind, Solaseado photovoltaics, Yeongam PV Power Plant, and Incheon fuel cell power generation.
KB Securities created a blind fund with a Canadian investment and management company with expertise in the resource and energy sector and is conducting a PV power generation business following the acquisition of the required business license. KB Asset Management has increased its renewable energy investments since 2007 to surpass KRW 1 trillion in cumulative investments in the offshore PV, biogas and PV-connected energy storage system business while investing in the overseas PV power generation business and actively advancing into the global market to diversify its investment destinations.
As climate change, ranging from global warming to Microdust issues, is exerting an even greater impact on our life today, KB Financial Group is developing a range of green financial instruments.
ESG Management
Leading ESG-driven Sustainability Management
Expand ESG products
Pursue inclusive finance
Integrate ESG factors in loan & investment process
1Promote ESG-based innovative growth for sustainable finance
Expand social contribution
Achieve shared growth and co-prosperity
Respect human rights and diversity
3Internalize responsible
management for society
Set and manage carbon targets
Manage environmental risk
Lead green finance ecosystem
2Advance our climate change strategy for the environment

001 Introduction026 Core Competency048 Management’s Discussion & Analysis053 Operation Review074 Financial Section317 Appendix
041ESG Management
Included in the eco-friendly product portfolio provided by KB Kookmin Bank are the ‘KB Clean Sky’ package which consists of installment savings and trust to help resolve microdust issues, ‘environmentally- responsible investment fund offerings’ that invest in companies with solid ESG performance to pursue long-term profits, ‘KB Green Growth Loans’ that benefit green growth companies through prime rates while donating a portion of the profits to green growth associations, green loan products such as energy use rationalization funds and environmental industry promotion funds, and ‘Preferential Loans for PV Power Plant Businesses’ eligible for green power generators.
KB Kookmin Card’s Green Card allows consumers who purchase eco-friendly products to accumulate eco-money points as a way to pursue green finance. KB Life Insurance developed the Environmental Love Hospitalization Plan (non-participating term insurance) that covers hospitalization caused by diseases stemming from the environment. KB Insurance included special provisions that offer discounts on the use of public transportation, low mileage and the consumption of green automobile parts. KB Asset Management delivers diverse funds that support the growth of the domestic and international renewable energy industry to expand group-wide green business investments while practicing eco-friendly management by launching sustainable finance products, taking the lead in improving corporate competitiveness and fulfilling social responsibility.
KB Kookmin Bank established a sustainable finance management system to strengthen its support for eco-friendly and socially-responsible business. Not only does this system comply with the ‘Sustainability Bond Guideline’ developed by the International Capital Market Association, but also is recognized for its excellence as demonstrated by the evaluation report prepared by the world-renowned ESG financial consulting firm ‘Sustainalytics’. KB Kookmin Bank became the first-ever Korean commercial bank to issue sustainability bonds in October 2018, and then successfully priced a sustainability subordinated bond offering in February 2019.
This issuance garnered much attention from investors and overseas media outlets as the bank became Asia’s first to offer such sustainability subordinated bonds. Their proceeds were used to finance qualified investment projects and extend loans designed to assist socially-vulnerable groups and create jobs for these individuals, develop renewable energy, and support the environmental improvement business.
Elevating our reputation as a corporate leader through strategic response to international sustainability management assessments
KB Financial Group was included in the ‘DJSI World Index’, the global-level index among the Dow Jones Sustainability Index family, for four consecutive years in recognition of its strong commitment to fulfilling ESG responsibility. The DJSI is globally accepted for its credibility in evaluating corporate sustainability management performance, and the
index family consists of DJSI World as the highest level index, DJSI Asia Pacific, DJSI Korea, and others.
Furthermore, we obtained ‘leadership A-‘ in the ‘Climate Change 2019’ published by the Carbon Disclosure Project (CDP) known for its credibility in the environmental sector. Through sustained commitment to gender equality, we became the first Korean business to be listed on the Bloomberg Gender-Equality Index for two consecutive years for our efforts in building a corporate culture that promotes gender equality through female leadership and talent development.
In Korea, we were granted an overall A+ in the ‘2019 ESG Evaluation by the Korea Corporate Governance Service’, which shows that our top-notch performance in sustainability management is widely acknowledged both internally and externally.
Publishing the 2018 KB Financial Group Sustainability Report
KB Financial Group ensures efficient communication on its sustainability management capabilities through the disclosure of key material issues and management data. KB Financial Group publishes sustainability reports by reflecting the outcomes of surveys conducted on internal/external stakeholders concerning wide-ranging sustainability management issues as well as those material issues identified through the materiality test.
Notably, the 2018 KB Financial Group Sustainability Report illustrated material issues on customers, innovation, environment, social responsibility, and employees, its sustainability management system spanning governance, business ethics, integrated risk management, and human rights management, and its sustainability management achievements in relation to customers, local communities, environment, employees and economy. In so doing, we disclose our performance in the areas of management, environment, safety, and society to strengthen our communication with investors, shareholders, customers and other stakeholders and earn their trust.
Listed for 4 Consecutive Years
Gained global top-level recognition in risk management, customer relationship management, inclusive finance,
and anti-financial crime policy
DJSI World Index

KB Financial Group Annual Report 2019042
ESG Strategy Directions in 2020Pursuing ESG-driven innovative growth for sustainable finance
KB Financial Group aims to extend the application of its ESG factors in its products and services to drive sustainable finance. To continue our endeavors to promote innovative growth in the ESG sector, we will focus on the following initiatives: 1) expand ESG-based products, including green renewable energy investment instruments, 2) Pursue inclusive finance aimed at protecting financially underserved groups and providing them with stable financial services, 3) integrate advanced ESG factors to examination of loans and investments.
Advancing our climate change strategy for the environment
We will advance our climate change strategy to address continuously emerging environmental issues. We intend to take the lead in creating green finance ecosystem: 1) we will control carbon emissions by setting reduction targets, systematically managing data and monitoring reduction outcomes 2) we will manage environmental risk by identifying climate change-induced risk factors and opportunities and communicating with internal/external stakeholders 3) we will form partnerships to proactively respond to climate change.
Internalizing responsible management for better society
We continue to fulfill our social responsibility and create value by embedding responsible management into our day-to-day business operations. We plan to expand ESG-aligned social contribution programs to create social impact and to advance the business capabilities of SMEs, suppliers, innovators, and startups to ensure shared growth and co-prosperity with them. KB also makes a concerted effort to improve employee welfare, ensure safe working environment, and respect diversity, thereby implementing inclusivity and social responsibility.
Adopting the Stewardship Code to enhance our corporate value and investor benefits
KB Financial Group adopted the Stewardship Code as part of its fiduciary duty policy for the six major subsidiaries of KB Kookmin Bank, KB Securities, KB Insurance, KB Life Insurance, KB Asset Management, and KB Investment. This allows us to reflect non-financial ESG components as well as financial ones in measuring corporate value in order to strengthen our role as a fiduciary in inducing the growth of our investees and increasing mid to long-term returns on customer assets. Furthermore, we developed our conflicts of interest policy to prevent the occurrence of such conflicts in fulfilling our fiduciary duty while implementing internal control regulations and compliance manuals to uphold the principle that investor interests take precedence over the interests of KB Financial Group, its shareholders and employees and that the mutual interests of investors should be equally addressed. In faithfully performing our fiduciary duty as a shareholder, we make our voices heard in business conduct and facilitate the maximization of shareholder interests while ensuring the robust operation of market surveillance mechanisms. In so doing, we help change corporate governance for the better and increase corporate value, ultimately advancing the rights and interests of our customers.
USD 450 million
Rated A+ K Innovative Finance Council
KB Kookmin Bank placing Asia’s first USD 450 million foreign currency-denominated subordinated
sustainability bonds (Feb. 2019)
Rated overall grade A+ in ESG assessments and named Most Excellent in Corporate Governance for 2 consecutive years by the Korea Corporate Governance Services in 2019
KB Financial Group establishing the ‘K Innovative Finance Council’ to support the innovative growth of
startups, venture capitals and SMEs (Apr. 2019)
Asia’s First
Korea Corporate Governance Service(KCGS)

001 Introduction026 Core Competency048 Management’s Discussion & Analysis053 Operation Review074 Financial Section317 Appendix
043Social Contribution
Social Contribution
With the mission of “Financial Services Delivering Changes-Happier Life & Better World”, KB Financial Group undertakes wide-ranging social contribution initiatives to fulfill its social responsibility and become a sustainable financial institution that grows hand-in-hand with society. Any and all social contribution initiatives of KB Financial Group are founded upon the CSR system illustrated below, and respective subsidiaries implement strategic social contribution programs on the basis of group-wide core business areas.
Fostering Future Generations
Supporting the growth base for youths and multicultural families
Since the establishment of the holding company in 2008, KB Financial Group has consistently launched social contribution programs to lay the basis for children and teens to grow into healthy members of society, and is taking the lead to support multicultural groups to bring inclusiveness and diversity to our society.
We signed a business agreement with the Ministry of Education in 2018 to help ‘fill the void of care’, a chronic and challenging social issue,
as one of our key focus areas in fostering future generations. Under this agreement, we will provide a total of KRW 75 billion by 2022 to establish and expand elementary afterschool care spaces and national kindergartens situated next to elementary school. Our assistance allowed numerous students to receive care services, and this is expected to bring positive ripple effects, from the early reinstatement of parents whose career was discontinued due to childcare burdens to the creation of new jobs at afterschool care facilities. As of last year, we helped create 976 afterschool care classrooms at 639 schools, and we will increase the number of these classrooms to 2,500 by 2022 to benefit more than 50,000 children.
KB Financial Group’s CSR System
KB Financial Group set the overarching directions of its CSR initiatives as ‘Fostering future generations’ and ‘Creating greater social value’, and
these initiatives are focused on the areas of ‘youth & multicultural family’, ‘employment’, ‘local community’ and ‘environment’ in alignment
with UN’s Sustainable Development Goals(SDGs).
· Dreaming Youth KB - Mentoring youth!
· Dreaming School Establish and expand kindergartens attached to national schools and elementary afterschool are programs
Youth & Multicultural Families
· Dreaming Neighbors Community development
· Dreaming Global Global support
Local Community
· Dreaming Job KB Good Job
· Dreaming Impact Support for social enterprises
Employment
· Dreaming City Urban regeneration
· Dreaming Green Eco-friendly business
Environment
Financial Services Delivering Changes Happier Life & Better World
· Support the growth base for ‘Youth & Multicultural Families’
· Provide ‘Education on Economy and Finance’ using our financial expertise
· Support to resolve social needs · Support for the shared growth of local communities
Fostering Next
Generation
Creating Greater Social
Value

KB Financial Group Annual Report 2019044
and operate itinerant learning sessions and economic education camps. ‘Liiv School’ opened as an experience-based learning center in Suncheon, Jeollanam-do and has been under year-round operation, and the contents for social networks were created through collaboration with undergraduate students to deliver customized economic and financial education to future generations. As of last year, KB Financial Group’s economic and financial education benefited more than 172,000 people.
Creating Greater Social Value
Supporting the resolution of social needs and shared growth with local communities
KB Financial Group makes use of the inherent characteristics of respective business areas based on its wide-ranging business portfolio that include banking, securities, and insurance with an aim to create greater social value. .
We formed a social investment fund with K-Growth to create a social financial ecosystem that nurtures social enterprises and promotes their self-reliance. Valued at KRW 100 billion, this fund invests in social enterprises capable of creating a positive impact in the areas of society and environment in compliance with the UN SDGs. These investments are made in social ventures that generate meaningful social impact as well as certified social enterprises to pursue both
We provide a range of educational programs to bring hope to future generations so that they can pursue their dreams. With ‘mentoring’ as the key agenda, KB Kookmin Bank is implementing a systemic CSR business portfolio: ‘Mentoring for Learning’ targets teens from low-income or multicultural families who often lack learning opportunities to provide one-on-two mentoring, English learning, and scholarships; ‘Mentoring for Career Path’ offers diverse career experience programs to help these teens make a suitable career choice; ‘Mentoring for Digital Future’ aims to nurture creative talent desired by the 4th Industrial Revolution era. KB Securities and KB Insurance help improve the learning and residential environment for children and teens from low-income families while KB Kookmin Card provides arts, music and sports educational programs to children with disabilities to help them stand on their own feet.
KB Financial Group offers continued support for ‘Korean learning’ as it constitutes an essential component in helping multicultural individuals adapt to Korean society, and assists them in obtaining the qualifications required for employment and receiving vocational training. Notably, our ‘KB Rainbow Love Camp’ and ‘Multicultural Understanding Classroom’ have been established as one of KB Financial Group’s unique programs that allow these children to expand their horizons and increase mutual understanding and exchange. We also care for North Korean adolescent refugees by supporting their school facilities and offering education to help them gain personal identity, which will surely contribute to their becoming a healthy member of our society.
Our social contribution initiatives also include ‘economic & financial education’ that leverages our competency as a financial institution. Since the establishment of the ‘KB Foundation’ as a non-profit foundation, we have provided wide-ranging economic and financial education programs over the past decade to make these programs a major part of our social contribution activities and to present new directions for economic and financial education through different programs and teaching methods that cater to changing social needs. The foundation created a group of professional instructors for economic and financial education to visit elementary/middle/high schools, military units, and big supermarkets to offer education
Bring positive rippling effects by helping parents who experienced career discontinuation to return to work
and by creating new jobs opportunities
976 classrooms created
at 639 schools in total
KRW 30 billion Support the construction and expansion of national
kindergartens situated next to elementary school as well as elementary afterschool care classrooms
(a total of KRW 75 billion to be provided by 2022)
Support for Afterschool Care Services

001 Introduction026 Core Competency048 Management’s Discussion & Analysis053 Operation Review074 Financial Section317 Appendix
045
social and financial outcomes. As of 2019, the ‘KB Social Investment Fund’ invested in 10 enterprises and its investments amounted to KRW 10 billion. In August 2018, KB Investment which manages the venture capital business of KB Financial Group also created the ‘KB Social Impact Fund’ worth KRW 15 billion in conjunction with the Korea Fund of Funds to help promote social enterprises.
Our ‘KB Good Job’ program has been under operation since 2011 to help create high-quality jobs. The KB Good Job website contains a variety of employment information as well as consulting information regarding CV and interview preparation to offer substantial assistance to young job seekers. As of the end of 2019, nearly 59,000 cases of employment information were made available through KB Good Job. The annual ‘KB Good Job Fair’ has been hosted to bring together profitable small and medium sized businesses and job seekers: it has been held 16 occasions over the years, the cumulative number of visitors amounted to 317,100, and 10,800 cases of job placement have been recorded to make it the largest job fair supervised by a private business in Korea. In particular, businesses who hire during the job fair period and retain employment for a designated period of time are provided with grants to encourage their recruitment and guarantee stable employment. ‘KB Good Job Academy’ and ‘KB Good Job School’ are also operated to improve job seekers’ employment
capabilities and help resolve unemployment issues.
As recently emerging environmental issues require our concerted efforts among governments, people and businesses, KB Financial Group is taking the lead in fulfilling its social responsibility through varying eco-friendly social contribution programs. The ‘KB Kookmin Bank Forest’ was created in Mongolia, where yellow dust and microdust originate from, to lower microdust levels while air purifiers were installed at local children’s centers as microdust poses higher risks to children. Educational books were also published in line with this initiative and environmental education was provided to teens to help them develop a sense of stewardship towards the environment. Furthermore, eco-friendly financial instruments are developed to engage customers in our social contribution initiatives. We’ve become the first in the financial industry to release the ‘KB Clean Sky Financial Package’ to encourage consumers to voluntarily help in resolving microdust issues: donations raised through its proceeds go to create forests in urban areas and provide eco-friendly condensing boilers to welfare facilities. In so doing, we conserve the environment for our future generations and create a sustainable society.
KB Financial Group also endeavors on diverse fronts to pursue shared growth with the global community. KB Kookmin Bank offers health care services to immigrant workers living in Korea and helps Cambodian children suffering from heart disease pay for their surgery, and since 2008, 527 undergraduates have joined its global volunteer group ‘RaonAtti’ to volunteer in less-developed countries. KB Securities initiated the Rainbow Classroom program to create a quality learning environment for teens in underdeveloped countries, and KB Insurance launched ‘Lighting Children’ as a green energy sharing campaign to encourage its employees to assemble photovoltaic lanterns and donate them to countries suffering energy shortages to help local children enjoy better living conditions. KB Daehan Specialized Bank, KB Kookmin Card’s Cambodian subsidiary, signed a business agreement with the local social enterprise ‘SmartCraft’ to use its upcycling products as promotional gifts given to customers worth USD 10,000, taking a continued journey for shared growth with the international community.
Social Contribution
Serve as a venue for job matching by linking outstanding SMEs with job seekers
"KB Good Job" hosted on 16 occasions with cumulative
317,100 visitors
KRW 10 billionin 10 companies
Operate social venture funds to pursue both social benefits and financial profits
Investment in KB Social Investment Funds

KB Financial Group Annual Report 2019046
KB Securities
Under the slogan ‘Wholehearted, Warm KB Securities’, KB Securities undertakes varying social contribution programs in the areas of ‘organizational culture of sharing and participation’, ‘youth & multicultural family’ and ‘community-friendly social contribution’. As its leading social-giving program, the ‘Rainbow Classroom’ aims to create a favorable learning environment for underprivileged youths by renovating learning spaces, creating a library, and donating books. Since 2009, this program has benefited 12 schools in Korea and three schools overseas, and opened the 15th Rainbow Classroom at the Saemsotneun Children Center in Seoguipo City, Jeju Island, in 2019. Included in other social contribution activities are the ‘Hands-On’ programs designed to donate homemade items, ranging from ‘KB facial masks’ and ‘filial piety carnation flowers’ given to seniors living alone to ‘soap of life’ donated to children and families in impoverished countries.
KB Insurance With the vision of “Becoming a company delivering hope to the public”, KB Insurance continues to practice sharing-focused management. Driven by the three core strategies of “intensive support for children”, “community-friendly social contribution” and “organizational culture of sharing and participation”, KB Insurance operates volunteer groups and improves residential conditions for children and teens, among other diverse social-giving programs. Notably, KB Insurance’s 190 volunteer groups composed of employees and sales representatives proactively lent their helping hand to reach nearly 16,000 hours in volunteer hours in 2019.
KB Kookmin Card
KB Kookmin Card practices the spirit of sharing in the three areas of youth, multi-cultural family, and public interest. In the youth education sector, KB Kookmin Card provides economic and financial education every year to nearly 10,000 elementary/middle/high school students to help them develop reasonable consumption habits. The ‘Fine Arts & Physical Education Program for Children with Disability’ has been under operation to sponsor a total of 241 teens with disabilities, including 91 in arts and 150 in sports. KB Kookmin Card
Major Social Contribution Initiatives by Subsidiary
KB Kookmin Bank
KB Kookmin Bank’s wide-ranging social contribution initiatives aims to encourage the healthy growth of teens and nurture future talent. Its leading social contribution program named ‘KB-Mentoring youth!’ consists of mentoring and support projects in the three areas of Learning, Career Path, and Digital Future: Mentoring for Learning provides learning support for teens from low-income/multicultural families who often lack educational opportunities; Mentoring for Career Path assists teens in attending diverse career experience programs; Mentoring for Digital Future supports coding education and other software education programs.
In the five key areas of ‘Dreaming Youth, Green, Global, Neighbor, and Culture’, a wide range of programs are implemented by offering economic and financial education, launching environment-linked products, and providing health care support for immigrant workers.
KB Kookmin Card supports teens with disabilities including 91 teens in arts and 150 teens in sports to provide
a systemic educational opportunity.
Educational Sponsorship Program for Teens with Disabilities
241 teens
16,000 hours
KB Insurance operates 190 volunteer teams that consist of employees and sales agents to undertake
a range of campaigns and social-giving programs across local communities.
Employee Volunteer Hours

001 Introduction026 Core Competency048 Management’s Discussion & Analysis053 Operation Review074 Financial Section317 Appendix
047
Employee Love-Sharing Blood Donation
1,100+KB Kookmin Card donated
nearly 1,100 blood donor cards to help children with leukemia via 'Employee Love-Sharing
Blood Donation' campaign since 2014.
also sends gift sets that consist of a backpack, school supplies, and an encouraging letter to children from low-income families who will be first graders that year, benefiting nearly 10,200 children over the years.
In the global sector, KB Kookmin Card offers Korean language education to children from multicultural families and North Korean refugees who face difficulties in learning and adapting to Korean society. Each year, 160 children receive personalized education from Korean language teachers for six hours per week. In addition, KB Kookmin Card employees have made Love T-shirts and donated them to children overseas since 2017, and its labor and management have jointly launched overseas volunteer activities since 2019 to extend classrooms and donate necessary equipment.
In the public interest sector, KB Kookmin Card has operated the ‘Employee Love-Sharing Blood Donation’ campaign biannually since 2014 to donate nearly 1,100 blood donor cards raised through the event to help children with leukemia. The company also initiated social-giving programs designed to bridge the social divide in 2019, ranging from turning non-regular workers into fulltime employees and improving working conditions to creating jobs for youth and supporting employment stability for low-income workers.
Social Contribution
All KB Financial Group subsidiaries are engaged in a wide array of social contribution programs. KB Asset Management visits senior welfare centers to help distribute meals and tidy up the facility, and designated each last Wednesday of the month as ‘Day of Social Contribution’ to undertake hands-on volunteering. KB Capital donates various items for underprivileged youths and has made financial donations to people who have been displaced.
KB Life Insurance offers scholarships to children whose parents work in the social welfare sector and its employees donate their blood, sign an organ donation pledge, tend to the upkeep of parks, and participate in environmental cleanups. KB Real Estate Trust offers learning guidance to children, provides vocational training and rehabilitation assistance to people with disabilities, and supports orphaned infants and toddlers. The company has helped improve the environment at the Seoul Forest since 2019 by rooting out noxious plants and clean up the environment.
KB Savings Bank has regularly sponsored and volunteered at the ‘Home of St. Paul Hasang’, a soup kitchen for the underprivileged, for the past seven years while supporting the livelihood of the less-fortunate in local communities and cleaning up the areas in the vicinity of its branches in order to pursue co-prosperity with local communities. KB Investment has volunteered at nursing homes every year since 2006 and is donating kimchi to multicultural families and seniors living alone. KB Data Systems visits senior welfare centers to help serve meals while making financial donations to youth residence facilities and holding just-for-fun soccer matches with teens living in these facilities. KB Credit Information offers meal services at soup kitchens, hands-on volunteering, blood donation cards, and environmental cleanups near its head office and other worksites.

KB Financial Group Annual Report 2019048
Management’s Discussion & Analysis
In 2019, the Korean economy slowed down due to global economic uncertainties and the continued shrinkage in domestic economic activities. In the face of these challenging business conditions, KB Financial Group strengthened its future growth driver and digital competitiveness to pave the way for its sustained growth into Asia’s leading global financial group. We pursued stability and balance in asset growth to reinforce our earnings fundamental while relentlessly improving the credit portfolio with our proved conservative risk management.
As to business results in 2019, KB Financial Group’s total assets rose by KRW 38.9 trillion from the previous year to KRW 518.5 trillion, which is attributable to the solid asset growth mostly focused on prime household and SME loans. Net interest income increased mostly led by quality loan growth and our endeavors to defend margins. Non-interest income also increased contributed to improvement performance in trusts and IB businesses as well as securities, F/X and derivatives. The Group’s net income posted KRW 3,311.8 billion, increased by KRW 250.6 billion from the previous year. In asset quality, the group NPL ratio fell by 0.11%p from the previous year to 0.48%. This is mainly due to our continued commitment to improving credit quality of loan portfolio by increasing portion of prime quality assets while reducing potential non-performing loans and continuing preemptive and conservative risk management. Under Basel III, group BIS ratio and CET 1 ratio are to mark 14.48% and 13.59% respectively. The capital adequacy ratios of the Group and other subsidiaries have remained stable above the regulatory standards set by financial supervisors.
Asset GrowthAs of the end of 2019, KB Financial Group’s total assets reached to KRW 518.5 trillion, rose by KRW 38.9 trillion, 8.1% from the previous year mainly in loans and financial investments. This is primarily attributable to loans in won growth driven by retail unsecured loans and prime SME loan, by KRW 11.6 trillion over the previous year. In addition, financial investments grew by KRW 10.1 trillion from the previous year as a result of the expanded securities business at the group-level in response to the continued low interest rates. KB Financial Group’s total assets including AUM posted KRW 789.6 trillion, up KRW 57.8 trillion, 7.9% from the previous year. The Group’s AUM increased by KRW 18.3 trillion from the previous year driven by KB Kookmin Bank’s trust and AUM of KB Securities as well as AUM of KB Asset Management.
(KRW in trillions, %)Group Financial Position
2018
479.6
20.3
51.0
61.7
319.2
6.4
21.0
443.9
15.3
276.8
33.0
53.3
65.5
35.7
2.1
-
17.1
0.2
17.3
(1.0)
0.0
731.8
252.7
2019
518.5
20.8
53.5
71.8
339.7
7.9
24.8
479.4
15.4
305.6
37.8
50.9
69.7
39.1
2.1
0.4
17.1
0.3
19.7
(1.1)
0.6
789.6
271.0
YTD
8.1
2.5
4.9
16.4
6.4
23.4
18.1
8.0
0.7
10.4
14.5
(4.5)
6.4
9.5
-
N.A.
-
50.0
13.9
N.A.
N.A.
7.9
7.2
Assets
Cash & Due from Financial Institutions
FVTPL 1) Assets
Financial Investments
Loans
Property & Equipment
Other Assets
Liabilities
FVTPL 1) Liabilities
Deposits
Debts
Debentures
Other Liabilities
Shareholder’s Equity
Share Capital
Hybrid Securities
Capital Surplus
Accumulated Other Comprehensive Income
Retained Earnings
Treasury Shares
Non-Controlling Interests
Group Total Assets 2)
AUM 3)
1) Fair Value Through Profit or Loss2) Based on simple arithmetic sum of each subsidiary’s total assets on the financial
statement for group reporting and AUM3) Including the Bank’s trust asset not subject to group reporting
2019
0.66
8.93
8,451
1.94
1.67
54.9
0.20
0.48
149.2
14.48
13.59
2018
0.66
8.82
7,721
1.99
1.71
54.5
0.21
0.59
139.4
14.60
13.97
YoY
-
0.11
730
(0.05)
(0.04)
0.4
(0.01)
(0.11)
9.7
(0.12)
(0.38)
ROA
ROE
Basic EPS (KRW)
NIM (Bank+Card)
NIM (Bank)
Cost-Income Ratio (CIR)
Credit Cost Ratio (CCR)
NPL Ratio
NPL Coverage Ratio
BIS Ratio
CET 1 Ratio
Key Financial Indicators(%, %p)

049Management Discussion & Analysis 001 Introduction026 Management Review048 Management’s Discussion & Analysis053 Operation Review074 Financial Section317 Appendix
KB Kookmin Bank’s total assets increased by KRW 30.5 trillion from the previous year to KRW 387.4 trillion. Its loans in won grew by KRW 11.2 trillion over the previous year to KRW 269.0 trillion: a KRW 6.6 trillion growth was posted in household loans, mainly in unsecured loans and Jeonse loans, while a 4.3% increase was recorded in corporate loans with a focus on prime SME loans due to the eased market competition in the second half of 2019 and flexibility in credit policy execution.
* Subsidiary figures are based on the consolidated financial statements of respective subsidiaries
2015
17
166
290
329
2016
20
16
32
307
376
2017
20
18
32
37
330
437
2018
22
21
35
45
357
480
2019
24
23
37
48
387
519
KB Kookmin Bank KB Securities KB Insurance KB Kookmin Card Others (including consolidation adjustments)
Group Total Assets Trends (KRW in trillions) ProfitabilityIn 2019, KB Financial Group’s net income amounted to KRW 3,311.8 billion, up by 8.2% from the previous year mainly due to robust increase in interest income in the banking and card business as well as solid growth in non-interest income, including fee and commission income from trust and IB Business, and profit from securities, FX, and derivatives.
2019
147.9
77.2
70.7
121.1
103.3
69.2
17.8
269.0
2018
141.3
69.9
71.4
116.1
98.0
65.6
18.1
257.4
YTD
4.7
10.4
(1.0)
4.3
5.4
5.5
(1.7)
4.5
Household
Mortgage
General
Corporate
SME
[SOHO]
Large Corp. etc.
Total
KB Kookmin Bank Loans in Won(KRW in trillions, %)
2018
8,904.9
2,243.4
(288.6)
10,859.7
5,918.5
673.7
4,267.5
34.1
3,061.9
3,061.2
YoY
3.3
5.0
N.A.
5.3
6.0
(0.5)
5.2
27.0
8.2
8.2
Net Interest Income
Net Fee & Commission Income
Other Operating Profit
Gross Operating Income
G&A Expenses
Provision for Credit Losses
Net Operating Profit
Net Non-Operating Profit
Profit for the Period
Profit attributable to controlling interests
2019
9,196.8
2,355.0
(119.9)
11,431.9
6,271.0
670.3
4,490.6
43.3
3,313.2
3,311.8
(KRW in billions, %)Group Profitability Overview
2019
Non-banking 30.8%Banking 69.2%
Group Net Income Trends (KRW in billions)
3,311
2017
1,698
2015
2,144
2016
3,061
2018
3,312
2019

KB Financial Group Annual Report 2019050
By subsidiary, KB Kookmin Bank’s profit for the year in 2019 reached KRW 2,439.1 billion, up by KRW 179.9 billion from the previous year, as its net interest income and net fee and commission income posted solid growth. Its net interest income rose by KRW 263.1 billion from the previous year to KRW 6,363.8 billion thanks to the sustained high-quality growth in assets. Its net fee and commission income inched up to KRW 1,133.3 billion mainly backed by growth in commission from trust and IB business in spite of the stock market remaining sluggish. Improvent in profit from securities, F/X, and derivatives drove its other operating income up by KRW 192.1 billion from the previous year, and gross operating income increased by KRW 465.1 billion YoY to KRW 7,319.1 billion. G&A expenses grew by KRW 120.4 billion from the previous year to KRW 3,887.4 billion mainly due to increasing digitalization costs such as amortization costs, resulting from the introduction of next-generation IT systems and other digitalization endeavors. Provision for credit losses rose by KRW 9.6 billion only to KRW 103.5 billion driven by the bank’s premptive and conservative risk management to manage credit quality in spite of its growing asset size. Since growing uncertainties, including COVID 19, could result in deterioration of asset quality especially for subprime borrowers, KB Kookmin Bank will closely monitor relevant indicators and reinforce its risk management, taking a conservative stance on asset quality management.
In 2019, KB Securities’ net income for the period increased by KRW 79.1 billion from the previous year to KRW 257.9 billion: declining market interest rates contributed to increasing its gain on valuation of bonds and stablizing its ELS and other derivatives performance, which showed augumented results last year, led to improve its sales & trading income, while the promissory note issuance business launched last year resulted in performance improvement in the IB businesses.
2019
6,363.8
1,133.3
(178.0)
7,319.1
3,887.4
103.5
3,328.1
(9.6)
2,439.1
2018
6,100.7
1,122.7
(370.1)
6,854.0
3,767.0
93.9
2,992.5
93.9
2,259.2
YoY
4.3
0.9
N.A
6.8
3.2
10.3
11.2
N.A
8.0
Net Interest Income
Net Fee and Commission Income
Other Operating Profit
Gross Operating Income
G&A Expenses
Provision for Credit Losses
Net Operating Profit
Net Non-Operating Profit
Profit for the Period
(KRW in billions)KB Kookmin Bank Profitability Overview
KB Financial Group’s net interest income amounted to KRW 9,196.8 billion, up by 3.3% from the previous year. This is attributed to increases in average loan balances mostly backed by the balanced growth of prime retail unsecured loans and prime SME and SOHO loans as well as to the increased contribution from the interest income generated by its card business. In 2019, net interest margin(NIM) of the group and bank stood at 1.94% and 1.67% respectively: bank NIM inched down only by 4bp from the previous year despite key rate cuts and intensifying market competition.
KB Financial Group’s net fee and commission income rose by 5.0% from the previous year to KRW 2,355.0 billion as trust income of the bank and group IB business increased in spite of the significant reductions posted in securities brokerage commissions amid the sluggish stock market. Other operating profit improved by KRW 168.7 billion from the previous year mostly due to a increase in gains on valuation of bonds resulted from declining market interest rates and improvement on profits from sales & trading in the securities business, while insurance-related profits fell due to the worsening loss ratios of auto insurance and long-term insurance plans.
G&A expenses recorded a 6.0% YoY growth to KRW 6,271.0 billion: ERP costs occurred in Kookmin Bank and KB Insurance, and digitalization costs – amortizing expenses and computing work expenses – related to the digitalization initiative undertaken at the group level were recognized. In 2019, the Group cost-income ratio(CIR) remained almost unchanged from the previous year at 54.9% in line with ERP costs and increasing digitalization costs. However, on a recurring basis disregarding ERP and digitalization costs etc., CIR recorded to 50.9% presenting continued improvements in cost efficiency in line with visible cost savings from ERP and group-wide cost control efforts. As digitalization costs are forecast to increase for the time being to respond to digitalization, open banking and other changes affecting the financial landscape, KB Financial Group will continue to tighten the level of cost control by revisiting every costs groupwide on a zeo base except investment for future growth such as digitalization.
Provision for credit losses fell by 0.5% YoY to KRW 670.3 billion: while the amount of loans increased, KB Financial Group pursued qualitative growth with a focus on high-quality assets as well as preemptive risk management, which also contributed to maintaining a low credit cost ratio of 0.20%.

051001 Introduction026 Management Review048 Management’s Discussion & Analysis053 Operation Review074 Financial Section317 Appendix
In 2019, KB Insurance’s net income fell by KRW 28.0 billion from the previous year to KRW 234.3 billion due to the deteriorating loss ratios witnessed mainly in auto and long-term insurance across the industry and the increasing operational expenses caused by intensifying competition over new contract.
In 2019, KB Kookmin Card’s profit for the period amounted to KRW 316.5 billion, up by KRW 29.9 billion from the previous year, which is attributable to increases in interest income generated by growing card transaction amounts, steadfast endeavors to improve cost efficiency, and expanding financial assets including installment financing and lease business.
KB Financial Group’s non-performing loan(NPL) ratio improved by 0.11%p from the previous year to 0.48% as sustained endeavors were made for conservative risk management at the group level as demonstrated by growth focused on prime quality loans. Its NPL coverage ratio increased by 9.8%p from the previous year to remain stable at 149.2%: new NPL formation decreased with its improved loan portfolio and its strengthened post-loan management led to the decrease in NPLs.
(KRW in billions, %)Group Asset Quality
2018
321,040.1
2,514.7 679.1 862.1 368.7
1,909.9
0.59%
2,662.7
139.4%
YTD
5.8
1.5 (3.4)
(21.2) (15.5)
(13.8)
(0.11%p)
(7.8)
9.8%p
Total Loans for NPL Classification
Precautionary Substandard Doubtful Estimated Loss
Substandard & Below Loans(NPL)
NPL Ratio
Loan Loss Reserves
NPL Coverage Ratio
2019
339,688.4
2,552.7 655.9 679.2 311.7
1,646.8
0.48%
2,456.3
149.2%
(KRW in billions, %)Net Income by Subsidiaries
2019
3,311.8
2,439.1
257.9
234.3
316.5
48.9
117.0
16.0
61.7
16.3
11.3
4.7
(0.3)
2018
3,061.2
2,259.2
178.8
262.3
286.6
39.6
111.9
14.8
47.0
11.0
14.5
2.9
0.2
YoY
8.2
8.0
44.2
(10.7)
10.4
23.5
4.6
8.1
31.3
48.2
(22.1)
62.1
N.A.
Group Net Income
Kookmin Bank
KB Securities
KB Insurance
KB Kookmin Card
KB Asset Management
KB Capital
KB Life Insurance
KB Real Estate Trust
KB Savings Bank
KB Investment
KB Data Systems
KB Credit Information Group NPL & NPL Coverage Ratio
1.17%
93.0%
20172015 2016 2018 2019
0.85%
104.1%
0.69%
108.3%
0.59%
139.4%
0.48%
149.2%
NPL RatioNPL Coverage Ratio
Group Credit Cost Ratio(CCR)
0.44%
20172015 2016 2018 2019
0.22%0.20% 0.21% 0.20%
Asset QualityIn 2019, KB Financial Group’s provision for credit losses amounted to KRW 670.3 billion, which fell slightly from the previous year due to quality growth generated mainly in high-quality assets and its premptive risk management in the face of the economic downturn. Group credit cost ratio also remained at a low level of 0.20%.
Management Discussion & Analysis

KB Financial Group Annual Report 2019052
Capital AdequacyKB Financial Group’s BIS and CET 1 ratios recorded to 14.48% and 13.59%, down by 0.12%p and 0.38%p from the previous year respectively. While this attributed to increases in risk-weighted assets in line with its growing asset, the group still maintains its strong capital position at the highest level in the Korean financial industry. Considering growing uncertainties and tightening regulations for capital management of financial institutions, KB Financial Group will strategically respond to the environment utilizing issuance of hybrid securities and other contingent convertible bonds while maintaining solid capital buffer mainly consisiting of common shares.
KB Kookmin Bank’s BIS and CET 1 ratios improved by 0.33%p and 0.04%p from the previous year to 15.85% and 14.37% respectively thanks to increasing retained earnings and the placement of contingent capital while RWA increased as a result of loan growth.
KB Kookmin Bank’s delinquency ratio remains at a low level of 0.24%, which is attributed to its endeavors to reduce potential NPLs and to proactively manage asset quality in so doing. Its NPL ratio improved by 0.11%p from the previous year to 0.37%: the bank strove to improve its credit quality of corporate loan portfolio by increasing the portion of prime rating loans and by pursuing preemptive risk management and proactive sales and write-offs of NPLs. Its NPL coverage ratio rose by 7.9%p from the previous year to 130.2%, which is at the highest level in the banking industry, and this is attributed to reductions in NPLs and its conservative approach to provisioning. KB Kookmin Bank’s credit cost remained at the significantly low level of 0.04%, based on its endeavor for quality growth and the reversal of provisions.
KB Kookmin Card focused on conservative credit quality management and strengthened premptive risk management in the face of mounting concerns over worsening asset quality as a result of the economic slowdown. This drove down its delinquency ratio by 0.09%p from the previous year to 1.11%, and its NPL ratio remains stable.
* In accordance with Basel III
2019
36,995
35,426
34,710
1,569
255,549
14.48%
13.86%
13.59%
2018
34,476
32,994
32,994
1,482
236,099
14.60%
13.97%
13.97%
YTD
7.3
7.4
5.2
5.9
8.2
(0.12%p)
(0.11%p)
(0.38%p)
BIS Capital
Tier 1 Capital
CET 1 Capital
Tier 2 Capital
Risk-Weighted Assets
BIS Ratio
Tier 1 Ratio
CET 1 Ratio
(KRW in billions, %)Group BIS Ratio
BIS Ratio
Tier 1 Ratio
CET 1 Ratio
2019
15.85
14.68
14.37
2018
15.52
14.33
14.33
YTD
0.33%p
0.35%p
0.04%p
KB Kookmin Bank BIS Ratio(%)
* In accordance with Basel III
Delinquency Ratio
20172015 2016 2018 2019
1.26% 1.25% 1.23% 1.20% 1.11%
0.24% 0.23% 0.24%0.40% 0.35%
KB Kookmin Bank KB Kookmin Card
NPL Ratio
KB Kookmin Bank KB Kookmin Card
20172015 2016 2018 2019
0.58% 0.48% 0.37%
1.10% 0.74%
1.40% 1.38% 1.37%1.15%
1.30%

053
KB FINANCIAL GROUP
KB Financial Group continues to place
the highest priority on customer value
and is committed to leading the industry
not only as evidenced by its financial
figures but also in all other areas of its
business.
OPERATION REVIEW
KB Kookmin Bank
KB Securities
KB Insurance
KB Kookmin Card
KB Asset Management
KB Capital
KB Life Insurance
KB Real Estate Trust
KB Savings Bank
KB Investment
KB Data Systems
KB Credit Information
054
060
062
064
066
067
068
069
070
071
072
073

KB Financial Group Annual Report 2019054
2,174.7
2017
2,259.2
2018
2,439.1
2019
+8.0%
Ranked top earnings power among commercial banks in Korea
KB Kookmin Bank ranked first in the National Customer Satisfaction Index for 13 consecutive years, for the first time in the banking industry.
NCSI
No.1Customer Satisfaction
KB Kookmin Bank
Retail BankingIn 2019, the retail banking market experienced increasing fluctuations in demographics and social trends in line with accelerating aging, an increasing prevalence of single households, an emerging demand for corporate social responsibility, growing interest in nation-wide environmental protection and eco-friendliness, and demands for a work-life balance and productivity gains spurred on by the 52-hour workweek policy. Wide-ranging changes were also witnessed across the regulatory landscape, including the revision of the Banking Act to approve the additional establishment of internet-only banks, tightening regulations on household loans and consumer protection, strengthened support to facilitate fintech(financial regulatory sandbox), and data deregulation.
Innovative Customer Centric Systems and Processes
In response to shifting demographics and customer transactions and needs, KB Kookmin Bank created new customer-centric indicators and developed a monitoring system to solidify the tailor-made customer management system while improving its customer management process for effective customer management. In addition, the ‘KB Star Dream Service’ was launched to further provide customized contents for respective VIP customer segments.
We also launched new specialty products to reflect changing demographics and social trends, including the ‘KB Clean Sky Installment Deposit’(Mar. 2019) to strengthen our image as a socially responsible company that cares for the environment, ‘280 Days for My Baby Installment Deposit’(Jun. 2019) to target expecting mothers, and ‘KB X BTS Installment Deposit’(Oct. 2019) developed in collaboration with the global idol band BTS, following its first version unveiled in 2018. Notably, the ‘KB X BTS Installment Deposit’ posted nearly 68,000 in number of accounts and KRW 25 billion in balance in just two months since its launching.
Given the prolonged low growth and low interest rates and the intensifying competition spurred by the entry of fintech businesses into the financial industry, KB Kookmin Bank will effectively respond to demographic shifts, governmental financial policies, and the changing regulatory landscape by promoting data-based segmented customer management and the more sophisticated identification of potential VIP customers, developing products that set the social trends, and expanding digital innovation as well as non-face-to-face channel products and services.
Strengthening Group-wide One-Firm WM Collaboration
We continued to broaden the coverage of multi-service WM branches to generate greater One-Firm synergy between banking and securities subsidiaries, and opened PB centers(WM multi-service branches) within the business districts where main corporate clients are located to invigorate our corporate asset management business. A dedicated team for securities firms was set up and the pilot operation was initiated on a multi-service branch model that adopted the proximate arrangement of WM and corporate banking counters.
Net Profit(KRW in billions)
As of the end of December 2019, KB Kookmin Bank reached 31.5 million customers and established the highest level of branch and mobile/internet banking network in the industry. With KB Star Banking serving nearly 15.5 million users, we are setting the trend of digital finance on the strength of our mobile platforms including Liiv and Liiv Talk Talk. As the first to launch Liiv M –the service that converging finance and telecommunication- in the banking industry, we deliver innovative financial services to provide customers with differentiated financial products and services.
+8.5%
Total Assets(KRW in trillions)
323.4
2017
357.0
2018
387.4
2019

001 Introduction026 Core Competency048 Management’s Discussion & Analysis053 Operation Review074 Financial Section317 Appendix
055
In addition, the existing collaboration system was improved to advance corporate finance-WM collaboration. Such as the ‘P-PB System’ was launched to provide specialized ‘total asset management solutions’ to corporate customers, and the ‘RM-VM One Team System’ was initiated in retail branches to improve working-level sales execution and generate collaborative outcomes in serving corporate clients.
Meanwhile, we launched the ‘KB Family UP Advisory Service’ brand and initiated its operation. Wealth management consulting was provided to those with professional careers as well as major corporate customers and their employees, and our WM advisory business improved its competitiveness by expanding the support of itinerant consulting, lectures and seminars for corporate customers maintaining outstanding business relationships with us. Also, we continuously worked to diversify our real estate investment advisory business and to generate profits by taking actions such as implementing the ‘Rebalancing & Value Added’ service for real estate assets and operating the ‘Real Estate Emergency Committee’ to respond to government policies.
In 2020, we plan to facilitate our wealth management operations by developing a new WM business model to innovate our WM channels by customer segment and providing ‘seminars’ and ‘professional counseling’ to diverse customers. We will also expand the range of our distinguished advisory service by providing systematic support services for land compensation process, ‘legal risk assessment’ services for SMEs and CEOs and ‘specialized tax’ services for overseas Koreans.
Corporate BankingIn the face of economic downturn and other sustained challenges in the business landscape, we pursued qualitative growth with a focus on high-quality assets to continue with sustainable growth, and endeavored to secure solid growth engines by advancing into the global IB market and developing IB services.
To sum up some of our major achievements, we topped the Bloomberg League Table’s Syndicated loan arrangement category for four consecutive years to maintain our No. 1 market leadership position while successfully arranging the Seoul IFC Mall refinancing worth KRW 2.3 trillion and the KRW 2.0 trillion Sin Ansan double track railway private investment project. We also broadened the coverage of our global business through wide-ranging overseas deals including the refinancing of the U.S.-based Lackawanna Center.
The utility of blind funds was improved and deal sourcing was strengthened in aircraft financing and other key business areas to secure a stable profit base while institutional improvements were made from multiple angles to establish a globally recognized infrastructure, including the improvement of the double counting system to handle global collaboration deals.
Fully Advancing into the Global IB Market
In 2019, we completed our regional hub network across Hong Kong, London and New York. These regional hubs will help us expand our business lineups in advanced markets based on our partnership
with local financial institutions and serve as the main pillar of our IB operations to strengthen our group-wide IB competitiveness. Furthermore, we will build new growth drivers in the global market to pave the way to ultimately emerge as a global IB player.
In 2020, we will fully advance into the global markets on the strength of our Hong Kong, London, and New Yok regional hubs and do our utmost to lay the basis for KB Financial Group to leap forward onto the global stage. This will be done by creating a team dedicated to the exploration of new markets and establishing the ‘Hub & Spoke’ operational system with Hong Kong, New York, and London serving as the ‘Hub’ and nearby regions as the ‘Spokes’. In preparation for the growing market uncertainties, we will continue to improve our asset portfolio to pursue qualitative growth with a focus on riskless assets and elevate capital efficiency while transforming ourselves into a global IB player to secure future growth momentum over the long haul.
SME BankingLeading Financial Support for SMEs
KB Kookmin Bank strengthened support for productive finance and fully responded to relevant governmental policies to posted an increase of KRW 5.2 trillion in SME loans in 2019 to become the first commercial bank to reach KRW 100 trillion in SME loan balances and is currently maintaining its No. 1 leadership position in market shares. Notably, the ratio of prime rating loans extended to healthy SMEs rose by 2.7%p YoY from 74.7% at the end of 2018 to 77.4%, which in turn allowed us to record the lowest delinquency rate of 0.55% among commercial banks.
Leading Support for Innovative Finance
Our credit supply continues to expand, with KRW 12.5 trillion newly provided for technology finance as a way to facilitate innovative financing. Also, our non-financial services are increasing their support for SMEs and self-employed businesses as demonstrated in 3,860 cases of job placement arranged through the ‘KB Good Job’ and 1,674 cases of consulting assistance provided through the ‘KB SoHo Consulting Center’.
KB Kookmin Bank has the largest customer base in the domestic banking industry.
Number of KB Kookmin Bank's Customers
31.5 million
KB Kookmin Bank

KB Financial Group Annual Report 2019056
Pursuing the Digitalization of Corporate Financing
We accelerate the digitalization of our corporate finance operations to proactively respond to the rapidly-changing business environment. Our ‘KB bridge’ app recommends optimal governmental policy funds to corporate customers based on their specific needs so that they can be swiftly provided with the necessary funds, and the ‘Corporate Financing ACE’ was developed exclusively for our corporate finance staff to help them reduce their workload and focus more of their time on corporate customer marketing. We also created the ‘KB Corporate Customer Preferential Support System’ to upgrade our corporate customer management and reward provision system. While 2020 is expected to suffer increasing external volatility and the protracted economic downturn, we will continue to attract prime customers to further step ahead of the
competition as the dominant player with the largest market share.
Global OperationOver the years, we have advanced into the digital banking, micro finance and other diverse business areas in Cambodia, Laos, Myanmar, and Vietnam to better understand and accumulate experience with these markets. In January 2020, we signed a stock purchase agreement(SPA) to acquire a 70% stake in PRASAC Microfinance, Cambodia’s largest Microfinance Deposit-taking Institution(MDI) while opening new local branches under Myanmar’s MFI and our Cambodian subsidiary as well as KB Kookmin Bank branches in Hanoi, Vietnam and Gurugram, India, further broadening our global network. Included in other tangible outcomes from our global operations is Liiv KB Cambodia which posted a consistent growth in number of members with its strengthened service competitiveness as the nation’s global digital banking platform.
In 2020, we plan to follow the Two-Track strategy both in Southeast Asia and other advanced markets to continuously expand our global presence. We will pursue non-organic growth through M&A and equity investment, and leverage digital banking in connection with our offline channel strategy to improve the accessibility of our retail service for retail and SME customers in emerging Asian economies with high growth potentials. To tap into mature financial markets with stable financial systems in place, we will expand our branch and subsidiary network in key regional hubs and use this network to secure our profit base with a focus on CIB and capital market businesses.
Expanding Global Presence
In December 2019, we made the decision to acquire a 70% stake in PRASAC Microfinance in Cambodia. With a local network of 117 locations, PRASAC is ranked third among financial institutions in loan market share. KB Kookmin Bank plans to transform PRASAC into a commercial bank to transfer its exceptional retail capabilities and help PRASAC evolve into a leading commercial bank in Cambodia in order to broaden its business presence in Southeast Asia.
Facilitating Global Export Finance
KB Kookmin Bank signed a ‘global export finance promotion business agreement’ with the Korea Trade Insurance Corporation(K-sure), and became the first commercial bank to launch the debtor finance instrument ‘KB Global Export Finance’. Upon making shipments on the part of the exporter, KB Kookmin Bank’s overseas branch extends loans to the importer, taking as security the short-term export insurance plan provided by K-sure so that the exporter can receive payments through their domestic account. This allows domestic exporters to turn their export receivables into cash sooner and without recourse while overseas importers can make payments at lower financial costs compared to those provided by local banks. In alignment with the Korean government’s top priority initiative of the New Southern Policy, KB Kookmin Bank will proactively deliver financing support through its overseas branch network, in addition to KB Global Export Finance.
KB Kookmin Bank also became the first commercial bank to launch the ‘KB Global Payment Usance’ service. Concerning imports whose payments are made on an open account basis, the domestic importer is provided with import finance from an overseas financial institution that suggests more competitive interest rates, and then later, they can pay the principle and interests at the time of maturity. This product will surely enable KB Kookmin Bank to reinforce its wire transfer line-ups which account for nearly 70% of the total import payments, and to respond to the international trade finance trend of moving away from letters of credit(LC) to wire transfers.
Furthermore, KB Kookmin Bank signed business agreements with the global e-commerce settlement service providers of WorldFirst and Payoneer, and launched the ‘KB Global eCommerce Sellers Benefit Program’ for domestic sellers to receive their sales proceeds generated overseas in a more cost-effective and convenient manner. This product is expected to revitalize the operations of SME exporters who often face difficulties in opening a local bank account as a seller conducting business at overseas online market places.
In 2020, KB Kookmin Bank will expand its F/X customer base, including SME importers and exporters, through the marketing programs led by its head office, strengthen its F/X product and service competitiveness through improved non-face-to-face F/X services, and reinforce marketing support to pave the way for the sustained growth of its F/X business.
Trust KB Kookmin Bank continued to face challenging conditions in the overall trust market due to shrinking investor confidence and declining global stock market indices. In the second half of 2019, derivatives-linked fund(DLF) products linked with offshore interest rates created serious issues to eventually prompt the financial authorities to impose restrictions on high-risk financial instruments and tighten relevant regulations. Even amid such unfavorable business conditions, our proactive customer management, strategic marketing campaigns, and the launching of customized ELT products enabled us to rank first in the industry, with KRW 26.4 trillion in money trust AUM and 19.3% in market

001 Introduction026 Core Competency048 Management’s Discussion & Analysis053 Operation Review074 Financial Section317 Appendix
057
PensionTo solidify its status as a leading bank in the pension market, KB Kookmin Bank strengthens the management of its rate of returns for customers and offers them differentiated specialty products while using its digitally-based total asset management system to support customers with their pension asset management. In 2019, our contribution reserve rose by KRW 3.7 trillion from the previous year to KRW 23.4 trillion to top all the other pension business operators in net reserve increase for two consecutive years. We developed the ‘KBot SAM’ service that deploys robo advisors to make personalized portfolio recommendations to support our pension asset management, and
improved the entire non-face-to-face pension transaction process, from establishing new accounts to transfers and payments, through the ‘One-Stop Online Pension Account Service’.
Our Retirement Pension Asset Management Consulting Center that provides one-on-one pension asset management services recruited more counselors and set up a team dedicated to improving our customers’ rate of returns in order to deliver differentiated customer management services, including pension asset portfolio rebalancing. The pension expert program was also created to provide customized asset management services according to different life cycle stages based on comprehensive counseling capabilities in the areas of public pensions, retirement pensions and personal pensions.
The ’12 Moments of Happiness’ was added to our pension portfolio as an installment payment option for our senior customers to help them generate a stable source of income following retirement. Furthermore, the ‘KB Golden Life Specialty Service’ was significantly reinforced, and the ‘Premium Health Care Service’ was launched to deliver diverse health care services, the first of its kind in the banking industry as a way to provide a range of services.
In 2020, the Retirement Pension Asset Management Consulting Center will extend its work scope and recruit more employees to increase customers’ rate of returns, and the operation of our pension expert training course will be upgraded to deliver comprehensive and professional pension asset management services.
We will deploy a non-face-to-face channel system 2.0 for our pension fund business. This will provide a virtual user environment that ensures improved and quicker around-the-clock accessibility throughout the year. Our UI/UX will be reconfigured to enable customers to intuitively understand and access all data and processes across non-face-to-face channels, and AI-powered lifecycle asset management solutions will be offered to establish an end-to-end pension asset counseling system spanning from premium payment and asset operation to benefit payment and taxation. We also plan to develop the ‘KB One-Senior Platform’ to deliver health care services for senior customers and other personalized customer service packages as a way to solidify our status as a professional pension service provider.
KB Kookmin Bank
No.1
Ranked first in net reserve increases among other pension operators for two consecutive years.
Pension Contribution Reserves
KRW
23.4trillion
KB Kookmin Bank accounted for 19.3% of the total money trust AUM of Korean banks, maintaining the position of consistently having the largest AUM in the industry for several years.
Money Trust Depository
KRW
26.4trillion
share. We were also able to generate solid profits with KRW 291 billion in annual revenue from trust operations for the year of 2019.
In 2019, a range of specialty products were unveiled to create the trust product line-ups that satisfy customer needs and increase our product competitive edge. These specialty products included the ‘KB Clean Sky Trust’ designed to contribute to reducing microdust levels, the integrated inheritance-bequeath solution ‘KB The Great Heritage Trust’ and the ‘Family Business Succession Trust’ that facilitates asset succession at SMEs. To respond to future trends and reflect current market conditions, our ‘Short Strangle ETN Trust’ leverages option transfer/selling to address the stock market trend of prices repeating ups and downs within a certain range, the ‘KB Mini Gold Bar Trust’ addresses preference for risk-free assets and declining benchmark rates, and ‘U.S. REITs EFT Trust’ invests in U.S.-located commercial real estate.
In 2020, we plan to maintain the similar level of profits of 2019 by continuously increasing the profitability of equity-linked trusts, our key profit-generating product. We will also be pursuing quantitative profit growth through the expanded line-ups of equity-based and alternative investment products, providing a portfolio of products that cater to each specific stage of a customer’s life cycle, and delivering specialty products that are in line with the latest trends. In the mid-to-long term, we will upgrade our customer-based asset management system to retain customers and increase their loyalty, and perform stringent reviews on complete sales and post-sales management to reinforce our financial consumer protection system.

KB Financial Group Annual Report 2019058
Capital MarketsIn 2019, even though the global financial markets experienced continuous fluctuations due to the U.S.-China trade dispute and concerns over the global economic slowdown. KB Kookmin Bank successfully issued sustainability bonds in diverse formats based on its outstanding credit ratings (Moody’s: Aa3, S&P: A+, Fitch: A), which are the highest among Korea’s commercial lenders, as well as on its exceptional business performances.
KB Kookmin Bank flexibly conducted business to respond to increasing volatility in interest rates while expanding the investment asset size to eventually set a new record in operational performance over the past decade. We have strengthened our flow business basis and expanded synergy-based transactions by intensive collaboration with our sales channels and subsidiaries. To broaden our overseas business, the London capital markets desk initiated to build up its trading position actively in 2019 and we have dispatched expert employees to establish Indian and Vietnamese desks.
In February 2019, we issued 10-year subordinated sustainability bonds with a nominal amount of USD 450 million, which drew investors’ attention as the first foreign currency-denominated subordinated bonds since the merger of the former Kookmin Bank and H&CB in 2001 and as the first such bonds in sustainability bond format in Korea. This successful issuance, with spread of 187.5bps over the 10-year U.S. Treasury, ended up building nearly USD 1.7 billion of orders from a total of 110 institutional investors.
In July, we also raised USD 500 million of Tier 1 subordinated bond which is Basel III compliant as well as Korea’s first foreign currency-denominated subordinated sustainability bond. The issuance attracted orders in the amount of USD 2.7 billion, 5.4 times greater than the issued amount, from a total of 128 global investors.
By issuing sustainability bonds in 2019, KB Kookmin Bank was able to secure new funding sources as well as to diversify investor spectrum which include socially responsible investors. Going forward, we will continue to issue ESG-related bonds, along with covered bonds and subordinated bonds to diversify our funding structure.
In 2020, we plan to preemptively respond to the changes in financial environment and strengthen our human/physical capabilities in the capital markets to consistently promote profit growth even in
the prolonged low-growth, low-interest rate environment. We will expand the size of investment assets and diversify products and strategies to pursue profitability while gradually expanding our global business presence and infrastructure and accelerating digitalization to strengthen our profit base and promote sustainable growth.
Smart BankingProactively Responding to the Shifting Digital Finance Landscape
In 2019, the opening of the financial infrastructure, as illustrated by the open banking initiative, and the introduction of the financial regulatory sandbox broke down the barriers that had separated industries and spurred competition and innovation. To turn this rapid change in the financial environment into opportunity, KB Kookmin Bank endeavored to create a convergence-driven ecosystem to collaborate with diverse players. We developed 157 open APIs to easily connect financial services with external platforms, and our cloud-based collaboration platform ‘CLAYON’ became the industry’s first to complete ‘cloud service provider safety assessments’ to pave the way to deploy financial services in the cloud environment. We also capitalized on the financial regulatory sandbox to launch innovative services that were barely available in the conventional financial environment. The MVNO-based finance-telecommunication hybrid service ‘Liiv M’ was unveiled to take a bold step into the previously-untapped ‘telecommunications’ market to broaden the KB financial ecosystem. Going forward, we will focus on the development of new innovative products and services through telecommunication-data convergence to move ahead of the competition and build distinctive competitiveness.
Strengthening Digital Platform Competitiveness
On the service front, we launched the AI-enabled counseling chatbot service to provide easy and convenient 24/7 counseling services, and developed the ‘KB Mobile Certificate’ to allow customers to easily process their transactions through biometric certification, simple passwords, and pattern certification without a physical security medium in order to deliver new customer experience and improve user convenience.
We also continued to reorganize our digital platforms. The ‘Open Banking’ service, which enables customers to register their accounts at other banks for account checks and transfers, was adapted to Star Banking, internet banking, Liiv, and Liiv Talk Talk, and KB my money was upgraded to address the shifting data industry landscape and strengthen our competitive edge as an asset manager. Our Liiv Talk Talk and Liiv platforms were equipped with scanning apps and additional financial product offerings to improve the financial expertise and usability of respective platforms.
Infrastructure-wise, our cloud-based collaboration platform CLAYON was leveraged to deliver Liiv M services to set an example in using cloud infrastructure for financial services. Our non-face-to-face log collection system was also upgraded to strengthen the analytics of customer behavior data, creating a financial environment conducive to the development of digital financial services.
KB Kookmin Bank issued USD 450 million 10-year subordinated sustainability bond for the first time in Asia.
Issuance of Subordinated Sustainability Bond
USD
450million

001 Introduction026 Core Competency048 Management’s Discussion & Analysis053 Operation Review074 Financial Section317 Appendix
059
Delivering MVNO-based Finance-Telecommunication Hybrid Services
KB Kookmin Bank unveiled the industry’s f irst MVNO-based telecommunication service ‘Liiv M’ to deliver innovative services and products that combine finance with telecommunications in order to create new customer experience and social value. Following the opening of its beta version in November 2019, this service fully opened on December 16, and has since provided services differentiated from the conventional MNVO counterparts by launching first-ever MVNO 5G plans and the membership service to turn monthly unclaimed data credits into Liiv Mate points.
We provide such innovative financial services as the USIM KB Mobile Certificate, the USIM personal information storage service, and the ATM withdrawal control service designed to prevent voice phishing frauds by disallowing the simultaneous use of a phone while making withdrawals in order to improve customer safety and convenience. Meanwhile, we offer ‘sharing discounts’ to vulnerable individuals and opened the Liiv M Zone within our branch to provide face-to-face counseling support for the digitally-underprivileged in order to strengthen our inclusive finance initiative.
Improving Diverse Functionalities for Greater Customer Convenience
In keeping with our public certificate log-in policy, which is rather complicated due to the inherent features of it being a banking app, we introduced a simpler log-in method that allows customers to use their mobile phone number as their ID, as the log-in was often cited as one of the user pain points. KB Real Estate Liiv ON is available across the PC web, mobile web, and mobile app channels, and customers can log in on any these channels to access the Liiv ON with their personal mobile phone number, which has significantly improved user convenience in regards to the log in process. Concerning data searching, our ‘natural language’ processing search function was upgraded to allow customers to type in single word segments without word spacing in the integrated search box to minimize the errors that may arise during real estate content research.
Providing Real Estate Data Contents to Customers through Social Network Channels
KB Real Estate Liiv ON leverages KB’s real estate price data recognized for its market dominance to directly produce season/issue-specific real estate information and delivers wide-ranging real estate contents across the four leading social network channels of Naver Post, Kakao 1boon, Youtube, and Facebook. Since this service was launched at the end of March 2019, its cumulative views reached 11 million at the end of 2019 which goes to demonstrate the huge interest in and appreciation for the Liiv ON contents granted by numerous customers who are keeping a constant eye on the real estate market.
In 2020, we are working to migrate our service platform into the cloud environment and improve the flexibility of our platform to allow for collaboration with external startup businesses. In so doing, KB Kookmin Bank will embrace a UI/UX that delivers digitally-based easy-to-understand visual contents and maximizes user convenience while swiftly catering to customer needs.
Plans for 2020 In 2020, the full-fledged opening of the financial infrastructure through the expansion of open banking services and the initiation of My Data business will further blur the lines between the financial industry and other industries, increase convergence services among heterogenous industries, and accelerate the ‘Financial Nomad’ trend with the emergence of customers who constantly shift among financial institutions for greater benefits. KB Kookmin Bank’s response to these trends will be to understand customers and deliver positive customer experience and new value in order to advance ‘customer-centric digital finance’.
We will analyze log data and gather candid customer feedback when it is time for the platform renovation to integrate such feedback into our service improvement. We will provide personalized and useful information through customer behavior data analytics, identify customers’ pain points to resolve any inconvenience they may face, and develop necessary benefits and services even before customers become aware of such needs in order to improve the qualitative competitiveness of our service.
We will also change the way we conduct business to swiftly address customer needs. While expanding our ‘ACE(Agile, Centric, Efficient)’ experience through Agile units to weave Agile into our corporate DNA, we will also promote collaboration by embracing co-location for our business units and IT operations. We will continue to hire outside experts and ICT staff and strengthen digital training for employees to nurture our digital workforce in order to reinforce our fundamentals for digital finance.
The financial industry’s first-ever MVNO-based finance and telecommunications service was fully launched in December 2019.
Liiv M
KB Kookmin Bank
157 open APIs were developed to facilitate the alignment between financial services and external platforms.
Banking Service
157open APIs

KB Financial Group Annual Report 2019060
KB Securities
Generating synergy with group subsidiaries
KB Securities opened five more multi-service branches in 2019 to expand WM coverage between banking and securities operations, which increased the number of these branches to a total of 70 as of the end of 2019. The continued improvement of joint business models including the KB Kookmin Bank-KB Securities pairing system and the offering of customer-centric tailor-made wealth management services raised our referral-based WM asset size by 9.5% YoY to KRW 7.4 trillion as of the end of 2019.
In IB business, our referral-based CIB revenue reached nearly KRW 113.0 billion and our contribution deals amounted to 62, which was made possible through the strengthened CIB collaboration system which included Partnership RM and Co-RM. Our nine CIB centers nationwide strive to enhance efficiency in serving banking-securities SME customers. As a product factory within KB Financial Group, our S&T Division continuously expands the delivery of wide-ranging products that cater to customer needs. Our increased banking-securities synergy and the resulting operational expansion enabled us to post nearly KRW 4.8 trillion in products delivered to banks(KRW 2.9 trillion in derivative-linked securities and KRW 1.9 trillion in bonds).
Strengthening digital competitiveness
KB Securities pursues company-wide digital transformation to improve work efficiency and provide differentiated customer service. This allowed us to create a smart work environment enabled by Robotics Process Automation and chatbots and to reduce nearly 30,000 hours of work on a cumulative annual basis through the Work Diet initiative. In addition, open APIs were leveraged in offering financial services, including account set-ups and account transaction inquiries, to build an open platform ecosystem and form partnerships with external startups and fintech businesses.
Such partnerships continue to expand as we launched a non-face-to-face discretionary investment robo advisor service app through a partnership with a robo advisor company in April 2019 while opening a fund care service in our integrated wealth management service app in October 2019. These endeavors enabled us to reach a total of 190,000 in new accounts opened through non-face-to-face channels as of the end of 2019, which is up by 27% from 2018, and to surpass 350,000 in monthly active users(MAU) by improving user convenience – upgrading MTS UI/UX and adopting the Kakao authentication for the first time in the industry. Furthermore, we became the first in the domestic financial industry to be honored with the ‘Digital Transformer Award’ by IDC, a globally-renowned IT market research firm.
Exceeding KRW 2 trillion in bills issued through KB able
Since we were granted the short-term financing business license from the Financial Services Commission in May 2019, we posted nearly KRW 2.1 trillion in bills issued as of the end of 2019. We ensure that 50% or more of the funds created as such are invested in corporate financing-related assets. This is done in consideration of
+52.9%
2017 2018
235.3189.7
290.1
2019
+6.2%
37.3
2017
45.0
2018
47.8
2019
+39.2%
KB Securities leverages its differentiated asset management capability to expand its AUM in operating WM financial instruments for customers.
WM AUM
Net Profit(KRW in billions)
KB Securities has grown into a mega investment firm with more than KRW 4 trillion in equity capital and 118 competitive WM branches nationwide as of the end of 2019. With an unrivaled competitive edge, KB Securities has been ranked No. 1 as an underwriter for corporate bonds and ABS for nine consecutive years. It is also widely known for its best-in-class product line-up and management competitiveness in the S&T business. By establishing a local subsidiary in Vietnam, KB Securities is broadening its global network to evolve into Asia’s leading financial firm.
Total Assets(KRW in trillions)
WM
KRW
28.4trillion

001 Introduction026 Core Competency048 Management’s Discussion & Analysis053 Operation Review074 Financial Section317 Appendix
061
the governmental regulation to invest more than 50% of these into corporate financing assets as well as internal risk management limits. We also intend to gradually increase our investments in innovative SMEs and other venture capital.
Surpassing 100,000 in Global One Market service customers
In January 2019, KB Securities unveiled the Global One Market service to enable customers to trade overseas stocks in six markets including the U.S., Hong Kong, Japan, China and Vietnam in Korean won, free from foreign exchange charges. This service was so popular that there were more than 100,000 users by the end of 2019. KB Securities aims to strengthen its competitive edge in global investment service by delivering such differentiated products and services that assist customers in diversifying their global investment portfolio, which include overseas securities, with greater convenience.
Ranking first in the DCM for nine consecutive years
KB Securities posted 22.4% market share(based on Bloomberg) in Debt Capital Market(DCM) in 2019, proudly topping the DCM league table for nine consecutive years since 2011. In 2019, we also became the first Korean business to underwrite the issuance of ESG bonds and the first in Korea to arrange the issuance of Arirang bonds through the Qualified Institutional Buyers(QIB) system. Furthermore, we became the largest corporate bill underwriter to build a short and long-term corporate financing platform while initiating bill issuance service as a way to offer competitive products to customers. Going forward, we plan to solidify our market leadership by exploring optimal financing options that satisfy the needs of issuers and investors.
Plans for 2020Uncertainties are forecast to continue for the time being in the real economy both at home and abroad and in the financial market. The competition in the securities sector will only intensify further, especially among big securities firms. This prompts us at KB Securities to strengthen our intrinsic core competitive edge and to identify new growth drivers and expand our global presence in order to secure
a leading position in the securities industry. Furthermore, we will improve the structural efficiency of our entire operations to sharpen our focus on profitability across our business management system.
Our business strategy by business area is as follows: in the WM sector, we will further reinforce our sales competitiveness to become a solid second tier player based on AUM in the WM market. Since building long-term customer relationships is the key to a successful WM business, our sales system will take a customer-centric approach to increase customer returns and prevent any incomplete sales to strengthen their protection. In the S&T business, we will continue to generate profits based on our strengths in bond management while developing best-in-class capabilities in operating overseas bonds, in-house assets and ELS hedging to secure solid profits even amid diverse financial market conditions.
In the IB sector, we will continue to increase profits in those areas where we are already competitive, including DCM, growth investment, real estate and structured assets while elevating our status as an investment bank in corporate financing business – Equity Capital Management, acquisition finance, and bill issuance – and in such new businesses as publicly-traded REITs and Business Development Company(BDC)
In the wholesale business, we will pursue revolutionary change in every aspect, from business processes to sales methods and performance to deliver optimal solutions and services to institutional and corporate customers and to rebuild our reputation in corporate sales operations. Furthermore, we will build business capabilities in the Outsourced Chief Investment Officer(OCIO) business that is emerging as a new financing method among institutions, and broaden our overseas network to drive global business and generate meaningful outcomes, boosting our growth drivers for the future.
KB Securities
Maintain dominant leadership in the DCM league table for nine consecutive years
DCM Market Share
22.4%No.1
KRW
2.1 trillion of bills issued
Granted Short-term Finance Business License
3rd Korea’s Securities Company licensed for short-term finance business

KB Financial Group Annual Report 2019062
Creating Synergy at the Group Level KB Insurance leverages KB Financial Group’s wide-ranging business areas to share capabilities among subsidiaries and to collaborate and generate synergistic value. Facilitating synergy across subsidiary planner channels, increasing the use of subsidiary infrastructure, and raising awareness among employees and engaging them in synergy generation will pave the way to produce synergistic outcomes, and this will in turn result in tangible outcomes in 2020 as it has before.
In 2019, KB Insurance encouraged its planners to sell products from other subsidiaries to expand synergy generated through its own planner channel, which raised the number of new cards issued by 24.4% YoY to 16,800 at KB Kookmin Card. This helped KB Insurance surpass KRW 300 million in CMIP-based product sales to more than triple its growth from the previous year. A wide array of synergy activities were also undertaken to promote win-win partnerships with other group subsidiaries, from payment account campaigns and Magic Car loan referral sales to the use of its corporate loan introduction process for bank branches. Furthermore, synergy activity reward programs and ‘acquaintance referral campaigns’ were operated for subsidiary employees to improve their engagement in synergy generation while subsidiary databases were analyzed to operate digitally-enabled marketing programs in order to broaden the window of marketing opportunities and increase cross-subsidiary customers.
Long-Term InsuranceIn 2019, the long-term insurance market experienced continued concerns regarding profitability due to the increasingly fierce competition across the industry to generate new sales from term insurance products, growth in non-reimbursed claims in relation to the Korean government’s policy to expand the national health insurance coverage, and increasing loss ratios. Such unfavorable business conditions drove down our long-term insurance profit for the year by 4.2% to KRW 287 billion while raising our loss ratio by 1.1%p YoY to 85.1%. This is mainly attributable to the worsening loss ratio that affected the overall industry primarily in indemnity insurance plans. KB Insurance will endeavor to refine its contract management and tighten its underwriting and claim review process to improve on loss ratios while increasing revenues with a focus on contract year-based maturity products and diversifying the product portfolio to strengthen its overall profit fundamentals.
Auto InsuranceWhile the 2019 car insurance market generally witnessed degrading loss ratios due to increases in such costs as minimum wage allowances and repair fees, the direct premiums written demonstrated a 5.1% YoY growth to reach KRW 17.5 trillion as auto insurance premium rates rose in the first half of the year. KB Insurance expanded its sales primarily through direct channels, and this raised its new sales from direct premiums by 8.4% YoY to KRW 2,206.5 billion and its market share inched up from the previous year to 12.6%. In the face of rate increases, our car insurance loss ratio rose by 3.7%p YoY to 92.0% in line with the cumulative effects caused by costs increases in minimum wage allowances and repair fees. Going forward, we aim to reinforce our underwriting competency, secure fair and reasonable prices, and improve our claim efficiency to continuously control our loss ratio.
KB Insurance continued to practice value-driven management to focus more on the Value of New Business(VNB) which is based on embedded profitability rather than external growth. This drove its Embedded Value(EV)-based growth up by 35.1% from the previous year. The company became the first in the industry to operate AI-powered voicebots at the call center and went above and beyond that by initiating a direct chatbot counseling service. Launching on-demand insurance plans targeting part-time delivery workers on two-wheelers, KB Insurance delivers wide-ranging financial products and services on the strength of its top-notch digital capabilities.
New purchases of long-term protection plans(KRW in billions)
Total Assets(KRW in trillions)
+4.7%
31.6
2017
33.9
2018
35.5
2019
+10.4%
77.9
2017
87.3
2018
96.4
2019
KB Insurance
Focus on sustainable growth through the pursuit of quality-driven management from the long-term perspective.
Embedded Value(EV)
+35.1%
KRW
6.6 trillion

001 Introduction026 Core Competency048 Management’s Discussion & Analysis053 Operation Review074 Financial Section317 Appendix
063
General Insurance In 2019, the general insurance market grew by 5.5% YoY to KRW 6.2 trillion based on the direct premiums written. The Korean market increased by 4.7% YoY to KRW 5.7 trillion and the overseas market by 14.4% YoY to KRW 517.3 billion. Our sales based on the direct premiums written increased by 5.4% YoY to KRW 981.7 billion, and our prompt response to the governmental regulation to make liability insurance mandatory in more areas allowed us to rank top in elevator liability insurance and data privacy liability insurance sales. As our loss ratio rose by 4.6%p YoY to reach 75.6%, the ESS(Energy Storage System) fire that occurred in Korea along with other factors set us back considerably. We plan to manage our loss ratio through the proactive risk management of large-size contracts and improve our portfolio with a focus on high-quality properties.
Asset ManagementOur AUM grew by 6.1% YoY to KRW 29 trillion as of the end of 2019, with our investment income increasing by KRW 175 billion YoY to KRW 959 billion and our return on investment 3.46%. We follow the barbell asset management strategy to pursue profitability while managing asset/liability duration. In line with the adoption of K-ICS and other tightening capital adequacy regulations, our new investments are focused on profitable real estate and SOC-related assets and swaps are utilized to improve our returns on asset management. This will surely enable us to expand our asset duration through the purchase of long-term bonds, relieve the burden of required capital with the decreasing ratio of risk assets, and minimize decreases in returns caused by a longer asset duration. Furthermore, investment limits are set in advance by asset type to manage the profitability and stability of assets under management while rigorous risk management is practiced including asset-specific limit management to secure stable returns.
Risk ManagementKB Insurance manages its capital efficiency and profitability through performing capital allocations based on internal capital by business area in order to systematically support the development of a risk-based performance culture. Periodical monitoring is conducted to ensure that the company-wide risk appetite remains at an appropriate level against available capital. Quarterly Risk Management Committee meetings are held to make decisions on major risk-related issues while monthly Risk Management Council meetings are hosted to discuss the current status and necessary improvements to be made on major issues by business area including general insurance, long-term insurance, and car insurance.
We systematically and independently performed Own Risk and Solvency Assessments(ORSA) to earn exceptional scores in all of the eight sectors and be chosen as one of the best practices under the ORSA operational status reviews conducted by the Financial Supervisory Service last June on the insurance industry.
Commitment to Greater Customer Convenience KB Insurance leads the industry through a differentiated customer experience enabled by digital innovation. As the most distinguished insurer in the field of insurtech, we became the first in the industry in 2018 to unveil the ‘easy premiums claim service’, and moved on to
launch an integrated tailor-made mobile app and initiate ‘You Self Claim’ as a self-directed insurance payment system in 2019 to leverage our digital competitive edge to improve customer convenience. Going forward, we will create a digital ecosystem with startups and ICT businesses to offer differentiated services in order to solidify our status as an insurance provider that grows hand-in-hand with customers in the digital financial environment.
Plans for 2020 In line with increasing loss ratios across the industry as a whole and overall intensifying competition regarding high-risk products, the domestic insurance market is forecast to experience abrupt changes in 2020 including but not limited to growing financial risks caused by shifting external conditions(interest rates and FX) and an accelerated digitalization of the financial industry. In response, KB Insurance will continue to focus on customers and values in business conduct and on the following strategic priorities by business area.
In long-term insurance, we will improve our product structure to move away from low-profit products, tighten loss ratio management through contract management, and expand business growth mainly on such strategic revenue-generating products as health insurance packages and auto insurance in order to build a stable profit base. Furthermore, we will upgrade the entire product-underwriting-claim value chain to improve on our mortality profit and other claim efficiency indicators while migrating to digitally-based customer-centric product/business processes to enhance work efficiency and increase profitability.
We aim to secure price fairness in auto insurance by strengthening our underwriting capability while adjusting premium rates by customer and property and to pursue phased-in premium increases. We will launch new on-demand products, respond to the aggregator market, and reinforce collaboration with platform and fintech businesses to improve customer convenience and build a differentiated competitive edge.
In general insurance, we will focus on our key channel – corporate sales channel – to increase sales from profitable and high-quality property/liability insurance products, and also use varying channels spanning planners, agencies, and direct channels to broaden our stable profit base. This will go hand-in-hand with developing new products to target new markets and platform business and strengthening cross sales with other subsidiaries to bolster our sales base.
KB Insurance
Won the ‘Grand Prize in the financial category’, granted to the best app in the entire financial industry
Smart App Award Korea 2019
No.1

KB Financial Group Annual Report 2019064
Total Assets(KRW in trillions)
+12.2%17.7
2017
20.5
2018
23.0
2019
KB Kookmin Card
Launching ‘KB Kookmin Deun Deun Livelihood Loan 2’ as a new mid-range interest rate loan offering
Following ‘KB Kookmin Mid-range Interest Rate Loan’ launched in 2018, KB Kookmin Card also unveiled ‘KB Kookmin Deun Deun Livelihood Loan 2’ in 2019 that offers mid-range interest rates to its credit card holders in an aim to help low-income individuals ease their interest rate burden and keep pace with the Korean government’s inclusive finance policy initiative. This new loan product was designed to bear 11.0% or less average annual interest rates and under 14.5% in maximum annual interest rates and to qualify 70% or more of those customers with credit grades ranging from 4 to 10 in accordance with mid-range loan requirements imposed on card businesses. This product will be available for KB Kookmin Card credit card holders with mid-level credit grades who are chosen based on separate criteria. Launching this new product, KB Kookmin Card is expected to significantly help customers reduce their interest rate burden through its differentiated risk management capability and big data analytics, and will assist low-income groups with wide-ranging financial services to proactively respond to the government’s inclusive finance policy.
Assigned ‘A-‘ rating by Fitch for three consecutive years
We were assigned ‘A-‘ long-term credit ratings by Fitch for three consecutive years, and ‘A2’ by Moody’s in June 2019. This makes us the highest-rated specialized credit finance business in Korea, and this can be attributed to our continued efforts towards diversification to generate stable results amid decreasing merchant fees and other challenging business conditions and to our contribution to group-level synergy generation as a key subsidiary of KB Financial Group based on our stable growth potential and profitability.
Initiating connected car pilot service through Hi-pass
Through our partnership with ‘Owin’, a connected car solution provider, we launched a connected car pilot service enabled by Hi-pass digital electronic cards. As part of the ‘financial regulatory testbed’ initiative led by the Korean Financial Services Commission for financial institutions to be commissioned the right to use new financial services developed by startups and innovators to conduct pilot operations, this service allows users to register their car ID granted through the digital electronic Hi-pass card as well as user/vehicle/payment card information on ‘Owin Pick’, a connected car service mobile application. It then allows users to receive onboard assistance in placing location-based orders and making automatic payments through Bluetooth Low Energy. We plan to operate this pilot service and continue with follow-up work for its full-fledged release.
Signing the SPA to acquire PT. Financia Multi Finance of Indonesia In November 2019, we signed a share purchase agreement with ‘PT Finansia Multi Finance’, an Indonesian specialized credit finance business offering installment financing for automobiles, motorbikes and consumer goods. Multi finance companies are capable of selling local currency-related loan products – installment finance, lease, factoring, and housing mortgages – and conducting credit card business. Our plan
+10.5%
296.8
2017
286.6
2018
316.6
2019
Net Income (KRW in billions)
KB Kookmin Card provides a broad range of financial services, including credit card and check card services and installment financing. Notably, the company has been ranked first in the industry in check card transaction amounts for nine consecutive years. To secure future growth drivers, KB Kookmin Card is expanding its market position in the auto installment and lease financing and mid-range interest rate loan sectors while accelerating its global business operations to tap into new sources of profit from multiple angles. As a tech-fin business enabled by big data and digital technology, KB Kookmin Card will set the trend of the future payment market, and focus on digital and data business to develop new payment systems and continuously strengthen data analytics and application.

001 Introduction026 Core Competency048 Management’s Discussion & Analysis053 Operation Review074 Financial Section317 Appendix
065
Card Transaction Volume(KRW in trillions)
+8.0%124.0
2017
136.9
2018
147.9
2019
is to acquire its 80% stake at USD 81.3 million (nearly KRW 9.5 billion) owned by PEFs, and officially transform the company into our second overseas subsidiary in the 2nd half of 2020 following approval by the financial authorities and post-merger integration. We aim to assist PT Finansia Multi Finance in evolving into a specialized credit finance business with products and services ranging from consumer goods installment finance to credit card operations: its installment finance business will be diversified through the continued transfer of our product development, risk management and digital core capabilities, and its card operation will be initiated including card processing agency business.
Becoming the 1st card company to receive the Presidential Award for exceptional labor relations
Kookmin Card became the first-ever card company to be honored with the Presidential Award at the ‘Labor-Management Culture Awards 2019’ in recognition of its contribution to establishing exemplary labor relations and a win-win labor-management culture.
Supervised by the Ministry of Employment and Labor and the Korea Labor Development Foundation, the awards serves to reward businesses and organizations for practicing a win-win labor culture, and awardees are determined through documentary/on-site reviews and case study presentations out of the businesses granted ‘Labor-Management Culture Top Performer’ certificates. Once awarded, these businesses become eligible for wide-ranging administrative/financial benefits including the exemption from regular work supervision for three years.
While KB Kookmin Card, following its establishment in 2011, suffered conflicts as labor-management confrontations on major issues resulted in repetitive labor dispute arbitration procedures executed by the National Labor Relations Commission, it has been positively evaluated in recent years for developing win-win labor relations through a range of mutual communication programs and for endeavoring to practice an advanced labor-management culture.
Notably, proactive steps have been taken to improve negotiation practices, from setting reasonable rules between labor and management and sharing negotiation agendas in advance to honoring simple promises, sharing review materials and hosting regular working-level workshops. The sum of such endeavors has led to the creation of outstanding labor relations.
The joint labor-management activity program ‘Harmony Created Together by KB Kookmin Card Labor and Management’ also allowed us to facilitate communication and to join hands in attending labor-related academic training and diverse social contribution programs, which highlighted our efforts to strengthen mutual cooperation and earned us high scores accordingly.
Plans for 2020While the growth of the card market turns sluggish due to worsening economic conditions and withering consumer confidence, we are encountering new competitive threats including the rapid emergence of fintech companies. As we recognize all such changes in the business landscape as a turning point to take a renewed step forward, we will follow the below three directions in actively conducting all our business initiatives.
First, we will take a back to ‘basics’ approach that focuses on our customers. We will perform detailed analyses of all our processes that occur in the customer use of our products and services and utilize their outcomes to continuously deliver innovative customer services.
Second, we will set ourselves apart from the competition with our top-notch digital capabilities. To keep pace with the ICT evolution, we will continue to embrace new technologies while taking a fresh perspective in identifying market and consumer trends and leading the industry.
Third, we will continuously expand the scope of our new business. Leveraging the existing card business base and data as well as wide-ranging assets, we will broaden our new business in Korea and abroad and diversify our profit base.
Establish win-win labor relations and practice an advanced labor-management culture through mutual communication program
Labor-Management Culture Awards 2019
The Presidential Award
KB Kookmin Card

KB Financial Group Annual Report 2019066
AUM(KRW in trillions)
+16.1%50.6
2017
51.0
2018
59.2
2019
Net Profit(KRW in billions)
+23.5%
52.0
2017
39.6
2018
48.9
2019
KB Asset Management
Strengthening overseas investment competencyFollowing the creation of a subsidiary in Shanghai, China, in August 2018, we opened a representative office in Vietnam in September 2019 to steadily expand our global presence and our overseas portfolio. Such endeavors resulted in noteworthy investment outcomes mainly in China and Vietnam in 2019: our Chinese equity funds reached KRW 1.6 trillion in AUM and our internal management size rose by 20% YoY to KRW 770.0 billion as of the end of 2019. In Vietnam, we became the first in the industry to launch a Vietnamese index fund in April 2019, and have since continued to grow our business with KRW 150.3 billion in AUM and nearly KRW 50 billion in the size of internal management of these funds as of the end of 2019.
Expanding alternative investment areas and increasing the share of overseas investmentsOur alternative investment operation is growing rapidly, posting a 23.8% YoY growth to KRW 13.0 trillion as of the end of 2019. Notably, our cumulative investments in photovoltaics(PV), wind farm, and other renewable energy sources amounted to KRW 1.5 trillion which enabled us to rank first in the industry. With our expertise in operating domestic infrastructure funds, we are also diversifying our investment destinations into overseas real estate and renewable energy. We made KRW 220 billion-worth GIF(Global Infrastructure Fund) commitments in May 2019 and increased our overseas infrastructure investments – energy infra projects in North America, PV generation in Spain, fund of funds in public affordable housing in the U.S., and mezzanine blind funds in Europe – to eventually raise the ratio of overseas investments out of the total alternative investments from nearly 19% at the end of 2018 to 28% at the end of 2019.
Broadening the Korean equity ETF line-upAs of the end of 2019, our ETF net asset value amounted to KRW 3.0 trillion, up by 16% from the previous year due to the expanding product line-up and a fund inflow mainly into new ETFs. In 2019, 12 new ETF offerings were listed to scale up our product line-up to 73 in total.
Plans for 2020In 2020, we plan to boost our marketing campaign on the existing equity funds and pension funds as a way to facilitate the public offering fund market while addressing shifting market conditions swiftly and flexibly by reinforcing our product line-up with a focus on overseas asset allocation funds. Furthermore, we will continue to closely collaborate with global fund managers to further develop our management competency and continue with our innovative digital strategy to reinforce our quant-based management capabilities and focus on non-face-to-face channel marketing to keep pace with technological changes in the 4th Industrial Revolution era.
In alternative investments, we aim to diversify our investment assets and the counties in which we provide them to, and expand our overseas infrastructure business to offer institutional investors varying profit-generation opportunities. Furthermore, we will proactively explore new products in the areas of domestic infrastructure and real estate to cater to the needs of individual investors.
As of the end of 2019, KB Asset Management’s total assets rose by 21.9% YoY to KRW 310.0 billion, and its net profit increased by 23.5% to KRW 48.9 billion. With AUM growing by 16.1% from the previous year to KRW 59.2 trillion, KB Asset Management continued with its growth journey in 2019.
Alternative Investments
+23.8 %
KRW 13.0 trillion
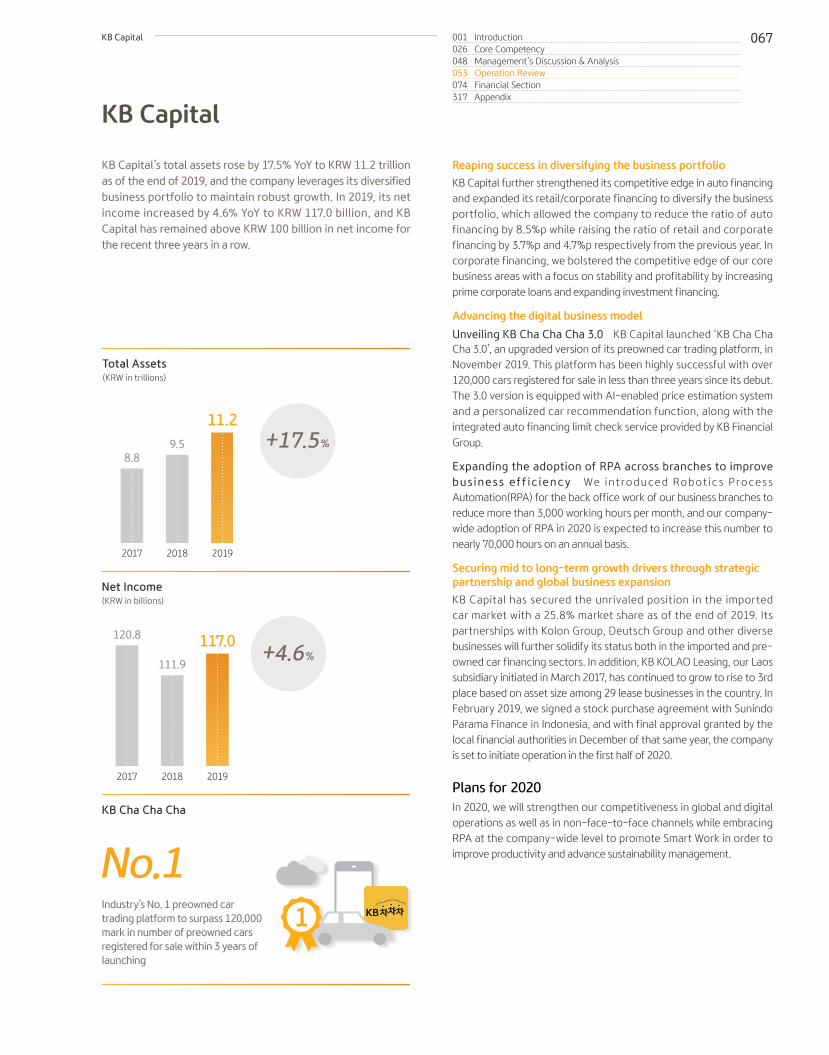
001 Introduction026 Core Competency048 Management’s Discussion & Analysis053 Operation Review074 Financial Section317 Appendix
067
+4.6%
Net Income(KRW in billions)
120.8
2017
111.9
2018
117.0
2019
+17.5%
Total Assets(KRW in trillions)
8.8
2017
9.5
2018
11.2
2019
KB Capital
Reaping success in diversifying the business portfolioKB Capital further strengthened its competitive edge in auto financing and expanded its retail/corporate financing to diversify the business portfolio, which allowed the company to reduce the ratio of auto financing by 8.5%p while raising the ratio of retail and corporate financing by 3.7%p and 4.7%p respectively from the previous year. In corporate financing, we bolstered the competitive edge of our core business areas with a focus on stability and profitability by increasing prime corporate loans and expanding investment financing.
Advancing the digital business model
Unveiling KB Cha Cha Cha 3.0 KB Capital launched ‘KB Cha Cha Cha 3.0’, an upgraded version of its preowned car trading platform, in November 2019. This platform has been highly successful with over 120,000 cars registered for sale in less than three years since its debut. The 3.0 version is equipped with AI-enabled price estimation system and a personalized car recommendation function, along with the integrated auto financing limit check service provided by KB Financial Group.
Expanding the adoption of RPA across branches to improve bus iness e f f ic ienc y We in t roduced Robot ic s P roces s Automation(RPA) for the back office work of our business branches to reduce more than 3,000 working hours per month, and our company-wide adoption of RPA in 2020 is expected to increase this number to nearly 70,000 hours on an annual basis.
Securing mid to long-term growth drivers through strategic partnership and global business expansion KB Capital has secured the unrivaled position in the imported car market with a 25.8% market share as of the end of 2019. Its partnerships with Kolon Group, Deutsch Group and other diverse businesses will further solidify its status both in the imported and pre-owned car financing sectors. In addition, KB KOLAO Leasing, our Laos subsidiary initiated in March 2017, has continued to grow to rise to 3rd place based on asset size among 29 lease businesses in the country. In February 2019, we signed a stock purchase agreement with Sunindo Parama Finance in Indonesia, and with final approval granted by the local financial authorities in December of that same year, the company is set to initiate operation in the first half of 2020.
Plans for 2020In 2020, we will strengthen our competitiveness in global and digital operations as well as in non-face-to-face channels while embracing RPA at the company-wide level to promote Smart Work in order to improve productivity and advance sustainability management.
KB Capital’s total assets rose by 17.5% YoY to KRW 11.2 trillion as of the end of 2019, and the company leverages its diversified business portfolio to maintain robust growth. In 2019, its net income increased by 4.6% YoY to KRW 117.0 billion, and KB Capital has remained above KRW 100 billion in net income for the recent three years in a row.
Industry’s No. 1 preowned car trading platform to surpass 120,000 mark in number of preowned cars registered for sale within 3 years of launching
KB Cha Cha Cha
No.1
KB Capital

KB Financial Group Annual Report 2019068
+10.7%p
RBC(%)
195.6
2017
203.7
2018
214.4
2019
+1.0%
Total Assets(KRW in trillions)
9.1
2017
9.7
2018
9.8
2019
KB Life Insurance
KB Life Insurance reached KRW 1,182 billion in premium income, up by 1.8% from 2018, and its net income also rose by 7.7% from the previous year to KRW 16.0 billion. As its Value of New Business(VNB) amounted to KRW 32.8 billion and total assets KRW 9.8 trillion, the company is well on track for continued growth.
Building a CPC-based integrated marketing systemWe developed ‘Customer-Product and Channel(CPC)’ based strategic direction to place our customers interests at our first priority while leveraging our customer segment analysis platform to perform wide-ranging analysis. As part of our digital marketing programs designed to secure future financial customers, online customer touchpoints were broadened by creating social network marketing channels. We also executed influencer marketing to target the millennial population.
Responding to changes in the regulatory environmentWith the continued implementation of the IFRS17 system development project, a stable infrastructure and a management decision-making support system were established while our RBC level has remained above the set target through the sustained duration extension of the assets before the adoption of the Korean Insurance Capital Standard (K-ICS). Furthermore, we make use of varying methods to promote internal modeling-based risk management and assist value-driven product development through the reflection of the new K-ICS and risk factor segmentation and improvement.
Driving digital transformation Our Smart Work Place initiative allowed us to create a mobile work environment, and we endeavored tirelessly to bring innovation to our value chain by establishing a data analysis system based on the DB targeting model, leveraging Robotics Process Automation to improve work processes, and developing a Smart UW System. Building a collaborative ecosystem with fintech businesses, we are also broadening our ecosystem.
Plans for 2020As a business in the life insurance market, we witness continued concerns over the profitability and growth potential of the insurance industry itself due to low growth, low interest rates and other unfavorable business conditions. Furthermore, the spread of high tech-based digital platforms is imposing numerous changes upon the overall financial industry. The insurance industry is also challenged with the introduction of IFRS17 and K-ICS, the tightening business regulations put in place to protect customers, and systemic and regulatory changes concerning business expenses and solicitation commissions. All these prompted KB Life Insurance to establish the following strategic steps.
First, our growth will be driven by our customers. We will rigorously analyze the data we collect regarding our customers and markets to constantly deliver products that truly meet the needs of our customers, and we will solidify our brand image as an insurer who truly puts customers first. Second, we will proactively respond to market and system changes to pursue quality and value-driven growth while fortifying our corporate value by improving management efficiency from the long-term perspective. Third, we will seek digitally-driven innovation to strengthen the user experience and optimize our value chain and data analytics system. This will undoubtedly expand our presence within the digital ecosystem as a business that wholeheartedly values customers.
Posted 32.8 billion of Value of New Business through the sustained sales of protection and variable products
Value of New Business(VNB)
KRW
32.8 billion

001 Introduction026 Core Competency048 Management’s Discussion & Analysis053 Operation Review074 Financial Section317 Appendix
069
KB Real Estate Trust
+31.3%
Net Income(KRW in billions)
36.4
2017
47.0
2018
61.7
2019
+29.1%
Operating Income(KRW in billions)
47.4
2017
64.5
2018
83.3
2019
Posted KRW 61.7 billion of net income in 2019 to set a new record in corporate history
KB Real Estate Trust became the first in the industry to launch completion guarantee management land trust products, and is currently broadening its real estate development portfolio into urban regeneration, REITs and other diverse areas to diversify its operational basis. The sum of such endeavors allowed the company to post KRW 61.7 billion in net income in 2019, up by 31.3% from the previous year, setting a new record in its corporate history.
Increasing New Orders Awarded on High-Quality Properties and Thorough Risk We perform stringent location analyses and feasibility reviews to focus on profitable project undertakings as a way to secure a stable profit base. Notably in the trust business, we endeavor to increase orders awarded for completion guarantee management land trust projects that are executed on an advanced business structure as well as profitable leveraged land trust projects. Our profit base is also being diversified through low-risk collateral trusts and other non-land trust offerings.
In the reconstruction business, we tender for profitable reconstruction projects and host promotional presentations to proactively conduct business, and are adopting diverse business models such as project agency and small-scale reconstruction in addition to the conventional project operation model to rebalance our business portfolio.
As far as the REITs business goes, the ‘REITs Business Division’ was created in 2019 to improve the competitiveness of our REITs operations, and our investments were diversified into retail properties and logistics centers to generate greater business outcomes.
In the risk management sector, periodic monitoring is performed on preemptive response processes developed in preparation for emergencies and on product-specific limit runout rates while phase-based progress reviews are made on major parts of the projects being implemented to manage risks preemptively.
Plans for 2020It is expected that the year 2020 will witness a deepening economic slowdown and continued downturn in the real estate market in Korea while the entry of new trust firms will further intensify competition in the real estate trust market. As such, KB Real Estate Trust will practice risk management based on product-specific risk factors and take swift and company-wide actions to address the pending issues of respective projects so as to solidify its proactive risk management system and push forward with digitalization to maximize business efficiency.
In the reconstruction business, we will ensure we obtain governmental official designation as either a project operator or a project agent on the projects we are currently working on, and increase our orders granted by respective business execution models in order to improve our performance. In the REITs business, we will diversify our investment portfolio and upgrade investment operations while diversifying the profit portfolio by participating in public biddings and launching wide-ranging property-based REITs products. Furthermore, we will advance our REITs operations to increase the value of REITs assets and maximize our operational outcomes through successful asset sales.
Ranked top-level of AUM in the industry with 12.3% of market share
KRW
28.3 trillion
AUM
KB Real Estate Trust

KB Financial Group Annual Report 2019070
KB Savings Bank
Posted 1.8%, significantly lower than the industry average to make remarkable progress in asset quality management
NPL Ratio
1.8%
In 2019, KB Savings Bank posted KRW 16.3 billion in net income and 1.8% of NPL ratio to demonstrate continued stable performance. In April 2019, the bank became the first-ever in the financial industry to adopt non-FIDO authentication, and launched a mobile banking app equipped with the mobile certificate functionality as a way to pursue digital innovation.
and mortar branches. This allows for easy and convenient access to these financial services by reducing business costs which will keep our loan interest rates low and deposit interest rates high.
New Products and Most-Popular Products & Services We offer wide-ranging financial products that cater to customer needs, from our flagship mid-range interest rate loan ‘KB Kind Loan’ to the Korea Inclusive Finance Agency’s ‘Sunshine Loan’ and the Seoul Guarantee Insurance Company’s ‘Saitdol 2’. In so doing, we not only help the working class build their assets but also serve as an intermediary in enabling low-credit customers, who are otherwise unable to get approved for loans at commercial banks, to benefit from the regulated financial system.
In May 2019, we launched the gamification product ‘KB Honey Savings’ to expand the territory of our business. This daily installment savings product comes with a 100-day maturity and offers up to 55,000 Liiv Mate points in addition to a 2.2% annual base rate. The Liiv Mate points are accumulated when the account holder plays the ‘Cham Cham Cham’ game following a daily automatic transfer, recommends this product to others, or opens his/her account. This product was named based on the idea generated through Gig, a voluntary idea suggestion meeting attended by KB Savings Bank employees, and we plan to launch diverse digital products that allow customers to experience saving money through such an amusing platform.
*Gig: The term originates in jazz music and is the name of KB Savings Bank’s in-house employee meeting organized voluntarily to meet specific purposes.
Becoming the First in the Industry to Achieve the ISO37001 Anti-Bribery Management Certification We became the first in the industry to achieve the ISO37001 international anti-bribery management certification in 2018, and have since maintained our certification through annual assessments in 2019. Our strong commitment and endeavors to establish and implement a practical and detailed anti-bribery management system were highly recognized, which include but are not limited to thorough financial policy compliance, mandatory integrity training, strengthened disciplinary standards, the proactive identification and improvement of anti-bribery risk factors at the department level, and internal evaluations and management reviews led by anti-bribery compliance managers. This represents a best practice on anti-bribery management in the savings bank industry, and we are strengthening our anti-bribery and integrity promotion activities.
Plans for 2020 KB Savings Bank will become a ‘Clean Bank’ through preemptive risk management and an industry-leading digital bank through the offering of differentiated digital customer experiences. To realize this vision, we will 1) deliver mobile banking services that offer the greatest-possible benefits and convenience to customers, 2) efficiently reallocate our human resources through process automation to pursue cost efficiency and productivity gains, 3) rebuild our credit rating model to broaden the credit spectrum of our mid-range interest rate loan portfolio, and 4) advance our IT infrastructure to ensure long-term growth.
Generating Synergy through Collaboration with SubsidiariesInclusive finance products(KB Kind Loan, Sunshine Loan, and Saitdol 2) along with mortgage loans provided in alignment with KB Savings Bank’s loan products are available at KB Kookmin Bank locations, and the subsidiary-linked loans posted a 125% YoY growth as a result of strengthened synergy with group subsidiaries through the promotion of subsidiary-aligned loans.
Achievements from Upgraded Digital FinancingThe KB Savings Bank’s mobile banking app is the first in the financial industry to deliver the ‘voice service’ enabled by non-FIDO authentication and the ‘mobile certificate’ function that uses QR codes to ascertain the authenticity of certificates. Our innovative mobile banking improved the UI/UX for greater customer convenience and increased the speed of log-ins and screen transition times to the highest-possible level in the industry. With the goal of creating a user-centric financial platform, we elevated security performance based on our philosophy of ‘Secure, Simple, and Speedy’, adopted a simple certification technique to increase service accessibility and utility, and achieved the highest-possible transaction speed in the financial industry through the rearrangement of security solutions and the improvement of transaction modes.
In 2020, we plan to leverage digital transformation to unveil our mobile banking services powered by a number of new technologies. We also aim to deliver even greater benefits to the working class by providing digital finance services for those who find it difficult to visit our brick

001 Introduction026 Core Competency048 Management’s Discussion & Analysis053 Operation Review074 Financial Section317 Appendix
071
KB Investment
Raised the collaboration fund with KB Kookmin Bank and five other subsidiaries to invest in the global market
+89.9%
Venture Investment (KRW in billions)
KB Global Platform Fund
90.3
2017
141.1
2018
267.9
2019
+36.8%
New Venture Funds Raised(KRW in billions)
158.0
2017
201.0
2018
275.0
2019
KRW
220.0 billion
Fund Creation and New Investment Reinforcement Strategy Driven by the Korean government’s venture business promotion policy, annual venture investments in the venture investment market surged by 25% from 2018 to reach nearly KRW 4.2 trillion in 2019, setting a new record in the venture investments made. With newly-formed venture capitals amounting to KRW 4.1 trillion, both fund creation and new investment witnessed rapid growth.
The number of new venture capital increased by 16 year on year and a record-high number of venture funds was created this year, competition has intensified in organizing funds and identifying deals. These circumstances prompted KB Investment to strengthen its collaboration with group subsidiaries in creating large-size venture funds while reinforcing investment in and promotion of new growth industries and overseas investment destinations.
Large-size Funds and Subsidiary Collaboration Funds In May 2019, KB Investment launched a KRW 220.0 billion large-scale KB Global Platform Fund in conjunction with KB Kookmin Bank, KB Securities, KB Insurance, KB Capital, and KB Kookmin Card, and made investments in the global market based on the funds raised.
PEFs and Specialty Venture Funds KB Investment created the ‘KB CAPE No.1’ fund with KRW 19.3 billion in total commitments in cooperation with CAPE Investment & Securities to invest KRW 18.8 billion in ‘TNK Factory’s redeemable convertible preferred stocks. In addition, We created the KB Culture & Global Digital Contents Fund valued at KRW 40 billion to invest in domestic/overseas cultural digital content businesses. In addition, the KRW 15 billion KB Social Impact Investment Fund was launched to invest in social enterprises.
Nurturing New Growth Industries and Making Overseas Investments We increased our investments in new growth industries: our ICT service investment posted a whopping 270% increase from KRW 37.1 billion in 2018 to KRW 137.1 billion in 2019, and our investment in the bio and health care sectors also surged by 114% from KRW 29.7 billion in 2018 to KRW 63.7 billion in 2019. Meanwhile, our Seed and Series A investments rose by 49% from KRW 47.2 billion in 2018 to KRW 70.1 billion in 2019, and our overseas investments skyrocketed by 489% from KRW 16.0 billion in 2018 to KRW 94.2 billion in 2019.
In 2019, KB Investment’s fund assets under management, including PEFs, increased by KRW 294 billion from the previous year to reach KRW 1,303 billion, and its investments also set a new record high at KRW 267.9 billion.
Plans for 2020 KB Investment will continue with its mid to long-term growth strategy to nurture talented employees and strengthen its investment capacity with an aim to move beyond being a top-tier venture capital business into the Most Influential Venture Capital within three years. We will also further broaden our global presence to establish a balanced investment portfolio and lay the basis for mid to long-term growth.
In 2019, KB Investment launched KRW 220.0 billion-worth large venture funds as well as new venture funds valued at KRW 275.0 billion in total, which raised its investments by 36.8% from the previous year. Its venture fund AUM surpassed the KRW 1 trillion mark, and the company formed subsidiary collaboration funds worth KRW 220 billion as a way to invest in the global market.
KB Investment

KB Financial Group Annual Report 2019072
Completed the development of KB Kookmin Card’s next-generation system and the redevelopment of the banking call center system under the The K Project
Net Income(KRW in billions)
IT system development
0.9
2017
2.9
2018
4.7
2019
+3.7%
Total Assets(KRW in billions)
41.9
2017
40.2
2018
41.7
2019
+62.1%
KB Data Systems
KB Data Systems reached KRW 41.7 billion in total assets, up by 3.7% from the previous year, and net income posted KRW 4.7 billion, up by 62.1% from the previous year, while sales posted a 20.3% YoY growth to KRW 158.1 billion in line with increasing group-level IT investments. KB Data Systems is also supporting KB Financial Group’s IT and digital innovation strategy, spanning from cloud and AI to blockchain.
Reaping success in building a next-generation system for group subsidiaries
In 2019, we successfully completed the development of a next-generation card system, and redeveloped the call center system under the KB Kookmin Bank’s “The K” Project. Furthermore, our professional developers took an active role in the information system and data hub businesses. As intensifying competition against internet-only banks and fintech businesses led to the growth of non-face-to-face channels and new IT-related business, KB Data Systems proactively joined the IT businesses conducted in digitally-driven core areas on the group level to assist KB Financial Group’s digital strategy and accelerate its digitalization.
Generating synergy through joint group-level IT system development
We developed IT systems that could be shared among group subsidiaries, including integrated internal controls for financial reporting and an integrated certificate platform while operating a joint group-wide IT system from WiseNet(group portal system) and open APIs to help improve the IT efficiency of KB Financial Group. In business operations, KB Insurance’s IT system operation was transferred to KB Data Systems to enable us to secure expertise in serving the IT operational service needs of the group and to extend the scope of these services into other subsidiaries in the savings bank and capital sectors. In line with the increasing demand for group-level operational business and SI development, our workforce expanded from 413 to 484 employees on a YoY basis, and the widened scope of our operational service support for insurance, card, capital and other non-banking subsidiaries demonstrates our commitment to providing balanced IT services at the group level.
Creating Digital IT Business Unit and internalizing digital competency
In 2019, Digital IT Business Unit was created to help us serve as a digital and IT hub within KB Financial Group and support its wide-ranging digital-related IT services. We participated in developing the strategy to assist the group’s savings bank business in migrating to digital banking, and adopted DevOps-based agile development methodology(CI/CD) in supporting the cloud-driven hybrid financing(CLAYON) business, thereby internalizing digital capabilities and broadening the width of our IT service offerings.
Plans for 2020 In response to KB Kookmin Bank’s “The K” Project and KB Financial Group’s digital innovation, KB Data Systems will recruit top performers and invest these top-notch human resources in a timely manner to assist the successful completion of the group’s next-generation system development. In hybrid financing, we will strengthen collaboration on major group-level businesses – particularly Cloud platform business and life-style financing(Liiv) business – to help generate synergy in the IT sector while securing and internalizing exceptional digital capabilities to grow into a provider of IT services that truly satisfies customer needs.
Supported the successful deployment of a next-generation IT system

001 Introduction026 Core Competency048 Management’s Discussion & Analysis053 Operation Review074 Financial Section317 Appendix
073
KB Credit Information
Manage nearly KRW 5 trillion worth NPLs from KB Financial Group subsidiaries and post KRW 322.2 billion in annual debt collection
+8.8%
Sales(KRW in billions)
KB Financial Group debts collected in 2019
31.7
2017
35.2
2018
38.3
2019
+5.7%
Total Assets(KRW in billions)
26.1
2017
26.3
2018
27.8
2019
Improving the Efficiency and Competitiveness of Debt Collection
KB Credit Information proactively recruited top-performing debt collectors in the areas of banking and card debts, operated an adequate performance management system, and strengthened its management system by type of debt in order to maximize group-level debt collection and recovery, and these multi-pronged endeavors allowed us to significantly increase the efficiency and competitiveness of our debt collection business. In 2019, we posted relatively robust performance in the face of worsening business conditions with our debt collection sales and group-level debt recovery reaching KRW nearly 28.2 billion and KRW 322.2 billion respectively. We also continuously extended our group-level business areas by supporting KB Kookmin Card’s credit recovery business, accepting KB Capital’s delinquent debts, and increasing the commission of bank debts.
By type of debt, the amount of delinquent debts we retrieved was KRW 154.1 billion at KB Kookmin Bank, KRW 159.7 billion at KB Kookmin Card, and KRW 8.9 billion at KB Insurance, KB Capital, and KB Savings Bank, which allowed us to remain above KRW 320 billion in annual debt collection just as we had last year.
As outstanding debt collectors are the key to our debt collection business, one of our top priorities for 2019 was to recruit these top-performing individuals. A total of 75 professional debt collectors were hired in the bank and card debt areas. The majority of these collectors outperformed their colleagues which served to affirm our expectation that their services will play a pivotal role for KB Credit Information in building a stronger competitive edge.
In lease investigation, our sales reached nearly KRW 9.5 billion, and we did our best to advance into diverse businesses derived from these investigations by continuing to accept title search work from KB Insurance and preparing a bid at the Korea Asset Management
Corporation.
Plans for 2020 In 2020, the economic slowdown is forecast to continue due to external/internal uncertainties and debtors’ moral hazard is also expected to aggravate in line with governmental support for the underprivileged, which prompted KB Credit Information to further reinforce its competitive edge as a debt collector in order to improve group-wide asset quality as its top priority. Our management system will be bolstered by type of debt and group-level debt collection will be maximized while proactive responses will be made to address declining debt volume. Meanwhile, we continue to explore new sources of revenue – KB Insurance, KB Capital, KB Savings Bank, and a business derived from lease investigations. We intend to strengthen our business competency through an advanced IT system and improve our organizational productivity through appropriate organizational and workforce operations while continuously tightening the management of delinquent customers in Korea in line with financial consumer protection regulations.
In 2019, KB Credit Information posted an approximately 8.8% growth in sales to KRW 38.3 billion, and its total assets rose by nearly 6% to KRW 27.8 billion. While financial institutions strengthened their asset quality this year to negatively impact the amount of debts managed by credit information businesses, this also helped to maintain a low level of delinquency ratio and non-performing loans on the part of financial institutions from the long-term view point, contributing to managing asset quality at the group level.
KRW
322.2 billion
KB Credit Information

Financial Section
Consolidated Financial Statements
Separate Financial Statements
075
256
KB Financial Group Annual Report 2019074

Independent Auditor’s Report
To the Board of Directors and Shareholders of KB Financial Group Inc.
Opinion
We have audited the accompanying consolidated financial statements of KB Financial Group Inc. and its subsidiaries (collectively referred to as the “Group”),
which comprise the consolidated statements of financial position as at December 31, 2019 and 2018, and the consolidated statements of comprehensive
income, consolidated statements of changes in equity and consolidated statements of cash flows for the years then ended, and notes to the consolidated
financial statements, including a summary of significant accounting policies.
In our opinion, the accompanying consolidated financial statements present fairly, in all material respects, the consolidated financial position of the Group
as at December 31, 2019 and 2018, and its consolidated financial performance and its consolidated cash flows for the years then ended in accordance with
International Financial Reporting Standards as adopted by the Republic of Korea (Korean IFRS).
Basis for Opinion
We conducted our audits in accordance with Korean Standards on Auditing. Our responsibilities under those standards are further described in the Auditor’s
Responsibilities for the Audit of the Consolidated Financial Statements section of our report. We are independent of the Group in accordance with the
ethical requirements of the Republic of Korea that are relevant to our audit of the consolidated financial statements and we have fulfilled our other ethical
responsibilities in accordance with the ethical requirements. We believe that the audit evidence we have obtained is sufficient and appropriate to provide a
basis for our audit opinion.
Key Audit Matters
Key audit matters are those matters that, in our professional judgment, were of most significance in our audit of the consolidated financial statements
of the current period. These matters were addressed in the context of our audit of the consolidated financial statements as a whole, and in forming our
opinion thereon, and we do not provide a separate opinion on these matters.
1. Expected Credit Losses on Loans Measured at Amortized Cost
Why it is determined to be a key audit matter :
The impairment guidance under Korean IFRS 1109 Financial Instruments requires determination of significant increases in credit risk and measurement of
expected credit losses using forward-looking information and others. Accordingly, the Group developed a new measurement model utilizing various types
of information, which requires a higher level of management’s interpretation and judgment.
The Group measures expected credit losses on loans measured at amortized cost, on an individual or collective basis. The identification of loans that
are deteriorating and the assessment of the present value of expected future cash flows in determining expected credit losses are inherently uncertain,
involving various assumptions and judgment. In measuring expected losses on a collective basis, a wide range of complex inputs and assumptions are used.
Given the extent of judgment involved, we considered expected credit losses to be a key audit matter.
Loans measured at amortized cost subject to individual or collective assessment are ₩ 342,092,076 million, with loan loss allowances of ₩ 2,408,016
million, as of December 31, 2019(See Note 4-2, 10, 11). In addition, unused commitments and guarantees are ₩ 163,972,499 million, with related provisions
of ₩ 291,970 million as of December 31, 2019(See Note 4-2, 23, 40). Significantly affected subsidiaries are Kookmin Bank and KB Kookmin Card.
(English Translation of a Report Originally Issued in Korean)
Financial Section 075

How our audit addressed the key audit matter :
(1) Assessment of expected credit losses on an individual basis
We obtained an understanding and evaluated the processes and controls relating to the assessment of expected credit losses on an individual basis. In
particular, we focused our effort on the assumptions used in estimating future cash flows. We evaluated whether management’s estimation was reasonable
and we assessed the key assumptions in the cash flow projection including growth rate of entities subject to individual assessment and valuation of
collateral. As part of these procedures, we assessed whether sales growth rate, operating income ratio, and assumptions on investment activities were
consistent with historical performance and current market conditions. Furthermore, we assessed the appropriateness of collateral valuation by conducting
our own research on recent property prices and engaged independent appraisal specialists in assessing reasonableness of appraisal reports, models and
methodologies used by management.
(2) Assessment of expected credit losses on a collective basis
We obtained an understanding and evaluated the processes and controls relating to management’s calculation of expected credit losses on a collective
basis in accordance with impairment requirements under Korean IFRS 1109 Financial Instruments. As explained in Note 2, management assesses credit
ratings to recognize lifetime expected credit losses on loans with significant increase in credit risk and impaired loans. Other than these cases, management
recognizes twelve-months of expected credit losses. To calculate all expected credit losses, management has applied forward-looking information,
probability of default, loss given default, and other assumptions estimated through its internal procedures and controls implemented for various
assumptions.
We assessed the design and operating effectiveness of controls relating to credit ratings that reasonably reflect both qualitative and quantitative
information. Our testing over the accuracy and reliability of the information included agreeing qualitative and quantitative information with relevant
evidence.
We reviewed the appropriateness of management policies and procedures to determine significant increases in credit risk, and tested reasonableness of
expected credit loss model applied by each of the three stages(Stage 1, 2 and 3) depending on how significantly credit risk was increased.
Our audit involved risk specialists to statistically analyze the correlation between forward-looking information and probability of default or loss given
default. We assessed the appropriateness of methodologies for adjusting the probability of default and loss given default to reflect forward-looking
information on estimation of expected credit losses. We further tested the reasonableness and mathematical accuracy of the information through
recalculation and inspection of supporting data.
We reviewed the methodologies used by management to verify that probability of default and loss given default were calibrated using sufficient and
reasonable historical data. We determined that the default and loss data used were appropriately gathered and applied in accordance with internal
control procedures. In addition, we assessed reasonableness and accuracy of probability of default and loss given default through procedures including
recalculation, and evaluated management’s default and loss data.
2. Valuation of Over-The-Counter Derivatives
Why it is determined to be a key audit matter :
Fair value of large portion of over-the-counter derivatives in the consolidated financial statements is calculated through the use of an internally
developed valuation system. Judgment is required in estimating the fair value of these derivatives held by KB Securities in determining appropriate models,
assumptions and inputs. Given the extent of judgment involved in valuing these over-the-counter derivatives, we considered this to be a key audit matter.
Over-the-counter derivatives of KB securities subject to fair value measurement amount to ₩ 14,444,557 million as of December 31, 2019, including
financial liabilities designated as at fair value through profit or loss related to structured securities and financial assets at fair value through profit or loss(See
Note 6).
How our audit addressed the key audit matter :
We obtained an understanding and evaluated processes and controls in relation to fair value measurement. Our focus was particularly on the accuracy of
underlying transaction data used and mathematical calculation in accordance with management’s internal valuation methodologies.
We assessed design and tested operating effectiveness of controls over accuracy and completeness of key inputs such as underlying transaction data
(notional amount, interest rate, maturity etc.) used in management’s determination of estimated fair value. We tested transaction data used in the valuation
by examining supporting evidence including contracts and trade confirmations.
KB Financial Group Annual Report 2019076

We also evaluated the design and tested the operating effectiveness of controls over periodic verification of management’s internal valuation system to
ensure the valuation methodologies configured in the system were operating as intended. We involved our derivative valuation specialist to independently
estimate fair values utilizing independent valuation models and variables to see if management’s valuation is outside our ranges.
Other MatterAuditing standards and their application in practice vary among countries. The procedures and practices used in the Republic of Korea to audit such
consolidated financial statements may differ from those generally accepted and applied in other countries.
Responsibilities of Management and Those Charged with Governance for the Consolidated Financial StatementsManagement is responsible for the preparation and fair presentation of the consolidated financial statements in accordance with Korean IFRS, and
for such internal control as management determines is necessary to enable the preparation of consolidated financial statements that are free from
material misstatement, whether due to fraud or error.
In preparing the consolidated financial statements, management is responsible for assessing the Group’s ability to continue as a going concern,
disclosing, as applicable, matters related to going concern and using the going concern basis of accounting unless management either intends to
liquidate the Group or to cease operations.
Those charged with governance are responsible for overseeing the Group’s financial reporting process.
Auditor’s Responsibilities for the Audit of the Consolidated Financial StatementsOur objectives are to obtain reasonable assurance about whether the consolidated financial statements as a whole are free from material
misstatement, whether due to fraud or error, and to issue an auditor’s report that includes our opinion. Reasonable assurance is a high level
of assurance, but is not a guarantee that an audit conducted in accordance with Korean Standards on Auditing will always detect a material
misstatement when it exists. Misstatements can arise from fraud or error and are considered material if, individually or in the aggregate, they could
reasonably be expected to influence the economic decisions of users taken on the basis of these consolidated financial statements.
As part of an audit in accordance with Korean Standards on Auditing, we exercise professional judgment and maintain professional skepticism
throughout the audit. We also:
· Identify and assess the risks of material misstatement of the consolidated financial statements, whether due to fraud or error, design and perform
audit procedures responsive to those risks, and obtain audit evidence that is sufficient and appropriate to provide a basis for our opinion. The risk
of not detecting a material misstatement resulting from fraud is higher than for one resulting from error, as fraud may involve collusion, forgery,
intentional omissions, misrepresentations, or the override of internal control.
· Obtain an understanding of internal control relevant to the audit in order to design audit procedures that are appropriate in the circumstances, but
not for the purpose of expressing an opinion on the effectiveness of the entity’s internal control.
· Evaluate the appropriateness of accounting policies used and the reasonableness of accounting estimates and related disclosures made by
management.
· Conclude on the appropriateness of management’s use of the going concern basis of accounting and, based on the audit evidence obtained,
whether a material uncertainty exists related to events or conditions that may cast significant doubt on the Group’s ability to continue as a going
concern. If we conclude that a material uncertainty exists, we are required to draw attention in our auditor’s report to the related disclosures in the
consolidated financial statements or, if such disclosures are inadequate, to modify our opinion. Our conclusions are based on the audit evidence
obtained up to the date of our auditor’s report. However, future events or conditions may cause the Group to cease to continue as a going concern.
· Evaluate the overall presentation, structure and content of the consolidated financial statements, including the disclosures, and whether the
consolidated financial statements represent the underlying transactions and events in a manner that achieves fair presentation.
· Obtain sufficient appropriate audit evidence regarding the financial information of the entities or business activities within the Group to express an
opinion on the consolidated financial statements. We are responsible for the direction, supervision and performance of the Group audit. We remain
solely responsible for our audit opinion.
Financial Section 077

We communicate with those charged with governance regarding, among other matters, the planned scope and timing of the audit and significant
audit findings, including any significant deficiencies in internal control that we identify during our audit.
We also provide those charged with governance with a statement that we have complied with relevant ethical requirements regarding independence,
and to communicate with them all relationships and other matters that may reasonably be thought to bear on our independence, and where
applicable, related safeguards.
From the matters communicated with those charged with governance, we determine those matters that were of most significance in the audit of the
consolidated financial statements of the current period and are therefore the key audit matters. We describe these matters in our auditor’s report
unless law or regulation precludes public disclosure about the matter or when, in extremely rare circumstances, we determine that a matter should
not be communicated in our report because the adverse consequences of doing so would reasonably be expected to outweigh the public interest
benefits of such communication.
The engagement partner on the audit resulting in this independent auditor’s report is Yeob Yu, Certified Public Accountant.
Samil PricewaterhouseCoopers
Seoul, Korea
March 5, 2020
This report is effective as of March 5, 2020, the audit report date. Certain subsequent events or circumstances, which may occur between the audit report date and the time of reading this report, could have a material impact on the accompanying consolidated financial statements and notes thereto. Accordingly, the readers of the audit report should understand that there is a possibility that the above audit report may have to be revised to reflect the impact of such subsequent events or circumstances, if any.
KB Financial Group Annual Report 2019078

Consolidated Statements of Financial Position
KB Financial Group Inc. and Subsidiaries
December 31, 2019 and 2018
Assets
Cash and due from financial institutions
Financial assets at fair value through profit or loss
Derivative financial assets
Loans at amortized cost
Financial investments
Investments in associates and joint ventures
Property and equipment
Investment property
Intangible assets
Net defined benefit assets
Current income tax assets
Deferred income tax assets
Assets held for sale
Other assets
Total assets
Liabilities
Financial liabilities at fair value through profit or loss
Derivative financial liabilities
Deposits
Debts
Debentures
Provisions
Net defined benefit liabilities
Current income tax liabilities
Deferred income tax liabilities
Insurance contract liabilities
Other liabilities
Total liabilities
Equity
Share capital
Hybrid securities
Capital surplus
Accumulated other comprehensive income
Retained earnings
Treasury shares
Equity attributable to shareholders of the Parent Company
Non-controlling interests
Total equity
Total liabilities and equity
2019
₩ 20,837,878
53,549,086
3,190,673
339,684,059
71,782,606
598,240
5,067,377
2,827,988
2,737,813
946
19,095
3,597
23,151
18,215,608
₩ 518,538,117
₩ 15,368,153
3,007,341
305,592,771
37,818,860
50,935,583
527,929
253,989
432,431
777,793
34,966,683
29,737,259
479,418,792
2,090,558
399,205
17,122,777
348,021
19,709,545
(1,136,188)
38,533,918
585,407
39,119,325
₩ 518,538,117
Notes
4,6,7,8,39
4,6,8,12
4,6,9
4,6,10,11
4,6,8,12
13
14
14
15
24
16,33
17
4,6,18
4,6,19
4,6,9
4,6,20
4,6,21
4,6,22
23
24
16,33
37
4,6,25
26
26
26
26,35
26
26
26
2018
₩ 20,274,490
50,987,847
2,025,962
319,201,603
61,665,094
504,932
4,272,127
2,119,811
2,755,783
-
10,004
4,158
16,952
15,749,535
₩ 479,588,298
₩ 15,326,859
2,901,247
276,770,449
33,004,834
53,278,697
525,859
262,213
698,634
492,534
33,412,949
27,200,996
443,875,271
2,090,558
-
17,121,660
177,806
17,282,441
(968,549)
35,703,916
9,111
35,713,027
₩ 479,588,298
(In millions of Korean won)
The above consolidated statements of financial position should be read in conjunction with the accompanying notes.
Financial Section 079
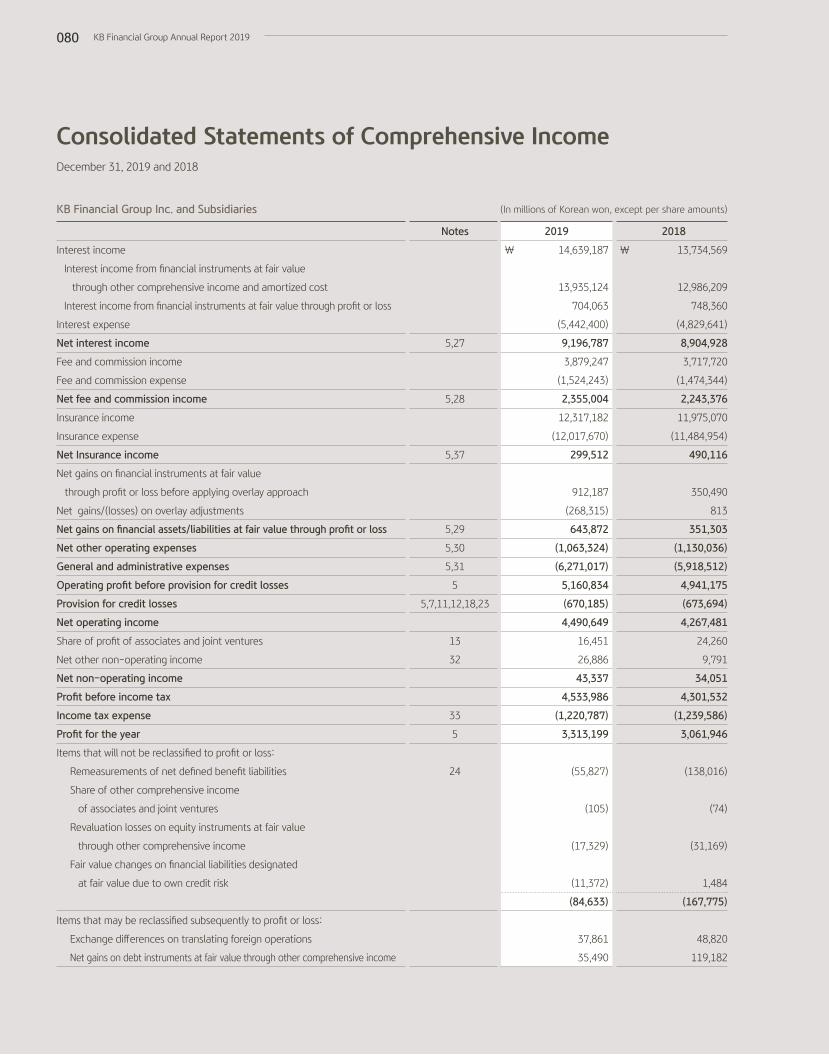
Consolidated Statements of Comprehensive Income
KB Financial Group Inc. and Subsidiaries
December 31, 2019 and 2018
(In millions of Korean won, except per share amounts)
Interest income
Interest income from financial instruments at fair value
through other comprehensive income and amortized cost
Interest income from financial instruments at fair value through profit or loss
Interest expense
Net interest income
Fee and commission income
Fee and commission expense
Net fee and commission income
Insurance income
Insurance expense
Net Insurance income
Net gains on financial instruments at fair value
through profit or loss before applying overlay approach
Net gains/(losses) on overlay adjustments
Net gains on financial assets/liabilities at fair value through profit or loss
Net other operating expenses
General and administrative expenses
Operating profit before provision for credit losses
Provision for credit losses
Net operating income
Share of profit of associates and joint ventures
Net other non-operating income
Net non-operating income
Profit before income tax
Income tax expense
Profit for the year
Items that will not be reclassified to profit or loss:
Remeasurements of net defined benefit liabilities
Share of other comprehensive income
of associates and joint ventures
Revaluation losses on equity instruments at fair value
through other comprehensive income
Fair value changes on financial liabilities designated
at fair value due to own credit risk
Items that may be reclassified subsequently to profit or loss:
Exchange differences on translating foreign operations
Net gains on debt instruments at fair value through other comprehensive income
Notes
5,27
5,28
5,37
5,29
5,30
5,31
5
5,7,11,12,18,23
13
32
33
5
24
2019
₩ 14,639,187
13,935,124
704,063
(5,442,400)
9,196,787
3,879,247
(1,524,243)
2,355,004
12,317,182
(12,017,670)
299,512
912,187
(268,315)
643,872
(1,063,324)
(6,271,017)
5,160,834
(670,185)
4,490,649
16,451
26,886
43,337
4,533,986
(1,220,787)
3,313,199
(55,827)
(105)
(17,329)
(11,372)
(84,633)
37,861
35,490
2018
₩ 13,734,569
12,986,209
748,360
(4,829,641)
8,904,928
3,717,720
(1,474,344)
2,243,376
11,975,070
(11,484,954)
490,116
350,490
813
351,303
(1,130,036)
(5,918,512)
4,941,175
(673,694)
4,267,481
24,260
9,791
34,051
4,301,532
(1,239,586)
3,061,946
(138,016)
(74)
(31,169)
1,484
(167,775)
48,820
119,182
KB Financial Group Annual Report 2019080

Shares of other comprehensive income of associates and joint ventures
Cash flow hedges
Losses on hedges of a net investment in a foreign operation
Other comprehensive income arising from separate account
Net gains on overlay adjustment
Other comprehensive income for the year, net of tax
Total comprehensive income for the year
Profit attributable to:
Shareholders of the Parent Company
Non-controlling interests
Total comprehensive income for the year attributable to:
Shareholders of the Parent Company
Non-controlling interests
Earnings per share
Basic earnings per share
Diluted earnings per share
Notes
37
5
36
2019
7,800
(33,182)
(8,900)
3,364
194,223
236,656
152,023
₩ 3,465,222
₩ 3,311,828
1,371
₩ 3,313,199
₩ 3,463,567
1,655
₩ 3,465,222
₩ 8,451
8,389
2018
(3,659)
(9,038)
(27,134)
28,709
413
157,293
(10,482)
₩ 3,051,464
₩ 3,061,191
755
₩ 3,061,946
₩ 3,050,805
659
₩ 3,051,464
₩ 7,721
7,676
(In millions of Korean won, except per share amounts)KB Financial Group Inc. and Subsidiaries
The above consolidated statements of comprehensive income should be read in conjunction with the accompanying notes.
Financial Section 081

Consolidated Statements of Changes in EquityYears Ended December 31, 2019 and 2018
Balance at January 1, 2018
The effect of changing of
accounting policy
Balance after reflecting the
effect of accounting policy
Comprehensive income
Profit for the year
Remeasurements of net defined
benefit liabilities
Exchange differences on translating
foreign operations
Net gains on financial instruments
at fair value through other
comprehensive income
Shares of other comprehensive income
of associates and joint ventures
Cash flow hedges
Losses on hedges of a net
investment in a foreign operation
Other comprehensive income
arising from separate account
Fair value changes on financial
liabilities designated at fair value
due to own credit risk
Net gains on overlay adjustment
Total comprehensive
income/(loss) for the year
Transactions with shareholders
Annual dividends paid to shareholders
of the Parent Company
Acquisition of treasury shares
Non-controlling interests changes in
business combination
Others
Total transactions with shareholders
Balance at December 31, 2018
Non-
controlling Interests
₩ 6,144
-
6,144
755
-
(96)
-
-
-
-
-
-
-
659
-
-
2,238
70
2,308
\ 9,111
Total Equity
\ 34,044,829
(421,200)
33,623,629
3,061,946
(138,016)
48,820
103,511
(3,733)
(9,038)
(27,134)
28,709
1,484
413
3,066,962
(766,728)
(212,576)
2,238
(498)
(977,564)
\ 35,713,027
Share Capital
₩ 2,090,558
-
2,090,558
-
-
-
-
-
-
-
-
-
-
-
-
-
-
-
-
₩ 2,090,558
Hybrid Securities
₩ -
-
-
-
-
-
-
-
-
-
-
-
-
-
-
-
-
-
-
₩ -
Capital Surplus
₩ 17,122,228
-
17,122,228
-
-
-
-
-
-
-
-
-
-
-
-
-
-
(568)
(568)
₩ 17,121,660
Retained Earnings
₩ 15,044,204
(71,724)
14,972,480
3,061,191
-
-
15,498
-
-
-
-
-
-
3,076,689
(766,728)
-
-
-
(766,728)
\ 17,282,441
Treasury Shares
₩ (755,973)
-
(755,973)
-
-
-
-
-
-
-
-
-
-
-
-
(212,576)
-
-
(212,576)
\ (968,549)
Accumulated Other
Comprehensive Income
₩ 537,668
(349,476)
188,192
-
(138,016)
48,916
88,013
(3,733)
(9,038)
(27,134)
28,709
1,484
413
(10,386)
-
-
-
-
-
\ 177,806
Equity attributable to shareholders of the Parent Company
(In millions of Korean won)KB Financial Group Inc. and Subsidiaries
KB Financial Group Annual Report 2019082

Balance at January 1, 2019
Comprehensive income
Profit for the year
Remeasurements of net defined
benefit liabilities
Exchange differences on translating
foreign operations
Net gains on financial instruments
at fair value through other
comprehensive income
Shares of other comprehensive income
of associates and joint ventures
Cash flow hedges
Losses on hedges of a net
investment in a foreign operation
Other comprehensive income
arising from separate account
Fair value changes on financial
liabilities designated at fair value
due to own credit risk
Net gains on overlay adjustment
Total comprehensive income for
the year
Transactions with shareholders
Annual dividends paid to shareholders
of the Parent Company
Issuance of hybrid securities
Dividends on hybrid securities
Acquisition and retirement of
treasury shares
Others
Total transactions with shareholders
Balance at December 31, 2019
Non-
controlling Interests
₩ 9,111
1,371
-
284
-
-
-
-
-
-
-
1,655
-
574,580
-
-
61
574,641
₩ 585,407
Total Equity
₩ 35,713,027
3,313,199
(55,827)
37,861
18,162
7,695
(33,182)
(8,900)
3,364
(11,372)
194,223
3,465,223
(759,736)
973,785
(6,513)
(267,639)
1,178
(58,925)
₩ 39,119,325
Share Capital
₩ 2,090,558
-
-
-
-
-
-
-
-
-
-
-
-
-
-
-
-
-
₩ 2,090,558
Hybrid Securities
\ -
-
-
-
-
-
-
-
-
-
-
-
-
399,205
-
-
-
399,205
\ 399,205
Capital Surplus
₩ 17,121,660
-
-
-
-
-
-
-
-
-
-
-
-
-
-
-
1,117
1,117
₩ 17,122,777
Retained Earnings
₩ 17,282,441
3,311,828
-
-
(18,475)
-
-
-
-
-
-
3,293,353
(759,736)
-
(6,513)
(100,000)
-
(866,249)
\ 19,709,545
Treasury Shares
₩ (968,549)
-
-
-
-
-
-
-
-
-
-
-
-
-
-
(167,639)
-
(167,639)
\ (1,136,188)
Accumulated Other
Comprehensive Income
\ 177,806
-
(55,827)
37,577
36,637
7,695
(33,182)
(8,900)
3,364
(11,372)
194,223
170,215
-
-
-
-
-
-
\ 348,021
Equity attributable to shareholders of the Parent Company
(In millions of Korean won)KB Financial Group Inc. and Subsidiaries
The above consolidated statements of changes in equity should be read in conjunction with the accompanying notes.
Financial Section 083
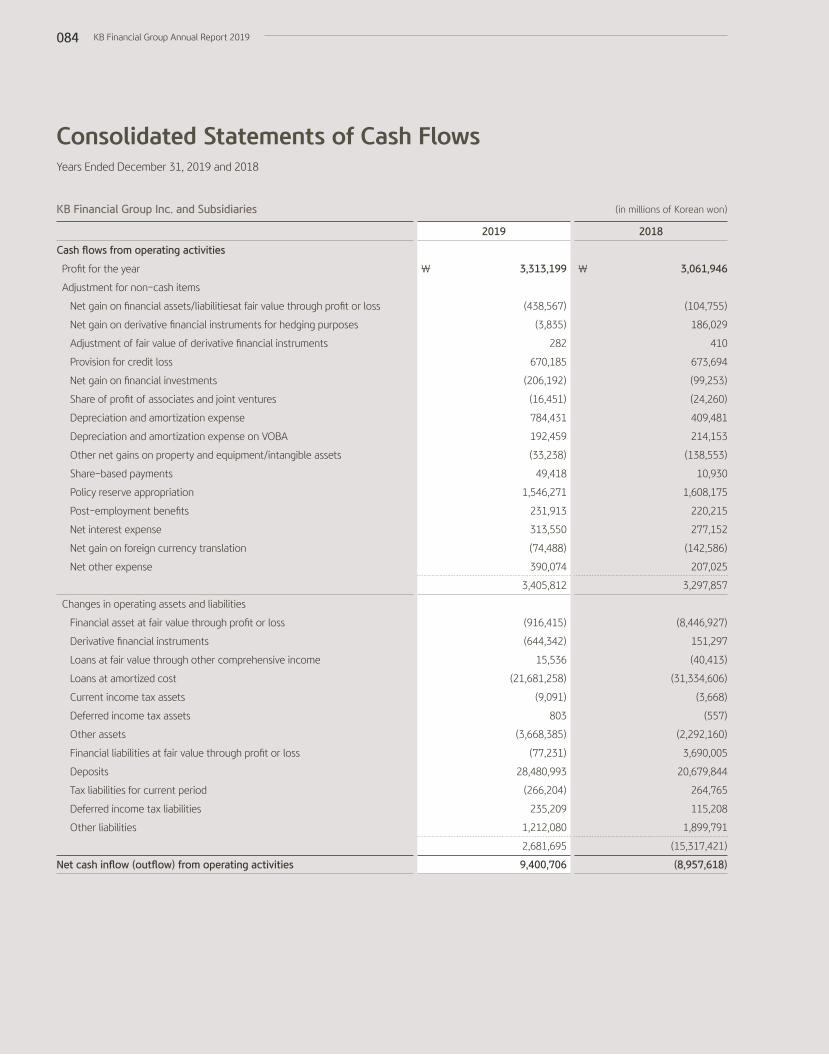
Cash flows from operating activities
Profit for the year
Adjustment for non-cash items
Net gain on financial assets/liabilitiesat fair value through profit or loss
Net gain on derivative financial instruments for hedging purposes
Adjustment of fair value of derivative financial instruments
Provision for credit loss
Net gain on financial investments
Share of profit of associates and joint ventures
Depreciation and amortization expense
Depreciation and amortization expense on VOBA
Other net gains on property and equipment/intangible assets
Share-based payments
Policy reserve appropriation
Post-employment benefits
Net interest expense
Net gain on foreign currency translation
Net other expense
Changes in operating assets and liabilities
Financial asset at fair value through profit or loss
Derivative financial instruments
Loans at fair value through other comprehensive income
Loans at amortized cost
Current income tax assets
Deferred income tax assets
Other assets
Financial liabilities at fair value through profit or loss
Deposits
Tax liabilities for current period
Deferred income tax liabilities
Other liabilities
Net cash inflow (outflow) from operating activities
2019
₩ 3,313,199
(438,567)
(3,835)
282
670,185
(206,192)
(16,451)
784,431
192,459
(33,238)
49,418
1,546,271
231,913
313,550
(74,488)
390,074
3,405,812
(916,415)
(644,342)
15,536
(21,681,258)
(9,091)
803
(3,668,385)
(77,231)
28,480,993
(266,204)
235,209
1,212,080
2,681,695
9,400,706
2018
₩ 3,061,946
(104,755)
186,029
410
673,694
(99,253)
(24,260)
409,481
214,153
(138,553)
10,930
1,608,175
220,215
277,152
(142,586)
207,025
3,297,857
(8,446,927)
151,297
(40,413)
(31,334,606)
(3,668)
(557)
(2,292,160)
3,690,005
20,679,844
264,765
115,208
1,899,791
(15,317,421)
(8,957,618)
Consolidated Statements of Cash FlowsYears Ended December 31, 2019 and 2018
(in millions of Korean won)KB Financial Group Inc. and Subsidiaries
KB Financial Group Annual Report 2019084

Cash flows from investing activities
Net cash flows from derivative financial instruments for hedging purposes
Disposal of financial asset at fair value through profit or loss
Acquisition of financial asset at fair value through profit or loss
Disposal of financial investments
Acquisition of financial investments
Disposal in investments in associates and joint ventures
Acquisition of investments in associates and joint ventures
Disposal of property and equipment
Acquisition of property and equipment
Disposal of investment property
Acquisition of investment property
Disposal of intangible assets
Acquisition of intangible assets
Net cash flows from the change in subsidiaries
Others
Net cash outflow from investing activities
Cash flows from financing activities
Net cash flows from derivative financial instruments for hedging purposes
Net increase in debts
Increase in debentures
Decrease in debentures
Increase (decrease) in other payables from trust accounts
Dividends paid
Dividends paid on hybrid securities
Acquisition of treasury shares
Issuance of hybrid securities
Increase or decrease of non-controlling interest
Principal elements of lease payments
Others
Net cash inflow from financing activities
Effect of exchange rate changes on cash and cash equivalents
Net decrease in cash and cash equivalents
Cash and cash equivalents at the beginning of the year
Cash and cash equivalents at the end of the year
2019
(206,680)
11,364,615
(12,359,886)
69,489,132
(79,083,472)
26,185
(92,200)
12,786
(608,736)
94,207
(806,088)
14,694
(333,557)
91,592
62,984
(12,334,424)
(28,631)
5,027,313
93,655,747
(96,145,669)
(68,648)
(759,736)
(6,513)
(274,317)
399,205
574,580
(229,750)
134,027
2,277,608
137,019
(519,091)
6,642,816
\ 6,123,725
2018
42,305
9,582,940
(8,707,420)
60,773,660
(64,729,380)
34,717
(187,077)
2,272
(452,270)
140,969
(1,288,125)
10,706
(126,163)
188,140
234,440
(4,480,286)
15,044
4,216,014
143,603,589
(135,180,630)
267,077
(766,728)
-
(224,700)
-
-
-
(185,894)
11,743,772
(67,950)
(1,762,082)
8,404,898
\ 6,642,816
(in millions of Korean won)KB Financial Group Inc. and Subsidiaries
The above consolidated statements of cash flows should be read in conjunction with the accompanying notes.
Financial Section 085

Notes to the Consolidated Financial StatementsDecember 31, 2019 and 2018
1. The Parent CompanyKB Financial Group Inc. (the “Parent Company”) was incorporated on September 29, 2008, under the Financial Holding Companies Act of Korea. KB
Financial Group Inc. and its subsidiaries (the “Group”) derive substantially all of their revenue and income from providing a broad range of banking and
related financial services to consumers and corporations primarily in Korea and in selected international markets. The Parent Company’s principal business
includes ownership and management of subsidiaries and associated companies that are engaged in financial services or activities. In 2011, Kookmin Bank
spun off its credit card business segment and established a new separate credit card company, KB Kookmin Card Co., Ltd., and KB Investment & Securities
Co., Ltd. merged with KB Futures Co., Ltd. The Group established KB Savings Bank Co., Ltd. in January 2012, acquired Yehansoul Savings Bank Co., Ltd. in
September 2013, and KB Savings Bank Co., Ltd. merged with Yehansoul Savings Bank Co., Ltd. in January 2014. In March 2014, the Group acquired Woori
Financial Co., Ltd. and changed the name to KB Capital Co., Ltd. Meanwhile, the Group included LIG Insurance Co., Ltd. as an associate and changed the
name to KB Insurance Co., Ltd. in June 2015. Also, the Group included Hyundai Securities Co., Ltd. as an associate in June 2016 and included as a subsidiary
in October 2016 by comprehensive exchange of shares. Hyundai Securities Co., Ltd. merged with KB Investment & Securities Co., Ltd. in December 2016 and
changed the name to KB Securities Co., Ltd. in January 2017. KB Insurance Co., Ltd. became one of the subsidiaries through a tender offer in May 2017.
The Parent Company’s share capital as of December 31, 2019, is ₩ 2,090,558 million. The Parent Company has been listed on the Korea Exchange (“KRX”)
since October 10, 2008, and on the New York Stock Exchange (“NYSE”) for its American Depositary Shares (“ADS”) since September 29, 2008. Number of
shares authorized in its Articles of Incorporation is 1,000 million.
2. Basis of Preparation2.1 Application of Korean IFRS
The Group maintains its accounting records in Korean won and prepares statutory financial statements in the Korean language (“Hangeul”) in accordance
with International Financial Reporting Standards as adopted by the Republic of Korea (“Korean IFRS”). The accompanying consolidated financial statements
have been condensed, restructured and translated into English from the Korean language financial statements.
Certain information attached to the Korean language financial statements, but not required for a fair presentation of the Group's financial position, financial
performance or cash flows, is not presented in the accompanying consolidated financial statements.
The consolidated financial statements of the Group have been prepared in accordance with Korean IFRS. These are the standards, subsequent amendments
and related interpretations issued by the International Accounting Standards Board ("IASB") that have been adopted by the Republic of Korea.
The preparation of consolidated financial statements requires the use of certain critical accounting estimates. Management also needs to exercise
judgment in applying the Group’s accounting policies. The areas involving a higher degree of judgment or complexity, or areas where assumptions and
estimates are significant to the consolidated financial statements are disclosed in Note 2.4.
The Group recognized an amount of services to customers as expenses in previous consolidated Statements of Comprehensive Income but recognized
as the reduction of revenue in accordance with Korean IFRS 1115 Revenue from Contracts with Customers. Accordingly, certain accounts reported in
the consolidated statement of comprehensive income for the year ended December 31, 2018 have been reclassified to facilitate the comparison with the
consolidated statement of comprehensive income for the year ended December 31. 2019. The reclassification of the accounts does not have any effect on
the net asset value or profit for the period of the Group as reported in the year ended December 31, 2018.
2.1.1 New and amended standards and interpretations adopted by the Group
The Group has applied the following standards and amendments for the first time for their annual reporting period commencing January 1, 2019.
-Enactment of Korean IFRS 1116 Leases
Korean IFRS 1116 Leases, the new standard, replaces Korean IFRS 1017 Leases. Under the new standard, with implementation of a single lease model,
lessee is required to recognize assets and liabilities for all lease which lease term is over 12 months and underlying assets are not low value assets. A lessee
is required to recognize a right-of-use asset and a lease liability representing its obligation to make lease payments.
With implementation of Korean IFRS 1116 Lease, the Group has changed accounting policy. The Group has adopted Korean IFRS 1116 retrospectively, as
KB Financial Group Annual Report 2019086

permitted under the specific transitional provisions in the standard and recognized the cumulative impact of initially applying the standard as at January 1, 2019, the date of initial application. The Group has not restated comparatives for the 2018 reporting period. The impact of the adoption of the leasing standard and the new accounting policies are disclosed in Note 45.
- Amendments to Korean IFRS 1109 Financial Instruments
The narrow-scope amendments made to Korean IFRS 1109 Financial Instruments enable entities to measure certain prepayable financial assets with negative compensation at amortized cost. When a modification of a financial liability measured at amortized cost that does not result in the derecognition, a modification gain or loss shall be recognized in profit or loss. The amendment does not have a significant impact on the financial statements.
- Amendments to Korean IFRS 1019 Employee Benefits
The amendments require that an entity shall calculate current service cost and net interest for the remainder of the reporting period after a plan amendment, curtailment or settlement based on updated actuarial assumptions from the date of the change. The amendments also require that a reduction in a surplus must be recognized in profit or loss even if that surplus was not previously recognized because of the impact of the asset ceiling. The amendment does not have a significant impact on the financial statements.
- Amendments to Korean IFRS 1028 Investments in Associates and Joint Ventures
The amendments clarify that an entity shall apply Korean IFRS 1109 to financial instruments in an associate or joint venture to which the equity method is not applied. These include long-term interests that, in substance, form part of the entity’s net investment in an associate or joint venture. The amendment does not have a significant impact on the financial statements.
- Enactment of Interpretation of Korean IFRS 2123 Uncertainty over Income Tax Treatments
The enactment clarifies the accounting for uncertainties in income taxes in the event that the decision of taxation authorities or courts can change tax treatment. The enactment presents calculating methods of disclosure amount based on the possibility of future recognition of the income tax treatment and requires disclosure of the uncertainty of the amount. The enactment does not have a significant impact on the financial statements.
- Amendments to Korean IFRS 1109 Financial Instruments , and 1107 Financial Instruments: Disclosure
These amendments provide exceptions applying hedge accounting even though interest rate benchmark reform gives rise to uncertainties. In the hedging relationship, an entity shall assume that the interest rate benchmark on which the hedge cash flows are based is not altered as a result of interest rate benchmark reform when determining whether a forecast transaction is highly probable and prospectively assessing hedging effectiveness. For a hedge of a non-contractually specified benchmark component of interest rate risk, an entity shall apply the requirement that the risk component shall be separately identifiable only at the inception of the hedging relationship. The application of this exception is ceased either when the uncertainty arising from interest rate benchmark reform is no longer present with respect to the timing and the amount of the interest rate benchmark-based cash flows of the hedge item, or when the hedging relationship that the hedge item is part of is discontinued. These amendments will be effective for annual periods beginning on or after January 1, 2020. However, the Group early adopted the amendments as it is permitted. The significant benchmark interest rate indicator for the hedge relationship is LIBOR, and the hedge accounting in Note 9 directly affected by these amendments.
- Annual Improvements to Korean IFRS 1103 Business Combination
The amendments clarify that when a party to a joint arrangement obtains control of a business that is a joint operation and had rights to the assets and obligations for the liabilities relating to that joint operation immediately before the acquisition date, the transaction is a business combination achieved in stages. In such cases, the acquirer shall remeasure its entire previously held interest in the joint operation. The amendment does not have a significant impact on the financial statements.
- Annual Improvements to Korean IFRS 1111 Joint Agreements
The amendments clarify that when a party that participates in, but does not have joint control of, a joint operation might obtain joint control of the joint operation in which the activity of the joint operation constitutes a business. In such cases, previously held interests in the joint operation are not remeasured. The amendment does not have a significant impact on the financial statements.
- Annual Improvements to Paragraph 57A of Korean IFRS 1012 Income Tax
The amendment is applied to all the income tax consequences of dividends and requires an entity to recognize the income tax consequences of dividends in profit or loss, other comprehensive income or equity according to where the entity originally recognized those past transactions or events. The amendment does not have a significant impact on the financial statements.
- Annual Improvements to Korean IFRS 1023 Borrowing Cost
The amendments clarify that if a specific borrowing remains outstanding after the related qualifying asset is ready for its intended use (or sale), it becomes part of general borrowings. The amendment does not have a significant impact on the financial statements.
Financial Section 087

2.1.2 New and amended standards and interpretations not yet adopted by the Group
Certain new accounting standards and interpretations that have been published but are not mandatory for the reporting period commencing January 1,
2019 and have not been early adopted by the Group are set out below.
- Amendments to Korean IFRS 1001 Presentation of Financial Statements and Korean IFRS 1008 Accounting policies, changes in accounting estimates and
errors – Definition of Material
The amendments clarify the explanation of the definition of material and amended Korean IFRS 1001 and Korean IFRS 1008 in accordance with the clarified
definitions. Materiality is assessed by reference to omission or misstatement of material information as well as effects of immaterial information, and to the
nature of the users when determining the information to be disclosed by the Group. These amendments should be applied for annual periods beginning on
or after January 1, 2020, and earlier application of permitted. The Group does not expect that these amendments have a significant impact on the financial
statements.
- Amendments to Korean IFRS 1103 Business Combination – Definition of a Business
To consider the integration of the required activities and assets as a business, the amended definition of a business requires an acquisition to include an
input and a substantive process that together significantly contribute to the ability to create outputs and excludes economic benefits from the lower costs.
An entity can apply a concentration test, an optional test, where substantially all of the fair value of gross assets acquired is concentrated in a single asset
or a group of similar assets, the assets acquired would not represent a business. These amendments should be applied for annual periods beginning on or
after January 1, 2020, and earlier application of permitted. The Group does not expect that these amendments have a significant impact on the financial
statements.
- IFRS Interpretation Committee’s agenda decisions - Lease Term
On December 16, 2019, the IFRS Interpretations Committee announced an interpretation of the “lease term and useful life of leasehold improvements”.
This interpretation deals with how to determine the lease term of a cancellable lease or a renewable lease and whether the useful life of non-removable
leasehold improvements is limited by the relevant lease term. According to this interpretation, the Group should identify factors to consider the broader
economic penalty, reflect identified factors to accounting policies, and calculate lease term again based on accounting policy.
However, due to the large number of lease contracts held by the Group and varying terms of the contract, the Group determined that sufficient time would
be required to set up items to be included in the review of extensive economic penalty and to establish procedures for collecting and analyzing necessary
information. Therefore, the effect of the changes in accounting policy for the lease term is not reflected in the consolidated financial statements for the
current reporting period.
If the accounting policy for the lease term is changed in the annual periods beginning on or after January 1, 2020, the amount of the related right-of-use
assets and lease liabilities may increase, and the consolidated financial statements may need to be retroactively restated to reflect this effect.
2.2 Measurement Basis
The consolidated financial statements have been prepared under the historical cost convention unless otherwise specified.
2.3 Functional and Presentation Currency
Items included in the financial statements of each entity of the Group are measured using the currency of the primary economic environment in which the
entity operates (“the functional currency”). The consolidated financial statements are presented in Korean won, which is the Parent Company’s functional
and presentation currency.
2.4 Critical Accounting Estimates
The preparation of consolidated financial statements requires the application of accounting policies, certain critical accounting estimates and assumptions
that may have a significant impact on the assets (liabilities) and incomes (expenses). Management’s estimates of outcomes may differ from actual outcomes
if management’s estimates and assumptions based on management’s best judgment at the reporting date are different from the actual environment.
Estimates and assumptions are continually evaluated and any change in an accounting estimate is recognized prospectively by including it in profit or loss
in the period of the change, if the change affects that period only. Alternatively if the change in accounting estimate affects both the period of change and
future periods, that change is recognized in the profit or loss of all those periods.
Uncertainty in estimates and assumptions with significant risk that may result in material adjustment to the consolidated financial statements are as follows:
KB Financial Group Annual Report 2019088

2.4.1 Income taxes
The Group is operating in numerous countries and the income generated from these operations is subject to income taxes based on tax laws and
interpretations of tax authorities in numerous jurisdictions. There are many transactions and calculations for which the ultimate tax determination is
uncertain.
If certain portion of the taxable income is not used for investments, increase in wages, and others in accordance with the Tax System for Promotion of
Investment and Collaborative Cooperation (Recirculation of Corporate Income), the Group is liable to pay additional income tax calculated based on the
tax laws. The new tax system is effective for three years from 2018. Accordingly, the measurement of current and deferred income tax is affected by the
tax effects from the new system. As the Group’s income tax is dependent on the investments, increase in wages, and others, there exists uncertainty with
regard to measuring the final tax effects.
2.4.2 Fair value of financial instruments
The fair value of financial instruments where no active market exists or where quoted prices are not otherwise available is determined by using valuation
techniques. Financial instruments, which are not actively traded in the market and those with less transparent market prices, will have less objective fair
values and require broad judgment on liquidity, concentration, uncertainty in market factors and assumptions in price determination and other risks.
As described in the significant accounting policies in Note 3.3, ‘Recognition and Measurement of Financial Instruments’, diverse valuation techniques are
used to determine the fair value of financial instruments, from generally accepted market valuation models to internally developed valuation models that
incorporate various types of assumptions and variables.
2.4.3 Provisions for credit losses
The Group tests impairment and recognizes allowances for losses on financial assets classified at amortized cost, debt instruments measured at fair value
through other comprehensive income and lease receivables through impairment testing and recognizes provisions for guarantees, and unused loan
commitments. Accuracy of provisions for credit losses is dependent upon estimation of expected cash flows of the borrower for individually assessed
allowances of loans, and upon assumptions and methodology used for collectively assessed allowances for groups of loans, guarantees and unused loan
commitments.
2.4.4 Net defined benefit liability
The present value of net defined benefit liability depends on a number of factors that are determined on an actuarial basis using a number of assumptions
(Note 24).
2.4.5 Impairment of goodwill
The recoverable amounts of cash-generating units have been determined based on value-in-use calculations to test whether goodwill has suffered any
impairment (Note 15).
3. Significant Accounting PoliciesThe significant accounting policies and calculation methods applied in the preparation of these consolidated financial statements have been consistently
applied to all periods presented, except for the impact of changes due to enactment of new standards, amendments and interpretations disclosed in Note 2.1
and the following paragraph.
3.1 Consolidation
3.1.1 Subsidiaries
Subsidiaries are companies that are controlled by the Group. The Group controls an investee when it is exposed, or has rights, to variable returns from
its involvement with the investee and has the ability to affect those returns through its power over the investee. The existence and effects of potential
voting rights that are currently exercisable or convertible are considered when assessing whether the Group controls another entity. Subsidiaries are fully
consolidated from the date when control is transferred to the Group and de-consolidated from the date when control is lost.
If a subsidiary uses accounting policies other than those adopted in the consolidated financial statements for like transactions and events in similar
circumstances, appropriate adjustments are made to make the subsidiary’s accounting policies conform to those of the Group when the subsidiary’s
financial statements are used by the Group in preparing the consolidated financial statements.
Financial Section 089

Profit or loss and each component of other comprehensive income are attributed to the owners of the Parent Company and to the non-controlling
interests, if any. Total comprehensive income is attributed to the owners of the Parent Company and to the non-controlling interests even if this results in
the non-controlling interests having a negative balance.
Transactions with non-controlling interests that do not result in loss of control are accounted for as equity transactions; that is, as transactions with the
owners exercising their entitlement. The difference between fair value of any consideration paid and the relevant share acquired of the carrying value of
net assets of the subsidiary is recorded in equity. Gains or losses on disposals to non-controlling interests are also recorded in equity.
When the Group ceases to have control, any retained interest in the entity is re-measured to its fair value at the date when control is lost, with the change
in carrying amount recognized in profit or loss. The fair value is the initial carrying amount for the purposes of subsequently accounting for the retained
interest as an associate, joint venture or financial asset. In addition, any amounts previously recognized in other comprehensive income in respect of that
entity are accounted for as if the Group had directly disposed of the related assets or liabilities. Amounts previously recognized in other comprehensive
income are reclassified to profit or loss.
The Group applies the acquisition method to account for business combinations. The consideration transferred is measured at the fair values of the assets
transferred, and identifiable assets acquired and liabilities and contingent liabilities assumed in a business combination are initially measured at their fair
values at the acquisition date. The Group recognizes any non-controlling interest in the acquiree on an acquisition-by-acquisition basis in the event of
liquidation, either at fair value or at the non-controlling interest’s proportionate share of the recognized amounts of acquiree’s identifiable net assets.
Acquisition-related costs are expensed as incurred.
In a business combination achieved in stages, the Group shall remeasure its previously held equity interest in the acquiree at its acquisition-date fair value
and recognize the resulting gain or loss, if any, in profit or loss or other comprehensive income, as appropriate. In prior reporting periods, the Group may
have recognized changes in the value of its equity interest in the acquiree in other comprehensive income. If so, the amount that was recognized in other
comprehensive income shall be reclassified as profit or loss, or retained earnings, on the same basis as would be required if the Group had disposed directly
of the previously held equity interest.
The Group applies the book amount method to account for business combinations of entities under a common control. Identifiable assets acquired and
liabilities assumed in a business combination are measured at their book amounts on the consolidated financial statements of the Group. In addition, the
difference between the sum of consolidated book amounts of the assets and liabilities transferred and accumulated other comprehensive income; and the
consideration paid is recognized as capital surplus.
3.1.2 Associates and joint ventures
Associates are entities over which the Group has significant influence in the financial and operating policy decisions. Generally, if the Group holds 20% to
50% of the voting power of the investee, it is presumed that the Group has significant influence, it is presumed that the Group has significant influence.
Joint ventures are investments in which the Group jointly controls over economic activities pursuant to contractual arrangement. Decisions on financial
and operating policies require unanimous consent of the parties sharing control.
Under the equity method, investments in associates and joint ventures are initially recognized at cost and the carrying amount is increased or decreased
to recognize the Group’s share of the profit or loss of the investee and changes in the investee’s equity after the date of acquisition. The Group’s share
of the profit or loss of the investee is recognized in the Group’s profit or loss. Distributions received from an investee reduce the carrying amount of the
investment. Profit and loss resulting from ‘upstream’ and ‘downstream’ transactions between the Group and associates are eliminated to the extent at the
Group’s interest in associates. Unrealized losses are eliminated in the same way as unrealized gains except that they are only eliminated to the extent that
there is no evidence of impairment.
If associates and joint ventures uses accounting policies other than those of the Group for like transactions and events in similar circumstances, if
necessary, adjustments shall be made to make the associate’s accounting policies conform to those of the Group when the associate’s financial statements
are used by the entity in applying the equity method.
If the Group’s share of losses of associates and joint ventures equals or exceeds its interest in the associate (including long-term interests that, in substance,
form part of the Group’s net investment in the associate), the Group discontinues recognizing its share of further losses. After the Group’s interest is
reduced to zero, additional losses are provided for, and a liability is recognized, only to the extent that the Group has incurred legal or constructive
obligations or made payments on behalf of the associate.
The Group determines at each reporting period whether there is any objective evidence that the investments in the associates are impaired. If this is the
case, the Group calculates the amount of impairment as the difference between the recoverable amount of the associates and its carrying value and
recognizes the amount as ‘non-operating income (expense)’ in the statement of comprehensive income.
KB Financial Group Annual Report 2019090

3.1.3 Structured entity
A structured entity is an entity that has been designed so that voting or similar rights are not the dominant factor in deciding who controls the entity. When
the Group decides whether it has power to the structured entities in which the Group has interests, it considers factors such as the purpose, the form, the practical
ability to direct the relevant activities of a structured entity, the nature of its relationship with a structured entity and the amount of exposure to variable returns.
3.1.4 Trusts and funds
The Group provides management services for trust assets, collective investment and other funds. These trusts and funds are not consolidated in the
Group’s consolidated financial statements, except for trusts and funds over which the Group has control.
3.1.5 Intra-group transactions
All intra-group balances and transactions, and any unrealized gains arising on intra-group transactions, are eliminated in preparing the consolidated
financial statements. Unrealized losses are eliminated in the same way as unrealized gains except that they are only eliminated to the extent that there is
no evidence of impairment.
3.2 Foreign Currency
3.2.1 Foreign currency transactions
A foreign currency transaction is recorded, on initial recognition in the functional currency, by applying the spot exchange rate between the functional
currency and the foreign currency at the date of the transaction. At the end of each reporting period, foreign currency monetary items are translated
using the closing rate which is the spot exchange rate at the end of the reporting period. Non-monetary items that are measured at fair value in a foreign
currency are translated using the spot exchange rates at the date when the fair value was determined and non-monetary items that are measured in terms
of historical cost in a foreign currency are translated using the spot exchange rate at the date of the transaction.
Exchange differences arising on the settlement of monetary items or on translating monetary items at rates different from those at which they were
translated on initial recognition during the period or in previous consolidated financial statements are recognized in profit or loss in the period in which they
arise, except for exchange differences arising on net investments in a foreign operation and financial liability designated as a hedge of the net investment.
When gains or losses on a non-monetary item are recognized in other comprehensive income, any exchange component of those gains or losses are
also recognized in other comprehensive income. Conversely, when gains or losses on a non-monetary item are recognized in profit or loss, any exchange
component of those gains or losses are also recognized in profit or loss.
3.2.2 Foreign operations
The financial performance and financial position of all foreign operations, whose functional currencies differ from the Group’s presentation currency, are
translated into the Group’s presentation currency using the following procedures.
Assets and liabilities for each statement of financial position presented (including comparatives) are translated at the closing rate at the end of the
reporting period, unless the functional currency of the foreign operation is in hyper-inflationary economy. Income and expenses in the statement of
comprehensive income presented are translated using the average exchange rates for the period. All resulting exchange differences are recognized in other
comprehensive income.
Any goodwill arising from the acquisition of a foreign operation and any fair value adjustments to the carrying amounts of assets and liabilities arising from
the acquisition of that foreign operation are treated as assets and liabilities of the foreign operation. Thus, they are expressed in the functional currency of
the foreign operation and are translated into the presentation currency at the closing rate.
On the disposal of a foreign operation, the cumulative amount of the exchange differences relating to that foreign operation, recognized in other
comprehensive income and accumulated in the separate component of equity, is reclassified from equity to profit or loss (as a reclassification adjustment)
when the gains or losses on disposal are recognized. On the partial disposal of a subsidiary that includes a foreign operation, the Group redistributes the
proportionate share of the cumulative amount of the exchange differences recognized in other comprehensive income to the non-controlling interests
in that foreign operation. In any other partial disposal of a foreign operation, the Group reclassifies to profit or loss only the proportionate share of the
cumulative amount of the exchange differences recognized in other comprehensive income.
3.2.3 Net investment in a foreign operation
If the settlement of a monetary item receivable from or payable to a foreign operation is neither planned nor likely to occur in the foreseeable future, then
foreign currency difference arising on the item which in substance is considered to form part of the net investment in the foreign operation, are recognized
in the other comprehensive income and shall be reclassified to profit or loss on disposal of the investment.
Financial Section 091

3.3 Recognition and Measurement of Financial Instruments
3.3.1 Initial recognition
The Group recognizes a financial asset or a financial liability in its statement of financial position when the Group becomes a party to the contractual
provisions of the instrument. A regular way purchase or sale of financial assets (a purchase or sale of a financial asset under a contract whose terms require
delivery of the financial instruments within the time frame established generally by market regulation or practice) is recognized and derecognized using
trade date accounting.
The Group classifies financial assets as financial assets at fair value through profit or loss, financial assets at fair value through other comprehensive income,
or financial assets at amortized cost. The Group classifies financial liabilities as financial liabilities at fair value through profit or loss, or other financial liabilities.
The classification depends on the nature and holding purpose of the financial instrument at initial recognition in the consolidated financial statements.
At initial recognition, a financial asset or financial liability is measured at its fair value plus or minus, in the case of a financial asset or financial liability not at
fair value through profit or loss, transaction costs that are directly attributable to the acquisition or issue of the financial asset or financial liability.
The fair value is defined as the amount for which an asset could be exchanged, or a liability settled, between knowledgeable, willing parties in an arm’s
length transaction. The fair value of a financial instrument on initial recognition is normally the transaction price (that is, the fair value of the consideration
given or received) in an arm’s length transaction.
3.3.2 Subsequent measurement
After initial recognition, financial instruments are measured at amortized cost or fair value based on classification at initial recognition.
Amortized cost
The amortized cost of a financial asset or financial liability is the amount at which the financial asset or financial liability is measured on initial recognition:
- minus the principal repayments
- plus or minus the cumulative amortization using the effective interest method of any difference between that initial amount and the maturity amount
- or any reduction (directly or through the use of an allowance account) due to impairment or uncollectibility
Fair value
Fair values, which the Group primarily uses for the measurement of financial instruments, are the published price quotations based on market prices or
dealer price quotations of financial instruments traded in an active market where available. These are the best evidence of fair value. A financial instrument
is regarded as quoted in an active market if quoted prices are readily and regularly available from an exchange, dealer, broker, an entity in the same industry,
pricing service or regulatory agency, and those prices represent actual and regularly occurring market transactions on an arm’s length basis.
If the market for a financial instrument is not active, fair value is determined either by using a valuation technique or independent third-party valuation
service. Valuation techniques include using recent arm’s length market transactions between knowledgeable, willing parties, if available, referencing to the
current fair value of another instrument that is substantially the same, discounted cash flow analysis and option pricing models.
The Group uses valuation models that are commonly used by market participants and customized for the Group to determine fair values of common over-
the-counter (OTC) derivatives such as options, interest rate swaps and currency swaps which are based on the inputs observable in markets. For more
complex instruments, the Group uses internally developed models, which are usually based on valuation methods and techniques generally used within the
industry, or a value measured by an independent external valuation institution as the fair values if all or some of the inputs to the valuation models are not
market observable and therefore it is necessary to estimate fair value based on certain assumptions.
In addition, the fair value information recognized in the statement of financial position is classified into the following fair value hierarchy, reflecting the
significance of the input variables used in the fair value measurement.
Level 1 : quoted prices (unadjusted) in active markets for identical assets or liabilities that the entity can access at the measurement date
Level 2 : inputs other than quoted prices included within Level 1 that are observable for the asset or liability, either directly or indirectly.
Level 3 : unobservable inputs for the asset or liability.
The level in the fair value hierarchy within which the fair value measurement is categorized in its entirety shall be determined on the basis of the lowest
level input that is significant to the fair value measurement in its entirety. For this purpose, the significance of an input is assessed against the fair value
measurement in its entirety.
If a fair value measurement uses observable inputs that require significant adjustment based on unobservable inputs, that measurement is a Level 3
measurement.
KB Financial Group Annual Report 2019092

If the valuation technique does not reflect all factors which market participants would consider in setting a price, the fair value is adjusted to reflect those
factors. Those factors include counterparty credit risk, bid-ask spread, liquidity risk and others.
The chosen valuation technique makes maximum use of market inputs and relies as little as possible on entity-specific inputs. It incorporates all factors that
market participants would consider in setting a price and is consistent with economic methodologies applied for pricing financial instruments. Periodically,
the Group calibrates the valuation technique and tests its validity using prices of observable current market transactions of the same instrument or based
on other relevant observable market data.
3.3.3 Derecognition
Derecognition is the removal of a previously recognized financial asset or financial liability from the statement of financial position. The Group derecognizes
a financial asset or a financial liability when, and only when:
Derecognition of financial assets
Financial assets are derecognized when the contractual rights to the cash flows from the financial assets expire or the financial assets have been
transferred and substantially all the risks and rewards of ownership of the financial assets are also transferred, or all the risks and rewards of ownership of
the financial assets are neither substantially transferred nor retained and the Group has not retained control. If the Group neither transfers nor disposes
of substantially all the risks and rewards of ownership of the financial assets, the Group continues to recognize the financial asset to the extent of its
continuing involvement in the financial asset.
If the Group transfers the contractual rights to receive the cash flows of the financial asset, but retains substantially all the risks and rewards of ownership
of the financial asset, the Group continues to recognize the transferred asset in its entirety and recognize a financial liability for the consideration received.
The Group writes off financial assets in its entirety or to a portion thereof when the principal and interest on the principal amount outstanding are
determined to be no longer recoverable. In general, the Group considers write-off if significant financial difficulties of the debtor, or delinquency in
interest or principal payments is indicated. The write-off decision is made in accordance with internal regulations and may require approval from external
institution, if necessary. After the write-off, the Group can collect the written-off loans continuously according to the internal policy. Recovered amounts
of financial assets previously written-off are recognized at profit or loss.
Derecognition of financial liabilities
Financial liabilities are derecognized from the statement of financial position when the obligation specified in the contract is discharged, cancelled or
expires.
3.3.4 Offsetting
Financial assets and liabilities are offset and the net amount reported in the consolidated statement of financial position where there is a legally enforceable
right to offset the recognized amounts and there is an intention to settle on a net basis or realize the assets and settle the liability simultaneously. The
legally enforceable right must not be contingent on future events and must be enforceable in the normal course of business and in the event of default,
insolvency or bankruptcy of the Group or the counterparty.
3.4 Cash and Due from Financial Institutions
Cash and due from financial institutions include cash on hand, foreign currency, and short-term, highly liquid investments that are readily convertible to
known amounts of cash and which are subject to an insignificant risk of changes in value, and due from financial institutions. Cash and due from financial
institutions are measured at amortized cost.
3.5 Non-derivative Financial Assets
3.5.1 Financial assets at fair value through profit or loss
Financial assets classified as held for trading, financial assets designated by the Group as at fair value through profit or loss upon initial recognition, and financial
assets that are required to be mandatorily measured at fair value through profit or loss are classified as financial assets at fair value through profit or loss.
The Group may designate certain financial assets upon initial recognition as at fair value through profit or loss when the designation eliminates or
significantly reduces a measurement or recognition inconsistency (sometimes referred to as ‘an accounting mismatch’) that would otherwise arise from
measuring assets or liabilities or recognizing the gains and losses on them on different bases.
After initial recognition, a financial asset at fair value through profit or loss is measured at fair value and gains or losses arising from a change in the fair
value are recognized in profit or loss. Interest income and dividend income from financial assets at fair value through profit or loss are also recognized in
the statement of comprehensive income.
Financial Section 093

3.5.2 Financial assets at fair value through other comprehensive income
The Group classifies below financial assets as financial assets at fair value through other comprehensive income;
- debt instruments that are a business model whose objective is achieved by both collecting contractual cash flows and selling financial assets, and
consistent with representing solely payments of principal and interest on the principal amount outstanding or;
- equity instruments, not held for trading with the objective of generating a profit from short-term fluctuations in price or dealer’s margin, designated as
financial assets at fair value through other comprehensive income
After initial recognition, a financial asset at fair value through other comprehensive income is measured at fair value. Gain and loss from changes in fair
value, other than dividend income and interest income amortized using effective interest method and exchange differences arising on monetary items
which are recognized directly in income as interest income or expense, are recognized as other comprehensive income in equity.
At disposal of financial assets at fair value through other comprehensive income, cumulative gain or loss is recognized as profit or loss for the reporting
period. However, cumulative gain or loss of equity instrument designated as fair value through other comprehensive income are not recycled to profit or
loss at disposal.
Financial assets at fair value through other comprehensive income denominated in foreign currencies are translated at the closing rate. Exchange
differences resulting from changes in amortized cost are recognized in profit or loss, and other changes are recognized as equity.
3.5.3 Financial assets measured at amortized cost
A financial asset, which are held within the business model whose objective is to hold assets in order to collect contractual cash flows and consistent with
representing solely payments of principal and interest on the principal amount outstanding, are classified as a financial asset at amortized cost.
Financial assets at amortized cost are subsequently measured at amortized cost using the effective interest method after initial recognition and interest
income is recognized using the effective interest method.
3.6 Expected Credit Loss of Financial Assets (Debt Instruments)
The Group measures expected credit loss and recognizes loss allowance at the end of the reporting period for financial assets measured at amortized cost
and fair value through other comprehensive income with the exception of financial asset measured at fair value through profit or loss.
Expected credit losses are a probability-weighted estimate of credit losses (i.e. the present value of all cash shortfalls) over the expected life of the financial
instrument. The Group measures expected credit losses by reflecting reasonable and supportable information that is reasonably available at the reporting
date without undue cost or effort, including information about past events, current conditions and forecasts of future economic conditions.
The Group uses the following three measurement techniques in accordance with Korean IFRS:
- General approach: for financial assets and off-balance-sheet unused credit line that are not applied below two approaches
- Simplified approach: for receivables, contract assets and lease receivables
- Credit-impaired approach: for purchased or originated credit-impaired financial assets
Different measurement approaches are applied depending on significant increase in credit risk. 12 month expected credit losses is recognized when credit
risk has not significantly increased since initial recognition. A loss allowance at an amount equal to lifetime expected credit losses is recognized when
credit risk has significantly increased since initial recognition. Lifetime is presumed to be a period to the contractual maturity date of a financial asset (the
expected life of the financial asset).
One or more of the following items is deemed significant increase in credit risk. 30 days past due presumption is applicable for all consolidated subsidiaries,
and other standards are selectively applied considering applicability of each subsidiary with its specific indicators. When the contractual cash flows of a
financial asset are renegotiated or otherwise modified, the Group determines whether the credit risk has increased significantly since initial recognition
using the following information.
- more than 30 days past due;
- decline in credit rating at period end by more than certain notches as compared to that at initial recognition;
- decline in ratings below certain level in the early warning system;
- debt restructuring (except for impaired financial assets); and
- credit delinquency information on Korea Federation of Banks, and etc.
Under simplified approach, the Group shall always measure the loss allowance at an amount equal to lifetime expected credit losses. Under credit-
impaired approach, the Group shall only recognize the cumulative changes in lifetime expected credit losses since initial recognition as a loss allowance
for purchased or originated credit-impaired financial assets. In assessing credit impairment, the Group uses definition of default as in the new Basel Accord
which rules calculation of Capital Adequacy Ratio.
KB Financial Group Annual Report 2019094

The Group generally deems one or more of the following items credit-impaired:
- no less than 90 days past due;
- legal proceedings related to collection;
- a borrower that has received a warning from the Korea Federation of Banks;
- corporate borrowers that are rated C or D;
- refinancing; and
- debt restructuring.
3.6.1 Forward-looking information
The Group uses forward-looking information, when it determines whether the credit risk has increased significantly and measures the expected credit losses.
The Group assumes the risk components have a certain correlation with the economic cycle, and uses statistical methodologies to estimate the relation
between key macroeconomic variables and risk components for the expected credit losses.
The correlation between the major macroeconomic variables and the credit risk is as follows:
Key macroeconomic variables
Domestic GDP growth rate
Composite stock index
Construction investment change rate
Rate of change in housing transaction price index
Interest rate spread
Private consumption growth rate
Change of call rate compared to the last year (%p)
Household loan change rate
Correlation between the major macroeconomic variables and the credit risk
(-)
(-)
(-)
(-)
(+)
(-)
(+)
(-)
Forward-looking information used in calculation of expected credit losses is based on the macroeconomic forecasts utilized by management of the Group for its business plan taking into account reliable external agency’s forecasts and others. The forward-looking information is generated by KB Research under the Parent Company with comprehensive approach to capture the possibility of various economic forecast scenarios that are derived from the internal and external viewpoints of the macroeconomic situation. The Group determines the macroeconomic variables to be used in forecasting future condition of the economy, taking into account the direction of the forecast scenario and the significant relationship between macroeconomic variables and time series data. And there are some changes compared to the macroeconomic variables used in the previous year.
3.6.2 Measuring expected credit losses on financial assets at amortized cost
The amount of the loss on financial assets at amortized cost is measured as the difference between the asset’s carrying amount and the present value of estimated future cash flows discounted at the financial asset’s original effective interest rate.The Group estimates expected future cash flows for financial assets that are individually significant (individual assessment of impairment).
For financial assets that are not individually significant, the Group collectively estimates expected credit loss by grouping loans with homogeneous credit risk profile (collective assessment of impairment).
Individual assessment of impairment
Individual assessment of impairment losses are calculated using management’s best estimate on present value of expected future cash flows. The Group uses all the available information including operating cash flow of the borrower and net realizable value of any collateral held.
Collective assessment of impairment
Collective assessment of loss allowance involves historical loss experience along with incorporation of forward-looking information. Such process incorporates factors such as type of collateral, product and borrowers, credit rating, size of portfolio and recovery period and applies ‘probability of default’(PD) on a group of assets and ‘loss given default’(LGD) by type of recovery method. Also, the expected credit loss model involves certain assumption to determine input based on loss experience and forward-looking information. These models and assumptions are periodically reviewed to reduce gap between loss estimate and actual loss experience.
Lifetime expected credit loss as at the end of the reporting period is calculated by product of carrying amount net of expected repayment, PD for each period and LGD adjusted by change in carrying amount.
Financial Section 095

3.6.3 Measuring expected credit losses on financial assets at fair value through other comprehensive income
Measuring method of expected credit losses on financial assets at fair value through other comprehensive income is equal to the method of financial assets at amortized cost, except for loss allowances that are recognized as other comprehensive income. Amounts recognized in other comprehensive income for sale or repayment of financial assets at fair value through other comprehensive income are reclassified to profit or loss.
3.7 Derivative Financial Instruments
The Group enters into numerous derivative financial instrument contracts such as currency forwards, interest rate swaps, currency swaps and others for trading purposes or to manage its exposures to fluctuations in interest rates and currency exchange, amongst others. These derivative financial instruments are presented as derivative financial instruments within the consolidated financial statements irrespective of transaction purpose and subsequent measurement requirement.
The Group designates certain derivatives as hedging instruments to hedge the risk of changes in fair value of a recognized asset or liability or of an unrecognized firm commitment (fair value hedge) and the risk of changes in cash flow (cash flow hedge). The Group designates non-derivatives as hedging instruments to hedge the risk of foreign exchange of a net investment in a foreign operation (hedge of net investment).
At the inception of the hedge, there is formal designation and documentation of the hedging relationship and the Group’s risk management objective and strategy for undertaking the hedge. This documentation includes identification of the hedging instrument, the hedged item or transaction, the nature of the risk being hedged and how the Group will assess the hedging instrument’s effectiveness in offsetting the exposure to changes in the hedged item’s fair value or cash flows attributable to the hedged risk.
Derivatives are initially recognized at fair value. Subsequent to initial recognition, derivatives are measured at fair value, and changes therein are accounted for as described below.
3.7.1 Derivative financial instruments held for trading
All derivative financial instruments, except for derivatives that are designated and qualify for hedge accounting, are measured at fair value. Gains or losses arising from a change in fair value are recognized in profit or loss as part of net gains or losses on financial instruments at fair value through profit or loss.
3.7.2 Fair value hedges
If derivatives qualify for a fair value hedge, the change in fair value of the hedging instrument and the change in fair value of the hedged item attributable to the hedged risk are recognized in profit or loss as part of other operating income and expenses. If hedged items are equity instruments and designated to present the change in fair value of the hedging instrument in other comprehensive income, recognized hedge ineffectiveness are presented in other comprehensive income. Fair value hedge accounting is discontinued prospectively if the hedging instrument expires or is sold, terminated or exercised, or the hedge no longer meets the criteria for hedge accounting or the Group revokes the designation. Once fair value hedge accounting is discontinued, the adjustment to the carrying amount of a hedged item is fully amortized to profit or loss by the maturity of the financial instrument using the effective interest method.
3.7.3 Cash flow hedges
The effective portion of changes in fair value of derivatives that are designated and qualify as cash flow hedges is recognized in other comprehensive income, limited to the cumulative change in fair value (present value) of the hedged item (the present value of the cumulative change in the future expected cash flows of the hedged item) from the inception of the hedge. The ineffective portion is recognized in gain or loss (other operating income or expense). The associated gains or losses that were previously recognized in other comprehensive income are reclassified from equity to profit or loss as a reclassification adjustment in the same period or periods during which the hedged forecast cash flows affects profit or loss. The associated gains or losses that were previously recognized in other comprehensive income are reclassified from equity to profit or loss as a reclassification adjustment in the same period or periods during which the hedged forecast cash flows affects profit or loss. Cash flow hedge accounting is discontinued prospectively if the hedging instrument expires or is sold, terminated or exercised, or the hedge no longer meets the criteria for hedge accounting or the Group revokes the
designation. When the cash flow hedge accounting is discontinued, the cumulative gains or losses on the hedging instrument that have been recognized in
other comprehensive income are reclassified to profit or loss over the year in which the forecast transaction occurs. If the forecast transaction is no longer
expected to occur, the cumulative gains or losses that had been recognized in other comprehensive income are immediately reclassified to profit or loss.
3.7.4 Hedge of net investment
If derivatives and non-derivatives qualify for a net investment hedge, the effective portion of changes in fair value of hedging instrument is recognized
in other comprehensive income and the ineffective portion is recognized in profit. The gain or loss on the hedging instrument relating to the effective
portion of the hedge that has been recognized in other comprehensive income will be reclassified from other comprehensive income to profit or loss as a
reclassification adjustment on the disposal or partial disposal of the foreign operation in accordance with Korean IFRS 1109 Financial Instruments.
KB Financial Group Annual Report 201996

3.7.5 Embedded derivatives
If a hybrid contract contains a host that is not an asset, an embedded derivative is separated from the host contract and accounted for as a derivative if, and
only if the economic characteristics and risks of the embedded derivative are not closely related to those of the host contract and a separate instrument
with the same terms as the embedded derivative would meet the definition of a derivative and the hybrid (combined) instrument is not measured at fair
value with changes in fair value recognized in profit or loss. Gains or losses arising from a change in the fair value of an embedded derivative separated
from the host contract are recognized in profit or loss as part of net gains or losses on financial instruments at fair value through profit or loss.
3.7.6 Day one gain and loss
If the Group uses a valuation technique that incorporates data not obtained from observable markets for the fair value at initial recognition of the financial
instrument, there may be a difference between the transaction price and the amount determined using that valuation technique. In these circumstances,
the difference is deferred and not recognized in profit or loss, and is amortized by using the straight-line method over the life of the financial instrument. If
the fair value of the financial instrument is subsequently determined using observable market inputs, the remaining deferred amount is recognized in profit
or loss as part of net gains or losses on financial instruments at fair value through profit or loss or other operating income and expenses.
3.8 Property and Equipment
3.8.1 Recognition and measurement
All property and equipment that qualify for recognition as an asset are measured at cost and subsequently carried at cost less any accumulated
depreciation and any accumulated impairment losses.
The cost of property and equipment includes any costs directly attributable to bringing the asset to the location and condition necessary for it to be
capable of operating in the manner intended by management and the initial estimate of the costs of dismantling and removing the item and restoring the
site on which it is located.
Subsequent expenditures are capitalized only when they prolong the useful life or enhance values of the assets but the costs of the day-to-day servicing of
the assets such as repair and maintenance costs are recognized in profit or loss as incurred. When part of an item of an asset has a useful life different from
that of the entire asset, it is recognized as a separate asset.
3.8.2 Depreciation
Land is not depreciated, whereas other property and equipment are depreciated using the method that reflects the pattern in which the asset’s future
economic benefits are expected to be consumed by the Group. The depreciable amount of an asset is determined after deducting its residual value.
Each part of an item of property and equipment with a cost that is significant in relation to the total cost of the item is depreciated separately.
The depreciation method and estimated useful lives of the assets are as follows:
Property and equipment
Buildings and structures
Leasehold improvements
Equipment and vehicles
Depreciation method
Straight-line
Declining-balance/ Straight-line
Declining-balance/ Straight-line
Estimated useful lives
20~40 years
4~5 years
3~15 years
The residual value, the useful life and the depreciation method applied to an asset are reviewed at each financial year end. If expectations differ from
previous estimates, the changes are accounted for as a change in an accounting estimate.
3.9 Investment Properties
3.9.1 Recognition and measurement
Properties held to earn rentals or for capital appreciation or both are classified as investment properties. Investment properties are measured initially at
their cost and subsequently the cost model is used.
3.9.2 Depreciation
Land is not depreciated, whereas other investment properties are depreciated using the method that reflects the pattern in which the asset’s future economic benefits are expected to be consumed by the Group. The depreciable amount of an asset is determined after deducting its residual value.
Financial Section 97

The depreciation method and estimated useful lives of the assets are as follows:
The residual value, the useful life and the depreciation method applied to an asset are reviewed at each financial year end. If expectations differ from previous estimates, the changes are accounted for as a change in an accounting estimate.
3.10 Intangible Assets
Intangible assets are measured initially at cost and subsequently carried at their cost less any accumulated amortization and any accumulated impairment losses.
Intangible assets, except for goodwill and membership rights, are amortized using the straight-line method or double declining balance method with no residual value over their estimated useful economic life since the asset is available for use.
The amortization period and the amortization method for intangible assets with a definite useful life are reviewed at each financial year end. Where an intangible asset is not being amortized because its useful life is considered to be indefinite, the Group carries out a review in each accounting period to confirm whether or not events and circumstances still support the assumption of an indefinite useful life. If they do not, the change from the indefinite to definite useful life is accounted for as a change in an accounting estimate.
3.10.1 Value of business acquired (VOBA)
The Group recorded value of business acquired (VOBA) as intangible assets, which are the differences between the fair value of insurance liabilities and book value calculated based on the accounting policy of the acquired company. VOBA is an estimated present value of future cash flow of long-term insurance contracts at the acquisition date. VOBA is amortized over the above estimated useful life using declining balance method, and the depreciation is recognized as insurance expense.
3.10.2 Goodwill
Recognition and measurement
Goodwill arisen from business combinations before January 1, 2010, is stated at its carrying amount which was recognized under the Group’s previous accounting policy, prior to the transition to Korean IFRS.
Goodwill acquired from business combinations after January 1, 2010, is initially measured as the excess of the aggregate of the consideration transferred, fair value of non-controlling interest and the acquisition-date fair value of the acquirer’s previously held equity interest in the acquiree over the net identifiable assets acquired and liabilities assumed. If this consideration is lower than the fair value of the net assets of the business acquired, the difference is recognized in profit or loss.
For each business combination, the Group decides whether the non-controlling interest in the acquiree is initially measured at fair value or at the non-controlling interest’s proportionate share of the acquiree’s identifiable net assets at the acquisition date.
Acquisition-related costs incurred to effect a business combination are charged to expenses in the periods in which the costs are incurred and the services are received, except for the costs to issue debt or equity securities.
Additional acquisitions of non-controlling interest
Additional acquisitions of non-controlling interests are accounted for as equity transactions. Therefore, no additional goodwill is recognized.
Subsequent measurement
Goodwill is not amortized and is stated at cost less accumulated impairment losses. However, goodwill that forms part of the carrying amount of an investment in associates is not separately recognized and an impairment loss recognized is not allocated to any asset, including goodwill, which forms part of the carrying amount of the investment in the associates.
Investment properties
Buildings
Depreciation method
Straight-line
Estimated useful lives
20~40 years
Intangible assets
Industrial property rights
Software
VOBA
Others
Amortization method
Straight-line
Straight-line
Declining-balance
Straight-line
Estimated useful lives
20~40 years
3 ~ 5 years
60 years
1 ~ 13 years
KB Financial Group Annual Report 201998
3.10.3 Subsequent expenditure
Subsequent expenditure is capitalized only when it enhances values of the assets. Internally generated intangible assets, such as goodwill and trade name,
are not recognized as assets but expensed as incurred.
3.11 Impairment of Non-financial Assets
The Group assesses at the end of each reporting period whether there is any indication that a non-financial asset, except for (i) deferred income tax assets,
(ii) assets arising from employee benefits and (iii) non-current assets (or group of assets to be sold) classified as held for sale, may be impaired. If any such
indication exists, the Group estimates the recoverable amount of the asset. However, irrespective of whether there is any indication of impairment, the
Group tests (i) goodwill acquired in a business combination, (ii) intangible assets with an indefinite useful life and (iii) intangible assets not yet available for
use for impairment annually by comparing their carrying amount with their recoverable amount.
The recoverable amount is estimated for the individual asset. If it is not possible to estimate the recoverable amount of the individual asset, the Group
determines the recoverable amount of the cash-generating unit to which the asset belongs (the asset’s cash-generating unit). A cash-generating unit is
the smallest identifiable group of assets that generates cash inflows that are largely independent of the cash inflows from other assets or groups of assets.
The recoverable amount of an asset is the higher of its fair value less costs to sell and its value in use. Value in use is the present value of the future cash
flows expected to be derived from an asset or cash-generating unit that are discounted by a pre-tax rate that reflects current market assessments of the
time value of money and the risks specific to the asset for which the future cash flow estimates have not been adjusted.
If the recoverable amount of an asset is less than its carrying amount, the carrying amount of the asset is reduced to its recoverable amount. That
reduction is an impairment loss and recognized immediately in profit or loss. For the purpose of impairment testing, goodwill arising from in a business
combination is allocated to each of the cash-generating units that are expected to benefit from the synergies of the combination. The impairment loss is
allocated first to reduce the carrying amount of any goodwill allocated to the cash-generating unit and then to the other assets of the unit pro rata on the
basis of the carrying amount of each asset in the unit.
An impairment loss recognized for goodwill is not reversed in a subsequent period. The Group assesses at the end of each reporting period whether there
is any indication that an impairment loss recognized in prior periods for an asset, other than goodwill, may no longer exist or may have decreased, and an
impairment loss recognized in prior periods for an asset other than goodwill shall be reversed if, and only if, there has been a change in the estimates used
to determine the asset’s recoverable amount since the last impairment loss was recognized. The increased carrying amount of an asset other than goodwill
attributable to a reversal of an impairment loss cannot exceed the carrying amount that would have been determined (net of amortization or depreciation)
had no impairment loss been recognized for the asset in prior years.
3.12 Non-current Assets Held for Sale
A non-current asset or disposal group is classified as held for sale if its carrying amount will be recovered principally through a sale transaction rather than
through continuing use. For this to be the case, the asset (or disposal group) must be available for immediate sale in its present condition and its sale must
be highly probable. A non-current asset (or disposal group) classified as held for sale is measured at the lower of its carrying amount and fair value less
costs to sell which is measured in accordance with the applicable Korean IFRS, immediately before the initial classification of the asset (or disposal group) as
held for sale.
A non-current asset while it is classified as held for sale or while it is part of a disposal group classified as held for sale is not depreciated (or amortized).
Impairment loss is recognized for any initial or subsequent write-down of the asset (or disposal group) to fair value less costs to sell. Gains are recognized
for any subsequent increase in fair value less costs to sell of an asset, but not in excess of the cumulative impairment loss that has been recognized.
3.13 Financial Liabilities
The Group classifies non-derivative financial liabilities into financial liabilities at fair value through profit or loss or other financial liabilities in accordance
with the substance of the contractual arrangement and the definitions of financial liabilities.
The Group recognizes financial liabilities in the consolidated statement of financial position when the Group becomes a party to the contractual provisions
of the financial liability.
3.13.1 Financial liabilities at fair value through profit or loss
Financial liabilities at fair value through profit or loss include financial liabilities held for trading or designated as such upon initial recognition. Subsequent to
initial recognition, financial liabilities at fair value through profit or loss are measured at fair value, and changes therein are recognized in profit or loss. Upon
initial recognition, transaction costs that are directly attributable to the acquisition are recognized in profit or loss as incurred.
Financial Section 99

In relation to securities lending or borrowing transactions, the Group records transaction using memo value when it borrows securities from Korea
Securities Depository etc. The borrowed securities are treated as financial liabilities at fair value through profit and loss when the Group sells them. Changes
in fair value at the end of the reporting period and difference between carrying amount at redemption and purchased amount are recognized as profit and
loss.
In addition, for the amount of change in the fair value of the financial liability that is attributable to changes in the credit risk of that liability, the Group
presents this change in other comprehensive income, and does not recycle this to profit or loss, subsequently. When this treatment creates or enlarges an
accounting mismatch, the Group recognizes this change as profit or loss for the current period.
3.13.2 Other financial liabilities
Non-derivative financial liabilities other than financial liabilities at fair value through profit or loss are classified as other financial liabilities. Other financial
liabilities include Deposits, Debts, Debentures and others. At the date of initial recognition, other financial liabilities are measured at fair value minus
transaction costs that are directly attributable to the acquisition. Subsequent to initial recognition, other financial liabilities are measured at amortized cost,
and its interest expense is recognized, using the effective interest method.
In case an asset is sold under repurchase agreement, the Group continues to recognize the asset with the amount sold being accounted for as borrowing.
The Group derecognizes a financial liability from the consolidated statement of financial position only when it is extinguished (i.e. when the obligation
specified in the contract is discharged, cancelled or expires).
3.14 Insurance Contracts
KB Life Insurance Co., Ltd., and KB Insurance Co., Ltd., the subsidiaries of the Group, issue insurance contracts.
Insurance contracts are defined as “a contract under which one party (the insurer) accepts significant insurance risk from another party by agreeing to
compensate the policyholder if a specified uncertain future event adversely affects the policyholder”.A contract that qualifies as an insurance contract remains
an insurance contract until all rights and obligations are extinguished or expire. Such a contract that does not contain significant insurance risk is classified
as an investment contract and is within the scope of Korean IFRS 1109, Financial Instruments to the extent that it gives rise to a financial asset or financial
liability, except if the investment contract contains a Discretionary Participation Features (DPF). If the contract has a DPF, the contract is subject to Korean
IFRS 1104, Insurance Contracts. The Group recognizes assets (liabilities) and gains (losses) relating to insurance contracts as other assets (liabilities) in the
statement of financial position, and as other operating income (expenses) in the statement of comprehensive income, respectively.
3.14.1 Insurance premiums
The Group recognizes collected premiums as revenue on the due date of collection of premiums from insurance contracts and the collected premium
which is not earned at the end of the reporting period is recognized as unearned premium.
3.14.2 Insurance liabilities
The Group recognizes a liability for future claims, refunds, policyholders’ dividends and related expenses as follows:
Premium reserve
Premium reserve refers to an amount based on the net premium method for payment of future claims with respect to events covered by insurance policies
which have not yet occurred as of the reporting period. It is calculated as the greater of the amount using standard interest rate and standard loss ratio
defined by Financial Supervisory Services and the amount using the actual underlying data that have been used in premium calculation.
Reserve for outstanding claims
Reserve for outstanding claims refers to the amount not yet paid, out of an amount to be paid or expected to be paid with respect to the insured events
which have arisen as of the end of each fiscal year.
Unearned premium reserve
The premiums that are due before the end of the reporting period but applicable to the next period are included.
Policyholders’ dividends reserve
Policyholders’ dividends reserve including an interest rate guarantee reserve, a mortality dividend reserve and an interest rate difference dividend reserve is
recognized for the purpose of provisioning for policyholders’ dividends in the future in accordance with statutes or insurance terms and conditions.
KB Financial Group Annual Report 2019100

3.14.3 Liability adequacy test
The Group assesses at each reporting period whether its insurance liabilities are adequate, using current estimates of all future contractual cash flows and related cash flow such as claims handling cost, as well as cash flows resulting from embedded options and guarantees under its insurance contracts in accordance with Korean IFRS 1104. If the assessment shows that the carrying amount of its insurance liabilities is insufficient in light of the estimated future cash flows, additional reserve is recognized for the deficient amount. Future cash flows from long-term insurance are discounted at a future rate of return on operating assets, whereas future cash flows from general insurance are not discounted to present value. For liability adequacy tests of premium and unearned premium reserves, the Group considers all cash flow factors such as future insurance premium, deferred acquisition costs, operating expenses and operating premiums. In relation to the reserve for outstanding claims, the Group elects to use a model that best reflects the trend of paid claims among several statistical methods to perform the adequacy test.
3.14.4 Deferred acquisition costs
Acquisition cost is deferred in an amount actually spent for an insurance contract and equally amortized over the premium payment period or the period in which acquisition costs are charged for the relevant insurance contract. Acquisition costs are amortized over the shorter of seven years or premium payment period; if there is any unamortized acquisition costs remaining as of the date of surrender or lapse, such remainder shall be amortized in the period in which the contract is surrendered or lapsed.
3.15 Provisions
Provisions are recognized when the Group has a present obligation (legal or constructive) as a result of a past event and it is probable that an outflow of resources embodying economic benefits will be required to settle the obligation and a reliable estimate can be made of the amount of the obligation. The risks and uncertainties that inevitably surround many events and circumstances are taken into account in reaching the best estimate of provisions, and where the effect of the time value of money is material, the amount of provisions are the present value of the expenditures expected to be required to settle the obligation.
Provisions on confirmed and unconfirmed acceptances and guarantees, unfunded commitments of credit cards and unused credit lines of consumer and corporate loans are recognized using a valuation model that applies the credit conversion factor, probability of default, and loss given default.
Provisions are reviewed at the end of each reporting period and adjusted to reflect the current best estimate. If it is no longer probable that an outflow of resources embodying economic benefits will be required to settle the obligation, the provisions are reversed.
If the Group has an onerous contract, the present obligation under the contract is recognized and measured as provisions.
An onerous contract is a contract in which the unavoidable costs of meeting the obligations under the contract exceed the economic benefits expected to be received under it. The unavoidable costs under a contract reflect the minimum net cost to exit from the contract, which is the lower of the cost of fulfilling it and any compensation or penalties arising from failure to fulfill it.
3.16 Financial Guarantee Contracts
A financial guarantee contract requires the issuer (the Group) to make specified payments to reimburse the holder for a loss it incurs because a specified debtor fails to make payments when due in accordance with the original or modified terms of a debt instrument.
Financial guarantee contracts are initially recognized at fair value as other liabilities, and are amortized over the contractual term. After initial recognition, financial guarantee contracts are measured at the higher of:
- The amount determined in accordance with Korean IFRS 1109, Financial Instruments or- The initial amount recognized, less, when appropriate, cumulative amortization recognized in accordance with Korean IFRS 1115, Revenue from Contracts
with Customers.
3.17 Equity Instruments Issued by the Group
An equity instrument is any contract or agreement that evidences a residual interest in the assets of an entity after deducting all of its liabilities.
3.17.1 Ordinary shares
Ordinary shares are classified as equity. Incremental costs directly attributable to the issue of new shares or the exercise of stock option are deducted from the equity, net of any tax effects.
3.17.2 Hybrid Securities
The financial instruments can be classified as either financial liabilities or equity in accordance with the terms of the contract. The Group classifies hybrid securities as an equity if the Group has the unconditional right to avoid any contractual obligation to deliver financial assets such as cash in relation to the financial instruments. As a result, hybrid securities issued by subsidiaries are classified as non-controlling interests, dividends are recognized in the consolidated statement of comprehensive income as profit attributable to non-controlling interests.
Financial Section 101

3.17.3 Treasury shares
If the Group acquires its own equity instruments, these are accounted for as treasury shares and are deducted directly from equity. No gains or losses are
recognized in profit or loss on the purchase, sale, issue or cancellation of own equity instruments. If an entity within the Group acquires and retains treasury
shares, the consideration paid or received is directly recognized in equity.
3.17.4 Compound financial instruments
A compound financial instrument is classified as a financial liability or an equity instrument depending on the substance of the contractual arrangement of
such financial instrument. The liability component of the compound financial instrument is measured at fair value of the similar liability without conversion
option at initial recognition and subsequently measured at amortized cost using effective interest rate method until it is extinguished by conversion or
matured. Equity component is initially measured at fair value of compound financial instrument in entirety less fair value of liability component net of tax
effect and it is not remeasured subsequently.
3.18 Revenue Recognition
The Group recognizes revenues in accordance with the following revenue recognition standard:
- Step 1: Identify the contract with a customer.
- Step 2: Identify the performance obligations in the contract.
- Step 3: Determine the transaction price.
- Step 4: Allocate the transaction price to the performance obligations in the contract.
- Step 5: Recognize revenue when (or as) the entity satisfies a performance obligation.
3.18.1 Interest income and expense
Interest income of financial assets at amortized cost and financial assets at fair value through other comprehensive income, and expense are recognized in
the statement of comprehensive income using the effective interest method. The effective interest method is a method of calculating the amortized cost
of a financial asset or a financial liability (or groups of financial assets or financial liabilities) and of allocating the interest income or interest expense over
the relevant period.
The effective interest rate is the rate that exactly discounts estimated future cash receipts or payments through the expected life of the financial instrument
or, where appropriate, a shorter period, to the net carrying amount of the financial asset or financial liability. When calculating the effective interest rate,
the Group estimates cash flows considering all contractual terms of the financial instrument but does not consider future credit losses. The calculation
includes all fees and points paid (main components of effective interest rates only) or received between parties to the contract that are an integral part of
the effective interest rate, transaction costs, and all other premiums or discounts. In those rare cases when it is not possible to estimate reliably the cash
flows or the expected life of a financial instrument (or group of financial instruments), the Group uses the contractual cash flows over the full contractual
term of the financial instrument (or group of financial instruments).
Interest on impaired financial assets is recognized using the rate of interest used to discount the future cash flows for the purpose of measuring the
impairment loss.
Interest earned arising from debt investments at fair value through profit or loss is also classified as interest income in the statement of comprehensive
income.
3.18.2 Fee and commission income
The Group recognizes financial service fees in accordance with the accounting standard of the financial instrument related to the fees earned.
Fees that are an integral part of the effective interest of a financial instrument
Such fees are generally treated as adjustments of effective interest. Such fees may include compensation for activities such as evaluating the borrower’s
financial condition, evaluating and recording guarantees, collateral and other security arrangements, negotiating the terms of the instrument, preparing
and processing documents and closing the transaction and origination fees received on issuing financial liabilities measured at amortized cost. However,
fees relating to the creation or acquisition of a financial instrument at fair value through profit or loss are recognized as revenue immediately.
Fees earned as services are provided
Such fees are recognized as revenue as the services are provided. Fees which can be earned through the certain periods, including account servicing fees,
investment management fees, and etc. are recognized when the related services are provided.
KB Financial Group Annual Report 2019102

Fees that are earned on the execution of a significant act
Such fees are recognized as revenue when the significant act has been completed.
Commission on the allotment of shares to a client is recognized as revenue when the shares have been allotted and placement fees for arranging a loan
between a borrower and an investor is recognized as revenue when the loan has been arranged.
A syndication fee received by the Group that arranges a loan and retains no part of the loan package for itself (or retains a part at the same effective
interest rate for comparable risk as other participants) is compensation for the service of syndication. Such a fee is recognized as revenue when the
syndication has been completed.
3.18.3 Net gains/losses on financial instruments at fair value through profit or loss
Net gains/losses on financial instruments at fair value through profit or loss include profit or loss (changes in fair value, dividends, and gain/loss from foreign
currency translation) from following financial instruments:
- Gain or loss from financial instruments at fair value through profit or loss
- Gain or loss from derivatives for trading, including derivatives for hedging that does not meet the condition of hedge accounting
3.18.4 Dividend income
Dividend income is recognized in profit or loss when the right to receive payment is established. Dividend income is recognized as relevant items on
statements of profit or loss and other comprehensive income in accordance with the classification of equity instruments.
3.19 Employee Compensation and Benefits
3.19.1 Post-employment benefits: defined contribution plans
The contributions are recognized as employee benefit expense when they are due.
3.19.2 Post-employment benefits: defined benefit plans
All post-employment benefits, other than defined contribution plans, are classified as defined benefit plans. The amount recognized as a defined benefit
liability is the present value of the defined benefit obligation less the fair value of plan assets at the end of the reporting period.
The present value of the defined benefit obligation is calculated annually by independent actuaries using the Projected Unit Credit method. The rate used
to discount post-employment benefit obligations is determined by reference to market yields at the end of the reporting period on high quality corporate
bonds. The currency and term of the corporate bonds are consistent with the currency and estimated term of the post-employment benefit obligations.
Actuarial gains and losses including experience adjustments and the effects of changes in actuarial assumptions are recognized in other comprehensive
income.
When the total of the present value of the defined benefit obligation minus the fair value of plan assets results in an asset, it is recognized to the extent of
the present value of any economic benefits available in the form of refunds from the plan or reductions in future contributions to the plan.
Past service cost is the change in the present value of the defined benefit obligation, which arises when the Group introduces a defined benefit plan or
changes the benefits of an existing defined benefit plan. Such past service cost is immediately recognized as an expense for the reporting period.
3.19.3 Short-term employee benefits
Short-term employee benefits are employee benefits (other than termination benefits) that are due to be settled within 12 months after the end of the
period in which the employees render the related service. The undiscounted amount of short-term employee benefits expected to be paid in exchange for
that service is recognized as a liability (accrued expense), after deducting any amount already paid.
The expected cost of profit-sharing and bonus payments are recognized as liabilities when the Group has a present legal or constructive obligation to make
such payments as a result of past events rendered by employees and a reliable estimate of the obligation can be made.
3.19.4 Share-based payment
The Group has provided its directors and employees with stock grant, and mileage stock programs. When stock grant options are exercised, the Group can
either select to distribute newly issued shares or treasury shares or compensate in cash based on the share price. When mileage stock options are exercised,
the Group pays the amount equivalent to KB Financial Group’s share price in cash.
For a share-based payment transaction in which the terms of the arrangement provide the Group with the choice of whether to settle in cash or by issuing
equity instruments, the Group determines that it has a present obligation to settle in cash because the Group has a past practice and a stated policy of
settling in cash. Therefore, the Group accounts for the transaction in accordance with the requirements of cash-settled share-based payment transactions.
Financial Section 103

For mileage stock option, the Group accounts for the transaction in accordance with cash-settled share-based payment transactions, which are recognized
as accrued expenses at the time of vesting.
The Group measures the services acquired and the liability incurred at fair value, and the fair value is recognized as expense and accrued expenses over
the vesting period. Until the liability is settled, the Group remeasures the fair value of the liability at the end of each reporting period and at the date of
settlement, with any changes in fair value recognized in profit or loss for the reporting period.
3.19.5 Termination benefits
Termination benefits are payable when employment is terminated by the Group before the normal retirement date, or whenever an employee accepts
voluntary redundancy in exchange for these benefits. The Group shall recognize a liability and expense for termination benefits at the earlier of the
following dates: when the Group can no longer withdraw the offer of those benefits and when the Group recognizes costs for a restructuring that is
within the scope of Korean IFRS 1037 and involves the payment of termination benefits. Termination benefits are measured by considering the number of
employees expected to accept the offer in the case of a voluntary early retirement. Termination benefits over 12 months after the reporting period are
discounted to present value.
3.20 Income Tax Expenses
Income tax expense comprises current tax expense and deferred income tax expense. Current and deferred income tax are recognized as income or
expense for the period, except to the extent that the ax arises from (a) a transaction or an event which is recognized, in the same or a different period
outside profit or loss, either in other comprehensive income or directly in equity and (b) a business combination.
3.20.1 Current income tax
Current income tax is the amount of income taxes payable in respect of the taxable profit (loss) for a period. A difference between the taxable profit and
accounting profit may arise when income or expense is included in accounting profit in one period, but is included in taxable profit in a different period.
Differences may also arise if there is revenue that is exempt from taxation, or expense that is not deductible in determining taxable profit (loss). Current
income tax liabilities (assets) for the current and prior periods are measured at the amount expected to be paid to (recovered from) the taxation authorities,
using the tax rates (and tax laws) that have been enacted or substantively enacted by the end of the reporting period.
The Group offsets current income tax assets and current income tax liabilities if, and only if, the Group (a) has a legally enforceable right to offset the
recognized amounts and (b) intends either to settle on a net basis, or to realize the asset and settle the liability simultaneously.
3.20.2 Deferred income tax
Deferred income tax is recognized, using the asset-liability method, on temporary differences arising between the tax based amount of assets and liabilities
and their carrying amount in the financial statements. Deferred income tax liabilities are recognized for all taxable temporary differences and deferred
income tax assets are recognized for all deductible temporary differences to the extent that it is probable that taxable profit will be available against which
the deductible temporary difference can be utilized. However, deferred income tax liabilities are not recognized if they arise from the initial recognition
of goodwill; deferred income tax is not accounted for if it arises from initial recognition of an asset or liability in a transaction other than a business
combination that at the time of the transaction affects neither accounting nor taxable profit or loss.
Deferred income tax is provided on temporary differences arising on investments in subsidiaries, associates and joint ventures, except for deferred income
tax liabilities for which the timing of the reversal of the temporary difference is controlled by the Group and it is probable that the temporary difference will
not reverse in the foreseeable future.
The carrying amount of a deferred income tax asset is reviewed at the end of each reporting period. The Group reduces the carrying amount of a deferred
income tax asset to the extent that it is no longer probable that sufficient taxable profit will be available to allow the benefit of part or all of that deferred
income tax asset to be utilized.
Deferred income tax assets and liabilities are measured at the tax rates that are expected to apply to the period when the asset is realized or the liability
is settled, based on tax rates (and tax laws) that have been enacted or substantively enacted by the end of the reporting period. The measurement of
deferred income tax liabilities and deferred income tax assets reflects the tax consequences that would follow from the manner in which the Group
expects, at the end of the reporting period, to recover or settle the carrying amount of its assets and liabilities.
The Group offsets deferred income tax assets and deferred income tax liabilities when the Group has a legally enforceable right to offset
current income tax assets against current income tax liabilities; and the deferred income tax assets and the deferred income tax liabilities
relate to income taxes levied by the same taxation authority on either the same taxable entity; or different taxable entities which intend
either to settle current income tax liabilities and assets on a net basis, or to realize the assets and settle the liabilities simultaneously,
in each future period in which significant amounts of deferred income tax liabilities or assets are expected to be settled or recovered.
KB Financial Group Annual Report 2019104

3.20.3 Uncertain tax positions
Uncertain tax positions arise from tax treatments applied by the Group which may be challenged by the tax authorities due to the complexity of the
transaction or different interpretation of the tax laws, a claim for rectification brought by the Group, or an appeal for a refund claimed from the tax
authorities related to additional assessments. The Group recognizes its uncertain tax positions in the consolidated financial statements based on the
guidance in Korean IFRS 1012. The income tax asset is recognized if a tax refund is probable for taxes paid and levied by the tax authority. However,
interest and penalties related to income tax are recognized in accordance with Korean IFRS 1037.
3.21 Earnings per Share
The Group calculates basic earnings per share amounts and diluted earnings per share amounts for profit or loss attributable to ordinary equity holders
of the Parent Company and presents them in the statement of comprehensive income. Basic earnings per share is calculated by dividing profit or loss
attributable to ordinary equity holders of the Parent Company by the weighted average number of ordinary shares outstanding during the period. For the
purpose of calculating diluted earnings per share, the Group adjusts profit or loss attributable to ordinary equity holders of the Parent Company and the
weighted average number of shares outstanding for the effects of all dilutive potential ordinary shares including convertible bonds and share options.
3.22 Leases
As explained in Note 2.2 above, the Group has changed its accounting policy for leases. The impact of the new accounting policies is disclosed in Note 45.
Lease income from operating leases where the Group is a lessor is recognized in income on a straight-line basis over the lease term. Initial direct costs
incurred in obtaining an operating lease are added to the carrying amount of the underlying asset and recognized as expense over the lease term on the
same basis as lease income. The respective leased assets are included in the statement of financial position based on their nature. The Group did not need
to make any adjustments to the accounting for assets held as a lessor as a result of adopting the new leasing standard.
At inception of a contract, the Group is required to assess whether the contract is, or contains, a lease. Also, at the date of initial application, the Group
has assessed whether the contract is, or contains, a lease in accordance with the standard. However, the Group did not reassess all contracts as the Group
elected to apply the practical expedient not to apply the standard to contracts that were not previously identified as containing a lease. On the basis of the
date of initial application, the Group assesses whether the contract is, or contains, a lease.
A lessee is required to recognize a right-of-use asset (lease assets) representing its right to use the underlying leased asset and a lease liability representing
its obligation to make lease payments. Assets and liabilities arising from a lease are initially measured on a present value basis.
Lease liabilities include the net present value of the following lease payments:
- Fixed payments (including in-substance fixed payments), less any lease incentives receivable
- Variable lease payment that are based on an index or a rate
- Amounts expected to be payable by the lessee under residual value guarantees
- The exercise price of a purchase option if the lessee is reasonably certain to exercise that option, and
- Payments of penalties for terminating the lease, if the lease term reflects the lessee exercising that option
The lease payments are discounted using the interest rate implicit in the lease. If that rate cannot be determined, the lessee’s incremental borrowing rate is
used, being the rate that the lessee would have to pay to borrow the funds necessary to obtain an asset of similar value in a similar economic environment
with similar terms and conditions.
Right-of-use assets are measured at cost comprising the following:
- The amount of the initial measurement of lease liability
- Any lease payments made at or before the commencement date less any lease incentives received
- Any initial direct costs, and
- Restoration costs
However, short-term lease (lease that, at the commencement date, has a lease term of 12 months or less) and lease of low-value assets (For example,
underlying leased asset under $ 5,000) are permitted to elect exceptional conditions.
The right-of-use asset is depreciated over the shorter of the asset’s useful life and the lease term.
Related to sale and leaseback, an entity (seller-lessee) is required to applying IFRS 1115 ‘Revenue from Contracts with Customers’ to determine whether
the transfer of an asset is accounted for as a sale of that asset. However, the Group has not reassessed sale and leaseback transactions entered into before
the date of initial application.
Extension and termination options are included in a number of leases across the Group. These terms are used to maximize operational flexibility in terms
of managing contracts. The majority of extension and termination options held are exercisable only by the Group and not by the respective lessor. But the
Group is evaluating its application in accordance with the IFRIC’s decision about “lease term and useful life of leasehold Improvements”
Financial Section 105

3.23 Operating Segments
Operating segments are components of the Group where separate financial information is available and is evaluated regularly by the chief operating
decision maker in deciding how to allocate resources and in assessing performance.
Segment information includes items which are directly attributable and reasonably allocated to the segment.
3.24 Overlay Approach
The Group applies the overlay approach in accordance with Korean IFRS 1104, and financial asset is eligible for designation for the overlay approach if, and
only if, the following criteria are met:
- It is measured at fair value through profit or loss applying Korean IFRS 1109 but would not have been measured at fair value through profit or loss in its
entirety applying Korean IFRS 1039.
- It is not held in respect of an activity that is unconnected with contracts within the scope of Korean IFRS 1104.
The Group reclassifies between profit or loss and other comprehensive income, and the amount reclassified is equal to the difference between:
- The amount reported in profit or loss for the designated financial assets applying Korean IFRS 1109.
- The amount that would have been reported in profit or loss for the designated financial assets if the insurer had applied Korean IFRS 1039.
The Group is permitted to apply this approach either at initial recognition or it may subsequently designate financial assets that newly meet criterion of not
being held in respect of activity unconnected with insurance contract, they having previously not met that criterion.
The Group continues to apply the overlay approach to a designated financial asset until that financial asset is derecognized. However, the Group
de-designates a financial asset when the financial asset no longer meets the criterion. In this case, the Group reclassifies from accumulated other
comprehensive income to profit or loss as a reclassification adjustment any balance relating to that financial asset.
At the beginning of any annual period, the Group may stop applying the overlay approach to all designated financial assets, and shall not subsequently
apply the overlay approach, if it stops using this approach because it is no longer an insurer.
4. Financial Risk Management4.1 Summary
4.1.1 Overview of financial risk management policy
The financial risks that the Group is exposed to are credit risk, market risk, liquidity risk, operational risk and others.
The Group’s risk management system focuses on increasing transparency, developing the risk management environment, preventing transmission of risk to
other related subsidiaries, and the preemptive response to risk due to rapid changes in the financial environment to support the Group’s long-term strategy
and business decisions efficiently. Credit risk, market risk, liquidity risk, and operational risk have been recognized as the Group’s key risks. These risks are
measured and managed in Economic Capital or VaR (Value at Risk) using a statistical method.
4.1.2 Risk management organization
Risk Management Committee
The Risk Management Committee establishes risk management strategies in accordance with the directives of the Board of Directors and determines
the Group’s target risk appetite. The Committee approves significant risk matters and reviews the level of risks that the Group is exposed to and the
appropriateness of the Group’s risk management operations as an ultimate decision-making authority.
Risk Management Council
The Risk Management Council is a consultative group which reviews and makes decisions on matters delegated by the Risk Management Committee, and
discusses the detailed issues relating to the Group’s risk management.
Risk Management Division
The Risk Management Division is responsible for monitoring and managing the Group’s economic capital limit and managing detailed policies, procedures
and working processes relating to the Group’s risk management.
KB Financial Group Annual Report 2019106

4.2 Credit Risk
4.2.1 Overview of credit risk
Credit risk is the risk of possible losses in an asset portfolio in the event of a counterparty’s default, breach of contract and deterioration in the credit
quality of the counterparty. For risk management reporting purposes, the individual borrower’s default risk, country risk, specific risks and other credit risk
exposure components are considered as a whole.
The Group uses definition of default as defined and applied in the calculation of Capital Adequacy Ratio (Basel III) in accordance with the new Basel Accord.
4.2.2 Credit risk management
The Group measures expected losses and economic capital on assets that are subject to credit risk management whether on- or off-balance sheet items
and uses expected losses and economic capital as a management indicator. The Group manages credit risk by allocating credit risk economic capital limits.
In addition, the Group controls the credit concentration risk exposure by applying and managing total exposure limits to prevent an excessive risk
concentration to each industry and borrower.
The Group has organized a credit risk management team that focuses on credit risk management in accordance with the Group’s credit risk management
policy. Especially, the loan analysis department of Kookmin Bank, one of the subsidiaries, is responsible for loan policy, loan limit, loan review, credit
management, restructuring and subsequent event management, independently of operating department. On the other hand, risk management group of
Kookmin Bank is responsible for planning risk management policy, applying limits of credit lines, measuring the credit risk economic capital, adjusting credit
limits, reviewing credit and verifying credit evaluation models.
4.2.3 Maximum exposure to credit risk
The Group’s maximum exposures of financial instruments, excluding equity securities, to credit risk without consideration of collateral values as of
December 31, 2019 and 2018, are as follows:
Financial assetsDue from financial institutions at amortized cost1
Financial assets at fair value through profit or loss
Due from financial institutions
Securities
Loans
Financial instruments indexed to the price of gold
Derivatives
Loans at amortized cost1
Financial investments
Securities measured at fair value through other comprehensive income
Securities at amortized cost1
Loans measured at fair value through other comprehensive income
Other financial assets1
Off-balance sheet itemsAcceptances and guarantees contracts
Financial guarantee contracts
Commitments
2018
\ 17,216,288
381,719
48,285,482
954,176
78,808
2,025,962
319,201,603
35,243,634
23,661,522
389,822
8,133,556
455,572,572
7,277,136
3,626,532
138,590,372
149,494,040
\ 605,066,612
2019
\ 18,142,960
216,367
50,721,526
427,545
79,805
3,190,673
339,684,059
43,556,848
25,346,555
375,098
9,147,059
490,888,495
8,327,494
3,847,390
151,797,615
163,972,499
\ 654,860,994
(In millions of Korean won)
1 Due from financial institutions, loans and securities measured at amortized cost and other financial assets are net of allowance.
Financial Section 107

4.2.4 Credit risk of loans
The Group maintains an allowance for loan losses associated with credit risk on loans to manage its credit risk.
The Group assesses expected credit loss on financial asset at amortized cost and financial asset at fair value through other comprehensive income other
than financial asset at fair value through profit or loss and recognizes loss allowance. Expected credit losses are a probability-weighted estimate of possible
credit losses within certain range by reflecting reasonable and supportable information that is reasonably available at the reporting date without undue
cost or effort, including information about past events, current conditions and forecasts of future economic conditions. The Group assesses the expected
credit losses for loans categorized in financial assets at amortized cost, and presents it with the name of account ‘allowance for loan losses’ netting from
the related carrying amounts. For the expected credit losses for loans categorized in financial assets at fair value through other comprehensive income, the
Group presents it in other comprehensive income.
Loans as of December 31, 2019 and 2018 are classified as follows:
Loans at amortized cost1
CorporateGrade 1
Grade 2
Grade 3
Grade 4
Grade 5
RetailGrade 1
Grade 2
Grade 3
Grade 4
Grade 5
Credit cardGrade 1
Grade 2
Grade 3
Grade 4
Grade 5
Loans at fair value through other comprehensive income
CorporateGrade1
Grade2
Grade3
Grade4
Grade5
The financial instruments
applying 12-month expected credit
losses
\ 83,839,707
58,057,809
2,650,199
518,108
16,648
145,082,471
146,265,744
7,081,846
2,080,690
185,081
10,180
155,623,541
8,390,177
5,695,069
1,558,999
26,404
350
15,670,999
316,377,011
241,524
133,574
-
-
-
375,098
375,098
\ 316,752,109
Financial instruments not applying
expected credit losses
\ -
-
-
-
-
-
-
-
-
-
-
-
-
-
-
-
-
-
-
-
-
-
-
-
-
-
\ -
Total
\ 86,462,605
62,748,306
4,842,055
1,423,099
1,178,479
156,654,544
149,884,900
11,544,982
3,633,703
582,614
1,142,923
166,789,122
8,486,229
6,414,134
2,720,395
417,345
610,307
18,648,410
342,092,076
241,524
133,574
-
-
-
375,098
375,098
\ 342,467,174
Non-impaired
\ 2,621,898
4,683,445
2,187,662
900,386
355,893
10,749,284
3,611,001
4,433,832
1,541,647
387,811
587,448
10,561,739
96,052
719,065
1,161,396
390,941
135,630
2,503,084
23,814,107
-
-
-
-
-
-
-
\ 23,814,107
Impaired
\ 1,000
7,052
4,194
4,605
805,938
822,789
8,155
29,304
11,366
9,722
545,295
603,842
-
-
-
-
474,327
474,327
1,900,958
-
-
-
-
-
-
-
\ 1,900,958
The financial instruments applying lifetime expected
credit losses
2019
(In millions of Korean won)
1 Before netting of allowance.
KB Financial Group Annual Report 2019108

Loans at amortized cost1
CorporateGrade 1
Grade 2
Grade 3
Grade 4
Grade 5
RetailGrade 1
Grade 2
Grade 3
Grade 4
Grade 5
Credit cardGrade 1
Grade 2
Grade 3
Grade 4
Grade 5
Loans at fair value through other comprehensive income
CorporateGrade1
Grade2
Grade3
Grade4
Grade5
The financial instruments
applying 12-month expected credit
losses
\ 75,785,147
55,292,251
2,957,463
484,248
244,593
134,763,702
133,946,705
7,819,152
1,718,104
706,797
14,110
144,204,868
8,411,723
4,449,617
1,460,344
6,004
112
14,327,800
293,296,370
189,501
128,712
-
-
-
318,213
318,213
\ 293,614,583
Financial instruments not applying
expected credit losses
\ -
-
-
-
-
-
-
-
-
-
-
-
-
-
-
-
-
-
-
-
-
-
-
-
-
-
\ -
Total
\ 77,930,960
59,521,308
4,721,649
1,517,613
1,686,827
145,378,357
138,367,007
15,334,799
3,284,778
1,141,915
950,370
159,078,869
8,588,035
5,036,871
2,688,431
473,016
567,705
17,354,058
321,811,284
215,232
174,590
-
-
-
389,822
389,822
\ 322,201,106
Non-impaired
\ 2,144,175
4,227,041
1,757,607
965,094
378,588
9,472,505
4,411,122
7,497,880
1,559,980
421,800
447,064
14,337,846
176,312
587,254
1,228,087
467,012
148,149
2,606,814
26,417,165
25,731
45,878
-
-
-
71,609
71,609
\ 26,488,774
Impaired
\ 1,638
2,016
6,579
68,271
1,063,646
1,142,150
9,180
17,767
6,694
13,318
489,196
536,155
-
-
-
-
419,444
419,444
2,097,749
-
-
-
-
-
-
-
\ 2,097,749
The financial instruments applying lifetime expected
credit losses
2018
(In millions of Korean won)
1 Before netting of allowance.
Credit quality of loans graded according to internal credit ratings are as follows:
Grade 1
Grade 2
Grade 3
Grade 4
Grade 5
Range of Probability of Default (%)0.0 ~ 1.0
1.0 ~ 5.0
5.0 ~ 15.0
15.0 ~ 30.0
30.0 ~
Retail1 ~ 5 grade
6 ~ 8 grade
9 ~ 10 grade
11 grade
12 grade or under
CorporateAAA ~ BBB+
BBB ~ BB
BB- ~ B
B- ~ CCC
CC or under
Financial Section 109

Guarantees
Deposits and savings
Property and equipment
Real estate
The financial instruments
applying 12-month expected credit
losses
\ 70,183,658
4,478,032
10,014,552
155,769,901
\ 240,446,143
Total
\ 74,203,219
4,604,287
10,652,071
167,027,311
\ 256,486,888
Non-impaired
\ 3,839,736
118,221
582,109
10,839,595
\ 15,379,661
Impaired
\ 179,825
8,034
55,410
417,815
\ 661,084
The financial instruments applying lifetime expected
credit losses
2019
(In millions of Korean won)
Guarantees
Deposits and savings
Property and equipment
Real estate
The financial instruments
applying 12-month expected credit
losses
\ 60,473,663
4,200,448
8,644,719
147,682,808
\ 221,001,638
Total
\ 66,496,823
4,283,957
9,315,529
160,953,171
\ 241,049,480
Non-impaired
\ 5,871,980
77,024
616,318
12,828,076
\ 19,393,398
Impaired
\ 151,180
6,485
54,492
442,287
\ 654,444
The financial instruments applying lifetime expected
credit losses
2018
(In millions of Korean won)
The quantification of the extent to which collateral and other credit enhancements mitigate credit risk as of December 31, 2019 and 2018, are as follows:
4.2.5 Credit quality of securities
Financial assets at fair value through profit or loss and financial investments excluding equity securities that are exposed to credit risk as of December 31,
2019 and 2018 are as follows:
Securities at amortized cost1
Grade 1Grade 2Grade 3Grade 4Grade 5
Securities measured at fair value through other comprehensive income
Grade1Grade2Grade3Grade4Grade5
The financial instruments
applying 12-month expected credit
losses
\ 25,147,636157,881
42,710--
25,348,227
40,206,8563,337,327
12,665--
43,556,848\ 68,905,075
Financial instruments not applying
expected credit losses
\ ------
------
\ -
Total
\ 25,147,636157,881
42,710--
25,348,227
40,206,8563,337,327
12,665--
43,556,848\ 68,905,075
Non-impaired
\ ------
------
\ -
Impaired
\ ------
------
\ -
The financial instruments applying lifetime expected
credit losses
2019
(In millions of Korean won)
KB Financial Group Annual Report 2019110

Securities at amortized cost1
Grade 1Grade 2Grade 3Grade 4Grade 5
Securities measured at fair value through other comprehensive income
Grade1Grade2Grade3Grade4Grade5
The financial instruments
applying 12-month expected credit
losses
\ 23,524,120120,546
18,572--
23,663,238
32,498,1552,740,053
-2,510
-35,240,718
\ 58,903,956
Financial instruments not applying
expected credit losses
\ ------
------
\ -
Total
\ 23,524,120120,546
18,572--
23,663,238
32,498,1552,740,053
-2,5102,916
35,243,634\ 58,906,872
Non-impaired
\ ------
------
\ -
Impaired
\ ------
----
2,9162,916
\ 2,916
The financial instruments applying lifetime expected
credit losses
2018
(In millions of Korean won)
1 Before netting of allowance.
The credit qualities of securities, excluding equity securities according to the credit ratings by external rating agencies as of December 31, 2019 and 2018,
are as follows:
Credit qualities of debt securities denominated in Korean won are based on the lowest credit rating by the domestic credit rating agencies, and those
denominated in foreign currencies are based on the lowest credit rating by the foreign credit rating agencies.
4.2.6 Credit risk of due from financial institutions
The credit quality of due from financial institutions as of December 31, 2019 and 2018, is classified as follows:
Credit quality
Grade 1
Grade 2
Grade 3
Grade 4
Grade 5
KIS
AA0 to AAA
A- to AA-
BBB0 to BBB+
BB0 to BBB-
BB- or under
NICE P&I AA0 to AAA
A- to AA-
BBB0 to BBB+
BB0 to BBB-
BB- or under
KAP
AA0 to AAA
A- to AA-
BBB0 to BBB+
BB0 to BBB-
BB- or under
FnPricing Inc.
AA0 to AAA
A- to AA-
BBB0 to BBB+
BB0 to BBB-
BB- or under
S&P
A- to AAA
BBB- to BBB+
BB to BB+
B+ to BB-
B or under
Fitch-IBCA
A- to AAA
BBB- to BBB+
BB to BB+
B+ to BB-
B or under
Moody’sA3 to Aaa
Baa3 to Baa1
Ba2 to Ba1
B1 to Ba3
B2 or under
Domestic Foreign
Due from financial institutions at amortized cost1
Grade1Grade2Grade3Grade4Grade5
The financial instruments
applying 12-month expected credit
losses
\ 17,292,966149,927677,249
-13,991
\ 18,134,133
Financial instruments not applying
expected credit losses
-----
\ -
Total
\ 17,292,966149,927677,249
-27,530
\ 18,147,672
Non-impaired
----
13,179\ 13,179
Impaired
----
360\ 360
The financial instruments applying lifetime expected
credit losses
2019
(In millions of Korean won)
Financial Section 111

Due from financial institutions at amortized cost1
Grade1Grade2Grade3Grade4Grade5
The financial instruments
applying 12-month expected credit
losses
\ 16,374,868213,903608,314
19,5311,691
\ 17,218,307
Financial instruments not applying
expected credit losses
\ -----
\ -
Total
\ 16,374,868213,903608,314
19,5311,691
\ 17,218,307
Non-impaired
\ -----
\ -
Impaired
\ -----
\ -
The financial instruments applying lifetime expected
credit losses
2018
(In millions of Korean won)
1 Before netting of allowance.
The credit qualities of due from financial institutions according to the credit ratings by external rating agencies as of December 31, 2019 is same as the
credit qualities of securities, excluding equity securities.
4.2.7 Credit risk mitigation of derivatives
The quantification of the extent to which derivatives and other credit enhancements mitigate credit risk as of December 31, 2019 and 2018, are as follows:
4.2.8 Credit risk concentration analysis
Details of the Group’s loans by jurisdiction as of December 31, 2019 and 2018, are as follows:
(In millions of Korean won)
Deposits, savings, securities, etc.
2019\ 802,170
\ 802,170
2018\ 460,670
\ 460,670
Korea
Europe
China
Japan
United States
Others
Retail
\ 166,310,457
-
-
101
-
478,564
\ 166,789,122
Corporate
\ 149,149,657
1,118,429
3,135,501
647,956
2,333,269
1,072,375
\ 157,457,187
Credit card
\ 18,642,111
-
358
81
-
5,860
\ 18,648,410
Total
\ 334,102,225
1,118,429
3,135,859
648,138
2,333,269
1,556,799
\ 342,894,719
%
97.44
0.33
0.91
0.19
0.68
0.45
100.00
Allowances
\ (2,363,332)
(4,181)
(20,654)
(576)
(9,205)
(10,069)
\ (2,408,017)
Carrying amount
\ 331,738,893
1,114,248
3,115,205
647,562
2,324,064
1,546,730
\ 340,486,702
2019
(In millions of Korean won)
Korea
Europe
China
Japan
United States
Others
Retail
\ 158,760,865
-
-
106
-
317,898
\ 159,078,869
Corporate
\ 141,864,644
649,281
2,259,202
354,181
997,321
597,726
\ 146,722,355
Credit card
\ 17,346,224
-
807
60
6,967
-
\ 17,354,058
Total
\ 317,971,733
649,281
2,260,009
354,347
1,004,288
915,624
\ 323,155,282
%
98.40
0.20
0.70
0.11
0.31
0.28
100.00
Allowances
\ (2,574,236)
(512)
(20,570)
(1,900)
(5,706)
(6,757)
\ (2,609,681)
Carrying amount
\ 315,397,497
648,769
2,239,439
352,447
998,582
998,582
\ 320,545,601
2018
(In millions of Korean won)
1 The above is the Group’s loans at fair value through profit and loss, other comprehensive income or amortized cost.
KB Financial Group Annual Report 2019112

Financial institutions
Manufacturing
Service
Wholesale & Retail
Construction
Public sector
Others
Housing
General
Credit card
Housing
General
Credit card
Financial institutions
Manufacturing
Service
Wholesale & Retail
Construction
Public sector
Others
Loans
\ 16,405,404
43,265,607
65,277,701
18,593,540
3,679,798
1,250,909
8,984,228
\ 157,457,187
Loans
\ 78,102,637
88,686,485
18,648,410
\ 185,437,532
Loans
\ 70,916,004
88,162,865
17,354,058
\ 176,432,927
Loans
\ 14,193,442
42,672,986
61,467,174
16,739,852
3,282,508
873,281
7,493,112
\ 146,722,355
%
10.42
27.48
41.46
11.81
2.34
0.79
5.70
100.00
%
42.12
47.83
10.05
100.00
%
40.19
49.97
9.84
100.00
%
9.67
29.08
41.89
11.41
2.24
0.60
5.11
100.00
Allowances
\ (14,819)
(394,428)
(195,205)
(99,051)
(194,737)
(2,084)
(56,662)
\ (956,986)
Allowances
\ (34,395)
(676,927)
(739,709)
\ (1,451,031)
Allowances
\ (29,369)
(613,528)
(710,941)
\ (1,353,838)
Allowances
\ (45,473)
(449,406)
(270,846)
(102,197)
(291,211)
(3,301)
(93,409)
\ (1,255,843)
Carrying amount
\ 16,390,585
42,871,179
65,082,496
18,494,489
3,485,061
1,248,825
8,927,566
\ 156,500,201
Carrying amount
\ 78,068,242
88,009,558
17,908,701
\ 183,986,501
Carrying amount
\ 70,886,635
87,549,337
16,643,117
\ 175,079,089
Carrying amount
\ 14,147,969
42,223,580
61,196,328
16,637,655
2,991,297
869,980
7,399,703
\ 145,466,512
2019
2019
2018
2018
(In millions of Korean won)
(In millions of Korean won)
(In millions of Korean won)
(In millions of Korean won)
Details of the Group’s corporate loans by industry as of December 31, 2019 and 2018, are as follows:
Types of the Group’s retail and credit card loans as of December 31, 2019 and 2018, are as follows:
Financial Section 113
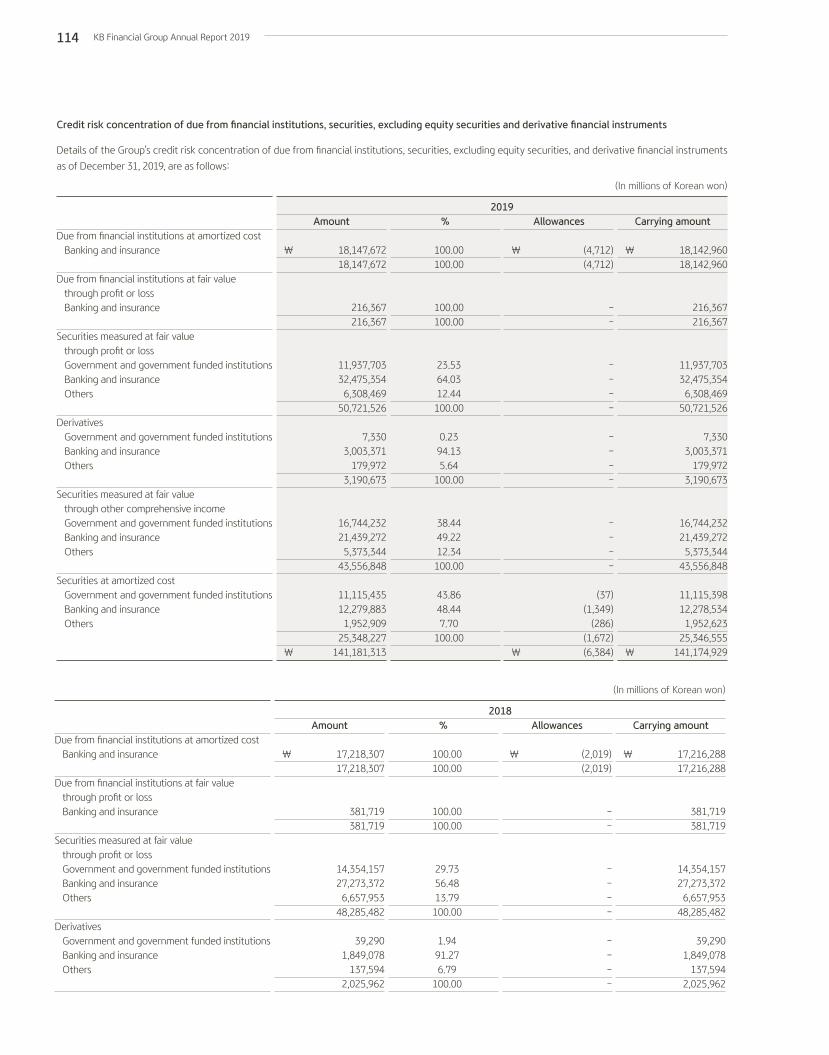
Due from financial institutions at amortized cost Banking and insurance
Due from financial institutions at fair value through profit or loss Banking and insurance
Securities measured at fair value through profit or loss Government and government funded institutions Banking and insurance Others
Derivatives Government and government funded institutions Banking and insurance Others
Securities measured at fair value through other comprehensive income Government and government funded institutions Banking and insurance Others
Securities at amortized cost Government and government funded institutions Banking and insurance Others
Amount
\ 18,147,67218,147,672
216,367216,367
11,937,70332,475,354
6,308,46950,721,526
7,3303,003,371
179,9723,190,673
16,744,23221,439,272
5,373,34443,556,848
11,115,43512,279,883
1,952,90925,348,227
\ 141,181,313
%
100.00100.00
100.00100.00
23.5364.0312.44
100.00
0.2394.135.64
100.00
38.4449.2212.34
100.00
43.8648.447.70
100.00
Allowances
\ (4,712)(4,712)
--
----
----
----
(37)(1,349)
(286)(1,672)
\ (6,384)
Carrying amount
\ 18,142,96018,142,960
216,367216,367
11,937,70332,475,354
6,308,46950,721,526
7,3303,003,371
179,9723,190,673
16,744,23221,439,272
5,373,34443,556,848
11,115,39812,278,534
1,952,62325,346,555
\ 141,174,929
2019
(In millions of Korean won)
Due from financial institutions at amortized cost Banking and insurance
Due from financial institutions at fair value through profit or loss Banking and insurance
Securities measured at fair value through profit or loss Government and government funded institutions Banking and insurance Others
Derivatives Government and government funded institutions Banking and insurance Others
Amount
\ 17,218,30717,218,307
381,719381,719
14,354,15727,273,372
6,657,95348,285,482
39,2901,849,078
137,5942,025,962
%
100.00100.00
100.00100.00
29.7356.4813.79
100.00
1.9491.276.79
100.00
Allowances
\ (2,019)(2,019)
--
----
----
Carrying amount
\ 17,216,28817,216,288
381,719381,719
14,354,15727,273,372
6,657,95348,285,482
39,2901,849,078
137,5942,025,962
2018
(In millions of Korean won)
Credit risk concentration of due from financial institutions, securities, excluding equity securities and derivative financial instruments
Details of the Group’s credit risk concentration of due from financial institutions, securities, excluding equity securities, and derivative financial instruments
as of December 31, 2019, are as follows:
KB Financial Group Annual Report 2019114

Securities measured at fair value
through other comprehensive income
Government and government funded institutions
Banking and insurance
Others
Securities at amortized cost
Government and government funded institutions
Banking and insurance
Others
Amount
9,504,156
21,210,983
4,528,495
35,243,634
10,321,667
11,424,418
1,917,153
23,663,238
\ 126,818,342
%
26.97
60.18
12.85
100.00
43.62
48.28
8.10
100.00
Allowances
-
-
-
-
(25)
(1,399)
(292)
(1,716)
\ (3,735)
Carrying amount
9,504,156
21,210,983
4,528,495
35,243,634
10,321,642
11,423,019
1,916,861
23,661,522
\ 126,814,607
2018
(In millions of Korean won)
Credit risk concentrations of due from financial institutions, securities, excluding equity securities and derivative financial instruments by country
Details of the Group’s credit risk concentration of due from financial institutions, securities, excluding equity securities, and derivative financial instruments
by country, as of December 31, 2019, is as follows:
Due from financial institutions at amortized costKoreaUnited StatesOthers
Due from financial institutions at fair value through profit or loss Korea
Securities measured at fair value through profit or loss Korea United States Others
Derivatives Korea United States France Others
Securities measured at fair value through other comprehensive income Korea United States Others
Securities at amortized cost Korea United States Others
Amount
\ 13,864,6871,318,5822,964,403
18,147,672
216,367216,367
46,413,061
1,939,3302,369,135
50,721,526
1,440,349529,956358,951861,417
3,190,673
40,948,853687,243
1,920,75243,556,848
22,591,5411,312,9411,443,745
25,348,227\ 141,181,313
%
76.407.27
16.33100.00
100.00100.00
91.513.824.67
100.00
45.1416.6111.2527.00
100.00
94.011.584.41
100.00
89.125.185.70
100.00
Allowances
\ (555)(1)
(4,156)(4,712)
--
----
-----
----
(1,034)(217)(421)
(1,672)\ (6,384)
Carrying amount
\ 13,864,1321,318,5812,960,247
18,142,960
216,367216,367
46,413,0611,939,3302,369,135
50,721,526
1,440,349529,956358,951861,417
3,190,673
40,948,853
687,2431,920,752
43,556,848
22,590,5071,312,7241,443,324
25,346,555\ 141,174,929
2019
(In millions of Korean won)
Financial Section 115

Due from financial institutions at amortized costKoreaUnited StatesOthers
Due from financial institutions at fair value through profit or loss Korea
Securities measured at fair value through profit or loss Korea United States Others
Derivatives Korea United States France Singapore Japan Others
Securities measured at fair value through other comprehensive income Korea United States Others
Securities at amortized cost Korea United States Others
Amount
\ 13,497,329826,660
2,894,31817,218,307
381,719381,719
43,697,7361,813,9022,773,844
48,285,482
1,024,392316,482237,080109,101
97,351241,556
2,025,962
33,156,0411,100,199
987,39435,243,634
21,175,7491,252,4261,235,063
23,663,238\ 126,818,342
%
78.394.80
16.81100.00
100.00100.00
90.503.765.74
100.00
50.5615.6211.705.394.81
11.92100.00
94.083.122.80
100.00
89.495.295.22
100.00
Allowances
\ (338)
(16)(1,665)(2,019)
--
----
-------
----
(1,136)(216)(364)
(1,716)\ (3,735)
Carrying amount
\ 13,496,991826,644
2,892,65317,216,288
381,719381,719
43,697,7361,813,9022,773,844
48,285,482
1,024,392316,482237,080109,101
97,351241,556
2,025,962
33,156,0411,100,199
987,39435,243,634
21,174,6131,252,2101,234,699
23,661,522\ 126,814,607
2018
(In millions of Korean won)
Due from financial institutions, financial assets at fair value through profit or loss and derivatives that are linked to gold price are mostly relevant to financial and insurance industry with high credit ratings.
4.3 Liquidity Risk
4.3.1 Overview of liquidity risk
Liquidity risk is a risk that the Group becomes insolvent due to uncertain liquidity caused by unexpected cash outflows, or a risk of borrowing high interest debts or disposal of liquid and other assets at a substantial discount. The Group manages its liquidity risk through analysis of the contractual maturity of interest-bearing assets and liabilities, assets and liabilities related to the other financing, and off-balance sheet items related to cash flow of currency derivative instruments and others.
Cash flows disclosed for the maturity analysis are undiscounted contractual principal and interest to be received (paid) and; thus, are not identical to the amount in the financial statements that are based on the present value of expected cash flows in some cases. The amount of interest to be received or paid on floating rate assets and liabilities is measured on the assumption that the current interest rate would be the same through the maturity.
4.3.2. Liquidity risk management and indicator
The liquidity risk is managed by risk management policy and liquidity risk management guidelines which are applied to the risk management policies and procedures that address all the possible risks that arise from the overall business of the Group.
The Group computes and manages cumulative liquidity gap and liquidity rate subject to all transactions that affect cash flow in Korean won and foreign currencies and off-balance sheet transactions in relation to the liquidity. The Group regularly reports to the Risk Planning Council and Risk Management Committee.
KB Financial Group Annual Report 2019116

4.3.3. Analysis of remaining contractual maturity of financial assets and liabilities
Cash flows disclosed below are undiscounted contractual principal and interest to be received (paid) and; thus, are not identical to the amount in the consolidated financial statements that are based on the present value of expected cash flows. The amount of interest to be received or paid on floating rate assets and liabilities is measured on the assumption that the current interest rate would be the same through the maturity.
The remaining contractual maturity of financial assets and liabilities, excluding derivatives held for cash flow hedging, as of December 31, 2019 and 2018, are as follows:
Financial assets Cash and due from financial institutions1
Financial assets at fair value through profit or loss Derivatives held for trading2
Derivatives held for fair value hedging3
Loans at amortized cost Financial investments4
Financial assets measured at fair value through other comprehensive income Securities at amortized cost
Other financial assets
On demand
₩ 5,323,332
52,488,545
3,008,598
-2,908,095
2,101,605
-71,528
₩ 65,901,703
Up to 1 month
₩ 1,038,805
446,069-
4,89233,042,040
526,465
1,002,1646,578,005
₩ 42,638,440
1-3
months
₩ 286,091
273,144-
20,21632,668,128
1,403,884
2,080,834179,790
₩ 36,912,087
3-12
months
₩ 822,123
187,821-
37,441125,125,270
6,761,533
5,700,5001,373,850
₩ 140,008,538
1-5
years
₩ 18,628
236,130-
41,40194,802,566
33,604,010
7,366,94540,243
₩ 136,109,923
Over 5 years
₩ -
1,011,289-
66,17696,757,198
4,506,581
15,888,34435,927
₩ 118,265,515
Total
₩ 7,488,979
54,642,9983,008,598
170,126
385,303,297
48,904,078
32,038,7878,279,343
₩ 539,836,206
December 31, 2019
(In millions of Korean won)
Financial liabilities Financial liabilities at fair value through profit or loss2
Financial liabilities designated at fair value through profit or loss2
Derivatives held for trading2
Derivatives held for fair value hedging3
Deposits5
Debts Debentures Lease liabilities Other financial liabilities
Off- balance sheet itemsCommitments6
Financial guarantee contract7
On demand
₩ 2,663,327
12,704,8262,842,950
-
141,821,9867,074,508
22,285256
114,320₩ 167,244,458
\ 151,797,615
3,847,390\ 155,645,005
Up to 1 month
₩ -
--
14,76417,180,49212,341,516
2,652,73019,304
17,663,385₩ 49,872,191
---
1-3
months
₩ -
--
15,58827,300,542
3,057,9803,812,476
35,730187,976
₩ 34,410,292
---
3-12
months
₩ -
--
1,652110,410,809
8,994,81711,062,873
137,419212,059
₩ 130,819,629
---
1-5
years
₩ -
--
20,04410,804,440
4,950,29432,477,672
318,781693,921
₩ 49,265,152
---
Over 5 years
₩ -
--
1292,354,5041,763,2343,515,716
66,032119,637
₩ 7,819,252
---
Total
₩ 2,663,327
12,704,8262,842,950
52,177309,872,773
38,182,34953,543,752
577,52218,991,298
₩ 439,430,974
₩ 151,797,6153,847,390
₩ 155,645,005
December 31, 2019
(In millions of Korean won)
1 The amounts of \ 13,394,627 million, which is restricted due from the financial institutions as of December 31, 2019, is excluded.2 Financial liabilities measured or designated at fair value through profit or loss and derivatives held for trading are not managed by contractual maturity because they are
expected to be traded or redeemed before maturity. Therefore, the carrying amounts of those financial instruments are classified as ‘on demand’ category.3 Cash flows of derivative instruments held for hedging are shown at net cash flow by remaining contractual maturity.4 The equity securities designated as financial assets measured at fair value through other comprehensive income are are included under the ‘On demand’ category as they
can be disposed without difficulty. However, the equity securities restricted from disposal are included on the category that the releasing date of restriction is belonged to.5 Deposits that are contractually repayable on demand or on short notice are classified under the ‘on demand’ category.6 Commitments are included under the ‘On demand’ category because payments will be made upon request.7 The financial guarantee contracts are included under the ‘On demand’ category as payments will be made upon request.
Financial Section 117

Financial assets Cash and due from
financial institutions1
Financial assets at fair value
through profit or loss
Derivatives held for trading2
Derivatives held
for fair value hedging3
Loans at amortized cost
Financial investments4
Financial assets measured
at fair value through other
comprehensive income
Securities at amortized cost
Other financial assets
On demand
₩ 5,636,123
50,139,812
1,915,532
-
3,180,412
2,117,560
-
89,890
₩ 63,079,329
Up to 1 month
₩ 1,481,598
672,326
-
4,344
27,520,126
1,812,270
1,245,353
5,454,381
₩ 38,190,398
1-3 months
₩ 242,353
162,459
-
1,724
32,374,297
2,694,083
1,483,667
160,182
₩ 37,118,765
3-12 months
₩ 538,579
254,632
-
17,948
116,479,553
11,210,903
4,412,816
1,488,164
₩ 134,402,595
1-5 years
₩ 81,646
215,436
-
21,367
84,600,284
18,626,405
8,932,468
53,425
₩ 112,531,031
Over 5 years
₩ -
1,113,694
-
40,830
102,789,366
2,728,392
14,380,433
37,841
₩ 121,090,556
Total
₩ 7,980,299
52,558,359
1,915,532
86,213
366,944,038
39,189,613
30,454,737
7,283,883
₩ 506,412,674
December 31, 2018
(In millions of Korean won)
Financial liabilities Financial liabilities at fair
value through profit or loss2
Financial liabilities designated
at fair value through
profit or loss2
Derivatives held for trading2
Derivatives held for fair
value hedging3
Deposits5
Debts
Debentures
Other financial liabilities
Off- balance sheet items Commitments6
Financial guarantee contract7
On demand
₩ 2,823,820
12,503,039
2,724,994
-
126,781,682
5,909,297
30,160
91,381
₩ 150,864,373
₩ 138,590,372
3,626,532
₩ 142,216,904
Up to 1 month
₩ -
-
-
(2,403)
16,852,129
10,355,022
1,699,165
15,943,018
₩ 44,846,931
₩ -
-
₩ -
1-3 months
₩ -
-
-
(8,231)
28,053,517
3,975,372
5,875,093
170,851
₩ 38,066,602
₩ -
-
₩ -
3-12 months
₩ -
-
-
(37,851)
95,568,339
7,205,116
13,471,021
275,135
₩ 116,481,760
₩ -
-
₩ -
1-5 years
₩ -
-
-
13,831
11,284,243
4,714,743
32,474,579
581,537
₩ 49,068,933
₩ -
-
₩ -
Over 5 years
₩ -
-
-
31
2,608,630
1,249,785
2,489,146
65,721
₩ 6,413,313
₩ -
-
₩ -
Total
₩ 2,823,820
12,503,039
2,724,994
(34,623)
281,148,540
33,409,335
56,039,164
17,127,643
₩ 405,741,912
₩ 138,590,372
3,626,532
₩ 142,216,904
December 31, 2018
(In millions of Korean won)
1 The amounts of \ 12,394,461 million, which is restricted due from the financial institutions as of December 31, 2018, is excluded.2 Financial liabilities measured or designated at fair value through profit or loss and derivatives held for trading are not managed by contractual maturity because they are
expected to be traded or redeemed before maturity. Therefore, the carrying amounts of those financial instruments are classified as ‘on demand’ category.3 Cash flows of derivative instruments held for hedging are shown at net cash flow by remaining contractual maturity.4 The equity securities designated as financial assets measured at fair value through other comprehensive income are are included under the ‘On demand’ category as they
can be disposed without difficulty. However, the equity securities restricted from disposal are included on the category that the releasing date of restriction is belonged to.5 Deposits that are contractually repayable on demand or on short notice are classified under the ‘on demand’ category.6 Commitments are included under the ‘On demand’ category because payments will be made upon request.7 The financial guarantee contracts are included under the ‘On demand’ category as payments will be made upon request.
KB Financial Group Annual Report 2019118

Net cash flow of net-settled
derivatives
Cash flow to be received of
gross-settled derivatives
Cash flow to be paid of
gross-settled derivatives
Net cash flow of net-settled
derivatives
Cash flow to be received of
gross-settled derivatives
Cash flow to be paid of
gross-settled derivatives
Up to 1 month
\ (639)
14,119
(18,171)
Up to 1 month
\ (172)
47,526
(50,281)
1-3months
\ (1,831)
200,170
(199,141)
1-3months
\ 1,999
129,826
(137,834)
3-12 months
\ (5,021)
657,909
(671,375)
3-12 months
\ 2,743
286,219
(286,165)
1-5 years
\ (10,602)
1,888,772
(1,955,650)
1-5 years
\ 1,949
2,116,253
(2,151,808)
Over 5 years
\ 1,084
-
-
Over 5 years
\ (66)
-
-
Total
\ (17,009)
2,760,970
(2,844,337)
Total
\ 6,453
2,579,824
(2,626,088)
2019
2018
(In millions of Korean won)
(In millions of Korean won)
The contractual cash flows of derivatives held for cash flow hedging as of September 30, 2019 and December 31, 2018, are as follows:
4.4 Market Risk
4.4.1 Concept
Market risk represents possible losses which arise from changes in market factors including interest rate, stock price, foreign exchange rate and other
market factors that affect the fair value or future cash flows of financial instruments including securities and derivatives amongst others. The most
significant risk associated with trading positions interest rate risks, currency risks and also, stock price risks. In addition, the Group is exposed to interest
rate risks associated with non-trading positions. The Group classifies exposures to market risk into either trading or non-trading positions. The Group
measures and manages market risk separately for each subsidiary.
4.4.2 Risk management
The Group sets internal capital limits for market risk and interest rate risk and monitors the risks to manage the risk of trading and non-trading positions.
The Group maintains risk management systems and procedures including trading policies and procedures, and market risk management guidelines for
trading positions, and interest rate risk management guidelines for non-trading positions in order to manage market risk efficiently. The procedures
mentioned are implemented with approval from the Risk Management Committee and Risk Management Council.
Kookmin Bank, one of the subsidiaries, establishes market risk management policy, sets position limits, loss limits and VaR limits of each business group and
approves newly developed instruments through its Risk Management Council. The Market Risk Management Committee, which is chaired by the Chief Risk
Officer (CRO), is the decision maker and sets position limits, loss limits, VaR limits, sensitivity limits and scenario loss limits for each division, at the level of
each individual business department.
The ALCO of Kookmin Bank determines the operational standards of interest and commission, the details of the establishment and prosecution of the Asset
Liability Management (ALM) policies and enacts and amends relevant guidelines. The Risk Management Committee and Risk Management Council monitor
the establishment and enforcement of ALM risk management policies, and enact and amend ALM risk management guidelines. The interest rate risk limit
is set based on the future assets/liabilities position and interest rate volatility estimation reflects the annual work plan. The ALM Department and Risk
Management Department measures and monitors the interest risk status and limits on a regular basis. The status and limits of interest rate risks including
interest gap, duration gap and interest rate VaR (Value at Risk), are reported to the ALCO and Risk Management Council on a monthly basis and to the
Risk Management Committee on a quarterly basis. To ensure adequacy of interest rate and liquidity risk management, the Risk Management Department
assigns the limits, monitors and reviews the risk management procedures and tasks conducted by the ALM Department. Also, the Risk Management
Department independently reports related information to the management.
Financial Section 119

4.4.3 Trading Position
Definition of a trading position
Trading positions subject to market risk management are defined under the Trading Policy and Guideline, and the basic requirements are as follows:
– The trading position is not restricted for sale, is measured daily at fair value, and its significant inherent risks are able to be hedged in the market.
– The criteria for classification as a trading position are clearly defined in the Trading Policy and Guideline, and separately managed by the trading department.
– The trading position is operated in accordance with the documented trading strategy and managed through position limits.
– The operating department or professional dealers have an authority to enforce a deal on the trading position within predetermined limits without pre-approval.
– The trading position is reported periodically to management for the purpose of the Group’s risk management
Observation method on market risk arising from trading positions
Subsidiaries of the Group calculate VaR to measure the market risk by using market risk management systems on the entire trading portfolio. Generally, the
Group manages market risk on the trading portfolio. In addition, the Group controls and manages the risk of derivative trading based on the regulations and
guidelines formulated by the Financial Supervisory Service.
VaR (Value at Risk)
i. VaR (Value at Risk)
Kookmin Bank, one of the subsidiaries, uses the value-at-risk methodology to measure the market risk of trading positions. Kookmin Bank uses the 10-day
VaR, which estimates the maximum amount of loss that could occur in ten days under an historical simulation model which is considered to be a full
valuation method. The distributions of portfolio’s value changes are estimated based on the data over the previous 250 business days, and ten-day VaR is
calculated by subtracting net present market value from the value measured at a 99% confident level of portfolio’s value distribution results.
VaR is a commonly used market risk measurement technique. However, the method has some shortcomings. VaR estimates possible losses
over a certain period at a particular confidence level using past market movement data. Past market movements are, however, not necessarily
a good indicator of future events, as there may be conditions and circumstances in the future that the model does not anticipate. As a result,
the timing and magnitude of the actual losses may vary depending on the assumptions made at the time of the calculation. In addition, the
time periods used for the model, generally one or ten days, are assumed to be a sufficient holding period before liquidating the relevant
underlying positions. If these holding periods are not sufficient, or too long, the VaR results may understate or overstate the potential loss.
A subsidiary which holds trading positions uses an internal model (VaR) to measure general risk, and a standard method to measure each individual risk.
When the internal model is not permitted for certain market risk, the Group uses the standard method. Therefore, the market risk VaR may not reflect
the market risk of each individual risk and some specific positions. And also, non-banking subsidiaries use the same standard method applied to measure
regulatory capital for improvement of market risk VaR management utility (improvement of relation with regulatory capital).
ii. Back-Testing
Back-testing is conducted on a daily basis to validate the adequacy of the market risk model. In back-testing, the Group compares both the actual and
hypothetical profit and loss with the VaR calculations.
iii. Stress Testing
Stress testing is carried out to analyze the impact of abnormal market situations on the trading and available-for-sale portfolio. It reflects changes in
interest rates, stock prices, foreign exchange rates, implied volatilities of derivatives and other risk factors that have significant influence on the value of the
portfolio. The Group uses historical scenarios and hypothetical scenarios for the analysis of abnormal market situations. Stress testing is performed at least
once every year.
VaR at a 99% confidence level of interest rate, stock price and foreign exchange rate risk for trading positions with a ten-day holding period by a subsidiary
as of December 31, 2019 and 2018, are as follows:
Interest rate risk
Stock price risk
Foreign exchange rate risk
Deduction of diversification effect
Total VaR
Average
\ 11,190
3,434
15,760
\ 17,545
Minimum
\ 1,725
2,402
11,416
\ 13,641
Maximum
\ 20,467
4,310
20,704
\ 24,849
Ending
\ 16,628
3,914
13,081
(13,246)
\ 20,377
2019
(In millions of Korean won)Kookmin Bank
KB Financial Group Annual Report 2019120

Meanwhile, the required equity capital using the standardized method related to the positions which are not measured by VaR or the non-banking
subsidiaries as of December 31, 2019 and 2018, are as follows:
Interest rate risk
Stock price risk
Foreign exchange rate risk
2019\ 83,731
1,954
1,850
\ 87,535
2018\ 112,153
19,756
1,339
\ 133,248
(In millions of Korean won)
Interest rate riskStock price riskForeign exchange rate riskDeduction of diversification effectTotal VaR
Average
\ 12,5132,9959,443
\ 16,221
Minimum
\ 6,0441,2535,033
\ 11,653
Maximum
\ 18,6844,831
16,453
\ 23,078
Ending
\ 7,0743,348
16,453(11,939)
\ 14,936
2018
(In millions of Korean won)
Kookmin Bank
Interest rate riskStock price riskForeign exchange rate riskCommodity risk
Interest rate risk
Stock price risk
Interest rate risk
Stock price risk
Interest rate riskStock price riskForeign exchange rate riskCommodity risk
Average
\ 520,681248,183
15,7853
\ 784,652
Average
\ 3,418
23,293
\ 26,711
Average
\ 43,431
11,074
\ 54,505
Average
\ 456,847293,623
5,9235
\ 756,398
Minimum
\ 460,539217,149
7,5781
\ 685,267
Minimum
\ 2,201
16,153
\ 18,354
Minimum
\ 34,202
8,484
\ 42,686
Minimum
\ 366,027236,329
2,3831
\ 604,740
Maximum
\ 563,991282,584
23,67420
\ 870,269
Maximum
\ 4,904
27,550
\ 32,454
Maximum
\ 48,456
15,053
\ 63,509
Maximum
\ 537,126335,900
12,61322
\ 885,661
Ending
\ 563,991270,443
21,4181
\ 855,853
Ending
\ 3,252
26,140
\ 29,392
Ending
\ 45,180
14,769
\ 59,949
Ending
\ 510,618261,341
3,6921
\ 775,652
2019
2019
2018
2018
(In millions of Korean won)
(In millions of Korean won)
(In millions of Korean won)
(In millions of Korean won)
KB Securities Co., Ltd.
KB Insurance Co., Ltd.
Financial Section 121

Interest rate risk
Interest rate risk
Average
\ 2,630
\ 2,630
Average
\ 1,264
\ 1,264
Minimum
\ 1,295
\ 1,295
Minimum
\ 968
\ 968
Maximum
\ 3,597
\ 3,597
Maximum
\ 1,544
\ 1,544
Ending
\ 2,038
\ 2,038
Ending
\ 1,134
\ 1,134
2019
2018
(In millions of Korean won)
(In millions of Korean won)
KB Life Insurance Co., Ltd.
Foreign exchange rate risk
Average
\ 7,452
\ 7,452
Minimum
\ 4,072
\ 4,072
Maximum
\ 10,480
\ 10,480
Ending
\ 9,988
\ 9,988
2019
(In millions of Korean won)KB Investment Co., Ltd.
Stock price risk
Foreign exchange rate risk
Average
\ 23
2,064
\ 2,087
Minimum
\ -
1,776
\ 1,776
Maximum
\ 56
3,033
\ 3,089
Ending
\ -
3,033
\ 3,033
2018
(In millions of Korean won)
Interest rate risk
Stock price risk
Foreign exchange rate risk
Average
\ 417
3,456
825
\ 4,698
Minimum
\ 202
1,965
362
\ 2,529
Maximum
\ 1,238
6,248
1,427
\ 8,913
Ending
\ 509
6,248
362
\ 7,119
2019
(In millions of Korean won)
Interest rate risk
Stock price risk
Foreign exchange rate risk
Average
\ 777
1,658
782
\ 3,217
Minimum
\ 21
-
627
\ 648
Maximum
\ 1,886
1,952
1,125
\ 4,963
Ending
\ 1,043
1,839
837
\ 3,719
2018
(In millions of Korean won)
KB Asset Management Co., Ltd.
KB Financial Group Annual Report 2019122

Details of risk factors
i. Interest rate risk
Trading position interest rate risk usually arises from debt securities denominated in Korean won. The Group’s trading strategy is to benefit from short-term
movements in the prices of debt securities arising from changes in interest rates. The Group manages interest rate risk on trading positions using market
value-based tools such as VaR and sensitivity analysis (Price Value of a Basis Point: PVBP).
ii. Stock price risk
Stock price risk only arises from trading securities denominated in Korean won as the Group does not have any trading exposure to shares denominated in
foreign currencies. The trading securities portfolio in Korean won are composed of exchange-traded stocks and derivative instruments linked to stock with
strict limits on diversification.
iii. Foreign exchange rate risk
Foreign exchange rate risk arises from holding assets and liabilities denominated in foreign currency and foreign currency derivatives. Net foreign currency
exposure mostly occurs from the foreign assets and liabilities which are denominated in US dollars and Chinese Yuan. The Group sets both loss limits and
net foreign currency exposure limits and manages comprehensive net foreign exchange exposures which consider both trading and non-trading portfolios.
4.4.4 Non-trading position
Definition of non-trading position
Managed interest rate risk in non-trading position includes on- or off-balance sheet assets, liabilities and derivatives that are sensitive to interest rate,
except trading position for market risk. The interest rate sensitive assets and liabilities are interest-bearing assets and liabilities that create interest income
and expenses.
Observation method on market risk arising from non-trading position
As a qualitative methodology, interest rate risk arises from a change in equity and earnings caused by fluctuation in value of interest rate sensitive assets
and liabilities, and these risks are measured with change in Economic Value of Equity (△EVE) or interest rate VaR and change in Net Interest Income (△NII).
In addition, as a quantitative methodology, average and longest maturity of interest rate revision for non-maturity deposits are monitored by the Group.
Interest rate risk levels
i. Subsidiary Kookmin Bank
Kookmin Bank calculates △EVE by applying six types of rate shock and crisis scenarios, and △NII by applying parallel rise and decline impact scenarios. The
results as at December 31, 2019 are as follows:
Scenario 1 (Parallel rise)Scenario 2 (Parallel decline)Scenario 3 (Short-term decline, long-term rise)Scenario 4 (Short-term rise, long-term decline)Scenario 5 (Short-term rise)Scenario 6 (Short-term decline)Maximum of Scenarios 1-6Basic capital
Changes in the Economic Value of Equity
483,207 31,718
257,756 411,237378,380492,047492,047
27,609,684
Changes in Net Interest Income
152,013 9,717
- ---
152,013 -
2019
(In millions of Korean won)
(*) As of the end of December 2019, interest rate risk was calculated by different method from the previous disclosure due to the revision of the Detailed Supervisory Regulations
on Banking Business.
The results of previous method as at December 31, 2018 are as follows:
Interest Rate VaR
2018168,282
(In millions of Korean won)
Financial Section 123

ii. Non-bank Subsidiaries
Interest rate VaR is the maximum possible loss due to interest rate risk under a normal distribution at a 99.9% confidence level. The measurement results of
risk as of December 31, 2019 and 2018, are as follows:
KB Securities Co., Ltd.KB Insurance Co.,Ltd.KB Kookmin Card Co., Ltd.KB Life Insurance Co., Ltd.KB Savings Bank Co., Ltd.KB Capital Co., Ltd.
2019 ₩ 20,605
345,29249,87856,214
6,51033,038
2018 ₩ 23,004
270,50727,89447,089
8,76019,852
(In millions of Korean won)
4.4.5 Financial Instruments in Foreign Currencies
Details of financial instruments presented in foreign currencies translated into Korean won as of December 31, 2019 and 2018, are as follows:
Financial assets Cash and due from
financial institutions
Financial assets at fair value
through profit or loss
Derivatives held for trading
Derivatives held for hedging
Loans at amortized cost
Financial assets measured
at fair value through other
comprehensive income
Financial assets at amortized cost
Other financial assets
Financial liabilities Financial liabilities designated at
fair value through profit or loss
Derivatives held for trading
Derivatives held for hedging
Deposits
Debts
Debentures
Other financial liabilities
Off-balance sheet items
JPY
\ 354,484
43,124
22,729
-
484,087
21,267
-
230,542
\ 1,156,233
\ -
39,050
-
766,720
125,096
-
60,029
\ 990,895
\ 32,694
USD
\ 2,581,674
6,275,426
244,010
83,610
14,478,537
4,643,921
2,380,000
1,619,738
\ 32,306,916
\ 2,754,602
351,394
35,538
12,266,565
9,399,828
5,007,285
2,556,502
\ 32,371,714
\ 18,702,327
EUR
\ 377,651
610,820
25,226
-
795,285
71,078
304,484
313,363
\ 2,497,907
\ -
36,018
-
791,638
419,155
-
101,289
\ 1,348,100
\ 176,756
GBP
\ 128,600
23,034
698
-
178,628
-
-
18,237
\ 349,197
\ -
-
-
45,892
408,918
-
22,531
\ 477,341
\ -
CNY
\ 1,207,769
6,131
6,786
-
1,205,297
282,390
97,845
186,607
\ 2,992,825
\ -
7,806
-
1,477,097
15,092
-
190,841
\ 1,690,836
\ 252,369
Others
\ 840,250
149,188
48,396
-
991,445
39,186
101,958
195,691
\ 2,366,114
\ -
67,809
-
560,939
247,943
338,225
254,876
\ 1,469,792
\ 257,881
Total
\ 5,490,428
7,107,723
347,845
83,610
18,133,279
5,057,842
2,884,287
2,564,178
\ 41,669,192
\ 2,754,602
502,077
35,538
15,908,851
10,616,032
5,345,510
3,186,068
\ 38,348,678
\ 19,422,027
December 31, 2019
(In millions of Korean won)
KB Financial Group Annual Report 2019124

Financial assets Cash and due from
financial institutions
Financial assets at fair value
through profit or loss
Derivatives held for trading
Derivatives held for hedging
Loans at amortized cost
Financial assets measured
at fair value through other
comprehensive income
Financial assets at amortized cost
Other financial assets
Financial liabilities Financial liabilities designated at
fair value through profit or loss
Derivatives held for trading
Derivatives held for hedging
Deposits
Debts
Debentures
Other financial liabilities
Off-balance sheet items
JPY
\ 417,682
87,764
2,947
-
354,111
36,538
-
300,116
\ 1,199,158
\ -
39,311
-
629,083
90,778
-
105,798
864,970
\ 32,619
USD
\ 1,950,546
6,025,782
163,064
32,996
12,372,434
3,925,922
2,257,057
1,528,235
\ 28,256,036
\ 2,319,369
313,303
88,367
9,294,189
9,427,662
4,405,842
959,797
26,808,529
\ 15,211,436
EUR
\ 594,103
432,047
31,370
-
807,019
32,842
287,732
24,511
\ 2,209,624
\ -
143,836
-
592,495
286,123
31,979
136,053
1,190,486
\ 1,262
GBP
\ 120,795
18,481
308
-
45,335
-
-
28,080
\ 212,999
\ -
90
-
48,418
220,150
-
3,659
272,317
\ -
CNY
\ 1,145,607
8,585
4,643
-
990,705
125,571
38,802
275,578
\ 2,589,491
\ -
4,062
-
1,267,102
11,393
-
284,498
1,567,055
\ 270,018
Others
\ 679,759
73,759
18,349
-
515,051
4,261
27,554
234,086
\ 1,552,819
\ -
168,339
-
468,615
65,412
266,935
159,649
1,128,950
\ 228,238
Total
\ 4,908,492
6,646,418
220,681
32,996
15,084,655
4,125,134
2,611,145
2,390,606
\ 36,020,127
\ 2,319,369
668,941
88,367
12,299,902
10,101,518
4,704,756
1,649,454
31,832,307
\ 15,743,573
December 31, 2018
(In millions of Korean won)
4.5 Operational Risk
4.5.1 Concept
The Group defines operational risk broadly to include all financial and non-financial risks that may arise from operating activities and could cause a negative
effect on capital.
4.5.2 Risk management
The purpose of operational risk management is not only to comply with supervisory and regulatory requirements but also to promote a risk management
culture, strengthen internal controls, innovate processes and provide timely feedback to management and employees. In addition, Kookmin Bank
established Business Continuity Plans (BCP) to ensure critical business functions can be maintained, or restored, in the event of material disruptions arising
from internal or external events. It has constructed replacement facilities as well as has carried out exercise drills for head office and IT departments to test
its BCPs.
4.6 Capital Adequacy
The Group complies with the capital adequacy standard established by the Financial Services Commission. The capital adequacy standard is based on Basel
III published by Basel Committee on Banking Supervision in Bank of International Settlements in June 2011 and was implemented in Korea in December
2013. The Group is required to maintain a minimum Common Equity Tier 1 ratio of at least 8.0%(2018: 7.125%), a minimum Tier 1 ratio of :9.5%(2018: 8.625%)
and a minimum Total Regulatory Capital of 11.5%(2018:10.625%) as of December 31, 2019.
The Group’s equity capital is classified into three categories in accordance with the Supervisory Regulations and Detailed Supervisory Regulations on
Financial Holding Companies:
Financial Section 125

- Common Equity Tier 1 Capital: Common equity Tier 1 Capital represents the issued capital that takes the first and proportionately greatest share of any
losses and represents the most subordinated claim in liquidation of the Group, and not repaid outside of liquidation. It includes common shares issued,
capital surplus, retained earnings, non-controlling interests of consolidated subsidiaries, accumulated other comprehensive income, other capital surplus
and others.
- Additional Tier 1 Capital: Additional Tier 1 Capital includes (i) perpetual instruments issued by the Group that meet the criteria for inclusion in Additional
Tier 1 capital, and (ii) stock surplus resulting from the issue of instruments included in Additional Tier 1 capital and others.
- Tier 2 Capital: Tier 2 Capital represents the capital that takes the proportionate share of losses in the liquidation of the Group. Tier 2 Capital includes a
fund raised by issuing subordinated debentures maturing in not less than five years that meet the criteria for inclusion in Additional Tier 2 capital, and
the allowance for loan losses which are accumulated for assets classified as normal or precautionary as a result of classification of asset soundness in
accordance with Regulation on Supervision of Financial Holding Companies and others.
Risk weighted asset means the inherent risks in the total assets held by the Group. The Group calculates risk weighted asset by each risk (credit risk, market
risk, and operational risk) based on the Supervisory Regulations and Detailed Supervisory Regulations on Financial Holding Companies and uses it for BIS
ratio calculation.
The Group assesses and monitors its adequacy of capital by using the internal assessment and management policy of the capital adequacy. The
assessment of the capital adequacy is conducted by comparing available capital (actual amount of available capital) and internal capital (amount of capital
enough to cover all significant risks under target credit rate set by the Group). The Group monitors the soundness of finance and provides risk adjusted
basis for performance review using the assessment of the capital adequacy.
Internal Capital is the amount of capital to prevent the inability of payment due to unexpected loss in the future. The Group measures, allocates and
monitors internal capital by risk type and subsidiaries.
The Risk Management Council of the Group determines the Group’s risk appetite and allocates internal capital by risk type and subsidiary. Each subsidiary
efficiently operates its capital within a range of allocated internal capital. The Risk Management Department of the Group monitors the limit on internal
capital and reports the results to management and the Risk Management Council. The Group maintains the adequacy of capital through proactive review
and approval of the Risk Management Committee when the internal capital is expected to exceed the limits due to new business or business expansion.
Details of the Group’s capital adequacy calculation in line with Basel III requirements as of December 31, 2019 and 2018, are as follows:
5. Segment Information5.1 Overall Segment Information and Business Segments
The Group classifies reporting segments based on the nature of the products and services provided, the type of customer, and the Group’s management organization.
Equity Capital: Tier 1 Capital Common Equity Tier 1 Capital Additional Tier 1 Capital Tier 2 CapitalRisk-weighted assets:Equity Capital (%): Tier 1 Capital (%) Common Equity Tier 1 Capital (%)
Banking Business
Securities BusinessNon-life Insurance BusinessCredit Card Business
Life Insurance Business
Corporate Banking
Retail BankingOther Banking Services
2019 \ 36,995,181
35,426,11434,709,873
716,2411,569,067
255,549,02014.4813.8613.58
Loans, deposit products and other related financial services to large, small and medium-sized
enterprises and SOHO(small office home office)s.
Loans, deposit products and other related financial services to individuals and households.
Trading activities in securities and derivatives, funding and other supporting activities.
Investment banking, brokerage services and other supporting activities.
The activities within this segment include property insurance and other supporting activities.
The activities within this segment include credit sale, cash service, card loan and other
supporting activities.
Life insurance and other supporting activities.
2018 \ 34,476,172
32,993,82632,993,826
-1,482,346
236,099,01714.6013.9713.97
(In millions of Korean won)
KB Financial Group Annual Report 2019126
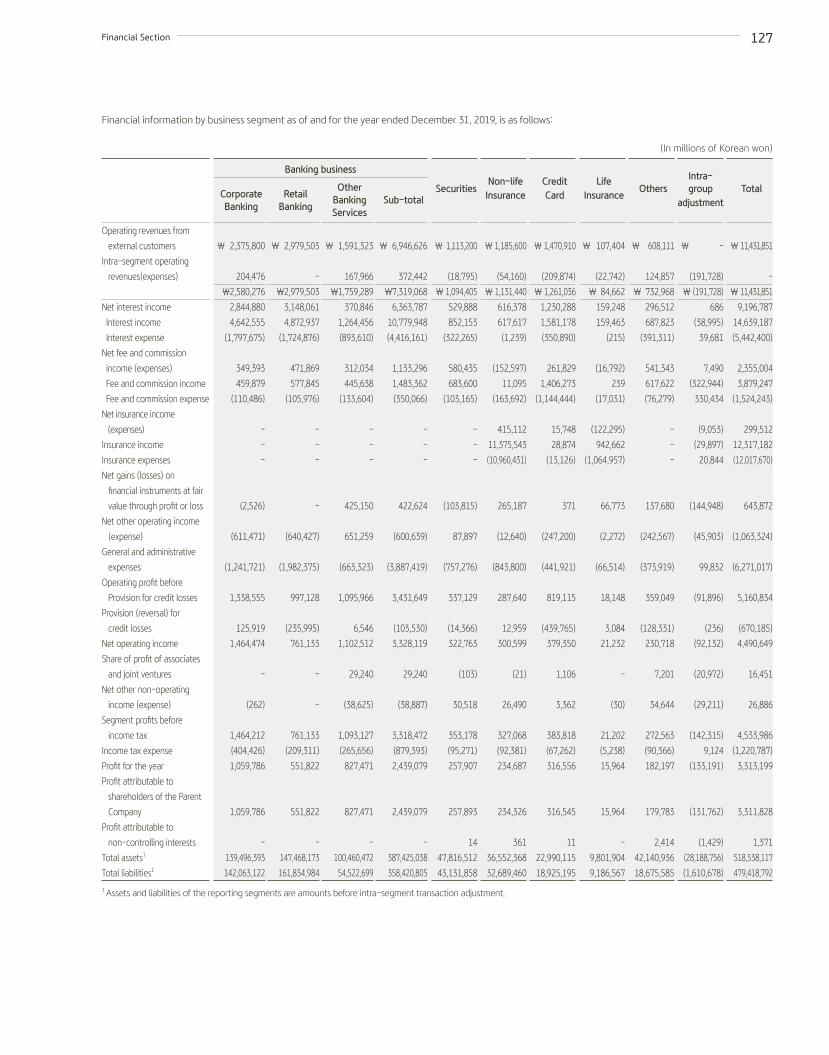
Financial information by business segment as of and for the year ended December 31, 2019, is as follows:
Operating revenues from
external customers
Intra-segment operating
revenues(expenses)
Net interest income
Interest income
Interest expense
Net fee and commission
income (expenses)
Fee and commission income
Fee and commission expense
Net insurance income
(expenses)
Insurance income
Insurance expenses
Net gains (losses) on
financial instruments at fair
value through profit or loss
Net other operating income
(expense)
General and administrative
expenses
Operating profit before
Provision for credit losses
Provision (reversal) for
credit losses
Net operating income
Share of profit of associates
and joint ventures
Net other non-operating
income (expense)
Segment profits before
income tax
Income tax expense
Profit for the year
Profit attributable to
shareholders of the Parent
Company
Profit attributable to
non-controlling interests
Total assets1
Total liabilities1
Retail
Banking
\ 2,979,503
-
\2,979,503
3,148,061
4,872,937
(1,724,876)
471,869
577,845
(105,976)
-
-
-
-
(640,427)
(1,982,375)
997,128
(235,995)
761,133
-
-
761,133
(209,311)
551,822
551,822
-
147,468,173
161,834,984
Corporate Banking
\ 2,375,800
204,476
\2,580,276
2,844,880
4,642,555
(1,797,675)
349,393
459,879
(110,486)
-
-
-
(2,526)
(611,471)
(1,241,721)
1,338,555
125,919
1,464,474
-
(262)
1,464,212
(404,426)
1,059,786
1,059,786
-
139,496,393
142,063,122
Other
Banking Services
\ 1,591,323
167,966
\1,759,289
370,846
1,264,456
(893,610)
312,034
445,638
(133,604)
-
-
-
425,150
651,259
(663,323)
1,095,966
6,546
1,102,512
29,240
(38,625)
1,093,127
(265,656)
827,471
827,471
-
100,460,472
54,522,699
Sub-total
\ 6,946,626
372,442
\7,319,068
6,363,787
10,779,948
(4,416,161)
1,133,296
1,483,362
(350,066)
-
-
-
422,624
(600,639)
(3,887,419)
3,431,649
(103,530)
3,328,119
29,240
(38,887)
3,318,472
(879,393)
2,439,079
2,439,079
-
387,425,038
358,420,805
Securities
\ 1,113,200
(18,795)
\ 1,094,405
529,888
852,153
(322,265)
580,435
683,600
(103,165)
-
-
-
(103,815)
87,897
(757,276)
337,129
(14,366)
322,763
(103)
30,518
353,178
(95,271)
257,907
257,893
14
47,816,512
43,131,858
Credit Card
\ 1,470,910
(209,874)
\ 1,261,036
1,230,288
1,581,178
(350,890)
261,829
1,406,273
(1,144,444)
15,748
28,874
(13,126)
371
(247,200)
(441,921)
819,115
(439,765)
379,350
1,106
3,362
383,818
(67,262)
316,556
316,545
11
22,990,115
18,925,195
Intra-group
adjustment
\ -
(191,728)
\ (191,728)
686
(38,995)
39,681
7,490
(322,944)
330,434
(9,053)
(29,897)
20,844
(144,948)
(45,903)
99,832
(91,896)
(236)
(92,132)
(20,972)
(29,211)
(142,315)
9,124
(133,191)
(131,762)
(1,429)
(28,188,756)
(1,610,678)
Non-life Insurance
\ 1,185,600
(54,160)
\ 1,131,440
616,378
617,617
(1,239)
(152,597)
11,095
(163,692)
415,112
11,375,543
(10,960,431)
265,187
(12,640)
(843,800)
287,640
12,959
300,599
(21)
26,490
327,068
(92,381)
234,687
234,326
361
36,552,368
32,689,460
Others
\ 608,111
124,857
\ 732,968
296,512
687,823
(391,311)
541,343
617,622
(76,279)
-
-
-
137,680
(242,567)
(373,919)
359,049
(128,331)
230,718
7,201
34,644
272,563
(90,366)
182,197
179,783
2,414
42,140,936
18,675,585
Life
Insurance
\ 107,404
(22,742)
\ 84,662
159,248
159,463
(215)
(16,792)
239
(17,031)
(122,295)
942,662
(1,064,957)
66,773
(2,272)
(66,514)
18,148
3,084
21,232
-
(30)
21,202
(5,238)
15,964
15,964
-
9,801,904
9,186,567
Total
\ 11,431,851
-
\ 11,431,851
9,196,787
14,639,187
(5,442,400)
2,355,004
3,879,247
(1,524,243)
299,512
12,317,182
(12,017,670)
643,872
(1,063,324)
(6,271,017)
5,160,834
(670,185)
4,490,649
16,451
26,886
4,533,986
(1,220,787)
3,313,199
3,311,828
1,371
518,538,117
479,418,792
Banking business
(In millions of Korean won)
1 Assets and liabilities of the reporting segments are amounts before intra-segment transaction adjustment.
Financial Section 127

Financial information by business segment for the year ended December 31, 2018, is as follows:
Operating revenues from
external customers
Intra-segment operating
revenues(expenses)
Net interest income
Interest income
Interest expense
Net fee and commission
income (expenses)
Fee and commission income
Fee and commission expense
Net insurance income
(expenses)
Insurance income
Insurance expenses
Net gains (losses) on
financial instruments at fair
value through profit or loss
Net other operating income
(expense)
General and administrative
expenses
Operating profit before
Provision for credit losses
Provision (reversal) for
credit losses
Net operating income
Share of profit of associates
and joint ventures
Net other non-operating
income (expense)
Segment profits before
income tax
Income tax expense
Profit for the year
Profit attributable to
shareholders of the Parent
Company
Profit attributable to
non-controlling interests
Total assets1
Total liabilities1
Retail
Banking
`\ 2,989,240
-
\ 2,989,240
2,960,598
4,547,615
(1,587,017)
490,447
583,213
(92,766)
-
-
-
-
(461,805)
(1,970,409)
1,018,831
(179,229)
839,602
-
-
839,602
(230,891)
608,711
608,711
-
140,814,393
152,173,062
Corporate Banking
\ 2,318,812
94,910
\ 2,413,722
2,753,928
4,267,675
(1,513,747)
287,978
381,481
(93,503)
-
-
-
13,933
(642,117)
(1,091,556)
1,322,166
77,224
1,399,390
-
(65)
1,399,325
(386,764)
1,012,561
1,012,561
-
131,303,734
123,880,329
Other
Banking Services
\ 1,271,117
179,300
\ 1,450,417
386,196
1,204,598
(818,402)
344,323
458,097
(113,774)
-
-
-
312,462
407,436
(705,030)
745,387
8,089
753,476
49,698
44,237
847,411
(209,485)
637,926
637,926
-
84,841,131
54,238,001
Sub-total
\ 6,579,169
274,210
\ 6,853,379
6,100,722
10,019,888
(3,919,166)
1,122,748
1,422,791
(300,043)
-
-
-
326,395
(696,486)
(3,766,995)
3,086,384
(93,916)
2,992,468
49,698
44,172
3,086,338
(827,140)
2,259,198
2,259,198
-
356,959,258
330,291,392
Securities
\ 997,898
(17,541)
\ 980,357
542,206
819,462
(277,256)
625,729
734,287
(108,558)
-
-
-
(222,014)
34,436
(735,227)
245,130
(9,993)
235,137
175
13,770
249,082
(70,222)
178,860
178,850
10
45,086,292
40,613,424
Credit Card
\ 1,524,695
(219,680)
\ 1,305,015
1,168,284
1,474,376
(306,092)
264,651
683,198
(418,547)
18,386
32,271
(13,885)
3,866
(150,172)
(404,927)
900,088
(431,032)
469,056
202
(33,062)
436,196
(149,623)
286,573
286,599
(26)
20,528,951
16,570,282
Intra-group
adjustment
\ -
(157,440)
\ (157,440)
1,034
(25,724)
26,758
4,522
(312,701)
317,223
(148)
(36,679)
36,531
(89,590)
(73,258)
150,045
(7,395)
318
(7,077)
(28,903)
(38,237)
(74,217)
6,770
(67,447)
(66,569)
(878)
(27,851,420)
(1,459,548)
Non-life Insurance
\1,183,394
(20,529)
\1,162,865
616,173
616,483
(310)
(147,041)
3,238
(150,279)
611,277
10,847,323
(10,236,046)
180,808
(98,352)
(789,443)
373,422
(14,392)
359,030
(16)
8,085
367,099
(104,667)
262,432
262,267
165
34,785,551
31,289,705
Others
\ 461,293
167,789
\ 629,082
291,415
644,975
(353,560)
385,930
443,455
(57,525)
1
-
1
89,059
(137,323)
(308,559)
320,523
(124,215)
196,308
3,104
16,465
215,877
(88,372)
127,505
126,021
1,484
40,399,287
17,441,868
Life
Insurance
\ 113,238
(26,809)
\ 86,429
185,094
185,109
(15)
(13,163)
214
(13,377)
(139,400)
1,132,155
(1,271,555)
62,779
(8,881)
(63,406)
23,023
(464)
22,559
-
(1,402)
21,157
(6,332)
14,825
14,825
-
9,680,379
9,128,148
Total
\10,859,687
-
\10,859,687
8,904,928
13,734,569
(4,829,641)
2,243,376
2,974,482
(731,106)
490,116
11,975,070
(11,484,954)
351,303
(1,130,036)
(5,918,512)
4,941,175
(673,694)
4,267,481
24,260
9,791
4,301,532
(1,239,586)
3,061,946
3,061,191
755
479,588,298
443,875,271
Banking business
(In millions of Korean won)
1 Assets and liabilities of the reporting segments are amounts before intra-segment transaction adjustment.
KB Financial Group Annual Report 2019128

5.2 Services and Geographical Segments
5.2.1 Services information
Operating revenues from external customers for each service for the years ended December 31, 2019 and 2018, are as follows:
5.2.2 Geographical information
Geographical operating revenues from external customers for the years ended December 31, 2019 and 2018, and major non-current assets as of December
31, 2019 and 2018, are as follows:
Banking serviceSecurities serviceNon-life Insurance serviceCredit card serviceLife insurance serviceOther service
2019 ₩ 6,946,626
1,113,2001,185,6001,470,910
107,404608,111
\ 11,431,851
2018 ₩ 6,579,169
997,8981,183,3941,524,695
113,238461,293
₩ 10,859,687
(In millions of Korean won)
DomesticUnited StatesNew ZealandChinaCambodiaUnited KingdomOthersIntra-group adjustment
Revenues from external customers
₩ 11,142,26472,945
6,946109,574
19,53410,03770,551
-₩ 11,431,851
Revenues from external customers
₩ 10,666,58646,391
6,21394,99611,062
8,11926,320
-₩ 10,859,687
Major non-current assets
₩ 9,515,220386,724
3,51615,119
7,16285,634
551,03968,764
₩ 10,633,178
Major non-current assets
₩ 8,114,196370,252
725,4543,733
537584,466
69,011₩ 9,147,721
2019 2018
(In millions of Korean won)
6. Financial Assets and Financial Liabilities6.1 Classification and Fair Value of Financial Instruments
6.1.1 Carrying amount and fair value of financial assets and liabilities as of December 31, 2019 and 2018, are as follows:
Financial assetsCash and due from financial institutionsFinancial assets at fair value through profit or loss
Due from financial institutionsDebt securitiesEquity securitiesLoansOthers
Derivatives held for trading Derivatives held for hedgingLoans at amortized costSecurities at amortized costFinancial assets measured at fair value through other comprehensive income
Debt securitiesEquity securitiesLoans
Others
Carrying amount
₩ 20,837,87853,549,086
216,36750,721,526
2,103,843427,545
79,8053,008,598
182,075339,684,059
25,346,55546,436,05143,556,848
2,504,105375,098
9,147,059₩ 498,191,361
Fair value
₩ 20,835,23553,549,086
216,36750,721,526
2,103,843427,545
79,8053,008,598
182,075340,836,884
26,570,49446,436,05143,556,848
2,504,105375,098
9,147,059₩ 500,565,482
2019
(In millions of Korean won)
Financial Section 129

Financial liabilitiesFinancial liabilities at fair value through profit or loss
Financial liabilities designated at fair value through profit or loss
Derivatives held for trading
Derivatives held for hedging
Deposits
Debts
Debentures
Other financial liabilities
Carrying amount
₩ 2,663,327
12,704,826
2,842,950
164,391
305,592,771
37,818,860
50,935,583
22,629,587
₩ 435,352,295
Fair value
₩ 2,663,327
12,704,826
2,842,950
164,391
306,048,291
37,808,944
51,558,748
22,629,587
₩ 436,421,064
2019
(In millions of Korean won)
Financial assetsCash and due from financial institutions
Financial assets at fair value through profit or loss
Due from financial institutions
Debt securities
Equity securities
Loans
Others
Derivatives held for trading
Derivatives held for hedging
Loans at amortized cost
Financial assets measured at fair value through other comprehensive income
Debt securities
Equity securities
Loans
Securities at amortized cost
Others
Financial liabilitiesFinancial liabilities at fair value through profit or loss
Financial liabilities designated at fair value through profit or loss
Derivatives held for trading
Derivatives held for hedging
Deposits
Debts
Debentures
Other financial liabilities
Carrying amount
₩ 20,274,490
50,987,847
381,719
48,285,482
1,287,662
954,176
78,808
1,915,532
110,430
319,201,603
38,003,572
35,243,634
2,370,116
389,822
23,661,522
8,133,556
₩ 462,288,552
₩ 2,823,820
12,503,039
2,724,994
176,253
276,770,449
33,004,834
53,278,697
19,828,307
₩ 401,110,393
Fair value
₩ 20,271,261
50,987,847
381,719
48,285,482
1,287,662
954,176
78,808
1,915,532
110,430
320,003,844
38,003,572
35,243,634
2,370,116
389,822
24,159,137
8,133,556
₩ 463,585,179
₩ 2,823,820
12,503,039
2,724,994
176,253
277,423,194
33,028,205
53,771,564
19,833,885
₩ 402,284,954
2018
(In millions of Korean won)
The fair value is defined as the price that would be received to sell an asset or paid to transfer a liability in an ordinary transaction between market
participants. For each class of financial assets and financial liabilities, the Group discloses the fair value of that class of assets and liabilities in a way that
permits it to be compared with its carrying amount at the end of each reporting period. The best evidence of fair value of financial instruments is a quoted
price in an active market.
KB Financial Group Annual Report 2019130

Methods of determining fair value for financial instruments are as follows:
6.1.2 Fair value hierarchy
The Group believes that valuation methods used for measuring the fair values of financial instruments are reasonable and that the fair values recognized in
the statement of financial position are appropriate. However, the fair values of the financial instruments recognized in the statement of financial position
may be different if other valuation methods or assumptions are used. Additionally, as there is a variety of valuation techniques and assumptions used in
measuring fair value, it may be difficult to reasonably compare the fair value with that of other financial institutions.
The Group classifies and discloses fair value of the financial instruments into the three-level hierarchy as follows:
Level 1: The fair values are based on quoted prices (unadjusted) in active markets for identical assets or liabilities that the entity can access at the
measurement date.
Level 2: The fair values are based on inputs other than quoted prices included within Level 1 that are observable for the asset or liability, either directly or indirectly.
Level 3: The fair values are based on unobservable inputs for the asset or liability.
When the inputs used to measure the fair value of an asset or a liability might be categorized within different levels of the fair value hierarchy, the fair value
measurement is categorized in its entirety in the same level of the fair value hierarchy as the lowest level input that is significant to the entire measurement.
Assessing the significance of a particular input to the entire measurement requires judgment, taking into account factors specific to the asset or liability. If a fair
value measurement uses observable inputs that require significant adjustment based on unobservable inputs, that measurement is a Level 3 measurement.
Fair value hierarchy of financial assets and liabilities measured at fair value in the statements of financial position
The fair value hierarchy of financial assets and liabilities measured at fair value in the statements of financial position as of December 31, 2019 and 2018, are
as follows:
Cash and due from financial institutions
Investment securities
Loans at amortized cost
Derivatives and Financial instruments at fair value through profit or loss
Deposits
Debts
Debentures
Other financial assets
and liabilities
The carrying amounts of cash and demand due from financial institutions and payment due from financial institutions
are a reasonable approximation of fair values. These financial instruments do not have a fixed maturity and are
receivable on demand. Fair value of ordinary due from financial institutions is measured using DCF model (Discounted
Cash Flow Model).
The fair value of financial instruments that are quoted in active markets is determined using the quoted prices.
Fair value is determined through the use of external professional valuation institution where quoted prices are not
available. The institutions use one or more of the following valuation techniques including DCF Model, Free Cash Flow
to Equity Model, Comparable Company Analysis, Dividend Discount Model, Risk Adjusted Discount Rate Method, and
Net Asset Value Method.
DCF model is used to determine the fair value of loans. Fair value is determined by discounting the expected cash
flows, which are contractual cash flows adjusted by the expected prepayment rate, at appropriate discount rate.
For exchange traded derivatives, quoted price in an active market is used to determine fair value and for OTC
derivatives, fair value is determined using valuation techniques. The Group uses internally developed valuation models
that are widely used by market participants to determine fair values of plain vanilla OTC derivatives including options,
interest rate swaps, and currency swaps, based on observable market parameters. However, some complex financial
instruments are valued using appropriate models developed from generally accepted market valuation models
including the Finite Difference Method, the Monte Carlo Simulation, Black-Scholes Model, Hull and White Model,
Closed Form and Tree Model or valuation results from independent external professional valuation institution.
Carrying amount of demand deposits is regarded as representative of fair value because they do not have a fixed
maturity and are payable on demand. Fair value of time deposits is determined using a DCF model. Fair value is
determined by discounting the expected cash flows, which are contractual cash flows adjusted by the expected
prepayment rate, at an appropriate discount rate.
Carrying amount of overdraft in foreign currency is regarded as representative of fair value because they do not have
a fixed maturity and are payable on demand. Fair value of other debts is determined using a DCF model discounting
contractual future cash flows at an appropriate discount rate.
Fair value is determined by using the valuations of external professional valuation institution, which are calculated
using market inputs.
The carrying amounts are reasonable approximation of fair values. These financial instruments are temporary accounts used
for other various transactions and their maturities are relatively short or not defined. However, fair value of finance lease
liabilities is measured using a DCF model.
Financial Section 131

Financial assetsFinancial assets at fair value through profit or loss
Due from financial institutions
Debt securities
Equity securities
Loans
Others
Derivatives held for trading
Derivatives held for hedging
Financial assets measured at fair value through other comprehensive income
Debt securities
Equity securities
Loans
Financial liabilitiesFinancial liabilities at fair value through profit or loss
Financial liabilities designated at fair value through profit or loss
Derivatives held for trading
Derivatives held for hedging
Level 1
\ 11,177,716
-
9,853,733
1,244,178
-
79,805
72,983
-
15,188,993
14,236,566
952,427
-
\ 26,439,692
\ 2,663,327
492
157,634
-
\ 2,821,453
Level 1
\ 12,128,933
-
11,312,317
737,808
-
78,808
67,436
-
10,514,315
9,542,948
971,367
-
\ 22,710,684
\ 2,823,820
126
479,264
-
\ 3,303,210
Level 2
\ 31,476,070
165,242
30,735,027
336,389
239,412
-
2,398,831
182,075
29,764,660
29,320,282
69,280
375,098
\ 63,821,636
\ -
1,482,302
2,458,498
164,391
\ 4,105,191
Level 2
\ 31,132,108
332,976
29,879,850
178,309
740,973
-
1,737,033
110,430
26,156,539
25,700,686
66,031
389,822
\ 59,136,110
\ -
1,629,530
1,834,536
176,253
\ 3,640,319
Level 3
\ 10,895,300
51,125
10,132,766
523,276
188,133
-
536,784
-
1,482,398
-
1,482,398
-
\ 12,914,482
\ -
11,222,032
226,818
-
\ 11,448,850
Level 3
\ 7,726,806
48,743
7,093,315
371,545
213,203
-
111,063
-
1,332,718
-
1,332,718
-
\ 9,170,587
\ -
10,873,383
411,194
-
\ 11,284,577
Total
\ 53,549,086
216,367
50,721,526
2,103,843
427,545
79,805
3,008,598
182,075
46,436,051
43,556,848
2,504,105
375,098
\ 103,175,810
\ 2,663,327
12,704,826
2,842,950
164,391
\ 18,375,494
Total
\ 50,987,847
381,719
48,285,482
1,287,662
954,176
78,808
1,915,532
110,430
38,003,572
35,243,634
2,370,116
389,822
\ 91,017,381
\ 2,823,820
12,503,039
2,724,994
176,253
\ 18,228,106
2019
2018
Fair value hierarchy
Fair value hierarchy
(In millions of Korean won)
(In millions of Korean won)
(*) Valuation target amount of the KB Securities Co., Ltd.’s over-the-counter (OTC) derivatives consist of \ 2,459,478 million of financial assets at fair value through profit
or loss-debt instruments, \ 11,222,032 million of financial liabilities at fair value through profit or loss, \ 536,714 of derivative financial assets and \ 226,333 of derivative
financial liabilities.
KB Financial Group Annual Report 2019132

Valuation techniques and the inputs used in the fair value measurement classified as Level 2
Financial assets and liabilities measured at fair value classified as Level 2 in the statements of financial position as of December 31, 2019 and 2018, are as follows:
Financial assets Financial assets at fair value through profit or loss
Due from financial institutions
Debt securities
Equity securities
Loans
Derivatives held for trading
Derivatives held for hedging
Financial assets measured at
fair value through other
comprehensive income
Debt securities
Equity securities
Loans
Financial liabilities Financial liabilities at fair value
through profit or loss
Derivatives held for trading
Derivatives held for hedging
Fair value
\ 31,476,070
165,242
30,735,027
336,389
239,412
2,398,831
182,075
29,764,660
29,320,282
69,280
375,098
\ 63,821,636
\ 1,482,302
2,458,498
164,391
\ 4,105,191
Valuation techniques
DCF Model, One factor Hull-White
Model,
DCF Model, Closed Form, Monte Carlo
Simulation, Black-Scholes Model,
Hull and White Model, Net Asset
Value and others
DCF Model
DCF Model
DCF Model, FDM, Closed Form,
Option Model, Monte Carlo
Simulation, Black-Scholes Model,
Hull and White Model and others
DCF Model, Closed Form, FDM
DCF Model, Option model, Market
value approach
DCF Model, Black-Scholes Model
DCF Model, Option Model
DCF Model, Closed Form, Monte Carlo
Simulation, Black-Scholes Model,
Hull and White Model and others
DCF Model, Closed Form, FDM, Monte
Carlo Simulation, Black-Sholes Model,
Hull and White Model, Option Model
and others
DCF Model, Closed Form, FDM and
others
Inputs
Discount rate, Volatility and others
Projected cash flow, Fair value of underlying
asset, Dividend yield, Interest rate, Underlying
asset price, Correlation coefficient, Discount
rate, Volatility and others
Interest rate, Discount rate and others
Interest rate, Discount rate and others
Underlying asset Index, Discount rate,
Volatility, Correlation coefficient, Interest
rate, PD, Credit Spread. Foreign exchange
rate, Stock price, Dividend rate and others
Discount rate, Volatility, Foreign exchange
rate and Others
Discount rate, Underlying asset Index,
Volatility, and others
Discount rate, Underlying asset Index,
Volatility, and others
Discount rate, Underlying asset Index,
Volatility, and others
Price of Underlying asset, interest rate,
Discount rate, Dividend rate, Volatility
and others
Discount rate, Underlying asset Index,
Volatility, Correlation coefficient,
Interest rate, Stock price, Foreign
exchange rate, Dividend rate, PD,
Credit Spread, and others
Discount rate, Volatility, Foreign
exchange rate and others
2019
(In millions of Korean won)
Financial Section 133

Financial assets Financial assets at fair value through profit or loss
Due from financial institutions
Debt securities
Equity securities
Loans
Derivatives held for trading
Derivatives held for hedging
Financial assets measured at
fair value through other
comprehensive income
Debt securities
Equity securities
Loans
Financial liabilities Financial liabilities at fair value
through profit or loss
Derivatives held for trading
Derivatives held for hedging
Fair value
\ 31,132,108
332,976
29,879,850
178,309
740,973
1,737,033
110,430
26,156,539
25,700,686
66,031
389,822
\ 59,136,110
1,629,530
1,834,536
176,253
\ 3,640,319
Valuation techniques
One factor Hull-White Model, DCF
Model
DCF Model, Closed Form, Monte Carlo
Simulation, Black-Scholes Model,
Hull and White Model, Net Asset
Value and others
DCF Model
DCF Model
DCF Model, FDM, Closed Form,
Option Model, Monte Carlo
Simulation, Black-Scholes Model,
Hull and White Model and others
DCF Model, Closed Form, FDM
DCF Model, Option model, Market
value approach
DCF Model, Black-Scholes Model
DCF Model
DCF Model, Closed Form, Monte Carlo
Simulation, Black-Scholes Model,
Hull and White Model and others
DCF Model, Closed Form, FDM and
others
DCF Model, Closed Form, FDM and
others
Inputs
Discount rate, Volatility and others
Projected cash flow, Fair value of underlying
asset, Dividend yield, Interest rate,
Underlying asset price, Discount rate,
Volatility and others
Interest rate, Discount rate and others
Interest rate, Discount rate and others
Underlying asset Index, Discount rate,
Volatility, Foreign exchange rate,
Stock price, Dividend rate and others
Discount rate, Volatility, Foreign exchange
rate and Others
Discount rate, Underlying asset Index,
Volatility, and others
Discount rate, Underlying asset Index,
Volatility, and others
Discount rate
Price of Underlying asset, Discount
rate, Dividend rate, Volatility
Discount rate, Price of Underlying
asset, Volatility, Foreign exchange rate,
Credit Spread, Stock price and others
Discount rate, Volatility, Foreign
exchange rate and others
2018
(In millions of Korean won)
KB Financial Group Annual Report 2019134

Fair value hierarchy of financial assets and liabilities whose fair values are disclosed
The fair value hierarchy of financial assets and liabilities whose fair values are disclosed as of December 31, 2019 and 2018, are as follows:
Financial assetsCash and due from financial institutions1
Loans at amortized cost
Securities at amortized cost
Other financial assets2
Financial liabilitiesDeposits1
Debts3
Debentures
Other financial liabilities2
Financial assetsCash and due from financial institutions1
Loans at amortized cost
Securities at amortized cost
Other financial assets2
Financial liabilitiesDeposits1
Debts3
Debentures
Other financial liabilities2
Level 1
\ 3,015,104
-
9,587,770
-
\ 12,602,874
\ -
-
-
-
\ -
Level 1
\ 3,338,863
-
8,629,708
-
\ 11,968,571
\ -
-
-
-
\ -
Level 2
\ 13,812,640
372,988
16,979,656
-
\ 31,165,284
\ 142,021,800
1,469,263
46,969,992
-
\ 190,461,055
Level 2
\ 14,632,352
493,773
15,529,429
-
\ 30,655,554
\ 127,265,703
1,114,900
48,680,196
-
\ 177,060,799
Level 3
\ 4,007,491
340,463,896
3,068
9,147,059
\ 353,621,514
\ 164,026,491
36,339,681
4,588,756
22,629,587
\ 227,584,515
Level 3
\ 2,300,046
319,510,071
-
8,133,556
\ 329,943,673
\ 150,157,491
31,913,305
5,091,368
19,833,885
\ 206,996,049
Total
\ 20,835,235
340,836,884
26,570,494
9,147,059
\ 397,389,672
\ 306,048,291
37,808,944
51,558,748
22,629,587
\ 418,045,570
Total
\ 20,271,261
320,003,844
24,159,137
8,133,556
\ 372,567,798
\ 277,423,194
33,028,205
53,771,564
19,833,885
\ 384,056,848
2019
2018
Fair value hierarchy
Fair value hierarchy
(In millions of Korean won)
(In millions of Korean won)
1 The amounts included in Level 2 are the carrying amounts which are reasonable approximations of the fair values.2 Other financial assets included in Level 3 are the carrying amounts which are reasonable approximation of fair values as of December 31, 2019.3 Debts of \ 4,685 million included in Level 2 is the carrying amounts which are reasonable approximation of fair values as of December 31, 2019.
1 The amounts included in Level 2 are the carrying amounts which are reasonable approximations of the fair values.2 Other financial assets of \ 8,133,556 million included in Level 3 are the carrying amounts which are reasonable approximation of fair values as of December 31, 2018. 3 Debts of \ 38,403 million included in Level 2 is the carrying amounts which are reasonable approximation of fair values as of December 31, 2018.
4 Other financial liabilities of \ 19,250,252 million included in Level 3 is the carrying amounts which are reasonable approximations of fair values as of December 31, 2018.
Valuation techniques and the inputs used in the fair value measurement
Financial assets and liabilities whose carrying amount is a reasonable approximation of fair value are not subject to disclose valuation techniques and inputs.
Valuation techniques and inputs of financial assets and liabilities whose fair values are disclosed and classified as Level 2 as of December 31, 2019 and 2018, are
as follows:
Financial Section 135

Valuation techniques and inputs of financial assets and liabilities whose fair values are disclosed and classified as Level 3 as of December 31, 2019 and 2018, are
as follows:
Financial assets Loans at amortized cost Securities at amortized costFinancial liabilities Debts Debentures
Financial assets Cash and due from financial institutions
Loans at amortized cost
Securities at amortized cost
Financial liabilities Deposits
Debts Debentures
Financial assets Cash and due from financial institutions
Loans at amortized cost
Financial liabilities Deposits
Debts
Debentures
Other Financial liabilities
Financial assets Loans at amortized cost Securities at amortized costFinancial liabilities Debts Debentures
Fair value
\ 372,98816,979,656
1,464,57846,969,992
Fair value
\4,007,491
340,463,896
3,068\ 344,474,455
\164,026,491
36,339,6814,588,756
\ 204,954,928
Fair value
\ 2,300,046
319,510,071
\ 321,810,117
\ 150,157,491
31,913,305
5,091,368
583,633\ 187,745,797
Fair value
\ 493,77315,529,429
1,076,49748,680,196
Valuation techniques
DCF ModelDCF Model, Monte Carlo Simulation
DCF ModelDCF Model
Valuation techniques
DCF Model
DCF Model
DCF Model
DCF Model
DCF ModelDCF Model
Valuation techniques
DCF Model
DCF Model
DCF Model
DCF Model
DCF Model
DCF Model
Valuation techniques
DCF ModelDCF Model
DCF ModelDCF Model
Inputs
Discount rateDiscount rate, Interest rate
Discount rateDiscount rate
Inputs
Credit spread, Other spread, Interest rates
Credit spread, Other spread, Early termination ratio, Interest rates
Interest rates
Other spread, Interest rates, Early termination ratioOther spread, Interest ratesOther spread, Interest rates
Inputs
Credit spread, Other spread, Interest rates
Credit spread, Other spread, Early termination ratio, Interest rates
Other spread, Interest rates, Early termination ratio
Other spread, Interest rates
Other spread, Interest rates
Other spread, Interest rates
Inputs
Discount rateDiscount rate
Discount rateDiscount rate
2019
2019
2018
2018
(In millions of Korean won)
(In millions of Korean won)
(In millions of Korean won)
(In millions of Korean won)
KB Financial Group Annual Report 2019136

6.2 Level 3 of the Fair Value Hierarchy Disclosure
6.2.1 Valuation policy and process for fair value measurement categorized within Level 3
The Group uses external, independent and qualified third-party valuation service in addition to internal valuation models to determine the fair value of the Group’s assets at the end of every reporting period.
Where a reclassification between the levels of the fair value hierarchy occurs for a financial asset or liability, the Group’s policy is to recognize such transfers as having occurred at the beginning of the reporting period.
6.2.2 Changes in fair value (Level 3) measured using valuation technique based on unobservable in market
Details of changes in Level 3 of the fair value hierarchy for year ended December 31, 2019 and 2018, are as follows:
BeginningTotal gains or losses- Profit or loss- Other comprehensive incomePurchasesSalesIssuesSettlementsTransfers into Level 31
Transfers out of Level 31
Ending
Beginning2
Total gains or losses- Profit or loss- Other comprehensive incomePurchasesSalesIssuesSettlementsTransfers into Level 31
Transfers out of Level 31
Ending
Cash and due from financial institutions at
fair value through profit
or loss
\ 48,743
1,207
1,175------
\ 51,125
Cash and due from financial institutions at
fair value through profit
or loss
\ 48,243
537(37)
------
\ 48,743
Financial
investments
Financial assets measured
at fair value through other comprehensive
income
\ 1,332,718
-
55,99395,359(1,672)
----
\ 1,482,398
Financial
investments
Financial assets measured
at fair value through other comprehensive
income
\ 1,187,217
-142,415
83,566(80,480)
----
\ 1,332,718
Securities measured at fair value through profit or loss
\ 7,464,860
(66,208)
111,8264,544,254
(2,139,174)--
851,457(110,973)
\ 10,656,042
Securities measured at fair value through profit or loss
\ 6,106,716
178,56960,624
3,011,701(1,855,118)
--
2,103(39,735)
\ 7,464,860
Financial liabilities at fair value through
profit or loss
Financial liabilities designated at fair
value through profit or loss
\ (10,873,383)
(1,285,157)
(25,538)--
(12,416,402)13,378,448
--
\ (11,222,032)
Financial liabilities at fair value through
profit or loss
Financial liabilities designated at fair
value through profit or loss
\ (8,687,892)
27,583(8,597)
--
(11,090,504)8,886,027
--
\ (10,873,383)
Loans at fair value through profit or loss
\ 213,203
10,412
-154,005
(189,487)----
\ 188,133
Loans at fair value through profit or loss
\ 133,309
4,367-
184,655(109,128)
----
\ 213,203
Derivatives held
for trading
\ (300,131)
851,453
--
(163,856)(59,202)
(1,316)(16,982)
-\ 309,966
Derivatives held
for trading
\ 96,354
(247,194)-
7,706(90,270)(76,519)
12,803(3,011)
-\ (300,131)
Derivatives held for fair
value hedging
\ -
-
-------
\ -
Derivatives held for fair
value hedging
\ 705
(116)----
(589)--
\ -
2019
2018
(In millions of Korean won)
(In millions of Korean won)
Financial assets at fair value through profit or loss
Financial assets at fair value through profit or loss
Net derivatives
financial instruments
Net derivatives
financial instruments
1 The changes in levels for the financial instruments occurred due to the change in the availability of observable market data.
1 The changes in levels for the financial instruments occurred due to the change in the availability of observable market data. 2 Restated based on Korean IFRS 1109.
Financial Section 137

In relation to changes in Level 3 of the fair value hierarchy, total gains or losses recognized in profit or loss for the year, and total gains or losses included in profit
or loss for financial instruments held at the end of the reporting period in the statements of comprehensive income for the years ended December 31, 2019 and
2018, are as follows:
6.2.3 Sensitivity analysis of changes in unobservable inputs
Information about fair value measurements using unobservable inputs as of December 31, 2019 and 2018, are as follows:
Total gains or losses included in profit or loss for the year
Total gains or losses for the year included in profit or loss for financial instruments held at the end of the reporting period
Total gains or losses included in profit or loss for the year
Total gains or losses for the year included in profit or loss for financial instruments held at the end of the reporting period
Other operating loss
₩ 1,388
1,331
Other operating loss
₩ (405)
(289)
Net income (loss) from financial investments at fair value through profit or loss
₩ (489,703)
(37,668)
Net income (loss) from financial investments at fair value through profit or loss
₩ (36,466)
144,674
Net interest income
₩ 22
-
Net interest income
₩ 617
43
2019
2018
(In millions of Korean won)
(In millions of Korean won)
Financial assets
Cash and due from financial
institutions
Debt securities
Fair value
₩ 51,125
10,132,766
Valuation technique
Option Model
DCF Model, Closed
Form, FDM, Monte
Carlo Simulation, Hull-
White Model, Black-
Scholes Model, Option
Model, Tree Model,
Net Asset Value, Income
approach, Market
approach and others
Unobservable inputs
Volatility of the
underlying asset
Correlation
Growth rate
Volatility of underlying
assets
Discount rate
Recovery rate
Correlation between
underlying asset
Liquidation value
Volatility of real estate
price
Relationship of unobservable inputs to
fair value
The higher the volatility, the higher
the fair value fluctuation
The higher the correlation, the
higher the fair value fluctuation
The higher the growth rate, the
higher the fair value
The higher the volatility, the higher
the fair value change
The lower the discount rate, the
higher the fair value
The higher the recovery rate, the
higher the fair value
The higher the correlation coefficient,
the higher the fair value change.
The higher the liquidation value, the
higher the fair value
The higher the price of real estate,
the higher the fair value
Range of unobservable
inputs(%)
11.43~34.39
-4.84
-1.00~1.00
1.00~48.00
0.75~17.37
-1.00~1.00
3.11~95.67
0.00
-1.00~1.00
December 31, 2019
(In millions of Korean won)
Financial assets at fair value through profit or loss
KB Financial Group Annual Report 2019138

Equity securities
Loans
Stock and index
Currency, interest rate and
others
Equity securities
Financial liabilities
Derivative-linked securities
Fair value
523,276
188,133
416,486
120,298
1,482,398
₩ 12,914,482
₩11,222,032
Valuation technique
Income approach,
Market approach,
Asset value
approach, DCF
Model, Comparable
Company Analysis,
Adjusted discount
rate method,
Dividend Discount
Model, Usage of past
transactions, Binomial
Model and others
Binomial Model, DCF
Model
DCF Model, Closed
Form, FDM, Monte
Carlo Simulation,
Hull and White Model,
Black-Scholes Model,
Binomial Model
DCF Model, Hull-
White Model
Adjusted discount
rate method, IMV
Model, DCF Model,
Comparable Company
Analysis, Dividend
discount model,
Option Model, Net
asset value method,
Market approach, One
Factor Hull-White
Model and others
DCF Model, Closed
Form, FDM, Monte
Carlo Simulation, Hull
and White Model,
Black Scholes-Model
Unobservable inputs
Growth rate
Discount rate
Liquidation value
Volatility
Volatility of the stock
price
Discount rate
Volatility of the
underlying asset
Correlation between
underlying asset
Volatility
Correlation between
underlying asset
Growth rate
Discount rate
Volatility
Volatility of the
underlying asset
Correlation between
underlying asset
Relationship of unobservable inputs to
fair valueThe higher the growth rate, the
higher the fair value
The lower the discount rate, the
higher the fair value
The higher the liquidation value, the
higher the fair value
The higher the volatility, the higher
the fair value fluctuation
The higher the volatility, the higher
the fair value fluctuation
The lower the discount rate, the
higher the fair value
The higher the volatility, the higher
the fair value fluctuation
The higher the correlation, the
higher the fair value fluctuation
The higher the volatility, the higher
the fair value fluctuation
The higher the absolute value of
correlation, the higher the fair value
fluctuation
The higher the growth rate, the
higher the fair value
The lower the discount rate, the
higher the fair value
The higher the volatility, the higher
the fair value fluctuation
The higher the volatility, the higher
the fair value fluctuation
The higher the absolute value of
correlation, the higher the fair value
fluctuation
Range of unobservable
inputs(%)0.00~2.20
2.00~22.00
-1.00~1.00
11.90
12.91~48.28
10.81
9.75~52.00
4.00~77.00
2.00~58.00
-49.00~90.00
0.00~2.20
3.04~16.37
20.97~34.87
1.00~58.00
-49.00~90.00
December 31, 2019
(In millions of Korean won)
Derivatives held for trading
Financial assets measured at fair value through other comprehensive income
Financial liabilities designated at fair value through profit or loss
Financial Section 139

Stock and index
Others
Financial assets
Cash and due from financial
institutions
Debt securities
Fair value
54,341
172,477
₩11,448,850
Fair value
₩ 48,743
7,093,315
Valuation technique
DCF Model, Closed
Form, FDM, Monte
Carlo Simulation,
Hull and White Model,
Black-Scholes Model,
Tree Model
Monte Carlo
Simulation, Hull and
White Model, DCF
Model, Closed form
formula
Valuation technique
Option Model
DCF Model, Closed
Form, FDM, Monte
Carlo Simulation, Hull-
White Model, Black-
Scholes Model, Option
Model, Tree Model,
Net Asset Value,
Income approach,
Market approach and
others
Unobservable inputs
Volatility
Correlation between
underlying asset
Volatility
Volatility of the stock
price
Volatility of the
interest rate
Discount rate
Correlation between
underlying asset
Unobservable inputs
Volatility of the
underlying asset
Correlation
Growth rate
Volatility of the
underlying asset
Volatility of real estate
price
Discount rate
Recovery rate
Correlation between
underlying asset
Relationship of unobservable inputs to
fair valueThe higher the volatility, the higher
the fair value fluctuation
The higher the absolute value of
correlation, the higher the fair value
fluctuation
The higher the volatility, the higher
the fair value fluctuation
The higher the volatility, the higher
the fair value fluctuation
The higher the volatility, the higher
the fair value fluctuation
The lower the discount rate, the
higher the fair value
The higher the absolute value of
correlation, the higher the fair value
fluctuation
Relationship of unobservable inputs to
fair value
The higher the volatility, the higher
the fair value fluctuation
The higher the correlation, the
higher the fair value fluctuation
The higher the growth rate, the
higher the fair value
The higher the sale price, the higher
the fair value
The higher the price of real estate,
the higher the fair value
The lower the discount rate, the
higher the fair value
The higher the recovery rate, the
higher the fair value
The higher the absolute value of
correlation, the higher the fair value
fluctuation
Range of unobservable
inputs(%)12.00~52.00
9.00~77.00
2.00~58.00
16.28
0.52
1.94~2.00
19.00~90.00
Range of unobservable
inputs(%)
11.25~31.28
8.79
0.29~2.20
11.25~41.00
-1.00~1.00
1.19~11.30
40.00
18.16~88.46
December 31, 2019
December 31, 2018
(In millions of Korean won)
(In millions of Korean won)
Financial assets at fair value through profit or loss
KB Financial Group Annual Report 2019140

Equity securities
Loans
Stock and index
Currency, interest rate and others
Equity securities
Financial liabilities
Derivative-linked securities
Fair value
371,545
213,203
50,824
60,239
1,332,718
₩ 9,170,587
10,873,383
Valuation technique
Income approach, Market approach, Asset value approach, DCF Model, Comparable Company Analysis, Adjusted discount rate method, Dividend Discount Model, Usage of past transactions, Tree Model and others
Tree Model
DCF Model, Closed Form, FDM, Monte Carlo Simulation, Hull and White Model, Black-Scholes Model, Tree ModelDCF Model, Hull and White Model, Monte Carlo Simulation, Tree Model
Adjusted discount rate method, IMV Model, DCF Model, Comparable Company Analysis, Dividend discount model, Option Model, Net asset value method, Market approach, One Factor Hull-White Model and others
DCF Model, Closed Form, FDM, Monte Carlo Simulation, Hull and White Model, Black Scholes-Model
Unobservable inputs
Growth rate
Discount rate
Liquidation value
Volatility
Correlation
Recovery rate
Volatility of the stock price
Volatility of the underlying asset
Correlation between underlying assetLoss given default
Volatility Correlation between underlying asset
Growth rate
Discount rate
Volatility
Volatility of the underlying assetCorrelation between underlying asset
Relationship of unobservable inputs to
fair valueThe higher the growth rate, the higher the fair valueThe lower the discount rate, the higher the fair valueThe higher the liquidation value, the higher the fair valueThe higher the volatility, the higher the fair value fluctuationThe higher the correlation, the higher the fair value fluctuationThe higher the recovery rate, the higher the fair valueThe higher the volatility, the higher the fair value fluctuation
The higher the correlation, the higher the fair value fluctuation
The higher the correlation, the higher the fair value fluctuationThe higher the loss given default, the lower the fair valueThe higher the volatility, the higher the fair value fluctuationThe higher the absolute value of correlation, the higher the fair value fluctuation
The higher the growth rate, the higher the fair valueThe lower the discount rate, the higher the fair valueThe higher the volatility, the higher the fair value fluctuation
The higher the volatility, the higher the fair value fluctuationThe higher the absolute value of correlation, the higher the fair value fluctuation
Range of unobservable
inputs(%)0~2.20
1.19~21.96
-1.00~1.00
11.25~39.94
77.62~79.78
40
13.11~49.28
14,00~50,00
8.74~68.77
100.00
1.00~36.00
-46.89~90.11
0~2.20
7.05~16.30
17.62~25.14
1.00~115.00
-49.00~90.11
December 31, 2018
(In millions of Korean won)
Derivatives held for trading
Financial assets measured at fair value through other comprehensive income
Financial liabilities designated at fair value through profit or loss
Financial Section 141

Stock and index
Others
Fair value
240,817
170,377
₩ 11,284,577
Valuation technique
DCF Model, Closed
Form, FDM, Monte
Carlo Simulation, Hull
and White Model,
Black-Scholes Model,
Tree Model
Monte Carlo Simulation,
Hull and White Model,
DCF Model, Closed
form formula
Unobservable inputs
Volatility
Correlation between
underlying asset
Volatility
Volatility of the stock
price
Volatility of the interest
rate
Discount rate
Correlation between
underlying asset
Relationship of unobservable inputs to
fair value
The higher the volatility, the higher
the fair value fluctuation
The higher the absolute value of
correlation, the higher the fair value
fluctuation
The higher the volatility, the higher
the fair value fluctuation
The higher the volatility, the higher
the fair value fluctuation
The higher the volatility, the higher
the fair value fluctuation
The higher the discount rate, the
lower the fair value
The higher the absolute value of
correlation, the higher the fair value
fluctuation
Range of unobservable
inputs(%)
2.00~54.00
4.27~70.17
1.00~115.00
20.85
0.69
2.19~2.26
-49.00~90.11
December 31, 2018
(In millions of Korean won)
Sensitivity analysis of changes in unobservable inputs
Sensitivity analysis of financial instruments is performed to measure favorable and unfavorable changes in the fair value of financial instruments which are
affected by the unobservable parameters, using a statistical technique. When the fair value is affected by more than two input parameters, the amounts
represent the most favorable or most unfavorable Level 3 financial instruments subject to sensitivity analysis are (i) equity-related derivatives, currency-related
derivatives and interest rate related derivatives whose fair value changes are recognized in profit or loss, (ii) financial liabilities designated at fair value through
profit or loss, and (iii) due from financial institutions, debt securities, equity securities and loan receivables whose fair value changes are recognized in profit or
loss or other comprehensive income. If overlay approach is applied in accordance with Korean IFRS 1104, changes in fair value of financial assets at fair value
through profit or loss are recognized as other comprehensive income.
The results of the sensitivity analysis from changes in inputs are as follows:
Financial assets Financial assets at fair value through profit or loss1
Due from financial institutions
Debt securities4
Equity securities3
Loans
Derivatives held for trading2
Financial assets measured at fair value
through other comprehensive income
Equity securities3
Financial liabilities Financial liabilities designated at fair value
through profit or loss1
Derivatives held for trading2
Favorable changes
\ 3
30,771
24,456
6,362
25,830
-
\ 87,422
\ 49,730
14,638
\ 64,368
Favorable changes
\ 2
2,341
1,110
-
-
214,268
\ 217,721
\ -
-
\ -
Unfavorable changes
\ (3)
(27,062)
(10,251)
(4,344)
(29,317)
-
\ (70,977)
\ (44,136)
(13,572)
\ (57,708)
Unfavorable changes
\ (2)
(2,276)
(824)
-
-
(110,687)
\ (113,789)
\ -
-
\ -
2019Recognition in profit or loss Other comprehensive income
(In millions of Korean won)
Derivatives held for trading
KB Financial Group Annual Report 2019142

Financial assets Financial assets at fair value through profit or loss 1
Due from financial institutions
Debt securities 4
Equity securities 3
Loans
Derivatives held for trading2
Financial assets measured at fair value
through other comprehensive income
Equity securities 3
Financial liabilities Financial liabilities designated at fair value
through profit or loss1
Derivatives held for trading2
Favorable changes
\ 4
20,261
14,241
129
27,639
-
\ 62,274
\ 146,135
112,827
\ 258,962
Favorable changes
\ 32
2,183
848
-
-
162,563
\ 165,626
\ -
-
\ -
Unfavorable changes
\ (2)
(17,885)
(10,162)
(46)
(26,155)
-
\ (54,250)
\ (157,361)
(105,875)
\ (263,236)
Unfavorable changes
\ (47)
(2,097)
(656)
-
-
(86,094)
\ (88,894)
\ -
-
\ -
2018Recognition in profit or loss Other comprehensive income
(In millions of Korean won)
1 For financial instruments at fair value through profit or loss, the changes in fair value are calculated by shifting principal unobservable input parameters such as volatility of the underlying asset or correlation between underlying asset by ± 10%.
2 For Derivatives financial instruments, the changes in fair value are calculated by shifting principal unobservable input parameters; such as, price of underlying asset, volatility of stock price, interest rate by ± 10% and the loss given default ratio, discount rate by ± 1%
3 For equity securities, the changes in fair value are calculated by shifting principal unobservable input parameters; such as, correlation between growth rate (0~2.2%) and discount rate.
4 Sensitivity of fair values to unobservable parameters of private equity fund is practically impossible, but in the case of equity fund composed of real estates, the changes in fair value are calculated by shifting correlation between discount rate (-1~1%) and volatilities of real estate price (-1~1%).
1 For financial instruments at fair value through profit or loss, the changes in fair value are calculated by shifting principal unobservable input parameters such as volatility of the underlying asset or correlation between underlying asset by ± 10%.
2 For Derivatives financial instruments, the changes in fair value are calculated by shifting principal unobservable input parameters; such as, price of underlying asset, volatility of stock price, interest rate by ± 10% and the loss given default ratio, discount rate by ± 1%
3 For equity securities, the changes in fair value are calculated by shifting principal unobservable input parameters; such as, correlation between growth rate (0~2.2%) and discount rate, or liquidation value (-1~1%) and discount rate.
4 Sensitivity of fair values to unobservable parameters of private equity fund is practically impossible, but in the case of equity fund composed of real estates, the changes in fair value are calculated by shifting correlation between discount rate (-1~1%) and volatilities of real estate price (-1~1%).
6.2.4 Day one gain or loss
If the Group uses a valuation technique that incorporates data not obtained from observable markets for the fair value at initial recognition of financial instruments, there could be a difference between the transaction price and the amount determined using that valuation technique. In these circumstances, the fair value of financial instruments is recognized as the transaction price, and the difference is deferred and not recognized in profit or loss, and is amortized by using the straight-line method over the life of the financial instrument. When the fair value of the financial instruments is subsequently determined using observable market inputs, the remaining deferred amount is recognized in profit or loss.
The aggregate difference yet to be recognized in profit or loss at the beginning and end of the year and a reconciliation of changes in the balance of this difference for the years ended December 31, 2019 and 2018, are as follows:
6.3 Carrying Amounts of Financial Instruments by Category
Financial assets and liabilities are measured at fair value or amortized cost. The measurement methodology by categories of financial instruments is
addressed at Note 3.
Balance at the beginning of the yearNew transactions and othersChanges during the yearBalance at the end of the year
2019 \ 62,155
168,225(184,613)
\ 45,767
2018 \ 22,814
131,504(92,163)
\ 62,155
(In millions of Korean won)
Financial Section 143

Financial assets Cash and due from financial institutions Financial assets at fair value through profit or loss Derivatives Loans at amortized cost Financial investments Other financial assets
Financial assets Cash and due from financial institutions Financial assets at fair value through profit or loss Derivatives Loans at amortized cost Financial investments Other financial assets
Financial liabilities Financial liabilities at fair value through profit or loss Derivatives Deposits Debts Debentures Other financial liabilities
Financial instruments at fair value
through profit or loss
\ -
53,549,0863,008,598
---
\56,557,684
Financial instruments at fair value
through profit or loss
\ -
50,987,8471,915,532
---
\ 52,903,379
Financial instruments at fair value
through profit or loss
\ 2,663,3272,842,950
----
\ 5,506,277
Financial instruments at amortized
cost
\ 20,837,878
--
339,684,05925,346,555
9,147,059\395,015,551
Financial instruments at amortized
cost
\ 20,274,490
--
319,201,60323,661,522
8,133,556\ 371,271,171
Derivatives heldfor hedging
\ -164,391
----
\ 164,391
Derivatives held for hedging
\ - -
182,075---
\182,075
Derivatives held for hedging
\ -
-110,430
---
\ 110,430
Total
\20,837,878
53,549,0863,190,673
339,684,05971,782,606
9,147,059\498,191,361
Total
\ 20,274,490
50,987,8472,025,962
319,201,60361,665,094
8,133,556\ 462,288,552
Total
\ 15,368,1533,007,341
305,592,77137,818,86050,935,58322,629,587
\ 435,352,295
Financial assets measured
at fair value through other comprehensive
income
\ -
---
43,931,946-
\43,931,946
Financial assets measured
at fair value through other comprehensive
income
\ -
---
35,633,456-
\ 35,633,456
Financial instruments designated at fair value through profit or loss
\ 12,704,826-----
\ 12,704,826
Financial instruments
designated at fair value through other
comprehensive income
\ -
---
2,504,105-
\2,504,105
Financial instruments
designated at fair value through other
comprehensive income
\ -
---
2,370,116-
\ 2,370,116
Financialinstruments atamortized cost
\ -
-305,592,771
37,818,86050,935,58322,629,587
\ 416,976,801
2019
2018
2019
(In millions of Korean won)
(In millions of Korean won)
(In millions of Korean won)
The carrying amounts of financial assets and liabilities by category as of December 31, 2018 and 2017, are as follows:
KB Financial Group Annual Report 2019144

Financial liabilities Financial liabilities at fair value through profit or loss Derivatives Deposits Debts Debentures Other financial liabilities
Discovery ABS Second Co., Ltd.
FK1411 Co., Ltd.
AP 3B ABS Ltd.
AP 4D ABS Ltd.1
Discovery ABS Second Co., Ltd.
FK1411 Co., Ltd.
AP 3B ABS Ltd.
AP 4D ABS Ltd.1
Financial instruments at fair value
through profit or loss
\ 2,823,8202,724,994
----
\ 5,548,814
Financial instruments at amortized
cost
\ --
276,770,44933,004,83453,278,69719,828,307
\ 382,882,287
Classification of financial
instruments
Financial assets at fair value through profit or loss
Financial assets at fair value through profit or loss
Financial assets at fair value through profit or loss
Financial assets at fair value through profit or loss
Classification of financial
instruments
Financial assets at fair value through profit or loss
Financial assets at fair value through profit or loss
Financial assets at fair value through profit or loss
Financial assets at fair value through profit or loss
Derivatives held for hedging
\ -176,253
----
\ 176,253
Carrying amount of continuing involvement in
the statement of financial position
\ 5,596
5,428
3,205
6,175
\ 20,404
Carrying amount of continuing involvement in
the statement of financial position
\ 6,205
8,883
5,512
13,494
\ 34,094
Total
\ 15,326,8592,901,247
276,770,44933,004,83453,278,69719,828,307
\ 401,110,393
Fair value of continuing
involvement
\ 5,596
5,428
3,205
6,175
\ 20,404
Fair value of continuing
involvement
\ 6,205
8,883
5,512
13,494
\ 34,094
Financialinstruments
designated at fairvalue throughprofit or loss
\ 12,503,039
-----
\ 12,503,039
Type of continuing involvement
Subordinate debt
Subordinate debt
Subordinate debt
Subordinated debt
Type of continuing involvemen
Subordinate debt
Subordinate debt
Subordinate debt
Subordinated debt
2018
2019
2018
(In millions of Korean won)
(In millions of Korean won)
(In millions of Korean won)
6.4 Transfer of Financial Assets
Transferred financial assets that are derecognized in their entirety
The Group transferred loans and other financial assets that are derecognized in their entirety to SPEs (special purpose entity), while the maximum exposure to
loss (carrying amount) from its continuing involvement in the derecognized financial assets as of December 31, 2019 and 2018, are as follows:
1 Other than above, additionally recovered portion in excess of the consideration paid attributable to adjustments based on the agreement with the National Happiness Fund for non-performing loans amounts to \ 13,731 million as at December 31, 2018.
Financial Section 145

Transferred financial assets that are not derecognized in their entirety
The Group securitized the loans and issued the asset-backed debentures. The senior debentures and related securitized assets as of December 31, 2019,
are as follows:
The Group transferred held in the previous year the beneficiary certificates to Yuanta Securities at \ 74,853 million and entered into a total return swap
contract. If the fair value of the transferred asset changes, the risk is attributed to the company in accordance with the contract.
Securities under repurchase agreements and loaned securities
The Group continues to recognize the financial assets related to repurchase agreements and securities lending transactions on the statements of financial
position since those transactions are not qualified for derecognition even though the Group transfers the financial assets. A financial asset is sold under
a repurchase agreement to repurchase the same asset at a fixed price, or loaned under a securities lending agreement to be returned as the same asset.
Thus, the Group retains substantially all the risks and rewards of ownership of the financial asset. The amounts of transferred assets and related liabilities as
of December 31, 2019 and 2018, are as follows:
6.5 Offsetting Financial Assets and Financial Liabilities
The Group enters into International Swaps and Derivatives Association (“ISDA”) master netting agreements and other similar arrangements with the Group’s
derivative and spot exchange counterparties. Similar netting agreements are also entered into with the Group’s reverse repurchase, securities and others.
Pursuant to these agreements, in the event of default by one party, contracts are to be terminated and receivables and payables are to be offset. Further,
as the law allows for the right to offset, domestic uncollected receivables balances and domestic accrued liabilities balances are shown in its net settlement
balance in the consolidated statement of financial position.
KB Kookmin Card Third Securitization Co., Ltd.1
KB Kookmin Card Fourth Securitization Co., Ltd. 1
KB Kookmin Card Fifth Securitization Co., Ltd. 1
KB Kookmin Card Sixth Securitization Co., Ltd. 1
Repurchase agreements1
Loaned securities
Government bond
Stock
Repurchase agreements1
Loaned securities
Government bond
Stock
Carrying amount of underlying assets
\ 601,659
560,903
542,861
795,884
\ 2,501,307
Fair value of underlying assets
\ 592,358
552,216
534,630
784,080
\ 2,463,284
Carrying amount of senior debentures
\ 351,207
347,387
299,795
461,909
\ 1,460,298
Carrying amount of transferred assets\ 9,292,858
2,259,096
25,725
\ 11,577,679
Carrying amount of transferred assets\ 9,176,947
1,160,362
58,171
\ 10,395,480
Fair value of senior debentures
\ 342,204
340,820
304,835
469,600
\ 1,457,459
Carrying amount of related liabilities\ 8,884,847
-
-
\ 8,884,847
Carrying amount of related liabilities\ 8,784,896
-
-
\ 8,784,896
2019
2019
2018
(In millions of Korean won)
(In millions of Korean won)
(In millions of Korean won)
1 The Group has an obligation to early redeem the asset-backed debentures upon occurrence of an event specified in the agreement such as when the outstanding balance
of the eligible asset-backed securitization (ABS), a trust-type ABS, is below the solvency margin ratio(minimum rate: 104.5%) of the beneficiary interest in the trust. To avoid
such early redemption, the Group entrusts accounts and deposits in addition to the previously entrusted card accounts.
1 The bond sold under repurchase agreements amounts to \ 4,126,274 million and \ 3,162,000 million as of December 31, 2019 and 2018, respectively.
KB Financial Group Annual Report 2019146

Details of financial assets subject to offsetting, enforceable master netting arrangements or similar agreement as of December 31, 2019 and 2018, are as
follows:
Details of financial liabilities subject to offsetting, enforceable master netting arrangements or similar agreement as of December 31, 2019 and 2018, are as
follows:
Derivatives held for trading and
derivatives linked securities
Derivatives held for hedging
Payable spot exchange
Repurchase agreements
Domestic exchange settlement credits
Other financial instruments
Derivatives held for trading and deriv
atives linked securities
Derivatives held for hedging
Payable spot exchange
Repurchase agreements1
Securities borrowing agreements
Domestic exchange settlement credits
Other financial instruments
Derivatives held for trading and
derivatives linked securities
Derivatives held for hedging
Payable spot exchange
Repurchase agreements
Domestic exchange settlement credits
Other financial instruments
Gross assets
\ 3,043,757
182,075
3,051,390
6,507,646
31,344,009
1,043,320
\ 45,172,197
Gross liabilities
\ 2,936,638
164,391
3,050,982
13,011,121
2,583,092
32,867,423
1,156,345
\ 55,769,992
Gross assets
\ 1,893,335
110,430
2,222,164
3,411,700
27,723,990
1,157,569
\ 36,519,188
Gross asset offset
\ -
-
-
-
(30,794,160)
(1,022,977)
\ (31,817,137)
Gross asset offset
\ -
-
-
-
-
(30,794,160)
(1,022,977)
\ (31,817,137)
Gross asset offset
\ -
-
-
-
(26,992,637)
(1,103,015)
\ (28,095,652)
Net amounts presented in the
statement of financial position
\ 3,043,757
182,075
3,051,390
6,507,646
549,849
20,343
\ 13,355,060
Net amounts presented in the
statement of financial position
\ 2,936,638
164,391
3,050,982
13,011,121
2,583,092
2,073,263
133,368
\ 23,952,855
Net amounts presented in the
statement of financial position
\ 1,893,335
110,430
2,222,164
3,411,700
731,353
54,554
\ 8,423,536
Financial instruments
\ (2,122,160)
(3,050,116)
(6,507,046)
-
(2,492)
\ (11,681,814)
Financial instruments
\ (2,182,243)
(3,034,679)
(13,000,321)
(2,583,092)
(2,073,263)
(2,492)
\ (22,876,090)
Financial instruments
\ (1,511,752)
(2,213,967)
(3,332,700)
-
(3,932)
\ (7,062,351)
Cash collateral
\ (288,040)
-
-
-
-
\ (288,040)
Cash collateral
\ (92,565)
-
-
-
-
-
-
\ (92,565)
Cash collateral
\ (5,101)
-
-
-
-
\ (5,101)
Net amount
\ 815,632
1,274
600
549,849
17,851
\ 1,385,206
Net amount
\ 826,221
16,303
10,800
-
-
130,876
\ 984,200
Net amount
\ 486,912
8,197
79,000
731,353
50,622
\ 1,356,084
Non-offsetting amount
Non-offsetting amount
Non-offsetting amount
2019
2019
2018
Financial Section 147

7. Due from Financial Institutions at Amortized CostDetails of due from financial institutions as of December 31, 2019 and 2018, are as follows:
Restricted cash from financial institutions as of December 31, 2019 and 2018, are as follows:
Derivatives held for trading and deriv
atives linked securities
Derivatives held for hedging
Payable spot exchange
Repurchase agreements1
Securities borrowing agreements
Domestic exchange settlement credits
Other financial instruments
Gross liabilities
\ 2,557,169
176,253
2,219,980
11,946,896
2,745,906
28,672,551
1,151,697
\ 49,470,452
Gross asset offset
\ -
-
-
-
-
(26,992,637)
(1,103,015)
\ (28,095,652)
Net amounts presented in the
statement of financial position
\ 2,557,169
176,253
2,219,980
11,946,896
2,745,906
1,679,914
48,682
\ 21,374,800
Financial instruments
\ (1,965,456)
(2,208,302)
(11,862,096)
(2,745,906)
(1,679,914)
(3,932)
\ (20,465,606)
Cash collateral
\ (47,746)
-
-
-
-
-
\ (47,746)
Net amount
\ 720,220
11,678
84,800
-
-
44,750
\ 861,448
Non-offsetting amount2018
(In millions of Korean won)
1 Includes repurchase agreements sold to customers.
1 Before netting of allowance.
1 Before netting of allowance.
Due from financial
institutions in Korean won
Due from financial
institutions in foreign
currencies
Due from financial
institutions in Korean won
Due from financial
institutions in foreign
currencies
Due from Bank of Korea
Due from banking institutions
Due from others
Due from banking institutions
Time deposits
Due from others
Due from Bank of Korea
Due from banking institutions
Due from others
Due from banking institutions
Time deposits
Due from others
Financial institutionsBank of Korea
KEB Hana Bank and others
Korea Securities Finance
Corporation and others
Bank of Korea and others
INDUSTRIAL BANK
CHANGSHA BR. and others
Morgan Stanley Bank
International and others
Financial InstitutionsBank of Korea
NH Investment
Securities and others
Korea Securities Finance
Corporation and others
Bank of Korea and others
ICBC NEW YORK and
others
Morgan Stanley Bank
International and others
Interest rate(%)-
0.00~2.75
0.00~1.23
0.00~0.50
0.00~7.80
0.00~8.00
December 31, 2019\ 8,117,840
3,027,963
555,294
\ 11,701,097
490,071
31,443
1,150,355
1,671,869
\ 13,372,966
2019\ 8,117,840
4,641,714
654,981
13,414,535
2,351,929
1,053,776
1,327,432
4,733,137
\ 18,147,672
December 31, 2018\ 8,723,761
1,348,099
655,194
\ 10,727,054
375,130
30,538
1,214,905
1,620,573
\ 12,347,627
2018\ 8,723,761
3,245,841
1,132,908
13,102,510
1,734,660
1,001,600
1,379,537
4,115,797
\ 17,218,307
Reason for restrictionBank of Korea Act
Net settlement
and others
Derivatives margin
account and others
Bank of Korea Act and
others
Bank Act of the
State of New York
and others
Derivatives margin
account and others
(In millions of Korean won)
(In millions of Korean won)
KB Financial Group Annual Report 2019148

Changes in the allowances for due from financial institutions losses
Changes in the allowances for due from financial institutions losses for the year ended December 31, 2018, are as follows:
8. Assets Pledged as CollateralDetails of assets pledged as collateral as of December 31, 2019 and 2018, are as follows:
Beginning
Transfer between stages
Transfer to 12-month expected credit losses
Transfer to lifetime expected credit losses
Impairment
Disposal
Provision for loan losses
Others (change of currency ratio, etc.)
Ending
Beginning 1
Transfer between stages
Transfer to 12-month expected credit losses
Transfer to lifetime expected credit losses
Impairment
Disposal
Provision for loan losses
Others (change of currency ratio, etc.)
Ending
Assets pledged
Due from financial institutions
Financial assets measured
at fair value through profit or loss
Pledgee
Korea Federation of Savings Banks and
others
Korea Securities Depository and others
Korea Securities Depository and others
Samsung Futures Inc. and others
Non-impaired
\ -
-
-
-
-
1,210
(22)
\ 1,188
Non-impaired
\ -
-
-
-
-
-
-
-
\ -
Impaired
\ -
-
-
-
-
360
-
\ 360
Impaired
\ -
-
-
-
-
-
-
-
\ -
The financial instruments applying 12-month expected
credit losses
\ 2,019
-
-
-
-
1,116
29
\ 3,164
The financial instruments applying 12-month expected
credit losses
\ 1,797
-
-
-
-
221
1
\ 2,019
Carrying amount \ 3,752,497
7,561,287
7,745,154
1,090,495
\ 16,396,936
Reason of pledgeBorrowings from Bank and others
Repurchase agreements
Securities borrowing transactions
Derivatives transactions
The financial instruments applying lifetime expected credit losses
The financial instruments applying lifetime expected credit losses
2019
2018
2019
(In millions of Korean won)
(In millions of Korean won)
(In millions of Korean won)
1 Restated based on Korean IFRS 1109.
Financial Section 149
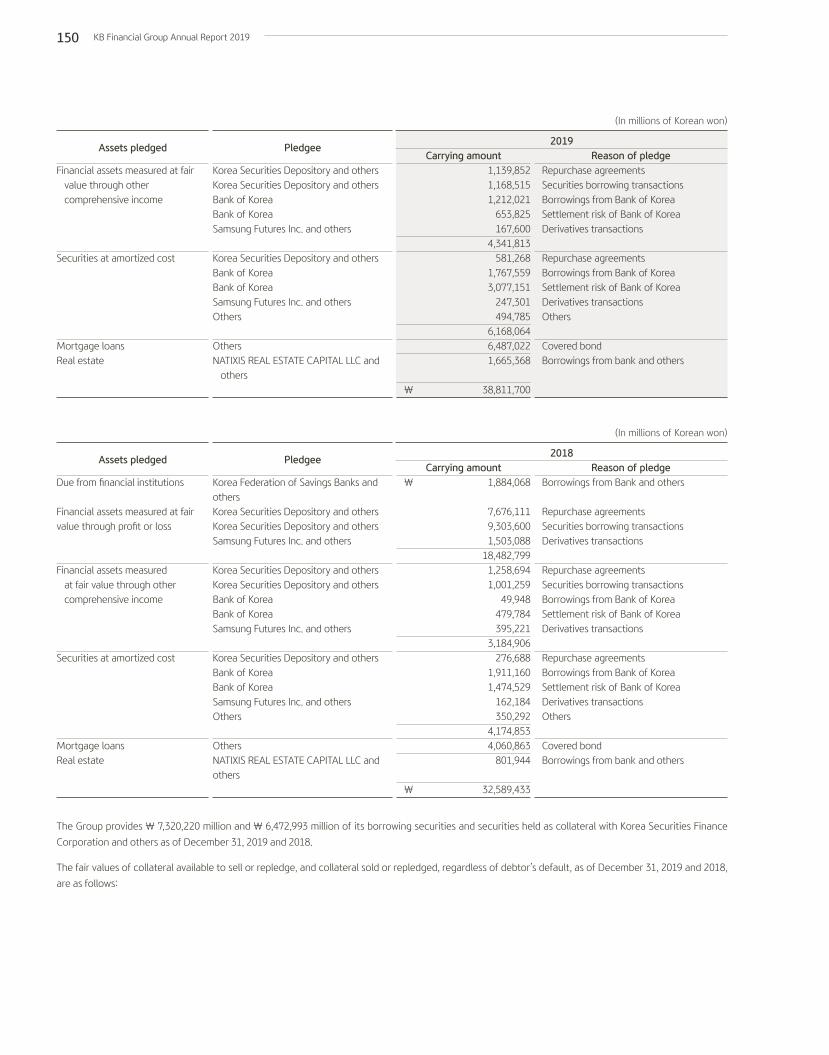
Assets pledged
Financial assets measured at fair value through other comprehensive income
Securities at amortized cost
Mortgage loansReal estate
Assets pledged
Due from financial institutions Financial assets measured at fair value through profit or loss
Financial assets measured at fair value through other comprehensive income
Securities at amortized cost
Mortgage loansReal estate
Pledgee
Korea Securities Depository and others Korea Securities Depository and othersBank of KoreaBank of KoreaSamsung Futures Inc. and others
Korea Securities Depository and othersBank of KoreaBank of KoreaSamsung Futures Inc. and othersOthers
OthersNATIXIS REAL ESTATE CAPITAL LLC and others
Pledgee
Korea Federation of Savings Banks and othersKorea Securities Depository and othersKorea Securities Depository and othersSamsung Futures Inc. and others
Korea Securities Depository and others Korea Securities Depository and othersBank of KoreaBank of KoreaSamsung Futures Inc. and others
Korea Securities Depository and othersBank of KoreaBank of KoreaSamsung Futures Inc. and othersOthers
OthersNATIXIS REAL ESTATE CAPITAL LLC and others
Carrying amount 1,139,8521,168,5151,212,021
653,825167,600
4,341,813581,268
1,767,5593,077,151
247,301494,785
6,168,0646,487,0221,665,368
\ 38,811,700
Carrying amount \ 1,884,068
7,676,1119,303,6001,503,088
18,482,7991,258,6941,001,259
49,948479,784395,221
3,184,906276,688
1,911,1601,474,529
162,184350,292
4,174,8534,060,863
801,944
\ 32,589,433
Reason of pledgeRepurchase agreementsSecurities borrowing transactionsBorrowings from Bank of KoreaSettlement risk of Bank of KoreaDerivatives transactions
Repurchase agreementsBorrowings from Bank of KoreaSettlement risk of Bank of KoreaDerivatives transactionsOthers
Covered bondBorrowings from bank and others
Reason of pledgeBorrowings from Bank and others Repurchase agreementsSecurities borrowing transactionsDerivatives transactions
Repurchase agreementsSecurities borrowing transactionsBorrowings from Bank of KoreaSettlement risk of Bank of KoreaDerivatives transactions
Repurchase agreementsBorrowings from Bank of KoreaSettlement risk of Bank of KoreaDerivatives transactionsOthers
Covered bondBorrowings from bank and others
2019
2018
(In millions of Korean won)
(In millions of Korean won)
The Group provides \ 7,320,220 million and \ 6,472,993 million of its borrowing securities and securities held as collateral with Korea Securities Finance
Corporation and others as of December 31, 2019 and 2018.
The fair values of collateral available to sell or repledge, and collateral sold or repledged, regardless of debtor’s default, as of December 31, 2019 and 2018,
are as follows:
KB Financial Group Annual Report 2019150

9. Derivative Financial Instruments and Hedge AccountingThe Group’s derivative operations focus on addressing the needs of the Group’s corporate clients to hedge their risk exposure and to hedge the Group’s risk exposure that results from such client contracts. The Group also engages in derivative trading activities to hedge the interest rate and foreign currency risk exposures that arise from the Group’s own assets and liabilities. In addition, the Group engages in proprietary trading of derivatives within the Group’s regulated open position limits.
The Group provides and trades a range of derivatives products, including:
- Interest rate swaps, relating to interest rate risks in Korean won- Cross-currency swaps, forwards and options relating to foreign exchange rate risks,- Stock price index options linked with the KOSPI index.
In particular, the Group applies fair value hedge accounting using cross currency swaps, interest rate swaps and others to hedge the risk of changes in fair values due to the changes in interest rates and foreign exchange rates of structured debts in Korean won, financial debentures in foreign currencies, structured deposits in Korean won, and structured deposits in foreign currencies. In addition, the Group applies net investment hedge accounting by designating financial debentures in foreign currencies as hedging instruments to hedge foreign exchange risks on net investments in foreign operations.
Details of derivative financial instruments held for trading as of December 31, 2019 and 2018, are as follows:
Securities
Securities
Interest rateForwardsFutures1
SwapsOptions
CurrencyForwardsFutures1
Swaps Options
Stock and indexFutures1
SwapsOptions
CreditSwaps
CommodityFutures1
Swaps
Other
Fair value of collateral held \ 6,726,632
Fair value of collateral held \ 3,547,179
Notional amount
\ 570,0002,951,770
270,091,77817,521,156
291,134,704
87,373,417 107,793
46,501,399 2,789,562
136,772,171
1,646,785 6,773,467 5,559,865
13,980,117
4,433,960 4,433,960
3,281
105,658 108,939
3,160,013 \ 449,589,904
Notional amount
\ 570,0004,269,407
219,558,59216,937,362
241,335,361
74,189,998602,805
36,073,9952,449,469
113,316,267
1,155,8618,190,6485,442,775
14,789,284
4,300,2084,300,208
5,807140,382146,189
2,361,827\ 376,249,136
Assets
\ 206698
512,145267,697780,746
942,632 -
606,464 5,438
1,554,534
22,451 448,803
99,013 570,267
19,178 19,178
68
2,948 3,016
80,857 \ 3,008,598
Assets
\ -1,124
421,591159,218581,933
622,74537
470,4996,071
1,099,352
4,90282,80370,740
158,445
32,71132,711
1502,2022,352
40,739\ 1,915,532
Liabilities
\ 84,126235
557,511379,262
1,021,134
750,380 349
610,275 14,346
1,375,350
20,704 86,100
176,141 282,945
13,659 13,659
3
474 477
149,385\ 2,842,950
Liabilities
\ 55,0563,852
471,915276,392807,215
548,127240
452,39013,602
1,014,359
10,820321,135464,226796,181
25,04725,047
1283,1993,327
78,865\ 2,724,994
Fair value of collateral sold or repledged \ -
Fair value of collateral sold or repledged \ -
Total \ 6,726,632
Total \ 3,547,179
2019
2018
2019 2018
(In millions of Korean won)
(In millions of Korean won)
(In millions of Korean won)
1 Gains or losses arising from daily mark-to-market futures are reflected in the margin accounts.
Financial Section 151
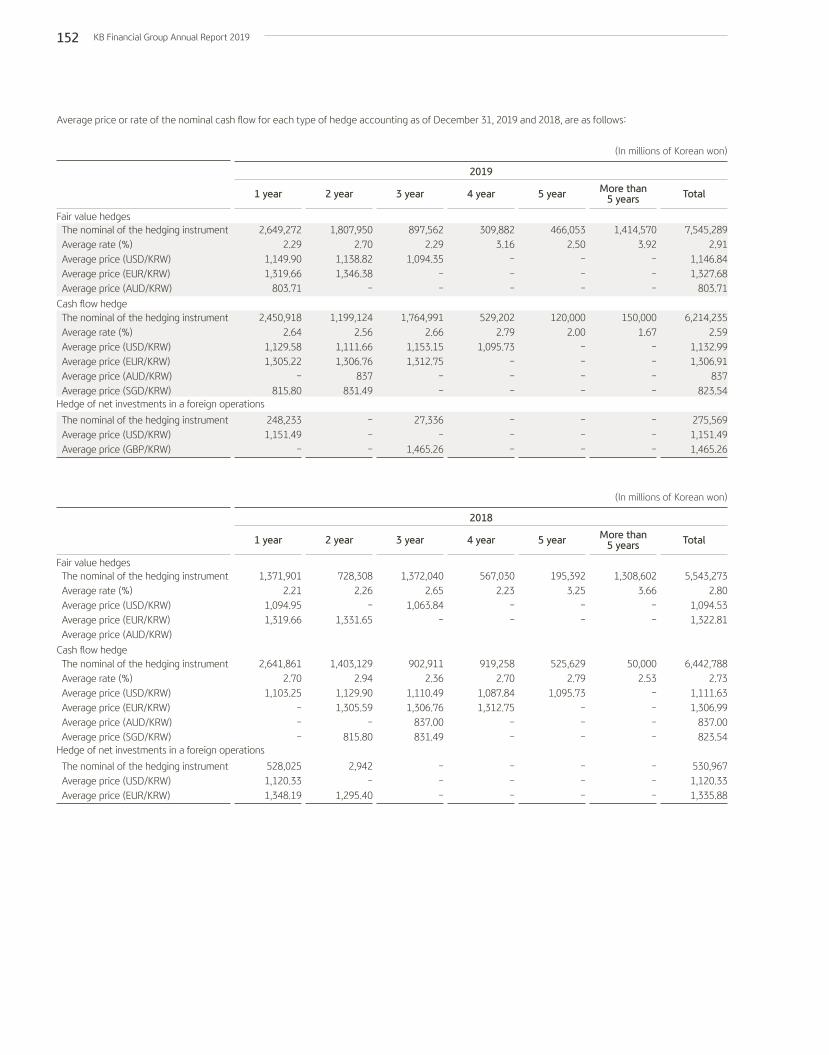
The nominal of the hedging instrument Average rate (%) Average price (USD/KRW) Average price (EUR/KRW) Average price (AUD/KRW)
The nominal of the hedging instrument Average rate (%) Average price (USD/KRW) Average price (EUR/KRW) Average price (AUD/KRW) Average price (SGD/KRW)
The nominal of the hedging instrument Average price (USD/KRW) Average price (GBP/KRW)
The nominal of the hedging instrument Average rate (%) Average price (USD/KRW) Average price (EUR/KRW) Average price (AUD/KRW)
The nominal of the hedging instrument Average rate (%) Average price (USD/KRW) Average price (EUR/KRW) Average price (AUD/KRW) Average price (SGD/KRW)
The nominal of the hedging instrument Average price (USD/KRW) Average price (EUR/KRW)
1 year
2,649,272
2.29 1,149.90 1,319.66
803.71
2,450,918 2.64
1,129.58 1,305.22
- 815.80
248,233 1,151.49
-
1 year
1,371,901
2.211,094.951,319.66
2,641,8612.70
1,103.25---
528,0251,120.331,348.19
3 year
897,562
2.29 1,094.35
- -
1,764,991
2.66 1,153.15 1,312.75
- -
27,336
- 1,465.26
3 year
1,372,040
2.651,063.84
-
902,9112.36
1,110.491,306.76
837.00831.49
---
5 year
466,053
2.50 - - -
120,000
2.00 - - - -
- - -
5 year
195,392
3.25--
525,6292.79
1,095.73---
---
2 year
1,807,950 2.70
1,138.82 1,346.38
-
1,199,124 2.56
1,111.66 1,306.76
837 831.49
- - -
2 year
728,3082.26 -
1,331.65
1,403,129
2.941,129.901,305.59
-815.80
2,942 -
1,295.40
4 year
309,882
3.16 - - -
529,202
2.79 1,095.73
- - -
- - -
4 year
567,030
2.23--
919,2582.70
1,087.841,312.75
--
---
More than 5 years
1,414,570
3.92 - - -
150,000
1.67 - - - -
- - -
More than 5 years
1,308,602
3.66--
50,0002.53
----
---
Total
7,545,289
2.91 1,146.84 1,327.68
803.71
6,214,235 2.59
1,132.99 1,306.91
837 823.54
275,569 1,151.49 1,465.26
Total
5,543,273
2.801,094.531,322.81
6,442,7882.73
1,111.631,306.99
837.00823.54
530,9671,120.331,335.88
2019
2018
(In millions of Korean won)
(In millions of Korean won)
Average price or rate of the nominal cash flow for each type of hedge accounting as of December 31, 2019 and 2018, are as follows:
Fair value hedges
Fair value hedges
Cash flow hedge
Cash flow hedge
Hedge of net investments in a foreign operations
Hedge of net investments in a foreign operations
KB Financial Group Annual Report 2019152

Fair Value Hedge
Details of derivative instruments designated as fair value hedge as of December 31, 2019 and 2018, are as follows:
Details of derivative instruments designated as fair value hedge as of December 31, 2019 and 2018, are as follows:
Debt securities in KRW
Debt securities in foreign currencies
Deposits in foreign currencies
Debts in KRW
Debts in foreign currencies
Debt securities in foreign currencies
Debt securities in KRW
Debt securities in foreign currencies
Deposits in foreign currencies
Debts in KRW
Debts in foreign currencies
Debt securities in foreign currencies
Interest rate
Currency
Interest rate
Currency
Assets
\ 549,526
1,670,838
-
-
-
2,220,364
2,339,239
2,339,239
\ 4,559,603
Liabilities
\ -
-
780,491
351,070
2,067,556
3,199,117
-
-
\ 3,199,117
Liabilities
\ -
-
(18,391)
21,070
41,406
44,085
-
-
\ 44,085
Assets
\ 465,213
702,727
-
-
-
1,167,940
1,845,253
1,845,253
\ 3,013,193
Liabilities
\ -
-
805,215
349,252
1,429,457
2,583,924
-
-
\ 2,583,924
Liabilities
\ -
-
(89,265)
19,252
(24,073)
(94,086)
-
-
\ (94,086)
Assets
\ 5,485
19,243
-
-
-
24,728
24,181
24,181
\ 48,909
Assets
\ 1,214
(9,790)
-
-
-
(8,576)
(75,255)
(75,255)
\ (83,831)
Changes in the fair value
\ 5,502
25,540
(62,439)
(1,818)
(65,480)
(98,695)
61,133
61,133
\ (37,562)
Changes in the fair value
\ 6,001
(1,233)
38,232
(2,308)
(1,868)
38,824
86,209
86,209
\ 125,033
Carrying amount
Carrying amount
Accumulated adjusted amount
Accumulated adjusted amount
2019
2018
(In millions of Korean won)
(In millions of Korean won)
Hedge accounting
Hedge accounting
Interest rateSwaps
CurrencyForwards
Interest rateSwaps
CurrencyForwards
National amount
\ 5,326,500
2,218,789
\ 7,545,289
National amount
\ 3,845,555
1,697,718
\ 5,543,273
Liabilities
\ 29,676
27,862
\ 57,538
Liabilities
\ 88,017
32,565
\ 120,582
Assets
\ 129,085
22,503
\ 151,588
Assets
\ 58,933
5,923
\ 64,856
Changes in the fair value1
\ 101,448
(74,372)
\ 27,076
Changes in the fair value
\ (37,638)
(106,903)
\ (144,541)
2019
2018
(In millions of Korean won)
(In millions of Korean won)
Financial Section 153

Details of hedge ineffectiveness recognized in profit or loss from derivatives for the year ended December 31, 2019 and 2018, are as follows:
Gains and losses from fair value hedging instruments and hedged items attributable to the hedged risk for the years ended December 31, 2019 and
2018, are as follows:
Cash Flow Hedge
Details of hedged item in cash flow hedge as of December 31, 2019 and 2018 are as follows:
From hedge accounting
Interest rate
Currency rate
Hedge accounting
Interest rate risk
Foreign currency change risk
Hedge accounting
Interest rate risk
Foreign currency change risk
Gains (losses) on hedging instruments
Gains (losses) on the hedged items attributable to the hedged risk
2019
\ 2,753
(13,239)
\ (10,486)
Changes in fair value
₩ 25,671
42,357
₩ 68,028
Changes in fair value
₩ 5,971
18,650
₩ 24,621
2019₩ 34,070
(44,655)
₩ (10,585)
2018
\ 1,186
(20,694)
\ (19,508)
Other comprehensive income for cash flow hedge
₩ 15,670)
(11,663)
₩ (27,333)
Other comprehensive income for cash flow hedge
₩ 4,686
1,163
₩ 5,849
2018₩ (160,416)
135,556
₩ (24,860)
Hedge ineffectiveness recognized in profit or loss
2019
2018
(In millions of Korean won)
(In millions of Korean won)
(In millions of Korean won)
(In millions of Korean won)
Details of derivative instruments designated as cash flow hedge as of December 31, 2019 and 2018, are as follows:
Interest rateSwaps
CurrencySwaps
National amount
₩ 3,600,334
2,613,901
₩ 6,214,235
Liabilities
₩ 28,484
73,067
₩ 101,551
Assets
₩ 3,698
23,382
₩ 27,080
Changes in the fair value
₩ (25,997)
(38,534)
₩ (64,531)
2019
(In millions of Korean won)
KB Financial Group Annual Report 2019154

Gains and losses from cash flow hedging instruments and hedged items attributable to the hedged risk for the years ended December 31, 2019 and
2018, are as follows:
Amounts recognized in other comprehensive income and reclassified from equity to profit or loss for the years ended December 31, 2019 and 2018, are
as follows:
Gains (losses) on hedging instruments
Gains (losses) on effectiveness (amount recognized in other comprehensive income)
Gains (losses) on ineffectiveness (amount recognized in profit or loss)
Amount recognized in other comprehensive income
Amount reclassified from equity to profit or loss
Tax effect
Amount recognized in other comprehensive income net of tax
2019\ (64,531)
(65,323)
\ 792
2019\ (65,323)
21,604
10,537
\ (33,182)
2018\ (23,022)
(24,672)
\ 1,650
2018\ (24,672)
15,234
400
\ (9,038)
(In millions of Korean won)
(In millions of Korean won)
Interest rateSwaps
CurrencySwaps
National amount
₩ 4,142,336
2,300,452
₩ 6,442,788
Liabilities
₩ 12,766
40,493
₩ 53,259
Assets
₩ 17,891
22,759
₩ 40,650
Changes in the fair value
₩ (6,364)
(16,658)
₩ (23,022)
2018
(In millions of Korean won)
Hedge on Net Investments in Foreign Operations
Details of hedged item in hedge on foreign operation net investments hedge as of December 31, 2018, are as follows:
Hedge accounting
Currency(foreign currency change risk)
Hedge accounting
Currency(foreign currency change risk)
Changes in fair value
\ 13,410
Changes in fair value
\ 25,198
Other comprehensive income for hedge on net investment
in a foreign operation
\ (41,992)
Other comprehensive income for hedge on net investment
in a foreign operation
\ (33,092)
2019
2018
(In millions of Korean won)
(In millions of Korean won)
Financial Section 155
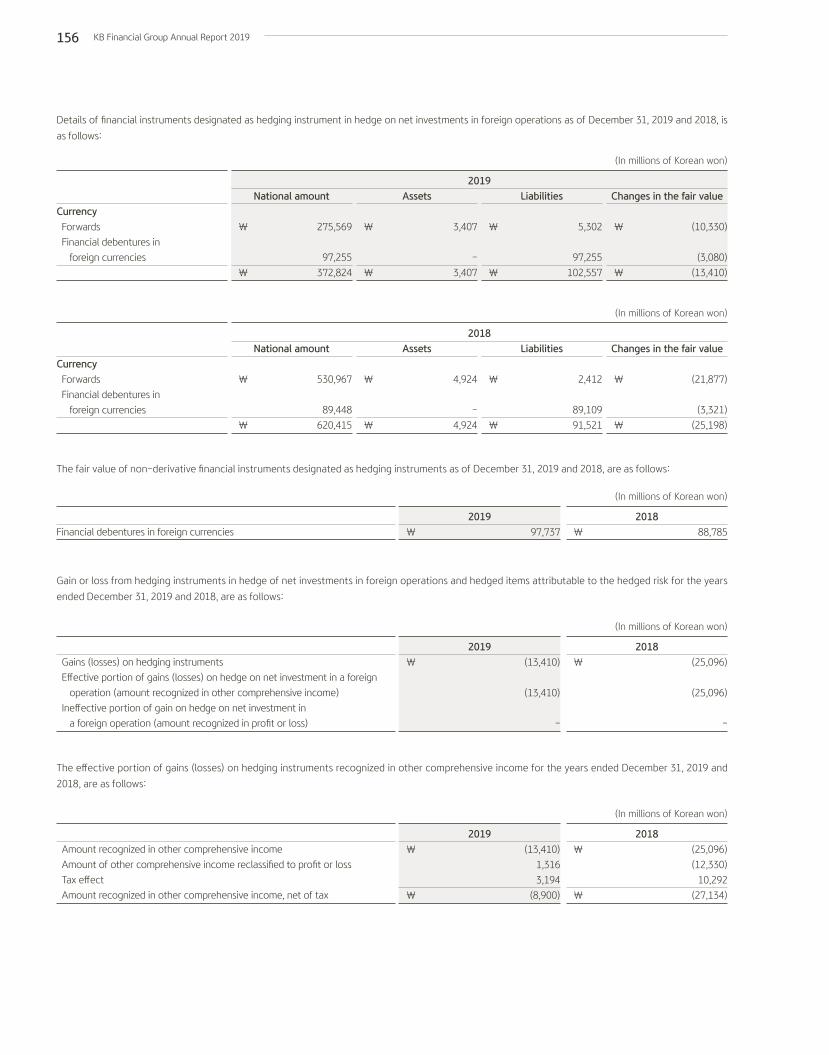
Details of financial instruments designated as hedging instrument in hedge on net investments in foreign operations as of December 31, 2019 and 2018, is
as follows:
Currency Forwards
Financial debentures in
foreign currencies
Currency Forwards
Financial debentures in
foreign currencies
National amount
₩ 275,569
97,255
₩ 372,824
National amount
₩ 530,967
89,448
₩ 620,415
Liabilities
₩ 5,302
97,255
₩ 102,557
Liabilities
₩ 2,412
89,109
₩ 91,521
Assets
₩ 3,407
-
₩ 3,407
Assets
₩ 4,924
-
₩ 4,924
Changes in the fair value
₩ (10,330)
(3,080)
₩ (13,410)
Changes in the fair value
₩ (21,877)
(3,321)
₩ (25,198)
2019
2018
(In millions of Korean won)
(In millions of Korean won)
The fair value of non-derivative financial instruments designated as hedging instruments as of December 31, 2019 and 2018, are as follows:
Gain or loss from hedging instruments in hedge of net investments in foreign operations and hedged items attributable to the hedged risk for the years
ended December 31, 2019 and 2018, are as follows:
The effective portion of gains (losses) on hedging instruments recognized in other comprehensive income for the years ended December 31, 2019 and
2018, are as follows:
Financial debentures in foreign currencies
Gains (losses) on hedging instruments
Effective portion of gains (losses) on hedge on net investment in a foreign
operation (amount recognized in other comprehensive income)
Ineffective portion of gain on hedge on net investment in
a foreign operation (amount recognized in profit or loss)
Amount recognized in other comprehensive income
Amount of other comprehensive income reclassified to profit or loss
Tax effect
Amount recognized in other comprehensive income, net of tax
2019\ 97,737
2019₩ (13,410)
(13,410)
-
2019₩ (13,410)
1,316
3,194
₩ (8,900)
2018\ 88,785
2018₩ (25,096)
(25,096)
-
2018₩ (25,096)
(12,330)
10,292
₩ (27,134)
(In millions of Korean won)
(In millions of Korean won)
(In millions of Korean won)
KB Financial Group Annual Report 2019156

10. Loans at Amortized CostDetails of loans as of December 31, 2019 and 2018, are as follows:
Details of loans for other banks as of December 31, 2019 and 2018, are as follows:
Loans at amortized cost
Deferred loan origination fees and costs
Less: Allowances for loan losses
Carrying amount
Loans at amortized cost
Less: Allowances for loan losses
Carrying amount
2019₩ 341,363,805
728,270
(2,408,016)
₩ 339,684,059
2019\ 4,011,246
(432)
\ 4,010,814
2018₩ 321,058,158
753,126
(2,609,681)
₩ 319,201,603
2018\ 3,484,210
(620)
\ 3,483,590
(In millions of Korean won)
(In millions of Korean won)
Details of loan types and customer types of loans to customers, other than banks, as of December 31, 2019 and 2018, are as follows:
Loans in Korean won
Loans in foreign currencies
Domestic import usance bills
Off-shore funding loans
Call loans
Bills bought in Korean won
Bills bought in foreign currencies
Guarantee payments under payment guarantee
Credit card receivables in Korean won
Credit card receivables in foreign currencies
Reverse repurchase agreements
Privately placed bonds
Factored receivables
Lease receivables
Loans for installment credit
Proportion (%)
Less: Allowances
Retail\ 159,232,495
433,399
-
-
-
-
-
36
-
-
-
-
117
1,385,617
5,737,458
166,789,122
49.33
(711,322)
\ 166,077,800
Credit card\ -
-
-
-
-
-
-
-
18,642,111
6,299
-
-
-
-
-
18,648,410
5.52
(739,708)
\ 17,908,702
Corporate\ 130,383,260
8,125,029
2,617,862
1,387,798
610,001
2,843
2,158,877
3,312
-
-
6,149,458
971,414
167
194,576
38,700
152,643,297
45.15
(956,554)
\ 151,686,743
Total\ 289,615,755
8,558,428
2,617,862
1,387,798
610,001
2,843
2,158,877
3,348
18,642,111
6,299
6,149,458
971,414
284
1,580,193
5,776,158
338,080,829
100
(2,407,584)
\ 335,673,245
2019
(In millions of Korean won)
Financial Section 157

Loans in Korean won
Loans in foreign currencies
Domestic import usance bills
Off-shore funding loans
Call loans
Bills bought in Korean won
Bills bought in foreign currencies
Guarantee payments under payment guarantee
Credit card receivables in Korean won
Credit card receivables in foreign currencies
Reverse repurchase agreements
Privately placed bonds
Factored receivables
Lease receivables
Loans for installment credit
Proportion (%)
Less: Allowances
Retail\ 152,523,852
259,015
-
-
-
-
-
46
-
-
-
-
446
1,712,597
4,582,913
159,078,869
49.97
(642,897)
\ 158,435,972
Credit card\ -
-
-
-
-
-
-
-
17,346,224
7,834
-
-
-
-
-
17,354,058
5.46
(710,941)
\ 16,643,117
Corporate\ 124,334,950
4,711,234
2,817,174
844,954
1,473,397
3,057
3,427,368
4,104
-
-
3,341,700
823,178
5,939
81,985
25,107
141,894,147
44.57
(1,255,223)
\ 140,638,924
Total\ 276,858,802
4,970,249
2,817,174
844,954
1,473,397
3,057
3,427,368
4,150
17,346,224
7,834
3,341,700
823,178
6,385
1,794,582
4,608,020
318,327,074
100.00
(2,609,061)
\ 315,718,013
2018
(In millions of Korean won)
The changes in deferred loan origination fees and costs for the years ended December 31, 2019 and 2018, are as follows:
Deferred loan origination costs Loans in
Korean won
Other
origination
costs
Deferred loan origination feesLoans in Korean won
Other origination fees
Deferred loan origination costs Loans in
Korean won
Other
origination
costs
Deferred loan origination feesLoans in Korean won
Other origination fees
Beginning
\ 664,237
119,780
784,017
9,055
21,836
30,891
\ 753,126
Beginning
\ 632,680
126,265
758,945
11,561
27,568
39,129
\ 719,816
Others
\ -
-
-
-
1
1
\ (1)
Others
\ -
1
1
-
1
1
\ -
Increase
\ 387,420
56,030
443,450
7,238
3,415
10,653
\ 432,797
Increase
\ 417,719
77,464
495,183
6,832
9,927
16,759
\ 478,424
Ending
\ 645,305
96,378
741,683
8,600
4,813
13,413
\ 728,270
Ending
\ 664,237
119,780
784,017
9,055
21,836
30,891
\ 753,126
Decrease
\ (406,352)
(79,432)
(485,784)
(7,693)
(20,439)
(28,132)
\ (457,652)
Decrease
\ (386,162)
(83,950)
(470,112)
(9,338)
(15,660)
(24,998)
\ (445,114)
2019
2018
(In millions of Korean won)
(In millions of Korean won)
KB Financial Group Annual Report 2019158

11. Allowances for Loan LossesChanges in the allowances for loan losses for the years ended December 31, 2019 and 2018, are as follows:
BeginningTransfer between stagesTransfer to 12-month expected credit lossesTransfer to lifetime expected credit losses ImpairmentWrite-offsDisposal Provision (reversal) for loan losses1,2
Others (change of currency ratio, etc.)Ending
Beginning2
Transfer between stagesTransfer to 12-month expected credit lossesTransfer to lifetime expected credit losses (non-impaired)Transfer to lifetime expected credit losses (impaired)Write-offsDisposal Provision (reversal) for loan losses1,3 Business combinationOthers (change of currency ratio, etc.)Ending
The financial instruments
applying 12-month expected
credit losses
\ 237,440
168,460
(144,590)(1,619)
(2)(486)
19,152
25\ 278,380
The financial instruments
applying 12-month expected
credit losses
\ 249,226
106,143
(99,242)
(2,107)-
(1,707)
(15,533)172
488\ 237,440
The financial instruments
applying 12-month expected
credit losses
\ 214,312
59,848
(53,696)(2,250)
--
(3,540)
395\ 215,069
The financial instruments
applying 12-month expected
credit losses
\ 208,354
38,360
(36,518)
(2,746)-
(72)
7,92722
(1,015)\ 214,312
The financial instruments
applying 12-month expected
credit losses
\ 180,467
51,542
(23,537)(2,388)
--
3,567
-\ 209,651
The financial instruments
applying 12-month expected
credit losses
\ 154,076
45,824
(23,345)
(2,007)--
5,919-
-\ 180,467
Nonimpaired
\ 215,743
(167,957)
160,509(54,736)
24(70)
71,231
161\ 224,905
Nonimpaired
\ 196,387
(105,597)
115,493
(49,241)(2)
(1,795)
60,180-
318\ 215,743
Nonimpaired
\ 318,656
(46,312)
141,398(36,656)
2-
(89,234)
2,456\ 290,310
Nonimpaired
\ 275,722
(36,402)
47,001
(31,157)(6)
-
62,901-
597\ 318,656
Nonimpaired
\ 290,025
(50,627)
24,529(14,377)
--
16,633
-\ 266,183
Nonimpaired
\ 260,162
(44,706)
24,438
(11,804)--
61,935-
-\ 290,025
Impaired
\ 189,714
(503)
(15,919)56,355
(443,034)(782)
424,758
(2,552)\ 208,037
Impaired
\ 186,766
(546)
(16,251)
51,348(380,698)
(1,661)
350,578-
178\ 189,714
Impaired
\ 722,875
(13,536)
(87,702)38,906
(239,319)(8,909)
80,216
(40,924)\ 451,607
Impaired
\ 865,063
(1,958)
(10,483)
33,903(233,314)
(14,172)
58,515-
25,321\ 722,875
Impaired
\ 240,449
(915)
(992)16,765
(506,255)-
524,652
(9,830)\ 263,874
Impaired
\ 213,181
(1,118)
(1,093)
13,811(465,415)
(47)
488,975-
(7,845)\ 240,449
2019
2018
(In millions of Korean won)
(In millions of Korean won)
Retails
Retails
Corporates
Corporates
Credit cards
Credit cards
1 Provision for credit losses in the statement of comprehensive income also include provision (reversal) for due from financial institutions (Note 7.3), and provision (reversal) for securities (Note 12.5), provision for unused commitments and guarantees (Note 23.2), provision (reversal) for financial guarantees contracts (Note 23.3), and provision (reversal) for other financial assets (Note 18.2).
2 Included \ 390,041 million of recover from write-offs
1 Provision for credit losses in the statement of comprehensive income also includes provision (reversal) for due from financial institutions (Note 7.3), and provision (reversal) for securities (Note 12.5), provision for unused commitments and guarantees (Note 23.2), provision (reversal) for financial guarantees contracts (Note 23.3), and provision (reversal) for other financial assets (Note 18.2).
2 Prepared in accordance with Korean IFRS 1109.3 Included \ 428,890 million of recover from write-offs
The financial instruments applying lifetime expected
credit losses
The financial instruments applying lifetime expected
credit losses
The financial instruments applying lifetime expected
credit losses
The financial instruments applying lifetime expected
credit losses
The financial instruments applying lifetime expected
credit losses
The financial instruments applying lifetime expected
credit lossess
Financial Section 159

The Group manages the written-off loans that their extinctive prescription did not occur, and that are not collected; the balance of those are respectively ₩
11,264,785 million and ₩ 12,067,272 million as of December 31, 2019 and 2018.
Changes in the book value of loans at amortized cost for the years ended December 31, 2019 and 2018, are as follows:
Beginning
Transfer between stages
Transfer to 12-month expected credit losses
Transfer to lifetime expected credit losses
Transfer to lifetime expected credit losses (impaired)
Write-offs
Disposal
Net increase(decrease)
(Execution, repayment and others)
Ending
Beginning
Transfer between stages
Transfer to 12-month expected credit losses
Transfer to lifetime expected credit losses
Transfer to lifetime expected credit losses (impaired)
Write-offs
Disposal
Net increase(decrease)
(Execution, repayment and others)
Ending
Non-impaired
₩ 26,417,165
(54,412,664)
58,078,679
(1,792,641)
26
(18,163)
(4,458,294)
₩ 23,814,108
Non-impaired
₩ 27,216,234
(8,322,782)
11,938,263
(901,109)
(8)
(10,557)
(3,502,876)
₩ 26,417,165
Impaired
₩ 2,097,749
(117,509)
(563,983)
2,357,016
(1,188,608)
(188,080)
(495,627)
₩ 1,900,958
Impaired
₩ 2,270,094
(76,251)
(71,119)
1,681,204
(1,079,427)
(192,415)
(434,337)
₩ 2,097,749
12-month expected credit losses
₩ 293,296,370
54,530,173
(57,514,696)
(564,375)
(2)
(889,880)
27,519,419
₩ 316,377,009
12-month expected credit losses
₩ 262,092,823
8,399,033
(11,867,144)
(780,095)
-
(490,070)
35,941,823
₩ 293,296,370
Lifetime expected credit losses
Lifetime expected credit losses
2019
2018
(In millions of Korean won)
(In millions of Korean won)
KB Financial Group Annual Report 2019160

12. Financial Assets at Fair Value through Profit or Loss and Financial InvestmentsDetails of financial assets at fair value through profit or loss and financial investments as of December 31, 2019 and 2018, are as follows:
Financial assets at fair value through profit or loss Debt securities:
Government and public bonds
Financial bonds
Corporate bonds
Asset-backed securities
Beneficiary certificates
Derivatives linked securities
Other debt securities
Equity securities:
Stocks
Other equity securities
Loans:
Private placed corporate bonds
Other loans
Due from financial institutions:
Other due from financial institutions
Others
Financial InvestmentsFinancial assets measured at fair value through other comprehensive income
Debt securities:
Government and public bonds
Financial bonds
Corporate bonds
Asset-backed securities
Other debt securities
Equity securities:
Stocks
Equity investments
Other equity securities
Loans:
Private placed corporate bonds
Financial assets at amortized cost Debt securities:
Government and public bonds
Financial bonds
Corporate bonds
Asset-backed securities
Allowance
December 31, 2019
₩ 6,569,472
16,360,495
3,218,480
124,898
12,375,326
3,623,648
8,449,207
1,716,149
387,694
265,499
162,046
216,367
79,805
53,549,086
9,501,642
20,913,361
12,289,820
832,160
19,865
2,377,994
41,042
85,069
375,098
46,436,051
5,395,720
8,157,428
7,536,805
4,258,274
(1,672)
25,346,555
₩ 71,782,606
December 31, 2018
₩ 7,922,936
14,978,408
4,101,066
84,382
10,252,377
3,516,626
7,429,687
1,094,441
193,221
823,071
131,105
381,719
78,808
50,987,847
3,475,214
20,107,719
10,540,985
1,100,041
19,675
2,262,379
38,584
69,153
389,822
38,003,572
5,090,051
6,847,055
6,943,332
4,782,800
(1,716)
23,661,522
₩ 61,665,094
(In millions of Korean won)
Financial Section 161

Dividend incomes from the equity securities measured at fair value through other comprehensive income for the years ended December 31, 2019 and 2018
are as follows:
The derecognized equity securities, measured at fair value through other comprehensive income for the years ended December 31, 2019 and 2018 are as follows:
Equity securities at fair value through other comprehensive income
Stocks Listed
Non-listed
Equity investments
Other equity securities
Equity securities at fair value through other comprehensive income
Stocks Listed
Non-listed
Other equity securities
Equity securities at fair value through other comprehensive income
Stocks Listed
Non-listed
Other equity securities
Equity securities at fair value through other comprehensive income
Stocks Listed
Non-listed
wEquity investments
Other equity securities
From the financial asset derecognized
\ -
-
-
-
\ -
Disposal price
₩ 18,342
1,671
-
₩ 20,013
Disposal price
₩ 26,877
480
80,000
₩ 107,357
From the financial asset derecognized
\ -
-
-
2,508
\ 2,508
From the remaining financial asset
\ 26,121
25,599
95
2,953
\ 54,768
Accumulated OCI as of disposal date
₩ (25,652)
169
-
₩ (25,483)
Accumulated OCI as of disposal date
₩ 18,330
480
2,567
₩ 21,377
From the remaining financial asset
\ 22,173
25,121
2,256
1,798
\ 51,348
2019
2019
2018
2018
(In millions of Korean won)
(In millions of Korean won)
(In millions of Korean won)
(In millions of Korean won)
KB Financial Group Annual Report 2019162

Provision(reversal) for the allowance of financial investments for the year periods ended December 31, 2019 and 2018, are as follows:
Securities measured at fair value through other comprehensive income
Loans measured at fair value through other comprehensive income
Securities at amortized cost
Securities measured at fair value through other comprehensive income
Loans measured at fair value through other comprehensive income
Securities at amortized cost
Impairment losses
₩ 1,537
170
216
₩ 1,923
Impairment losses
₩ 860
963
296
₩ 2,119
Reversal of impairment
₩ 1,144
982
280
₩ 2,406
Reversal of impairment
₩ 873
826
282
₩ 1,981
Total
₩ 393
(812)
(64)
₩ (483)
Total
₩ (13)
137
14
₩ 138
2019
2018
(In millions of Korean won)
(In millions of Korean won)
Changes in the allowances for debt securities for the years ended December 31, 2019 and 2018 are as follows:
Beginning
Transfer between stages
Transfer to 12-month expected credit losses
Transfer to lifetime expected credit losses
Disposal
Provision (reversal) for loan losses
Others (change of currency ratio, etc.)
Ending
Beginning1
Transfer between stages
Transfer to 12-month expected credit losses
Transfer to lifetime expected credit losses
Impairment
Disposal
Provision (reversal) for loan losses
Others (change of currency ratio, etc.)
Ending
Non-impaired
₩ 192
(188)
669
-
(702)
29
₩ -
Non-impaired
₩ 482
(125)
-
-
-
(180)
16
₩ 192
Impaired
₩ 322
(249)
-
-
-
(73)
₩ -
Impaired
₩ 720
-
-
-
-
(398)
-
₩ 322
12-month expected credit losses
₩ 5,657
437
(669)
(329)
219
55
₩ 5,370
12-month expected credit losses
₩ 4,937
125
-
-
(170)
716
49
₩ 5,657
Lifetime expected credit losses
Lifetime expected credit losses
2019
2018
(In millions of Korean won)
(In millions of Korean won)
1 Prepared in accordance with Korean IFRS 1109.
Financial Section 163

13. Investments in Associates and Joint VenturesInvestments in associates and joint ventures as of December 31, 2019 and 2018, are as follows:
Associates KB Pre IPO Secondary Venture Fund 1st1
KB GwS Private Securities Investment Trust
KB-KDBC New Technology Business investment Fund10
KB Star office Private real estate Investment Trust No.1
PT Bank Bukopin TBK16, 17
Dae-A Leisure Co., Ltd.8
Doosung Metal Co., Ltd.8
RAND Bio Science Co., Ltd.1
Balhae Infrastructure Company1
Aju Good Technology Venture Fund
Acts Co., Ltd.12
SY Auto Capital Co., Ltd.
Wise Asset Management Co., Ltd.9
Incheon Bridge Co., Ltd.1
Jungdong Steel Co., Ltd.8
Kendae Co., Ltd.8
Dongjo Co., Ltd.8
Dpaps Co., Ltd.8
Big Dipper Co., Ltd.
Shinla Construction Co., Ltd.8
Shinhwa Underwear Co., Ltd.8
A-PRO Co., Ltd.1
MJT&I Co., Ltd.8
Jaeyang Industry Co., Ltd.8
Jungdo Co., Ltd.8
Jinseung Tech Co., Ltd.8
Terra Co., Ltd. 8
Paycoms Co., Ltd.11
Food Factory Co., Ltd.13
Ownership (%)
15.19
26.74
66.66
21.05
22.00
49.36
26.52
14.92
12.61
38.46
7.14
49.00
33.00
14.99
42.88
41.01
29.29
38.62
29.33
20.24
26.24
15.19
22.89
20.86
25.53
30.04
24.06
11.70
22.22
Acquisition cost
₩ 1,137
113,880
20,000
20,000
116,422
-
-
2,000
105,214
19,998
500
9,800
-
9,158
-
-
-
-
440
-
-
1,500
-
-
-
-
-
800
1,000
Share of net asset amount
₩ 1,705
138,013
18,988
19,839
115,321
1,613
(62)
1,037
101,391
23,016
(119)
17,736
-
(14,746)
(433)
(252)
806
-
10
(551)
16
2,565
(613)
(552)
1,492
(194)
2
17
398
Carrying amount
₩ 1,705
136,168
18,988
19,839
121,381
578
-
-
101,391
23,016
-
12,725
-
-
-
98
115
-
125
-
258
2,790
116
-
-
-
-
45
1,000
Location
Korea
Korea
Korea
Korea
Indonesia
Korea
Korea
Korea
Korea
Korea
Korea
Korea
Korea
Korea
Korea
Korea
Korea
Korea
Korea
Korea
Korea
Korea
Korea
Korea
Korea
Korea
Korea
Korea
Korea
Industry
Investment finance
Investment finance
Investment finance
Investment finance
Banking and foreign exchange transaction
Earth works
Manufacture of metal products
Research and experimental development on medical sciences and pharmacy
Investment finance
Investment finance
Manufacture of optical lens and elements
Installment loan
Asset management
Operation of highways and related facilities
Wholesale of primary metal
Screen printing
Wholesale of agricultural and forestry machinery and equipment
Wholesale of paper products
Big data consulting
Specialty construction
Manufacture of underwears and sleepwears
Manufacture of electric power storage system
Wholesale of other goods
Manufacture of luggage and other protective cases
Office, commercial and institutional building construction
Manufacture of other general-purpose machinery n.e.c.
Manufacture of hand-operated kitchen appliances and metal ware
System software publishing
Farm product distribution industry
2019
(In millions of Korean won)
KB Financial Group Annual Report 2019164

Korea NM Tech Co., Ltd.8
KB IGen Private Equity Fund No.11
KB No.17 Special Purpose Acquisition Company1, 4
KB No.18 Special Purpose Acquisition Company1 ,5
KB No.19 Special Purpose Acquisition Company1, 6
KB No.20 Special Purpose Acquisition Company1, 7
KBSP Private Equity Fund IV1, 10
KB Private Equity FundⅢ1
Korea Credit Bureau Co., Ltd.1
KoFC POSCO HANHWA KB shared growth Private Equity Fund No.2
Keystone-Hyundai Securities No.1 Private Equity Fund1
KB Social Impact FundKB-Solidus Global Healthcare FundPOSCO-KB Shipbuilding FundGH Real Estate I LPKBTS Technology Venture Private Equity Fund10
KB-Brain KOSDAQ Scale-up New Technology Business Investment Fund10
KB-SJ Tourism Venture Fund1, 10
UNION Media Commerce FundKB-Stonebridge Secondary Private Equity Fund11
KB SPROTT Renewable Private Equity FundⅠKB-UTC Inno-Tech Venture FundCHONG IL MACHINE & TOOLS CO.,LTD.8
IMT TECHNOLOGY CO.,LTD.8
IWON ALLOY CO.,LTD.8
CARLIFE CO.,LTD.8
COMPUTERLIFE CO.,LTD.8
SKYDIGITAL INC.8
JO YANG INDUSTRIAL CO., LTD. 8
IL-KWANG ELECTRONIC MATERIALS CO.,LTD. 8
SO-MYUNG RECYCLING CO.,LTD. 8
IDTECK CO., LTD. 8
Seyoon Development Company. 8
PIP System CO., LTD8
Ownership (%)
22.41
0.030.02
0.02
0.01
0.02
14.9515.69
9.0025.00
4.49
30.0043.3331.2542.0056.00
42.55
18.5228.9914.56
37.6944.2921.71
25.2923.31
24.39
45.71
20.40
23.1429.0620.2332.80
26.9520.72
Acquisition cost
-
-1
2
1
1
6,1008,0004,500
12,970
1,908
1,50042,697
7,50017,67819,824
21,250
3,0001,0005,215
1,667450
-
--
-
-
-
----
--
₩ 577,113
Share of net asset amount
552
-1
3
2
1
5,9047,7545,991
13,616
1,625
1,46545,021
6,84719,04219,731
20,504
2,761961
4,944
1,295417
(126)
22394
(75)
(260)
(248)
75(398)
184
(103)2
27₩ 584,374
Carrying amount
-
-1
3
2
1
5,9047,7545,991
13,616
1,625
1,46545,718
6,84719,04219,731
19,752
2,761961
4,944
1,295417
-
3-
-
69
-
----
--
₩ 598,240
Location
Korea
KoreaKorea
Korea
Korea
Korea
KoreaKoreaKoreaKorea
Korea
KoreaKoreaKorea
GuernseyKorea
Korea
KoreaKoreaKorea
KoreaKoreaKorea
KoreaKorea
Korea
Korea
Korea
KoreaKoreaKoreaKorea
KoreaKorea
Industry
Manufacture of motor vehicles, trailers and semitrailers
Investment financeSPAC
SPAC
SPAC
SPAC
Investment financeInvestment financeCredit informationInvestment finance
Investment finance
Investment financeInvestment financeInvestment financeAsset managementInvestment finance
Investment finance
Investment financeInvestment financeInvestment finance
Investment financeInvestment financeMachinery and equipment wholesale
Computer Peripherals DistributionManufacture of smelting, refining and alloys
Publishing of magazines and periodicals (publishing industry)
Publishing of magazines and periodicals (publishing industry)
Multi Media, Manufacture of Multi Media EquipmentManufacture of Special GlassElectronic partsNon-ferrous metalsOther wireless communication equipment manufacturing
Civil facilities constructionPrint equipment
2019
(In millions of Korean won)
Financial Section 165
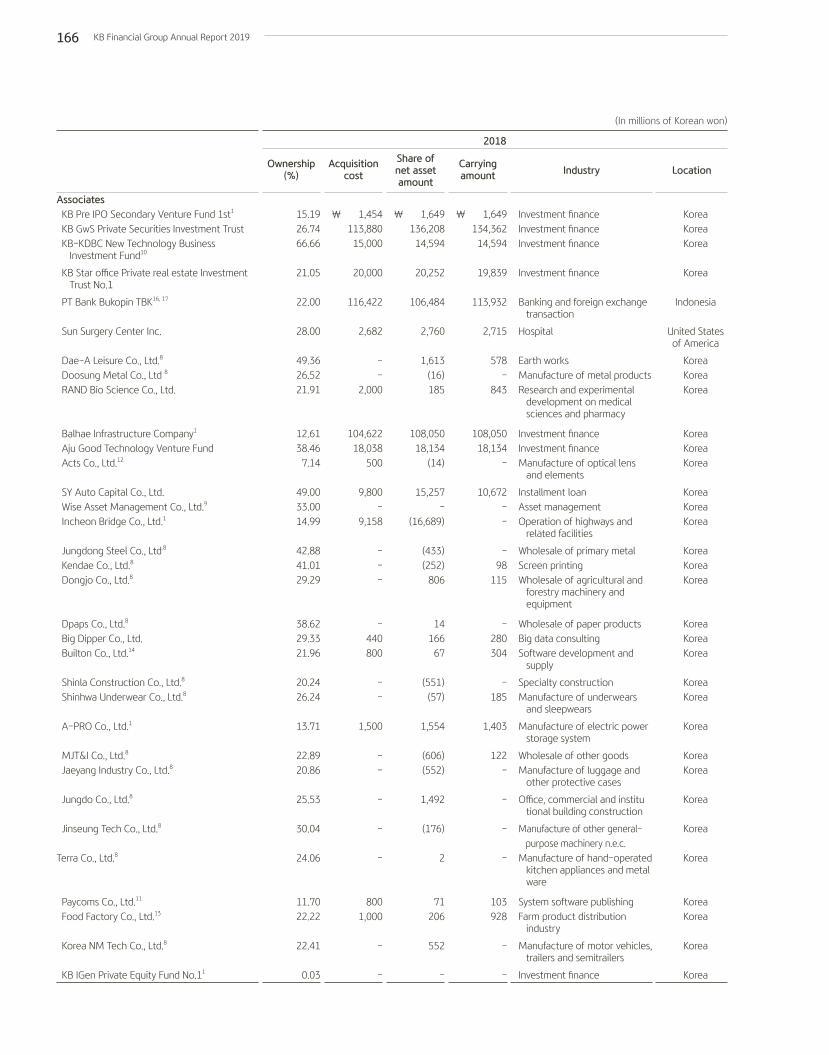
Associates KB Pre IPO Secondary Venture Fund 1st1
KB GwS Private Securities Investment Trust KB-KDBC New Technology Business Investment Fund10
KB Star office Private real estate Investment Trust No.1
PT Bank Bukopin TBK16, 17
Sun Surgery Center Inc.
Dae-A Leisure Co., Ltd.8
Doosung Metal Co., Ltd 8
RAND Bio Science Co., Ltd.
Balhae Infrastructure Company1
Aju Good Technology Venture Fund Acts Co., Ltd.12
SY Auto Capital Co., Ltd. Wise Asset Management Co., Ltd.9
Incheon Bridge Co., Ltd.1
Jungdong Steel Co., Ltd.8
Kendae Co., Ltd.8
Dongjo Co., Ltd.8
Dpaps Co., Ltd.8
Big Dipper Co., Ltd. Builton Co., Ltd.14
Shinla Construction Co., Ltd.8
Shinhwa Underwear Co., Ltd.8
A-PRO Co., Ltd.1
MJT&I Co., Ltd.8
Jaeyang Industry Co., Ltd.8
Jungdo Co., Ltd.8
Jinseung Tech Co., Ltd.8
Terra Co., Ltd.8
Paycoms Co., Ltd.11
Food Factory Co., Ltd.13
Korea NM Tech Co., Ltd.8
KB IGen Private Equity Fund No.11
Ownership (%)
15.1926.7466.66
21.05
22.00
28.00
49.3626.5221.91
12.6138.46
7.14
49.0033.0014.99
42.8841.0129.29
38.6229.3321.96
20.2426.24
13.71
22.8920.86
25.53
30.04
24.06
11.7022.22
22.41
0.03
Acquisition cost
₩ 1,454113,880
15,000
20,000
116,422
2,682
--
2,000
104,62218,038
500
9,800-
9,158
---
-440800
--
1,500
--
-
-
-
8001,000
-
-
Share of net asset amount
₩ 1,649136,208
14,594
20,252
106,484
2,760
1,613(16)185
108,05018,134
(14)
15,257-
(16,689)
(433)(252)
806
14166
67
(551)(57)
1,554
(606)(552)
1,492
(176)
2
71206
552
-
Carrying amount
₩ 1,649134,362
14,594
19,839
113,932
2,715
578-
843
108,05018,134
-
10,672--
-98
115
-280304
-185
1,403
122-
-
-
-
103928
-
-
Location
KoreaKoreaKorea
Korea
Indonesia
United States of America
KoreaKoreaKorea
KoreaKoreaKorea
KoreaKoreaKorea
KoreaKoreaKorea
KoreaKoreaKorea
KoreaKorea
Korea
KoreaKorea
Korea
Korea
Korea
KoreaKorea
Korea
Korea
Industry
Investment financeInvestment financeInvestment finance
Investment finance
Banking and foreign exchange transaction
Hospital Earth worksManufacture of metal productsResearch and experimental development on medical sciences and pharmacy
Investment financeInvestment financeManufacture of optical lens and elements
Installment loanAsset managementOperation of highways and related facilities
Wholesale of primary metalScreen printingWholesale of agricultural and forestry machinery and equipment
Wholesale of paper productsBig data consultingSoftware development and supply
Specialty constructionManufacture of underwears and sleepwears
Manufacture of electric power storage system
Wholesale of other goodsManufacture of luggage and other protective cases
Office, commercial and institu tional building construction
Manufacture of other general- purpose machinery n.e.c.Manufacture of hand-operated kitchen appliances and metal ware
System software publishingFarm product distribution industry
Manufacture of motor vehicles, trailers and semitrailers
Investment finance
2018
(In millions of Korean won)
KB Financial Group Annual Report 2019166

KB No.9 Special Purpose Acquisition Company1
KB No.10 Special Purpose Acquisition Company1,2
KB No.11 Special Purpose Acquisition Company1,3
KB Private Equity FundⅢ1
Korea Credit Bureau Co., Ltd.1
KoFC KBIC Frontier Champ 2010-5(PEF) KoFC POSCO HANHWA KB shared growth Private Equity Fund No.2
Keystone-Hyundai Securities No. 1 Private Equity Fund1
POSCO-KB Shipbuilding Fund GH Real Estate I LP KBTS Technology Venture Private Equity Fund10
KB-Brain KOSDAQ Scale-up New Technology Business Investment Fund10
KB-SJ Tourism Venture Fund1, 10
UNION Media Commerce Fund CHONG IL MACHINE & TOOLS CO., LTD. 8
IMT TECHNOLOGY CO., LTD. 8
IWON ALLOY CO., LTD. 8
CARLIFE CO., LTD. 8
COMPUTERLIFE CO.,LTD. 8
SKYDIGITAL INC.8
JO YANG INDUSTRIAL CO., LTD.8
Ownership (%)
0.110.19
0.31
15.689.00
50.0025.00
5.64
31.2542.0056.00
42.55
18.5229.0021.71
25.2923.31
24.39
45.71
20.40
23.14
Acquisition cost
2410
10
8,0004,500
36412,970
1,842
5,00017,67814,224
8,000
1,5001,000
-
--
-
-
-
-\ 493,218
Share of net asset amount
3120
19
7,8305,941
23314,601
1,581
4,46317,25213,777
7,930
1,386962
(107)
18394
(75)
(329)
(142)
75\ 486,630
Carrying amount
3120
19
7,8305,941
23314,601
1,581
4,46317,25213,777
7,930
1,386962
-
--
-
-
-
-\ 504,932
Location
KoreaKorea
Korea
KoreaKoreaKoreaKorea
Korea
KoreaGuernsey
Korea
Korea
KoreaKoreaKorea
KoreaKorea
Korea
Korea
Korea
Korea
Industry
SPACSPAC
SPAC
Investment financeCredit informationInvestment financeInvestment finance
Investment finance
Investment financeAsset managementInvestment finance
Investment finance
Investment financeInvestment financeMachinery and equipment wholesale
Computer Peripherals DistributionManufacture of smelting, refining and alloys
Publishing of magazines and periodicals (publishing industry)
Publishing of magazines and periodicals (publishing industry)
Multi Media, Manufacture of Multi Media Equipment
Manufacture of Special Glass
2018
(In millions of Korean won)
1 As of December 31, 2019 and 2018, the Group is represented on the governing bodies of its associates. Therefore, the Group has a significant influence over the decision-making process relating to their financial and business policies.
2 The market value of KB No.10 Special Purpose Acquisition Company, reflecting the quoted market price as of December 31, 2018, amounts to ₩ 20 million.3 The market value of KB No.11 Special Purpose Acquisition Company, reflecting the quoted market price as of December 31, 2018, amounts to ₩ 21 million.4 The market value of KB No.17 Special Purpose Acquisition Company, reflecting the quoted market price as of December 31, 2019, amounts to ₩ 2 million.5 The market value of KB No.18 Special Purpose Acquisition Company, reflecting the quoted market price as of December 31, 2019, amounts to ₩ 4 million.6 The market value of KB No.19 Special Purpose Acquisition Company, reflecting the quoted market price as of December 31, 2019, amounts to ₩ 2 million.7 The market value of KB No.20 Special Purpose Acquisition Company, reflecting the quoted market price as of December 31, 2019, amounts to ₩ 2 million.8 Reclassified to investments in associates due to termination of rehabilitation procedures.9 Carrying amount of the investment has been recognized as a loss from the date Hyundai Securities Co., Ltd. was included in the consolidation scope.10 In order to direct relevant activities, it is necessary to obtain the consent of the two co-operative members; the Group has applied the equity method as the Group cannot control the investee by itself.11 The ownership of Paycoms Co., Ltd. would be 22.96% and 22.96% as of December 31, 2019 and 2018, respectively, considering the potential voting rights from convertible bond.12 The ownership of Acts Co., Ltd. would be 27.22% and 27.22% as of December 31, 2019 and 2018, respectively, considering the potential voting rights from convertible bond.13 The ownership of Food Factory Co., Ltd. would be 30.00% and 30.00% as of December 31, 2019 and 2018, respectively, considering the potential voting rights from convertible bond.14 The ownership of Builton Co., Ltd. would be 26.86% as of December 31, 2018, considering the potential voting rights from convertible bond.15 In accordance with Korean IFRS 1028 Investments in Associates and Joint Ventures, application of the equity method is exempted, and the Group designates its investments measured at fair
value through profit or loss in Rainist Co., Ltd., RMGP Bio-Pharma Investment Fund, L.P.,RMGP Bio-Pharma Investment, L.P, HEYBIT, Inc.,Hasys.,Stratio, Inc., Honest Fund Co.,Ltd., Cellincells Co., Ltd., CY CO., Ltd., ZOYI corporation INC., KOSESEUJITO CO., LTD., Bomapp Inc., KB Cape No.1 Private Equity Fund., Mitoimmune Therapeutics, BNF Corporation Ltd., Fabric Types CO.,LTD..
16 The Group has entered into an agreement with PT Bosowa Corporindo, the major shareholder of PT Bank Bukopin TBK. Under this agreement, the Group has a right of first refusal, a tag-along right and a drag-along right. The drag-along right can be exercised for the duration of two years after three years from the acquisition date, subject to the occurrence of certain situations as defined in the agreement.
17 The fair value of PT Bank Bukopin TBK ordinary share is ₩ 47,709 million and ₩ 53,540 million as of December 31, 2019 and 2018.
Financial Section 167

Although the Group holds more than 20% of ownership, it has been excluded from associates by limited influence due to the trust agreement on related
activities, bankruptcy and rehabilitation procedures.
Summarized financial information on major associates and joint ventures, adjustments to carrying amount of investment in associates and dividends
received from the associates are as follows:
Associates and joint ventures KB Pre IPO Secondary Venture Fund 1st
KB GwS Private Securities Investment Trust
KB-KDBC New Technology Business
Investment Fund
KB Star office Private real estate Investment
Trust No.1
PT Bank Bukopin TBK2
RAND Bioscience Co., Ltd.
Balhae Infrastructure Company
Aju Good Technology Venture Fund
Acts Co., Ltd.
SY Auto Capital Co., Ltd.
Incheon Bridge Co., Ltd.
Big Dipper Co., Ltd.
A-PRO Co., Ltd.
Paycoms Co., Ltd.
Food Factory Co., Ltd.
KB IGen Private Equity Fund No. 1
KB No.17 Special Purpose Acquisition Company
KB No.18 Special Purpose Acquisition Company
KB No.19 Special Purpose Acquisition Company
KB No.20 Special Purpose Acquisition Company
KBSP Private Equity Fund IV
KB Private Equity FundⅢ
Korea Credit Bureau Co., Ltd.
KoFC POSCO HANHWA KB shared growth
Private Equity Fund No. 2
Keystone-Hyundai Securities No. 1 Private Equity Fund
KB Social Impact Fund
KB-Solidus Global Healthcare Fund
POSCO-KB Shipbuilding Fund
GH Real Estate I LP
KBTS Technology Venture Private Equity Fund
KB-Brain KOSDAQ Scale-up New Technology Business
Investment Fund
KB-SJ Tourism Venture Fund
UNION Media Commerce Fund
KB-Stonebridge Secondary Private Equity Fund
KB SPROTT Renewable Private Equity FundⅠ
KB-UTC Inno-Tech Venture Fund
Consolidated carrying amount
\ 1,705
136,168
18,988
19,839
121,381
-
101,391
23,016
-
12,725
-
125
2,790
45
1,000
-
1
3
2
1
5,904
7,754
5,991
13,616
1,625
1,465
45,718
6,847
19,042
19,731
19,752
2,761
961
4,944
1,295
417
Equity
\ 11,217
522,124
28,483
96,146
524,184
6,952
804,364
59,847
(1,671)
36,196
(98,369)
34
16,883
143
1,790
183
10,529
15,220
8,199
619
39,490
49,433
66,566
54,461
33,314
4,882
103,891
21,912
45,279
35,233
48,184
14,910
3,314
33,943
3,437
941
Unrealized gains
(losses)
\ -
(1,845)
-
-
6,060
(1,037)
-
-
119
(5,011)
14,746
115
225
28
602
-
-
-
-
-
-
-
-
-
-
-
697
-
-
-
(752)
-
-
-
-
-
Share capital
\ 8,690
425,814
30,000
95,000
106,536
1,340
834,695
52,000
117
20,000
61,096
1,500
2,468
855
450
7,270
546
782
430
50
40,800
51,000
10,000
51,880
42,837
5,000
61,800
24,000
42,093
35,400
51,700
16,200
3,450
35,805
9,640
1,016
Share of net asset amount
\ 1,705
138,013
18,988
19,839
115,321
1,037
101,391
23,016
(119)
17,736
(14,746)
10
2,565
17
398
-
1
3
2
1
5,904
7,754
5,991
13,616
1,625
1,465
45,021
6,847
19,042
19,731
20,504
2,761
961
4,944
1,295
417
Total liabilities
\ 20
741
603
122,465
7,623,829
74
1,854
828
6,973
52,415
707,563
336
30,281
1,620
3,797
8
1,328
2,022
924
1,372
2
4
30,289
1,063
153,842
3
5
4
61
1,212
185
4
4
507
249
75
Total assets
\ 11,237
522,865
29,086
218,611
8,148,013
7,026
806,218
60,675
5,302
88,611
609,194
370
47,164
1,763
5,587
191
11,857
17,242
9,123
1,991
39,492
49,437
96,855
55,524
187,156
4,885
103,896
21,916
45,340
36,445
48,369
14,914
3,318
34,450
3,686
1,016
20191
(In millions of Korean won)
KB Financial Group Annual Report 2019168

Associates and joint ventures KB Pre IPO Secondary Venture Fund 1st
KB GwS Private Securities Investment Trust
KB-KDBC New Technology Business Investment Fund
KB Star office Private real estate Investment Trust No.1
PT Bank Bukopin TBK
RAND Bio Science Co., Ltd.
Balhae Infrastructure Company
Aju Good Technology Venture Fund
Acts Co., Ltd.
SY Auto Capital Co., Ltd.
Incheon Bridge Co., Ltd.
Big Dipper Co., Ltd.
A-PRO Co., Ltd.
Paycoms Co., Ltd.
Food Factory Co., Ltd.
KB IGen Private Equity Fund No.1
KB No.17 Special Purpose Acquisition Company
KB No.18 Special Purpose Acquisition Company
KB No.19 Special Purpose Acquisition Company
KB No.20 Special Purpose Acquisition Company
KBSP Private Equity Fund IV
KB Private Equity FundⅢ
Korea Credit Bureau Co., Ltd.
KoFC POSCO HANHWA KB shared growth Private Equity Fund No. 2
Keystone-Hyundai Securities No. 1 Private Equity Fund
KB Social Impact Fund
KB-Solidus Global Healthcare Fund
POSCO-KB Shipbuilding Fund
GH Real Estate I LP
KBTS Technology Venture Private Equity Fund
KB-Brain KOSDAQ Scale-up New Technology Business Investment Fund
KB-SJ Tourism Venture Fund
UNION Media Commerce Fund
KB-Stonebridge Secondary Private Equity Fund
KB SPROTT Renewable Private Equity FundⅠ
KB-UTC Inno-Tech Venture Fund
Dividends
\ -
9,297
-
-
-
-
6,855
-
-
-
-
-
-
-
-
-
-
-
-
-
-
-
135
-
-
-
-
-
-
-
-
-
-
-
-
-
Profit (loss)
\ 2,452
41,524
(638)
6,004
(5,612)
(2,928)
(3,153)
7,734
(507)
5,292
9,127
(532)
7,702
(343)
664
5,851
8
(3)
(25)
(9)
(1,304)
(485)
1,480
(3,911)
(572)
(118)
8,708
(371)
3,698
632
(3,355)
(673)
(3)
(1,856)
(986)
(75)
Total comprehensive
income
\ 2,452
41,524
(638)
6,004
40,168
(2,928)
(3,153)
7,734
(507)
5,077
9,127
(532)
7,702
(343)
664
5,851
8
(3)
(25)
(9)
(1,304)
(485)
1,480
(3,911)
(572)
(118)
8,708
(371)
4,263
632
(3,355)
(673)
(3)
(1,856)
(986)
(75)
Operating income
\ 3,225
42,503
371
14,455
721,169
-
62,113
9,288
1,542
20,394
107,178
598
47,725
262
6,807
-
-
-
-
-
39
-
91,200
4,077
18,342
8
13,085
1,000
5,043
1,643
138
-
-
346
1
-
Other comprehensive
income
\ -
-
-
-
45,780
-
-
-
-
(215)
-
-
-
-
-
-
-
-
-
-
-
-
-
-
-
-
-
-
565
-
-
-
-
-
-
-
20191
(In millions of Korean won)
Financial Section 169

Associates and joint ventures KB Pre IPO Secondary Venture Fund 1st
KB GwS Private Securities Investment Trust
KB-KDBC New Technology Business
Investment Fund
KB Star office Private real estate Investment
Trust No.1
PT Bank Bukopin TBK2
Sun Surgery Center Inc
RAND Bio Science Co., Ltd.
Balhae Infrastructure Company
Aju Good Technology Venture Fund
Acts Co., Ltd.
SY Auto Capital Co., Ltd.
Incheon Bridge Co., Ltd.
Big Dipper Co., Ltd.
Builton Co., Ltd.
A-PRO Co., Ltd.
Paycoms Co., Ltd.
Food Factory Co., Ltd.
KB IGen Private Equity Fund No. 1
KB No.9 Special Purpose Acquisition Company
KB No.10 Special Purpose Acquisition Company
KB No.11 Special Purpose Acquisition Company
KB Private Equity FundⅢ
Korea Credit Bureau Co., Ltd.
KoFC KBIC Frontier Champ 2010-5(PEF)
KoFC POSCO HANHWA KB shared growth Private
Equity Fund No. 2
Keystone-Hyundai Securities No. 1
Private Equity Fund
POSCO-KB Shipbuilding Fund
GH Real Estate I LP
KBTS Technology Venture Private Equity Fund
KB-Brain KOSDAQ Scale-up New Technology
Business Investment Fund
KB-SJ Tourism Venture Fund
UNION Media Commerce Fund
Consolidated carrying amount
\ 1,649
134,362
14,594
19,839
113,932
2,715
843
108,050
18,134
-
10,672
-
280
304
1,403
103
928
-
31
20
19
7,830
5,941
233
14,601
1,581
4,463
17,252
13,777
7,930
1,386
962
Equity
\ 10,855
515,374
21,890
96,197
484,016
9,858
843
857,197
47,150
(157)
31,136
(111,336)
566
304
11,339
606
928
140
27,659
10,256
6,065
49,919
66,009
466
58,403
25,162
14,283
41,016
24,602
18,639
7,482
3,318
Unrealized gains
(losses)
\ -
(1,846)
-
(413)
7,448
(45)
658
-
-
14
(4,585)
16,689
114
237
(151)
32
722
-
-
-
-
-
-
-
-
-
-
-
-
-
-
-
Share capital
\ 10,120
425,814
22,500
95,000
106,536
9,428
913
829,995
46,900
117
20,000
61,096
1,500
325
1,713
855
450
170
1,382
521
321
51,000
10,000
300
51,880
34,114
16,000
42,093
25,400
18,800
8,100
3,450
Share of net asset amount
\ 1,649
136,208
14,594
20,252
106,484
2,760
185
108,050
18,134
(14)
15,257
(16,689)
166
67
1,554
71
206
-
31
20
19
7,830
5,941
233
14,601
1,581
4,463
17,252
13,777
7,930
1,386
962
Total liabilities
\ 9
741
602
121,828
6,711,233
610
2,070
1,843
66
6,823
58,812
728,896
157
1,604
18,099
1,520
3,168
8
2,629
1,704
742
5
22,788
3
1,061
151,862
4
190
208
181
2
-
Total assets
\ 10,864
516,115
22,492
218,025
7,195,249
10,468
2,913
859,040
47,216
6,666
89,948
617,560
723
1,908
29,438
2,126
4,096
148
30,288
11,960
6,807
49,924
88,797
469
59,464
177,024
14,287
41,206
24,810
18,820
7,484
3,318
20181
(In millions of Korean won)
KB Financial Group Annual Report 2019170

Associates and joint venturesKB Pre IPO Secondary Venture Fund 1st
KBGwS Private Securities Investment Trust
KB-KDBC New Technology Business Investment Fund
KB Star office Private real estate Investment Trust No.1
PT Bank Bukopin TPK
Sun Surgery Center Inc.
RAND Bio Science Co., Ltd.
Balhae Infrastructure Company
Aju Good Technology Venture Fund
Acts Co., Ltd.
SY Auto Capital Co., Ltd.
Incheon Bridge Co., Ltd.
Big Dipper Co., Ltd.
Builton Co., Ltd.
A-PRO Co., Ltd.
Paycoms Co., Ltd.
Food Factory Co., Ltd.
KB IGen Private Equity Fund No. 1
KB No.9 Special Purpose Acquisition Company
KB No.10 Special Purpose Acquisition Company
KB No.11 Special Purpose Acquisition Company
KB Private Equity FundⅢ
Korea Credit Bureau Co., Ltd.
KoFC KBIC Frontier Champ 2010-5(PEF)
KoFC POSCO HANHWA KB shared growth Private Equity Fund No. 2
Keystone-Hyundai Securities No. 1 Private Equity Fund
POSCO-KB Shipbuilding Fund
GH Real Estate I LP
KBTS Technology Venture Private Equity Fund
KB-Brain KOSDAQ Scale-up New Technology Business Investment Fund
KB-SJ Tourism Venture Fund
UNION Media Commerce Fund
Dividends
₩ -
8,160
-
1,162
-
-
-
6,804
-
-
-
-
-
-
-
-
-
-
-
-
-
-
112
999
-
-
-
1,595
-
-
-
-
Profit (loss)
₩ 1,404
41,524
(568)
6,135
(8,843)
71
(2,076)
54,241
1,356
(628)
2,729
(2,757)
(543)
(287)
2,015
(409)
412
3,693
262
73
218
(438)
9,901
1,453
(12,313)
(3,194)
(1,222)
3,089
(798)
(161)
(618)
(132)
Total comprehensive
income
₩ 1,404
41,524
(568)
6,135
(11,168)
413
(2,076)
54,241
1,356
(628)
2,578
(2,757)
(543)
(287)
2,015
(409)
412
3,693
262
73
218
(438)
9,901
1,453
(12,313)
(3,194)
(1,222)
2,782
(798)
(161)
(618)
(132)
Operating income
₩ 2,140
42,502
39
14,092
148,793
873
-
61,525
2,491
2,472
16,525
94,373
441
1,867
47,926
686
4,753
-
-
-
-
-
78,018
1,460
2,401
15,507
160
4,293
-
20
-
-
Other comprehensive
income
₩ -
-
-
-
(2,325)
342
-
-
-
-
(151)
-
-
-
-
-
-
-
-
-
-
-
-
-
-
-
-
(307)
-
-
-
-
20181
(In millions of Korean won)
1 The amounts included in the financial statements of the associates and joint ventures are adjusted to reflect adjustments made by the entity, such as, fair value adjustments made at the time of acquisition and adjustments for differences in accounting policies.
2 The amounts of goodwill on PT Bank Bukopin TBK is ₩ 4,528 million and ₩ 4,101 million as of December 31, 2019 and December 31, 2018, respectively.
Financial Section 171

Changes in investments in associates and joint ventures for the years ended December 31, 2019 and 2018, are as follows
Associates and joint ventures KB Pre IPO Secondary Venture Fund 1st
KB GwS Private Securities Investment Trust
KB-KDBC New Technology Business
Investment Fund
KB Star office Private real estate
Investment Trust No.1
PT Bank Bukopin TBK
Sun Surgery Center Inc.
Dae-A Leisure Co., Ltd.
RAND Bio Science Co., Ltd.
Balhae Infrastructure Company
Aju Good Technology Venture Fund
SY Auto Capital Co., Ltd.
Kendae Co., Ltd.
Dong Jo Co., Ltd.
Big Dipper Co., Ltd.
Builton Co., Ltd.
Shinhwa Underwear Co., Ltd.
A-PRO Co., Ltd.
MJT&I Co., Ltd.
Paycoms Co., Ltd.
Food Factory Co., Ltd.
KB No.9 Special Purpose Acquisition
Company
KB No.10 Special Purpose Acquisition
Company
KB No.11 Special Purpose Acquisition
Company
KB No.17 Special Purpose Acquisition
Company
KB No.18 Special Purpose Acquisition
Company
KB No.19 Special Purpose Acquisition
Company
KB No.20 Special Purpose Acquisition
Company
KBSP Private Equity Fund IV
KB Private Equity FundⅢ
Korea Credit Bureau Co., Ltd.
KoFC KBIC Frontier Champ 2010-5(PEF)
KoFC POSCO HANHWA KB shared
growth Private Equity Fund No. 2
Keystone-Hyundai Securities No. 1
Private Equity Fund
KB Social Impact Fund
KB-Solidus Global Healthcare Fund3
POSCO-KB Shipbuilding Fund
GH Real Estate I LP
Ending
₩ 1,705
136,168
18,988
19,839
121,381
-
578
-
101,391
23,016
12,725
98
115
125
-
258
2,790
116
45
1,000
-
-
-
1
3
2
1
5,904
7,754
5,991
-
13,616
1,625
1,465
45,718
6,847
19,042
Dividends
₩ -
(9,297)
-
-
-
-
-
-
(6,855)
-
-
-
-
-
-
-
-
-
-
-
-
-
-
-
-
-
-
-
-
(135)
-
-
-
-
-
-
-
Other compre- hensive income
₩ -
-
-
-
10,408
210
-
-
-
-
(105)
-
-
-
-
-
1
-
-
-
-
-
-
-
1
1
-
-
-
-
-
-
4
-
-
-
237
Acquisition and others
₩ -
-
5,000
-
-
-
-
-
592
1,960
-
-
-
-
403
-
-
-
-
-
-
-
-
1
2
1
1
6,100
-
-
-
-
66
1,500
42,697
2,500
-
Impairment loss
₩ -
-
-
-
(1,723)
-
-
(843)
-
-
-
-
-
-
-
-
-
-
-
-
-
-
-
-
-
-
-
-
-
-
-
-
-
-
-
-
-
Disposal and others
₩ (317)
-
-
-
-
(3,321)
-
-
-
-
-
-
-
-
(839)
-
-
-
-
-
(31)
(20)
(19)
-
-
-
-
-
-
-
(233)
-
-
-
-
-
-
Gains (losses) on equity-
method accounting
₩ 373
11,103
(606)
-
(1,236)
396
-
-
(396)
2,922
2,158
-
-
(155)
132
73
1,386
(6)
(58)
72
-
-
-
-
-
-
-
(196)
(76)
185
-
(985)
(26)
(35)
3,021
(116)
1,553
Beginning
₩ 1,649
134,362
14,594
19,839
113,932
2,715
578
843
108,050
18,134
10,672
98
115
280
304
185
1,403
122
103
928
31
20
19
-
-
-
-
-
7,830
5,941
233
14,601
1,581
-
-
4,463
17,252
2019
(In millions of Korean won)
KB Financial Group Annual Report 2019172

KBTS Technology Venture Private
Equity Fund
KB-Brain KOSDAQ Scale-up New
Tech nology Business Investment Fund
KB-SJ Tourism Venture Fund
UNION Media Commerce Fund
KB-Stonebridge Secondary Private
Equity Fund
KB SPROTT Renewable Private Equity
Fund No.1
KB-UTC Inno-Tech Venture Fund
IMT TECHNOLOGY CO., LTD.
COMPUTERLIFE CO., LTD.,
Associates and joint ventures
KB Pre IPO Secondary Venture Fund 1st
KB GwS Private Securities
Investment Trust
KB-KDBC New Technology Business
Investment Fund
KB Star office Private real estate
Investment Trust No.1
PT Bank Bukopin TBK
Sun Surgery Center Inc.
Dae-A Leisure Co., Ltd.
RAND Bio Science Co., Ltd.
Balhae Infrastructure Company
Bungaejangter Inc.3
Aju Good Technology Venture Fund
Acts Co., Ltd. 2
SY Auto Capital Co., Ltd.
Kendae Co., Ltd.
Dong Jo Co., Ltd.
Big Dipper Co., Ltd.
Builton Co., Ltd.
Shinhwa Underwear Co., Ltd.
A-PRO Co., Ltd.
MJT&I Co., Ltd.
Inno Lending Co., Ltd.
Ending
19,731
19,752
2,761
961
4,944
1,295
417
3
69
₩ 598,240
Ending
₩ 1,649
134,362
14,594
19,839
113,932
2,715
578
843
108,050
-
18,134
-
10,672
98
115
280
304
185
1,403
122
-
Dividends
-
-
-
-
-
-
-
-
-
₩ (16,287)
Dividends
₩ -
(8,160)
-
(1,162)
-
-
-
-
(6,804)
-
-
-
-
-
-
-
-
-
-
-
-
Other compre- hensive income
85
-
-
-
-
-
-
-
-
₩ 10,842
Other compre-hensive income
₩ -
-
-
-
(544)
-
(3,120)
-
-
-
-
-
(74)
-
-
-
-
-
-
-
-
Acquisition and others
7,440
13,250
1,500
-
7,070
1,667
450
-
-
₩ 92,200
Acquisition and others
₩ -
-
10,000
-
116,422
-
-
-
4,645
-
9,808
-
-
-
-
-
-
-
-
-
-
Impairment loss
-
-
-
-
-
-
-
-
-
₩ (2,566)
Impairment loss
₩ -
-
-
-
-
-
-
-
-
(2,100)
-
(500)
-
-
-
-
-
-
-
-
-
Disposal and others
(1,840)
-
-
-
(1,855)
-
-
-
-
₩ (8,475)
Disposal and others
₩ (217)
-
-
-
-
-
-
-
(1,817)
(1,384)
-
-
-
-
-
-
-
-
-
-
(230)
Gains (losses) on equity-
method accounting
269
(1,428)
(125)
(1)
(271)
(372)
(33)
3
69
₩ 17,594
Gains (losses) on equity-
method accounting
₩ 315
11,102
(378)
1,292
(1,946)
33
3,698
(1,157)
6,836
-
96
-
2,676
(29)
115
(160)
(496)
47
(97)
(5)
-
Beginning
13,777
7,930
1,386
962
-
-
-
-
-
₩ 504,932
Beginning1
₩ 1,551
131,420
4,972
19,709
-
2,682
-
2,000
105,190
3,484
8,230
500
8,070
127
-
440
800
138
1,500
127
230
2019
2018
(In millions of Korean won)
(In millions of Korean won)
1 Gain on disposal of investments in associates and joint ventures for the year ended December 31, 2019 is ₩ 1,423 million.
Financial Section 173

Terra Co., Ltd. Paycoms Co., Ltd. Food Factory Co., Ltd. KB IGen Private Equity Fund No. 1 KB No.8 Special Purpose Acquisition Company KB No.9 Special Purpose Acquisition Company KB No.10 Special Purpose Acquisition Company KB No.11 Special Purpose Acquisition Company KB Private Equity FundⅢ Korea Credit Bureau Co., Ltd. KoFC KBIC Frontier Champ 2010-5(PEF) KoFC POSCO HANHWA KB shared growth Private Equity Fund No. 2 Keystone-Hyundai Securities No. 1 Private Equity Fund POSCO-KB Shipbuilding Fund Hyundai-Tongyang Agrifood Private Equity Fund GH Real Estate I LP KBTS Technology Venture Private Equity Fund KB-Brain KOSDAQ Scale-up New Technology Business Investment Fund KB-SJ Tourism Venture Fund CUBE Growth Fund No.2 UNION Media Commerce Fund
Ending
-103928
--
31
20
19
7,8305,941
23314,601
1,581
4,463-
17,25213,777
7,930
1,386-
962₩ 504,932
Dividends
-----
-
-
-
-(112)(999)
-
-
-(469)
(1,595)-
-
---
₩ (19,301)
Other compre-hensive income
-----
-
-
(1)
---
(1,239)
-
--
(129)-
-
---
₩ (5,107)
Acquisition and others
-----
-
-
-
----
-
2,500-
17,67814,224
8,000
1,5001,3001,000
₩ 187,077
Others
-----
-
-
-
----
-
--
--
-
---
₩ (2,600)
Disposal and
others
---
(4)(20)
-
-
-
--
(6,121)-
-
-(74)
--
-
-(1,300)
-₩ (11,167)
Gains (losses) on equity-
method accounting
(20)(697)
(72)1-
-
-
1
(69)997233
(1,873)
(180)
(382)-
1,298(447)
(70)
(114)-
(38)₩ 20,510
Beginning1
20800
1,0003
20
31
20
19
7,8995,0567,120
17,713
1,761
2,345543
--
-
---
₩ 335,520
2018
(In millions of Korean won)
1 Prepared in accordance with Korean IFRS 11092 Recognized \ 500 million loss in relation to impaired capital.3 The amount of reclassification as financial assets is \ 2,100 million.4 Gain on disposal of investments in associates and joint ventures for the year ended December 31, 2018 is \ 4,250 million.
Accumulated unrecognized share of losses in investments in associates and joint ventures due to discontinuation of applying the equity method for the
years ended December 31, 2019 and 2018, are as follows:
Doosung Metal Co., LtdIncheon Bridge Co., Ltd. Jungdong Steel Co., Ltd.Dpaps Co., Ltd.Shinla Construction Co., Ltd. Jaeyang Industry Co., Ltd.Terra Co., Ltd.Jungdo Co., Ltd.Jinseung Tech Co., Ltd.Korea NM Tech Co., Ltd.CHONG IL MACHINE & TOOLS CO.,LTD.SKYDIGITAL INC
Unrecognized loss
\ 46(1,943)
-14
----
18-
19106
Unrecognized loss
\ (4)487
-141
-3014
1613
28--
Accumulated unrecognized loss
\ 6514,746
489339183
3014
161212819
106
Accumulated unrecognized loss
\ 1916,689
489325183
3014
1613
28--
2019 2018
(In millions of Korean won)
KB Financial Group Annual Report 2019174

14. Property and Equipment, and Investment PropertiesDetails of property and equipment as of December 31, 2018 and 2017, are as follows:
The changes in property and equipment for the years ended December 31, 2019 and 2018, are as follows:
LandBuildingsLeasehold improvementsEquipment and vehiclesConstruction in progressRight-of-use assets
LandBuildingsLeasehold improvementsEquipment and vehiclesConstruction in progressRight-of-use assets
Acquisition cost
₩ 2,431,8122,265,929
865,5311,867,739
86,303854,327
₩ 8,371,641
Acquisition cost
₩ 2,433,0592,043,459
878,0781,729,223
88,61844,429
₩ 7,216,866
Accumulated impairment losses
₩ (1,018)(5,859)
---
(1,178)₩ (8,055)
Accumulated impairment losses
₩ (1,018)(5,859)
----
₩ (6,877)
Accumulated depreciation
₩ -(757,147)(749,407)
(1,487,386)-
(302,269)₩ (3,296,209)
Accumulated depreciation
₩ -(707,389)(750,442)
(1,448,599)-
(31,432)₩ (2,937,862)
Carrying amount ₩ 2,430,794
1,502,923116,124380,353
86,303550,880
₩ 5,067,377
Carrying amount
₩ 2,432,0411,330,211
127,636280,624
88,61812,997
₩ 4,272,127
2019
2018
(In millions of Korean won)
(In millions of Korean won)
Land Buildings Leasehold improvement3
Equipment and vehicles Construction in progress Right-of-use assets3
Land Buildings Leasehold improvement Equipment and vehicles Construction in progress Finance lease assets
Ending
\ 2,430,7941,502,923
116,124380,353
86,303550,880
\ 5,067,377
Ending
\2,432,0411,330,211
127,636280,624
88,61812,997
\4,272,127
Disposal
\ (4,907)(9,964)
(338)(526)
-(153,034)
\ (168,769)
Disposal
\ (691)(4,528)
(633)(1,026)
--
\ (6,878)
Business
combination
\ ------
\ -
Business
combination
\ ---
121644
-\ 765
Acquisition
\ 7,33410,90813,398
283,896293,204379,934
\ 988,674
Acquisition
\ 2473,738
28,922182,868236,495
9,640\ 461,910
Others
\ 2836,902
58263
(7,383)16,177
\ 16,300
Others
\ 192,046
11,3285
(1,999)-
\ 11,399
Transfers1
\ (3,957)220,535
58,645(4)
(288,136)19
\ (12,898)
Transfers1
\ (41,888)9,683
70,221242
(161,330)-
\ (123,072)
Depreciation2
\ -(55,669)(77,948)
(183,900)-
(281,404)\ 598,921)
Depreciation2
\ -(51,881)(71,931)
(144,791)-
(5,091)\ (273,694)
Beginning
\2,432,0411,330,211
122,309280,624
88,618589,188
\4,842,991
Beginning
\ 2,474,3541,371,153
89,729243,205
14,8088,448
\4,201,697
2019
2018
(In millions of Korean won)
(In millions of Korean won)
1 Including transfers with investment property and assets held for sale.2 Including depreciation cost and others amounting to \ 111 million and \ 128 million recorded in other operating expenses in the statements of comprehensive income for
the years ended December 31, 2019 and 2018, respectively.3 Beginning balances of leasehold improvement and right-of-use assets are based on Korean IFRS 1116.
Financial Section 175
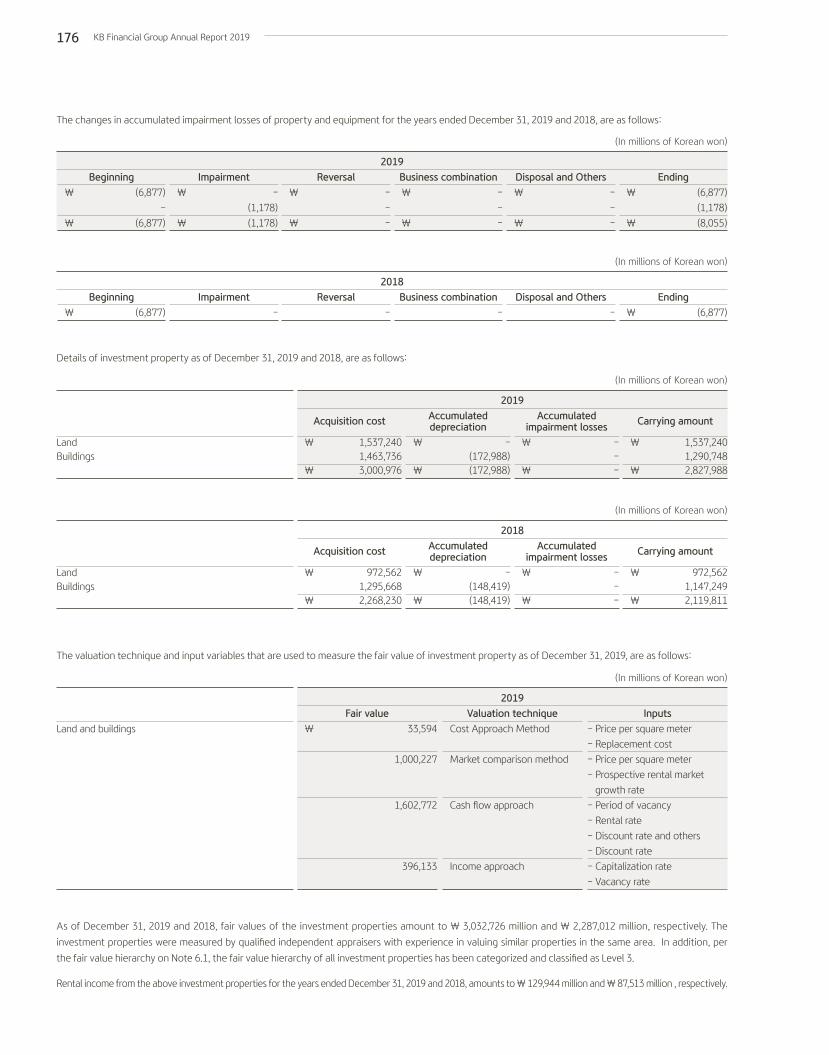
The changes in accumulated impairment losses of property and equipment for the years ended December 31, 2019 and 2018, are as follows:
Details of investment property as of December 31, 2019 and 2018, are as follows:
As of December 31, 2019 and 2018, fair values of the investment properties amount to \ 3,032,726 million and \ 2,287,012 million, respectively. The
investment properties were measured by qualified independent appraisers with experience in valuing similar properties in the same area. In addition, per
the fair value hierarchy on Note 6.1, the fair value hierarchy of all investment properties has been categorized and classified as Level 3.
Rental income from the above investment properties for the years ended December 31, 2019 and 2018, amounts to \ 129,944 million and \ 87,513 million , respectively.
The valuation technique and input variables that are used to measure the fair value of investment property as of December 31, 2019, are as follows:
Beginning\ (6,877)
-
\ (6,877)
Beginning\ (6,877)
Reversal\ -
-
\ -
Reversal-
Disposal and Others\ -
-
\ -
Disposal and Others-
Impairment\ -
(1,178)
\ (1,178)
Impairment-
Business combination\ -
-
\ -
Business combination-
Ending\ (6,877)
(1,178)
\ (8,055)
Ending\ (6,877)
2019
2018
(In millions of Korean won)
(In millions of Korean won)
LandBuildings
Land and buildings
LandBuildings
Acquisition cost
\ 1,537,240
1,463,736\ 3,000,976
Acquisition cost
\ 972,562
1,295,668\ 2,268,230
Accumulated impairment losses
\ --
\ -
Valuation technique
Cost Approach Method
Market comparison method
Cash flow approach
Income approach
Accumulated impairment losses
\ --
\ -
Accumulated depreciation
\ -(172,988)
\ (172,988)
Fair value \ 33,594
1,000,227
1,602,772
396,133
Accumulated depreciation
\ -(148,419)
\ (148,419)
Carrying amount
\ 1,537,2401,290,748
\ 2,827,988
Inputs- Price per square meter
- Replacement cost
- Price per square meter
- Prospective rental market
growth rate
- Period of vacancy
- Rental rate
- Discount rate and others
- Discount rate
- Capitalization rate
- Vacancy rate
Carrying amount
\ 972,5621,147,249
\ 2,119,811
2019
2019
2018
(In millions of Korean won)
(In millions of Korean won)
(In millions of Korean won)
KB Financial Group Annual Report 2019176

The changes in investment property for the years ended December 31, 2019 and 2018, are as follows:
Land
Buildings
Land
Buildings
Ending\ 1,537,240
1,290,748
\ 2,827,988
Ending\ 972,562
1,147,249
\ 2,119,811
Disposal\ (13,318)
(50,780)
\ (64,098)
Disposal\ (57,384)
(50,872)
\ (108,256)
Others\ 1,115
14,184
\ 15,299
Others\ (2,090)
8,935
\ 6,845
Transfers\ (3,374)
(8,861)
\ (12,235)
Transfers\ 66,086
44,622
\ 110,708
Depreciation\ -
(36,877)
\ (36,877)
Depreciation\ -
(26,092)
\ (26,092)
Acquisition\ 580,255
225,833
\ 806,088
Acquisition\ 714,454
573,671
\ 1,288,125
Beginning\ 972,562
1,147,249
\ 2,119,811
Beginning\ 251,496
596,985
\ 848,481
2019
2018
(In millions of Korean won)
(In millions of Korean won)
15. Intangible AssetsDetails of intangible assets as of December 31, 2019 and 2018, are as follows:
GoodwillOther intangible assets
GoodwillOther intangible assets
Acquisition cost
\ 346,3144,420,371
\ 4,766,685
Acquisition cost
\ 346,3144,140,355
\ 4,486,669
Accumulated impairment losses \ (70,517)
(31,652)\ (102,169)
Accumulated impairment losses \ (70,517)
(45,017)\ (115,534)
Accumulated amortization
\ -(1,926,647)
\ (1,926,647)
Accumulated amortization
\ -(1,614,775)
\ (1,614,775)
Carrying amount \ 275,741
2,462,072\ 2,737,813
Carrying amount \ 275,220
2,480,563\ 2,755,783
Other ₩ (56)
-\ (56)
Other \ (577)
-\ (577)
2019
2018
(In millions of Korean won)
(In millions of Korean won)
Details of goodwill as of December 31, 2019 and 2018, are as follows:
Housing & Commercial BankKB Cambodia BankKB Securities Co., Ltd.1
KB Capital Co., Ltd.KB Savings Bank Co., Ltd.KB Securities Vietnam Joint Stock Company2
KB Daehan Specialized Bank PLC.
Acquisition cost
\ 65,2881,202
70,26579,609
115,34313,092
1,515\ 346,314
Acquisition cost
\ 65,2881,202
70,26579,609
115,34313,092
1,515\ 346,314
Carrying amount
\ 65,288-
58,88979,60957,40412,987
1,564\ 275,741
Carrying amount
\ 65,288-
58,88979,60957,40412,520
1,510\ 275,220
2019 2018
(In millions of Korean won)
1 The amount occurred from formerly known as KB Investment & Securities Co., Ltd.2 Changed corporate name from MARITIME SECURITIES INCORPORATION.
Financial Section 177

The changes in accumulated impairment losses of goodwill for the years ended December 31, 2019 and 2018, are as follows:
Goodwill is allocated to cash-generating units, based on management’s analysis, that are expected to benefit from the synergies of the combination
for impairment testing, and cash-generating units consist of an operating segment or units which are not larger than an operating segment. The Group
recognized the amount of \ 65,288 million related to goodwill acquired in the merger of Housing & Commercial Bank. Of those respective amounts, the
amounts of \ 49,315 million and \ 15,973 million were allocated to the Retail Banking and Corporate Banking, respectively. Cash-generating units to
which goodwill has been allocated is tested for impairment annually, and whenever there is an indication that the unit may be impaired, by comparing the
carrying amount of the unit, including the goodwill, with the recoverable amount of the unit.
The recoverable amount of a cash-generating unit is measured at the higher of its fair value less costs to sell and its value in use. The fair value less costs to
sell is the amount obtainable from the sale in an arm’s length transaction between knowledgeable, willing parties, less the costs of disposal. If it is difficult
to measure the amount obtainable from the sale, the Group measures the fair value less costs to sell by reflecting the characteristics of the measured
cash-generating unit. If it is not possible to obtain reliable information to measure the fair value less costs to sell, the Group uses the asset’s value in use
as its recoverable amount. Value in use is the present value of the future cash flows expected to be derived from an asset or cash-generating unit. The
projections of the future cash flows are based on the most recent financial budget approved by management and generally cover a period of five years.
The future cash flows after projection period are estimated on the assumption that the future cash flows will increase by 1.0% for all other cash-generating
units. The key assumptions used for the estimation of the future cash flows are the market size and the Group’s market share. The discount rate is a pre-
tax rate that reflects assumptions regarding risk-free interest rate, market risk premium and the risks specific to the asset for which the future cash flow
estimates have not been adjusted.
Beginning\ (70,517)
Beginning\ (70,517)
Others\ -
Others\ -
Ending\ (70,517)
Ending\ (70,517)
Impairment\ -
Impairment\ -
2019
2018
(In millions of Korean won)
(In millions of Korean won)
The details of allocating goodwill to cash-generating units and related information for impairment testing as of December 31, 2019 are as follows:
Carrying amounts
Recoverable amount exceeded
carrying amount
Discount rate (%)
Permanent growth rate (%)
KB Securities Co., Ltd.1
\ 58,889
663,842
17.25
1.00
KB Capital Co., Ltd.
\ 79,609
1,713,855
11.54
1.00
KB Savings Bank Co., Ltd. and Yehansoul Savings Bank
Co., Ltd.
\ 57,404
481,609
8.29
1.00
KB Securities Vietnam
Joint Stock Company2
\ 12,987
9,077
19.95
1.00
KB DAEHAN SPECIALIZED BANK PLC.
\ 1,564
11,772
19.55
1.00
Total
\ 275,741
9,446,992
Retail Banking
\ 49,315
3,424,398
13.02
1.00
Corporate Banking
\ 15,973
3,142,439
13.09
1.00
Housing & Commercial Bank2019
(In millions of Korean won)
1 The amount occurred from formerly known as KB Investment&Securities Co., Ltd.2 Changed corporate name from MARITIME SECURITIES INCORPORATION.
KB Financial Group Annual Report 2019178

Details of intangible assets as of December 31, 2019 and 2018, are as follows:
Industrial property rights
Software
Other intangible assets
Value of Business Acquired (VOBA)
Right-of-use assets
Industrial property rights
Software
Other intangible assets
Value of Business Acquired (VOBA)
Finance leases assets
Acquisition cost
\ 5,802
1,428,655
555,424
2,395,290
35,200
\ 4,420,371
Acquisition cost
\ 9,248
1,169,549
515,041
2,395,291
51,226
\ 4,140,355
Accumulated impairment losses
\ (19)
-
(31,633)
-
-
\ (31,652)
Accumulated impairment losses
\ (2,090)
-
(42,927)
-
-
\ (45,017)
Accumulated amortization
\ (2,930)
(1,055,136)
(257,274)
(585,805)
(25,502)
\ (1,926,647)
Accumulated amortization
\ (2,661)
(965,044)
(223,503)
(393,346)
(30,221)
\ (1,614,775)
Carrying amount
\ 2,853
373,519
266,517
1,809,485
9,698
\ 2,462,072
Carrying amount
\ 4,497
204,505
248,611
2,001,945
21,005
\ 2,480,563
2019
2018
(In millions of Korean won)
(In millions of Korean won)
The changes in intangible assets, excluding goodwill, for the years ended December 31, 2019 and 2018, are as follows:
Industrial property rights
Software
Other intangible assets2
Value of Business Aquired (VOBA)
Right-of-use assets
Industrial property rights
Software
Other intangible assets2
Value of Business Aquired (VOBA)
Finance leases assets
Ending
\ 2,853
373,519
266,517
1,809,485
9,698
\ 2,462,072
Ending
\ 4,497
204,505
248,611
2,001,945
21,005
\ 2,480,563
Amortization1
\ (658)
(105,228)
(33,590)
(192,460)
(9,893)
\ (341,829)
Amortization1
\ (639)
(76,280)
(24,388)
(214,153)
(8,388)
\ (323,848)
Others
\ -
(341)
5,254
-
(2,482)
\ 2,431
Others
\ (2,091)
(190)
(204)
-
-
\ (2,485)
Disposal
\ (1,160)
-
(13,534)
-
-
\ (14,694)
Disposal
\ (1,200)
(6)
(10,290)
-
-
\ (11,496)
Business combination
\ -
-
-
-
-
\ -
Business combination
\ -
17
-
-
-
\ 17
Acquisition & Transfer
\ 174
274,583
59,776
-
1,010
\ 335,543
Acquisition & Transfer
\ 1,329
103,398
36,014
8,024
\ 148,765
Beginning
\ 4,497
204,505
248,611
2,001,945
21,063
\ 2,480,621
Beginning
\ 7,098
177,566
247,479
2,216,098
21,369
\ 2,669,610
2019
2018
(In millions of Korean won)
(In millions of Korean won)
1 Including \ 193,085 million and \ 214,735 million recorded in insurance expenses and other operating expenses and others in the statements of comprehensive income for the years ended December 31, 2019 and 2018.
2 Impairment loss for membership right of other intangible asset with indefinite useful life was recognized when its recoverable amount is lower than its carrying amount, and reversal of impairment loss was recognized when its recoverable amount is higher than its carrying amount.
Financial Section 179

The changes in accumulated impairment losses on intangible assets for the years ended December 31, 2019 and 2018, are as follows:
Accumulated impairment losses on
intangible assets
Accumulated impairment losses on
intangible assets
Reversal
\ 6,859
Reversal
\ 3,475
Ending
\ (31,652)
Ending
\ (45,017)
Impairment
\ (1,578)
Impairment
\ (5,846)
Disposal and others
\ 8,084
Disposal and others
\ 428
Beginning
\ (45,017)
Beginning
\ (43,074)
2019
2018
(In millions of Korean won)
(In millions of Korean won)
16. Deferred Income Tax Assets and LiabilitiesDetails of deferred income tax assets and liabilities as of December 31, 2019 and 2018, are as follows:
Other provisionsAllowances for loan lossesImpairment losses on property and equipmentShare-based paymentsProvisions for guaranteesLosses (gains) from valuation on derivative financial instrumentsPresent value discountLosses (gains) from fair value hedged itemAccrued interestDeferred loan origination fees and costsAdvanced depreciation provisionGains from revaluationInvestments in subsidiaries and othersLosses (gains) on valuation of security investmentDefined benefit liabilitiesAccrued expensesRetirement insurance expenseAdjustments to the prepaid contributionsDerivative-linked securitiesOthers
Offsetting of deferred income tax assets and liabilities
Liabilities \ -
(3,266)(1,952)
--
(158,604)(4,201)
-(110,359)(199,000)
(1,703)(329,331)(105,470)(265,934)
--
(489,602)(22,897)(34,635)
(762,429)(2,489,383)
1,711,590\ (777,793)
Assets \ 115,500
4514,396
18,00220,95951,160
8,24412,123
-531
-549
35,30639,949
557,423249,999
--
131,259469,336
1,715,187(1,711,590)
\ 3,597
Net amount\ 115,500
(2,815)2,444
18,00220,959
(107,444)4,043
12,123(110,359)(198,469)
(1,703)(328,782)
(70,164)(225,985)
557,423249,999
(489,602)(22,897)
96,624(293,093)(774,196)
-\ (774,196)
2019
(In millions of Korean won)
Other provisionsAllowances for loan lossesImpairment losses on property and equipmentShare-based paymentsProvisions for guaranteesLosses (gains) from valuation on derivative financial instrumentsPresent value discountLosses (gains) from fair value hedged itemAccrued interest
Liabilities \ -
(65)(2,032)
--
(13,485)(2,380)
(25,873)(113,152)
Assets \ 109,721
3,3276,030
17,65520,298
138,4016,763
--
Net amount\ 109,721
3,2623,998
17,65520,298
124,9164,383
(25,873)(113,152)
2018
(In millions of Korean won)
KB Financial Group Annual Report 2019180

Deferred loan origination fees and costsAdvanced depreciation provisionGains from revaluationInvestments in subsidiaries and othersLosses (gains) on valuation of security investmentDefined benefit liabilitiesAccrued expensesRetirement insurance expenseAdjustments to the prepaid contributionsDerivative-linked securitiesOthers
Offsetting of deferred income tax assets and liabilities
Liabilities (194,848)
(1,703)(330,548)
(78,586)(181,638)
--
(444,244)(19,033)(74,765)
(568,357)(2,050,709)
1,558,175\ (492,534)
Assets 506
-648
33,58976,558
494,572272,190
17,559-
3,762360,754
1,562,333(1,558,175)\ 4,158
Net amount(194,342)
(1,703)(329,900)
(44,997)(105,080)
494,572272,190
(426,685)(19,033)(71,003)
(207,603)(488,376)
-\ (488,376)
2018
(In millions of Korean won)
Unrecognized deferred income tax assets
No deferred income tax assets have been recognized for the deductible temporary difference of \ 67,645 million associated with investments in
subsidiaries and others as of December 31, 2019, because it is not probable that the temporary differences will be reversed in the foreseeable future.
No deferred income tax assets have been recognized for deductible temporary differences of \ 125,158 million with others, as of December 31, 2019, due
to the uncertainty that these will be realized in the future.
Unrecognized deferred income tax liabilities
No deferred income tax liabilities have been recognized for the taxable temporary difference of \ 68,836 million associated with investment in subsidiaries
and associates as of December 31, 2019, due to the following reasons:
- The Group is able to control the timing of the reversal of the temporary difference.
- It is probable that the temporary difference will not be reversed in the foreseeable future.
No deferred income tax liabilities have been recognized as of December 31, 2019, for the taxable temporary difference of \ 65,288 million arising from the
initial recognition of goodwill from the merger of Housing and Commercial Bank in 2001.
The changes in cumulative temporary differences for the years ended December 31, 2019 and 2018, are as follows:
Deductible temporary differencesLosses(gains) from fair value hedged item
Other provisions
Allowances for loan losses
Impairment losses on property and equipment
Deferred loan origination fees and costs
Share-based payments
Provisions for guarantees
Gains(losses) from valuation on derivative financial instruments
Present value discount
Investments in subsidiaries and others
Gains on valuation of security investment
Defined benefit liabilities
Accrued expenses
Derivative linked securities
Others
Increase
44,085
424,227
5,697
15,460
1,930
55,496
76,214
186,035
29,732
47,727
130,823
384,616
912,019
477,307
978,968
3,770,336
Decrease
-
411,747
16,160
21,402
1,841
52,475
73,809
503,277
24,347
47,217
264,318
200,827
994,326
13,679
600,007
3,225,432
Beginning
-
411,903
12,481
21,927
1,841
60,071
73,809
503,277
24,593
184,870
269,731
1,977,430
993,906
13,679
1,289,322
5,838,840
Ending
44,085
424,383
2,018
15,985
1,930
63,092
76,214
186,035
29,978
185,380
136,236
2,161,219
911,599
477,307
1,668,283
6,383,744
2019
(In millions of Korean won)
Financial Section 181
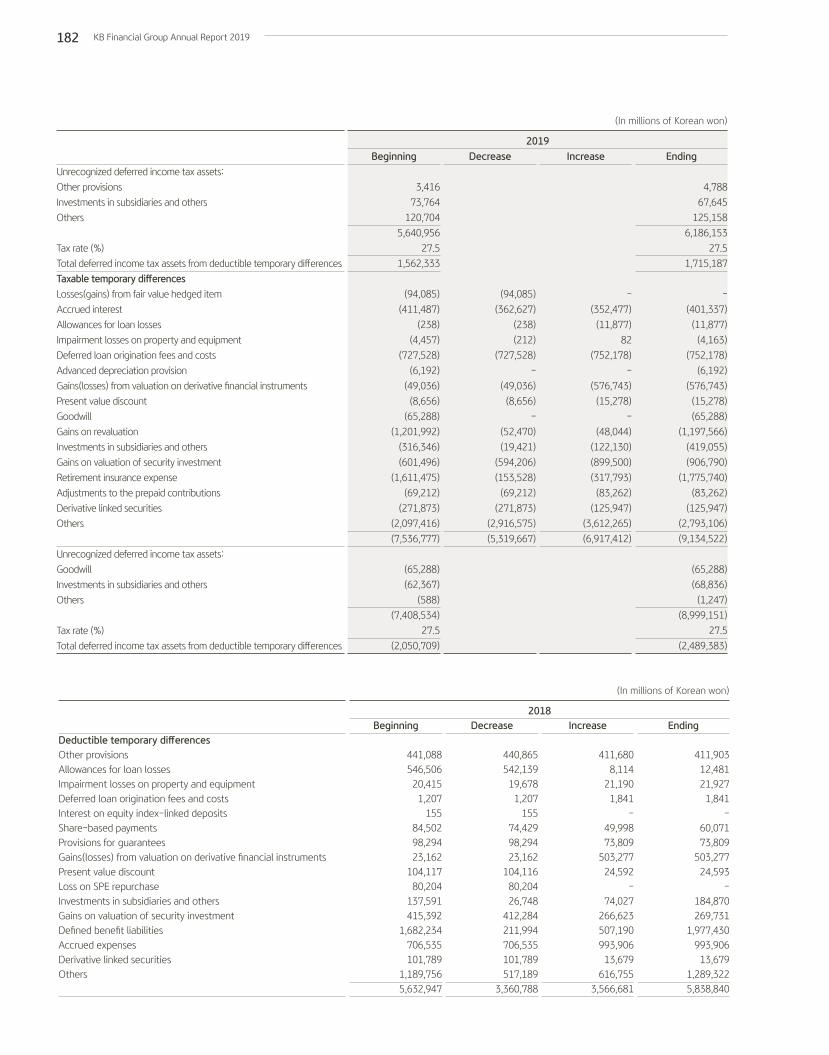
Unrecognized deferred income tax assets:
Other provisions
Investments in subsidiaries and others
Others
Tax rate (%)
Total deferred income tax assets from deductible temporary differences
Taxable temporary differencesLosses(gains) from fair value hedged item
Accrued interest
Allowances for loan losses
Impairment losses on property and equipment
Deferred loan origination fees and costs
Advanced depreciation provision
Gains(losses) from valuation on derivative financial instruments
Present value discount
Goodwill
Gains on revaluation
Investments in subsidiaries and others
Gains on valuation of security investment
Retirement insurance expense
Adjustments to the prepaid contributions
Derivative linked securities
Others
Unrecognized deferred income tax assets:
Goodwill
Investments in subsidiaries and others
Others
Tax rate (%)
Total deferred income tax assets from deductible temporary differences
Increase
-
(352,477)
(11,877)
82
(752,178)
-
(576,743)
(15,278)
-
(48,044)
(122,130)
(899,500)
(317,793)
(83,262)
(125,947)
(3,612,265)
(6,917,412)
Decrease
(94,085)
(362,627)
(238)
(212)
(727,528)
-
(49,036)
(8,656)
-
(52,470)
(19,421)
(594,206)
(153,528)
(69,212)
(271,873)
(2,916,575)
(5,319,667)
Beginning
3,416
73,764
120,704
5,640,956
27.5
1,562,333
(94,085)
(411,487)
(238)
(4,457)
(727,528)
(6,192)
(49,036)
(8,656)
(65,288)
(1,201,992)
(316,346)
(601,496)
(1,611,475)
(69,212)
(271,873)
(2,097,416)
(7,536,777)
(65,288)
(62,367)
(588)
(7,408,534)
27.5
(2,050,709)
Ending
4,788
67,645
125,158
6,186,153
27.5
1,715,187
-
(401,337)
(11,877)
(4,163)
(752,178)
(6,192)
(576,743)
(15,278)
(65,288)
(1,197,566)
(419,055)
(906,790)
(1,775,740)
(83,262)
(125,947)
(2,793,106)
(9,134,522)
(65,288)
(68,836)
(1,247)
(8,999,151)
27.5
(2,489,383)
2019
(In millions of Korean won)
Deductible temporary differencesOther provisionsAllowances for loan losses Impairment losses on property and equipmentDeferred loan origination fees and costsInterest on equity index-linked depositsShare-based paymentsProvisions for guaranteesGains(losses) from valuation on derivative financial instrumentsPresent value discountLoss on SPE repurchaseInvestments in subsidiaries and othersGains on valuation of security investmentDefined benefit liabilitiesAccrued expensesDerivative linked securitiesOthers
Increase
411,6808,114
21,1901,841
-49,99873,809
503,27724,592
-74,027
266,623507,190993,906
13,679616,755
3,566,681
Decrease
440,865542,139
19,6781,207
15574,42998,29423,162
104,11680,20426,748
412,284211,994706,535101,789517,189
3,360,788
Beginning
441,088546,506
20,4151,207
15584,50298,29423,162
104,11780,204
137,591415,392
1,682,234706,535101,789
1,189,7565,632,947
Ending
411,90312,48121,927
1,841-
60,07173,809
503,27724,593
-184,870269,731
1,977,430993,906
13,6791,289,3225,838,840
2018
(In millions of Korean won)
KB Financial Group Annual Report 2019182

Unrecognized deferred income tax assets:Other provisionsLoss on SPE repurchaseInvestments in subsidiaries and othersOthers
Tax rate (%)Total deferred income tax assets from deductible temporary differencesTaxable temporary differencesLosses(gains) from fair value hedged itemAccrued interestAllowances for loan lossesImpairment losses on property and equipmentDeferred loan origination fees and costs Advanced depreciation provisionGains(losses) from valuation on derivative financial instrumentsPresent value discountGoodwillGains on revaluationInvestments in subsidiaries and othersGains on valuation of security investmentRetirement insurance expenseAdjustments to the prepaid contributionsDerivative linked securitiesOthers
Unrecognized deferred income tax assets:GoodwillInvestments in subsidiaries and othersOthers
Tax rate (%)Total deferred income tax assets from deductible temporary differences
Increase
(94,085)(370,463)
(238)(2,976)
(727,528)-
(49,036)(8,656)
-(50,758)(74,847)
(600,642)(405,907)
(69,212)(271,873)
(1,664,205)(4,390,426)
Decrease
(57,083)(364,518)
--
(668,657)-
(38,051)(11,948)
-(124,407)(146,234)(799,187)(136,444)
(59,040)(20,650)
(1,261,852)(3,688,071)
Beginning
2,87980,20455,546
112,0305,382,288
27.51,487,039
(57,083)(405,542)
-(1,481)
(668,657)(6,192)
(38,051)(11,948)(65,288)
(1,275,641)(387,733)(800,041)
(1,342,012)(59,040)(20,650)
(1,695,063)(6,834,422)
(65,288)(17,205)
(906)(6,751,023)
27.5(1,861,070)
Ending
3,416-
73,764120,704
5,640,95627.5
1,562,333
(94,085)(411,487)
(238)(4,457)
(727,528)(6,192)
(49,036)(8,656)
(65,288)(1,201,992)
(316,346)(601,496)
(1,611,475)(69,212)
(271,873)(2,097,416)(7,536,777)
(65,288)(62,367)
(588)(7,408,534)
27.5(2,050,709)
2018
(In millions of Korean won)
1 Prepared in accordance with Korean IFRS 1109.
1 Acquisition cost of buildings held for sale is net of accumulated depreciation.
17. Assets Held for SaleDetails of assets held for sale as of December 31, 2019 and 2018, are as follows:
Land held for saleBuildings held for sale
Land held for saleBuildings held for sale
Acquisition cost1
\ 14,54211,391
\ 25,933
Acquisition cost1
\ 16,0489,054
\ 25,102
Carrying amount
\ 13,01210,139
\ 23,151
Carrying amount
\ 12,6064,346
\ 16,952
Accumulated impairment
\ (1,530)(1,252)
\ (2,782)
Accumulated impairment
\ (3,442)(4,708)
\ (8,150)
Fair value less costs to sell
\ 14,37412,396
\ 26,770
Fair value less costs to sell
\ 16,5524,403
\ 20,955
2019
2018
(In millions of Korean won)
(In millions of Korean won)
Financial Section 183

The valuation technique and input variables that are used to measure the fair value of assets held for sale as of December 31, 2019 are as follows:
The fair values of assets held for sale were measured by qualified independent appraisers with experience in valuing similar properties in the same area. In
addition, per the fair value hierarchy on Note 6.1, the fair value hierarchy of all investment properties has been categorized and classified as Level 3.
The changes in accumulated impairment losses of assets held for sale for the years ended December 31, 2019 and 2018, are as follows:
As of December 31, 2019, assets held for sale consist of four real estates of closed offices, which were committed to sell by the management, but not yet
sold as of December 31, 2019. Negotiation with buyers is in process for the one asset and the remaining three assets are also being actively marketed.
Land and buildings
Unobservable input2
Adjustment index
Relationship of unobservable inputs to fair
value
Fair value increases as
the adjustment index rises.
Valuation technique1
Market comparison
approach model
Range of unobservable inputs
(%)
0.44 ~ 1.40
Fair value
\ 26,770
2019
(In millions of Korean won)
1 The Group adjusted the appraisal value by the adjustment ratio in the event the public sale is unsuccessful.2 Adjustment index is calculated using the real estate index or the producer price index, or land price volatility.
Beginning\ (8,150)
Beginning\ (12,801)
Reversal\ -
Reversal\ 286
Others\ 5,701
Others\ 9,646
Ending\ (2,782)
Ending\ (8,150)
Provision\ (333)
Provision\ (5,281)
2019
2018
(In millions of Korean won)
(In millions of Korean won)
18. Other AssetsDetails of other assets as of December 31, 2019 and 2018, are as follows:
Other financial assetsOther receivablesAccrued incomeGuarantee depositsDomestic exchange settlement debitsOthersAllowancesPresent value discount
Other non-financial assetsOther receivablesPrepaid expensesGuarantee depositsInsurance assetsSeparate account assetsOthersAllowances
2019
\ 5,792,8141,659,1821,146,000
531,356129,039
(104,629)(6,703)
9,147,059
1,294198,893
4,0841,662,0165,052,8042,173,693
(24,235)9,068,549
\ 18,215,608
2018
\ 4,708,9101,724,3281,182,686
504,899125,380
(106,275)(6,372)
8,133,556
4,965205,394
4,5291,362,8774,715,4141,347,580
(24,780)7,615,979
\ 15,749,535
(In millions of Korean won)
KB Financial Group Annual Report 2019184
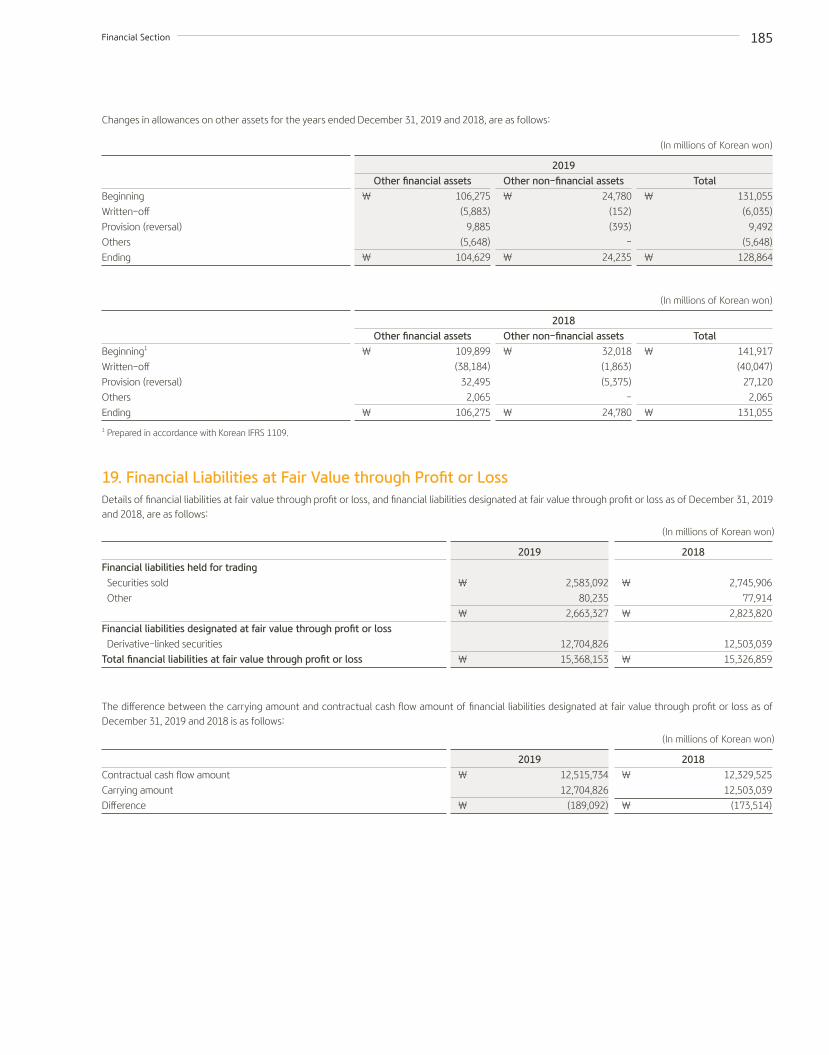
Changes in allowances on other assets for the years ended December 31, 2019 and 2018, are as follows:
Financial liabilities held for trading Securities sold
Other
Financial liabilities designated at fair value through profit or loss Derivative-linked securities
Total financial liabilities at fair value through profit or loss
Contractual cash flow amount
Carrying amount
Difference
2019
\ 2,583,092
80,235
\ 2,663,327
12,704,826
\ 15,368,153
2019 \ 12,515,734
12,704,826
\ (189,092)
2018
\ 2,745,906
77,914
\ 2,823,820
12,503,039
\ 15,326,859
2018 \ 12,329,525
12,503,039
\ (173,514)
(In millions of Korean won)
(In millions of Korean won)
Beginning
Written-off
Provision (reversal)
Others
Ending
Beginning1
Written-off
Provision (reversal)
Others
Ending
Other non-financial assets\ 24,780
(152)
(393)
-
\ 24,235
Other non-financial assets\ 32,018
(1,863)
(5,375)
-
\ 24,780
Other financial assets \ 106,275
(5,883)
9,885
(5,648)
\ 104,629
Other financial assets \ 109,899
(38,184)
32,495
2,065
\ 106,275
Total\ 131,055
(6,035)
9,492
(5,648)
\ 128,864
Total\ 141,917
(40,047)
27,120
2,065
\ 131,055
2019
2018
(In millions of Korean won)
(In millions of Korean won)
1 Prepared in accordance with Korean IFRS 1109.
19. Financial Liabilities at Fair Value through Profit or LossDetails of financial liabilities at fair value through profit or loss, and financial liabilities designated at fair value through profit or loss as of December 31, 2019 and 2018, are as follows:
The difference between the carrying amount and contractual cash flow amount of financial liabilities designated at fair value through profit or loss as of December 31, 2019 and 2018 is as follows:
Financial Section 185

20. DepositsDetails of deposits as of December 31, 2019 and 2018, are as follows:
21. DebtsDetails of debts as of December 31, 2019 and 2018, are as follows:
Details of borrowings as of December 31, 2019 and 2018, are as follows:
Demand deposits Demand deposits in Korean won
Demand deposits in foreign currencies
Time depositsTime deposits in Korean won
Time deposits in foreign currencies
Fair value adjustments on valuation of fair value hedged items
Certificates of depositsTotal deposits
Borrowings
Repurchase agreements and others
Call money
Borrowings in Korean won
Borrowings in foreign currencies
Borrowings from Bank of Korea
Borrowings from the government
Borrowings from banks
Borrowings from non-banking financial institutions
Other borrowings
Due to banks
Borrowings from banks
Borrowings from other financial institutions
Other borrowings
Lenders
Bank of Korea
SEMAS and others
Shinhan Bank and others
Korea Securities Finance Corporation and others
The Korea Development Bank and others
KEB Hana Bank and others
Central Bank of Uzbekistan and others
The Export-Import Bank of Korea and others
Standard Chartered Bank and others
2019
\ 127,790,349
8,550,068
136,340,417
157,653,603
157,653,603
7,377,173
(18,391)
7,358,782
165,012,385
4,239,969
\ 305,592,771
2019 \ 24,370,567
13,015,506
432,787
\ 37,818,860
2019
\ 2,649,851
1,658,810
116,160
1,982,242
8,022,921
\ 14,429,984
4,682
8,089,368
7,081
1,839,452
9,940,583
\ 24,370,567
Annual interest rate (%)
0.50 ~ 0.75
0.00 ~ 3.00
1.71 ~ 3.25
0.20 ~ 3.80
0.00 ~ 4.90
-
0.00 ~ 8.50
2.28 ~3.08
0.00 ~ 3.00
2018
\ 115,602,691
6,887,280
122,489,971
145,336,136
145,336,136
5,501,887
(89,264)
5,412,623
150,748,759
3,531,719
\ 276,770,449
2018 \ 19,969,328
11,954,491
1,081,015
\ 33,004,834
2018
\ 1,672,714
1,745,940
100,100
1,852,953
5,033,768
\ 10,405,475
13,353
7,521,197
18,725
2,010,578
9,563,853
\ 19,969,328
(In millions of Korean won)
(In millions of Korean won)
(In millions of Korean won)
KB Financial Group Annual Report 2019186

22. DebenturesDetails of debentures as of December 31, 2019 and 2018, are as follows:
The details of repurchase agreements and others as of December 31, 2019 and 2018, are as follows:
The details of call money as of December 31, 2019 and 2018, are as follows:
Repurchase agreementsBills sold
Call money in Korean wonCall money in foreign currencies
Debentures in Korean won Structured debentures Subordinated fixed rate debentures Fixed rate debentures Floating rate debentures
Fair value adjustments on fair value hedged debentures in Korean won Less: Discount on debentures in Korean won
Debentures in foreign currencies Floating rate debentures Fixed rate debentures
Fair value adjustments on fair value hedged debentures in foreign currencies Less: Discount on debentures in foreign currencies
Lenders
Individuals, Groups and CorporationsCounter sale
Lenders
HI Asset Management and othersCentral Bank of Uzbekistan and others
2019
\ 13,011,1214,385
\ 13,015,506
2019
\ 165,000267,787
\ 432,787
2019
\ 1,458,5513,386,590
39,171,5141,580,000
45,596,65521,070
(30,029)45,587,696
2,227,6073,094,1965,321,803
41,406(15,322)
5,347,887\ 50,935,583
Annual interest rate (%)
0.91~2.900.70~1.05
Annual interest rate (%)
1.42~1.442.91~4.30
Annual interest rate (%)
1.74 ~ 5.862.96 ~ 4.351.35 ~ 3.791.52 ~ 2.24
2.26 ~ 2.841.60 ~ 4.50
2018
\ 11,946,8967,595
\ 11,954,491
2018
\ 718,600362,415
\ 1,081,015
2018
\ 1,296,8603,437,729
42,203,5451,650,000
48,588,13419,252
(33,445)48,573,941
1,791,8682,951,2514,743,119
(24,073)(14,290)
4,704,756\ 53,278,697
(In millions of Korean won)
(In millions of Korean won)
(In millions of Korean won)
Changes in debentures based on face value for the years ended December 31, 2019 and 2018, are as follows:
Debentures in Korean wonStructured debenturesSubordinated fixed rate debenturesFixed rate debenturesFloating rate debentures
Debentures in foreign currencies Floating rate debenturesFixed rate debentures
Beginning
₩ 1,296,8603,437,729
42,203,5451,650,000
₩ 48,588,134
1,791,8682,951,2514,743,119
₩ 53,331,253
Repayments
₩ (1,263,550)(51,139)
(93,566,831)(640,000)
₩ (95,521,520)
(33,199)(590,950)(624,149)
₩ (96,145,669)
Issues
₩ 1,425,241-
90,534,800570,000
₩ 92,530,041
532,380595,490
1,127,870₩ 93,657,911
Others
₩ ----
₩ -
(63,442)138,405
74,963₩ 74,963
Ending
₩ 1,458,5513,386,590
39,171,5141,580,000
₩ 45,596,655
2,227,6073,094,1965,321,803
₩ 50,918,458
2019
(In millions of Korean won)
Financial Section 187

23. ProvisionsDetails of debentures as of December 31, 2019 and 2018, are as follows:
Debentures in Korean wonStructured debenturesSubordinated fixed rate debenturesFixed rate debenturesFloating rate debentures
Debentures in foreign currencies Floating rate debenturesFixed rate debentures
Beginning
₩ 869,2942,913,411
36,823,365728,000
₩ 41,334,070
1,371,3922,363,4863,734,878
₩ 45,068,948
Repayments
₩ (3,235,231)(75,682)
(131,606,920)(238,000)
₩ (135,155,833)
(384,230)-
(384,230)₩ (135,540,063)
Issues
₩ 3,662,797600,000
136,987,1001,160,000
₩ 142,409,897
725,638493,022
1,218,660₩ 143,628,557
Others
₩ ----
₩ -
79,06894,743
173,811₩ 173,811
Ending
₩ 1,296,8603,437,729
42,203,5451,650,000
₩ 48,588,134
1,791,8682,951,2514,743,119
₩ 53,331,253
2018
(In millions of Korean won)
Provisions for unused loan commitmentsProvisions for payment guaranteesProvisions for financial guarantee contractsProvisions for restoration costOthers
2019 \ 208,148
77,7596,063
120,340115,619
\ 527,929
2018 \ 210,677
75,1754,275
108,000127,732
\ 525,859
(In millions of Korean won)
Changes in provisions for unused loan commitments, payment guarantees for the years ended December 31, 2019 and 2018, are as follows:
Beginning Transfer between stages Transfer to 12-month expected credit losses Transfer to lifetime expected credit losses Impairment Provision (reversal) for credit losses Others (change of exchange rate, etc.)Ending
Beginning1
Transfer between stages Transfer to 12-month expected credit losses Transfer to lifetime expected credit losses Impairment Provision (reversal) for credit losses Others (change of exchange rate, etc.)Ending
12-month expected credit
losses
\ 132,876
32,622(16,932)
(422)(21,171)
324\ 127,297
12-month expected credit
losses
\ 124,487
25,562(11,053)
(481)(5,932)
293\ 132,876
12-month expected credit
losses
\ 27,084 365 (975) (24)
(1,763) 274\ 24,961
12-month expected credit
losses
\ 41,637
660(913)
(6)(14,702)
408\ 27,084
Non-impaired\ 68,920
(31,408) 7,195
(1,516)18,036
237\ 71,464
Non-impaired\ 63,407
(24,067)11,381(1,333)19,374
158\ 68,920
Non-impaired\ 30,109 (365) 1,705 (280) 4,584 259\ 36,012
Non-impaired\ 39,628
(661)1,055
(87)(10,069)
243\ 30,109
Impaired\ 8,881
(1,214) (263) 1,938 45 -\ 9,387
Impaired\ 7,746
(1,494)(327)1,8151,141
-\ 8,881
Impaired\ 17,982 - (729) 304 (893) 122\ 16,786
Impaired\ 18,744
-(141)
93(897)
183\ 17,982
2019
2018
(In millions of Korean won)
(In millions of Korean won)
Provisions for unused loan commitments
Provisions for unused loan commitments
Provisions for unused loan commitments
Provisions for unused loan commitments
Lifetime expected credit losses
Lifetime expected credit losses
Lifetime expected credit losses
Lifetime expected credit losses
1 Restated in accordance with Korean IFRS 1109.
KB Financial Group Annual Report 2019188

Beginning1
Provision (reversal)
Others
Ending
2019 ₩ 4,275
1,865
(77)
₩ 6,063
2018 ₩ 4,857
(582)
-
₩ 4,275
(In millions of Korean won)
Changes in provisions for financial guarantee contracts for the years ended December 31, 2019 and 2018, are as follows:
1 The beginning balance for 2018 has been restated in accordance with Korean IFRS 1109.
BeginningProvisionReversalUsed Unwinding of discountEffects of changes in discount rateEnding
2019 ₩ 108,000
7,037(7,178)(5,211)
2,23715,455
₩ 120,340
2018 ₩ 95,194
7,301(2,055)(3,627)
2,5078,680
₩ 108,000
(In millions of Korean won)
Changes in provisions for restoration cost for the years ended December 31, 2019 and 2018, are as follows:
Provisions for restoration cost are the present value of estimated costs to be incurred for the restoration of the leased properties. Actual expenses are expected to be incurred at the end of each lease contract. Three-year historical data of expired leases were used to estimate the average lease period. Also, the average restoration expense based on actual three-year historical data and the three-year historical average inflation rate were used to estimate the present value of estimated costs.
Changes in other provisions for the years ended December 31, 2019 and 2018, are as follows:
BeginningIncreaseDecreaseEnding
BeginningIncreaseDecreaseEnding
Total
\ 127,732121,024
(133,137)\ 115,619
Total
₩ 203,14676,355
(151,769)₩ 127,732
Litigations
\ 21,19023,863
(16,363)\ 28,690
Litigations
₩ 23,7632,699
(5,272)₩ 21,190
Others1
\ 89,51138,025
(58,855)\ 68,681
Others1
₩ 159,04424,722
(94,255)₩ 89,511
Dormant accounts
\ 4,3772,378
(3,176)\ 3,579
Dormant accounts
₩ 5,0502,657
(3,330)₩ 4,377
Greenhouse gas emission
liabilities
\ ---
\ -
Greenhouse gas emission
liabilities
₩ 177-
(177)₩ -
Membership rewards program
\ 12,65456,758
(54,743)\ 14,669
Membership rewards program
₩ 15,11246,277
(48,735)₩ 12,654
2019
2018
(In millions of Korean won)
(In millions of Korean won)
1 As of December 31, 2019, the Group’s provision on incomplete sales on cardssurance are ₩ 2,532 million.
1 As of December 31, 2018, the Group’s provision on incomplete sales on cardssurance are ₩ 26,930 million.
Financial Section 189

24. Net Defined Benefit Liabilities (assets)Defined benefit plan
The Group operates defined benefit plans which have the following characteristics:
- The Group has the obligation to pay the agreed benefits to all its current and former employees.- Actuarial risk (that benefits will cost more than expected) and investment risk fall, in substance, on the Group.
The defined benefit liability recognized in the statements of financial position is calculated by independent actuaries in accordance with actuarial valuation methods.
The net defined benefit obligation is calculated using the Projected Unit Credit method (the ‘PUC’). Data used in the PUC such as interest rates, future salary
increase rate, mortality rate and consumer price index are based on observable market data and historical data which are updated annually.
Actuarial assumptions may differ from actual results, due to changes in the market, economic trends and mortality trends which may impact defined benefit
liabilities and future payments. Actuarial gains and losses arising from changes in actuarial assumptions are recognized in the period incurred through other
comprehensive income.
Changes in the net defined benefit liabilities for the years ended December 31, 2019 and 2018, are as follows:
Beginning
Current service cost
Past service cost
Interest cost (income)
Remeasurements:
Actuarial gains and losses by changes in
demographic assumptions
Actuarial gains and losses by changes in
financial assumptions
Actuarial gains and losses by experience adjustments
Return on plan assets (excluding amounts included
in interest income)
Contributions
Payments from plans (benefit payments)
Payments from the Group
Transfer in
Transfer out
Effect of exchange rate changes
Others
Ending1
Present value of defined benefit obligation
₩ 2,172,260
226,788
2,276
48,795
(3,122)
61,547
7,458
-
-
(141,820)
(32,556)
7,775
(7,517)
(2)
(129)
₩ 2,341,753
Net defined benefit liabilities
₩ 262,213
226,788
2,276
5,545
(3,122)
61,547
7,458
11,116
(288,420)
(22)
(32,556)
350
-
(2)
(128)
₩ 253,043
Fair value of plan assets
₩ (1,910,047)
-
-
(43,250)
-
-
-
11,116
(288,420)
141,798
-
(7,425)
7,517
-
1
₩ (2,088,710)
2019
(In millions of Korean won)
1 The net defined benefit liabilities of \ 253,043 million is calculated by subtracting \ 946 million net defined benefit assets from \ 253,989 million net defined benefit
liabilities
KB Financial Group Annual Report 2019190
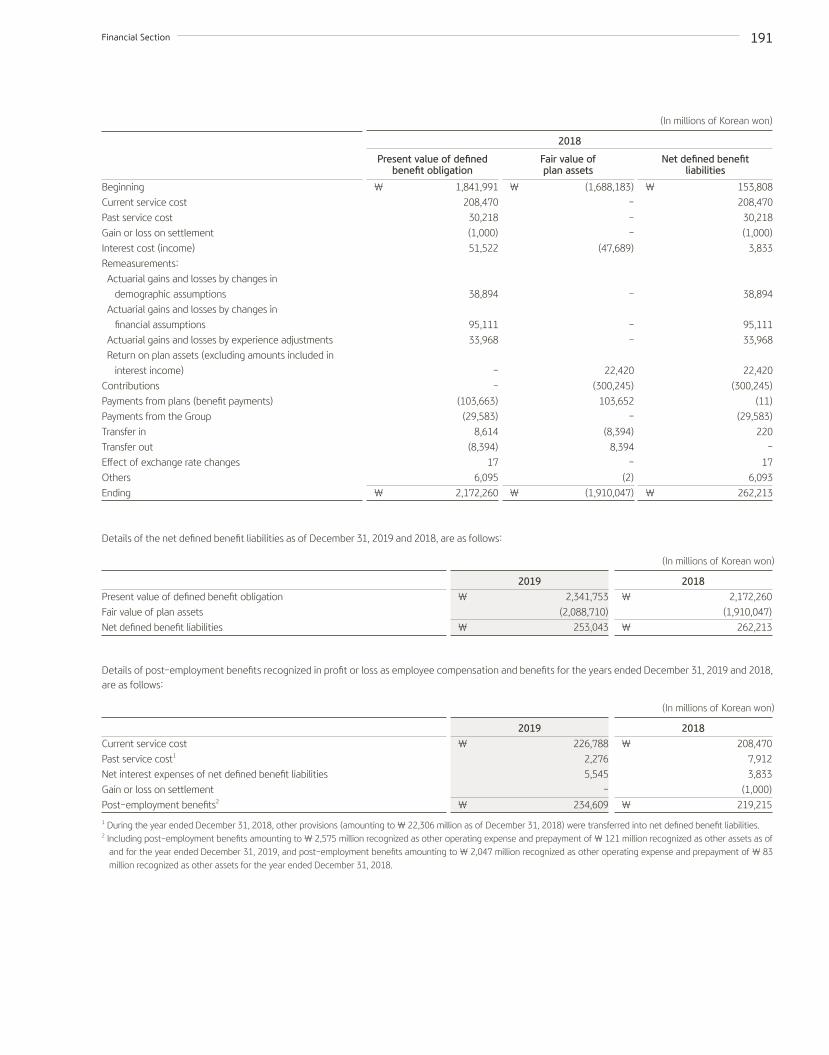
Beginning
Current service cost
Past service cost
Gain or loss on settlement
Interest cost (income)
Remeasurements:
Actuarial gains and losses by changes in
demographic assumptions
Actuarial gains and losses by changes in
financial assumptions
Actuarial gains and losses by experience adjustments
Return on plan assets (excluding amounts included in
interest income)
Contributions
Payments from plans (benefit payments)
Payments from the Group
Transfer in
Transfer out
Effect of exchange rate changes
Others
Ending
Present value of defined benefit obligation
₩ 1,841,991
208,470
30,218
(1,000)
51,522
38,894
95,111
33,968
-
-
(103,663)
(29,583)
8,614
(8,394)
17
6,095
₩ 2,172,260
Net defined benefit liabilities
₩ 153,808
208,470
30,218
(1,000)
3,833
38,894
95,111
33,968
22,420
(300,245)
(11)
(29,583)
220
-
17
6,093
₩ 262,213
Fair value of plan assets
₩ (1,688,183)
-
-
-
(47,689)
-
-
-
22,420
(300,245)
103,652
-
(8,394)
8,394
-
(2)
₩ (1,910,047)
2018
(In millions of Korean won)
Present value of defined benefit obligation
Fair value of plan assets
Net defined benefit liabilities
Current service cost
Past service cost1
Net interest expenses of net defined benefit liabilities
Gain or loss on settlement
Post-employment benefits2
2019 \ 2,341,753
(2,088,710)
\ 253,043
2019 \ 226,788
2,276
5,545
-
\ 234,609
2018 \ 2,172,260
(1,910,047)
\ 262,213
2018 \ 208,470
7,912
3,833
(1,000)
\ 219,215
(In millions of Korean won)
(In millions of Korean won)
Details of the net defined benefit liabilities as of December 31, 2019 and 2018, are as follows:
Details of post-employment benefits recognized in profit or loss as employee compensation and benefits for the years ended December 31, 2019 and 2018, are as follows:
1 During the year ended December 31, 2018, other provisions (amounting to ₩ 22,306 million as of December 31, 2018) were transferred into net defined benefit liabilities.2 I ncluding post-employment benefits amounting to ₩ 2,575 million recognized as other operating expense and prepayment of ₩ 121 million recognized as other assets as of
and for the year ended December 31, 2019, and post-employment benefits amounting to ₩ 2,047 million recognized as other operating expense and prepayment of ₩ 83 million recognized as other assets for the year ended December 31, 2018.
Financial Section 191

Remeasurements:
Return on plan assets (excluding amounts included in interest income)
Actuarial gains and losses
Income tax effects
Remeasurements after income tax
2019
\ (11,116)
(65,883)
21,172
\ (55,827)
2018
\ (22,420)
(167,973)
52,377
\ (138,016)
(In millions of Korean won)
Remeasurements of the net defined benefit liabilities recognized as other comprehensive income for the years ended December 31, 2019 and 2018, are as follows:
Details of intangible assets as of December 31, 2019 and 2018, are as follows:
Cash and due from financial institutions
Investment fund
Cash and due from financial institutions
Investment fund
Assets not quoted in an active market
\ 2,087,861
849
\ 2,088,710
Assets not quoted in an active market
\ 1,908,028
2,019
\ 1,910,047
Assets quoted in an active market
\ -
-
\ -
Assets quoted in an active market
\ -
-
\ -
Total
\ 2,087,861
849
\ 2,088,710
Total
\ 1,908,028
2,019
\ 1,910,047
2019
2018
(In millions of Korean won)
(In millions of Korean won)
Discount rate (%)
Salary increase rate (%)
Turnover (%)
2019 1.60~2.00
0.00~7.50
0.00~50.00
2018 2.00~2.30
0.00~7.50
0.00~50.00
Key actuarial assumptions used as of December 31, 2019 and 2018, are as follows:
Mortality assumptions are based on the experience-based mortality table of Korea Insurance Development Institute of 2019.
The sensitivity of the defined benefit obligation to changes in the weighted principal assumptions as of December 31, 2019, are as follows:
The above sensitivity analyses are based on a change in an assumption while holding all other assumptions constant. In practice, this is unlikely to occur, and changes in some of the assumptions may be correlated. The sensitivity of the defined benefit obligation to changes in principal actuarial assumptions is calculated using the projected unit credit method, the same method applied when calculating the defined benefit obligations recognized on the statement of financial position.
Discount rate (%)
Salary increase rate (%)
Turnover (%)
Increase in principal assumption
4.22 decrease
1.86 increase
0.75 decrease
Changes in principal assumption
0.5 p.
0.5 p.
0.5 p.
Decrease in principal assumption
4.48 increase
6.18 decrease
0.67 increase
Effect on net defined benefit obligation
KB Financial Group Annual Report 2019192

(In millions of Korean won)
Expected maturity analysis of undiscounted pension benefits (including expected future benefit) as of December 31, 2019 are as follows:
Pension benefits1
Total ₩ 5,947,740
Over 10 years ₩ 3,707,746
5~10 years ₩ 1,365,073
1~2 years ₩ 153,129
2~5 years ₩ 647,074
Up to 1 year ₩ 74,718
The weighted average duration of the defined benefit obligation is 1.0 ~ 11.7 years.
Expected contribution to plan assets for periods after December 31, 2019 is estimated to be \ 215,290 million.
1 Excluded amount to be settled per promotion-incentivized defined contribution plan
25. Other LiabilitiesDetails of other liabilities as of December 31, 2018 and 2017, are as follows:
Other financial liabilitiesOther payablesPrepaid card and debit cardAccrued expensesFinancial guarantee liabilitiesDeposits for letter of guarantees and othersDomestic exchange settlement creditsForeign exchanges settlement creditsBorrowings from other business accountsOther payables from trust accountsLiability incurred from agency relationshipsAccount for agency businessesDividend payablesLease liabilitiesOthers
Other non-financial liabilitiesOther payablesUnearned revenueAccrued expensesDeferred revenue on credit card points Withholding taxesSeparate account liabilitiesOthers
2019
\ 9,485,59727,555
3,066,44546,428
862,9682,079,636
114,316256
5,216,460771,609407,475
473544,439
5,93022,629,587
283,771465,501716,180206,188158,992
5,047,080229,960
7,107,672\ 29,737,259
2018
\ 7,910,88725,831
2,986,21043,395
685,4511,689,908
102,18713,166
5,285,108605,076460,949
2,019-
18,12019,828,307
319,267378,792744,863187,459137,236
5,401,192203,880
7,372,689\ 27,200,996
(In millions of Korean won)
26. Equity26.1 Share Capital
Details of share capital and number of issued shares of the Parent Company as of December 31, 2019 and 2018, are as follows:
Type of share
Number of authorized shares
Par value per share (In millions of Korean won)
Number of issued shares
Share capital1
2019 Ordinary share
1,000,000,000
₩ 5,000
415,807,920
₩ 2,090,558
2018 Ordinary share
1,000,000,000
₩ 5,000
418,111,537
₩ 2,090,558
(In millions of Korean won)
1 Due to the retirement of shares deducted through profits, it is different from the total par value of the shares issued.
Financial Section 193

26.2 Hybrid Securities
Details of hybrid securities classified as equity as of December 31, 2019 and 2018 are as follows:
Changes in outstanding shares for the years ended December 31, 2019 and 2018, are as follows:
The above hybrid securities are early redeemable by the Group after 5 or 10 years from the issuance date. On the other hand, hybrid securities of ₩ 574,580 million issued by KB Kookmin Bank are recognized as non-controlling interests and are early redeemable every five years after the issuance date.
Beginning
Increase
Decrease
Ending
The 1-1st Hybrid securities
The 1-2nd Hybrid securities
2019 \ 395,551,297
-
(5,916,962)
\ 389,634,335
2019 \ 349,309
49,896
\ 399,205
Maturity Perpetual bond
Perpetual bond
Issuance date May 2, 2019
May 2, 2019
2018 \ 399,037,583
-
(3,486,286)
\ 395,551,297
2018 \ -
-
\ -
Interest rate (%) 3.23
3.44
(In number of shares)
(In millions of Korean won)
26.3 Capital Surplus
Details of capital surplus as of December 31, 2019 and 2018, are as follows:
26.4 Accumulated Other Comprehensive Income
Details of accumulated other comprehensive income as of December 31, 2019 and 2018, are as follows:
Share premiumLoss on sales of treasury sharesOther capital surplus
Remeasurements of net defined benefit liabilitiesExchange differences on translating foreign operationsNet gains on financial instruments at fair value through other comprehensive incomeShares of other comprehensive income of associates and joint venturesCash flow hedgesLosses on hedges of a net investment in a foreign operationOther comprehensive income arising from separate accountFair value changes on financial liabilities designated at fair value due to own credit riskNet overlay adjustments
2019 \ 13,190,274
(481,332)4,413,835
\ 17,122,777
2019 \ (290,228)
31,793
487,331
3,318(27,333)(41,992)
18,381
(20,326) 187,077
\ 348,021
2018 \ 13,190,274
(481,332)4,412,718
\ 17,121,660
2018 \ (234,401)
(5,784)
450,694
(4,377)5,849
(33,092)15,017
(8,954)(7,146)
\ 177,806
(In millions of Korean won)
(In millions of Korean won)
KB Financial Group Annual Report 2019194

Regulatory reserve for credit losses
Measurement and disclosure of regulatory reserve for credit losses are required in accordance with Articles 26 through 28 of Supervisory Regulations on Financial Holding Companies.
Details of the regulatory reserve for credit losses as of December 31, 2019 and 2018, are as follows:
26.5 Retained Earnings
Details of retained earnings as of December 31, 2019 and 2018, are as follows:
Legal reserves1
Voluntary reservesUnappropriated retained earnings
Regulatory reserve for credit losses attributable to:Shareholders of the Parent CompanyNon-controlling interests
2019 \ 482,807
982,00018,244,738
\ 19,709,545
2019
₩ 3,418,1361,478
₩ 3,419,614
2018 \ 390,216
982,00015,910,225
\ 17,282,441
2018
₩ 3,130,7651,354
₩ 3,132,119
(In millions of Korean won)
(In millions of Korean won)
1 With respect to the allocation of net profit earned in a fiscal term, the Parent Company must set aside in its legal reserve an amount equal to at least 10% of its net income after tax as reported in the separate statement of comprehensive income each time it pays dividends on its net profits earned until its legal reserve reaches at least the aggregate amount of its share capital in accordance with Article 53 of the Financial Holding Company Act. The reserve is not available for the payment of cash dividends, but may be transferred to share capital, or used to reduce accumulated deficit.
The adjustments to the regulatory reserve for credit losses for the year ended December 31, 2019 and 2018, are as follows:
Provision of regulatory reserve for credit losses1
Adjusted profit after provision of regulatory reserve for credit losses2,3
Adjusted basic earnings per share after provision of regulatory reserve for credit losses2
Adjusted diluted earnings per share after provision of regulatory reserve for credit losses2
2019 \ 287,371
3,017,944
7,716
7,659
2018 \ 355,363
2,705,828
6,824
6,785
(In millions of Korean won, except earnings per share)
1 The amount expected to be appropriated for the year ended December 31, 2018 is the amount required to reserve for credit losses, calculated based on the beginning balance of regulatory reserve for credit losses (including unearned reserves) that reflects the effect of adoption of Korean IFRS 1109 retrospectively.
2 Adjusted profit after provision of regulatory reserve for credit losses is not based on Korean IFRS; this is calculated reflecting provision (reversal) of the reserve before tax to the net profit to shareholders of the Parent Company.
3 After deducting dividends on hybrid securities.
1 For the year ended December 31, 2019, the treasury stock trust agreement of ₩ 300,000 million with Samsung Securities Co., Ltd., which had been signed in 2018, was terminated.
1 For the year ended December 31, 2018, the treasury stock trust agreement of ₩ 300,000 million with Samsung Securities Co., Ltd., which had been signed in 2017, was terminated. In order to increase shareholder value, the Group entered into another treasury stock trust agreement of ₩ 300,000 million with Samsung Securities Co., Ltd. for the year ended December 31, 2018.
26.6 Treasury Shares
Changes in treasury shares outstanding for the years ended December 31, 2019 and 2018, are as follows:
Number of treasury shares1
Carrying amount1
Number of treasury shares1
Carrying amount1
Ending26,173,585
₩ 1,136,188
Ending22,560,240
₩ 968,549
Disposal(2,303,617)
₩ (100,000)
Disposal-
₩ -
Acquisition5,916,962
₩ 267,639
Acquisition3,486,286
₩ 212,576
Beginning22,560,240
₩ 968,549
Beginning19,073,954
₩ 755,973
2019
2018
(In number of shares and millions of Korean won)
(In number of shares and millions of Korean won)
Financial Section 195

27. Net Interest IncomeDetails of interest income and interest expense for the years ended December 31, 2019 and 2018, are as follows:
28. Net Fee and Commission IncomeDetails of fee and commission income, and fee and commission expense for the years ended December 31, 2019 and 2018, are as follows:
Interest income recognized on impaired loans is ₩ 54,033 million and ₩ 48,974 million for the years ended December 31, 2019 and 2018, respectively.
Interest incomeDeposits at fair value through profit or loss
Securities measured at fair value through profit or loss
Loans measured at fair value through profit or loss
Securities measured at fair value through other comprehensive income
Loans measured at fair value through other comprehensive income
Deposits at amortized cost
Equity instruments at amortized cost
Loans at amortized cost
Other
Interest expensesDeposits
Debts
Debentures
Other
Net interest income
Fee and commission incomeBanking activity fees
Lending activity fees
Credit & Debit card related fees and commissions
Agent activity fees
Trust and other fiduciary fees
Fund management related fees
Guarantee fees
Foreign currency related fees
Commissions from transfer agent services
Other business account commission on consignment
Commissions received on securities business
Lease fees
Others
Fee and commission expenseTrading activity related fees1
Lending activity fees
Credit & Debit card related fees and commissions
Outsourcing related fees
Foreign currency related fees
Others
Net fee and commission income
2019
₩ 2,685
668,377
33,001
774,864
14,708
150,635
599,519
12,247,493
147,905
14,639,187
3,481,121
596,425
1,240,566
124,288
5,442,400
₩ 9,196,787
2019
\ 214,512
83,916
1,316,636
172,211
388,352
153,798
48,122
134,145
145,846
36,813
445,987
428,195
310,714
3,879,247
28,869
26,040
892,391
190,312
42,902
343,729
1,524,243
\ 2,355,004
2018
₩ 9,236
713,058
26,066
718,327
2,373
109,155
604,709
11,431,359
120,286
13,734,569
3,041,739
544,562
1,148,729
94,611
4,829,641
₩ 8,904,928
2018
\ 208,443
74,340
1,360,515
149,585
363,767
132,657
44,104
124,201
167,071
36,947
518,309
246,537
291,244
3,717,720
31,889
25,734
907,831
164,594
43,053
301,243
1,474,344
\ 2,243,376
(In millions of Korean won)
(In millions of Korean won)
1 The fees from financial assets/liabilities at fair value through profit or loss.
KB Financial Group Annual Report 2019196

29. Net Gains or Losses on Financial Assets/Liabilities at Fair Value through Profit or Loss29.1 Net Gains or Losses on Financial Instruments Held for Trading
Net gain or loss from financial instruments at fair value through profit or loss includes dividend income, gains or losses arising from changes in the fair values, sales and redemptions. Details of net gain or loss from financial instruments held for trading for the years ended December 31, 2019 and 2018, are as follows:
29.2 Net Gains or Losses on Financial Instruments Designated at Fair Value through Profit or Loss
Net gain or loss from financial instruments designated at fair value through profit or loss includes dividend income and gains or losses arising from changes in the fair values, sales and redemptions. Details of net gain or loss from financial instruments designated at fair value through profit or loss for the years ended December 31, 2019 and 2018, are as follows:
Gains related to financial instruments held for tradingFinancial assets held for trading
Debt securitiesEquity securities
Derivatives held for tradingInterest rateCurrencyStock or stock indexCreditCommodityOther
Financial liabilities held for tradingOther financial instruments
Losses related to financial instruments held for tradingFinancial assets held for trading
Debt securitiesEquity securities
Derivatives held for tradingInterest rateCurrencyStock or stock indexCreditCommodityOther
Financial liabilities held for tradingOther financial instruments
Net gains or losses on financial instruments held for trading
Revenue from financial instruments designated at fair value through profit or loss
Financial liabilities designated at fair value through profit or loss
Expense from financial instruments designated at fair value through profit or loss
Financial liabilities designated at fair value through profit or loss
Net gains or losses on financial instruments designated at fair value through profit or loss
2019
₩ 1,613,946428,646
2,042,592
2,685,9985,251,5972,612,422
41,54815,240
212,73110,819,536
46,7505,811
₩ 12,914,689
₩ 752,999315,743
1,068,742
2,758,2055,118,0951,585,086
42,1729,437
190,9799,703,974
94,4265,704
10,872,846₩ 2,041,843
2019
₩ 555,749555,749
1,953,7201,953,720
₩ (1,397,971)
2018
₩ 1,544,892571,404
2,116,296
2,328,5763,764,9851,383,446
38,4618,285
92,9477,616,700
72,41022
₩ 9,805,428
₩ 850,129475,968
1,326,097
2,610,3053,499,3561,626,007
36,74710,456
117,7417,900,612
134,28760
9,361,056₩ 444,372
2018
₩ 667,508667,508
760,577760,577
₩ (93,069)
(In millions of Korean won)
(In millions of Korean won)
Financial Section 197

30. Other Operating Income and ExpensesDetails of other operating income and expenses for the years ended December 31, 2019 and 2018, are as follows:
31. General and Administrative Expenses31.1 General and Administrative Expenses
Details of general and administrative expenses for the years ended December 31, 2019 and 2018, are as follows:
Other operating incomeRevenue related to financial instruments at fair value
through other comprehensive income
Gain on redemption of financial instruments at fair value
through other comprehensive income
Gain on sale of financial instruments at fair value
through other comprehensive income
Revenue related to financial assets at amortized cost
Gain on sale of loans at amortized cost
Gain on foreign exchange transactions
Dividend income
Others
Other operating expensesExpenses related to financial instruments measured at fair value
through other comprehensive income
Losses on redemption of financial instruments measured at fair value
through other comprehensive income
Losses on sale of financial instruments measured at fair value
through other comprehensive income
Expenses related to financial assets at amortized cost
Loss on sale of loans at amortized cost
Loss on foreign exchanges transactions
Others
Net other operating expenses
2019
₩ 796
222,371
223,167
80,746
80,746
2,183,703
54,768
321,244
₩ 2,863,628
₩ -
16,975
16,975
19,439
19,439
1,970,294
1,920,244
3,926,952
₩ (1,063,324)
2018
₩ 259
134,875
135,134
46,877
46,877
1,600,161
83,930
260,709
₩ 2,126,811
₩ 17
35,864
35,881
9,006
9,006
1,539,837
1,672,123
3,256,847
₩ (1,130,036)
(In millions of Korean won)
Employee BenefitsSalaries and short-term employee benefits - salaries
Salaries and short-term employee benefits - others
Post-employment benefits - defined benefit plans
Post-employment benefits - defined contribution plans
Termination benefits
Share-based payments
Depreciation and amortization
2019
\ 2,557,821
848,421
231,913
27,924
239,790
49,418
3,955,287
784,431
2018
\ 2,512,945
870,356
217,085
21,056
242,010
10,930
3,874,382
408,771
(In millions of Korean won)
KB Financial Group Annual Report 2019198

Other general and administrative expensesRental expense
Tax and dues
Communication
Electricity and utilities
Publication
Repairs and maintenance
Vehicle
Travel
Training
Service fees
Electronic data processing expenses
Advertising
Others
2019
109,745
238,670
48,749
29,161
15,136
23,947
11,537
21,452
31,451
227,631
258,456
228,826
286,538
1,531,299
\ 6,271,017
2018
361,344
214,683
46,661
28,823
16,018
22,432
12,495
19,393
30,310
210,081
189,007
217,244
266,868
1,635,359
\ 5,918,512
(In millions of Korean won)
31.2 Share-based Payments
31.2.1 Stock grants
The Group changed the scheme of share-based payment from stock options to stock grants in November 2007. The stock grant award program is an
incentive plan that sets, on grant date, the maximum amount of shares that can be awarded. Actual stock granted at the end of the vesting period is
determined in accordance with achievement of pre-specified targets over the vesting period.
Details of stock grants linked to long-term performance as of December 31, 2019, are as follows:
KB Financial Group Inc.Series 18
Series 19
Series 20
Series 21
Series 22
Series 23
Series 24
Deferred grant
Kookmin BankSeries 72
Series 73
Series 74
Series 75
Grant date
Jul. 17, 2017
Nov. 21, 2017
Jan. 01, 2018
Jan. 01, 2019
Apr. 01, 2019
May 27, 2019
Jul. 17, 2019
2015
2016
2017
2018
Aug. 28, 2017
Nov. 21, 2017
Jan. 01, 2018
Jan. 01, 2019
Vesting conditions2
Services fulfillment, market performance3 30~50% and non-market performance4 50~70%
Services fulfillment, market performance3 35% and non-market performance5 65%
Services fulfillment, market performance3 30~50% and non-market performance4 50~70%
Services fulfillment, market performance3 30% and non-market performance4 70%
Services fulfillment, market performance3 30% and non-market performance4 70%
Services fulfillment, market performance3 30% and non-market performance4 70%
Services fulfillment, market performance3 30% and non-market performance4 70%
Satisfied
Satisfied
Satisfied
Satisfied
Services fulfillment, market performance3 30~50% and non-market performance4 50~70%
Services fulfillment, market performance3 30% and non-market performance6 70%
Services fulfillment, market performance3 30~50% and non-market performance4
50~70%
Services fulfillment, market performance3 30~50% and non-market performance4
50~70%
Number of granted shares1
7,826
46,890
38,826
28,926
3,227
1,392
11,224
10,043
12,093
45,728
8,057
214,232
6,742
27,786
134,465
192,170
(In number of shares)
Financial Section 199

Series 76
Series 77 Series 78 Deferred grantDeferred grantDeferred grantDeferred grant
Other subsidiariesStock granted in 2010Stock granted in 2011Stock granted in 2012Stock granted in 2013Stock granted in 2014Stock granted in 2015Stock granted in 2016Stock granted in 2017Stock granted in 2018Stock granted in 2019
Grant date
Apr. 01, 2019
May 27, 2019
Nov. 21, 2019
2015201620172018
----------
Vesting conditions2
Services fulfillment, market performance3 30~50% and
non-market performance4 50~70%
Services fulfillment, market performance3 30~50% and non-market performance4 50~70%
Services fulfillment, market performance3 30% and non-market performance6 70%
SatisfiedSatisfiedSatisfiedSatisfied
Services fulfillment, market performance3 10~50% and non-market performance4, 50~90%
Number of granted shares1
5,380
5,569
36,443
4,75665,41995,69797,244
671,671
106146420
1,0071,2234,456
23,47483,459
257,064241,226612,581
1,498,484
(In number of shares)
1 Granted shares represent the total number of shares initially granted to executives and employees that have residual shares at the end of reporting period (Deferred grants are residual shares as of December 31, 2019).
2 Executives and employees were given the option of deferred payment of the granted shares (after the date of retirement), payment ratio, and payment period. Accordingly, a certain percentage of the granted amount is deferred for up to five years after the date of retirement after the deferred grant has been confirmed.
3 Relative TSR (Total Shareholders Return): [(Fair value at the end of the contract - Fair value at the beginning of the contract) + (Total amount of dividend per share paid during the contract period)] / Fair value at the beginning of the contract
4 Accomplishment of subsidiaries’ performance and accomplishment of performance results.5 EPS, Asset Quality, HCROI, Profit from non-banking segment6 EPS, Asset Quality
Details of stock grants linked to short-term performance as of December 31, 2019, are as follows:
KB Financial Group Inc.Stock granted in 2015Stock granted in 2016Stock granted in 2017Stock granted in 2018Stock granted in 2019
Kookmin BankStock granted in 2015Stock granted in 2016Stock granted in 2017Stock granted in 2018Stock granted in 2019
Other subsidiariesStock granted in 2015Stock granted in 2016Stock granted in 2017Stock granted in 2018Stock granted in 2019
Estimated number of vested shares1
9,69011,78312,27320,66430,504
15,83152,85555,490
109,296112,445
16,922 94,201
238,115457,006284,888
1,521,963
Vesting conditions
SatisfiedSatisfiedSatisfiedSatisfiedProportional to service period SatisfiedSatisfiedSatisfiedSatisfiedProportional to service period Satisfied SatisfiedSatisfiedSatisfiedProportional to service period
1 Executives and employees were given the option of deferred payment of the granted shares (after the date of retirement), payment ratio, and payment period. Accordingly, a certain percentage of the granted amount is deferred for up to five years after the date of retirement after the deferred grant has been confirmed.
KB Financial Group Annual Report 2019200

Share grants are measured at fair value using the Monte Carlo Simulation Model and assumptions used in determining the fair value as of December 31,
2019, are as follows:
Linked to long term performance(KB Financial Group Inc.)
Series 18Series 19Series 20Series 21Series 22Series 23Series 24Deferred grant in 2015Deferred grant in 2016Deferred grant in 2017Deferred grant in 2018
(Kookmin Bank)Series 72Series 73Series 74Series 75Series 76Series 77Series 78Grant deferred in 2015Grant deferred in 2016Grant deferred in 2017Grant deferred in 2018
(Other subsidiaries)Share granted in 2010Share granted in 2011Share granted in 2012Share granted in 2013Share granted in 2014Share granted in 2015Share granted in 2016Share granted in 2017Share granted in 2018Share granted in 2019
Linked to short-term performance(KB Financial Group Inc.)
Share granted in 2015Share granted in 2016Share granted in 2017Share granted in 2018Share granted in 2019
(Kookmin Bank)Share granted in 2015Share granted in 2016Share granted in 2017Share granted in 2018Share granted in 2019
(Other subsidiaries)Share granted in 2015Share granted in 2016Share granted in 2017Share granted in 2018Share granted in 2019
Risk free rate (%)
1.341.341.341.341.341.341.341.341.341.341.34
1.341.341.341.341.341.341.341.341.341.341.34
1.341.341.341.341.341.341.341.341.341.34
1.341.341.341.341.34
1.341.341.341.341.34
1.341.341.341.341.34
Fair value (Market performance condition)
40,362~44,03438,220~41,77541,135~45,03541,489~46,02141,070~44,92641,070~44,92641,070~44,926
----
43,659~47,63141,253~43,74141,279~45,03541,506~46,02141,070~44,92641,070~44,92638,303~41,900
----
-------
35,863~46,81737,446~45,24039,878~47,631
-----
-----
-----
Fair value (Non-market performance condition)
43,659~47,63142,493~46,44543,659~47,63142,336~47,63141,070~44,92641,070~44,92641,070~44,92638,616~47,63142,336~47,63143,659~47,63142,336~47,631
43,659~47,63143,803~46,44543,659~47,63142,336~47,63141,070~44,92641,070~44,92641,070~44,92644,926~47,63142,336~47,63142,336~47,63142,336~47,631
46,28146,281
44,926~46,28144,926~47,63140,065~46,76641,070~47,67639,801~47,63138,616~47,63139,801~47,63141,070~47,631
38,616~47,63139,801~47,63142,336~47,63142,336~47,63143,659~46,281
42,336~47,63141,070~47,63142,336~47,63142,336~47,63143,659~46,281
38,616~47,63138,616~47,63138,616~47,63138,616~47,63139,801~46,281
Financial Section 201

The Group used the volatility of the stock price over the previous year as the expected volatility, used the dividend yield as the arithmetic mean of the dividend
rate of one year before, two years before, and three years before the base year, and used one-year risk-free interest rate in order to calculate fair value.
As of December 31, 2019 and 2018, the accrued expenses related to share-based payments including share grants amounted to ₩ 124,853 million and ₩
111,058 million, respectively, and the compensation costs from share grants amounting to ₩ 49,418 million and ₩ 10,930 million were incurred during the
years ended 2019 and 2018, respectively.
31.2.2 Mileage Stocks
Details of Mileage stock as of December 31, 2019, are as follows:
Stock granted in 2017
Stock granted in 2018
Grant date
Jan. 09, 2017
Feb. 03, 2017
Apr. 03, 2017
May 22, 2017
Jul. 03, 2017
Aug. 07, 2017
Aug. 08, 2017
Aug. 16, 2017
Aug. 17, 2017
Aug. 24, 2017
Sept. 08, 2017
Nov. 01, 2017
Nov. 06, 2017
Dec. 06, 2017
Dec. 26, 2017
Dec. 29, 2017
Jan. 10, 2018
Feb. 12, 2018
Apr. 02, 2018
Apr. 30, 2018
May 08, 2018
Jun. 01, 2018
Jul. 02, 2018
Aug. 07, 2018
Aug. 09, 2018
Aug. 14, 2018
Aug. 16, 2018
Sept. 07, 2018
Oct. 04, 2018
Nov. 01, 2018
Nov. 06, 2018
Dec. 03, 2018
Dec 04, 2018
Dec. 07, 2018
Dec. 12, 2018
Dec. 18, 2018
Dec. 19, 2018
Dec. 31, 2018
Number of granted shares1
28,925
43
82
20
52
29
5
204
40
387
83
120
106
105
255
114
19,197
9
115
86
170
140
180
194
47
30
130
106
129
258
236
132
21
91
64
271
42
127
Expected exercise period (years)2
0.00~0.02
0.00~0.09
0.00~0.25
0.00~0.39
0.00~0.50
0.00~0.60
0.00~0.60
0.00~0.62
0.00~0.63
0.00~0.65
0.00~0.69
0.00~0.84
0.00~0.85
0.00~0.93
0.00~0.99
0.00~0.99
0.00~1.03
0.00~1.12
0.00~1.25
0.00~1.33
0.00~1.35
0.00~1.42
0.00~1.50
0.00~1.60
0.00~1.61
0.00~1.62
0.00~1.62
0.00~1.68
0.00~1.76
0.00~1.84
0.00~1.85
0.00~1.92
0.00~1.93
0.00~1.93
0.00~1.95
0.00~1.96
0.00~1.97
0.00~2.00
Remaining shares
11,365
28
61
20
52
19
2
151
24
288
73
103
101
83
175
58
15,430
7
99
62
150
121
123
175
38
30
112
82
106
248
206
132
21
91
57
271
42
127
(in number of shares)
KB Financial Group Annual Report 2019202

Stock granted in 2019
Grant date
Jan. 11, 2019
Feb. 01, 2019
Apr. 01, 2019
Apr. 18, 2019
Apr. 22, 2019
Jul. 01, 2019
Aug. 29, 2019
Sept. 02, 2019
Nov. 01, 2019
Nov. 08, 2019
Dec. 05, 2019
Dec. 06, 2019
Dec. 31, 2019
Number of granted shares1
26,580
12
167
105
33
109
39
50
119
14
56
84
87
79,800
Expected exercise period (years)2
0.00~2.03
0.00~2.09
0.00~2.25
0.00~2.30
0.00~2.31
0.00~2.50
0.00~2.66
0.00~2.67
0.00~2.84
0.00~2.85
0.00~2.93
0.00~2.93
0.00~3.00
Remaining shares
25,563
12
167
105
33
109
39
50
119
14
56
84
87
56,771
(in number of shares)
1 Mileage stock may be exercised after one year from the grant date for two years. When the mileage stock is exercised, the closing price of prior month is applied. However, in case of transfer or retirement during the vesting period, mileage stock may still be exercised at the closing price of prior month.
2 The remaining shares are assessed based on the stock price as of December 31, 2019. These shares are vested immediately at grant date.
As of December 31, 2019 and 2018, the accrued expenses for share-based payments in regards to mileage stock amounted to ₩ 2,705 million and ₩ 2,283
million, respectively, and the compensation costs amounting to ₩ 1,334 million and ₩ 1,350 million were recognized for the year ended December 31, 2019
and 2018, respectively.
32. Net Other Non-operating Income and ExpensesDetails of other non-operating income and expenses for the years ended December 31, 2019 and 2018, are as follows:
Other non-operating incomeGain on disposal of property and equipment
Rent received
Profit on disposal of non-current assets held for sale
Others
Other non-operating expensesLoss on disposal in property and equipment
Donation
Restoration cost
Management cost for special bonds
Others
Net other non-operating income
2019
\ 35,747
85,720
2,731
84,793
208,991
8,587
102,711
2,902
3,382
64,523
182,105
\ 26,886
2018
\ 34,238
55,321
118,716
37,122
245,397
6,131
130,249
4,386
3,338
91,502
235,606
\ 9,791
(In millions of Korean won)
Financial Section 203

33. Income Tax ExpenseIncome tax expense for the years ended December 31, 2019 and 2018, are as follows:
An analysis of the net profit before income tax and income tax expense for the years ended December 31, 2019 and 2018, follows:
Tax payableCurrent tax expense
Adjustments recognized in the period for current tax of prior years
Changes in deferred income tax assets (liabilities)Income tax recognized directly in equity
Remeasurements of net defined benefit liabilities
Exchange difference in foreign operation
Financial assets measured at fair value through other comprehensive income
Shares of other comprehensive income of associates and joint ventures
Cash flow hedges
Hedges of a net investment in a foreign operation
Other comprehensive income of separate account
Profit or loss related with credit risk change of
financial liabilities designated at fair value through profit or loss
Net overlay adjustments
Tax expense
Net profit before income tax Tax at the applicable tax rate1
Non-taxable income
Non-deductible expense
Tax credit and tax exemption
Temporary difference for which no deferred tax is recognized
Deferred tax relating to changes in recognition and measurement
Income tax refund for tax of prior years
Income tax expense of overseas branch
Effects from change in tax rate
Others
Average effective tax rate and tax expense
2019
₩ 1,043,047
(51,130)
991,917
285,820
21,172
(5,714)
(13,168)
(3,147)
10,537
3,194
(1,301)
4,294
(72,817)
(56,950)
₩ 1,220,787
Tax rate (%)
27.27
(0.52)
0.42
(0.01)
(0.11)
-
(0.2)
0.11
-
(0.03)
26.93
Tax rate (%)
27.26
(0.28)
0.64
(0.01)
0.29
(0.06)
(0.19)
0.09
(0.03)
1.12
28.82
Amount
₩ 4,533,986
1,236,484
(23,601)
19,086
(627)
(4,860)
(100)
(9,105)
5,004
-
(1,494)
₩ 1,220,787
Amount
₩ 4,301,532
1,172,559
(11,888)
27,551
(637)
12,260
(2,692)
(8,135)
3,882
(1,470)
48,156
₩ 1,239,586
2018
₩ 1,096,600
22,925
1,119,525
114,345
52,377
(13,087)
(33,329)
1,374
400
10,292
(10,864)
(563)
(884)
5,716
₩ 1,239,586
(In millions of Korean won)
(In millions of Korean won)
34. DividendsThe dividends paid to the shareholders of the Parent Company in 2019 and 2018 were \ 759,736 million (\ 1,920 per share) and \ 766,728 million (\ 1,920
per share) , respectively. The dividend to the shareholders in respect of the year ended December 31, 2019 of 2,210 per share, amounting to total dividends
of \ 861,092 is to be proposed at the annual general meeting on March 20, 2020. The Group’s financial statements as of December 31, 2019, do not reflect
this dividend payable.
2019 2018
1 Applicable income tax rate for \200 million and below is 11%, for over \200 million to \20 billion is 22%, and for over \20 billion to \300 billion is 24.2%, for over \300
billion is 27.5% as at December 31, 2019 and 2018.
KB Financial Group Annual Report 2019204

35. Accumulated Other Comprehensive IncomeDetails of changes in accumulated other comprehensive income for the years ended December 31, 2019 and 2018, are as follows:
Remeasurements of
net defined benefit liabilities
Exchange differences on translating
foreign operations
Other comprehensive income related
with financial assets at fair value
through profit or loss
Other comprehensive income related
with investments in associates and
joint ventures
Cash flow hedges
Hedges of a net investment
in a foreign operation
Other comprehensive income related
with separate account assets
Profit or loss related with credit risk
change of Financial liabilities
designated at fair value
through profit or loss
Net overlay adjustment
Ending
₩ (290,228)
31,793
487,331
3,318
(27,333)
(41,992)
18,381
(20,326)
187,077
₩ 348,021
Ending
₩ (234,401)
(5,784)
450,694
(4,377)
5,849
(33,092)
15,017
(8,954)
(7,146)
₩ 177,806
Reclassification to profit or loss
₩ -
5,353
(82,662)
-
21,604
1,316
(16,364)
-
(2,603)
₩ (73,356)
Reclassification to profit or loss
₩ -
15,057
8,521
-
15,234
(12,330)
3,747
-
(23,161)
₩ 7,068
Tax effect
₩ 21,172
(5,714)
(13,168)
(3,147)
10,537
3,194
(1,301)
4,294
(72,817)
₩ (56,950)
Tax effect
₩ 52,377
(13,087)
(33,329)
1,374
400
10,292
(10,864)
(563)
(884)
₩ 5,716
Changes except for reclassification
₩ (76,999)
37,938
106,984
10,842
(65,323)
(13,410)
21,029
(15,666)
269,643
₩ 275,038
Changes except for reclassification
₩ (190,393)
46,946
134,198
(5,107)
(24,672)
(25,096)
35,826
2,047
24,458
₩ (1,793)
Replaced byretained earnings
₩ -
-
25,483
-
-
-
-
-
-
₩ 25,483
Replaced byretained earnings
₩ -
-
(21,377)
-
-
-
-
-
-
₩ (21,377)
Beginning
₩ (234,401)
(5,784)
450,694
(4,377)
5,849
(33,092)
15,017
(8,954)
(7,146)
₩ 177,806
Beginning1
₩ (96,385)
(54,700)
362,681
(644)
14,887
(5,958)
(13,692)
(10,438)
(7,559)
₩ 188,192
2019
2018
(In millions of Korean won)
(In millions of Korean won)
1 Restated in accordance with Korean IFRS 1109.
Financial Section 205

36. Earnings per Share36.1 Basic Earnings per Share
Basic earnings per share is calculated by dividing profit and loss attributable to ordinary equity holders of the Parent Company by the weighted average
number of ordinary shares outstanding, excluding the treasury shares, during the years ended December 31, 2019 and 2018.
Weighted average number of ordinary shares outstanding:
36.2 Diluted Earnings per Share
Diluted earnings per share is calculated by adjusting the weighted average number of ordinary shares outstanding to assume conversion of all dilutive
potential ordinary shares. The Group’s dilutive potential ordinary shares include Stock Grants.
A calculation is done to determine the number of shares that could have been acquired at fair value (determined as the average market share price of
the Group’s outstanding shares for the year) based on the monetary value of Stock Grants. The number of shares calculated above is compared with the
number of shares that would have been issued assuming the settlement of Stock Grants.
Adjusted profit for diluted earnings per share for the years ended December 31, 2019 and 2018, are as follows:
Basic earnings per share:
Adjusted weighted average number of ordinary shares outstanding to calculate diluted earnings per share for the years ended December 31, 2019 and
2018, are as follows:
Number of issued ordinary shares
Number of treasury shares
Average number of ordinary shares outstanding
Number of days
Weighted average number of ordinary shares outstanding
Profit attributable to shareholders of the Parent Company
Deduction: Dividends on hybrid securities
Profit attributable to the ordinary equity holders of the Parent
Company (A)
Weighted average number of ordinary shares outstanding (B)
Basic earnings per share (A / B)
Weighted average number of ordinary shares outstanding
Adjustment Stock Grants
Adjusted weighted average number of ordinary shares outstanding for
diluted earnings per share
Profit attributable to ordinary equity holders of the Parent Company
Adjustment
Adjusted profit for diluted earnings
Number of shares
415,807,920
(26,173,585)
389,634,335
Number of shares
418,111,537
(22,560,240)
395,551,297
Accumulated amount
152,564,638,665
(9,801,574,522)
142,763,064,143
365
391,131,683
₩ 3,311,827,412,557
6,512,500,000
₩ 3,305,314,912,557
391,131,683
₩ 8,451
391,131,683
2,890,513
394,022,196
₩ 3,305,314,912,557
-
₩ 3,305,314,912,557
Accumulated amount
152,610,711,005
(7,888,226,378)
144,722,484,627
365
396,499,958
₩ 3,061,191,387,929
-
₩ 3,061,191,387,929
396,499,958
₩ 7,721
396,499,958
2,307,630
398,807,588
₩ 3,061,191,387,929
-
₩ 3,061,191,387,929
(In number of shares)
(In Korean won and in number of shares)
(In number of shares)
(In Korean won)
20191
2019
2019
2019
2018
2018
2018
2018
1 Initial date of treasury stock that was deducted by the retirement is December 12, 2019.
KB Financial Group Annual Report 2019206

Diluted earnings per share for the years ended December 31, 2019 and 2018, are as follows:
Details of reinsurance assets included in other assets as of December 31, 2019 and 2018, are as follows:
Adjusted profit for diluted earnings per share
Adjusted weighted average number of ordinary shares outstanding for
diluted earnings per share
Diluted earnings per share
Non-life insurance Life insurance
Others
Total reinsurance assetsAllowance for impairmentTotal reinsurance assets, net
Reserve for outstanding claimsGeneral insuranceAutomobile insuranceLong-term insurance
Unearned premium reserveGeneral insuranceAutomobile insurance
Reserve for outstanding claimsUnearned premium reserve
Reserve for outstanding claimsUnearned premium reserve
Non-life insuranceLife insurance
₩ 3,305,314,912,557
394,022,196
₩ 8,389
\ 361,06516,555
130,758
208,82019,952
737,1501,639
4082,0472,563
8443,407
742,6041,953
\ 740,651
\ 786,626
134,739\ 921,365
₩ 3,061,191,387,929
398,807,588
₩ 7,676
\ 360,99718,057
109,751
171,24030,864
690,9091,912
4482,3603,417
9834,400
697,6691,916
\ 695,753
\ 547,831
119,293\ 667,124
(In Korean won and in number of shares)
(In millions of Korean won)
(In millions of Korean won)
2019
2019
2019
2018
2018
2018
37. Insurance Contracts37.1 Insurance Assets
Details of deferred acquisition costs included in other assets as of December 31, 2019 and 2018, are as follows:
Changes in the deferred acquisition costs for the years ended December 31, 2019 and 2018, are as follows
Non-life insuranceLife insurance
Non-life insuranceLife insurance
Beginning \ 547,831
119,293\ 667,124
Beginning \ 267,602
130,393\ 397,995
Depreciate \ (576,917)
(102,362)\ (679,279)
Depreciate \ (492,421)
(113,652)\ (606,073)
Increase \ 815,712
117,808\ 933,520
Increase \ 772,650
102,552\ 875,202
Ending \ 786,626
134,739\ 921,365
Ending \ 547,831
119,293\ 667,124
2019
2018
(In millions of Korean won)
(In millions of Korean won)
Financial Section 207

The changes in reinsurance assets included in other assets for the years ended December 31, 2019 and 2018, are as follows:
Non-life insurance Life insurance
Others
Total reinsurance assetsAllowance for impairmentTotal reinsurance assets, net
Non-life insurance Life insurance
Others
Total reinsurance assetsAllowance for impairmentTotal reinsurance assets, net
Reserve for outstanding claimsGeneral insuranceAutomobile insuranceLong-term insurance
Unearned premium reserveGeneral insuranceAutomobile insurance
Reserve for outstanding claimsUnearned premium reserve
Reserve for outstanding claimsUnearned premium reserve
Reserve for outstanding claimsGeneral insuranceAutomobile insuranceLong-term insurance
Unearned premium reserveGeneral insuranceAutomobile insurance
Reserve for outstanding claimsUnearned premium reserve
Reserve for outstanding claimsUnearned premium reserve
(In millions of Korean won)
(In millions of Korean won)
2019
2018
Beginning
\ 360,99718,057
109,751
171,24030,864
690,9091,912
4482,3603,417
9834,400
697,6691,916
\ 695,753
Beginning
\ 480,76013,32089,317
178,58614,986
776,9691,410
4901,9003,6701,0754,745
783,614629
\ 782,985
Ending
\ 361,06516,555
130,758
208,82019,952
737,1501,639
4082,0472,563
8443,407
742,6041,953
\ 740,651
Ending
\ 360,99718,057
109,751
171,24030,864
690,9091,912
4482,3603,417
9834,400
697,6691,916
\ 695,753
Net increase (decrease)
\ 68(1,502)21,007
37,580(10,912)
46,241(273)
(40)(313)(854)(139)(993)
44,93537
\ 44,898
Net increase (decrease)
\ (119,763)4,737
20,434
(7,346)15,878
(86,060)502(42)460
(253)(92)
(345)(85,945)
1,287\ (87,232)
KB Financial Group Annual Report 2019208

Long-term Insurance premium reserve
Reserve for outstanding claims
Unearned premium reserve
Reserve for participating policyholders’ dividends
Unallocated Divisible Surplus to Future Policyholders
Reserve for compensation for losses on
dividend-paying insurance contracts
Guarantee reserve
Long-term Insurance premium reserve
Reserve for outstanding claims
Unearned premium reserve
Reserve for participating policyholders’ dividends
Unallocated Divisible Surplus to Future Policyholders
Reserve for compensation for losses on
dividend-paying insurance contracts
Guarantee reserve
(In millions of Korean won)
(In millions of Korean won)
2019
2018
Life insurance
₩ 6,991,247
101,690
4,603
29,745
4,202
5,784
22,229
₩ 7,159,500
Life insurance
₩ 7,214,765
89,400
2,199
30,187
4,290
5,644
18,412
₩ 7,364,897
Non-life insurance
₩ 23,799,607
2,297,256
1,522,827
117,094
46,901
20,090
-
₩ 27,803,775
Non-life insurance
₩ 22,333,503
2,152,018
1,393,570
104,461
40,690
19,410
-
₩ 26,043,652
Total
₩ 30,790,854
2,401,509
1,528,275
146,839
51,103
25,874
22,229
₩ 34,966,683
Total
₩ 29,548,268
2,244,835
1,396,752
134,648
44,980
25,054
18,412
₩ 33,412,949
Others
₩ -
2,563
845
-
-
-
-
₩ 3,408
Others
₩ -
3,417
983
-
-
-
-
₩ 4,400
37.2 Insurance Liabilities
Details of insurance liabilities presented within other liabilities as of December 31, 2019 and 2018, are as follows:
The changes in insurance liability for the years ended December 31, 2019 and 2018, are as follows:
Non-life insurance Life insurance
Others Total
General insuranceAutomobile insuranceLong-term insuranceLong-term investment contractPure endowment insuranceDeath insuranceJoint insuranceGroup insuranceOther1
(In millions of Korean won)
2019
Beginning
\ 1,054,8231,492,294
23,386,279110,256
5,233,491500,571
1,621,460735
8,6404,400
\ 33,412,949
Ending
\ 1,064,9131,623,846
25,006,078108,938
5,236,128642,963
1,270,855524
9,0313,407
\ 34,966,683
Net increase (decrease)2
\ 10,090131,552
1,619,799(1,318)
2,637142,392
(350,605)(211)
391(993)
\ 1,553,734
Financial Section 209

Non-life insurance Life insurance
Others Total
Long-term insurance
Discount rate
Expense ratio
Lapse ratio
Risk rate
General insurance
Expense ratio
Loss adjustment expense ratio
Claim settlement ratio
Automobile insurance
Expense ratio
Loss adjustment expense ratio
Claim settlement ratio
General insuranceAutomobile insuranceLong-term insuranceLong-term investment contractPure endowment insuranceDeath insuranceJoint insuranceGroup insuranceOther1
(In millions of Korean won)
2018
Assumptions(%)
Beginning
\ 1,194,2601,477,569
21,598,125112,509
5,249,627366,303
1,782,8851,069
14,1834,745
\ 31,801,275
2019
2.47~10.55
6.60
1.51~34.13
13.10~1037.3
11.38
4.54
64.95
9.94
8.84
78.44
2018
0.55~7.32
6.43
1.50~31.40
9.00~724.00
10.42
4.63
63.77
10.11
9.09
77.51
Ending
\ 1,054,823 1,492,294
23,386,279110,256
5,233,491500,571
1,621,460735
8,6404,400
\ 33,412,949
Basis
Applied risk-free rate curve plus liquidity premium presented by Financial Supervisory Service
Reflected future expense plan based on the most recent one-year data
Based on the most recent five years data
The rate of insurance claim payments to risk premiums based on historical data for the latest seven years
Ratio of maintenance costs incurred to earned premiums by the types of contracts for the most recent year
Ratio of loss adjustment expenses incurred to insurance claim payments by the type of contracts within for the most recent three years
Ratio of insurance claims incurred to earned premiums by the type of contracts for the most recent five years
Ratio of maintenance costs incurred to earned premiums by the type of collaterals for the most recent year
Ratio of loss adjustment expenses incurred to insurance claims paid by the type of collaterals for the most recent three years
Ratio of insurance claims incurred to earned premiums by the type of collaterals for the most recent five years
Net increase (decrease)2
\ (139,437)14,725
1,788,154(2,253)
(16,136)134,268
(161,425)(334)
(5,543)(345)
\ 1,611,674
1 Including policyholder’s profit dividend reserve and Reserve for compensation for losses on dividend-paying insurance contracts 2 Including currency translation effect and decrease in liability related to investment contract
37.3 Liability adequacy test
37.3.1 Non-life insurance
Assumptions and basis for the insurance liability adequacy test as of December 31, 2019 and 2018, are as follows:
KB Financial Group Annual Report 2019210

The results of liability adequacy test as of December 31, 2019 and 2018, are as follows:
As a result of adequacy test, the Group did not set additional reserve as it shows net surplus. As such, there was no amount recorded as a result of liability
adequacy test.
37.3.2 Life insurance
Assumptions and basis for the insurance liability adequacy test as of December 31, 2019 and 2018, are as follows:
Indirect costs included in commission and operating expenses were calculated based on unit cost of the expense allocation standards of the last year in
accordance with the Regulation on Insurance Supervision. Direct costs included in commission and operating expenses were calculated based on estimates
of future expense according to the Group’s regulations.
General insurance
Automobile insurance
Long-term insurance
General insurance
Automobile insurance
Long-term insurance
(In millions of Korean won)
(In millions of Korean won)
2019
2018
Recognized liabilities1
\ 365,234
1,123,450
19,743,658
\ 21,232,342
Recognized liabilities1
\ 341,439
1,020,861
18,419,316
\ 19,781,616
Shortfall (surplus)
\ (68,434)
(52,374)
(10,001,793)
\ (10,122,601)
Shortfall (surplus)
\ (61,683)
(53,625)
(10,948,142)
\ (11,063,450)
Estimated adequate liabilities
\ 296,800
1,071,076
9,741,865
\ 11,109,741
Estimated adequate liabilities
\ 279,756
967,236
7,471,174
\ 8,718,166
1 Long-term insurance is for premium reserves and unearned premium reserves; the premium reserve is the amount deducted from the unearned premiums and insurance
contract loans in accordance with Article 6-3 of the Insurance Supervisory Regulation.
Surrender rate
Rate of claim
Discount rate
Assumptions(%)2019
0~65.39
11~132
(2.61)~15.53
2018
0~64.95
8~122
(1.82)~13.71
Basis
The ratio of cancelled premiums to premiums by product group, method of payment, channel, and elapsed period calculated based on the most recent five-year experience statistics
The ratio of incidents by collateral, gender, elapsed period to the number of holding insurances based on the most recent seven-year experience statistics
Estimated investment assets profit ratio based on the interest rate scenario provided by the Financial Supervisory Service
Financial Section 211

The results of liability adequacy test as of December 31, 2019 and 2018, are as follows:
As a result of adequacy test, the group did not set additional reserve as it shows net surplus. As such, there was no amount recorded as a result of liability
adequacy test.
37.4 Insurance Income and Expense
Insurance income and expenses for the years ended December 31, 2019 and 2018, are as follows:
Fixed interest type
Variable interest type
Variable type
Total
Fixed interest type
Variable interest type
Variable type
Total
Participating
Non-participating
Participating
Non-participating
Participating
Non-participating
Participating
Non-participating
(In millions of Korean won)
(In millions of Korean won)
2019
2018
Recognized liabilities1
\ 30,514
180,058
1,037,148
5,335,572
(36,500)
\ 6,546,792
Recognized liabilities1
\ 30,571
133,784
1,087,049
5,544,265
(31,235)
\ 6,764,434
Shortfall (surplus)
\ 24,604
(136,862)
19,693
(368,737)
(112,378)
\ (573,680)
Shortfall (surplus)
\ 23,586
(40,928)
1,169
(491,661)
(88,276)
\ (596,110)
Estimated adequate liabilities
\ 55,118
43,196
1,056,841
4,966,835
(148,878)
\ 5,973,112
Estimated adequate liabilities
\ 54,157
92,856
1,088,218
5,052,604
(119,511)
\ 6,168,324
Insurance IncomePremium income
Reinsurance income
Reversal of policy reserves
Separate account income
Income of change in reinsurance assets
Other insurance income
Insurance ExpenseInsurance claims paid
Dividend expense
Refunds of surrender value
Reinsurance expense
Provision of policy reserves
Separate account expenses
Insurance operating expenses
Deferred acquisition costs
Expenses of change in reinsurance assets
Claim survey expenses paid
Other insurance expenses
Net insurance income
2019
\ 11,173,367
850,871
993
216,429
42,432
33,090
12,317,182
5,046,772
9,902
2,870,543
1,018,007
1,547,264
139,810
453,016
679,279
314
52,123
200,640
12,017,670
\ 299,512
2018
\ 10,730,227
873,053
344
360,664
-
10,782
11,975,070
4,415,760
9,400
2,855,573
947,560
1,608,519
276,412
418,646
606,073
89,621
38,782
218,608
11,484,954
\ 490,116
(In millions of Korean won)
KB Financial Group Annual Report 2019212

37.5 Risk management of insurance
37.5.1 Overview
Insurance risk is the risk that arises from a primary operation of insurance companies that is associated with acceptance of insurance contract and payment
of claims, and is classified as the insurance price risk and the reserves risk. The insurance price risk is the risk of loss that might occur when the actual risk
exceeds the expected risk rate or expected insurance operating expenses ratios in calculation of premiums. It is the risk of loss that arises from differences
between actual payment of claims and premiums received from policyholders. The reserves risk is the risk that arises due to a deficit in reserves at the date
of assessment, making the Group unable to cover the actual claims payment in the future.
37.5.2 Purposes, policies and procedures to manage risk arising from insurance contracts
The risks associated with insurance contract that the Group faces are the insurance actuarial risk and the acceptance risk. Each risk occurs due to insurance
contract’s pricing and conditions of acceptance. In order to minimize acceptance risk, the Group establishes guidelines and procedure for acceptance and
outlines specific conditions for acceptance by product. In addition, expected risk level at the date of pricing is compared with actual risk of contracts after
acceptance and various subsequent measures such as the adjustments in the interest rate and sales conditions, termination of selling specific product and
others are taken in order to reduce insurance actuarial risk. The Group has a committee to discuss status of product acceptance risk and interest rate policy.
The committee decides important matters to set the processes that allow minimizing the insurance actuarial risk, the acceptance risk and other business
related risk.
In addition, according to reinsurance operating standards, the Group establishes an operating strategy of reinsurance for large claims expense due to
unexpected catastrophic events. The Group aims at policy holders’ safety and its stable profit achievement. For the long-term goal, the Group manages
risk at a comprehensive level to keep its value at the maximum.
37.5.3 Exposure to insurance price risk
According to RBC standard, exposure to insurance price risk is defined as net written premiums for prior one year that is calculated by adding and
subtracting original insurance premium, assumed reinsurance premium and ceded reinsurance premium.
The Group’s exposure to insurance price risk as of December 31, 2019 and 2018, as follows:
37.5.4 Concentration of Insurance risk
The Group is selling general non-life insurances (fire, maritime, injury, technology, liability, package, title, guarantee and special type insurances), automobile
insurances (for private use, for hire, for business, bicycle and other), long-term insurances (long-term non-life, property damage, injury, driver, savings,
illness, nursing and pension) and various other insurances. The Group’s risk is distributed through reinsurance, joint acceptance and diversified selling. In
addition, insurances that cover severe level of risk, although there is rare possibility of the occurrence of disaster, such as storm and flood insurance are
limited, and the Group controls the risk through joint acquisition.
General
Automobile
Long-term
General
Automobile
Long-term
(In millions of Korean won)
(In millions of Korean won)
2019
2018
Inward reinsurance
\ 101,613
-
-
\ 101,613
Inward reinsurance
\ 91,440
-
-
\ 91,440
Direct insurance
\ 999,348
2,101,780
2,550,236
\ 5,651,364
Direct insurance
\ 943,770
1,940,602
2,285,378
\ 5,169,750
Total
\ 521,039
2,061,713
2,182,332
\ 4,765,084
Total
\ 509,184
1,876,882
1,959,041
\ 4,345,107
Outward reinsurance
\ (579,922)
(40,067)
(367,904)
\ (987,893)
Outward reinsurance
\ (526,026)
(63,720)
(326,337)
\ (916,083)
Financial Section 213

Loss development tables
The Group uses claim development of payments and the estimated ultimate claims for the years where the accident has occurred, in order to maintain
overall reserve adequacy in respect of general, automobile and long-term insurance. When the estimated ultimate claims are greater than claim payments,
the Group establishes additional reserves. Loss development tables as of December 31, 2019 and 2018, are as follows:
<2019>General Insurance
Automobile Insurance
Accident year
Estimate of gross ultimate claims (A)2015.1.1 ~ 2015.12.31
2016.1.1 ~ 2016.12.31
2017.1.1 ~ 2017.12.31
2018.1.1 ~ 2018.12.31
2019.1.1 ~ 2019.12.31
Gross cumulative claim payments (B)2015.1.1 ~ 2015.12.31
2016.1.1 ~ 2016.12.31
2017.1.1 ~ 2017.12.31
2018.1.1 ~ 2018.12.31
2019.1.1 ~ 2019.12.31
Difference (A-B)
Accident year
Estimate of gross ultimate claims (A)2013.1.1 ~ 2013.12.31
2014.1.1 ~ 2014.12.31
2015.1.1 ~ 2015.12.31
2016.1.1 ~ 2016.12.31
2017.1.1 ~ 2017.12.31
2018.1.1 ~ 2018.12.31
2019.1.1 ~ 2019.12.31
Gross cumulative claim payments(B)2013.1.1 ~ 2013.12.31
2014.1.1 ~ 2014.12.31
2015.1.1 ~ 2015.12.31
2016.1.1 ~ 2016.12.31
2017.1.1 ~ 2017.12.31
2018.1.1 ~ 2018.12.31
2019.1.1 ~ 2019.12.31
Difference (A-B)
After 1 year
₩ 125,161
145,618
168,409
200,280
220,474
859,942
93,443
108,098
132,430
153,770
185,832
673,573
₩ 186,369
After 1 year
\ 1,131,945
1,174,611
1,227,106
1,276,939
1,342,998
1,468,784
1,591,793
9,214,176
939,569
969,211
1,020,975
1,052,830
1,104,158
1,224,820
1,332,849
7,644,412
\ 1,569,764
After 3 years
₩ 147,031
171,205
204,538
-
-
522,774
137,157
162,059
193,811
-
-
493,027
₩ 29,747
After 3 years
\ 1,170,968
1,205,524
1,256,058
1,287,728
1,358,867
-
-
6,279,145
1,145,110
1,180,953
1,228,357
1,264,651
1,335,962
-
-
6,155,033
\ 124,112
After 2 years
₩ 144,565
167,818
200,704
237,111
-
750,198
129,765
151,283
184,333
216,705
-
682,086
₩ 68,112
After 2 years
\ 1,156,535
1,193,832
1,245,780
1,281,381
1,348,828
1,471,807
-
7,698,163
1,114,063
1,150,462
1,198,241
1,235,656
1,306,235
1,428,973
-
7,433,630
\ 264,533
After 4 years
₩ 147,616
178,265
-
-
-
325,881
141,218
170,353
-
-
-
311,571
₩ 14,310
After 4 years
\ 1,179,458
1,212,025
1,263,044
1,294,735
-
-
-
4,949,262
1,161,624
1,196,387
1,245,779
1,282,346
-
-
-
4,886,136
\ 63,126
After 6 years
\ 1,179,514
1,214,524
-
-
-
-
-
2,394,038
1,175,681
1,208,421
-
-
-
-
-
2,384,102
\ 9,936
After 5 years
₩ 148,995
-
-
-
-
148,995
143,985
-
-
-
-
143,985
₩ 5,010
After 5 years
\ 1,179,323
1,212,162
1,267,142
-
-
-
-
3,658,627
1,168,617
1,204,580
1,254,187
-
-
-
-
3,627,384
\ 31,243
After 7 years
\ 1,180,458
-
-
-
-
-
-
1,180,458
1,178,158
-
-
-
-
-
-
1,178,158
\ 2,300
Payment year
Payment year
(In millions of Korean won)
(In millions of Korean won)
KB Financial Group Annual Report 2019214

Long-term Insurance
Accident year
Estimate of gross ultimate claims (A)2013.1.1 ~ 2013.12.31
2014.1.1 ~ 2014.12.31
2015.1.1 ~ 2015.12.31
2016.1.1 ~ 2016.12.31
2017.1.1 ~ 2017.12.31
2018.1.1 ~ 2018.12.31
2019.1.1 ~ 2019.12.31
Gross cumulative claim payments(B)2013.1.1 ~ 2013.12.31
2014.1.1 ~ 2014.12.31
2015.1.1 ~ 2015.12.31
2016.1.1 ~ 2016.12.31
2017.1.1 ~ 2017.12.31
2018.1.1 ~ 2018.12.31
2019.1.1 ~ 2019.12.31
Difference (A-B)
After 1 year
₩ 709,602
789,087
885,476
1,064,744
1,184,224
1,372,706
1,626,481
7,632,320
671,500
744,944
836,471
1,017,243
1,130,868
1,319,613
1,574,696
7,295,335
₩ 336,985
After 3 years
₩ 997,607
1,114,821
1,256,051
1,485,839
1,670,929
-
-
6,525,247
989,957
1,104,468
1,248,475
1,477,415
1,682,978
-
-
6,483,293
₩ 41,954
After 2 years
₩ 965,587
1,083,048
1,219,393
1,437,573
1,614,903
1,881,046
-
8,201,550
953,494
1,065,792
1,205,130
1,424,948
1,599,227
1,868,434
-
8,117,025
₩ 84,525
After 4 years
₩ 1,003,646
1,119,206
1,266,881
1,500,403
-
-
-
4,890,136
999,944
1,114,341
1,262,528
1,496,556
-
-
-
4,873,369
₩ 16,767
After 6 years
₩ 1,007,041
1,123,240
-
-
-
-
-
2,130,281
1,005,796
1,122,378
-
-
-
-
-
2,128,174
₩ 2,107
After 5 years
₩ 1,006,025
1,122,192
1,270,967
-
-
-
-
3,399,184
1,003,715
1,119,531
1,269,557
-
-
-
-
3,392,803
₩ 6,381
After 7 years
₩ 1,008,589
-
-
-
-
-
-
1,008,589
1,007,865
-
-
-
-
-
-
1,007,865
₩ 724
Payment year
(In millions of Korean won)
<2018>General Insurance
Accident year
Estimate of gross ultimate claims (A)2014.1.1 ~ 2014.12.31
2015.1.1 ~ 2015.12.31
2016.1.1 ~ 2016.12.31
2017.1.1 ~ 2017.12.31
2018.1.1 ~ 2018.12.31
Gross cumulative claim payments (B)2014.1.1 ~ 2014.12.31
2015.1.1 ~ 2015.12.31
2016.1.1 ~ 2016.12.31
2017.1.1 ~ 2017.12.31
2018.1.1 ~ 2018.12.31
Difference (A-B)
After 1 year
₩ 127,903
125,170
145,618
168,409
201,014
768,114
94,901
93,443
108,098
132,430
153,770
582,642
₩ 185,472
After 3 years
₩ 146,430
148,165
171,506
-
-
466,101
136,689
137,854
162,360
-
-
436,903
₩ 29,198
After 2 years
₩ 144,915
145,637
168,119
201,100
-
659,771
129,652
130,430
151,583
184,716
-
596,381
₩ 63,390
After 4 years
₩ 146,533
151,594
-
-
-
298,127
141,170
142,645
-
-
-
283,815
₩ 14,312
After 5 years
₩ 146,508
-
-
-
-
146,508
142,217
-
-
-
-
142,217
₩ 4,291
Payment year
(In millions of Korean won)
Financial Section 215

Automobile Insurance
Accident year
Estimate of gross ultimate claims (A)2012.1.1 ~ 2012.12.31
2013.1.1 ~ 2013.12.31
2014.1.1 ~ 2014.12.31
2015.1.1 ~ 2015.12.31
2016.1.1 ~ 2016.12.31
2017.1.1 ~ 2017.12.31
2018.1.1 ~ 2018.12.31
Gross cumulative claim payments(B)2012.1.1 ~ 2012.12.31
2013.1.1 ~ 2013.12.31
2014.1.1 ~ 2014.12.31
2015.1.1 ~ 2015.12.31
2016.1.1 ~ 2016.12.31
2017.1.1 ~ 2017.12.31
2018.1.1 ~ 2018.12.31
Difference (A-B)
After 1 year
\ 1,117,650
1,131,945
1,174,611
1,227,106
1,276,939
1,342,998
1,468,784
8,740,033
939,239
939,569
969,211
1,020,975
1,052,830
1,104,158
1,224,820
7,250,802
\ 1,489,231
After 3 years
\ 1,155,529
1,170,968
1,205,524
1,256,058
1,287,728
-
-
6,075,807
1,135,064
1,145,110
1,180,953
1,228,357
1,264,651
-
-
5,954,135
\ 121,672
After 2 years
\ 1,146,779
1,156,535
1,193,832
1,245,780
1,281,381
1,348,828
-
7,373,135
1,105,672
1,114,063
1,150,462
1,198,241
1,235,656
1,306,235
-
7,110,329
\ 262,806
After 4 years
\ 1,162,075
1,179,458
1,212,025
1,263,044
-
-
-
4,816,602
1,149,585
1,161,624
1,196,387
1,245,779
-
-
-
4,753,375
\ 63,227
After 6 years
\ 1,166,470
1,179,514
-
-
-
-
-
2,345,984
1,159,614
1,175,681
-
-
-
-
-
2,335,295
\ 10,689
After 5 years
\ 1,164,774
1,179,323
1,212,162
-
-
-
-
3,556,259
1,156,150
1,168,617
1,204,580
-
-
-
-
3,529,347
\ 26,912
After 7 years
\ 1,165,352
-
-
-
-
-
-
1,165,352
1,160,769
-
-
-
-
-
-
1,160,769
\ 4,583
Payment year
(In millions of Korean won)
Long-term Insurance
Accident year
Estimate of gross ultimate claims (A)2014.1.1 ~ 2014.12.31
2015.1.1 ~ 2015.12.31
2016.1.1 ~ 2016.12.31
2017.1.1 ~ 2017.12.31
2018.1.1 ~ 2018.12.31
Gross cumulative claim payments (B)2014.1.1 ~ 2014.12.31
2015.1.1 ~ 2015.12.31
2016.1.1 ~ 2016.12.31
2017.1.1 ~ 2017.12.31
2018.1.1 ~ 2018.12.31
Difference (A-B)
After 1 year
\ 789,087
885,476
1,064,744
1,184,224
1,372,706
5,296,237
744,944
836,471
1,017,243
1,130,868
1,319,613
5,049,139
\ 247,098
After 3 years
\ 1,114,821
1,256,051
1,485,839
-
-
3,856,711
1,104,468
1,248,475
1,477,415
-
-
3,830,358
\ 26,353
After 2 years
\ 1,083,048
1,219,393
1,437,573
1,614,903
-
5,354,917
1,065,792
1,205,130
1,424,948
1,599,227
-
5,295,097
\ 59,820
After 4 years
\ 1,119,206
1,266,881
-
-
-
2,386,087
1,114,341
1,262,528
-
-
-
2,376,869
\ 9,218
After 5 years
\ 1,122,192
-
-
-
-
1,122,192
1,119,531
-
-
-
-
1,119,531
\ 2,661
Payment year
(In millions of Korean won)
37.5.5 Sensitivity analysis of insurance risk
The Group manages insurance risk by performing sensitivity analysis based on discount rate, loss ratio and insurance operating expenses ratio which are
considered to have significant influence on future cash flow, timing and uncertainty. According to result of sensitivity analysis there is no material influence
on the equity and net profit before tax.
KB Financial Group Annual Report 2019216

37.5.6 Liquidity risk of insurance contracts
Liquidity risk arising from insurance contracts is the increase in refunds at maturity caused by concentrations of maturity, the increase in surrender values
caused by unexpected amounts in cancellation and the increase in payments of claims caused by catastrophic events. The Group manages payment of
refunds payable at maturity by analyzing maturity of insurance.
Premium reserve’s maturity structure as of December 31, 2019 and 2018, as follows:
Surrenders and termination rates
Loss ratio
Insurance operating expenses ratio
Discount rate
Surrenders and termination rates
Loss ratio
Insurance operating expenses ratio
Discount rate
(In millions of Korean won)
(In millions of Korean won)
2019
2018
Effect on LAT\ 488,191
(541,208)
4,319,256
(4,319,256)
326,915
(326,915)
(1,426,729)
1,732,166
Effect on LAT\ 599,778
(658,755)
4,348,655
(4,348,655)
347,179
(347,179)
(1,295,369)
1,554,782
Assumption change
+10%
-10%
+10%
-10%
+10%
-10%
+0.5%
-0.5%
Assumption change
+10%
-10%
+10%
-10%
+10%
-10%
+0.5%
-0.5%
Long-term insurance non participating
Non-linked
Linked
Annuity
Non-linked
Linked
Asset-linked
Linked
Total
Non-linked
Linked
Within 1 year
\ 57,532
527,467
584,999
10
273
283
27,389
57,542
555,129
\ 612,671
5~10 years
\ 84,349
2,085,054
2,169,403
2,244
367,710
369,954
-
86,593
2,452,764
\ 2,539,357
1~5 years
\ 258,436
2,578,004
2,836,440
543
70,180
70,723
-
258,979
2,648,184
\ 2,907,163
10~20 years
\ 43,141
777,340
820,481
3,714
1,245,176
1,248,890
-
46,855
2,022,516
\ 2,069,371
Total
\ 569,080
19,304,533
19,873,613
7,586
3,910,393
3,917,979
27,389
576,666
23,242,315
\ 23,818,981
More 20 years
\ 125,622
13,336,668
13,462,290
1,075
2,227,054
2,228,129
-
126,697
15,563,722
\ 15,690,419
20191
(In millions of Korean won)
1 Includes long-term investment contract amounting to ₩ 108,938 million.
Financial Section 217

Long-term insurance non participating
Non-linked
Linked
Annuity
Non-linked
Linked
Asset-linked
Linked
Total
Non-linked
Linked
Within 1 year
\ 27,477
419,874
447,351
5
200
205
-
27,482
420,074
\ 447,556
5~10 years
\ 94,503
2,169,861
2,264,364
2,279
339,662
341,941
-
96,782
2,509,523
\ 2,606,305
1~5 years
\ 301,842
2,774,991
3,076,833
251
58,182
58,433
27,480
302,093
2,860,653
\ 3,162,746
10~20 years
\ 41,129
726,859
767,988
3,736
1,176,168
1,179,904
-
44,865
1,903,027
\ 1,947,892
Total
\ 560,802
17,991,970
18,552,772
7,598
3,768,593
3,776,191
27,480
568,400
21,788,043
\ 22,356,443
More 20 years
\ 95,851
11,900,385
11,996,236
1,327
2,194,381
2,195,708
-
97,178
14,094,766
\ 14,191,944
20181
(In millions of Korean won)
1 Includes long-term investment contract amounting to \ 110,255 million.
37.5.7 Credit risk of insurance contract
Credit risk of insurance contract is the economic loss arising from non-performing contractual obligations due to decline in credit ratings or default. Through strict internal review, only the insurers rated above BBB- of S&P rating are accepted for the insurance contracts.
As of December 31, 2019, there are 153 reinsurance companies that deal with the Group, and the top three reinsurance companies’ concentration and credit ratings are as follows:
37.5.8 Interest risk of insurance contract
The interest rate risk exposure from the Group’s insurance contracts is the risk of unexpected losses in net interest income or net assets arising from changes in interest rates and it is managed to minimize unexpected loss. For long-term, non-life insurance contracts, the Group calculates exposure of interest-bearing assets and interest-bearing liabilities. Liabilities exposure is premium reserves less costs of termination deductions plus unearned premium reserve. Asset exposure is interest-bearing assets. Assets that receive only fees without interest are excluded from interest bearing assets. Exposures to interest rate risk as of December 31, 2019 and 2018, are as follows:
Reinsurance companyKOREAN RESWISS RESCOR RE
64.14%10.81%
2.77%
AA
AAAAAA
Ratio Credit rating
Reinsurance assets1
Net receivables from reinsurers2
\ 735,196
328,177\ 1,063,373
\ 688,993
398,575\ 1,087,568
(In millions of Korean won)
2019 2018
Exposures to credit risk related to reinsurance as of December 31, 2019 and 2018 as follows
1 Net carrying amounts after impairment loss2 Net carrying amounts of after allowance for loan losses
KB Financial Group Annual Report 2019218

i) Exposure to interest rate risk
LiabilitiesFixed interest rateVariable interest rate
AssetsDue from financial institutions at amortized cost and cash equivalentsFinancial assets at fair value through profit or lossFinancial assets at fair value through other comprehensive incomeFinancial assets at amortized costLoans at amortized cost
2019
\ 534,23621,911,39322,445,629
108,5594,560,5122,984,7388,163,4856,924,597
\ 22,741,891
2018
\ 560,47120,332,09420,892,565
100,7014,257,9592,691,7447,718,3376,877,139
\ 21,645,880
(In millions of Korean won)
(In millions of Korean won)
ii) Measurement and recognition methodDuration is used to measure interest rate risk within risk based solvency test. ALM system is utilized to manage interest rate risk internally. In addition, Risk Management Committee sets ALM strategy every year to manage interest rate risk.
iii) Sensitivity to changes in interest ratesGenerally, when interest rates rise, the value and duration of assets and liabilities fall when interest rates fall, value and duration of assets and liabilities increase. Where duration of assets is shorter than that of liabilities with the interest rates fall, the interest risk is increased since the incremental portion of liabilities exceeds that of assets.
iv) Negative spread risk controlIn order to manage the reverse margins risk between interest expenses from liabilities and investment incomes on assets, the Group set the disclosure rate every month considering the market interest rate and the managing portfolio’s profit ratio.
37.6 Risk management of life insurance
37.6.1 Overview
Insurance risk is the risk of loss arising from the actual risk at the time of claims exceeding the estimated risk at the time of underwriting. Insurance risk is classified by insurance price risk and policy reserve risk.
Insurance price risk is the risk of loss arising from differences between received from policyholders and actual claims paid.
Policy reserve risk is the risk of loss arising from differences between policy reserves the Group holds and actual claims to be paid.
The Group measures only insurance price risk under RBC requirement because life insurance claim payout is mainly in a fixed amount with less volatility in policy reserve and shorter waiting period before payment.
Financial Section 219

37.6.2 Concentration of insurance risk and reinsurance policy
The Group uses reinsurance to mitigate concentration of insurance risk seeking an enhanced capital management.
The Group categorized reinsurance into group and individual contracts, and reinsurance is ceded through the following process:
The Group’s reinsurance is ceded through the following process:
i. In the decision-making process of launching a new product, the Group makes a decision on ceding reinsurance. Subsequently, a reinsurer is selected through bidding, agreements with the relevant departments and final approval by the executive management.
ii. The reinsurance department analyzes the object of reinsurance, the maximum limit of reinsurance and the loss ratio with the relevant departments.
37.6.3 The characteristic and exposure of insurance price risk
The exposure of insurance price risk is measured by the risk premium for all insurance contracts held for one year prior to the calculation date. The premium for risk retention is calculated by adding direct insurance premium and reinsurance assumed premium, and deducting reinsurance ceded premium (which is paid to reinsurance companies). If the holding risk premium is less than zero, the exposure of the insurance price is measured as zero.
The insurance risk of a life insurance company is measured by insurance price risk. As the life insurance coverage is in the form of a fixed payment, the fluctuation of policy reserve is small and the period from insured event to claims payment is not long. The policy reserve risk is managed by assessments of adequacy of the policy reserve.
The insurance price risk is managed through insurance risk management regulation established by Risk Management Committee.
The maximum exposures to insurance price risk as of December 31, 2019 and 2018, are as follows:
DeathDisabilityHospitalizationOperation and diagnosisActual losses for medical expenseOthers
Before reinsurance mitigation
\ 12,882754
1,2604,4191,0531,066
\ 21,434
After reinsurance mitigation
\ 9,033424642
2,211396411
\ 13,117
2019
(In millions of Korean won)
DeathDisabilityHospitalizationOperation and diagnosisActual losses for medical expenseOthers
Before reinsurance mitigation
\ 13,264858
1,2873,9361,0591,019
\ 21,423
After reinsurance mitigation
\ 6,758296358
1,0318596
\ 8,624
2018
(In millions of Korean won)
Average ratios of claims paid per risk premium received on the basis of exposure before mitigation for the past three years as of December 31, 2019 and 2018, were 57.8 % and 67.6%, respectively.
The exposure of market risk arising from embedded derivatives included in host insurance contracts as of December 31, 2019 and 2018, are as follows:
Variable annuity
Variable universal
Variable saving
(In millions of Korean won)
2019 2018
Guarantee reserve
\ 2,565
3,095
516
\ 6,176
Guarantee reserve
\ 2,688
4,129
396
\ 7,213
Policyholders reserve1
\ 429,970
91,988
734,661
\ 1,256,619
Policyholders reserve1
\ 359,617
84,783
542,035
\ 986,435
1 Excluding the amount of the lapsed reserve
KB Financial Group Annual Report 2019220

37.6.4 Assumptions used in measuring insurance liabilities
The Group applies assumed rates defined in the premium and liability reserve calculation manual provided by the regulatory authority and in accordance with the Regulations on Supervision of Insurance Business when measuring insurance liabilities at every reporting period. For interest sensitive insurance, credit rate stated in the premium and liabilities reserve calculation manual, which is calculated based on adjusted external base rate and return rate of asset management according to Article 6-12 of the Regulation on Supervision of Insurance Business.
Reserve amount should exceed the standard reserve which is calculated using the standard interest rate and standard risk rate as required by the Regulation on Supervision of Insurance Business.
37.6.5 Premium reserves and unearned premium reserves residual maturity
Premium reserve’s maturity structure as of December 31, 2019 and 2018, as follows:
Premium reserves
Premium reserves
Less than 3 years
\ 984,945
Less than 3 years
\ 984,201
5-10 years
\ 665,241
5-10 years
\ 777,690
3-5 years
\ 280,733
3-5 years
\ 530,322
10-15 years
\ 525,699
10-15 years
\ 575,712
20 years or more
\ 4,188,965
20 years or more
\ 4,005,728
15-20 years
\ 345,664
15-20 years
\ 341,112
Total
\ 6,991,247
Total
\ 7,214,765
2019
2018
(In millions of Korean won)
(In millions of Korean won)
Surrender rate Rate of claim Expense rate Discount rate
Surrender rate Rate of claim Expense rate Discount rate
(In millions of Korean won)
(In millions of Korean won)
2019
2018
Effect on LAT\ 50,666
(56,115)22,786
(23,456)31,315
(31,315)(370,094)
424,632
Effect on LAT\ 42,328
(47,157)20,223
(20,540)24,671
(24,671)(316,446)
382,418
Assumption change
+10%-10%+10%-10%+10%-10%+10%-10%
Assumption change
+10%-10%+10%-10%+10%-10%+10%-10%
37.6.6 Sensitivity analysis of insurance risk
The Group manages insurance risk by performing sensitivity analysis based on surrender rate, rate of claim, expense rate, discount rate and others which are considered to have significant influence on future cash flow, timing and uncertainty.
Financial Section 221

37.7 The Overlay Approach
The Group applied “The Overlay Approach” under Korean IFRS 1104 at the initial application of Korean IFRS 1109.
Details of financial assets applied “The Overlay Approach” as of December 31, 2019 and 2018, are as follows:
Changes of net overlay adjustments for the years ended December 31, 2019 and 2018, are as follows:
Financial assets at fair value through profit or lossDue from financial institutionsDebt securitiesEquity securities
₩ 166,891
7,955,28652,250
₩ 8,174,427
₩ 172,7777,044,081
81,949₩ 7,298,807
(In millions of Korean won)
2019 2018
BeginningRecognization of other comprehensive income due to acquisition and valuationReclassification to profit or loss due to disposalEnding
BeginningRecognization of other comprehensive income due to acquisition and valuationReclassification to profit or loss due to disposalEnding
2019 ₩ (7,146)
196,110(1,887)
187,077
2018 ₩ (7,559)
17,205(16,792)
(7,146)
(In millions of Korean won)
(In millions of Korean won)
1 Calculated based on Korean IFRS 11092 Amounts are net of tax
38. Trust AccountsFinancial information of the trust accounts that Kookmin Bank manages as of December 31, 2019 and 2018, are as follows:
Consolidated
Unconsolidated
Total assets
\ 4,384,959
51,685,885
\ 56,070,844
Total assets
\ 4,259,441
47,644,193
\ 51,903,634
Operating revenues
\ 137,017
2,206,184
\ 2,343,201
Operating revenues
\ 127,994
1,609,587
\ 1,737,581
(In millions of Korean won)
2019 2018
1 Financial information of the trust accounts has been prepared in accordance with the Statement of Korea Accounting Standard 5004, Trust Accounts, and enforcement regulations of Financial Investment Services under the Financial Investment Services and Capital Markets Act.
Significant transactions between the Group and the trust accounts for the years ended December 31, 2019 and 2018, are as follows:
RevenuesFees and commissions from trust accounts
Interest income from loans on trust accounts
Commissions from early termination in trust accounts
ExpensesInterest expenses due to trust accounts
ReceivablesAccrued trust fees
Due from trust accounts
2019
\ 542,150
4,261
119
\ 546,530
\ 65,706
\ 74,992
92,866
\ 167,858
2018
\ 496,424
5,586
88
\ 502,098
\ 61,454
\ 72,085
109,357
\ 181,442
(In millions of Korean won)
KB Financial Group Annual Report 2019222

39. Supplemental Cash Flow InformationCash and cash equivalents as of December 31, 2019 and 2018, are as follows:
PayablesDue to trust accounts
Accrued interest on due to trust accounts
Cash
Checks with other banks
Due from Bank of Korea
Due from other financial institutions
Due from financial institutions at fair value through profit or loss
Restricted cash from financial institutions
Due from financial institutions with original maturities over three months
2019
\ 5,216,460
10,136
\ 5,226,596
2019 \ 2,311,418
383,500
8,607,911
9,535,049
20,837,878
216,367
21,054,245
(13,372,966)
(1,557,554)
(14,930,520)
\ 6,123,725
2018
\ 5,285,108
10,547
\ 5,295,655
2018 \ 2,186,035
872,166
9,098,891
8,117,398
20,274,490
381,718
20,656,208
(12,347,627)
(1,665,765)
(14,013,392)
\ 6,642,816
(In millions of Korean won)
(In millions of Korean won)
Significant non-cash transactions for the years ended December 31, 2019 and 2018, are as follows:
Decrease in loans due to the write-offs
Changes in financial instruments due to conversion of investment
Changes in accumulated other comprehensive income due to valuation of
financial investments at fair value through other comprehensive income
Decrease in accumulated other comprehensive income from measurement of
investment securities in associates
Changes in other payables due to treasury stock trust agreement, etc
2019 \ 1,188,584
104,815
35,490
7,695
-
2018 \ 1,079,435
22,286
119,182
(3,733)
6,678
(In millions of Korean won)
Cash inflows and outflows from income tax, interests and dividends for the years ended December 31, 2019 and 2018, are as follows:
Income tax paid
Interest received
Interest paid
Dividends received
Dividends paid
2019 \ 1,223,084
14,936,705
5,365,595
185,846
766,249
ActivityOperating
Operating
Operating
Operating
Financial
2018 \ 759,013
13,958,806
4,369,345
235,243
766,728
(In millions of Korean won)
Financial Section 223

Changes in liabilities arising from financing activities
Changes in liabilities and assets that arising from financing activities for the year ended December 31, 2019 are as follows:
The net cash outflow associated with the change of the subsidiaries for the year ended December 31, 2019 was \ 91,592 million.
Derivatives held for hedging1
Debts
Other payables
from trust accounts
Change of Non-controlling
equity
Others
Acquisition (Disposal)
\ -
-
-
-
766,259
\ 766,259
Changes in fair value
\ 139,771
67,297
-
-
-
\ 207,068
Changes in foreign
exchange rates
\ -
397,571
-
345
35,591
\ 433,507
Business Combination
\ -
(602,388)
-
-
-
\ (602,388)
Other changes
\ 67,912
71,041
-
1,372
(4,699)
\ 135,626
Beginning
\ 8,049
86,283,531
5,285,108
9,110
167,128
\ 91,752,926
Net cash flows
\ (28,631)
2,537,391
(68,648)
574,580
(95,723)
\ 2,918,969
Ending
\ 187,101
88,754,443
5,216,460
585,407
868,556
\ 95,611,967
Non-cash changes2019
(In millions of Korean won)
1 Derivatives held for hedging purposes are the net amount after offsetting liabilities from assets
40. Contingent Liabilities and CommitmentsDetails of payment guarantees as of December 31, 2019 and 2018, are as follows:
Confirmed payment guaranteesConfirmed payment guarantees in Korean won
Payment guarantees for KB purchasing loan
Other payment guarantees
Confirmed payment guarantees in foreign currency
Acceptances of letter of credit
Letter of guarantees
Bid bond
Performance bond
Refund guarantees
Other payment guarantees in foreign currency
Financial guarantees
Payment guarantees for mortgage
Overseas debt guarantees
International financing guarantees in foreign currencies
Other financing payment guarantees
Unconfirmed acceptances and guaranteesGuarantees of letter of credit
Refund guarantees
2019
\ 161,314
746,823
908,137
155,151
49,754
37,765
718,097
1,022,646
2,935,939
4,919,352
47,384
406,680
231,685
230,000
915,749
6,743,238
1,845,508
654,497
2,500,005
\ 9,243,243
2018
\ 196,517
597,636
794,153
208,926
53,210
51,528
604,311
592,925
2,539,900
4,050,800
50,497
311,796
110,070
270,000
742,363
5,587,316
1,745,340
686,843
2,432,183
\ 8,019,499
(In millions of Korean won)
KB Financial Group Annual Report 2019224

Payment guarantees that are exposed to credit risk as of December 31, 2019, are as follows:
Confirmed payment guaranteesGrade 1Grade 2Grade 3Grade 4Grade 5
Unconfirmed acceptances and guaranteesGrade1Grade2Grade3Grade4Grade5
The financial instruments
applying 12-month expected credit losses
\ 4,220,0462,105,637
93,07418,773
-6,437,530
1,228,2581,121,159
17,0914,236
-2,370,744
\ 8,808,274
Total
\ 4,220,7422,143,908
174,391191,213
12,9846,743,238
1,229,5471,153,572
38,04867,20011,638
2,500,005\ 9,243,243
Non-impaired
\ 69638,27181,317
172,4402,873
295,597
1,28932,41320,95762,964
170117,793
\ 413,390
Impaired
\ ----
10,11110,111
----
11,46811,468
\ 21,579
The financial instruments applying lifetime expected
credit losses
(In millions of Korean won)
Acceptances and guarantees by counterparty as of December 31, 2019 and 2018, are as follows:
Corporations
Small companies
Public and others
Corporations
Small companies
Public and others
(In millions of Korean won)
(In millions of Korean won)
2019
2018
Unconfirmed guarantees
\ 1,904,346
397,539
198,120
\ 2,500,005
Unconfirmed guarantees
\ 1,901,951
423,947
106,285
\ 2,432,183
Proportion (%)
85.10
11.34
3.56
100.00
Proportion (%)
83.27
12.99
3.74
100.00
Confirmed guarantees
\ 5,962,004
650,612
130,622
\ 6,743,238
Confirmed guarantees
\ 4,775,838
617,458
194,020
\ 5,587,316
Total
\ 7,866,350
1,048,151
328,742
\ 9,243,243
Total
\ 6,677,789
1,041,405
300,305
\ 8,019,499
Acceptances and guarantees by counterparty as of December 31, 2019 and 2018, are as follows:
Financial institutions
Manufacturing
Service
Whole sale & Retail
Construction
Public sector
Others
(In millions of Korean won)
2019
Unconfirmed guarantees
\ 23,999
1,627,840
88,158
597,998
20,590
81,895
59,525
\ 2,500,005
Proportion (%)
3.08
54.11
13.80
18.66
5.28
2.05
3.02
100.00
Confirmed guarantees
\ 260,974
3,373,220
1,187,516
1,126,976
467,114
107,481
219,957
\ 6,743,238
Total
\ 284,973
5,001,060
1,275,674
1,724,974
487,704
189,376
279,482
\ 9,243,243
Financial Section 225

Financial institutionsManufacturingServiceWhole sale & RetailConstructionPublic sectorOthers
(In millions of Korean won)
2018
Unconfirmed guarantees
\ 3,7361,451,657
84,586723,367
40,98836,25691,593
\ 2,432,183
Proportion (%)
0.9555.2712.6721.47
4.002.523.12
100.00
Confirmed guarantees
\ 72,0712,981,245
931,680998,333280,146165,571158,270
\ 5,587,316
Total
\ 75,8074,432,9021,016,2661,721,700
321,134201,827249,863
\ 8,019,499
Commitments as of December 31, 2019 and 2018, are as follows:
CommitmentsCorporate loan commitmentsRetail loan commitments Credit line on credit cardsPurchase of other security investment and others
Financial GuaranteesCredit linePurchase of security investment
2019
\ 41,930,40742,582,73660,667,219
6,617,253151,797,615
2,340,141591,500
2,931,641\ 154,729,256
2018
\ 37,340,72741,335,45454,488,133
5,426,058138,590,372
2,447,369436,800
2,884,169\ 141,474,541
(In millions of Korean won)
Other Matters (including litigation)
a) The Group has filed 102 lawsuits as a plaintiff (excluding minor lawsuits in relation to the collection or management of loans), involving aggregate claims of ₩ 458,195 million, and faces 207 lawsuits (as a defendant) (excluding minor lawsuits in relation to the collection or management of loans) involving aggregate damages of ₩ 193,002 million, which arose in the normal course of the business and are still pending as of December 31, 2019.
b) Kookmin bank made a construction contract building the integrated company building, amounting to ₩ 155,546 million; for the year ended December 31, 2019, the Bank has paid ₩ 41,598 million.
c) As at December 31, 2019, Kookmin Bank has entered into construction contracts amounting to ₩ 250,458 million related to the construction of The K Project(IT infrastructure construction business needed KB’s Digital Transformation to cope with change of IT technology and finance environment), and payments made up to December 31, 2019 amount to ₩ 60,462 million.
d) The face value of the securities which Kookmin Bank sold to general customers through the bank tellers amounts to ₩ 372 million and ₩ 372 million as of December 31, 2019 and 2018, respectively.
e) While setting up a fraud detection system, a computer contractor employed by the personal credit ratings firm Korea Credit Bureau caused a widespread data breach in June 2013, resulting in the theft of cardholders’ personal information. As a result of the leakage of customer personal information, the KB Kookmin Card received a notification from the Financial Services Commission that the KB Kookmin Card is subject to a temporary three-month operating suspension as of February 16, 2014. In respect of the incident, the Group faces 11 and 113 legal claims filed as a defendant, with an aggregate claim of ₩ 444 million and ₩ 6,906 million as of December 31, 2019. A provision liability of ₩ 2,549 million and ₩ 9,888 million have been recognized for these pending lawsuits. In addition, the Group took out the personal information protection liability insurance. On the other hand, the further appeals can be filed against the Group, however, the final outcome cannot be reasonably measured.
f) As of December 31, 2019, the Group is not able to dispose, transfer or collateralize the shares of a joint-venture lease company or the right of shares to a third party without the written consent of Kolao Holdings for five years (the restriction period for the disposal of its equity) from the date of initial investment for KB KOLAO LEASING Co., LTD. Each party of the joint venture lease company may transfer all or part of its equity, as determined separately, after the restriction period for the disposal of its equity has expired. Meanwhile, according to the agreement, KB KOLAO LEASING Co., LTD. disposes affiliated receivables, which are overdue for more than three months, of Kolao Holdings to Lanexang Leasing Co., Ltd.
g) KB Securities is a professional private equity investment firm which sells private investment funds that loans capital to corporations (borrowers) who invest in rental apartment of disables in Australia. KB Securities sold ₩ 326,500 million in funds and trusts to individuals and institutional investors. However, KB Securities is in probable of a loss of investment principal because the operation of the funds became impossible due to a contract breach of a local
KB Financial Group Annual Report 2019226

borrower. In this regard, one lawsuit has been filed with the Group and there is a possibility of further lawsuits as of December 31, 2019. The expected loss from the lawsuit is reflected as provision and the result of the lawsuit is unpredictable as of now.
h) Regarding Lime Asset Management, KB Securities is holding PIS(Portfolio Index Swap) contract in related to Lime Thetis Qualified Investor Private Investment Trust No.2 and Lime Pluto FI Qualified Investor Private Investment Trust No.D-1, which are suspended to repurchase in fourth quarter of 2019 and KB Securities holds beneficiary certificates and TRS contracts as underlying asset amount to ₩ 403,700 million. On the other hand, KB Securities has sold feeder fund of applicable funds amounts to ₩ 68,100 million. Lime Asset Management conducted a due diligence on the assets of the suspended fund through an external evaluation agency and adjusted the base price based on the results of the due diligence. The Group measured the fair values of the fund and linked TRS based on the fund base price, which is adjusted by Lime Asset Management reflecting the results of the due diligence. Lime Asset Management has a repurchase and management plan in place, however, at the current status, either the availability or timing of repurchase of the fund cannot be predicted. There is possibility of lawsuit to be filed in the future, but the impact on the financial statements is unpredictable as of now.
i) Kookmin Bank signed a contract to take over a 70 percent share in Prasak(PRASAC Microfinance Institution Limited), a microcreditary finance company in Cambodia, for US$ 603 million from an existing stockholder on January 6, 2020. The Group is required to report this contract to the domestic and foreign financial authorities for approval in order to complete the contract.
The Group has signed an agreement with the existing shareholders of PRASAC. Existing shareholders of PRASAC have the right of put option to sell 30% of the remaining shares to the Group, and they are entitled to exercise their rights at the exercise price calculated on the basis of the adjustment book amount at the end of 2021 within six months from the issue date of the audit report or date when the adjusted book amount is confirmed. If existing shareholders do not exercise put option within the exercise period, the Group has the right of call option to buy the shares of existing shareholders within six months of the end of the put option exercisable period. All stockholders are restricted from selling shares or additional pledge before exercising the put option and call option.
j) KB Kookmin Card signed a stock sale agreement to acquire 80% of the shares of PT. Finansia Multi Finance, Indonesian financial company, for US$ 81 million in December 2019 and paid US$ 16 million in December 2019. In addition, KB Kookmin Card entered into a contract to acquire bonds, which includes the right to exchange 5% of PT. Finansia Multi Finance shares, issued by PT. Finansia Multi Finance shareholders for US$ 5 million.
41. SubsidiariesDetails of subsidiaries as of December 31, 2019, are as follows:
Investor
KB Financial Group Inc.
Kookmin Bank
Ownership interests (%)
100.00%
100.00%100.00%100.00%100.00%100.00%100.00%100.00%100.00%100.00%100.00%
100.00%
100.00%
100.00%
100.00%
100.00%
-
99.94%
99.90%
99.96%
Location
Korea
KoreaKoreaKoreaKoreaKoreaKoreaKoreaKoreaKoreaKorea
Korea
Cambodia
United Kingdom
China
Myanmar
Korea
Korea
Korea
Korea
Date of financial
statements
Dec. 31
Dec. 31Dec. 31Dec. 31Dec. 31Dec. 31Dec. 31Dec. 31Dec. 31Dec. 31Dec. 31
Dec. 31
Dec. 31
Dec. 31
Dec. 31
Dec. 31
Dec. 31
Dec. 31
Dec. 31
Dec. 31
Investee
Kookmin Bank
KB Securities Co., Ltd.KB Insurance Co., Ltd.KB Kookmin Card Co., Ltd.KB Asset Management Co., Ltd.KB Capital Co., Ltd.KB Life Insurance Co., Ltd.KB Real Estate Trust Co., Ltd.KB Savings Bank Co., Ltd.KB Investment Co., Ltd.KB Data System Co., Ltd.
KB Credit Information Co., Ltd.
Kookmin Bank Cambodia PLC.
Kookmin Bank Int’l Ltd. (London)6
Kookmin Bank(China) Ltd.
KB Microfinance Myanmer Co., Ltd.
KBD Tower 1st L.L.C. and 39 others2
KB Haeoreum private securities investment trust 83(Bond)
Kiwoom Frontier Private placement fund 10[Bond]
Tong Yang Safe Plus Qualified Private Trust S-8
Industry
Banking and foreign exchange transaction
Financial investmentNon-life insuranceCredit card and installment financeCollective investment and advisoryFinancial LeasingLife insuranceReal estate trust managementSavings bankingCapital investmentSoftware advisory, development, and supply
Collection of receivables or credit investigation
Banking and foreign exchange transaction
Banking and foreign exchange transaction
Banking and foreign exchange transaction
Other credit granting n.e.c.
Asset-backed securitization
Capital investment
Capital investment
Capital investment
Financial Section 227

Investor
KB Securities Co., Ltd.
Ownership interests (%)
99.92%
77.78%
87.53%
98.56%
99.50%
50.00%
50.00%
99.97%
100.00%
100.00%
99.70%
-
29.67%
98.86%
99.51%
79.67%
99.64%
100.00%
98.15%
100.00%
99.99%
100.00%
82.06%
98.77%
99.96%
Location
Korea
Korea
Korea
Korea
Korea
Korea
Korea
Korea
United States
of America
China
Vietnam
Korea
Korea
Korea
Korea
Korea
Korea
Korea
Korea
Korea
Korea
Korea
Korea
Korea
Cayman islands
Date of financial
statements
Dec. 31
Dec. 31
Dec. 31
Dec. 31
Dec. 31
Dec. 31
Dec. 31
Dec. 31
Dec. 31
Dec. 31
Dec. 31
Dec. 31
Dec. 31
Dec. 31
Dec. 31
Dec. 31
Dec. 31
Dec. 31
Dec. 31
Dec. 31
Dec. 31
Dec. 31
Dec. 31
Dec. 31
Dec. 31
Investee
Mirae Asset Triumph Global Privately placed Feeder Investment Trust 1
NH-AMUNDI Global Private Securities Investment Trust 1USD(BOND)
KB KBSTAR Mid-Long Term KTB Active ETF3
Samsung KODEX 10Y F-SKTB Inverse
KB Global Private Real Estate Debt Fund 3rd(USD)
KB Europe Renewable Specialized Investment
NO.2(EUR)(SOC- FoFs)3
KB Korea Short Term Premium Private Securities 10 (USD) (BOND)3
AIP US Red Private Real Estate Trust NO.10
KBFG Securities America Inc.
KB Securities Hong Kong Ltd.
KB SECURITEIS VIETNAM JOINT STOCK COMPANY
Able NS Co., Ltd and 64 others2
KB NA COMPASS Energy Private Special Asset Fund3
Hyundai Smart Index Alpha Securities Feeder Investment
Trust No.1
Hyundai Strong Korea Equity Trust No.1
Hyundai Kidzania Equity Feeder Trust No.1
Hyundai Value Plus Equity Feeder Trust No.1
Heungkuk Highclass Private Real Estate Trust No. 21
JB New Jersey Private Real Estate Investment Trust No. 1
Heungkuk Global Highclass Private Real Estate Trust No. 23
Hyundai Dynamic Mix Securities Feeder Investment Trust No.1
Hyundai Quant Long Short Securities Feeder Investment Trust No. 1
Hyundai Kon-tiki Specialized Privately Placed Fund No.1
DGB Private real estate Investment Trust No.8
Aquila Global Real Assets Fund No.1 LP
Industry
Capital investment
Capital investment
Capital investment
Capital investment
Capital investment
Capital investment
Capital investment
Capital investment
Investment advisory and securities dealing activities
Investment advisory and securities dealing activities
Investment advisory and securities dealing activities
Asset-backed securitization
Capital investment
Capital investment
Capital investment
Capital investment
Capital investment
Capital investment
Capital investment
Capital investment
Capital investment
Capital investment
Capital investment
Capital investment
Capital investment
KB Financial Group Annual Report 2019228

Investor
KB Insurance Co., Ltd.
Ownership interests (%)
100.00%
96.64%
99.61%
99.50%
54.84%
91.61%
99.79%
100.00%
100.00%
100.00%
100.00%
100.00%
100.00%
100.00%
100.00%
100.00%
70.00%
100.00%
100.00%
100.00%
41.67%
33.33%
80.00%
87.21%
50.00%
99.99%
99.79%
99.37%
99.82%
80.00%
99.36%
Location
Cayman islands
Korea
Korea
Korea
Korea
Korea
Korea
Korea
Korea
Korea
Korea
Korea
Korea
Korea
United States of America
China
Indonesia
Korea
Korea
Korea
Korea
Korea
Korea
Korea
Korea
Korea
Korea
Korea
Korea
Korea
Korea
Date of financial
statements
Dec. 31
Dec. 31
Dec. 31
Dec. 31
Dec. 31
Dec. 31
Dec. 31
Dec. 31
Dec. 31
Dec. 31
Dec. 31
Dec. 31
Dec. 31
Dec. 31
Dec. 31
Dec. 31
Dec. 31
Dec. 31
Dec. 31
Dec. 31
Dec. 31
Dec. 31
Dec. 31
Dec. 31
Dec. 31
Dec. 31
Dec. 31
Dec. 31
Dec. 31
Dec. 31
Dec. 31
Investee
Mangrove Feeder Fund
LB Ireland Private Real Estate Investment Trust 8
KTB Aircraft Private Investment Trust No.21-1
Pacific US Blackrock Private Placement Real Estate Fund No.15
Vestas Qualified Investors Private Real Estate Fund Investment Trust No.38
Hyundai Strong-small Corporate Trust[Stock]
Capstone US Professional Investment Private Fund #6
JB Dry Street Private Fund1
JB Australia108 Private Fund1
JB Forge Private Fund1
JB Hall Street Private Fund1
JB Margaret Street Private Fund1
LB UK Private Real Estate Investment Trust No.18
LB UK Private Real Estate Investment Trust No.19
Leading Insurance Services, Inc.
LIG Insurance (China) Co., Ltd.
PT. KB Insurance Indonesia
KB Claims Survey & Adjusting
KB Sonbo CNS
KB Golden Life Care Co., Ltd.
KB AMP Infra Private Special Asset Fund 1(FoFs) 3
KB Muni bond Private Securities Fund 1(USD)(bond)3
KB CHILE SOLAR FUND
Meritz Private Specific Real Estate Fund 1-2
KB Global Private Real Estate Debt Fund 13
Hana Landchip Real estate Private Fund 58th
Hyundai Power Professional Investment Type Private Investment Fund No.4
KB U.S. LongShort Private Securities Fund 1
Hyundai Infra Professional Investment Type Private Investment Trust No.5
KB SAUDI SEPCO II Private Special Asset Fund
Meritz Private Real Estate Fund 8
Industry
Capital investment
Capital investment
Capital investment
Capital investment
Capital investment
Capital investment
Capital investment
Capital investment
Capital investment
Capital investment
Capital investment
Capital investment
Capital investment
Capital investment
Management service
Non-life insurance
Non-life insurance
Claim service
Management service
Service
Capital investment
Capital investment
Capital investment
Capital investment
Capital investment
Financial investment
Financial investment
Financial investment
Financial investment
Financial investment
Financial investment
Financial Section 229

Investor
KB Kookmin Card Co., Ltd.
KB Asset Management Co., Ltd.
Ownership interests (%)
99.98%
99.25%
99.80%
99.08%
98.36%
57.14%
47.37%
36.12%
99.62%
90.00%
0.50%
100.00%
100.00%
88.00%
100.00%
36.56%
71.16%
52.51%
97.62%
83.69%
99.49%
56.94%
53.80%
37.11%
50.36%
Location
Korea
Korea
Korea
Korea
Korea
Korea
Korea
Korea
Korea
Cambodia
Korea
Korea
China
Korea
Singapore
Korea
Korea
Korea
Korea
Korea
Korea
Korea
Korea
Korea
Korea
Date of financial
statements
Dec. 31
Dec. 31
Dec. 31
Dec. 31
Dec. 31
Dec. 31
Dec. 31
Dec. 31
Dec. 31
Dec. 31
Dec. 31
Dec. 31
Dec. 31
Dec. 31
Dec. 31
Dec. 31
Dec. 31
Dec. 31
Dec. 31
Dec. 31
Dec. 31
Dec. 31
Dec. 31
Dec. 31
Dec. 31
Investee
Hyundai Star Private Real Estate Investment Trust No. 14
Vogo debt strategy private real estate fund VII
KORAMCO Europe Debt Strategy Private Real-Estate Fund 2nd
KB Peru Transmission Facility Investment Private Fund
KB Global Private Real Estate Debt Fund 2
KB Europe Private Real Estate Debt Fund 1
KB AU Infigen Energy Private Special Asset Fund 23
KB North American Loan
Specialty Private Real Estate Investment Trust 3rd3
Multi Asset Global Private Debt Fund 6
KB DAEHAN SPECIALIZED BANK PLC.
KB Kookmin Card 3rd Securitiza
tion Co., Ltd. and 3 others2
Heungkuk Life Insurance Money
Market Trust
KBAM Shanghai Advisory Services Co.,Ltd
KB Star Office Private Real Estate Feeder fund 3-2
KB Asset Management Singa pore Pte, Ltd.
KB Global Multiasset Income Securities Feeder Fund(Bond Mixed-FoFs)3
KB Active Investor Securities Investment Trust(Derivatives Mixed)
KB G2 Plus Korea Securities Fund(Equity)
KB Hedge Fund Solution Mixed Asset Fund(FoFs)
KB OCIO Global Asset Allocation Private Fund 1
KB Global Big data Research Securities Feeder Fund(Equity)(H)
KB Long-term Total Return Performance Fee Securities Investment Trust(Equity-mixed)
KB GLOBAL ESG SECURITIES FEEDER FUND(USD)(EQUITY)
KB Star Office Private Real Estate Investment Trust 53
KB Global Core REITs Real Estate Self-Investment Trust (H) C-F
Industry
Financial investment
Financial investment
Capital investment
Capital investment
Capital investment
Capital investment
Capital investment
Capital investment
Capital investment
Banking
Asset-backed securitization
Trust asset management
General advisory
Capital investment
Collective investment
Capital investment
Capital investment
Capital investment
Capital investment
Capital investment
Capital investment
Capital investment
Capital investment
Capital investment
Capital investment
KB Financial Group Annual Report 2019230

Investor
KB Investment Co., Ltd.
Kookmin Bank, KB Investment Co., Ltd.
Kookmin Bank, KB Securities Co., Ltd., KB Insurance Co., Ltd.,
Kookmin Bank, KB Securities Co., Ltd., KB Insurance Co., Ltd.,
Kookmin Bank, KB Insurance Co., Ltd., KB life Insurance Co., Ltd., KB Investment Co., Ltd.
Kookmin Bank, KB Securities Co., Ltd., KB Insurance Co., Ltd., KB Kookmin Card Co.,
Ltd., KB Capital Co.,
Ltd., KB Life Insurance Co., Ltd..
Kookmin Bank, KB Investment Co., Ltd., KB Capital Co., Ltd.
Kookmin Bank, KB Insurance Co., Ltd., KB Investment Co., Ltd., KB Capital Co., Ltd.
Ownership interests (%)
85.52%
33.66%
79.73%
45.26%
43.33%
33.33%
20.00%
40.00%
21.00%
20.00%
22.50%
32.30%
100.00%
62.50%
34.00%
45.46%
45.46%
100.00%
100.00%
75.00%
62.51%
Location
Korea
Korea
Korea
Korea
Korea
Korea
Korea
Korea
Korea
Korea
Korea
Korea
Korea
Korea
Korea
Korea
Korea
Korea
Korea
Korea
Korea
Date of financial
statements
Dec. 31
Dec. 31
Dec. 31
Dec. 31
Dec. 31
Dec. 31
Dec. 31
Dec. 31
Dec. 31
Dec. 31
Dec. 31
Dec. 31
Dec. 31
Dec. 31
Dec. 31
Dec. 31
Dec. 31
Dec. 31
Dec. 31
Dec. 31
Dec. 31
Investee
KB Global Core REITs Real Estate Self-Investment Trust (UH) C-F
KB Global Alpha Opportunity Securities Investor Trust (Mixed-Redirect)3
KB Best More Dream Mixed Assets Self-Investment Trust
KB Korea Equity EMP Solution Securities Fund(Equity-FoFs)3
2011 KIF-KB IT Venture Fund4
KoFC-KB Young Pioneer 1st Fund4
KB NEW CONTENTS Venture Fund4
KB Young Pioneer 3.0 Venture Fund4
KB Pre IPO Secondary Venture Fund 24
KB Contents Panda iMBC Contents Venture Fund4
KB Culture & Global Digital Contents Fund Limited partnership4
KB Gross Capital Fund4
KB12-1 Venture Investment
KB Start-up Creation Fund
KB Intellectual Property Fund4
KB Global Infra Private Special
Asset Fund No.53
KB Global Infra Private Special
Asset Fund No.63
KB High-tech Company
Investment Fund
KB digital innovation&growth New Technology Business Investment Fund
KB Intellectual Property Fund 2
KB Digital Innovation Investment
Fund Limited partnership
Industry
Capital investment
Capital investment
Capital investment
Capital investment
Capital investment
Capital investment
Capital investment
Capital investment
Capital investment
Capital investment
Capital investment
Capital investment
Capital investment
Capital investment
Capital investment
Capital investment
Capital investment
Capital investment
Capital investment
Capital investment
Capital investment
Financial Section 231

Investor
Kookmin Bank, KB Securities Co., Ltd., KB Insurance Co., Ltd., KB Kookmin Card Co., Ltd., KB Capital Co., Ltd., KB Investment Co., Ltd.
Kookmin Bank, KB Securities Co., Ltd., KB Life Insurance Co., Ltd., KB real estimate trust co., Ltd.
Kookmin Bank, KB Insurance Co., Ltd.
Kookmin Bank, KB Insurance Co., Ltd.,
Kookmin Bank, KB Insurance Co., Ltd.,
Kookmin Bank, KB Insurance Co., Ltd.
Kookmin Bank, KB Insurance Co., Ltd., KB life Insurance Co., Ltd.
Kookmin Bank, KB Insurance Co., Ltd., KB life Insurance Co., Ltd.
Kookmin Bank, KB Insurance Co., Ltd., KB life Insurance Co., Ltd.
Kookmin Bank, KB Insurance Co., Ltd., KB life Insurance Co., Ltd., KB Asset Management Co., Ltd.
Kookmin Bank, KB life Insurance Co., Ltd.,
Kookmin Bank, KB Insurance Co., Ltd., KB Asset Management Co., Ltd.
Kookmin Bank, KB Securities Co., Ltd.
Kookmin Bank, KB Securities Co., Ltd., KB Insurance Co., Ltd., KB life Insurance Co., Ltd. KB Asset Management Co., Ltd.
KB Securities Co., Ltd., KB Investment Co., Ltd.
Ownership interests (%)
100.00%
100.00%
46.36%
37.59%
100%
25.33%
46.00%
37.39%
100.00%
100.00%
40.74%
51.96%
100.00%
77.30%
46.88%
Location
Korea
Korea
Korea
Korea
Korea
Korea
Korea
Korea
Korea
Korea
Korea
Korea
Korea
Korea
Korea
Date of financial
statements
Dec. 31
Dec. 31
Dec. 31
Dec. 31
Dec. 31
Dec. 31
Dec. 31
Dec. 31
Dec. 31
Dec. 31
Dec. 31
Dec. 31
Dec. 31
Dec. 31
Dec. 31
Investee
KB Global Platform Fund
KB Wise Star Private Real Estate Feeder Fund 1st.
Hanbando BTL Private Special Asset Fund 1st3
KB KBSTAR Mid-Long Term KTB Active ETF3
KOREIT BIEN Specialized Private Equity Private Investment Trust No. 1
KB Mezzanine Private Security Investment Trust No.33
KB Hope Sharing BTL Private Special Asset3
KB Senior Loan Private Fund3
KB New Renewable Energy Private Special Asset Fund 1
KB Core Blind Private Estate Fund 1st
KB Mezzanine Private Security Investment Trust No.23
KB Star Office Private Real Estate Investment Trust 4
Meritz Private Real Estate Fund 9-2
KB Global Core Bond Securities Fund Master Fund(Bond)
KB KONEX Market Vitalization Fund4
Industry
Capital investment
Investment trust
Capital investment
Capital investment
Capital investment
Capital investment
Capital investment
Capital investment
Capital investment
Capital investment
Capital investment
Capital investment
Capital investment
Capital investment
Capital investment
KB Financial Group Annual Report 2019232
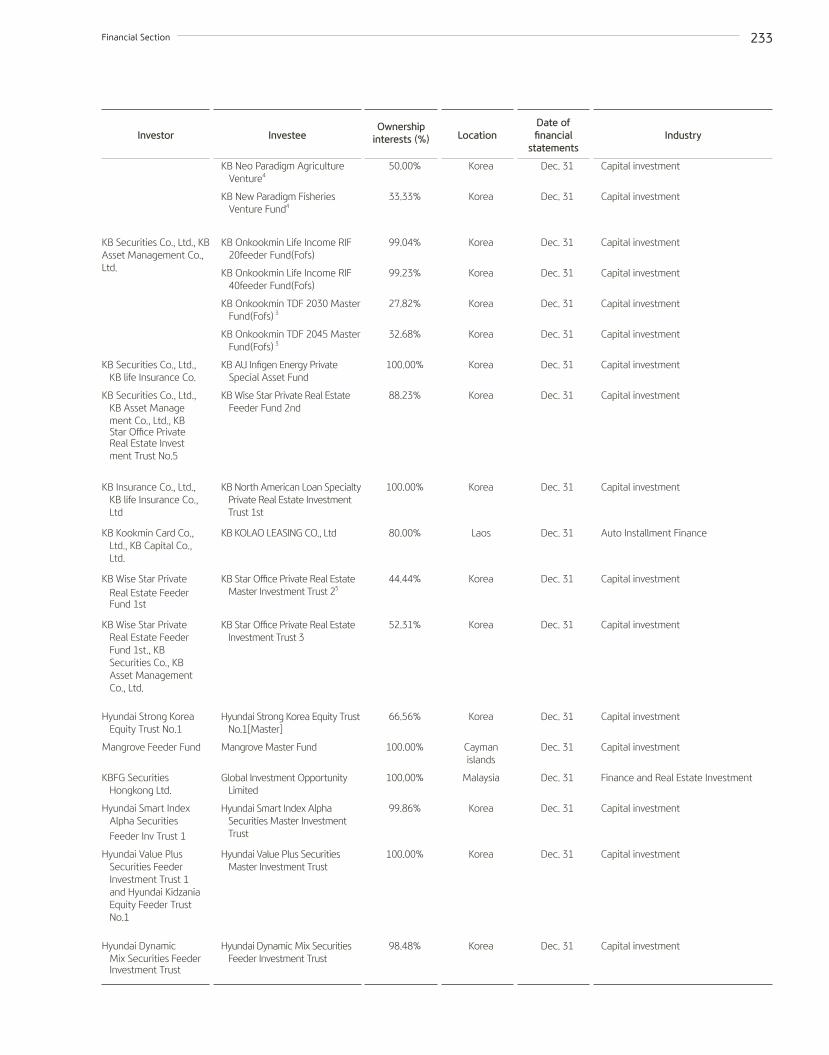
Investor
KB Securities Co., Ltd., KB Asset Management Co., Ltd.
KB Securities Co., Ltd., KB life Insurance Co.
KB Securities Co., Ltd., KB Asset Manage ment Co., Ltd., KB Star Office Private Real Estate Invest ment Trust No.5
KB Insurance Co., Ltd., KB life Insurance Co., Ltd
KB Kookmin Card Co., Ltd., KB Capital Co., Ltd.
KB Wise Star Private Real Estate Feeder Fund 1st
KB Wise Star Private Real Estate Feeder Fund 1st., KB Securities Co., KB Asset Management Co., Ltd.
Hyundai Strong Korea Equity Trust No.1
Mangrove Feeder Fund
KBFG Securities Hongkong Ltd.
Hyundai Smart Index Alpha Securities
Feeder Inv Trust 1
Hyundai Value Plus Securities Feeder Investment Trust 1 and Hyundai Kidzania Equity Feeder Trust No.1
Hyundai Dynamic Mix Securities Feeder Investment Trust
Ownership interests (%)
50.00%
33.33%
99.04%
99.23%
27.82%
32.68%
100.00%
88.23%
100.00%
80.00%
44.44%
52.31%
66.56%
100.00%
100.00%
99.86%
100.00%
98.48%
Location
Korea
Korea
Korea
Korea
Korea
Korea
Korea
Korea
Korea
Laos
Korea
Korea
Korea
Caymanislands
Malaysia
Korea
Korea
Korea
Date of financial
statements
Dec. 31
Dec. 31
Dec. 31
Dec. 31
Dec. 31
Dec. 31
Dec. 31
Dec. 31
Dec. 31
Dec. 31
Dec. 31
Dec. 31
Dec. 31
Dec. 31
Dec. 31
Dec. 31
Dec. 31
Dec. 31
Investee
KB Neo Paradigm Agriculture
Venture4
KB New Paradigm Fisheries Venture Fund4
KB Onkookmin Life Income RIF 20feeder Fund(Fofs)
KB Onkookmin Life Income RIF 40feeder Fund(Fofs)
KB Onkookmin TDF 2030 Master Fund(Fofs) 3
KB Onkookmin TDF 2045 Master Fund(Fofs) 3
KB AU Infigen Energy Private Special Asset Fund
KB Wise Star Private Real Estate Feeder Fund 2nd
KB North American Loan Specialty Private Real Estate Investment Trust 1st
KB KOLAO LEASING CO., Ltd
KB Star Office Private Real Estate Master Investment Trust 25
KB Star Office Private Real Estate Investment Trust 3
Hyundai Strong Korea Equity Trust No.1[Master]
Mangrove Master Fund
Global Investment Opportunity Limited
Hyundai Smart Index Alpha Securities Master Investment Trust
Hyundai Value Plus Securities Master Investment Trust
Hyundai Dynamic Mix Securities Feeder Investment Trust
Industry
Capital investment
Capital investment
Capital investment
Capital investment
Capital investment
Capital investment
Capital investment
Capital investment
Capital investment
Auto Installment Finance
Capital investment
Capital investment
Capital investment
Capital investment
Finance and Real Estate Investment
Capital investment
Capital investment
Capital investment
Financial Section 233

Investor
Hyundai Quant Long Short Securities Feeder Investment Trust 1
Aquila Global Real Assets Fund No.1 LP
AGRAF Real Estate No.1, Senningerberg
AGRAF Real Estate Holding No.1, Senningerberg
AGRAF Real Estate Holding No.1, Senningerberg
AGRAF Real Estate Holding No.1, Senningerberg
JB New Jersey Private Real Estate Investment Trust No. 1
ABLE NJ DSM INVESTMENT REIT
Heungkuk Global Highclass Private Real
Estate Trust 23
HYUNDAI ABLE
INVESTMENT REIT
LB Ireland Private Real Estate Investment Trust 8
KB Global Multiasset Income Securities Feeder Fund(Bond Mixed-FoFs)
KB Onkookmin Life Income RIF 20feeder Fund(Fofs)
KB Onkookmin Life Income RIF 40feeder Fund(Fofs)
Mirae Asset Triumph Global Privately placed feeder Investment Trust 1
Mirae Asset Triumph Global Privately placed feeder Investment Trust 1
KB Global Core Bond Securities feeder Fund(Bond)
KB Global Big data Research Securities Master Fund(Equity)(H)
Ownership interests (%)
100.00%
100.00%
100.00%
100.00%
100.00%
100.00%
99.18%
100.00%
99.90%
100.00%
100.00%
87.00%
86.00%
86.00%
100.00%
100.00%
100.00%
100.00%
Location
Korea
Luxemburg
Luxemburg
Germany
Germany
Germany
United States of America
United States of America
United States of America
United States of America
Ireland
Korea
Korea
Korea
Korea
Korea
Korea
Korea
Date of financial
statements
Dec. 31
Dec. 31
Dec. 31
Dec. 31
Dec. 31
Dec. 31
Dec. 31
Dec. 31
Dec. 31
Dec. 31
Dec. 31
Dec. 31
Dec. 31
Dec. 31
Dec. 31
Dec. 31
Dec. 31
Dec. 31
Investee
Hyundai Quant Long Short Securities Master Investment Trust
AGRAF Real Estate No.1, Senningerberg
AGRAF Real Estate Holding No.1, Senningerberg
Vierte CasaLog GmbH & Co. KG
HD1 Grundstucksgesellschaft mbH & Co. KG
Sechste Casalog KG
ABLE NJ DSM INVESTMENT REIT
ABLE NJ DSM, LLC
HYUNDAI ABLE INVESTMENT REIT
HYUNDAI ABLE PATRIOTS PARK, LLC
BECKETT ACQUISITION LIMITED
KB Global Multiasset Income Securities Master Fund(Bond Mixed-FoFs)
KB Onkookmin Life Income RIF 20 Master Fund(Fofs)
KB Onkookmin Life Income RIF 40 Master Fund(Fofs)
Mirae Asset Triumph Global Privately placed Master Investment Trust 1
Mirae Asset Triumph Global Privately placed Master Investment Trust 2
KB Global Core Bond Securities Master Fund(Bond)
KB Global Big data Research Securities Master Fund(Equity)(H)
Industry
Capital investment
Asset-backed securitization
Asset-backed securitization
Real estate investment
Real estate investment
Real estate investment
Real estate investment
Real estate investment
Real estate investment
Real estate investment
Real estate investment
Capital investment
Capital investment
Capital investment
Capital investment
Capital investment
Capital investment
Capital investment
KB Financial Group Annual Report 2019234

Investor
KB Global Good Investment ESG Securities feeder Fund(Equity)(H), KB Best More Dream Mixed Assets Self- Investment Trust
KB Global Core REITs Real Estate Self- Investment Trust (Redirect) (H), KB Global Core REITs Real Estate Self- Investment Trust (Redirect) (UH) C-F, KB Best More Dream Mixed Assets Self-Investment Trust
KB Global Alpha Opportunity Securities Investor Trust (Mixed-Redirect), KB Best More Dream Mixed Assets Self- Investment Trust
KB Hedge Fund Solution Mixed Asset Parent Investment Trust (Private Investment Indirect), KB Best More Dream Mixed Assets Self-Investment Trust
KB Wise Star Private Real Estate Feeder Fund 1st, KB Wise Star Private Real
Estate Feeder Fund 2nd
KB Core Blind Private Estate Fund 1st
Kookmin Bank
Vestas Qualified Investors Private Real Estate Fund Investment Trust No.38
Lumen International Developments
LB UK Private Real Estate Investment Trust No.18, etc
LB UK Private Real Estate Investment Trust No.18, etc
LB UK Private Real Estate Investment Trust No.18, etc
Hillswood Holding Property Unit Trust, etc
Hyundai Strong-small Corporate Trust No.1
Ownership interests (%)
100.00%
100.00%
100.00%
100.00%
100.00%
46.90%
-
100.00%
100.00%
100.00%
100.00%
100.00%
100.00%
80.43%
Location
Korea
Korea
Korea
Korea
Korea
Korea
Korea
Luxemburg
Luxemburg
Jersey
Jersey
Jersey
Jersey
Korea
Date of financial
statements
Dec. 31
Dec. 31
Dec. 31
Dec. 31
Dec. 31
Dec. 31
Dec. 31
Dec. 31
Dec. 31
Dec. 31
Dec. 31
Dec. 31
Dec. 31
Dec. 31
Investee
KB GLOBAL ESG SECURITIES FEEDER FUND(USD)
KB Global Core REITs Real Estate Investment Fund (Indirect)
KB Global Alpha Opportunity Securities Parent Investment Trust (Mixed-Redirect)
KB Hedge Fund Solution Mixed Asset Parent Investment Trust (Private Investment Indirect)
KB Wise Star Jongno Tower Real Estate Master Fund
KB Wise Star Private Real Estate Feeder Fund 3rd3
Personal pension trusts and 10 other trusts1
Lumen International Developments
VREF Shaftesbury ScSp
Hillswood Finco Ltd.
Hillswood Holdings Ltd.
Hillswood Holding Property Unit Trust
Hillswood Property Unit Trust
Hyundai Strong-small Corporate Master Trust
Industry
Capital investment
Capital investment
Capital investment
Capital investment
Capital investment
Capital investment
Trust
Capital investment
Capital investment
Capital investment
Capital investment
Capital investment
Capital investment
Capital investment
1 The Group controls the trust because it has power that determines the management performance over the trust and is exposed to variable returns to absorb losses through the guarantees of payment of principal, or payment of principal and fixed rate of return.
2 Although the Group holds less than a majority of the investee’s voting rights, the Group controls these investees as it has power over relevant activities in case of default; is significantly exposed to variable returns by providing lines of credit or ABCP purchase commitments or due to acquisition of subordinated debt; and has ability to affect those returns through its power.
3 Although the Group holds less than a majority of the investee’s voting rights, the Group controls the investee as it has power over relevant activities by managing the fund; has significant percentage of ownership; is significantly exposed to variable returns which is affected by the performance of the investees; and has ability to affect the performance through its power.
4 Although the Group holds less than a majority of the investee’s voting rights, the Group controls the investee as it has power over relevant activities by taking the role of an operating manager and it is significantly exposed to variable returns which is affected by the performance of the investees, and has ability to affect the performance through its power.
5 Although the Group holds less than a majority of the investee’s voting rights, the Group participated directly in establishment of this entity and has power over relevant activities, and is significantly exposed to variable returns which is affected by the performance of the investee, and has ability to affect the performance through its power. Accordingly the Group has control over the investee.
6 The Group changed Kookmin Bank Int'l Ltd. (London) to Kookmin Bank London Branch on May 16, 2018, and this event is categorized as business combination of entities under common control. The assets and liabilities acquired under business combinations under common control are recognized at the carrying amounts in the consolidated financial statements of the Group. The transferred assets and liabilities due to this business combination are ₩ 480,161 million and ₩ 480,023 million, respectively.
Structured companies that hold more than half of their ownership percentage but do not have the strength to related activities in accordance with
agreements with trust and other related parties are excluded from the consolidation.
Financial Section 235

Kookmin Bank1
KB Securities Co., Ltd.1,2
KB Insurance Co., Ltd.1,2
KB Kookmin Card Co., Ltd.1
KB Asset Management Co., Ltd.1
KB Capital Co., Ltd.1
KB Life Insurance Co., Ltd.1, 2
KB Real Estate Trust Co., Ltd.KB Savings Bank Co., Ltd.KB Investment Co., Ltd.1
KB Data System Co., Ltd.KB Credit Information Co., Ltd.
Kookmin Bank1
KB Securities Co., Ltd.1,2
KB Insurance Co., Ltd.1,2
KB Kookmin Card Co., Ltd.1
KB Life Insurance Co., Ltd.1
KB Asset Management Co., Ltd.1
KB Capital Co., Ltd.1,2
KB Savings Bank Co., Ltd.KB Real Estate Trust Co., Ltd.KB Investment Co., Ltd.1
KB Credit Information Co., Ltd.KB Data System Co., Ltd.
Total comprehensive
income (loss) for the year
\ 2,428,154261,639366,362306,251
48,490115,524
63,10761,67215,43311,310
4,282(337)
Total comprehensive
income (loss) for the year
\ 2,186,979204,903317,067261,667
25,06240,154
111,75810,83246,81314,529
951,705
Profit (loss) for the year
\ 2,439,079257,893234,327316,546
48,899117,028
15,96361,71316,30111,311
4,664(256)
Profit (loss) for the year
\ 2,259,198178,850262,266286,599
14,82439,586
111,93911,01847,00414,532
1852,942
Operating
income
\ 20,817,4318,053,363
12,661,9273,102,186
148,780931,694
1,506,417119,899
92,43599,822
158,06738,278
Operating
income
\ 18,089,8856,667,005
11,977,6013,045,0391,305,231
130,027734,499
85,346114,660114,914
35,219131,374
Equity
\ 29,004,2334,684,6543,862,9084,064,919
195,2421,154,491
615,338292,806212,407214,751
20,69114,898
Equity
\ 26,667,8664,472,8693,495,8453,958,671
552,231146,752
1,000,401201,973235,834153,776
15,23516,409
Liabilities
\ 358,420,80543,131,85832,689,46018,925,195
114,77610,036,077
9,186,56785,132
1,148,625542,221
20,99912,936
Liabilities
\ 330,291,39240,613,42331,289,70616,570,280
9,128,148107,504
8,516,8381,186,871
57,229374,925
11,04123,788
Assets
\ 387,425,03847,816,51236,552,36822,990,114
310,01811,190,568
9,801,905377,938
1,361,032756,972
41,69027,834
Assets
\ 356,959,25845,086,29234,785,55120,528,951
9,680,379254,256
9,517,2391,388,844
293,063528,701
26,27640,197
2019
2018
(In millions of Korean won)
(In millions of Korean won)
The condensed financial information of major subsidiaries as of December 31, 2019 and 2018, and for the years ended December 31, 2019 and 2018, is as follows:
Nature of the risks associated with interests in consolidated structured entities
The terms of contractual arrangements to provide financial support to a consolidated structured entity
- The Group has provided payment guarantees of ₩ 3,498,818 million to KBD Tower 1st L.L.C. and other subsidiaries.
- The Group provides capital commitment to KB Wise Star Private Real Estate Feeder Fund 1st. and 24 other subsidiaries. The unexecuted amount of the investment
agreement is ₩ 592,435 million. Based on the capital commitment, the Group is subject to increase its investment upon the request of the asset management
company or the additional agreement among investors.
- The Group provides the guarantees of payment of principal, or principal and fixed rate of return in case the operating results of the trusts are less than the
guaranteed principal, or principal and fixed rate of return.
1 Financial information is based on its consolidated financial statements.2 The amount includes the fair value adjustments due to the merger.
KB Financial Group Annual Report 2019236

Changes in subsidiaries
The subsidiaries newly included in consolidation during the year ended December 31, 2019, are as follows:
The subsidiaries excluded from consolidation during the year ended December 31, 2019, are as follows:
Company
KBAM Shanghai Advisory Services Co.,Ltd and 38 others
KBH the 5th L.L.C and 70 others
KB New Renewable Energy Private Special
Asset Fund 1 and 15 others
KB Culture & Global Digital Contents Fund
Limited partnership and 2 others
Company
KH the 4th L.L.C and 59 others
KB Evergreen Private Securities Fund 98(Bond) and 6 others
Hyundai China Index Plus Securities Investment Trust No.1 and 13 others
KB Everyone TDF 2035 Securities Investment Trust - Bond Balanced-
Fund of Funds and 7 others
Nature
Structured financing
Investment funds
Trusts
Asset-backed securitization
Purpose
Granting PF loans and stocks to SOC
and real estate
Granting loans and stocks to ships/
aircrafts SPC
Project financing, such as mergers
and acquisitions
Investment in beneficiary certificates
Investment in PEF and partnerships
Management of financial trusts;
-Development trust
-Mortgage trust
-Management trust
-Disposal trust
-Distribution and management trust
-Other trusts
Early cash generation through
transfer of securitization assets
Fees earned as services to SPC,
such as providing lines of credit and
ABCP purchase commitments
Activity
Construction of SOC and real estate
Building ships/ construction and
purchase of aircrafts
Mergers and acquisitions
Management of fund assets
Payment of fund fees and allocation
of fund profits
Development, management, and
disposal of trusted real estate assets
Payment of trust fees and allocation
of trust profits.
Fulfillment of Asset-backed
securitization plan
Purchase and transfer of
securitization assets
Issuance and repayment of ABS and
ABCP
Method of Financing
Loan commitments through Credit Line,
providing lines of credit and investment
agreements
Sales of beneficiary certificate
instruments
Investment of managing partners and
limited partners
Distribution of trusted real estate assets
and financing of trust company
Public auction of trusted real estate
assets and financing of trust company
Issuance of ABS and ABCP based on
securitization assets
Description
Holds over than a majority of the ownership interests
Holds the power in the case of default and exposed to variable returns by providing
lines of credit, ABCP purchase commitments or acquiring subordinated debt
Holds the power to determine the operation of the trust and exposed to
variable returns by holding significant amount of ownership interests
The Group has a power over the investee as a general partner, is significantly
exposed to variable returns due to significant percentage of ownership.
Description
Lost the right of variable returnsdue to the releasing debt
Liquidation
Disposal
Ownership decrease
42. Unconsolidated Structured EntityThe nature, purpose and activities of the unconsolidated structured entities and how the structured entities are financed, are as follows:
Financial Section 237

Total assets of unconsolidated structured entityCarrying amount on financial statements
AssetsFinancial assets at fair value through profit or lossDerivative financial assetsLoans at amortized costFinancial investmentsInvestment in associates Other assets
LiabilitiesDepositsDerivative financial liabilitiesOther liabilities
Maximum exposure to loss1
Holding assetsPurchase and investment commitmentsUnused creditPayment guarantee and loan commitments
Methods of determining the maximum exposure to loss
Total
\ 335,743,075
12,384,1912,959
6,256,7815,166,578
352,488174,023
\ 24,337,020
\ 1,022,463228
17,609\ 1,040,300
\ 24,337,020
4,964,6042,613,432
2,424,263\ 34,339,319
Asset-backed securitization
and others
\ 99,012,931
2,405,2282,959
920,8635,166,578
-9,181
\ 8,504,809
\ 409,246228
16,169\ 425,643
\ 8,504,809
945,5981,927,902
600,664\ 11,978,973Providing lines of credit/ purchase commitments/ loan commitments and acceptances and guarantees
Trusts
\ 2,287,172
--
266,974--
93,613\ 360,587
\ ---
\ -
\ 360,587
-28,427
-\ 389,014Dividends by results trust: Total amount of trust exposure
Investment funds
\ 180,236,568
9,846,278-
293,221-
352,48869,353
\ 10,561,340
\ 90,131-
78\ 90,209
\ 10,561,340
3,980,3562,900
7,188\ 14,551,784Investments /loans and capital commitments
Structured financing
\ 54,206,404
132,685-
4,775,723--
1,876\ 4,910,284
\ 523,086-
1,362\ 524,448
\ 4,910,284
38,650654,203
1,816,411\ 7,419,548Loan commitments /investment agreements / purchase commitments and acceptances and guarantees
2019
(In millions of Korean won)
Details of scale of unconsolidated structured entities and nature of the risks associated with the Group’s interests in unconsolidated structured entities as of
December 31, 2019 and 2018, are as follows:
Total assets of unconsolidated structured entityCarrying amount on financial statements
AssetsFinancial assets at fair value through profit or lossDerivative financial assetsLoans at amortized costFinancial investmentsInvestment in associates Other assets
Total
\ 291,017,431
11,910,75427,883
5,048,8446,048,644
258,594176,994
\ 23,471,713
Asset-backed securitization
and others
\ 125,240,129
3,846,7254,089
635,8406,040,008
-17,046
\ 10,543,708
Trusts
\ 519,609
--
34,000--
109,357\ 143,357
Investment funds
\ 121,481,888
7,934,66223,794
391,6658,636
258,59448,872
\ 8,666,223
Structured financing
\ 43,775,805
129,367-
3,987,339--
1,719\ 4,118,425
2018
(In millions of Korean won)
KB Financial Group Annual Report 2019238
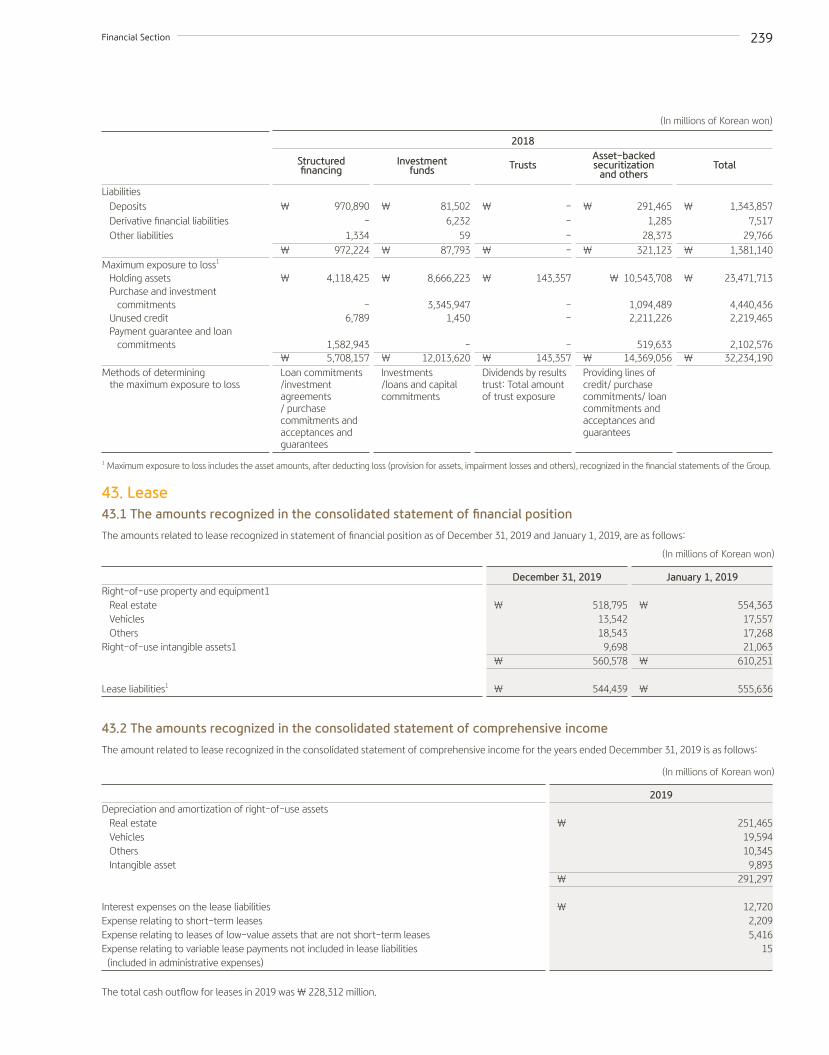
LiabilitiesDepositsDerivative financial liabilitiesOther liabilities
Maximum exposure to loss1
Holding assetsPurchase and investment commitmentsUnused creditPayment guarantee and loan commitments
Methods of determining the maximum exposure to loss
Total
\ 1,343,8577,517
29,766\ 1,381,140
\ 23,471,713
4,440,4362,219,465
2,102,576\ 32,234,190
Asset-backed securitization
and others
\ 291,4651,285
28,373\ 321,123
\ 10,543,708
1,094,4892,211,226
519,633\ 14,369,056Providing lines of credit/ purchase commitments/ loan commitments and acceptances and guarantees
Trusts
\ ---
\ -
\ 143,357
--
-\ 143,357Dividends by results trust: Total amount of trust exposure
Investment funds
\ 81,5026,232
59\ 87,793
\ 8,666,223
3,345,9471,450
-\ 12,013,620Investments /loans and capital commitments
Structured financing
\ 970,890-
1,334\ 972,224
\ 4,118,425
-6,789
1,582,943\ 5,708,157Loan commitments /investment agreements / purchase commitments and acceptances and guarantees
2018
(In millions of Korean won)
1 Maximum exposure to loss includes the asset amounts, after deducting loss (provision for assets, impairment losses and others), recognized in the financial statements of the Group.
43. Lease43.1 The amounts recognized in the consolidated statement of financial position
The amounts related to lease recognized in statement of financial position as of December 31, 2019 and January 1, 2019, are as follows:
43.2 The amounts recognized in the consolidated statement of comprehensive income
The amount related to lease recognized in the consolidated statement of comprehensive income for the years ended Decemmber 31, 2019 is as follows:
The total cash outflow for leases in 2019 was \ 228,312 million.
Right-of-use property and equipment1Real estateVehiclesOthers
Right-of-use intangible assets1
Lease liabilities1
Depreciation and amortization of right-of-use assetsReal estateVehiclesOthersIntangible asset
Interest expenses on the lease liabilitiesExpense relating to short-term leasesExpense relating to leases of low-value assets that are not short-term leasesExpense relating to variable lease payments not included in lease liabilities (included in administrative expenses)
January 1, 2019
\ 554,36317,55717,26821,063
\ 610,251
\ 555,636
2019
\ 251,46519,59410,345
9,893\ 291,297
\ 12,7202,2095,416
15
December 31, 2019
\ 518,79513,54218,543
9,698\ 560,578
\ 544,439
(In millions of Korean won)
(In millions of Korean won)
Financial Section 239

43.3 Finance lease - 2018
43.3.1 The Group as a finance lessee
The future minimum lease payments classified as a finance lease as at December 31, 2018 is as follows:
43.3.2 The Group as a finance lessor
Total lease investment and the present value of minimum lease payments as of December 31, 2019 and 2018, are as follows:
Unearned interest income of finance lease as of December 31, 2019 and 2018 is as follows:
Net carrying amount of finance lease assetsMinimum lease payment
Within 1 year
1-5 years
Present value of minimum lease paymentWithin 1 year
1-5 years
Total lease investmentNet lease investment
Present value of minimum lease payment
Present value of Non-guaranteed residual value
Unearned interest income
2018 \ 34,002
6,827
3,553
\ 10,380
6,705
3,456
\ 10,161
2019\ 1,740,085
938,624
639,075
1,577,699
\ 162,386
2018 \ 1,935,797
952,873
786,359
11,739,232
\ 196,565
(In millions of Korean won)
(In millions of Korean won)
Within 1 year
1-5 years
Later than 5 years
Within 1 year
1-5 years
Total lease investment\ 654,104
1,085,208
773
\ 1,740,085
Total lease investment\ 710,532
1,225,265
\ 1,935,797
Present value of minimum lease payment\ 367,937
569,939
748
\ 938,624
Present value of minimum lease payment\ 387,721
565,152
\ 952,873
2019
2018
(In millions of Korean won)
(In millions of Korean won)
KB Financial Group Annual Report 2019240

43.4 Operating lease
43.4.1 The Group as a operating lessee
The future minimum lease payments arising from the non-cancellable lease contracts as of December 31 2018, are as follows:
43.4.2 The Group as a operating lessor
The future minimum lease receipts arising from the non-cancellable lease contracts as of December 31, 2019 and 2018, are as follows:
The lease payment reflected in profit or loss for the years ended December 31, 2018, is as follows:
44. Related Party TransactionsProfit and loss arising from transactions with related parties for the years ended December 31, 2019 and 2018, are as follows:
Minimum lease paymentWithin 1 year
1-5 years
Over 5 years
Minimum sublease payment
Lease payment reflected in profit or lossMinimum lease payment
Sublease payment
2018
\ 179,384
299,900
111,906
\ 591,190
\ (6,561)
2018
\ 221,305
(1,804)
\ 219,501
(In millions of Korean won)
(In millions of Korean won)
Associates and joint venturesBalhae Infrastructure Fund
Korea Credit Bureau Co., Ltd.
KoFC KBIC Frontier Champ 2010-5(PEF) 1
KB GwS Private Securities Investment Trust
Incheon Bridge Co., Ltd.
Fee and commission income
Interest expense
Fee and commission income
Insurance income
Fee and commission expense
Other operating expense
Fee and commission income
Fee and commission income
Interest income
Interest expense
Fee and commission income
Fee and commission expense
2019
\ 6,743
21
1,056
3
2,541
-
-
851
8,612
483
-
7
2018
\ 6,691
127
1,194
-
1,909
4
197
851
9,426
296
9
2
(In millions of Korean won)
Minimum lease receiptsWithin 1 year
1-5 years
Over 5 years
2019
\ 577,490
1,432,354
682,165
\ 2,692,009
2018
\ 304,204
985,097
280,084
\ 1,569,385
(In millions of Korean won)
Financial Section 241

KoFC POSCO HANHWA KB Shared Growth Private Equity Fund No. 2
Aju Good Technology Venture Fund
KB Star Office Private Real Estate Investment Trust No.1
RAND Bio Science Co., Ltd.
Inno Lending Co., Ltd. 1
SY Auto Capital Co., Ltd.
Food Factory Co., Ltd.
KB Pre IPO Secondary Venture Fund 1st
Builton Co., Ltd. 1
KB Private Equity Fund Ⅲ
Wise Asset Management Co., Ltd.
Acts Co., Ltd.
Dongjo Co., Ltd.
A-PRO Co., Ltd.
POSCO-KB Shipbuilding Fund
Dae-A Leisure Co., Ltd.
Insurance income
Gains on financial assets/liabilities at fair value through profit or loss
Reversal for credit losses
Provision for credit losses
Fee and commission income
Interest expense
Interest income
Interest expense
Fee and commission income
Interest expense
Other non-operating expense
Fee and commission income
Interest income
Interest expense
Fee and commission income
Fee and commission expense
Insurance income
Other operating income
Other operating expense
Reversal for credit losses
Provision for credit losses
Interest income
Insurance income
Fee and commission expense
Gains on financial assets/liabilities at fair value through profit or loss
Reversal for credit losses
Provision for credit losses
Interest expense
Fee and commission income
Interest income
Insurance income
Losses on financial assets/liabilities at fair value through profit or loss
Fee and commission income
Interest expense
Interest income
Insurance income
Gains on financial assets/liabilities at fair value through profit or loss
Losses on financial assets/liabilities at fair value through profit or loss
Other non-operating expense
Reversal for credit losses
Insurance income
Interest income
Interest expense
Fee and commission expense
Insurance income
Fee and commission income
Interest expense
Interest expense
2019 284
4,975
5
1
178
22
370
208
435
5
843
-
1,016
1
34
389
32
689
288
13
-
41
4
12
60
-
1
7
110
1
1
-
480
2
1
1
30
-
-
-
2
19
4
17
4
490
-
8
2018 365
2,655
6
1
210
30
370
93
435
3
-
1
1,279
-
73
840
33
621
415
-
14
9
5
1
30
1
1
27
110
4
2
1
521
9
-
2
-
1,851
1,246
31
2
-
1
-
5
490
81
9
(In millions of Korean won)
KB Financial Group Annual Report 2019242

Paycoms Co., Ltd.
Bungaejangter Inc. 1
Big Dipper Co., Ltd.
KB-KDBC New Technology Business Investment Fund
KBTS Technology Venture Private Equity Fund
KB-SJ Tourism Venture Fund
JLK INSPECTION Inc. 1
TESTIAN Inc.1
Rainist Co., Ltd.
IWON ALLOY CO.,LTD.
RMGP Bio-Pharma Investment Fund, L.P.
Hasys.
KB-Brain KOSDAQ Scale-up New Technology
Business Investment Fund
Spark Biopharma, Inc1.
KB No.8 Special Purpose Acquisition Company1
KB No.9 Special Purpose Acquisition Company1
KB No.10 Special Purpose Acquisition Company1
KB No.11 Special Purpose Acquisition Company1
KB No.17 Special Purpose Acquisition Company
KB No.18 Special Purpose Acquisition Company
Interest income
Insurance income
Gains on financial assets/liabilities at fair value through profit or loss
Interest income
Reversal for credit losses
Interest expense
Fee and commission income
Fee and commission income
Fee and commission income
Interest income
Interest expense
Interest income
Gains on financial assets/liabilities at fair value through profit or loss
Fee and commission income
Interest expense
Insurance income
Other non-operating income
Gains on financial assets/liabilities at fair value through profit or loss
Losses on financial assets/liabilities at fair value through profit or loss
Gains on financial assets/liabilities at fair value through profit or loss
Losses on financial assets/liabilities at fair value through profit or loss
Insurance income
Losses on financial assets/liabilities at fair value through profit or loss
Interest expense
Fee and commission income
Interest expense
Interest expense
Losses on financial assets/liabilities at fair value through profit or loss
Interest expense
Losses on financial assets/liabilities at fair value through profit or loss
Gains on financial assets/liabilities at fair value through profit or loss
Interest expense
Gains on financial assets/liabilities at fair value through profit or loss
Interest expense
Gains on financial assets/liabilities at fair value through profit or loss
Fee and commission income
Gains on financial assets/liabilities at fair value through profit or loss
Interest expense
Fee and commission income
Gains on financial assets/liabilities at fair value through profit or loss
Interest expense
2019 10
1
125
-
-
58
449
730
422
-
1
3
-
39
-
2
33
947
2,120
136
-
50
72
89
735
59
-
-
(23)
-
-
18
3,066
9
118
175
1,384
28
263
1,898
28
2018 10
1
125
60
2
39
322
305
314
6
-
4
83
-
2
1
10
-
-
-
136
4
-
21
108
25
17
2,330
43
2,256
48
30
121
12
56
-
-
-
-
-
-
(In millions of Korean won)
Financial Section 243

KB No.19 Special Purpose Acquisition Company
KB No.20 Special Purpose Acquisition Company
KB SPROTT Renewable Private Equity FundⅠ
KB-Stonebridge Secondary Private Equity Fund1
KOSESEUJITO CO., LTD
CWhy Inc
Stratio, Inc.
NEXOLON CO.,LTD.1
CellinCells Co., Ltd
Bomapp Inc.
KB Social Impact Investment Association
KB-Solidus Global Healthcare Fund
BNF Corporation Ltd.
KB Cape No.1 Private Equity Fund
ALS Co., Ltd.1
Hyundai-Tongyang Agrifood Private Equity Fund 1
Keystone-Hyundai Securities No. 1 Private
Equity Fund
MJT&I Co., Ltd.
Doosung Metal Co., Ltd.
OtherRetirement pension
Fee and commission income
Gains on financial assets/liabilities at fair value through profit or loss
Interest expense
Interest expense
Fee and commission income
Fee and commission income
Losses on financial assets/liabilities at fair value through profit or loss
Losses on financial assets/liabilities at fair value through profit or loss
Insurance income
Interest expense
Interest expense
Interest expense
Interest expense
Insurance income
Fee and commission income
Fee and commission income
Interest income
Gains on financial assets/liabilities at fair value through profit or loss
Provision for credit losses
Fee and commission income
Interest income
Fee and commission income
Fee and commission income
Insurance income
Insurance income
Fee and commission income
Interest expense
2019 150
1,044
8
3
490
1,444
32
5
3
1
2
19
1
1
121
81
7
158
1
97
194
-
90
1
-
939
4
2018 -
-
-
-
-
-
-
-
-
-
-
-
-
-
-
-
-
-
-
-
-
151
116
-
1
876
3
(In millions of Korean won)
1 Excluded from the Group’s related party as of December 31, 2019.
Meanwhile, the Group purchased installment financial assets from SY Auto Capital Co., Ltd. amounts to ₩ 1,393,346 million and ₩ 881,502 million for the
years ended December 31, 2019 and 2018.
KB Financial Group Annual Report 2019244

Associates and joint venturesBalhae Infrastructure FundKorea Credit Bureau Co., Ltd.
KB GwS Private Securities Investment TrustIncheon Bridge Co., Ltd.
KoFC POSCO HANHWA KB Shared Growth Private Equity Fund No. 2
Jungdo Co., Ltd.Dongjo Co., Ltd.Dae-A Leisure Co., Ltd.
Aju Good Technology Venture Fund
Doosung Metal Co., Ltd.KB Star Office Private Real Estate Investment Trust No.1
KBTS Technology Venture Private Equity Fund
KB-Brain KOSDAQ Scale-up New Technology Business Investment Fund
KB-Stonebridge Secondary Private Equity Fund
KB IGen Private Equity Fund No.1KB Cape No.1 Private Equity Fund
RAND Bio Science Co., Ltd.
SY Auto Capital Co., Ltd.
Food Factory Co., Ltd.
Other assetsLoans at amortized cost (Gross amount)DepositsProvisionsInsurance contract liabilitiesOther liabilitiesOther assetsFinancial assets at fair value through profit or loss
Loans at amortized cost (Gross amount)Allowances for loan lossesOther assetsDepositsProvisionsInsurance contract liabilitiesOther liabilitiesOther assets
DepositsInsurance contract liabilitiesDepositsOther liabilitiesDepositsOther liabilitiesDepositsLoans at amortized cost (Gross amount)Allowances for loan lossesOther assetsDepositsOther liabilitiesFinancial assets at fair value through profit or loss
Financial assets at fair value through profit or loss
DepositsOther liabilitiesFinancial assets at fair value through profit or loss
DepositsFinancial assets at fair value through profit or loss
DepositsLoans at amortized cost (Gross amount)Loans at amortized cost (Gross amount)Allowances for loan lossesOther assetsDepositsProvisionsInsurance contract liabilitiesOther liabilitiesFinancial assets at fair value through profit or loss
Loans at amortized cost (Gross amount)| Allowances for loan losses Other assets
2019
\ 1,71843
17,9661 2 -
64137,857
147,70712
52045,447
10108346
8941
75314
5,4562-
10,0004
1368,293
663,540
2,678
13,1184
713
1472,000
4,4521
41,9904
638
131370
590
1,992 2 1
2018
\ 1,708 22
15,674 - -
98 641
32,882
158,206 15
736 43,666
10 113
24
90 4 2
1,229 7
6,439 2 3
10,000 4
136 7,946
58 -
-
18,813 7 -
148 -
232 1
48,356 18 94
5 11
6 102 530
200
1 1
(In millions of Korean won)
Details of receivables and payables, and related allowances for loan losses arising from the related party transactions as of December 31, 2019 and 2018,
are as follows:
Financial Section 245

KB Pre IPO Secondary Venture Fund 1st
Builton Co., Ltd. 1
Wise Asset Management Co., Ltd.
Acts Co., Ltd.
Paycoms Co., Ltd.
Big Dipper Co., Ltd.
KB-KDBC Pre-IPO New Technology Business Investment Fund
A-PRO Co., Ltd.
JLK Inspection, Inc. 1
TESTIAN Inc. 1
IWON ALLOY CO.,LTD.CARLIFE CO.,LTD.COMPUTERLIFE CO.,LTD.RMGP Bio-Pharma Investment Fund, L.P.
RMGP Bio-Pharma Investment, L.P.
Hasys.
SKYDIGITAL INCRainist Co., Ltd.
Spark Biopharma, Inc. 1
HEYBIT, Inc. Stratio, Inc. Honest Fund, Inc.
DepositsInsurance contract liabilitiesOther liabilities DepositsOther liabilitiesOther assetsFinancial assets at fair value through profit or loss
Loans at amortized cost (Gross amount)DepositsInsurance contract liabilitiesDepositsOther liabilitiesIntangible assetsDepositsOther liabilitiesOther assetsFinancial assets at fair value through profit or loss
DepositsLoans at amortized cost (Gross amount)DepositsDepositsOther liabilitiesLoans at amortized cost (Gross amount)Insurance contract liabilitiesDepositsOther liabilitiesFinancial assets at fair value through profit or loss
Other assetsFinancial assets at fair value through profit or loss
Insurance contract liabilitiesDepositsDepositsFinancial assets at fair value through profit or loss
Other liabilitiesFinancial assets at fair value through profit or loss
Financial assets at fair value through profit or loss
Insurance contract liabilitiesDepositsFinancial assets at fair value through profit or loss
DepositsFinancial assets at fair value through profit or loss
DepositsOther liabilitie Financial assets at fair value through profit or loss Financial assets at fair value through profit or loss
Deposits Financial assets at fair value through profit or loss
2019 1,073
41
2,9551--
---
21--1
1001
1,157
111
67,054
42,019
23,201
1-
--
1-1
3,419
28
6,000
3725
7,504
--
--
250 1,000
726
3,999
2018 68
3 -
1,115 1 1
399
2 7 1
696 2
530 29
530 1
1,032
1 5
182 7,088
3 -2
2,201 -
7,300
1 615
22 1
3,051
35 4
5,864
29 16
2,504
1 6,500
2,630 19
250 1,000
516 -
(In millions of Korean won)
KB Financial Group Annual Report 2019246

CellinCells Co., Ltd.
Joyang Industry Co., Ltd.KB No.9 Special Purpose Acquisition Company1
KB No.10 Special Purpose Acquisition Company1
KB No.11 Special Purpose Acquisition Company1
KB No.17 Special Purpose Acquisition Company
KB No.18 Special Purpose Acquisition Company
KB No.19 Special Purpose Acquisition Company
KB No.20 Special Purpose Acquisition Company
KOSESEUJITO CO., LTD.CWhy Inc.Bomapp Inc.
ZOYI corporation INC.MitoImmune TherapeuticsKB-Solidus Global Healthcare FundKB Social Impact Investment AssociationFabric Types CO.,LTD.
BNF Corporation Ltd.
Key management
OtherRetirement pension
Financial assets at fair value through profit or lossLoans at amortized cost (Gross amount)DepositsOther liabilitiesDepositsFinancial assets at fair value through profit or lossDepositsOther liabilitiesFinancial assets at fair value through profit or lossDerivative financial assets DepositsOther liabilitiesFinancial assets at fair value through profit or lossDerivative financial assets DepositsOther liabilitiesFinancial assets at fair value through profit or lossDepositsOther liabilitiesFinancial assets at fair value through profit or lossDepositsOther liabilitiesFinancial assets at fair value through profit or lossDepositsOther liabilitiesFinancial assets at fair value through profit or lossDepositsOther liabilitiesFinancial assets at fair value through profit or lossFinancial assets at fair value through profit or lossFinancial assets at fair value through profit or lossInsurance contract liabilitiesFinancial assets at fair value through profit or lossFinancial assets at fair value through profit or lossFinancial assets at fair value through profit or lossOther assetsFinancial assets at fair value through profit or lossDepositsOther liabilitiesFinancial assets at fair value through profit or lossLoans at amortized cost (Gross amount)Other assetsDepositsOther liabilitiesLoans at amortized cost (Gross amount)Allowances for loan lossesOther assetsDepositsInsurance contract liabilitiesOther liabilities
Other assetsOther liabilities
2019 2,000
41,545
12- - - - - - - - - - -
2,6831,742
273,7862,140
282,0431,093
71,4991,984
32,9302,0001,999
22,0005,000
10,40573
1,845395
22,2591,400
2947
63,538
13
15,3391,984
289
36617,620
2018 - - - - -
2,481 2,275
42 2,025 1,659 1,666
11 737 873 658
2 - - - - - - - - - -
- - - - - - - - - - - - - - - -
2,404-2
13,8181,092
233
331 16,388
(In millions of Korean won)
According to Korean IFRS 1024, the Group includes associates, key management (including family members), and post-employment benefit plans of the
Group and its related party companies in the scope of related parties. Additionally, the Group discloses balances (receivables and payables) and other
amounts arising from the related party transactions in the notes to the consolidated financial statements. Refer to Note 13 for details on investments in
associates and joint ventures.
1 Excluded from the Group’s related party as of December 31, 2019.
Financial Section 247

1 Transactions from operating activities with related parties (i.e. such as settlement, daily overdraft loans, etc) are excluded.2 Excluded from the Group’s related party as of December 31, 2019.
Significant lending transactions with related parties for the years ended December 31, 2019 and 2018, are as follows:
AssociatesKorea Credit Bureau Co., Ltd.
Incheon Bridge Co., Ltd.
KB Star Office Private Real
Estate Investment Trust No.1
KBTS Technology Venture Private Equity Fund
KB-Brain KOSDAQ Scale-up New Technology
Business Investment Fund
KB-Stonebridge Secondary Private Equity Fund
KB Cape No.1 Private Equity Fund
RAND Bio Science Co., Ltd.
SY Auto Capital Co., Ltd.
Food Factory Co., Ltd.
Builton Co., Ltd.2
Acts Co., Ltd.
Paycoms Co., Ltd.
Big Dipper Co., Ltd.
A-PRO Co., Ltd.
JLK INSPECTION Inc.2
TESTIAN Inc.2
RMGP Bio-Pharma Investment Fund, L.P.
RMGP Bio-Pharma Investment, L.P.
Hasys.
Rainist Co., Ltd.
Spark Biopharma, Inc.2
HEYBIT, Inc.,
Stratio, Inc.
Honest Fund, Inc.
CellinCells Co., Ltd.
KB No.9 Special Purpose Acquisition Company2
KB No.10 Special Purpose Acquisition Company2
KB No.11 Special Purpose Acquisition Company2
KB No.17 Special Purpose Acquisition Company
KB No.18 Special Purpose Acquisition Company
KB No.19 Special Purpose Acquisition Company
KB No.20 Special Purpose Acquisition Company
KOSESEUJITO CO., LTD.
CWhy Inc.
Bomapp Inc.
ZOYI corporation INC.
MitoImmune Therapeutics
KB-Solidus Global Healthcare Fund
Fabric Types CO.,LTD
BNF Corporation Ltd.
Key management
Beginning
\ 22
191,088
10,000
-
-
-
-
1
48,356
730
401
-
1,032
5
-
7,300
615
3,051
4
5,864
2,504
6,500
250
1,000
-
-
2,481
2,025
737
-
-
-
-
-
-
-
-
-
-
-
-
2,404
Decrease
\ (22)
(10,506)
-
-
-
-
-
(1)
(34,454)
(20)
(401)
(68)
-
(5)
-
-
(639)
-
-
-
-
-
-
-
-
-
(2,481)
(2,025)
(737)
-
-
-
-
-
-
-
-
-
-
-
-
(872)
Increase
\ 43
4,982
-
3,540
2,678
713
2,000
1
28,088
1,872
-
68
125
11
2,019
(7,300)
24
368
4
136
5,000
(6,500)
-
-
3,999
2,004
-
-
-
2,683
3,786
2,043
1,499
2,930
2,000
1,999
2,000
5,000
10,405
1,845
3,659
2,006
Ending
\ 43
185,564
10,000
3,540
2,678
713
2,000
1
41,990
2,582
-
-
1,157
11
2,019
-
-
3,419
8
6,000
7,504
-
250
1,000
3,999
2,004
-
-
-
2,683
3,786
2,043
1,499
2,930
2,000
1,999
2,000
5,000
10,405
1,845
3,659
3,538
2019
(In millions of Korean won)
KB Financial Group Annual Report 2019248

1 Transactions from operating activities with related parties (i.e. such as settlement, daily overdraft loans, etc) are excluded.2 Excluded from the Group’s related party as of December 31, 2019.
AssociatesKorea Credit Bureau Co., Ltd.
Incheon Bridge Co., Ltd.
Dongjo Co., Ltd.
KB Star Office Private Real Estate
Investment Trust No.1
RAND Bio Science Co., Ltd.
Inno Lending Co., Ltd. 2
SY Auto Capital Co., Ltd.
Food Factory Co., Ltd.
Builton Co., Ltd. 2
Acts Co., Ltd.
Bungaejanter. Inc. 2
Paycoms Co., Ltd.
Big Dipper Co., Ltd.
JLK INSPECTION Inc. 2
TESTIAN Inc. 2
RMGP Bio-Pharma Investment Fund, L.P.
RMGP Bio-Pharma Investment, L.P.
Hasys.
Rainist Co., Ltd.
Spark Biopharma, Inc. 2
HEYBIT, Inc.,
Stratio, Inc.
KB No.8 Special Purpose Acquisition Company 2
KB No.9 Special Purpose Acquisition Company2
KB No.10 Special Purpose Acquisition Company2
KB No.11 Special Purpose Acquisition Company2
Key management
Beginning
₩ 22
200,414
116
10,000
1
2
40,057
679
1
1,927
425
1,066
6
-
-
-
-
-
-
-
-
-
2,296
2,356
1,603
697
1,665
Decrease
₩ (22)
(14,714)
(116)
-
(1)
(2)
(41,810)
-
(2)
(1,927)
(425)
(1,066)
(6)
-
-
-
-
(136)
-
-
-
-
(2,296)
(2,356)
(1,603)
(697)
(836)
Increase
₩ 22
5,388
-
-
1
-
50,109
51
402
-
-
1,032
5
7,300
615
3,051
4
6,000
2,504
6,500
250
1,000
-
2,481
2,025
737
1,509
Ending
₩ 22
191,088
-
10,000
1
-
48,356
730
401
-
-
1,032
5
7,300
615
3,051
4
5,864
2,504
6,500
250
1,000
-
2,481
2,025
737
2,338
2018
(In millions of Korean won)
Financial Section 249

1 Transactions from operating activities with related parties (i.e. such as settlement, daily overdraft loans, etc) are excluded.2 Excluded from the Group’s related party as of December 31, 2019.
Significant borrowing transactions with related parties for the years ended December 31, 2019 and 2018, are as follows:
AssociatesKorea Credit Bureau Co., Ltd.
Incheon Bridge Co., Ltd.
Doosung Metal Co., Ltd
Jungdo Co., Ltd.
Dae-A Leisure Co., Ltd.
CARLIFE CO.,LTD.
COMPUTERLIFE CO.,LTD.,
SKYDIGITAL INC
Joyang Industry Co., Ltd.
Aju Good Technology Venture Fund
KB-KDBC New Technology Business Fund
KB-Brain KOSDAQ Scale-up New Technology
Business Investment Fund
KB Star Office Private Real Estate
Investment Trust No.1
SY Auto Capital Co., Ltd.
KB No.9 Special Purpose Acquisition Company2
KB No.10 Special Purpose Acquisition Company2
KB No.11 Special Purpose Acquisition Company2
KB No.17 Special Purpose Acquisition Company
KB No.18 Special Purpose Acquisition Company
KB No.19 Special Purpose Acquisition Company
KB No.20 Special Purpose Acquisition Company
RAND Bio Science Co., Ltd.
Wise Asset Management Co., Ltd.
Builton Co., Ltd.2
Food Factory Co., Ltd.
Acts Co., Ltd.
Paycoms Co., Ltd.
Big Dipper Co., Ltd.
A-PRO Co., Ltd.
Rainist Co., Ltd.
Spark Biopharma, Inc.2
Stratio, Inc.
NEXOLON CO.,LTD.2
CellinCells Co., Ltd.
KB IGen Private Equity Fund No.1
KB Pre IPO Secondary Venture Fund 1st
Fabric Types CO.,LTD.
BNF Corporation Ltd.
Key management
Beginning
₩ 15,674
43,666
3
4
1,229
2
1
16
-
6,439
7,088
18,813
7,946
5
2,275
1,666
658
-
-
-
-
232
696
7
68
29
1
182
2,201
1
2,630
516
-
-
148
1,115
-
-
13,818
Repayment
₩ (3,000)
(5,260)
-
-
-
-
-
-
-
-
(10,000)
-
(5,072)
-
(2,266)
(1,618)
(530)
-
(100)
-
-
-
(682)
-
-
-
-
-
-
-
(9,000)
-
(200)
-
-
-
-
-
(14,611)
Borrowing
₩ -
25,260
-
-
-
-
-
-
-
-
15,000
-
5,018
-
-
-
-
1,500
2,200
1,000
1,500
1,900
-
-
-
-
-
-
-
-
17,000
-
-
-
-
-
-
-
13,520
Others1
₩ 5,292
(18,219)
(3)
-
(476)
(2)
-
9
2
(983)
(5,034)
(5,695)
401
3
(9)
(48)
(128)
242
40
93
484
2,320
7
(7)
1,005
(28)
-
(176)
1,000
(1)
(10,630)
210
200
1,545
(1)
1,840
395
947
2,611
Ending
₩ 17,966
45,447
-
4
753
-
1
25
2
5,456
7,054
13,118
8,293
8
-
-
-
1,742
2,140
1,093
1,984
4,452
21
-
1,073
1
1
6
3,201
-
-
726
-
1,545
147
2,955
395
947
15,338
2019
(In millions of Korean won)
KB Financial Group Annual Report 2019250

1 Transactions from operating activities with related parties (i.e. such as settlement, deposit on demend, etc) are netted.2 Excluded from the Group’s related party as of December 31, 2019.
AssociatesKorea Credit Bureau Co., Ltd.
Incheon Bridge Co., Ltd.
Terra Co., Ltd.
Jungdong Steel Co., Ltd.
Doosung Metal Co., Ltd
Jungdo Co., Ltd.
Dae-A Leisure Co., Ltd.
Daesang Techlon Co., Ltd.2
CARLIFE CO.,LTD.
COMPUTERLIFE CO.,LTD.,
SKYDIGITAL INC
Aju Good Technology Venture Fund
KB-KDBC New Technology Business Fund
KB-Brain KOSDAQ Scale-up New Technology
Business Investment Fund
KB Star Office Private Real Estate
Investment Trust No.1
SY Auto Capital Co., Ltd.
KB No.8 Special Purpose Acquisition Company2
KB No.9 Special Purpose Acquisition Company2
KB No.10 Special Purpose Acquisition Company2
KB No.11 Special Purpose Acquisition Company2
RAND Bio Science Co., Ltd.
Wise Asset Management Co., Ltd.
Builton Co., Ltd. 2
Food Factory Co., Ltd.
Acts Co., Ltd.
Paycoms Co., Ltd.
Big Dipper Co., Ltd.
A-PRO Co., Ltd.
Rainist Co., Ltd.
Spark Biopharma, Inc.2
KB IGen Private Equity Fund No.1
KB Pre IPO Secondary Venture Fund 1st
POSCO-KB Shipbuilding Fund
Inno Lending Co., Ltd.2
Key management
Beginning
₩ 25,513
48,795
10
3
-
4
466
2
-
-
-
2,771
7,500
-
6,962
6
2,339
2,309
1,698
530
1,032
340
26
1
4
-
473
-
-
-
-
2,690
-
41
8,260
Repayment
₩ (16,000)
(1,270)
-
-
-
-
(466)
-
-
-
-
-
-
-
-
-
(2,300)
(2,234)
(1,618)
(530)
(500)
(2,008)
-
-
-
-
-
-
-
(3,300)
-
(4,000)
(32,800)
-
(5,283)
Borrowing
₩ 8,000
1,260
-
-
-
-
479
-
-
-
-
-
-
-
351
-
-
2,266
1,618
530
-
2,366
-
-
-
-
-
-
-
4,300
-
2,000
32,800
-
7,587
Others1
₩ (1,839)
(5,119)
(10)
(3)
3
-
750
(2)
2
1
16
3,668
(412)
18,813
633
(1)
(39)
(66)
(32)
128
(300)
(2)
(19)
67
25
1
(291)
2,201
1
1,630
148
425
-
(41)
264
Ending
₩ 15,674
43,666
-
-
3
4
1,229
-
2
1
16
6,439
7,088
18,813
7,946
5
-
2,275
1,666
658
232
696
7
68
29
1
182
2,201
1
2,630
148
1,115
-
-
10,828
2018
(In millions of Korean won)
Financial Section 251

1 Excluded from the Group’s related party as of December 31, 2019.
1 Excluded from the Group’s related party as of December 31, 2019.
Significant investment and collection transaction with related parties for the years ended December 31, 2019 and 2018 is as follows:
Korea Credit Bureau Co., Ltd.
Balhae Infrastructure Company
KoFC KBIC Frontier Champ 2010-5(PEF)1
KB GwS Private Securities Investment Trust
Aju Good Technology Venture Fund
POSCO-KB Shipbuilding Fund
KB-KDBC Pre-IPO New Technology Business Fund
KBTS Technology Venture Private Equity Fund
KB-SJ Tourism Venture Fund
KB-Brain KOSDAQ Scale-up New Technology Business Investment Fund
KB-UTC Inno-Tech Venture Fund
KB-Solidus Global Healthcare Fund
KB Star office Private real estate Investment Trust No.1
KB Cape No.1 Private Equity Fund
KB No.9 Special Purpose Acquisition Company1
KB No.17 Special Purpose Acquisition Company
KB No.18 Special Purpose Acquisition Company
KB No.19 Special Purpose Acquisition Company
KB No.20 Special Purpose Acquisition Company
KB SPROTT Renewable Private Equity Fund
KB-Stonebridge Secondary Private Equity Fund
KBSP 4th Private Investment Partnership
KB Social Impact Investment Association
Korea Credit Bureau Co., Ltd.
Balhae Infrastructure Company
Daesang Techlon Co.,Ltd.1
PT Bank Bukopin TBK
KoFC KBIC Frontier Champ 2010-5(PEF)1
KB GwS Private Securities Investment Trust
Aju Good Technology Venture Fund
KB-KDBC Pre-IPO New Technology Business Fund
KBTS Technology Venture Private Equity Fund
KB-Brain KOSDAQ Scale-up New Technology Business Investment Fund
KB Star office Private real estate Investment Trust No.1
KB No.8 Special Purpose Acquisition Company1
Hyundai-Tongyang Agrifood Private Equity Fund1
KB IGen Private Equity Fund No.1
GH Real Estate I LP
KB-SJ Tourism Venture Fund
CUBE Growth Fund No.21
UNION Media Commerce Fund
Equity investments₩ -
592
-
-
1,960
2,500
5,000
7,840
1,500
14,000
450
10,400
-
2,000
-
1
1
1
1
1,667
7,070
6,100
1,500
Equity investments₩ -
4,645
-
116,422
-
-
9,808
10,000
14,224
8,000
-
-
-
-
17,678
1,500
1,300
1,000
Withdrawal and others₩ 135
6,855
138
7,276
-
-
-
2,240
-
-
-
13,520
1,275
-
16
-
-
-
-
-
1,855
-
-
Withdrawal and others₩ 113
8,623
42
-
4,800
6,386
-
-
-
-
1,162
5
82
3
-
-
1,300
-
2019
2018
(In millions of Korean won)
(In millions of Korean won)
KB Financial Group Annual Report 2019252

Associates and joint venturesBalhae Infrastructure Fund
Korea Credit Bureau Co., Ltd.
KoFC KBIC Frontier Champ 2010-5(PEF)1
KB GwS Private Securities Investment Trust
Aju Good Technology Venture Fund
Incheon Bridge Co., Ltd.
KoFC POSCO HANHWA KB Shared Growth Private Equity Fund No. 2
SY Auto Capital Co., Ltd.
KB No.9 Special Purpose Acquisition Company1
KB No.10 Special Purpose Acquisition Company1
KB No.18 Special Purpose Acquisition Company
KB No.19 Special Purpose Acquisition Company
CellinCells Co., Ltd
RAND Bio Science Co., Ltd.
Builton Co., Ltd. 1
Food Factory Co., Ltd.
Big Dipper Co., Ltd.
KB Pre IPO Secondary Venture Fund 1st
POSCO-KB Shipbuilding Fund
KB-KDBC New Technology Business Investment Fund
KBTS Technology Venture Private Equity Fund
KB-SJ Tourism Venture Fund
KB-Brain KOSDAQ Scale-up New Technology Business Investment Fund
KB SPROTT Renewable Private Equity Fund Ⅰ
KB-Stonebridge Secondary Private Equity Fund
KB Social Impact Investment Association
BNF Corporation Ltd.
A-PRO Co., Ltd.
KB-UTC Inno-Tech Venture Fund
KB-Solidus Global Healthcare Fund
RMGP Bio-Pharma Investment Fund, L.P.
RMGP Bio-Pharma Investment, L.P.
Key management
Purchase of security investment
Unused commitments of credit card
Purchase of security investment
Preferred loss allowance agreement
Purchase of security investment
Purchase of security investment
Loan commitments in Korean won
Unused commitments of credit card
Purchase of security investment
Preferred loss allowance agreement
Loan commitments in Korean won
Unused commitments of credit card
Unused commitments of credit card
Unused commitments of credit card
Unused commitments of credit card
Unused commitments of credit card
Unused commitments of credit card
Unused commitments of credit card
Unused commitments of credit card
Unused commitments of credit card
Unused commitments of credit card
Preferred loss allowance agreement
Purchase of security investment
Purchase of security investment
Purchase of security investment
Purchase of security investment
Purchase of security investment
Purchase of security investment
Purchase of security investment
Purchase of security investment
Loan commitments in Korean won
Unused commitments of credit card
Purchase of security investment
Purchase of security investment
Purchase of security investment
Purchase of security investment
Loan commitments in Korean won
2019
₩ 7,327
557
-
-
876
1,154
20,000
93
12,550
10,000
8,100
60
-
-
15
1
20
24
-
25
89
1,671
5,000
-
5,936
2,000
18,000
22,833
27,930
3,000
360
96
22,050
24,700
USD 8,911,002
USD 13,150
1,695
2018
₩ 10,453
108
2,150
10,000
876
1,960
20,000
94
12,550
10,000
6,700
94
1
5
-
-
-
24
3
11
95
1,671
7,500
5,000
13,776
3,500
32,000
-
-
-
-
-
-
-
USD 10,271,257
USD 15,847
1,832
(In millions of Korean won)
(US Dollar)
Unused commitments to related parties as of December 31, 2019 and 2018, are as follows:
Compensation to key management for the years ended December 31, 2019 and 2018, are as follows:
1 Excluded from the Group’s related party as of December 31, 2019.
Registered directors (executive)
Registered directors (non-executive)
Non-registered directors
(In millions of Korean won)
2019
Post-employment benefits
₩ 425
-
360
₩ 785
Short-term employee benefits
₩ 8,540
1,030
9,157
₩ 18,727
Total
₩ 16,399
1,030
17,027
₩ 34,456
Share-based payments
₩ 7,434
-
7,510
₩ 14,944
Financial Section 253

Registered directors (executive)
Registered directors (non-executive)
Non-registered directors
(In millions of Korean won)
2018
Post-employment benefits
₩ 418
-
273
₩ 691
Short-term employee benefits
₩ 7,757
960
7,135
₩ 15,852
Total
₩ 12,388
960
10,722
₩ 24,070
Share-based payments
₩ 4,213
-
3,314
₩ 7,527
Collateral received from related parties as of December 31, 2019 and 2018, are as follows:
AssociatesKB Star Office Private Real Estate
Investment Trust No.1
Key management
Right-of-use asset
Operating lease commitments disclosed at December 31, 20181
Add : Finance lease asset recognized at December 31, 2018
Right-of use asset recognized as of the date of initial application
Lease liability
Operating lease commitments disclosed at December 31, 2018
Discounted amount using the lessee’s incremental borrowing rate2 at the date of initial application
Add : Finance lease liability recognized at December 31, 2018
Lease liabilities recognized as of the date of initial application
Real estate
Time deposits and others
Real estate
2019
₩ 13,000
192
2,922
2018
₩ 13,000
401
3,182
January 1, 2019
\ 576,249
34,002
\ 610,251
\ 586,882
544,475
10,161
\ 555,636
(In millions of Korean won)
(In millions of Korean won)
As of December 31, 2019, Incheon Bridge Co., Ltd., a related party, provides fund management account, insurance for civil engineering completion, and
management rights as senior collateral amounting to \ 611,000 million to a financial syndicate that consists of the Group and five other institutions, and as
subordinated collateral amounting to \ 384,800 million to subordinated debt holders that consist of the Group and two other institutions. Also, it provides
certificate of credit guarantee amounting to \ 400,000 million as collateral to a financial syndicate consisting of the Group and five other institutions.
45. Changes in Accounting Policies - Implementation of Korean IFRS 1116 LeasesThe Group applied Korean IFRS 1116 retrospectively as of January 1, 2019. However, the financial statements for the year ended 2018 was not restated
using the method allowed by transitional provisions. Therefore reclassification and adjustments under the new IFRS were recognized in the financial
statements beginning on January 1, 2019.
A lessee shall apply this standard to its leases either:
- retrospectively to each prior reporting period presented applying Korean IFRS 1008 Accounting Policies, Changes in Accounting Estimates and Errors (Full
retrospective application); or
- retrospectively with the cumulative effect of initially applying the standard recognized at the date of initial application.
The Group applied Korean IFRS 1116 retrospectively with recognizing the cumulative effect of initial adoption of the standard as at January 1, 2019. The
Group did not restate any comparative financial statements.
For leases previously classified as ‘finance leases’, the Group recognized the carrying amount of the lease asset and lease liability immediately before
transition as the carrying amount of the right-of-use asset and the lease liability at the date of initial application. The measurement principles of Korean
IFRS 1116 are only applied after that date. The remeasurements to the lease liabilities were recognized as adjustments to the related right-of-use assets
immediately after the date of initial application.
1 The amount included lease contract related provisions for asset retirement obligation and other assets/liabilities according to the adoption of Korean IFRS.2 The incremental borrowing rate is 1.45%~6.95%.
KB Financial Group Annual Report 2019254

The difference between the amount of the right-of-use asset and the lease liability is adjusted by the amount of any prepaid or accrued lease payments
relating to that lease recognized in the consolidated statement of financial position immediately before the date of initial application.
46. Approval of Issuance of the Financial StatementsThe issuance of the Group’s consolidated financial statements as of and for the year ended December 31, 2019, was initially approved on February 6, 2020
and re-approved due to revision on March 4, 2020 by the Board of Directors.
Financial Section 255

Independent Auditor’s Report
To the Board of Directors and Shareholders of KB Financial Group Inc.
Opinion
We have audited the accompanying separate financial statements of KB Financial Group Inc.(the Company), which comprise the separate statements of
financial position as at December 31, 2019 and 2018 and the separate statements of comprehensive income, changes in equity and cash flows for the years
then ended, and notes to the separate financial statements, including a summary of significant accounting policies and other explanatory information.
In our opinion, the accompanying separate financial statements present fairly, in all material respects, the separate financial position of the Company as at
December 31, 2019 and 2018, and its separate financial performance and cash flows for the years then ended in accordance with International Financial
Reporting Standards as adopted by the Republic of Korea (Korean IFRS).
We also have audited, in accordance with Korean Standards on Auditing, the Company’s Internal Control over Financial Reporting as of December 31, 2019,
based on Conceptual Framework for Designing and Operating Internal Control over Financial Reporting and our report dated March 5, 2020 expressed an
unqualified opinion.
Basis for Opinion
We conducted our audits in accordance with Korean Standards on Auditing. Our responsibilities under those standards are further described in the Auditor’s
Responsibilities for the Audit of the Financial Statements section of our report. We are independent of the Company in accordance with the ethical
requirements of the Republic of Korea that are relevant to our audit of the financial statements and we have fulfilled our other ethical responsibilities in
accordance with the ethical requirements. We believe that the audit evidence we have obtained is sufficient and appropriate to provide a basis for our audit opinion.
Key Audit Matters
No key audit matter is identified to be described in this audit report.
Other MatterAuditing standards and their application in practice vary among countries. The procedures and practices used in the Republic of Korea to audit such
financial statements may differ from those generally accepted and applied in other countries.
Responsibilities of Management and Those Charged with Governance for the Financial StatementsManagement is responsible for the preparation and fair presentation of the separate financial statements in accordance with Korean IFRS, and for such
internal control as management determines is necessary to enable the preparation of financial statements that are free from material misstatement,
whether due to fraud or error.
In preparing the financial statements, management is responsible for assessing the Company’s ability to continue as a going concern, disclosing, as
applicable, matters related to going concern and using the going concern basis of accounting unless management either intends to liquidate the Company
or to cease operations.
Those charged with governance are responsible for overseeing the Company’s financial reporting process.
(English Translation of a Report Originally Issued in Korean)
KB Financial Group Annual Report 2019256

Auditor’s Responsibilities for the Audit of the Financial StatementsOur objectives are to obtain reasonable assurance about whether the financial statements as a whole are free from material misstatement, whether due to
fraud or error, and to issue an auditor’s report that includes our opinion. Reasonable assurance is a high level of assurance, but is not a guarantee that an
audit conducted in accordance with Korean Standards on Auditing will always detect a material misstatement when it exists. Misstatements can arise from
fraud or error and are considered material if, individually or in the aggregate, they could reasonably be expected to influence the economic decisions of
users taken on the basis of these financial statements.
As part of an audit in accordance with Korean Standards on Auditing, we exercise professional judgment and maintain professional skepticism throughout
the audit. We also:
· Identify and assess the risks of material misstatement of the financial statements, whether due to fraud or error, design and perform audit procedures
responsive to those risks, and obtain audit evidence that is sufficient and appropriate to provide a basis for our opinion. The risk of not detecting a
material misstatement resulting from fraud is higher than for one resulting from error, as fraud may involve collusion, forgery, intentional omissions,
misrepresentations, or the override of internal control.
· Obtain an understanding of internal control relevant to the audit in order to design audit procedures that are appropriate in the circumstances
· Evaluate the appropriateness of accounting policies used and the reasonableness of accounting estimates and related disclosures made by management.
· Conclude on the appropriateness of management’s use of the going concern basis of accounting and, based on the audit evidence obtained, whether a
material uncertainty exists related to events or conditions that may cast significant doubt on the Company’s ability to continue as a going concern. If we
conclude that a material uncertainty exists, we are required to draw attention in our auditor’s report to the related disclosures in the financial statements
or, if such disclosures are inadequate, to modify our opinion. Our conclusions are based on the audit evidence obtained up to the date of our auditor’s
report. However, future events or conditions may cause the Company to cease to continue as a going concern.
· Evaluate the overall presentation, structure and content of the financial statements, including the disclosures, and whether the financial statements
represent the underlying transactions and events in a manner that achieves fair presentation.
We communicate with those charged with governance regarding, among other matters, the planned scope and timing of the audit and significant audit
findings, including any significant deficiencies in internal control that we identify during our audit.
We also provide those charged with governance with a statement that we have complied with relevant ethical requirements regarding independence, and to
communicate with them all relationships and other matters that may reasonably be thought to bear on our independence, and where applicable, related safeguards.
From the matters communicated with those charged with governance, we determine those matters that were of most significance in the audit of the
financial statements of the current period and are therefore the key audit matters. We describe these matters in our auditor’s report unless law or regulation
precludes public disclosure about the matter or when, in extremely rare circumstances, we determine that a matter should not be communicated in our
report because the adverse consequences of doing so would reasonably be expected to outweigh the public interest benefits of such communication.
The engagement partner on the audit resulting in this independent auditor’s report is Yeob Yu, Certified Public Accountant.
Samil PricewaterhouseCoopers
Seoul, Korea
March 5, 2020
This report is effective as of March 5, 2020, the audit report date. Certain subsequent events or circumstances, which may occur between the audit report date and the time of reading this report, could have a material impact on the accompanying consolidated financial statements and notes thereto. Accordingly, the readers of the audit report should understand that there is a possibility that the above audit report may have to be revised to reflect the impact of such subsequent events or circumstances, if any.
Financial Section 257

Separate Statements of Financial Position
KB Financial Group Inc. and Subsidiaries
December 31, 2019 and December 31, 2018
Assets
Cash and due from financial institutions
Financial assets at fair value through profit or loss
Loans at amortized cost
Investments in subsidiaries
Property and equipment
Intangible assets
Deferred income tax assets
Other assets
Total assets
Liabilities
Debts
Debentures
Net defined benefit liabilities
Current income tax liabilities
Other liabilities
Total liabilities
Equity
Share capital
Hybrid securities
Capital surplus
Accumulated other comprehensive income
Retained earnings
Treasury shares
Total equity
Total liabilities and equity
2019
₩ 18,537
413,909
120,000
24,162,116
4,170
11,092
7,526
609,286
25,346,636
\ -
5,543,446
437
417,414
203,440
6,164,737
2,090,558
399,085
14,742,814
(7,664)
3,093,294
(1,136,188)
19,181,899
\ 25,346,636
Notes
4,5,6,28
4,5,7
4,5,8
9
10
11
12
4,5,13
4,5,14
4,5,15
16
4,5,17
18
18
18
18
18
18
2018
₩ 344,302
289,179
50,000
24,062,116
2,185
9,646
8,184
857,462
25,623,074
\ 300,000
5,373,266
183
691,909
186,481
6,551,839
2,090,558
-
14,742,814
(7,144)
3,213,556
(968,549)
19,071,235
\ 25,623,074
(In millions of Korean won)
The above separate statements of financial position should be read in conjunction with the accompanying notes.
KB Financial Group Annual Report 2019258
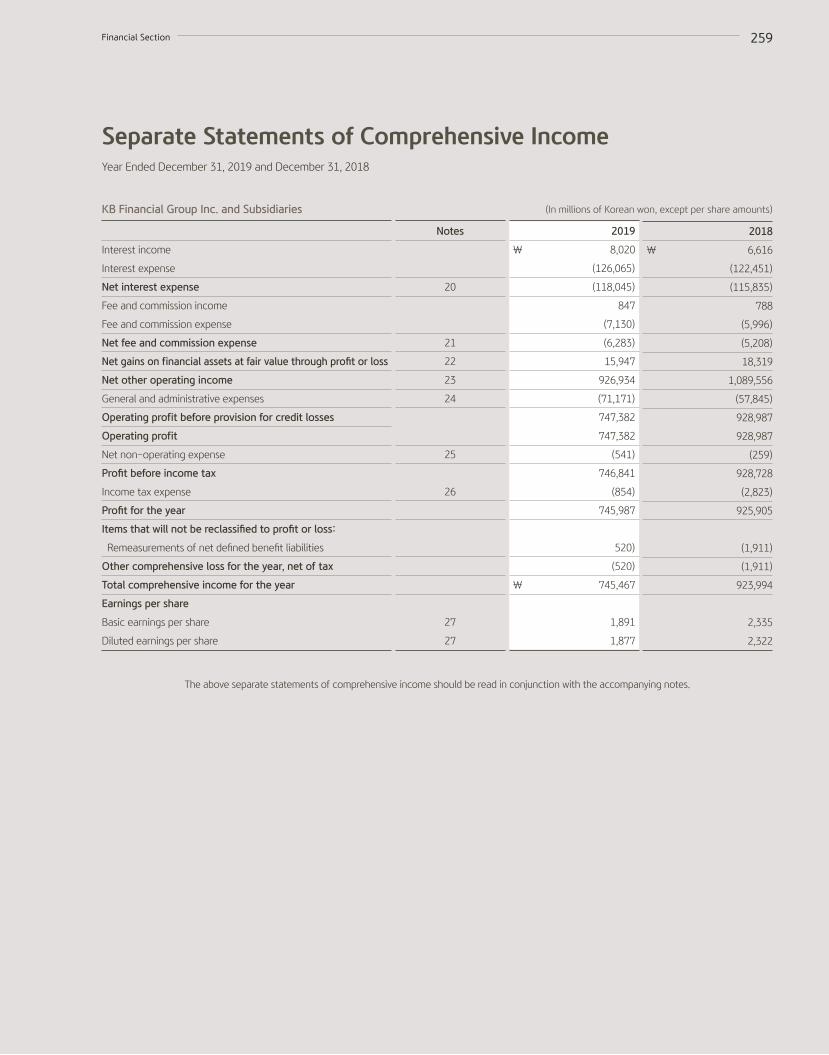
Separate Statements of Comprehensive Income
KB Financial Group Inc. and Subsidiaries
Year Ended December 31, 2019 and December 31, 2018
Interest income
Interest expense
Net interest expense
Fee and commission income
Fee and commission expense
Net fee and commission expense
Net gains on financial assets at fair value through profit or loss
Net other operating income
General and administrative expenses
Operating profit before provision for credit losses
Operating profit
Net non-operating expense
Profit before income tax
Income tax expense
Profit for the year
Items that will not be reclassified to profit or loss:
Remeasurements of net defined benefit liabilities
Other comprehensive loss for the year, net of tax
Total comprehensive income for the year
Earnings per share
Basic earnings per share
Diluted earnings per share
2019
₩ 8,020
(126,065)
(118,045)
847
(7,130)
(6,283)
15,947
926,934
(71,171)
747,382
747,382
(541)
746,841
(854)
745,987
520)
(520)
\ 745,467
1,891
1,877
Notes
20
21
22
23
24
25
26
27
27
2018
₩ 6,616
(122,451)
(115,835)
788
(5,996)
(5,208)
18,319
1,089,556
(57,845)
928,987
928,987
(259)
928,728
(2,823)
925,905
(1,911)
(1,911)
923,994
2,335
2,322
(In millions of Korean won, except per share amounts)
The above separate statements of comprehensive income should be read in conjunction with the accompanying notes.
Financial Section 259

Separate Statements of Changes in EquityYear Ended December 31, 2019 and December 31, 2018
Balance at January 1, 2018
Comprehensive income
Profit for the year
Remeasurements of net defined
benefit liabilities
Total comprehensive income
Transactions with shareholders
Annual dividends
Acquisition of treasury shares
Total transactions with shareholders
Balance at December 31, 2018
Balance at January 1, 2019
Comprehensive income
Profit for the year
Remeasurements of net defined
benefit liabilities
Total comprehensive income
Transactions with shareholders
Annual dividends
Issuance of hybrid securities
Dividends on hybrid securities
Acquisition and Retirement of
treasury shares
Total transactions with shareholders
Balance at December 31, 2019
Total Equity
\ 19,126,545
925,905
(1,911)
923,994
(766,728)
(212,576)
(979,304)
\ 19,071,235
\ 19,071,235
745,987
(520)
745,467
(759,736)
399,085
(6,513)
(267,639)
(634,803)
\ 19,181,899
Share Capital
₩ 2,090,558
-
-
-
-
-
-
\ 2,090,558
\ 2,090,558
-
-
-
-
-
-
-
-
\ 2,090,558
Hybrid Securitiesal
₩ -
-
-
-
-
-
-
-
-
-
-
-
-
399,085
-
-
399,085
\ 399,085
Capital Surplus
₩ 14,742,814
-
-
-
-
-
-
\ 14,742,814
\ 14,742,814
-
-
-
-
-
-
-
-
\ 14,742,814
Retained Earnings
₩ 3,054,379
925,905
-
925,905
(766,728)
-
(766,728)
\ 3,213,556
\ 3,213,556
745,987
-
745,987
(759,736)
-
(6,513)
(100,000)
(866,249)
\ 3,093,294
Treasury Shares
₩ (755,973)
-
-
-
-
(212,576)
(212,576)
\ (968,549)
\ (968,549)
-
-
-
-
-
-
(167,639)
(167,639)
\ (1,136,188)
Accumulated Other
Comprehensive Income
₩ (5,233)
-
(1,911)
(1,911)
-
-
-
\ (7,144)
\ (7,144)
-
(520)
(520)
-
-
-
-
-
\ (7,664)
(In millions of Korean won)KB Financial Group Inc. and Subsidiaries
The above separate statements of changes in equity should be read in conjunction with the accompanying notes.
KB Financial Group Annual Report 2019260

Separate Statements of Cash Flows
KB Financial Group Inc. and Subsidiaries
Year Ended December 31, 2019 and December 31, 2018
Cash flows from operating activities
Profit for the period
Adjustment for non-cash items
Depreciation and amortization
Share-based payments
Net interest expense
Net gains on valuation on financial assets at fair
value through profit or loss
Net other expenses
Changes in operating assets and liabilities
Deferred income tax assets
Other assets
Other liabilities
Net cash inflow from operating activities
Cash flows from investing activities
Acquisition of financial assets at fair
value through profit or loss
Disposal of financial assets at fair
value through profit of loss
Acquisition of subsidiaries
Increase in loans at amortized cost
Acquisition of property and equipment
Disposal of property and equipment
Acquisition of intangible assets
Disposal of intangible assets
Net increase in guarantee deposits paid
Other investing activities
Net cash outflow from investing activities
Cash flows from financing activities
Increase in debts
Decrease in debts
Increase in debentures
Decrease in debentures
Dividends paid to shareholders
Principal elements of lease payments
Acquisition of treasury shares
Issuance of hybrid securities
Dividends paid on hybrid securities
Net cash outflow from financing activities
Net increase (decrease) in cash and cash equivalentsCash and cash equivalents at the beginning of the periodCash and cash equivalents at the end of the period
2019
₩ 745,987
5,093
4,259
4,727
(2,322)
2,209
13,966
854
(4,270)
(10,824)
(14,240)
745,713
(2,180,000)
2,057,592
(100,000)
(70,000)
(4,771)
13
(1,848)
41
(1,265)
(371)
(300,609)
418,705
(717,026)
1,037,656
(868,154)
(759,736)
(569)
(274,317)
399,085
(6,513)
(770,869)
(325,765)
344,299
\ 18,534
Notes
28
28
2018
₩ 925,905
864
551
5,198
(4,694)
2,118
4,037
2,782
(1,046)
(7,016)
(5,280)
924,662
-
-
-
(40,000)
(1,991)
-
(866)
34
(375)
(356)
(43,554)
298,321
(298,485)
897,872
(688,486)
(766,728)
-
(224,700)
-
-
(782,206)
98,902
245,397
\ 344,299
(In millions of Korean won)
The above separate statements of cash flows should be read in conjunction with the accompanying notes.
Financial Section 261

Notes to the Separate Financial StatementsYears Ended December 31, 2019 and 2018
1. The CompanyKB Financial Group Inc. (the “Company”), in accordance with Financial Holding Companies Act, was established on September 29, 2008, through stock
transfers with the former shareholders of Kookmin Bank, KB Investment & Securities Co., Ltd., KB Asset Management Co., Ltd., KB Real Estate Trust Co., Ltd.,
KB Investment Co., Ltd., KB Futures Co., Ltd., KB Credit Information Co., Ltd., and KB Data Systems Co., Ltd. in order to provide management services and
financing to associated companies. The headquarters are located at 26, Gukjegeumyung-ro-8-gil, Yeongdeungpo-gu, Seoul. The Company’s share capital
as of December 31, 2019, is ₩ 2,090,558 million. In 2011, Kookmin Bank spun off its credit card business segment and established a new separate credit
card company, KB Kookmin Card Co., Ltd., and KB Investment & Securities Co., Ltd. merged with KB Futures Co., Ltd. The Company established KB Savings
Bank Co., Ltd. in January 2012, acquired Yehansoul Savings Bank Co., Ltd. in September 2013, and KB Savings Bank Co., Ltd. merged with Yehansoul Savings
Bank Co., Ltd. in January 2014. In March 2014, the Company acquired Woori Financial Co., Ltd. and changed the name to KB Capital Co., Ltd. Meanwhile,
the Company included LIG Insurance Co., Ltd. as an associate and changed the name to KB Insurance Co., Ltd. in June 2015. Also, the Company included
Hyundai Securities Co., Ltd. as an associate in June 2016 and included as a subsidiary on October 2016 by comprehensive exchange of shares. Hyundai
Securities Co., Ltd. merged with KB Investment & Securities Co., Ltd. in December 2016 and changed the name to KB Securities Co., Ltd. in January 2017. KB
Insurance Co., Ltd. became one of the subsidiaries through a tender after in May 2017.
The Company has been listed on the Korea Exchange (“KRX”) since October 10, 2008, and on the New York Stock Exchange (“NYSE”) for its American
Depositary Shares (“ADS”) since September 29, 2008. Number of shares authorized on its Articles of Incorporation is 1,000 million.
2. Basis of Preparation2.1 Application of Korean IFRS
The Company maintains its accounting records in Korean won and prepares statutory financial statements in the Korean language (“Hangeul”) in
accordance with International Financial Reporting Standards as adopted by the Republic of Korea (“Korean IFRS”). The accompanying separate financial
statements have been condensed, restructured and translated into English from the Korean language financial statements.
Certain information attached to the Korean language financial statements, but not required for a fair presentation of the Company’s financial position,
financial performance or cash flows, is not presented in the accompanying separate financial statements.
The separate financial statements of the Company have been prepared in accordance with Korean IFRS. These are the standards, subsequent amendments
and related interpretations issued by the International Accounting Standards Board (“IASB”) that have been adopted by the Republic of Korea.
The preparation of separate financial statements requires the use of certain critical accounting estimates. Management also needs to exercise judgment in
applying the Company’s accounting policies. The areas involving a higher degree of judgment or complexity, or areas where assumptions and estimates are
significant to the separate financial statements are disclosed in Note 2.4.
The separate financial statements were prepared in accordance with Korean IFRS 1027, Separate Financial Statements.
2.1.1 New and amended standards and interpretations adopted by the Company
The Company has applied the following standards and amendments for the first time for their annual reporting period commencing January 1, 2019.
- Enactment of Korean IFRS 1116 Leases
Korean IFRS 1116 Leases replaces Korean IFRS 1017 Leases. Under Korean IFRS 1116, with implementation of a single lease model, lessee is required
to recognize assets and liabilities for all lease which lease term is over 12 months and underlying assets are not low value assets. A lessee is required to
recognize a right-of-use asset and a lease liability representing its obligation to make lease payments.
With implementation of Korean IFRS 1116 Lease, the Company has changed accounting policy. The Company has adopted Korean IFRS 1116 retrospectively,
as permitted under the specific transitional provisions in the standard, and recognized the cumulative impact of initially applying the standard as of January
1, 2019, the date of initial application. The Company has not restated comparatives for the 2018 reporting period. The impact of the adoption of the leasing
standard and the new accounting policies are disclosed in Note 31.
KB Financial Group Annual Report 2019262

- Amendments to Korean IFRS 1109 Financial Instruments
The narrow-scope amendments made to Korean IFRS 1109 Financial Instruments enable entities to measure certain prepayable financial assets with
negative compensation at amortized cost. When a modification of a financial liability measured at amortized cost that does not result in the derecognition,
a modification gain or loss shall be recognized in profit or loss. The amendment does not have a significant impact on the Company’s financial statements.
- Amendments to Korean IFRS 1019 Employee Benefits
The amendments require that an entity shall calculate current service cost and net interest for the remainder of the reporting period after a plan
amendment, curtailment or settlement based on updated actuarial assumptions from the date of the change. The amendments also require that a
reduction in a surplus must be recognized in profit or loss even if that surplus was not previously recognized because of the impact of the asset ceiling. The
amendment does not have a significant impact on the Company’s financial statements.
- Amendments to Korean IFRS 1028 Investments in Associates and Joint Ventures
The amendments clarify that an entity shall apply Korean IFRS 1109 to financial instruments in an associate or joint venture to which the equity method is
not applied. These include long-term interests that, in substance, form part of the entity’s net investment in an associate or joint venture. The amendment
does not have a significant impact on the Company’s financial statements.
- Enactment of Interpretation of Korean IFRS 2123 Uncertainty over Income Tax Treatments
The Interpretation explains how to recognize and measure deferred and current income tax assets and liabilities where there is uncertainty over a tax
treatment, and includes guidance on how to determine whether each uncertain tax treatment is considered separately or together. It also presents
examples of circumstances where a judgement or estimate is required to be reassessed. The enactment does not have a significant impact on the
Company’s financial statements.
- Annual Improvements to Korean IFRS 1103 Business Combination
The amendments clarify that when a party to a joint arrangement obtains control of a business that is a joint operation, and had rights to the assets and
obligations for the liabilities relating to that joint operation immediately before the acquisition date, the transaction is a business combination achieved in
stages. In such cases, the acquirer shall remeasure its entire previously held interest in the joint operation. The amendments have no significant effect on
the Company’s financial statements.
- Annual Improvements to Korean IFRS 1111 Joint Agreements
The amendments clarify that when a party that participates in, but does not have joint control of, a joint operation might obtain joint control of the
joint operation in which the activity of the joint operation constitutes a business. In such cases, previously held interests in the joint operation are not
remeasured. The amendments have no significant effect on the Company’s financial statements.
- Annual Improvements to Paragraph 57A of Korean IFRS 1012 Income Tax
The amendment is applied to all the income tax consequences of dividends and requires an entity to recognize the income tax consequences of dividends
in profit or loss, other comprehensive income or equity according to where the entity originally recognized those past transactions or events. The
amendments have no significant effect on the Company’s financial statements.
- Annual Improvements to Korean IFRS 1023 Borrowing Cost
The amendments clarify that if a specific borrowing remains outstanding after the related qualifying asset is ready for its intended use (or sale), it becomes
part of general borrowings. The amendments have no significant effect on the Company’s financial statements.
2.1.2 New and amended standards and interpretations not yet adopted by the Company
Certain new accounting standards and interpretations that have been published but are not mandatory for the reporting period commencing January 1,
2019 and have not been early adopted by the Company are set out below.
- Amendments to Korean IFRS 1001 Presentation of Financial Statements and Korean IFRS 1008 Accounting policies, changes in accounting estimates and
errors – Definition of Material
The amendments clarify the explanation of the definition of material and amended Korean IFRS 1001 and Korean IFRS 1008 in accordance with the clarified
definitions. Materiality is assessed by reference to omission or misstatement of material information as well as effects of immaterial information, and to the
nature of the users when determining the information to be disclosed by the Company. These amendments should be applied for annual periods beginning
on or after January 1, 2020, and earlier application of permitted. The Company does not expect that these amendments have a significant impact on the
financial statements.
Financial Section 263

- Amendments to Korean IFRS 1103 Business Combination – Definition of a Business
To consider the integration of the required activities and assets as a business, the amended definition of a business requires an acquisition to include an
input and a substantive process that together significantly contribute to the ability to create outputs and excludes economic benefits from the lower costs.
An entity can apply a concentration test, an optional test, where substantially all of the fair value of gross assets acquired is concentrated in a single asset
or a group of similar assets, the assets acquired would not represent a business. These amendments should be applied for annual periods beginning on or
after January 1, 2020, and earlier application of permitted. The Company does not expect that these amendments have a significant impact on the financial
statements.
- IFRS Interpretation Committee’s agenda decisions - Lease Term
On December 16, 2019, the IFRS Interpretations Committee announced an interpretation of the “lease term and useful life of leasehold improvements”.
This interpretation deals with how to determine the lease term of a cancellable lease or a renewable lease and whether the useful life of non-removable
leasehold improvements is limited by the relevant lease term. According to this interpretation, the Company should identify factors to consider the broader
economic penalty, reflect identified factors to accounting policies, and calculate lease term again based on accounting policy.
However, due to the large number of lease contracts held by the Company and varying terms of the contract, the Company determined that sufficient
time would be required to set up items to be included in the review of extensive economic penalty and to establish procedures for collecting and analyzing
necessary information. Therefore, the effect of the changes in accounting policy for the lease term is not reflected in the separate financial statements for
the current reporting period.
If the accounting policy for the lease term is changed in the annual periods beginning on or after January 1, 2020, the amount of the related right-of-use
assets and lease liabilities may increase, and the separate financial statements may need to be retroactively restated to reflect this effect.
2.2 Measurement Basis
The separate financial statements have been prepared under the historical cost convention unless otherwise specified.
2.3 Functional and Presentation Currency
Items included in the separate financial statements of the Company are measured using the currency of the primary economic environment in which the
Company operates (“the functional currency”). The separate financial statements are presented in Korean won, which is the Company’s functional and
presentation currency.
2.4 Critical Accounting Estimates
The preparation of separate financial statements requires the application of accounting policies, certain critical accounting estimates and assumptions that
may have a significant impact on the assets (liabilities) and incomes (expenses). Management’s estimates of outcomes may differ from actual outcomes if
management’s estimates and assumptions based on management’s best judgment at the reporting date are different from the actual environment.
Estimates and assumptions are continually evaluated and any change in an accounting estimate is recognized prospectively by including it in profit or loss
in the period of the change, if the change affects that period only. Alternatively, if the change in accounting estimate affects both the period of change and
future periods, that change is recognized in the profit or loss of all those periods.
Uncertainty in estimates and assumptions with significant risk that may result in material adjustment to the separate financial statements are as follows:
2.4.1 Income taxes
The Company is operating in numerous countries and the income generated from these operations is subject to income taxes based on tax laws and
interpretations of tax authorities in numerous jurisdictions. There are many transactions and calculations for which the ultimate tax determination is
uncertain.
If certain portion of the taxable income is not used for investments, increase in wages, and others in accordance with the Tax System for Promotion of
Investment and Collaborative Cooperation (Recirculation of Corporate Income), the Company is liable to pay additional income tax calculated based on the
tax laws. The new tax system is effective for three years from 2018. Accordingly, the measurement of current and deferred income tax is affected by the tax
effects from the new system. As the Company’s income tax is dependent on the investments, increase in wages, and others, there exists uncertainty with
regard to measuring the final tax effects.
KB Financial Group Annual Report 2019264

2.4.2 Fair value of financial instruments
The fair value of financial instruments where no active market exists or where quoted prices are not otherwise available is determined by using valuation
techniques. Financial instruments, which are not actively traded in the market and those with less transparent market prices, will have less objective fair
values and require broad judgment on liquidity, concentration, uncertainty in market factors and assumptions in price determination and other risks.
As described in the significant accounting policies in Note 3.1, ‘Recognition and Measurement of Financial Instruments’, diverse valuation techniques are
used to determine the fair value of financial instruments, from generally accepted market valuation models to internally developed valuation models that
incorporate various types of assumptions and variables.
2.4.3 Net defined benefit liability
The present value of net defined benefit liability depends on a number of factors that are determined on an actuarial basis using a number of assumptions (Note 16).
3. Significant Accounting PoliciesThe significant accounting policies and calculation methods applied in the preparation of these separate financial statements have been consistently
applied to all periods presented, except for the impact of changes due to enactment of new standards, amendments and interpretations disclosed in Note 2.1
and the following paragraph.
3.1 Recognition and Measurement of Financial Instruments
3.1.1 Initial recognition
The Company recognizes a financial asset or a financial liability in its statement of financial position when the Company becomes a party to the contractual
provisions of the instrument. A regular way purchase or sale of financial assets (a purchase or sale of a financial asset under a contract whose terms require
delivery of the financial instruments within the time frame established generally by market regulation or practice) is recognized and derecognized using
trade date accounting.
The Company classifies financial assets as financial assets at fair value through profit or loss, financial assets at fair value through other comprehensive income,
or financial assets at amortized cost. The Company classifies financial liabilities as financial liabilities at fair value through profit or loss, or other financial
liabilities. The classification depends on the nature and holding purpose of the financial instrument at initial recognition in the separate financial statements.
At initial recognition, a financial asset or financial liability is measured at its fair value plus or minus, in the case of a financial asset or financial liability not at
fair value through profit or loss, transaction costs that are directly attributable to the acquisition or issue of the financial asset or financial liability.
The fair value is defined as the amount for which an asset could be exchanged, or a liability settled, between knowledgeable, willing parties in an arm’s
length transaction. The fair value of a financial instrument on initial recognition is normally the transaction price (that is, the fair value of the consideration
given or received) in an arm’s length transaction.
3.1.2 Subsequent measurement
After initial recognition, financial instruments are measured at amortized cost or fair value based on classification at initial recognition.
Amortized cost
The amortized cost of a financial asset or financial liability is the amount at which the financial asset or financial liability is measured on initial recognition:
- minus the principal repayments
- plus or minus the cumulative amortization using the effective interest method of any difference between that initial amount and the maturity amount
- or any reduction (directly or through the use of an allowance account) due to impairment or uncollectibility
Fair value
Fair values, which the Company primarily uses for the measurement of financial instruments, are the published price quotations based on market prices or
dealer price quotations of financial instruments traded in an active market where available. These are the best evidence of fair value. A financial instrument
is regarded as quoted in an active market if quoted prices are readily and regularly available from an exchange, dealer, broker, an entity in the same industry,
pricing service or regulatory agency, and those prices represent actual and regularly occurring market transactions on an arm’s length basis.
Financial Section 265

If the market for a financial instrument is not active, fair value is determined either by using a valuation technique or independent third-party valuation
service. Valuation techniques include using recent arm’s length market transactions between knowledgeable, willing parties, if available, referencing to the
current fair value of another instrument that is substantially the same, discounted cash flow analysis and option pricing models.
The Company uses valuation models that are commonly used by market participants and customized for the Company to determine fair values of common
over-the-counter (OTC) derivatives such as options, interest rate swaps and currency swaps which are based on the inputs observable in markets. For more
complex instruments, the Company uses internally developed models, which are usually based on valuation methods and techniques generally used within
the industry, or a value measured by an independent external valuation institution as the fair values if all or some of the inputs to the valuation models are
not market observable and therefore it is necessary to estimate fair value based on certain assumptions.
In addition, the fair value information recognized in the statement of financial position is classified into the following fair value hierarchy, reflecting the
significance of the input variables used in the fair value measurement.
Level 1 : quoted prices (unadjusted) in active markets for identical assets or liabilities that the entity can access at the measurement date
Level 2 : inputs other than quoted prices included within Level 1 that are observable for the asset or liability, either directly or indirectly.
Level 3 : unobservable inputs for the asset or liability.
The level in the fair value hierarchy within which the fair value measurement is categorized in its entirety shall be determined on the basis of the lowest
level input that is significant to the fair value measurement in its entirety. For this purpose, the significance of an input is assessed against the fair value
measurement in its entirety.
If a fair value measurement uses observable inputs that require significant adjustment based on unobservable inputs, that measurement is a Level 3
measurement.
If the valuation technique does not reflect all factors which market participants would consider in setting a price, the fair value is adjusted to reflect those
factors. Those factors include counterparty credit risk, bid-ask spread, liquidity risk and others.
The chosen valuation technique makes maximum use of market inputs and relies as little as possible on entity-specific inputs. It incorporates all factors
that market participants would consider in setting a price and is consistent with economic methodologies applied for pricing financial instruments.
Periodically, the Company calibrates the valuation technique and tests its validity using prices of observable current market transactions of the same
instrument or based on other relevant observable market data.
3.1.3 Derecognition
Derecognition is the removal of a previously recognized financial asset or financial liability from the statement of financial position. The Company
derecognizes a financial asset or a financial liability when, and only when:
Derecognition of financial assets
Financial assets are derecognized when the contractual rights to the cash flows from the financial assets expire or the financial assets have been
transferred and substantially all the risks and rewards of ownership of the financial assets are also transferred, or all the risks and rewards of ownership
of the financial assets are neither substantially transferred nor retained and the Company has not retained control. If the Company neither transfers nor
disposes of substantially all the risks and rewards of ownership of the financial assets, the Company continues to recognize the financial asset to the extent
of its continuing involvement in the financial asset.
If the Company transfers the contractual rights to receive the cash flows of the financial asset, but retains substantially all the risks and rewards of
ownership of the financial asset, the Company continues to recognize the transferred asset in its entirety and recognize a financial liability for the
consideration received.
The Company writes off financial assets in its entirety or to a portion thereof when the principal and interest on the principal amount outstanding are
determined to be no longer recoverable. In general, the Company considers write-off if significant financial difficulties of the debtor, or delinquency in
interest or principal payments is indicated. The write-off decision is made in accordance with internal regulations and may require approval from external
institution, if necessary. After the write-off, the Company can collect the written-off loans continuously according to the internal policy. Recovered
amounts of financial assets previously written-off are recognized at profit or loss.
Derecognition of financial liabilities
Financial liabilities are derecognized from the statement of financial position when the obligation specified in the contract is discharged, cancelled or
expires.
KB Financial Group Annual Report 2019266

3.1.4 Offsetting
Financial assets and liabilities are offset and the net amount reported in the separate statement of financial position where there is a legally enforceable
right to offset the recognized amounts and there is an intention to settle on a net basis or realize the assets and settle the liability simultaneously. The
legally enforceable right must not be contingent on future events and must be enforceable in the normal course of business and in the event of default,
insolvency or bankruptcy of the Company or the counterparty.
3.2 Cash and Due from Financial Institutions
Cash and due from financial institutions include cash on hand, foreign currency, and short-term, highly liquid investments that are readily convertible to
known amounts of cash and which are subject to an insignificant risk of changes in value, and due from financial institutions. Cash and due from financial
institutions are measured at amortized cost.
3.3 Non-derivative Financial Assets
3.3.1 Financial assets at fair value through profit or loss
Financial assets classified as held for trading, financial assets designated by the Company as at fair value through profit or loss upon initial recognition, and
financial assets that are required to be mandatorily measured at fair value through profit or loss are classified as financial assets at fair value through profit or loss.
The Company may designate certain financial assets upon initial recognition as at fair value through profit or loss when the designation eliminates or
significantly reduces a measurement or recognition inconsistency (sometimes referred to as ‘an accounting mismatch’) that would otherwise arise from
measuring assets or liabilities or recognizing the gains and losses on them on different bases.
After initial recognition, a financial asset at fair value through profit or loss is measured at fair value and gains or losses arising from a change in the fair
value are recognized in profit or loss. Interest income and dividend income from financial assets at fair value through profit or loss are also recognized in
the statement of comprehensive income.
3.3.2 Financial assets at fair value through other comprehensive income
The Company classifies below financial assets as financial assets at fair value through other comprehensive income;
- debt instruments with a business model whose objective is achieved by both collecting contractual cash flows and selling financial assets, and consistent
with representing solely payments of principal and interest on the principal amount outstanding or;
- equity instruments, not held for trading with the objective of generating a profit from short-term fluctuations in price or dealer’s margin, designated as
financial assets at fair value through other comprehensive income
After initial recognition, a financial asset at fair value through other comprehensive income is measured at fair value. Gain and loss from changes in fair
value, other than dividend income and interest income amortized using effective interest method and exchange differences arising on monetary items
which are recognized directly in income as interest income or expense, are recognized as other comprehensive income in equity.
At disposal of financial assets at fair value through other comprehensive income, cumulative gain or loss is recognized as profit or loss for the reporting
period. However, cumulative gain or loss of equity instrument designated as fair value through other comprehensive income are not recycled to profit or
loss at disposal.
Financial assets at fair value through other comprehensive income denominated in foreign currencies are translated at the closing rate. Exchange
differences resulting from changes in amortized cost are recognized in profit or loss, and other changes are recognized as equity.
3.3.3 Financial assets measured at amortized cost
A financial asset, which are held within the business model whose objective is to hold assets in order to collect contractual cash flows and consistent with
representing solely payments of principal and interest on the principal amount outstanding, are classified as a financial asset at amortized cost.
Financial assets at amortized cost are subsequently measured at amortized cost using the effective interest method after initial recognition and interest
income is recognized using the effective interest method.
3.4 Expected Credit Loss of Financial Assets (Debt Instruments)
The Company measures expected credit loss and recognizes loss allowance at the end of the reporting period for financial assets measured at amortized
cost and fair value through other comprehensive income with the exception of financial asset measured at fair value through profit or loss.
Financial Section 267

Expected credit losses are a probability-weighted estimate of credit losses (i.e. the present value of all cash shortfalls) over the expected life of the financial
instrument. The Company measures expected credit losses by reflecting reasonable and supportable information that is reasonably available at the
reporting date without undue cost or effort, including information about past events, current conditions and forecasts of future economic conditions.
The Company uses the following three measurement techniques in accordance with Korean IFRS:
- General approach: for financial assets and off-balance-sheet unused credit line that are not applied below two approaches
- Simplified approach: for receivables, contract assets and lease receivables
- Credit-impaired approach: for purchased or originated credit-impaired financial assets
Different measurement approaches are applied depending on significant increase in credit risk. 12 month expected credit losses is recognized when credit
risk has not significantly increased since initial recognition. A loss allowance at an amount equal to lifetime expected credit losses is recognized when
credit risk has significantly increased since initial recognition. Lifetime is presumed to be a period to the contractual maturity date of a financial asset (the
expected life of the financial asset).
One or more of the following items is deemed significant increase in credit risk. When the contractual cash flows of a financial asset are renegotiated or
otherwise modified, the Company determines whether the credit risk has increased significantly since initial recognition using the following information.
- more than 30 days past due;
- decline in credit rating at period end by more than certain notches as compared to that at initial recognition;
- debt restructuring (except for impaired financial assets); and
- credit delinquency information on Korea Federation of Banks, and etc.
Under simplified approach, the Company shall always measure the loss allowance at an amount equal to lifetime expected credit losses. Under credit-
impaired approach, the Company shall only recognize the cumulative changes in lifetime expected credit losses since initial recognition as a loss allowance
for purchased or originated credit-impaired financial assets. In assessing credit impairment, the Company uses definition of default as in the new Basel
Accord which rules calculation of Capital Adequacy Ratio.
The Company generally deems one or more of the following items credit-impaired:
- no less than 90 days past due;
- legal proceedings related to collection;
- a borrower that has received a warning from the Korea Federation of banks;
- corporate borrowers that are rated C or D;
- debt restructuring.
3.4.1 Forward-looking information
The Company uses forward-looking information, when it determines whether the credit risk has increased significantly and measures the expected credit losses.
The Company assumes the risk components have a certain correlation with the economic cycle, and uses statistical methodologies to estimate the relation
between key macroeconomic variables and risk components for the expected credit losses. The correlation between the major macroeconomic variables
and the credit risk is as follows;
Key macroeconomic variables
Domestic GDP growth rate
Composite stock index
Construction investment change rate
Rate of change in housing transaction price index
Interest rate spread
Private consumption growth rate
Correlation between the major macroeconomic variables and the credit risk
(-)
(-)
(-)
(-)
(+)
(-)
Forward-looking information used in calculation of expected credit losses is based on the macroeconomic forecasts utilized by management of the
Company for its business plan taking into account reliable external agency’s forecasts and others. The forward-looking information is generated by KB
Research under KB Financial Group with comprehensive approach to capture the possibility of various economic forecast scenarios that are derived from
the internal and external viewpoints of the macroeconomic situation. The Company determines the macroeconomic variables to be used in forecasting
future condition of the economy, taking into account the direction of the forecast scenario and the significant relationship between macroeconomic
variables and time series data. And there are some changes compared to the macroeconomic variables used in the previous year.
KB Financial Group Annual Report 2019268

3.4.2 Measuring expected credit losses on financial assets at amortized cost
The amount of the loss on financial assets at amortized cost is measured as the difference between the asset’s carrying amount and the present value of
estimated future cash flows discounted at the financial asset’s original effective interest rate.
The Company estimates expected future cash flows for financial assets that are individually significant (individual assessment of impairment).
For financial assets that are not individually significant, the Company collectively estimates expected credit loss by grouping loans with homogeneous credit
risk profile (collective assessment of impairment).
Individual assessment of impairment
Individual assessment of impairment losses are calculated using management’s best estimate on present value of expected future cashflows. The Company
uses all the available information including operating cash flow of the borrower and net realizable value of any collateral held.
Collective assessment of impairment
Collective assessment of loss allowance involves historical loss experience along with incorporation of forward-looking information. Such process
incorporates factors such as type of collateral, product and borrowers, credit rating, size of portfolio and recovery period and applies Probability of
Default(PD) on a group of assets and Loss Given Default(LGD) by type of recovery method. Also, the expected credit loss model involves certain assumption
to determine input based on loss experience and forward-looking information. These models and assumptions are periodically reviewed to reduce gap
between loss estimate and actual loss experience.
Lifetime expected credit loss as at the end of the reporting period is calculated by product of carrying amount net of expected repayment, PD for each
period and LGD adjusted by change in carrying amount.
3.4.3 Measuring expected credit losses on financial assets at fair value through other comprehensive income
Measuring method of expected credit losses on financial assets at fair value through other comprehensive income is equal to the method of financial assets
at amortized cost, except for loss allowances that are recognized as other comprehensive income. Amounts recognized in other comprehensive income for
sale or repayment of financial assets at fair value through other comprehensive income are reclassified to profit or loss.
3.5 Revenue Recognition
The Company recognizes revenues in accordance with the following revenue recognition standard:
- Step 1: Identify the contract with a customer.
- Step 2: Identify the performance obligations in the contract.
- Step 3: Determine the transaction price.
- Step 4: Allocate the transaction price to the performance obligations in the contract.
- Step 5: Recognize revenue when (or as) the entity satisfies a performance obligation.
3.5.1 Interest income and expense
Interest income of financial assets at amortized cost and financial assets at fair value through other comprehensive income, and expense are recognized in
statements of comprehensive income using the effective interest method. The effective interest method is a method of calculating the amortized cost of
a financial asset or a financial liability (or groups of financial assets or financial liabilities) and of allocating the interest income or interest expense over the
relevant period.
The effective interest rate is the rate that exactly discounts estimated future cash receipts or payments through the expected life of the financial instrument
or, where appropriate, a shorter period, to the net carrying amount of the financial asset or financial liability. When calculating the effective interest rate,
the Company estimates cash flows considering all contractual terms of the financial instrument but does not consider future credit losses. The calculation
includes all fees and points paid (main components of effective interest rates only) or received between parties to the contract that are an integral part of
the effective interest rate, transaction costs, and all other premiums or discounts. In those rare cases when it is not possible to estimate reliably the cash
flows or the expected life of a financial instrument (or group of financial instruments), the Company uses the contractual cash flows over the full contractual
term of the financial instrument (or group of financial instruments).
3.5.2 Fee and commission income
The Company recognizes financial service fees in accordance with the accounting standard of the financial instrument related to the fees earned.
Financial Section 269

Fees that are an integral part of the effective interest of a financial instrument
Such fees are generally treated as adjustments of effective interest. Such fees may include compensation for activities such as evaluating the borrower’s
financial condition, evaluating and recording guarantees, collateral and other security arrangements, negotiating the terms of the instrument, preparing
and processing documents and closing the transaction and origination fees received on issuing financial liabilities measured at amortized cost. However,
fees relating to the creation or acquisition of a financial instrument at fair value through profit or loss are recognized as revenue immediately.
Fees earned as services are provided
Such fees are recognized as revenue as the services are provided. Fees which can be earned through the certain periods, including account servicing fees,
investment management fees, and etc, are recognized when the related services are provided.
Fees that are earned on the execution of a significant act
Such fees are recognized as revenue when the significant act has been completed.
3.5.3 Net gains/losses on financial instruments at fair value through profit or loss
Net gains/losses on financial instruments at fair value through profit or loss include profit or loss (changes in fair value, dividends, and gain/loss from foreign
currency translation) from following financial instruments:
- Gain or loss from financial instruments at fair value through profit or loss
- Gain or loss from derivatives for trading, including derivatives for hedging that does not meet the condition of hedge accounting
3.5.4 Dividend income
Dividend income is recognized in profit or loss when the right to receive payment is established. Dividend income is recognized as relevant items on
statements of profit or loss and other comprehensive income in accordance with the classification of equity instruments.
3.6 Investments in Subsidiaries and Associates
Investments in subsidiaries and associates are accounted at cost method in accordance with Korean IFRS 1027. The Company determines at each reporting
period whether there is any objective evidence that the investments in the subsidiaries and associates are impaired. If this is the case, the Company
calculates the amount of impairment as the difference between the recoverable amount of the subsidiaries or associates and its carrying value.
3.7 Property and Equipment
Recognition and Measurement
All property and equipment that qualify for recognition as an asset are measured at its cost and subsequently carried at cost less any accumulated
depreciation and any accumulated impairment losses.
The cost of property and equipment includes any costs directly attributable to bringing the asset to the location and condition necessary for it to be
capable of operating in the manner intended by management and the initial estimate of the costs of dismantling and removing the item and restoring the
site on which it is located.
Subsequent expenditures are capitalized only when they prolong the useful life or enhance values of the assets but the costs of the day-to-day servicing of
the assets such as repair and maintenance costs are recognized in profit or loss as incurred. When part of an item of an asset has a useful life different from
that of the entire asset, it is recognized as a separate asset.
Depreciation
Land is not depreciated, whereas other property and equipment are depreciated using the method that reflects the pattern in which the asset’s future
economic benefits are expected to be consumed by the Company. The depreciable amount of an asset is determined after deducting its residual value.
Each part of an item of property and equipment with a cost that is significant in relation to the total cost of the item is depreciated separately.
The depreciation method and estimated useful lives of the assets are as follows:
Property and equipment
Leasehold improvements
Equipment and vehicles
Depreciation method
Declining-balance
Declining-balance
Estimated useful life
4 years
4 years
KB Financial Group Annual Report 2019270

The residual value, the useful life and the depreciation method applied to an asset are reviewed at each financial year-end and, if expectations differ from
previous estimates or if there has been a significant change in the expected pattern of consumption of the future economic benefits embodied in the asset,
the changes are accounted for as a change in an accounting estimate.
3.8 Intangible Assets
Intangible assets are measured initially at cost and subsequently carried at their cost less any accumulated amortization and any accumulated impairment losses.
Intangible assets, except for membership right, are amortized using the straight-line method with no residual value over their estimated useful economic
life since the asset is available for use.
The amortization period and the amortization method for intangible assets with a definite or limited useful life are reviewed at each financial year end.
Where an intangible asset is not being amortized because its useful life is considered to be indefinite, the Company carries out a review in each accounting
period to confirm whether or not events and circumstances still support the assumption of an indefinite useful life. If they do not, the change from the
indefinite to definite or limited useful life is accounted for as a change in an accounting estimate.
3.9 Impairment of Non-financial Assets
The Company assesses at the end of each reporting period whether there is any indication that a non-financial asset except for (i) deferred income tax
assets, (ii) assets arising from employee benefits and (iii) non-current assets (or group of assets to be sold) classified as held for sale, may be impaired. If
any such indication exists, the Company estimates the recoverable amount of the asset.
The recoverable amount is estimated for the individual asset. If it is not possible to estimate the recoverable amount of the individual asset, the Company
determines the recoverable amount of the cash-generating unit to which the asset belongs (the asset’s cash-generating unit). A cash-generating unit is
the smallest identifiable group of assets that generates cash inflows that are largely independent of the cash inflows from other assets or groups of assets.
The recoverable amount of an asset is the higher of its fair value less costs to sell and its value in use. Value in use is the present value of the future cash
flows expected to be derived from an asset or cash-generating unit that are discounted by a pre-tax rate that reflects current market assessments of the
time value of money and the risks specific to the asset for which the future cash flow estimates have not been adjusted.
If the recoverable amount of an asset is less than its carrying amount, the carrying amount of the asset is reduced to its recoverable amount. That
reduction is an impairment loss and recognized immediately in profit or loss.
3.10 Provisions
Provisions are recognized when the Company has a present obligation (legal or constructive) as a result of a past event and it is probable that an outflow
of resources embodying economic benefits will be required to settle the obligation and a reliable estimate can be made of the amount of the obligation.
The risks and uncertainties that inevitably surround many events and circumstances are taken into account in reaching the best estimate of provisions, and
where the effect of the time value of money is material, the amount of provisions are the present value of the expenditures expected to be required to
settle the obligation.
Provisions are reviewed at the end of each reporting period and adjusted to reflect the current best estimate. If it is no longer probable that an outflow of
resources embodying economic benefits will be required to settle the obligation, the provisions are reversed.
3.11 Equity Instrument Issued by the Company
An equity instrument is any contract or agreement that evidences a residual interest in the assets of an entity after deducting all of its liabilities.
3.11.1 Ordinary share
Ordinary shares are classified as equity. Incremental costs directly attributable to the issue of new shares are deducted, net of tax, from the equity.
3.11.2 Hybrid Securities
The financial instruments can be classified as either financial liabilities or equity in accordance with the terms of the contract. The Company classifies hybrid
securities as an equity if the Company has the unconditional right to avoid any contractual obligation to deliver financial assets such as cash in relation to
the financial instruments.
Intangible assets
Software
Others
Amortization method
Straight-line
Straight-line
Estimated useful life
4 years
4 ~ 19 years
Financial Section 271

3.12 Employee Compensation and Benefits
3.12.1 Post-employment benefit:
Defined benefit plans
All post-employment benefit, other than defined contribution plans, is classified as defined benefit plans. The amount recognized as a defined benefit
liability is the present value of the defined benefit obligation less the fair value of plan assets at the end of the reporting period.
The present value of the defined benefit obligation is calculated annually by independent actuaries using the Projected Unit Credit method. The rate used to
discount post-employment benefit obligations is determined by reference to market yields at the end of the reporting period on high quality corporate bonds.
The currency and term of the corporate bonds are consistent with the currency and estimated term of the post-employment benefit obligations. Actuarial
gains and losses including experience adjustments and the effects of changes in actuarial assumptions are recognized in other comprehensive income.
When the fair value of plan assets deducted from the total of the present value of the defined benefit obligation results in an asset, it is recognized to the
extent of any cumulative unrecognized past service cost and the present value of any economic benefits available in the form of refunds from the plan or
reductions in future contributions to the plan.
Past service cost arises when the Company introduces a defined benefit plan that attributes to past service or changes the benefits payable for past service
under an existing defined benefit plan. Such past service cost is recognized immediately in profit or loss.
Defined contribution plans
The contributions are recognized as employee benefit expense when they are due.
3.12.2 Short-term employee benefits
Short-term employee benefits are employee benefits (other than termination benefits) that are due to be settled within 12 months after the end of the
period in which the employees render the related service. The undiscounted amount of short-term employee benefits expected to be paid in exchange for
that service is recognized as a liability (accrued expense), after deducting any amount already paid.
The expected cost of profit-sharing and bonus payments are recognized as liabilities when the Company has a present legal or constructive obligation to
make such payments as a result of past events rendered by employees and a reliable estimate of the obligation can be made.
3.12.3 Share-based payment
The Company has share grant programs to directors and employees of the Company. When the stock grants are exercised, the Company can either select
to distribute newly issued shares or treasury shares, or compensate in cash based on the share price.
For a share-based payment transaction in which the terms of the arrangement provide the Company with the choice of whether to settle in cash or by
issuing equity instruments, the Company determined that it has a present obligation to settle in cash because the Company has a past practice and a stated
policy of settling in cash. Therefore, the Company accounts for the transaction in accordance with the requirements of cash-settled share-based payment
transactions.
The Company measures the services acquired and the liability incurred at fair value, and the fair value is recognized as expense and accrued expenses over
the vesting period. Until the liability is settled, the Company remeasures the fair value of the liability at the end of each reporting period and at the date of
settlement, with any changes in fair value recognized in profit or loss for the year.
3.12.4 Termination benefits
Termination benefits are employee benefits provided in exchange for the termination of an employee’s employment as a result of either (a) the Company
decision to terminate an employee’s employment before the normal retirement date; or (b) an employee’s decision to accept an offer of benefits in
exchange for the termination of employment. The Company recognizes liabilities and expenses for termination benefits at the earlier of the following
dates: when the Company can no longer withdraw the offer of those benefits and when the Company recognizes costs for a restructuring that is within the
scope of Korean IFRS 1037 and involves the payment of termination benefits. Termination benefits are measured by considering the number of employees
expected to accept the offer in the case of a voluntary early retirement. Termination benefits which are not expressed to be settled wholly before 12
months after the end of the reporting period are discounted to present values.
3.13 Income Tax Expenses
Income tax expense comprises current tax expense and deferred income tax expense. Current and deferred income tax are recognized as income or
expense and included in profit or loss for the year, except to the extent that the tax arises from (a) a transaction or event which is recognized either in other
comprehensive income or directly in equity and (b) a business combination.
KB Financial Group Annual Report 2019272

Current income tax
Current income tax is the amount of income taxes payable in respect of the taxable profit (loss) for a period. A difference between the taxable profit and
accounting profit may arise when income or expense is included in accounting profit in one period but is included in taxable profit in a different period.
Differences may also arise if there is revenue that is exempt from taxation or expenses that is not deductible in determining taxable profit (loss). Current
income tax liabilities (assets) for the current and prior periods are measured at the amount expected to be paid to (recovered from) the taxation authorities,
using the tax rates (and tax laws) that have been enacted or substantively enacted by the end of the reporting period.
The Company offsets current income tax assets and current income tax liabilities if, and only if, the Company (a) has a legally enforceable right to offset the
recognized amounts and (b) intends either to settle on a net basis, or to realize the asset and settle the liability simultaneously.
Deferred income tax
Deferred income tax is recognized, using the asset-liability method, on temporary differences arising between the tax based amount of assets and liabilities
and their carrying amount in the financial statements. Deferred income tax liabilities are recognized for all taxable temporary differences and deferred
income tax assets are recognized for all deductible temporary differences to the extent that it is probable that taxable profit will be available against which
the deductible temporary difference can be utilized. However, deferred income tax liabilities are not recognized if they arise from the initial recognition
of goodwill; deferred income tax is not accounted for if it arises from initial recognition of an asset or liability in a transaction other than a business
combination that at the time of the transaction affects neither accounting nor taxable profit or loss.
The carrying amount of a deferred income tax asset is reviewed at the end of each reporting period. The Company reduces the carrying amount of a
deferred income tax asset to the extent that it is no longer probable that sufficient taxable profit will be available to allow the benefit of part or all of that
deferred income tax asset to be utilized.
Deferred income tax assets and liabilities are measured at the tax rates that are expected to be applied to the period when the asset is realized or the
liability is settled, based on tax rates (and tax laws) that have been enacted or substantively enacted by the end of the reporting period. The measurement
of deferred income tax liabilities and deferred income tax assets reflects the tax consequences that would follow from the manner in which the Company
expects, at the end of the reporting period, to recover or settle the carrying amount of its assets and liabilities.
The Company offsets deferred income tax assets and deferred income tax liabilities when the Company has a legally enforceable right to offset current
income tax assets against current income tax liabilities; and the deferred income tax assets and the deferred income tax liabilities relate to income taxes
levied by the same taxation authority on either the same taxable entity; or different taxable entities which intend either to settle current income tax
liabilities and assets on a net basis, or to realize the assets and settle the liabilities simultaneously, in each future period in which significant amounts of
deferred income tax liabilities or assets are expected to be settled or recovered.
Uncertain tax positions
Uncertain tax positions arise from a claim for rectification brought by the Company, an appeal for a refund of tax levied by the tax authorities, or others
due to different interpretation of tax laws or others. The Company recognizes its uncertain tax positions in the separate financial statements based on
the guidance in Korean IFRS 1012. The income tax asset is recognized if a tax refund is probable for taxes paid and levied by the tax authority. However,
interest and penalties related to income tax are recognized in accordance with Korean IFRS 1037.
3.14 Earnings per Share
The Company calculates basic earnings per share amounts and diluted earnings per share amounts for profit or loss attributable to ordinary equity holders
and presents them in the statement of comprehensive income. Basic earnings per share is calculated by dividing profit or loss attributable to ordinary
equity holders by the weighted average number of ordinary shares outstanding during the period. For the purpose of calculating diluted earnings per share,
the Company adjusts profit or loss attributable to ordinary equity holders and the weighted average number of shares outstanding for the effects of all
dilutive potential ordinary shares including convertible bond and share option.
3.15 Leases
As explained in Note 2 above, the Company has changed its accounting policy for leases. The impact of the new accounting policies is disclosed in Note 31.
Lease income from operating leases where the Company is a lessor is recognized in income on a straight-line basis over the lease term. Initial direct costs
incurred in obtaining an operating lease are added to the carrying amount of the underlying asset and recognized as expense over the lease term on the
same basis as lease income. The respective leased assets are included in the statement of financial position based on their nature. The Company did not
need to make any adjustments to the accounting for assets held as a lessor as a result of adopting the new leasing standard.
At inception of a contract, the Company is required to assess whether the contract is, or contains, a lease. Also, at the date of initial application, the
Company has assessed whether the contract is, or contains, a lease in accordance with the standard. However, the Company did not reassess all contracts
as the Company elected to apply the practical expedient not to apply the standard to contracts that were not previously identified as containing a lease. On
the basis of the date of initial application, the Company assesses whether the contract is, or contains, a lease.
Financial Section 273

A lessee is required to recognize a right-of-use asset (lease assets) representing its right to use the underlying leased asset and a lease liability representing
its obligation to make lease payments. Assets and liabilities arising from a lease are initially measured on a present value basis.
Lease liabilities include the net present value of the following lease payments:
- Fixed payments (including in-substance fixed payments), less any lease incentives receivable
- Variable lease payment that are based on an index or a rate
- Amounts expected to be payable by the lessee under residual value guarantees
- The exercise price of a purchase option if the lessee is reasonably certain to exercise that option, and
- Payments of penalties for terminating the lease, if the lease term reflects the lessee exercising that option
The lease payments are discounted using the interest rate implicit in the lease. If that rate cannot be determined, the lessee’s incremental borrowing rate is
used, being the rate that the lessee would have to pay to borrow the funds necessary to obtain an asset of similar value in a similar economic environment
with similar terms and conditions.
Right-of-use assets are measured at cost comprising the following:
- The amount of the initial measurement of lease liability
- Any lease payments made at or before the commencement date less any lease incentives received
- Any initial direct costs, and
- Restoration costs
However, short-term lease (lease that, at the commencement date, has a lease term of 12 months or less) and lease of low-value assets (For example,
underlying leased asset under $ 5,000) are permitted to elect exceptional conditions.
The right-of-use asset is depreciated over the shorter of the asset’s useful life and the lease term.
Related to sale and leaseback, an entity (seller-lessee) is required to applying Korean IFRS 1115 ‘Revenue from Contracts with Customers’ to determine
whether the transfer of an asset is accounted for as a sale of that asset. However, the Company has not reassessed sale and leaseback transactions entered
into before the date of initial application.
3.16 Operating Segments
The Company is composed of a single operating segment. Therefore, disclosures on segments are omitted in accordance with Korean IFRS 1108, Operating Segments.
4. Financial Risk Management4.1 Summary
4.1.1 Overview of financial risk management policy
The financial risks that the Company is exposed to are credit risk, market risk, liquidity risk and others.
The note regarding financial risk management provides information about the risks that the Company is exposed to, including the objectives, policies,
assessment and management process of risks. Additional quantitative information is disclosed throughout the separate financial statements.
The Company’s risk management system focuses on increasing transparency, developing the risk management environment, and the preemptive response
to risk due to rapid changes in the financial environment to support the Company’s long-term strategy and business decisions efficiently. Credit risk, market
risk and liquidity risk have been recognized as the Company’s key risks. These risks are measured and managed in Internal Capital or VaR (Value at Risk)
using a statistical method.
4.1.2 Risk management organization
Risk Management Committee
The Risk Management Committee establishes risk management strategies in accordance with the directives of the Board of Directors and determines the
Company’s target risk appetite. The committee approves significant risk matters and reviews the level of risks that the Company is exposed to and the
appropriateness of the Company’s risk management operations as an ultimate decision-making authority.
KB Financial Group Annual Report 2019274
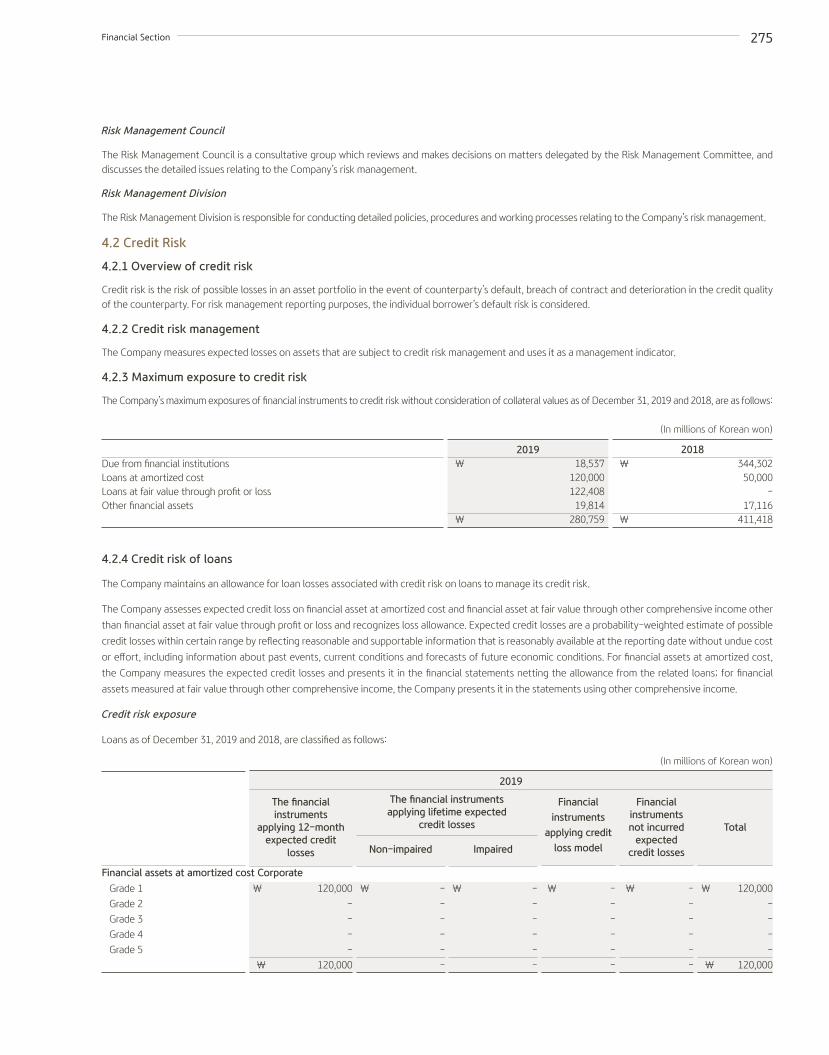
4.2.4 Credit risk of loans
The Company maintains an allowance for loan losses associated with credit risk on loans to manage its credit risk.
The Company assesses expected credit loss on financial asset at amortized cost and financial asset at fair value through other comprehensive income other
than financial asset at fair value through profit or loss and recognizes loss allowance. Expected credit losses are a probability-weighted estimate of possible
credit losses within certain range by reflecting reasonable and supportable information that is reasonably available at the reporting date without undue cost
or effort, including information about past events, current conditions and forecasts of future economic conditions. For financial assets at amortized cost,
the Company measures the expected credit losses and presents it in the financial statements netting the allowance from the related loans; for financial
assets measured at fair value through other comprehensive income, the Company presents it in the statements using other comprehensive income.
Credit risk exposure
Loans as of December 31, 2019 and 2018, are classified as follows:
Risk Management Council
The Risk Management Council is a consultative group which reviews and makes decisions on matters delegated by the Risk Management Committee, and discusses the detailed issues relating to the Company’s risk management.
Risk Management Division
The Risk Management Division is responsible for conducting detailed policies, procedures and working processes relating to the Company’s risk management.
4.2 Credit Risk
4.2.1 Overview of credit risk
Credit risk is the risk of possible losses in an asset portfolio in the event of counterparty’s default, breach of contract and deterioration in the credit quality of the counterparty. For risk management reporting purposes, the individual borrower’s default risk is considered.
4.2.2 Credit risk management
The Company measures expected losses on assets that are subject to credit risk management and uses it as a management indicator.
4.2.3 Maximum exposure to credit risk
The Company’s maximum exposures of financial instruments to credit risk without consideration of collateral values as of December 31, 2019 and 2018, are as follows:
Due from financial institutionsLoans at amortized costLoans at fair value through profit or lossOther financial assets
2018\ 344,302
50,000-
17,116\ 411,418
2019\ 18,537
120,000122,408
19,814\ 280,759
(In millions of Korean won)
(In millions of Korean won)
Grade 1
Grade 2
Grade 3
Grade 4
Grade 5
Financial instruments
applying credit loss model
\ -
-
-
-
-
-
Financialinstrumentsnot incurred
expectedcredit losses
\ -
-
-
-
-
-
Total
\ 120,000
-
-
-
-
\ 120,000
Non-impaired
\ -
-
-
-
-
-
The financial instruments
applying 12-month expected credit
losses
\ 120,000
-
-
-
-
\ 120,000
Impaired
\ -
-
-
-
-
-
The financial instruments applying lifetime expected
credit losses
2019
(In millions of Korean won)
Financial assets at amortized cost Corporate
Financial Section 275

4.2.5 Credit risk of due from financial institutions
The credit quality of due from financial institutions as of December 31, 2019 and 2018, are classified as follows:
Due from financial institutionsGrade 1
Grade 2
Grade 3
Grade 4
Grade 5
The financial instruments
applying 12-month expected credit
losses
\ 18,537
-
-
-
-
\ 18,537
Financial instruments not applying
expected credit losses
\ -
-
-
-
-
-
Total
\ 18,537
-
-
-
-
\ 18,537
Non-impaired
\ -
-
-
-
-
-
Impaired
\ -
-
-
-
-
-
The financial instruments applying lifetime expected
credit losses
2019
(In millions of Korean won)
Financial assets at amortized cost
Credit quality of loans graded according to the probability of default as of December 31, 2019 and 2018, are as follows:
Grade 1
Grade 2
Grade 3
Grade 4
Grade 5
Range of PD (%) (Probability of Default)
0.0 ~ 1.0
1.0 ~ 5.0
5.0 ~ 15.0
15.0 ~ 30.0
30.0 ~
Grade 1
Grade 2
Grade 3
Grade 4
Grade 5
2018
(In millions of Korean won)
Financial assets at amortized cost Corporate
Financial instruments
applying credit loss model
\ -
-
-
-
-
-
Financialinstrumentsnot incurred
expectedcredit losses
\ -
-
-
-
-
-
Total
\ 50,000
-
-
-
-
\ 50,000
Non-impaired
\ -
-
-
-
-
-
The financial instruments
applying 12-month expected credit
losses
\ 50,000
-
-
-
-
\ 50,000
Impaired
\ -
-
-
-
-
-
The financial instruments applying lifetime expected
credit losses
KB Financial Group Annual Report 2019276

4.2.6 Credit risk concentration analysis
Details of the Company’s loans by country as of December 31, 2019 and 2018, are as follows:
Details of the Company’s corporate loans by industry as of December 31, 2019 and 2018, are as follows:
Due from financial institutionsGrade 1
Grade 2
Grade 3
Grade 4
Grade 5
The financial instruments
applying 12-month expected credit
losses
\ 344,302
-
-
-
-
\ 344,302
Financial instruments not applying
expected credit losses
\ -
-
-
-
-
-
Total
\ 344,302
-
-
-
-
\ 344,302
Non-impaired
\ -
-
-
-
-
-
Impaired
\ -
-
-
-
-
-
The financial instruments applying lifetime expected
credit losses
2018
(In millions of Korean won)
Financial assets at amortized cost
Korea
Financial institutions
Korea
Financial institutions
Corporate loans
\ 120,000
\ 120,000
Corporate loans
\ 120,000
\ 120,000
Corporate loans
\ 50,000
\ 50,000
Corporate loans
\ 50,000
\ 50,000
%
100.00
100.00
%
100.00
100.00
%
100.00
100.00
%
100.00
100.00
Allowances
\ -
\ -
Allowances
\ -
\ -
Allowances
\ -
\ -
Allowances
\ -
\ -
Carrying amount
\ 120,000
\ 120,000
Carrying amount
\ 120,000
\ 120,000
Carrying amount
\ 50,000
\ 50,000
Carrying amount
\ 50,000
\ 50,000
2019
2019
2018
2018
(In millions of Korean won)
(In millions of Korean won)
(In millions of Korean won)
(In millions of Korean won)
Financial Section 277

Details of the Company’s due from financial institutions by industry as of December 31, 2019 and 2018, are as follows:
Details of the Company’s due from financial institutions by country as of December 31, 2019 and 2018, are as follows:
Due from financial institutions at amortized cost Financial institutions
Due from financial institutions at amortized cost Korea
Due from financial institutions at amortized cost Korea
Due from financial institutions at amortized cost Financial institutions
Corporate loans
\ 18,537
\ 18,537
Corporate loans
\ 18,537
\ 18,537
Corporate loans
\ 344,302
\ 344,302
Corporate loans
\ 344,302
\ 344,302
%
100.00
100.00
%
100.00
100.00
%
100.00
100.00
%
100.00
100.00
Allowances
\ -
\ -
Allowances
\ -
\ -
Allowances
\ -
\ -
Allowances
\ -
\ -
Carrying amount
\ 18,537
\ 18,537
Carrying amount
\ 18,537
\ 18,537
Carrying amount
\ 344,302
\ 344,302
Carrying amount
\ 344,302
\ 344,302
2019
2019
2018
2018
(In millions of Korean won)
(In millions of Korean won)
(In millions of Korean won)
(In millions of Korean won)
4.3 Liquidity Risk
4.3.1 Overview of liquidity risk
Liquidity risk is a risk that the Company becomes insolvent due to uncertain liquidity caused by unexpected cash outflows, or a risk of borrowing high
interest debts or disposal of liquid and other assets at a substantial discount. The Company manages its liquidity risk through analysis of the contractual
maturity of interest-bearing assets and liabilities, assets and liabilities related to the other cash flow, and off-balance sheet items related to cash flow of
currency derivative instruments and others.
Cash flows disclosed for the maturity analysis are undiscounted contractual principal and interest to be received (paid) and; thus, are not identical to the
amount in the financial statements that are based on the present value of expected cash flows in some cases. The amount of interest to be received or paid
on floating rate assets and liabilities is measured on the assumption that the current interest rate would be the same through the maturity.
4.3.2. Liquidity risk management
The liquidity risk is managed by liquidity management principles and related guidelines which are applied to the risk management policies and procedures
that address all the possible risks that arise from the overall business of the Company.
KB Financial Group Annual Report 2019278

4.3.3. Analysis of remaining contractual maturity of financial assets and liabilities
The remaining contractual maturity of financial assets and liabilities as of December 31, 2019 and 2018, are as follows:
4.4 Market Risk
4.4.1 Concept
Market risk is the risk of possible losses which arise from changes in market factors; such as, interest rate, stock price, foreign exchange rate and other
market factors that affect the fair value of future cash flows of financial instruments. The most significant risk of the Company is interest rate risk.
4.4.2 Interest rate risk
Definition of interest rate risk
Interest rate risk is the risk that may occur due to changes in interest rates; such as, the value (fair value) change risk in statement of financial position line
items and cash flow change risk in interest income and expense arising from investing and financing activities.
Financial assetsCash and due from financial institutions1
Financial assets at fair value through profit or loss2
Loans at amortized costOther financial assets
Financial liabilitiesDebentures Lease liabilitiesOther financial liabilities
Financial assetsCash and due from financial institutions1
Financial assets at fair value through profit or loss2
Loans at amortized costOther financial assets
Financial liabilitiesDebts DebenturesOther financial liabilities
On demand
\ 18,619
122,408
--
\ 141,027
\ ---
\ -
On demand
\ 284,350
---
\ 284,350
\ ---
\ -
Up to 1 month
\ -
--
925\ 925
\ 105,903 44
1,819\ 107,766
Up to 1 month
\ 20,030
--
1,532\ 21,562
\ -6,0097,555
\ 13,564
1-3
months
\ -
-71,523
-\ 71,523
\ 224,57885
-\ 224,663
1-3
months
\ 40,178
---
\ 40,178
\ 300,000103,180
-\ 403,180
3-12
months
\ -
-51,09815,660
\ 66,758
\ 723,474249
-\ 723,723
3-12
months
\ -
-51,07514,399
\ 65,474
\ -870,199
-\ 870,199
1-5
years
\ -
---
\ -
\ 3,624,305215
-\ 3,624,520
1-5
years
\ -
---
\ -
\ -3,636,044
-\ 3,636,044
Over 5 years
\ -
291,501--
\ 291,501
\ 1,134,756--
\ 1,134,756
Over 5 years
\ -
289,179--
\ 289,179
\ -1,187,038
-\ 1,187,038
Total
\ 18,619
413,909122,621
16,585\ 571,734
\ 5,813,016593
1,819\ 5,815,428
Total
\ 344,558
289,17951,07515,931
\ 700,743
\ 300,0005,802,470
7,555\ 6,110,025
2019
2018
(In millions of Korean won)
(In millions of Korean won)
1 The amount of ₩ 3 million, which is restricted due from the financial institutions as of December 31, 2019 and 2018, is excluded.2 Hybrid securities included in financial assets at fair value through profit or loss are included in the ‘Over 5 years’ category since the point of disposal is uncertain.
Financial Section 279

Observation method and management indicator on interest rate risk
The main objective of interest rate risk management is to protect asset values against interest rate fluctuations. The Company manages the risk through
measurement and management of Value at Risk for the interest rate.
Interest Rate VaR
Interest rate VaR is the maximum possible loss due to interest rate risk at a 99.9% confidence level. The measurement results of risk as of December 31,
2019 and 2018, are as follows:
4.5 Capital Adequacy
The Company complies with the capital adequacy standard established by the Financial Services Commission. The capital adequacy standard is based
on Basel III published by Basel Committee on Banking Supervision in Bank for International Settlements in June 2011, and was implemented in Korea in
December 2013. The Company is required to maintain a minimum Common Equity Tier 1 ratio of at least 8.0%(2018: 7.125%), a minimum Tier 1 ratio of
9.5%(2018: 8.625%) and a minimum Total Regulatory Capital ratio of 11.5%(2018: 10.625%) as of December 31, 2019.
The Company’s equity capital is classified into three categories in accordance with the Supervisory Regulations and Detailed Supervisory Regulations on
Financial Holding Companies as below:
- Common Equity Tier 1 Capital: Common equity Tier 1 Capital represents the issued capital that takes the first and proportionately greatest share of any
losses and represents the most subordinated claim in liquidation of the Company, and not repaid outside of liquidation. It includes common shares issued,
capital surplus, retained earnings, non-controlling interests of consolidated subsidiaries, accumulated other comprehensive income, other capital surplus
and others.
- Additional Tier 1 Capital: Additional Tier 1 Capital includes (i) perpetual instruments issued by the Company that meet the criteria for inclusion in
Additional Tier 1 capital, and (ii) stock surplus resulting from the issue of instruments included in Additional Tier 1 capital and others.
- Tier 2 Capital: Tier 2 Capital represents the capital that takes the proportionate share of losses in the liquidation of the Company. Tier 2 Capital includes
a fund raised by issuing subordinated debentures maturing in not less than 5 years that meet the criteria for inclusion in Additional Tier 2 capital, and
the allowance for loan losses which are accumulated for assets classified as normal or precautionary as a result of classification of asset soundness in
accordance with Regulation on Supervision of Financial Holding Companies and others.
Risk weighted asset means the inherent risks in the total assets held by the Company. The Company calculates risk weighted asset by each risk (credit risk,
market risk, and operational risk) based on the Supervisory Regulations and Detailed Supervisory Regulations on Financial Holding Companies and uses it
for BIS ratio calculation.
The Company assesses and monitors its adequacy of capital by using the internal assessment and management policy of the capital adequacy. The
assessment of the capital adequacy is conducted by comparing available capital (actual amount of available capital) and Internal Capital (amount of capital
enough to cover all significant risks under target credit rate set by the Company). The Company monitors the soundness of finance and provides risk
adjusted basis for performance review using the assessment of the capital adequacy.
Internal Capital is the amount of capital to prevent the inability of payment due to unexpected loss in the future. The Company measures, allocates and
monitors Internal Capital by risk type and subsidiaries.
The Risk Management Council of the Company determines the Company’s risk appetite and allocates Internal Capital by risk type and subsidiary. Each
subsidiary efficiently operates its capital within a range of allocated Internal Capital. The Risk Management Department of the Company monitors the limit
on Internal Capital and reports the results to management and the Risk Management Council. The Company maintains the adequacy of capital through
proactive review and approval of the Risk Management Committee when the Internal Capital is expected to exceed the limits due to new business or
business expansion.
Interest rate VaR
2019\ 146,472
2018\ 149,774
(In millions of Korean won)
KB Financial Group Annual Report 2019280

Equity Capital: Tier 1 Capital Common Equity Tier 1 Capital Additional Tier 1 Capital Tier 2 CapitalRisk-weighted assets:Equity Capital (%): Tier 1 Capital (%) Common Equity Tier 1 Capital (%)
2019 \ 36,989,005
35,420,18434,703,953
716,2311,568,821
255,382,30214.4813.8713.59
2018 \ 34,476,172
32,993,82632,993,826
-1,482,346
236,099,01714.6013.9713.97
(In millions of Korean won)
Details of the Company’s capital adequacy calculation in line with Basel III, as of December 31, 2019 and 2018, are as follows:
5. Financial Assets and Financial Liabilities5.1 Classification and Fair value of Financial Instruments
The carrying amounts and fair value of financial assets and liabilities by category as of December 31, 2019 and 2018, are as follows:
Financial assetsFinancial assets at fair value through profit or lossFinancial assets at amortized cost
Due from financial institutions
Loans
Other financial assets
Financial liabilitiesFinancial liabilities at amortized cost
Debentures
Other financial liabilities
Financial assetsFinancial assets at fair value through profit or lossFinancial assets at amortized cost
Due from financial institutions
Loans
Other financial assets
Financial liabilitiesFinancial liabilities at amortized cost
Debts
Debentures
Other financial liabilities
Carrying amount
\ 413,909
18,537
120,000
19,814
572,260
5,543,446
14,940
\ 5,558,386
Carrying amount
\ 289,179
344,302
50,000
17,116
700,597
300,000
5,373,266
19,953
\ 5,693,219
Fair value
\ 413,909
18,537
120,000
19,814
572,260
5,631,217
14,940
\ 5,646,157
Fair value
\ 289,179
344,302
50,000
17,116
700,597
300,000
5,398,656
19,953
\ 5,718,609
2019
2018
(In millions of Korean won)
(In millions of Korean won)
Financial Section 281

Fair value is the amount for which an asset could be exchanged, or a liability could be settled, between knowledgeable, willing parties in an arm’s length
transaction. For each class of financial assets and financial liabilities, the Company discloses the fair value of that class of assets and liabilities in a way that
permits it to be compared with its carrying amount at the end of each reporting period. The best evidence of fair value of financial instruments is quoted
price in an active market.
Methods of determining fair value of financial instruments are as follows:
Fair value hierarchy
The Company believes that valuation methods used for measuring the fair values of financial instruments are reasonable and that the fair values recognized
in the statement of financial position are appropriate. However, the fair values of the financial instruments recognized in the statement of financial position
may be different if other valuation methods or assumptions are used. Additionally, as there is a variety of valuation techniques and assumptions used in
measuring fair value, it may be difficult to reasonably compare the fair value with that of other financial institutions.
The Company classifies and discloses fair value of the financial instruments into the three-level hierarchy as follows:
Level 1 The fair values are based on quoted prices (unadjusted) in active markets for identical assets or liabilities that the entity can access at the
measurement date.
Level 2 The fair values are based on inputs other than quoted prices included within Level 1 that are observable for the asset or liability, either directly or indirectly.
Level 3 The fair values are based on unobservable inputs for the asset or liability.
When the inputs used to measure the fair value of an asset or a liability might be categorized within different levels of the fair value hierarchy, the fair value
measurement is categorized in its entirety in the same level of the fair value hierarchy as the lowest level input that is significant to the entire measurement.
Assessing the significance of a particular input to the entire measurement requires judgment, taking into account factors specific to the asset or liability.
If a fair value measurement uses observable inputs that require significant adjustment based on unobservable inputs, that measurement is a Level 3
measurement.
Cash and due from financial institutions
Investment securities
Derivatives
Loans at amortized cost
Debts
Debentures
Other financial assets and liabilities
The carrying amounts of cash and demand due from financial institutions and payment due from financial institutions
are a reasonable approximation of fair values. These financial instruments do not have a fixed maturity and are
receivable on demand. Fair value of ordinary due from financial institutions is measured using DCF model.
The fair value of financial instruments that are quoted in active markets is determined using the quoted prices.
Fair value is determined through the use of external professional valuation institution where quoted prices are not
available. The institutions use one or more of the following valuation techniques including DCF Model, Free Cash Flow
to Equity Model, Imputed Market Value Model, Dividend Discount Model, Risk Adjusted Discount Rate Method, and
Net Asset Value Method.
For exchange traded derivatives, quoted price in an active market is used to determine fair value and for OTC
derivatives, fair value is determined using valuation techniques. The Company uses internally developed valuation
models that are widely used by market participants to determine fair values of plain vanilla OTC derivatives including
options, interest rate swaps, and currency swaps, based on observable market parameters. However, some complex
financial instruments are valued using appropriate models developed from generally accepted market valuation
models including the Finite Difference Method and the Monte Carlo Simulation or valuation results from independent
external professional valuation institution.
DCF model is used to determine the fair value of loans. Fair value is determined by discounting the expected cash
flows, which are contractual cash flows adjusted by the expected prepayment rate, at appropriate discount rate.
DCF model is used to determine the fair value of debts, but in the case of short-term maturity, the carrying amount is
used as the fair value.
Fair value is determined by using the valuations of external professional valuation institution, which are calculated
using market inputs.
The carrying amounts are reasonable approximation of fair values. These financial instruments are temporary accounts
used for other various transactions and their maturities are relatively short or not defined.
KB Financial Group Annual Report 2019282

Fair value hierarchy of financial assets and liabilities measured at fair value in the statements of financial position
The fair value hierarchy of financial assets measured at fair value in the statement of financial position as of December 31, 2019 and 2018, are as follows:
Fair value hierarchy of financial assets and liabilities whose fair values are disclosed
The fair value hierarchy of financial assets and liabilities whose fair values are disclosed as of December 31, 2019 and 2018, are as follows:
Financial assets Financial assets at fair value through profit or loss
Hybrid securities
Loans
Financial assetsCash and due from financial institutions1
Loans at amortized cost2
Other financial assets3
Financial liabilitiesDebentures
Other financial liabilities3
Financial assets Financial assets at fair value through profit or loss
Hybrid securities
Level 1
\ -
-
\ -
Level 1
\ -
-
-
-
-
-
\ -
Level 1
\ -
\ -
Level 2
\ -
122,408
\ 122,408
Level 2
\ 18,537
-
-
18,537
5,631,217
-
\ 5,631,217
Level 2
\ -
\ -
Level 3
\ 291,501
-
\ 291,501
Level 3
\ -
120,000
19,814
139,814
-
14,940
\ 14,940
Level 3
\ 289,179
\ 289,179
Total
\ 291,501
122,408
\ 413,909
Total
\ 18,537
120,000
19,814
158,351
5,631,217
14,940
\ 5,646,157
Total
\ 289,179
\ 289,179
2019
2019
2018
Fair value hierarchy
Fair value hierarchy
Fair value hierarchy
(In millions of Korean won)
(In millions of Korean won)
(In millions of Korean won)
Valuation techniques and inputs of financial assets and liabilities at fair value in the statements of financial position and classified as Level 2 as of December
31, 2019, are as follows:
Financial assets Financial assets at fair value through profit or loss
Loans
Fair value
\ 122,408
Valuation techniques
DCF model
Inputs
Interest, Discount rate, etc
2019
Financial Section 283

Valuation techniques and inputs used in the fair value measurement
For financial assets and liabilities whose carrying amount is a reasonable approximation of fair value, we do not disclose valuation techniques and inputs.
Valuation techniques and inputs of financial assets and liabilities whose fair values are disclosed and classified as Level 2 as of December 31, 2019 and 2018,
are as follows:
5.2 Level 3 of the Fair Value Hierarchy Disclosure
5.2.1 Valuation policy and process for fair value measurement categorized as Level 3
The Company uses external, independent and qualified professional valuer’s valuation to determine the fair value of the Company’s assets at the end of
every reporting period.
Financial assetsCash and due from financial institutions1
Loans at amortized cost2
Other financial assets3
Financial liabilitiesDebts4
Debentures
Other financial liabilities3
Level 1
\ -
-
-
-
-
-
-
\ -
Level 2
\ 284,302
-
-
284,302
300,000
5,398,656
-
\ 5,698,656
Level 3
\ 60,000
50,000
17,116
127,116
-
-
19,953
\ 19,953
Total
\ 344,302
50,000
17,116
411,418
300,000
5,398,656
19,953
\ 5,718,609
2018Fair value hierarchy
(In millions of Korean won)
1 Because due from financial institutions classified as level 2 are deposits on demand, carrying amounts are reasonable approximations of fair values. And due from financial
institutions classified as level 3 are due from financial institutions with residual maturity of less than 3 months, carrying amounts are reasonable approximations of fair values.2 Because loans at amortized cost classified as level 3 are loans with residual maturity of less than one year, carrying amounts are reasonable approximations of fair values.3 For other financial assets and other financial liabilities classified as level 3, carrying amounts are reasonable approximations of fair values.4 Since the remaining maturity of debts classified as level 2 is less than a year, carrying amounts are reasonable approximations of fair values.
Financial liabilities Debentures
2019
\ 5,631,217
2018
\ 5,398,656
Valuation Techniques
DCF model
Inputs
Discount rate
Fair value
(In millions of Korean won)
KB Financial Group Annual Report 2019284

5.2.2 Changes in fair value (Level 3) measured using valuation technique based on assumption that is unobservable in the market
Details of changes in Level 3 of the fair value hierarchy for the years ended December 31, 2019 and 2018, are as follows:
In relation to changes in Level 3 of the fair value hierarchy, total gains or losses recognized in profit or loss for the year, and profit or loss from financial
instruments held at the end of the reporting period in the statement of comprehensive income for the year ended December 31, 2019 and 2018, are as follows:
Beginning balanceTotal gains or losses- Profit or loss for the year- Other comprehensive incomePurchasesSalesIssuesSettlementsTransfers into Level 3Transfers out of Level 3Ending balance
Beginning balanceTotal gains or losses- Profit or loss for the year- Other comprehensive incomePurchasesSalesIssuesSettlementsTransfers into Level 3Transfers out of Level 3Ending balance
Financial assets at fair value through profit or loss
2019\ 289,179
2,322-------
\ 291,501
Financial assets at fair value through profit or loss
2018\ 284,485
4,694-------
\ 289,179
(In millions of Korean won)
(In millions of Korean won)
Total gains or losses included in
profit or loss for the year
Total gains or losses for the year
included in profit or loss for
financial instruments held at the end
of the reporting period
Gains from financial
investments at fair value through
profit or loss
₩ 2,322
₩ 2,322
Gains from financial
investments at fair value through
profit or loss
₩ 4,694
₩ 4,694
Other operating income
₩ -
₩ -
Other operating income
₩ -
₩ -
Net interest income
₩ -
₩ -
Net interest income
₩ -
₩ -
2019 2018
(In millions of Korean won)
Financial Section 285

5.2.3 Sensitivity analysis of changes in unobservable inputs
Information about fair value measurements using unobservable inputs as of December 31, 2019 and 2018, are as follows:
Financial assets
Financial assets at fair value
through profit or loss
Hybrid securities
Financial assets
Financial assets at fair value
through profit or loss
Hybrid securities
Fair value
\ 291,501
Fair value
\ 289,179
Valuation technique
Hull and
White Model,
Monte Carlo
Simulation
Valuation technique
Hull and
White Model,
Monte Carlo
Simulation
Inputs
Matrix YTM,
Additional spread
by grade, Risk
spread of
company, Valid
credit rating,
Disclosed
information of
securities, Interest
rate estimation
variability
Inputs
Matrix YTM,
Additional
spread by grade,
Risk spread of
company, Valid
credit rating,
Disclosed
information of
securities, Interest
rate estimation
variability
Unobservable inputs
Discount rate
Volatility of
interest rate
Unobservable inputs
Discount rate
Volatility of
interest rate
Relationship of unobservable inputs to
fair value
The lower the
discount rate,
the higher
the fair value
The higher the volatility,
the higher
the fair value
fluctuation
Relationship of unobservable inputs to
fair value
The lower the
discount rate,
the higher
the fair value
The higher the
volatility,
the higher
the fair value
fluctuation
Range of unobservable
inputs(%)
2.05 ~ 4.45
0.50
Range of unobservable
inputs(%)
2.43~4.80
0.47
2019
2018
(In millions of Korean won)
(In millions of Korean won)
KB Financial Group Annual Report 2019286

Sensitivity analysis of changes in unobservable inputs
Sensitivity analysis of financial instruments is performed to measure favorable and unfavorable changes in the fair value of financial instruments which are
affected by the unobservable parameters, using a statistical technique. When the fair value is affected by more than two input parameters, the amounts
represent the most favorable or most unfavorable outcome. There are hybrid securities whose fair value changes are recognized in profit or loss.
The results of the sensitivity analysis from changes in inputs are as follows:
6. Due from Financial Institution
Details of due from financial institution as of December 31, 2019 and 2018, are as follows:
Details of a maturity analysis of due from financial institution, excluding restricted cash, as of December 31, 2019 and 2018, are as follows:
Financial assets Financial assets at fair value through profit or loss
Hybrid securities1
Financial assets Financial assets at fair value through profit or loss
Hybrid securities1
Favorable changes
\ 3,215
\ 3,215
Favorable changes
\ 5,882
\ 5,882
Favorable changes
₩ -
₩ -
Favorable changes
₩ -
₩ -
Unfavorable changes
\ (3,195)
\ (3,195)
Unfavorable changes
\ (5,782)
\ (5,782)
Unfavorable changes
₩ -
₩ -
Unfavorable changes
₩ -
₩ -
2019
2018
Recognition in profit or loss
Recognition in profit or loss
Other comprehensive income
Other comprehensive income
(In millions of Korean won)
(In millions of Korean won)
1 For equity securities, the changes in fair value are calculated by increasing or decreasing correlations between discount rate (2.05 ~ 4.45%) which are principal unobservable
input parameters. And, the changes in fair value are calculated by increasing or decreasing the correlation coefficient between short-term and long-term interests or
volatility of the interest rates, which are unobservable inputs, by 1%.
1 For equity securities, the changes in fair value are calculated by increasing or decreasing correlations between discount rate (2.43 ~ 4.80%) which are principal unobservable
input parameters. And, the changes in fair value are calculated by increasing or decreasing the correlation coefficient between short-term and long-term interests or
volatility of the interest rates, which are unobservable inputs, by 1%.
Due from financial institution
in Korean won
Due from banks
Financial Institution
Kookmin Bank
Standard Chartered Bank
The Korea Securities Finance
Corporation
BNK Busan Bank
Interest rate(%) (As of December 31, 2019)
0.00 ~ 1.20
-
-
-
2019
\ 18,537
-
-
-
\ 18,537
2018
\ 69,621
41,350
100,000
133,331
\ 344,302
(In millions of Korean won)
Due from financial institution in Korean won
Due from financial institution in Korean won
Up to 3 months
₩ 18,534
Up to 3 months
₩ 344,299
6~12 months
₩ -
6~12 months
₩ -
Over 3 years
₩ -
Over 3 years
₩ -
3~6 months
₩ -
3~6 months
₩ -
1~3 years
₩ -
1~3 years
₩ -
Total
₩ 18,534
Total
₩ 344,299
2019
2018
(In millions of Korean won)
(In millions of Korean won)
Financial Section 287

Restricted cash from financial institution as of December 31, 2019 and 2018, are as follows:
Details of loan types and customer types of loans to customers, other than banks, as of December 31, 2019, are as follows:
7. Financial Assets at Fair Value through Profit or LossDetails of financial assets at fair value through profit or loss as of December 31, 2019 and 2018, are as follows:
8. Loans at Amortized CostDetails of loans at amortized cost as of December 31, 2019 and 2018, are as follows:
Due from financial institution in Korean won
2019
₩ 3
₩ 3
Financial Institution
Kookmin Bank
2018
₩ 3
₩ 3
Reason for restriction
Pledged as collateral for
the overdraft establishment
(In millions of Korean won)
Financial assets at fair value through profit or loss
Hybrid securities
Loans
Financial assets at fair value through profit or loss
Loans at amortized cost
Less: Allowances for loan losses
Carrying amount
2019
\ 291,501
122,408
\ 413.5,909
2019
\ 120,000
-
\ 120,000
2018
\ 289,179
-
\ 289,179
2018
,\ 50,000
-
\ 50,000
(In millions of Korean won)
(In millions of Korean won)
Reverse repurchase
agreements
Proportion (%)
Less: Allowances
Reverse repurchase
agreements
Proportion (%)
Less: Allowances
Retail\ -
-
-
-
\ -
Retail\ -
-
-
-
\ -
Credit card\ -
-
-
-
\ -
Credit card\ -
-
-
-
\ -
Corporate\ 120,000
120,000
100.00
-
\ 120,000
Corporate\ 50,000
50,000
100.00
-
\ 50,000
Total\ 120,000
120,000
100.00
-
\ 120,000
Total\ 50,000
50,000
100.00
-
\ 50,000
2019
2018
(In millions of Korean won)
(In millions of Korean won)
KB Financial Group Annual Report 2019288

9. Investments in SubsidiariesDetails of subsidiaries as of December 31, 2019, are as follows:
Name of subsidiaryKookmin Bank
KB Securities Co., Ltd.
KB Insurance Co., Ltd
KB Kookmin Card Co., Ltd.
KB Asset Management Co., Ltd.
KB Capital Co., Ltd.
KB Life Insurance Co., Ltd.
KB Real Estate Trust Co., Ltd.
KB Savings Bank Co., Ltd.
KB Investment Co., Ltd.
KB Data System Co., Ltd.
KB Credit Information Co., Ltd.
IndustryBanking and domestic, foreign exchange transaction
Financial investment
Insurance
Credit card
Investment advisory and collective investment
Financial leasing
Life insurance
Real estate trust management
Savings banking
Capital investment
System software, development and supply
Collection of receivables and credit investigation
LocationKorea
Korea
Korea
Korea
Korea
Korea
Korea
Korea
Korea
Korea
Korea
Korea
Investments in subsidiaries as of December 31, 2019 and 2018, are as follows:
Name of subsidiary
Kookmin Bank
KB Securities Co., Ltd.
KB Insurance Co., Ltd
KB Kookmin Card Co., Ltd.
KB Asset Management Co., Ltd.
KB Capital Co., Ltd.1
KB Life Insurance Co., Ltd.
KB Real Estate Trust Co., Ltd.
KB Savings Bank Co., Ltd.
KB Investment Co., Ltd. 1
KB Data System Co., Ltd.
KB Credit Information Co., Ltd.
Ownership(%)
100.00
100.00
100.00
100.00
100.00
100.00
100.00
100.00
100.00
100.00
100.00
100.00
Number of Issued Shares
404,379,116
298,620,424
66,500,000
92,000,000
7,667,550
23,349,208
91,200,000
16,000,000
8,001,912
22,525,328
800,000
1,252,400
(In millions of Korean won, except for shares and ownership %)
2019
₩ 14,821,721
3,342,391
2,375,430
1,953,175
96,312
623,811
485,314
121,553
157,544
154,910
6,334
23,621
\ 24,162,116
2018
₩ 14,821,721
3,342,391
2,375,430
1,953,175
96,312
573,811
485,314
121,553
157,544
104,910
6,334
23,621
\ 24,062,116
Carrying amount
As of December 31, 2019
1 Carrying amount of investments in KB Capital Co., Ltd. Increased \ 500,000 in million due to paid-in capital increase and KB investment Co., Ltd. increased \ 500,000 in
million due to free capital increase and paid-in capital increase for the year ended December 31, 2019.
Changes in accumulated impairment losses on investments in subsidiaries for the years ended December 31, 2019 and 2018, are as follows:
Accumulated impairment losses on
investments in subsidiaries
Accumulated impairment losses on
investments in subsidiaries
Ending
₩ (51,742)
Ending
₩ (51,742)
Impairment
₩ -
Impairment
₩ -
Others
₩ -
Others
₩ -
Beginning
₩ (51,742)
Beginning
₩ (51,742)
2019
2018
(In millions of Korean won)
(In millions of Korean won)
Financial Section 289

10. Property and EquipmentDetails of property and equipment as of December 31, 2019 and 2018, are as follows:
Leasehold improvements
Equipment and others
Right-of-use property and equipment -Buildings
Right-of-use property and equipment -Vehicles
Right-of-use property and equipment -Others
Leasehold improvements
Equipment and others
Acquisition cost
\ 4,119
4,818
683
904
36
\ 10,560
Acquisition cost
\ 1,034
5,455
\ 6,489
Accumulated impairment losses
\ -
-
-
-
-
\ -
Accumulated impairment losses
\ -
-
\ -
Accumulated depreciation
\ (2,309)
(2,946)
(490)
(624)
(21)
\ (6,390)
Accumulated depreciation
\ (842)
(3,462)
\ (4,304)
Carrying amount
\ 1,810
1,872
193
280
15
\ 4,170
Carrying amount
\ 192
1,993
\ 2,185
2019
2018
(In millions of Korean won)
(In millions of Korean won)
The changes in property and equipment for the years ended December 31, 2019 and 2018, are as follows:
Leasehold improvements
Equipment and others
Right-of-use assets -Buildings
Right-of-use assets -Vehicles
Right-of-use assets -Others
Leasehold improvements
Equipment and others
Depreciation\ (1,988)
(1,252)
(496)
(627)
(21)
\ (4,384)
Depreciation\ (95)
(408)
\ (503)
Acquisition2
\ 3,606
1,165
432
521
21
\ 5,745
Acquisition\ 211
1,780
\ 1,991
Ending\ 1,810
1,872
193
280
15
\ 4,170
Ending\ 192
1,993
\ 2,185
Disposal3
\ -
(34)
(6)
(20)
-
\ (60)
Disposal\ -
-
\ -
Beginning1
\ 192
1,993
263
406
15
\ 2,869
Beginning\ 76
621
\ 697
2019
2018
(In millions of Korean won)
(In millions of Korean won)
1 Right-of-use assets are restated based on Korean IFRS 1116.2 Increase in right-of-use assets during the year.3 Decrease in right-of-use assets during the year.
KB Financial Group Annual Report 2019290

11. Intangible AssetsDetails of intangible assets as of December 31, 2019 and 2018, are as follows:
Software
Membership rights
Other intangible assets
Software
Membership rights
Other intangible assets
Acquisition cost
\ 4,849
9,765
5,451
\ 20,065
Acquisition cost
\ 3,679
9,623
4,635
\ 17,937
Accumulated impairment losses
\ -
(1,786)
-
\ (1,786)
Accumulated impairment losses
\ -
(1,814)
-
\ (1,814)
Accumulated amortization
\ (3,101)
-
(4,086)
\ (7,187)
Accumulated amortization
\ (2,748)
-
(3,729)
\ (6,477)
Carrying amount
\ 1,748
7,979
1,365
\ 11,092
Carrying amount
\ 931
7,809
906
\ 9,646
2019
2018
(In millions of Korean won)
(In millions of Korean won)
The changes in intangible assets for the years ended December 31, 2019 and 2018, are as follows:
Software
Membership rights
Other intangible assets
Software
Membership rights
Other intangible assets
Ending\ 1,748
7,979
1,365
\ 11,092
Ending\ 931
7,809
906
\ 9,646
Amortization\ (353)
-
(356)
\ (709)
Amortization\ (168)
-
(193)
\ (361)
Acquisition\ 1,170
215
815
\ 2,200
Acquisition\ 607
-
520
\ 1,127
Impairment1
\ -
(4)
-
\ (4)
Impairment1
\ -
50
-
\ 50
Disposal\ -
(41)
-
\ (41)
Disposal\ -
(34)
-
\ (34)
Beginning\ 931
7,809
906
\ 9,646
Beginning\ 492
7,793
579
\ 8,864
2019
2018
(In millions of Korean won)
(In millions of Korean won)
1 Impairment loss for membership rights of intangible assets with indefinite useful life was recognized when its recoverable amount is lower than its carrying amount and
reversal of impairment losses was recognized when its recoverable amount is higher than its carrying amount.
The changes in accumulated impairment losses on intangible assets for the years ended December 31, 2019 and 2018, are as follows:
Accumulated impairment losses on
intangible assets
Accumulated impairment losses on
intangible assets
Ending
\ (1,786)
Ending
\ (1,814)
Impairment
\ (4)
Reversal
\ 50
Disposal
\ 32
others
\ -
Beginning
\ (1,814)
Beginning
\ (1,864)
2019
2018
(In millions of Korean won)
(In millions of Korean won)
Financial Section 291

12. Deferred Income Tax Assets and LiabilitiesDetails of deferred income tax assets and liabilities as of December 31, 2019 and 2018, are as follows:
Unrecognized deferred income tax assets
No deferred income tax assets have been recognized for the deductible temporary difference of \ 2,896,164 million, \ 66,162 million and \ 51,742 million
associated with investments in subsidiaries, tax loss carryforwards and impairment losses on investments in subsidiaries, respectively, as of December 31,
2019, due to the uncertainty that all these will be realized in the future.
Unrecognized deferred income tax liabilities
No deferred income tax liabilities have been recognized for the taxable temporary difference of \ 2,395,805 million associated with investments in
subsidiaries as of December 31, 2019, due to the following reasons:
- The Company is able to control the timing of the reversal of the temporary difference.
- It is probable that the temporary difference will not be reversed in the foreseeable future.
Share-based payments
Membership rights
Defined benefit obligation
Plan assets
Short-term employee benefits
Gains on valuation of financial assets at fair
value through profit or loss
Others
Offsetting of deferred tax assets and liabilities
Share-based payments
Membership rights
Defined benefit obligation
Plan assets
Short-term employee benefits
Gains on valuation of financial assets at fair
value through profit or loss
Others
Offsetting of deferred tax assets and liabilities
Liabilities \ -
-
-
(2,888)
-
-
-
(2,888)
2,888
\ -
Liabilities \ -
-
-
(1,604)
-
-
-
(1,604)
1,604
\ -
Assets \ 3,260
491
2,888
-
1,193
2,337
245
10,414
(2,888)
\ 7,526
Assets \ 2,922
499
2,523
-
748
2,976
120
9,788
(1,604)
\ 8,184
Net amount\ 3,260
491
2,888
(2,888)
1,193
2,337
245
7,526
-
\ 7,526
Net amount\ 2,922
499
2,523
(1,604)
748
2,976
120
8,184
-
\ 8,184
2019
2018
(In millions of Korean won)
(In millions of Korean won)
KB Financial Group Annual Report 2019292

The changes in cumulative temporary differences for the years ended December 31, 2019 and 2018, are as follows:
Deductible temporary differencesShare-based payments
Membership rights
Investments in subsidiaries
Defined benefit obligation
Short-term employee benefits
Tax loss carryforwards
Impairment losses on investments in subsidiaries
Gains on valuation of financial assets at fair value
through profit or loss
Others
Unrecognized deferred income tax assets:
Investments in subsidiaries
Tax loss carryforwards
Impairment losses on investments in subsidiaries
Tax rate (%)
Deferred income tax assets from deductible
temporary differences
Taxable temporary differencesInvestments in subsidiaries
Plan assets
Unrecognized deferred income tax liabilities:
Investments in subsidiaries
Tax rate (%)
Deferred income tax liabilities from
taxable temporary differences
Ending
\ 11,856
1,786
2,896,164
10,504
4,338
66,162
51,742
8,499
891
3,051,942
2,896,164
66,162
51,742
37,874
27.5
\ 10,414
(2,395,805)
(10,504)
(2,406,309)
(2,395,805)
(10,504)
27.5
(2,888)
Decrease
\ 3,027
32
-
1,833
2,721
-
-
2,323
413
10,349
-
(1,833)
(1,833)
Increase
\ 4,259
4
-
3,162
4,338
-
-
-
865
12,628
-
(6,502)
(6,502)
Beginning
\ 10,624
1,814
2,896,164
9,175
2,721
66,162
51,742
10,822
439
3,049,663
2,896,164
66,162
51,742
35,595
27.5
\ 9,788
(2,395,805)
(5,835)
(2,401,640)
(2,395,805)
(5,835)
27.5
(1,604)
2019
(In millions of Korean won)
Financial Section 293

Deductible temporary differencesShare-based payments
Membership rights
Investments in subsidiaries
Defined benefit obligation
Short-term employee benefits
Tax loss carryforwards
Impairment losses on investments in subsidiaries
Gains on valuation of financial assets at fair value
through profit or loss
Others
Unrecognized deferred income tax assets:
Investments in subsidiaries
Tax loss carryforwards
Impairment losses on investments in subsidiaries
Tax rate (%)
Deferred income tax assets from deductible
temporary differences
Taxable temporary differencesInvestments in subsidiaries
Plan assets
Unrecognized deferred income tax liabilities:
Investments in subsidiaries
Tax rate (%)
Deferred income tax liabilities from
taxable temporary differences
Ending
\ 10,624
1,814
2,896,164
9,175
2,721
66,162
51,742
10,822
439
3,049,663
2,896,164
66,162
51,742
35,595
27.5
\ 9,788
(2,395,805)
(5,835)
(2,401,640)
(2,395,805)
(5,835)
27.5
\ (1,604)
Decrease
\ 5,048
50
-
1,393
2,077
-
-
4,693
416
13,677
-
(1,393)
(1,393)
Increase
\ 551
-
-
4,760
2,721
-
-
-
404
8,436
-
(3,779)
(3,779)
Beginning
\ 15,121
1,864
2,896,164
5,808
2,077
66,162
51,742
15,515
451
3,054,904
2,896,164
66,162
51,742
40,836
27.5
\ 11,230
(2,395,805)
(3,449)
(2,399,254)
(2,395,805)
(3,449)
27.5
\ (948)
2018
(In millions of Korean won)
13. Other AssetsDetails of other assets as of December 31, 2019 and 2018, are as follows:
Other financial assetsReceivables
Accrued income
Guarantee deposits
Other non-financial assetsReceivables
Prepaid expenses
Advanced payments
2019
\ -
3,654
16,160
19,814
588,765
556
151
589,472
\ 609,286
2018
\ 675
2,251
14,190
17,116
838,450
1,763
133
840,346
\ 857,462
(In millions of Korean won)
KB Financial Group Annual Report 2019294

14. DebtsDebts as of December 31, 2019 and 2018, consist of:
15. DebenturesDetails of debentures as of December 31, 2019 and 2018, are as follows:
Borrowings
Unguaranteed debentures No. 3-3
Unguaranteed debentures No. 5-1
Unguaranteed debentures No. 5-2
Unguaranteed debentures No. 6
Unguaranteed debentures No. 8
Unguaranteed debentures No. 9
Unguaranteed debentures No. 10
Unguaranteed debentures No. 11
Unguaranteed debentures No. 12-2
Unguaranteed debentures No. 12-3
Unguaranteed debentures No. 14-1
Unguaranteed debentures No. 14-2
Unguaranteed debentures No. 15-1
Unguaranteed debentures No. 15-2
Unguaranteed debentures No. 15-3
Unguaranteed debentures No. 16-1
Unguaranteed debentures No. 16-2
Unguaranteed debentures No. 16-3
Unguaranteed debentures No. 17
Unguaranteed debentures No. 18-1
2019\ -
Issued date
Aug. 13, 2013
Mar. 19, 2014
Mar. 19, 2014
Feb. 26, 2015
June 23, 2015
June 23, 2015
Sept. 17, 2015
Sept. 23, 2015
Nov. 27, 2015
Nov. 27, 2015
Dec. 09, 2015
Dec. 09, 2015
May 12, 2016
May 12, 2016
May 12, 2016
May 27, 2016
May 27, 2016
May 27, 2016
June 27, 2016
July 25, 2016
2019
\ 70,000
-
50,000
30,000
100,000
150,000
20,000
30,000
110,000
50,000
140,000
30,000
-
220,000
200,000
-
60,000
150,000
50,000
-
2018
\ 70,000
80,000
50,000
30,000
100,000
150,000
20,000
30,000
110,000
50,000
140,000
30,000
180,000
220,000
200,000
240,000
60,000
150,000
50,000
170,000
Expiration date
Aug. 13, 2020
Mar. 19, 2019
Mar. 19, 2021
Feb. 26, 2022
June 23, 2020
June 23, 2022
Sept. 17, 2020
Sept. 23, 2020
Nov. 27, 2020
Nov. 27, 2022
Dec. 09, 2020
Dec. 09, 2022
May 12, 2019
May 12, 2021
May 12, 2026
May 27, 2019
May 27, 2021
May 27, 2023
June 27, 2021
July 25, 2019
Annual interest rate (%) As of December 31, 2019
3.65
3.31
3.50
2.38
2.34
2.52
2.16
2.06
2.26
2.38
2.27
2.38
1.61
1.72
2.01
1.67
1.78
1.91
1.51
1.38
2018\ 300,000
(In millions of Korean won)
(In millions of Korean won)
Details of borrowings as of December 31, 2019 and 2018, are as follows:
Borrowings in Korean won
Other borrowings
Lender
MERITZ Securities Co., Ltd
2019
\ -
\ -
Annual interest rate (%) As of December 31, 2019
-
2018
\ 300,000
\ 300,000
(In millions of Korean won)
The maturities of debts as of December 31, 2019 and 2018, are as follows:
Borrowings in Korean won
Borrowings in Korean won
Up to 3 months
₩ -
Up to 3 months
\ 300,000
6~12 months
₩ -
6~12 months
₩ -
Over 3 years
₩ -
Over 3 years
₩ -
3~6 months
₩ -
3~6 months
₩ -
1~3 years
₩ -
1~3 years
₩ -
Total
₩ -
Total
\ 300,000
2019
2018
(In millions of Korean won)
(In millions of Korean won)
Financial Section 295

Unguaranteed debentures No. 18-2
Unguaranteed debentures No. 18-3
Unguaranteed debentures No. 19-2
Unguaranteed debentures No. 19-3
Unguaranteed debentures No. 20-1
Unguaranteed debentures No. 20-2
Unguaranteed debentures No. 21
Unguaranteed debentures No. 22-1
Unguaranteed debentures No. 22-2
Unguaranteed debentures No. 23
Unguaranteed debentures No. 24
Unguaranteed debentures No. 25-1
Unguaranteed debentures No. 25-2
Unguaranteed debentures No. 25-3
Unguaranteed debentures No. 25-4
Unguaranteed debentures No. 26-1
Unguaranteed debentures No. 26-2
Unguaranteed debentures No. 27
Unguaranteed debentures No. 28-1
Unguaranteed debentures No. 28-2
Unguaranteed debentures No. 28-3
Unguaranteed debentures No. 29-1
Unguaranteed debentures No. 29-2
Unguaranteed debentures No. 30
Unguaranteed debentures No. 31-1
Unguaranteed debentures No. 31-2
Unguaranteed debentures No. 31-3
Unguaranteed debentures No. 32-1
Unguaranteed debentures No. 32-2
Unguaranteed debentures No. 32-3
Unguaranteed debentures No. 33-1
Unguaranteed debentures No. 33-2
Unguaranteed debentures No. 34-1
Unguaranteed debentures No. 34-2
Unguaranteed debentures No. 34-3
Unguaranteed debentures No. 34-4
Unguaranteed debentures No. 35
Unguaranteed debentures No. 36-1
Unguaranteed debentures No. 36-2
Unguaranteed debentures No. 36-3
Unguaranteed debentures No. 37-1
Unguaranteed debentures No. 37-2
Unguaranteed debentures No. 38-1
Unguaranteed debentures No. 38-2
Unguaranteed debentures No. 39-1
Unguaranteed debentures No. 39-2
Unguaranteed debentures No. 40-1
Unguaranteed debentures No. 40-2
Issued date
July 25, 2016
July 25, 2016
Aug. 25, 2016
Aug. 25, 2016
Nov. 28, 2016
Nov. 28, 2016
Jan. 25, 2017
Feb. 28, 2017
Feb. 28, 2017
Mar. 23, 2017
Apr. 06, 2017
May 24, 2017
May 24, 2017
May 24, 2017
May 24, 2017
June 27, 2017
June 27, 2017
July 19, 2017
Aug. 30, 2017
Aug. 30, 2017
Aug. 30, 2017
Sept. 19, 2017
Sept. 19, 2017
Jan. 25, 2018
Feb. 28, 2018
Feb. 28, 2018
Feb. 28, 2018
Apr. 06, 2018
Apr. 06, 2018
Apr. 06, 2018
June 12, 2018
June 12, 2018
July 25, 2018
July 25, 2018
July 25, 2018
July 25, 2018
Oct. 05, 2018
Feb. 22, 2019
Feb. 22, 2019
Feb. 22, 2019
Mar. 15, 2019
Mar. 15, 2019
June. 19, 2019
June. 19, 2019
Oct. 15, 2019
Oct. 15, 2019
Dec. 04, 2019
Dec. 04, 2019
2019
110,000
80,000
100,000
120,000
-
50,000
100,000
120,000
110,000
80,000
70,000
-
100,000
270,000
80,000
50,000
200,000
100,000
60,000
30,000
60,000
150,000
110,000
80,000
150,000
50,000
60,000
60,000
80,000
20,000
100,000
30,000
40,000
70,000
20,000
20,000
120,000
120,000
230,000
60,000
140,000
70,000
80,000
120,000
80,000
40,000
70,000
30,000
5,550,000
(6,554)
\ 5,543,446
2018
110,000
80,000
100,000
120,000
50,000
50,000
100,000
120,000
110,000
80,000
70,000
150,000
100,000
270,000
80,000
50,000
200,000
100,000
60,000
30,000
60,000
150,000
110,000
80,000
150,000
50,000
60,000
60,000
80,000
20,000
100,000
30,000
40,000
70,000
20,000
20,000
120,000
-
-
-
-
-
-
-
-
-
-
-
5,380,000
(6,734)
\ 5,373,266
Expiration date
July 25, 2021
July 25, 2026
Aug. 25, 2021
Aug. 25, 2026
Nov. 28, 2019
Nov. 28, 2021
Jan. 23, 2020
Feb. 28, 2020
Feb. 28, 2022
Mar. 23, 2020
Apr. 06, 2020
May 24, 2019
May 24, 2020
May 24, 2022
May 24, 2027
June 27, 2022
June 27, 2024
July 19, 2024
Aug. 30, 2022
Aug. 30, 2024
Aug. 30, 2027
Sept. 19, 2022
Sept. 19, 2024
Jan. 25, 2021
Feb. 26, 2021
Feb. 28, 2023
Feb. 28, 2028
Apr. 06, 2021
Apr. 06, 2023
Apr. 06, 2028
June 12, 2023
June 12, 2028
July 23, 2021
July 25, 2023
July 25, 2025
July 25, 2028
Oct. 05, 2023
Feb. 22, 2022
Feb. 22, 2024
Feb. 22, 2029
Mar. 15, 2024
Mar. 15, 2029
June 19, 2026
June 19, 2029
Oct. 15, 2024
Oct. 15, 2029
Dec. 04, 2024
Dec. 04, 2029
Annual interest rate (%) As of December 31, 2019
1.45
1.69
1.46
1.69
2.13
2.28
1.82
1.89
2.11
1.95
1.97
1.79
1.97
2.23
2.62
2.18
2.34
2.41
2.30
2.43
2.60
2.29
2.44
2.45
2.57
2.81
3.02
2.50
2.71
2.86
2.81
2.92
2.41
2.65
2.71
2.76
2.52
2.03
2.11
2.22
2.06
2.16
1.73
1.77
1.60
1.67
1.76
1.87
(In millions of Korean won)
Less: Bond Discounts
KB Financial Group Annual Report 2019296

The maturities of debentures as of December 31, 2019 and 2018, are as follows:
Debentures in Korean won
Debentures in Korean won
Up to 3 months
\ 300,000
Up to 3 months
\ 80,000
6~12 months
\ 370,000
6~12 months
\ 220,000
Over 3 years
\ 2,620,000
Over 3 years
\ 2,600,000
3~6 months
\ 270,000
3~6 months
\ 570,000
1~3 years
\ 1,990,000
1~3 years
\ 1,910,000
Total
\ 5,550,000
Total
\ 5,380,000
2019
2018
(In millions of Korean won)
(In millions of Korean won)
Changes in debentures based on face value for the years ended December 31, 2019 and 2018, are as follows:
Debentures in Korean won
Debentures in Korean won
Ending₩ 5,550,000
Ending₩ 5,380,000
Issue₩ 1,040,000
Issue₩ 900,000
Repayment₩ (870,000)
Repayment₩ (690,000)
Beginning₩ 5,380,000
Beginning₩ 5,170,000
2019
2018
(In millions of Korean won)
(In millions of Korean won)
16. Net Defined Benefit LiabilitiesDefined benefit plan
The Company operates defined benefit plans which have the following characteristics:
- The Company has the obligation to pay the agreed benefits to all its current and former employees.
- Actuarial risk (that benefits will cost more than expected) and investment risk fall, in substance, on the Company.
The net defined benefit liability recognized in the statements of financial position is calculated in accordance with actuarial valuation methods using market
data; such as, interest rates, future salary increase rate and mortality rate based on historical data. Actuarial assumptions may differ from actual results, due
to changes in the market, economic trends and mortality trends.
Changes in the defined benefit obligation for the years ended December 31, 2019 and 2018, are as follows:
Beginning
Current service cost
Interest cost(income)
Remeasurements:
Actuarial gains and losses by
changes in demographic assumptions
Actuarial gains and losses by changes
in financial assumptions
Actuarial gains and losses by experience adjustments
Return on plan assets (excluding amounts
included in interest income)
Present value of defined benefit obligation
₩ 20,363
2,175
466
(20)
599
(58)
-
Net defined benefit liabilities
₩ 183
2,175
4
(20)
599
(58)
195
Fair value of plan assets
₩ (20,180)
-
(462)
-
-
-
195
2019
(In millions of Korean won)
Financial Section 297

ContributionsPayments from plans (benefit payments)Payments from the CompanyTransfer inTransfer outEnding
BeginningCurrent service costInterest cost (income)Remeasurements:
Actuarial gains and losses by changes in financial assumptionsActuarial gains and losses by experience adjustmentsReturn on plan assets (excluding amounts included in interest income)
ContributionsPayments from plans (benefit payments)Payments from the CompanyTransfer inTransfer outEnding
Present value of defined benefit obligation
-(1,833)
-1,302
(2,682)₩ 20,312
Present value of defined benefit obligation
₩ 16,5941,925
479
1,205
1,151
--
(1,393)(38)
2,883(2,443)
₩ 20,363
Net defined benefit liabilities
(2,688)--
47-
₩ 437
Net defined benefit liabilities
₩ (201)1,925
(6)
1,205
1,151
280(4,172)
-(38)
39-
₩ 183
Fair value of plan assets
(2,688)1,833
-(1,255)
2,682₩ (19,875)
Fair value of plan assets
₩ (16,795)-
(485)
-
-
280(4,172)
1,393-
(2,844)2,443
₩ (20,180)
2019
2018
(In millions of Korean won)
(In millions of Korean won)
Details of the net defined benefit liabilities as of December 31, 2019 and 2018, are as follows:
Details of post-employment benefits recognized in profit or loss as employee compensation and benefits for the years ended December 31, 2019 and 2018,
are as follows:
Remeasurements of the net defined benefit liabilities recognized as other comprehensive income for the years ended December 31, 2019 and 2018, are as follows:
Present value of defined benefit obligation
Fair value of plan assets
Net defined benefit liabilities
Current service cost
Net interest expenses(income) of net defined benefit liabilities
Post-employment benefits
RemeasurementsReturn on plan assets (excluding amounts included in interest income)Actuarial gains and lossesIncome tax effectsRemeasurements after income tax
2019\ 20,312
(19,875)
\ 437
2019\ 2,175
4
\ 2,179
2019
\ (195)(521)
196\ (520)
2018\ 20,363
(20,180)
\ 183
2018\ 1,925
(6)
\ 1,919
2018
\ (280)(2,356)
725 \ (1,911)
(In millions of Korean won)
(In millions of Korean won)
(In millions of Korean won)
KB Financial Group Annual Report 2019298

Plan assets as of December 31, 2019 and 2018, are as follows:
Cash and due from financial institutions
Cash and due from financial institutions
Assets not quoted in an active market
\ 19,875
Assets not quoted in an active market
\ 20,180
Assets quoted in an active market
\ -
Assets quoted in an active market
\ -
Total
\ 19,875
Total
\ 20,180
2019
2018
(In millions of Korean won)
(In millions of Korean won)
Key actuarial assumptions used as of December 31, 2019 and 2018, are as follows:
Mortality assumptions are based on the experience-based mortality table(retirement pension) of Korea Insurance Development Institute of 2019.
The sensitivity of the defined benefit obligation to changes in the principal assumptions as of December 31, 2019, is as follows:
The above sensitivity analyses are based on a change in an assumption while holding all other assumptions constant. In practice, this is unlikely to occur,
and changes in some of the assumptions may be correlated. The sensitivity of the defined benefit obligation to changes in principal actuarial assumptions is
calculated using the projected unit credit method, the same method applied when calculating the defined benefit obligations recognized on the statement
of financial position.
Expected maturity analysis of undiscounted pension benefits (including expected future benefits) as of December 31, 2019, are as follows:
The weighted average duration of the defined benefit obligation is 10.2 years.
Expected contribution to plan assets for periods after December 31, 2019, is estimated to be approximately \ 2,100 million.
Discount rate (%)
Future salary increase rate (%)
Turnover (%)
20192.00
3.75
1
20182.30
3.75
1
Discount rate (%)
Salary increase rate (%)
Turnover (%)
Increase in principal assumption
-4.86%
5.32%
-0.56%
Changes in principal assumption
0.5%p.
0.5%p.
0.5%p.
Decrease in principal assumption
5.20%
-5.02%
0.58%
Effect on defined benefit obligation
(In millions of Korean won)
Pension benefits
Up to 1 year
\ 185
2 ~ 5 years
\ 3,349
Over 10 years
\ 35,862
1 ~ 2 years
\ 387
5 ~ 10 years
\ 13,583
Total
\ 53,366
(In millions of Korean won)
Financial Section 299

Other financial liabilities Payables
Accrued expenses
Lease liability
Other non-financial liabilities Payables
Accrued expenses
Withholding taxes
2019
\ 1,134
13,218
588
14,940
59,263
128,824
413
188,500
\ 203,440
2018
\ 7,375
12,578
-
19,953
49,348
116,800
380
166,528
\ 186,481
17. Other LiabilitiesDetails of other assets as of December 31, 2019 and 2018, are as follows:
18. Equity18.1 Share Capital
Details of share capital and number of issued shares as of December 31, 2019 and 2018, are as follows:
(In millions of Korean won)
Type of share
Number of authorized shares
Par value per share
Number of issued shares
Share capital1
2019 Ordinary share
1,000,000,000
₩ 5,000
415,807,920
₩ 2,090,558
2018 Ordinary share
1,000,000,000
₩ 5,000
418,111,537
₩ 2,090,558
1 In millions of Korean won. Due to the retirement of shares deducted through profits, it is different from the total par value of the shares issued.
The above hybrid securities are early redeemable by the Company after 5 or 10 years from the issuance date
Beginning
Increase
Decrease
Ending
2019 \ 395,551,297
-
(5,916,962)
\ 389,634,335
2018 \ 399,037,583
-
(3,486,286)
\ 395,551,297
(In number of shares)
18.2 Hybrid Securities
Details of hybrid securities classified as equity as of December 31, 2019 and 2018, are as follows:
The 1-1st Hybrid securities
The 1-2nd Hybrid securities
2019 ₩ 349,204
49,881
₩ 399,085
Maturity Perpetual bond
Perpetual bond
Issuance date May 2, 2019
May 2, 2019
2018 \ -
-
\ -
Interest rate (%) 3.23
3.44
(In millions of Korean won)
KB Financial Group Annual Report 2019300

18.3 Capital Surplus
Details of capital surplus as of December 31, 2019 and 2018, are as follows:
18.5 Retained Earnings
Details of retained earnings as of December 31, 2019 and 2018, are as follows:
With respect to the allocation of net profit earned in a fiscal term, the Company must set aside in its legal reserve an amount equal to at least 10% of its profit for the year after tax as reported in the separate statement of comprehensive income each time it pays dividends on its net profits earned until its legal reserve reaches at least the aggregate amount of its share capital in accordance with Article 53 of the Financial Holding Company Act. The reserve is not available for the payment of cash dividends, but may be transferred to share capital, or used to reduce accumulated deficit.
18.4 Accumulated Other Comprehensive Income
Details of accumulated other comprehensive income as of December 31, 2019 and 2018, are as follows:
Share premiumOther capital surplusGain on sales of treasury share
Legal reservesVoluntary reservesRegulatory reserve for credit lossesRetained earnings before appropriation
Remeasurements of net defined benefit liabilities
2019 \ 13,190,275
1,465,89386,646
\ 14,742,814
2019 \ 482,807
982,0004,458
1,624,029\ 3,093,294
2019 \ (7,664)\ (7,664)
2018 \ 13,190,275
1,465,89386,646
\ 14,742,814
2018 \ 390,216
982,0002,374
1,838,966\ 3,213,556
2018 \ (7,144)\ (7,144)
(In millions of Korean won)
(In millions of Korean won)
(In millions of Korean won)
Remeasurements of net defined benefit liabilities
Remeasurements of net defined benefit liabilities
Ending₩ (7,664)
₩ (7,664)
Ending₩ (7,144)
₩ (7,144)
Tax effect₩ 196
₩ 196
Tax effect₩ 725
₩ 725
Changes₩ (716)
₩ (716)
Changes₩ (2,636)
₩ (2,636)
Beginning₩ (7,144)
₩ (7,144)
Beginning₩ (5,233)
₩ (5,233)
2019
2019
(In millions of Korean won)
(In millions of Korean won)
Changes in accumulated other comprehensive income for the years ended December 31, 2019 and 2018, are as follows:
Financial Section 301

Unappropriated retained earningsBalance at the beginning of the year
Profit for the year
Retirement of treasury shares
Dividends of hybrid securities
Transfers such as discretionary reservesRegulatory reserve for credit losses
Appropriation of retained earningsLegal reserve
Regulatory reserve for credit losses
Cash dividends
(Dividends per common share: ₩ 2,210 (44.2%) in 2019)
(Dividends per common share: ₩ 1,920 (38.4%) in 2018)
Unappropriated retained earnings to be carried forward
2019
\ 984,555
745,987
(100,000)
(6,513)
1,624,029
283
283
74,599
-
861,092
935,691
\ 688,621
2018
\ 913,061
925,905
-
-
1,838,966
-
-
92,591
2,084
759,736
854,411
\ 984,555
Appropriation of retained earnings
(Expected date of appropriation for 2019: March 20, 2020)
(Date of appropriation for 2018: March 27, 2019)
Regulatory reserve for credit losses
Measurement and disclosure of regulatory reserve for credit losses are required in accordance with Articles 26 through 28 of the Supervisory Regulations
on Financial Holding Companies.
Details of the regulatory reserve for credit losses as of December 31, 2019 and 2018, are as follows:
The adjustments to the regulatory reserve for credit losses for the years ended December 31, 2019 and 2018, are as follows:
(In millions of Korean won)
Beginning
Estimated amounts subject to provision(reversal)
Ending
2019 \ 4,458
(283)
\ 4,175
2018 \ 2,374
2,084
\ 4,458
(In millions of Korean won)
Provision(reversal) of regulatory reserve for credit losses
Adjusted profit after provision(reversal) of regulatory reserve for credit losses1,2
Adjusted basic earnings per share after provision of
regulatory reserve for credit losses1
Adjusted diluted earnings per share after provision of
regulatory reserve for credit losses1
2019 ₩ (283)
739,757
1,891
₩ 1,877
2018 ₩ 2,084
923,821
|
2,330
₩ 2,316
(In millions of Korean won, except per share amounts)
1 Adjusted profit after provision(reversal) of regulatory reserve for credit losses is not in accordance with Korean IFRS and calculated on the assumption that provision(reversal) of regulatory reserve for credit losses before income tax is adjusted to the profit for the year.
2 Amount after deducting dividends on hybrid securities.
KB Financial Group Annual Report 2019302

18.6 Treasury Shares
Changes in treasury shares outstanding for the years ended December 31, 2019 and 2018, are as follows:
19. Dividends The dividends paid to the shareholders of the Company in 2019 and 2018 were ₩ 759,736 million (₩ 1,920 per share) and ₩ 766,728 million(₩ 1,920 per share) respectively. The dividends to the shareholders of the Company for the year ended December 31, 2019, amounting to ₩ 861,092 million (₩ 2,210 per share) is to be proposed at the annual general shareholder’s meeting on March 20, 2020. The Company’s financial statements as of December 31, 2019, do not reflect this dividend payable.
20. Net Interest Income(expense)Interest income(expense) and net interest income(expense) for the years ended December 31, 2019 and 2018, are as follows:
21. Net Fee and Commission Income(Expense) Fee and commission income(expense) and net fee and commission income(expense) for the years ended December 31, 2019 and 2018, are as follows:
Number of treasury shares1
Carrying amount1
Number of treasury shares1
Carrying amount1
Ending 26,173,585
\ 1,136,188
Ending 22,560,240
\ 968,549
Retirement(2,303,617)
\ (100,000)
Disposal-
\ -
Acquisition5,916,962
\ 267,639
Acquisition3,486,286
\ 212,576
Beginning22,560,240
\ 968,549
Beginning19,073,954
\ 755,973
2019
2018
(In millions of Korean won and in number of shares)
(In millions of Korean won and in number of shares)
1 For the year ended December 31, 2019, the treasury stock trust agreement of ₩ 300,000 million with Samsung Securities Co., Ltd., which had been signed in 2018, was terminated.
1 For the year ended December 31, 2018, the treasury stock trust agreement of ₩ 300,000 million with Samsung Securities Co., Ltd., which had been signed in 2017, was terminated. In order to increase shareholder value, the Company entered into another treasury stock trust agreement of ₩ 300,000 million with Samsung Securities Co., Ltd. for the year ended December 31, 2018.
Interest incomeDue from financial institutionsLoans at amortized costLoans at fair value through profit or loss Other
Interest expenseDebtsDebenturesOther
Net interest expense
Fee and commission incomeFee and commission expenseFees paid in Korean wonFees paid in foreign currency
Net fee and commission expense
2019
\ 2,5802,3332,805
3028,020
2,489123,560
16126,065
\ (118,045)
2019\ 847
6,891239
7,130\ (6,283)
2018
\ 5,748619
-249
6,616
1,458120,993
-122,451
\ (115,835)
2018 \ 788
5,867129
5,996\ (5,208)
(In millions of Korean won)
Financial Section 303

22. Net Gains on Financial assets at Fair value through Profit or Loss Net Gains on Financial assets at fair value through profit or loss consist of gains or losses related to financial instrument that includes dividend income and gains or losses arising from changes in the fair values, sales and redemptions. Details net gains on financial assets at fair value through profit or loss for the years ended December 31, 2019 and 2018, are as follows:
23. Net Other Operating IncomeOther operating income or other operating expense for the years ended December 31, 2019 and 2018, are as follows:
24. General and Administrative ExpensesDetails of general and administrative expenses for the years ended December 31, 2019 and 2018, are as follows:
Gains related to financial instruments at fair value through profit or lossDividend income on financial assets designated at fair value through profit or lossGains on valuation on financial assets designated at fair value through profit or loss
Losses related to financial instruments at fair value through profit or loss Financial assets at fair value through profit or loss
Net gains on financial instruments at fair value through profit or loss
Other operating incomeDividend income from subsidiaries
Net other operating income
Employee benefitsSalaries and other short-term employee benefits - SalariesSalaries and other short-term employee benefits - OthersPost employment benefits - defined benefit plansPost employment benefits - defined contribution plansShare-based payments
Depreciation and amortization Depreciation and amortization
Other general and administrative expensesTravelCommunicationsTax and duesPublicationRental expenseVehicleService feesAdvertisingTraining Others
2019
\ 13,625
3,16616,791
844844
\ 15,947
2019
\ 926,934\ 926,934
2019
\ 28,448 4,778 2,179 286 4,259 39,950
5,093 1,158 633 496 367 835 150 12,236 894 1,591 7,768 26,128\ 71,171
2018
\ 13,625
4,69418,319
--
\ 18,319
2018
\ 1,089,556\ 1,089,556
2018
\ 27,021 4,508 1,919 85 551 34,084
864 833 520 326 250 1,503 153 10,122 909 1,130 7,151 22,897\ 57,845
(In millions of Korean won)
(In millions of Korean won)
(In millions of Korean won)
KB Financial Group Annual Report 2019304

Share-based Payments
The Company entered into share-based payment plan for executives and employees of the Company and its subsidiaries.
Details of stock grants linked to long-term performance as of December 31, 2019, are as follows:
KB Financial Group Inc.Series 18 Series 19Series 20 Series 21Series 22Series 23Series 24Deferred grant in 2015Deferred grant in 2016Deferred grant in 2017Deferred grant in 2018
Kookmin BankSeries 72
Series 73Series 74
Series 75
Series 76
Series 77 Series 78Deferred grant in 2015Deferred grant in 2016Deferred grant in 2017Deferred grant in 2018
Other subsidiaries and associate
Stock granted in 2010Stock granted in 2011Stock granted in 2012Stock granted in 2013Stock granted in 2014Stock granted in 2015Stock granted in 2016Stock granted in 2017Stock granted in 2018Stock granted in 2019
Grant date
Jul. 17, 2017
Nov. 21, 2017Jan. 01, 2018
Jan. 01, 2019Apr. 01, 2019May 27, 2019Jul. 17, 2019
- - - -
Aug. 28, 2017
Nov. 21, 2017Jan. 01, 2018
Jan. 01, 2019
Apr. 01, 2019
May 27, 2019
Nov. 21, 2019 - - - -
----------
Vesting conditions2
Service fulfillment, market performance3 30~50% and non-market performance4 50~70%Service fulfillment, market performance3 35% and non-market performance5 65%Service fulfillment, market performance3 30~50% and non-market performance4 50~70%Service fulfillment, market performance3 30% and non-market performance4 70%Service fulfillment, market performance3 30% and non-market performance4 70%Service fulfillment, market performance3 30% and non-market performance4 70%Service fulfillment, market performance3 30% and non-market performance4 70%SatisfiedSatisfiedSatisfiedSatisfied
Service fulfillment, market performance 3 30~50%, and non-market performance4 50~70%Service fulfillment, market performance3 30%, and non-market performance6 70%Service fulfillment, market performance3 30~50%, and non-market performance4 50~70%Service fulfillment, market performance3 30~50%, and non-market performance4 50~70%Service fulfillment, market performance3 30~50%, and non-market performance4 50~70%Service fulfillment, market performance3 30~50%, and non-market performance4 50~70%Service fulfillment, market performance3 30%, and non-market performance6 70%SatisfiedSatisfiedSatisfiedSatisfied
Services fulfillment, market performance3 10~50% and non-market performance4, 50~90%
Number of granted shares1
7,826
46,89038,826
28,926
3,2271,392
11,22410,04312,09345,728
8,057214,232
6,742
27,786134,465
192,170
5,380
5,569
36,443 4,756
65,41995,69797,244
671,671
106146420
1,0071,2234,456
23,47483,459
257,064241,226612,581
1,498,484
(In number of shares)
1 Granted shares represent the total number of shares initially granted to directors and employees that have residual shares at the end of reporting period (Deferred grants are residual shares at the end of the reporting period).
2 Executives and employees were given the option of deferring payment of the granted shares (after the date of retirement), payment ratio, and payment period. Accordingly, a certain percentage of the granted amount is deferred for up to five years after the date of retirement when the deferred grant has been confirmed.
3 Relative TSR (Total Shareholders Return): [(Fair value at the end of the contract - Fair value at the beginning of the contract) + (Total amount of dividend per share paid during the contract period)] / Fair value at the beginning of the contract)
4 Accomplishment of corporates' and individuals' performance results5 EPS, Asset Quality, HCROI, Non-banking sector profit6 EPS, Asset Quality
Financial Section 305

The stock grant award program is an incentive plan that sets, on grant date, the maximum amount of shares that can be awarded. Actual stock granted at
the end of the vesting period is determined in accordance with achievement of pre-specified targets over the vesting period.
Details of stock grants linked to short-term performances as of December 31, 2019, are as follows:
Share grants are measured at fair value using the Monte Carlo Simulation Model and assumptions used in determining the fair value as of December 31,
2019, are as follows:
KB Financial Group Inc.Stock granted in 2015Stock granted in 2016Stock granted in 2017Stock granted in 2018Stock granted in 2019
Kookmin BankStock granted in 2015Stock granted in 2016Stock granted in 2017Stock granted in 2018Stock granted in 2019
Other subsidiariesStock granted in 2015Stock granted in 2016Stock granted in 2017Stock granted in 2018Stock granted in 2019
Estimated number of vested shares1
9,69011,78312,27320,66430,504
15,83152,85555,490
109,296112,445
16,922 94,201
238,115457,006284,888
1,521,963
Vesting Conditions
SatisfiedSatisfiedSatisfiedSatisfiedProportional to service period SatisfiedSatisfiedSatisfiedSatisfiedProportional to service period Satisfied SatisfiedSatisfiedSatisfiedProportional to service period
1 Executives and employees were given the option of deferring payment of the granted shares (after the date of retirement), payment ratio, and payment period. Accordingly, a certain percentage of the granted amount is deferred for up to five years after the date of retirement when the deferred grant has been confirmed.
Linked to long term performance(KB Financial Group Inc.)
Series 18Series 19Series 20Series 21Series 22Series 23Series 24Deferred grant in 2015Deferred grant in 2016Deferred grant in 2017Deferred grant in 2018
(Kookmin Bank)Series 72Series 73Series 74Series 75Series 76Series 77Series 78Grant deferred in 2015Grant deferred in 2016Grant deferred in 2017Grant deferred in 2018
Risk free rate (%)
1.341.341.341.341.341.341.341.341.341.341.34
1.341.341.341.341.341.341.341.341.341.341.34
Fair value (Market performance condition)
40,362~44,03438,220~41,77541,135~45,03541,489~46,02141,070~44,92641,070~44,92641,070~44,926
----
43,659~47,63141,253~43,74141,279~45,03541,506~46,02141,070~44,92641,070~44,92638,303~41,900
----
Fair value (Non-market performance condition)
43,659~47,63142,493~46,44543,659~47,63142,336~47,63141,070~44,92641,070~44,92641,070~44,92638,616~47,63142,336~47,63143,659~47,63142,336~47,631
43,659~47,63143,803~46,44543,659~47,63142,336~47,63141,070~44,92641,070~44,92641,070~44,92644,926~47,63142,336~47,63142,336~47,63142,336~47,631
KB Financial Group Annual Report 2019306

The Company used the volatility of the stock price over the previous year as the expected volatility, used the arithmetic mean of the dividend rate of one year before, two years before, and three years before the base year as the dividend yield, and used one-year risk-free interest rate in order to calculate fair value.
Share-based payment arrangement for subsidiaries and associate was transferred to the Company in 2010, and the related compensation cost paid to the executives and employees of subsidiaries and associate is reimbursed by these companies. The accrued expenses representing share-based payments as of December 31, 2019 and 2018, are ₩ 124,853 million and ₩ 111,058 million, respectively, and the receivables to be reimbursed by the subsidiaries for the compensation costs are ₩ 112,997 million and ₩100,434 million, respectively. In addition, the compensation costs from share-based payments that amount to ₩ 4,259 million and ₩ 551 million were recognized for the years ended December 31, 2019 and 2018, respectively.
25. Non-operating Income (Expense)Details of non-operating income and expenses for the years ended December 31, 2019 and 2018, are as follows:
(Other subsidiaries)Share granted in 2010Share granted in 2011Share granted in 2012Share granted in 2013Share granted in 2014Share granted in 2015Share granted in 2016Share granted in 2017Share granted in 2018Share granted in 2019
Linked to short-term performance(KB Financial Group Inc.)
Share granted in 2015Share granted in 2016Share granted in 2017Share granted in 2018Share granted in 2019
(Kookmin Bank)Share granted in 2015Share granted in 2016Share granted in 2017Share granted in 2018Share granted in 2019
(Other subsidiaries)Share granted in 2015Share granted in 2016Share granted in 2017Share granted in 2018Share granted in 2019
Risk free rate (%)
1.341.341.341.341.341.341.341.341.341.34
1.341.341.341.341.34
1.341.341.341.341.34
1.341.341.341.341.34
Fair value (Market performance condition)
-------
35,863~46,81737,446~45,24039,878~47,631
-----
-----
-----
Fair value (Non-market performance condition)
46,28146,281
44,926~46,28144,926~47,63140,065~46,76641,070~47,67639,801~47,63138,616~47,63139,801~47,63141,070~47,631
38,616~47,63139,801~47,63142,336~47,63142,336~47,63143,659~46,281
42,336~47,63141,070~47,63142,336~47,63142,336~47,63143,659~46,281
38,616~47,63138,616~47,63138,616~47,63138,616~47,63139,801~46,281
Non-operating incomeReversal of impairment losses on intangible assetsOthers
Non-operating expensesLoss on disposal of property, plant and equipmentImpairment on intangible assetsDonationOthers
Non-operating expenses
2019
\ - 669669
214
1,1778
1,210\ (541)
2018
\ 50876926
--
1,1841
1,185\ (259)
(In millions of Korean won)
Financial Section 307
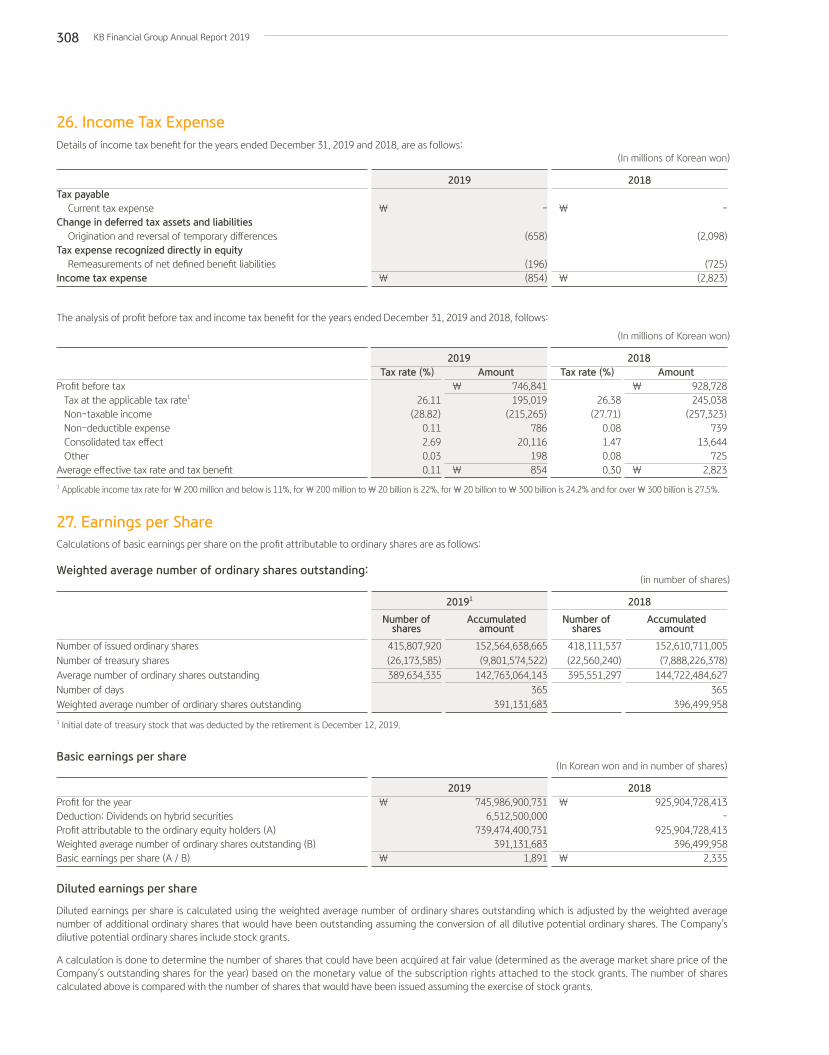
26. Income Tax Expense Details of income tax benefit for the years ended December 31, 2019 and 2018, are as follows:
Profit before taxTax at the applicable tax rate1
Non-taxable incomeNon-deductible expenseConsolidated tax effectOther
Average effective tax rate and tax benefit
Tax rate (%)
26.11(28.82)
0.112.690.030.11
Tax rate (%)
26.38(27.71)
0.081.470.080.30
Amount
\ 746,841195,019
(215,265)786
20,116198
\ 854
Amount
\ 928,728245,038
(257,323)739
13,644725
\ 2,823
(In millions of Korean won)
2019 2018
1 Applicable income tax rate for \ 200 million and below is 11%, for \ 200 million to \ 20 billion is 22%, for \ 20 billion to \ 300 billion is 24.2% and for over \ 300 billion is 27.5%.
27. Earnings per ShareCalculations of basic earnings per share on the profit attributable to ordinary shares are as follows:
Weighted average number of ordinary shares outstanding:
Number of issued ordinary sharesNumber of treasury sharesAverage number of ordinary shares outstandingNumber of daysWeighted average number of ordinary shares outstanding
Number of shares
415,807,920(26,173,585)389,634,335
Number of shares
418,111,537(22,560,240)395,551,297
Accumulated amount
152,564,638,665(9,801,574,522)
142,763,064,143365
391,131,683
Accumulated amount
152,610,711,005(7,888,226,378)
144,722,484,627365
396,499,958
(in number of shares)
20191 2018
1 Initial date of treasury stock that was deducted by the retirement is December 12, 2019.
Basic earnings per share
Profit for the yearDeduction: Dividends on hybrid securitiesProfit attributable to the ordinary equity holders (A)Weighted average number of ordinary shares outstanding (B) Basic earnings per share (A / B)
₩ 745,986,900,731
6,512,500,000739,474,400,731
391,131,683₩ 1,891
₩ 925,904,728,413
-925,904,728,413
396,499,958₩ 2,335
(In Korean won and in number of shares)
2019 2018
Tax payableCurrent tax expense
Change in deferred tax assets and liabilitiesOrigination and reversal of temporary differences
Tax expense recognized directly in equityRemeasurements of net defined benefit liabilities
Income tax expense
₩ -
(658)
(196)₩ (854)
₩ -
(2,098)
(725)₩ (2,823)
(In millions of Korean won)
2019 2018
Diluted earnings per share
Diluted earnings per share is calculated using the weighted average number of ordinary shares outstanding which is adjusted by the weighted average number of additional ordinary shares that would have been outstanding assuming the conversion of all dilutive potential ordinary shares. The Company’s dilutive potential ordinary shares include stock grants.
A calculation is done to determine the number of shares that could have been acquired at fair value (determined as the average market share price of the Company’s outstanding shares for the year) based on the monetary value of the subscription rights attached to the stock grants. The number of shares calculated above is compared with the number of shares that would have been issued assuming the exercise of stock grants.
The analysis of profit before tax and income tax benefit for the years ended December 31, 2019 and 2018, follows:
KB Financial Group Annual Report 2019308

Adjusted profit to calculate diluted earnings per share:
28. Supplemental Cash Flow InformationCash and cash equivalents as of December 31, 2019 and 2018, are as follows:
Adjusted weighted average number of ordinary shares outstanding to calculate diluted earnings per share:
Diluted earnings per share:
Significant non-cash transactions for the years ended December 31, 2019 and 2018, are as follows:
Cash inflows and outflows due to interest and dividends for the years ended December 31, 2019 and 2018, are as follows:
Profit attributable to the ordinary equity holders1
Adjustment
Adjusted profit for diluted earnings per share
Due from financial institutions
Restricted cash from financial institutions
Weighted average number of ordinary shares outstanding
Adjustment
Stock grants
Adjusted weighted average number of ordinary shares
outstanding for diluted earnings per share
Adjusted profit for diluted earnings per share
Adjusted weighted average number of ordinary shares outstanding
for diluted earnings per share
Diluted earnings per share
Changes in receivables and payables from consolidated tax
Changes in receivables and payables relating to stock grants
Other payables due to treasury stock trust agreement, etc
Prepaid income tax expense
Interest received
Interest paid
Dividends received
Dividends paid
₩ 739,474,400,731
-
₩ 739,474,400,731
\ 18,537
(3)
\ 18,534
391,131,683
2,890,513
394,022,196
\ 739,474,400,731
394,022,196
\ 1,877
\ 262,296
(12,564)
-
\ 1,145
6,384
122,195
940,560
766,249
Operating
Operating
Operating
Operating
Finance
₩ 925,904,728,413
-
₩ 925,904,728,413
\ 344,302
(3)
\ 344,299
396,499,958
2,307,630
398,807,588
\ 925,904,728,413
398,807,588
\ 2,322
\ 393,380
(18,085)
6,678
\ 1,222
5,868
116,307
1,103,182
766,728
(In Korean won)
(In millions of Korean won)
(in number of shares)
(In Korean won and in number of shares)
(In millions of Korean won)
(In millions of Korean won)
2019
2019
2019
2019
2019
2019Activity
2018
2018
2018
2018
2018
2018
1 The amount is after deducting dividends on hybrid securities.
Financial Section 309

Changes in liabilities arising from financing activities for the year ended December 31, 2019, are as follows:
29. Contingent Liabilities and CommitmentsCommitments made with financial institutions as of December 31, 2019 and 2018, are as follows:
30. Related Party TransactionsSignificant related party transactions for the years ended December 31, 2019 and 2018, are as follows:
Other Matters
The Company has no pending lawsuit as the defendant.
Debts
Debentures
KEB Hana Bank
Closing balance\ -
5,543,446
\ 5,543,446
Non-cash changes\ (1,679)
678
\ (1,001)
Net cash flows\ (298,321)
169,502
\ (128,819)
Amounts borrowed\ -
\ -
Amounts borrowed\ -
\ -
Opening balance\ 300,000
5,373,266
\ 5,673,266
Amount of commitment\ 50,000
\ 50,000
Amount of commitment\ 50,000
\ 50,000
2019
2019 2018
(In millions of Korean won)
(In millions of Korean won)
Kookmin Bank
KB Securities Co., Ltd.
KB Insurance Co., Ltd.
KB Kookmin Card Co., Ltd.
KB Life Insurance Co., Ltd.KB Asset Management Co., Ltd.KB Capital Co., Ltd
KB Savings Bank Co., Ltd.KB Real Estate Trust. Co., Ltd.
KB Investment Co., Ltd.KB Data Systems Co., Ltd.
Interest incomeFee and commission incomeNet other operating income Net non-operating incomeGeneral and administrative expensesNet other operating income General and administrative expensesNet non-operating incomeNet other operating income General and administrative expensesNet non-operating incomeNet other operating income General and administrative expensesNet non-operating incomeGeneral and administrative expensesNet other operating incomeNet gains on financial assets at fair value through profit or lossNet other operating incomeGeneral and administrative expensesNet non-operating incomeNet other operating incomeNet other operating incomeNet non-operating incomeInterest incomeGeneral and administrative expenses
\ 1,580
841667,225
706,312
50,0001,119
14-
1,8717
200,0081,042
6238
-
15,947-
1164
5,0004,700
132,333 1,953
\ 5,178
778640,132
-5,452
139,1571,196
-49,875
1,031-
180,044970
579
50,000
18,31910,746
--
8,80210,800
-615
1,477
(In millions of Korean won)
2019 2018
KB Financial Group Annual Report 2019310
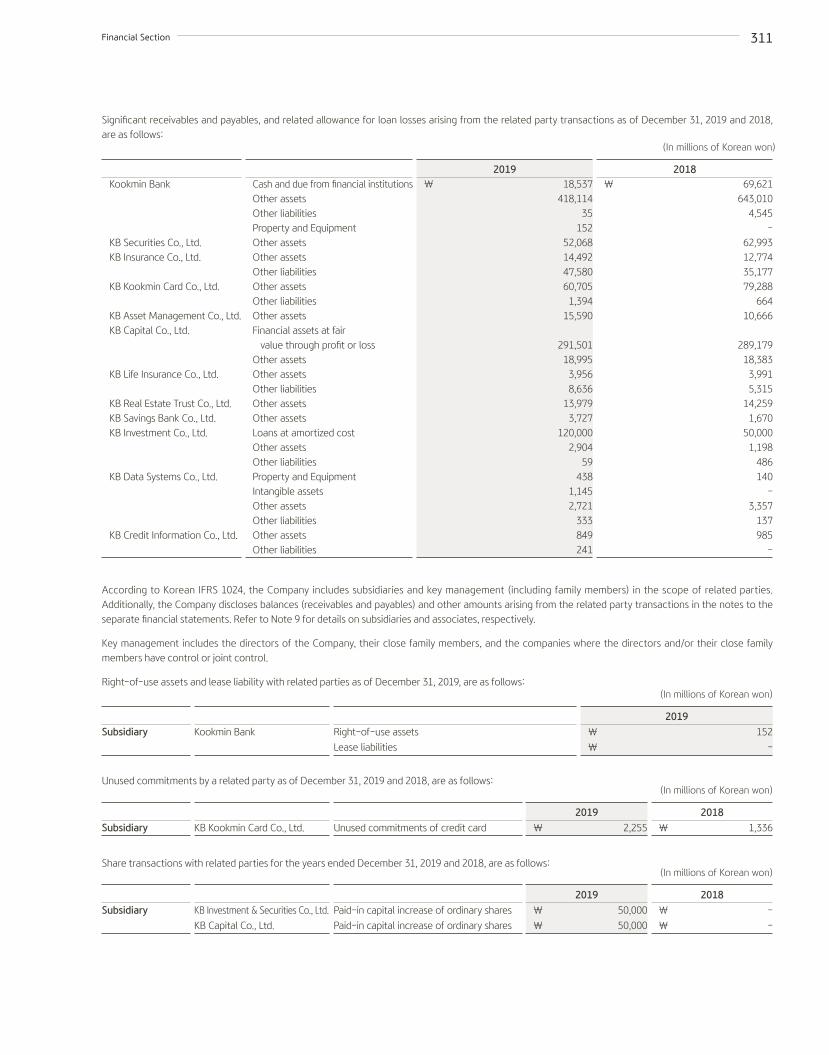
Significant receivables and payables, and related allowance for loan losses arising from the related party transactions as of December 31, 2019 and 2018, are as follows:
Kookmin Bank
KB Securities Co., Ltd.KB Insurance Co., Ltd.
KB Kookmin Card Co., Ltd.
KB Asset Management Co., Ltd.KB Capital Co., Ltd.
KB Life Insurance Co., Ltd.
KB Real Estate Trust Co., Ltd.KB Savings Bank Co., Ltd.KB Investment Co., Ltd.
KB Data Systems Co., Ltd.
KB Credit Information Co., Ltd.
Cash and due from financial institutionsOther assetsOther liabilitiesProperty and EquipmentOther assetsOther assetsOther liabilitiesOther assetsOther liabilitiesOther assetsFinancial assets at fair value through profit or lossOther assetsOther assetsOther liabilitiesOther assetsOther assetsLoans at amortized costOther assetsOther liabilitiesProperty and EquipmentIntangible assetsOther assetsOther liabilitiesOther assetsOther liabilities
\ 18,537
418,11435
15252,06814,49247,58060,705
1,39415,590
291,501
18,9953,9568,636
13,9793,727
120,0002,904
59438
1,1452,721
333849
241
\ 69,621
643,0104,545
-62,99312,77435,17779,288
66410,666
289,179 18,383
3,9915,315
14,2591,670
50,0001,198
486140
-3,357
137985
-
(In millions of Korean won)
2019 2018
According to Korean IFRS 1024, the Company includes subsidiaries and key management (including family members) in the scope of related parties. Additionally, the Company discloses balances (receivables and payables) and other amounts arising from the related party transactions in the notes to the separate financial statements. Refer to Note 9 for details on subsidiaries and associates, respectively.
Key management includes the directors of the Company, their close family members, and the companies where the directors and/or their close family members have control or joint control.
Right-of-use assets and lease liability with related parties as of December 31, 2019, are as follows:
Unused commitments by a related party as of December 31, 2019 and 2018, are as follows:
Share transactions with related parties for the years ended December 31, 2019 and 2018, are as follows:
Subsidiary
Subsidiary
Subsidiary
KB Kookmin Card Co., Ltd.
KB Investment & Securities Co., Ltd.
KB Capital Co., Ltd.
Kookmin Bank
Unused commitments of credit card
Paid-in capital increase of ordinary shares
Paid-in capital increase of ordinary shares
Right-of-use assets
Lease liabilities
₩ 2,255
₩ 50,000
₩ 50,000
₩ 152
₩ -
₩ 1,336
₩ -
₩ -
(In millions of Korean won)
(In millions of Korean won)
(In millions of Korean won)
2019
2019
2019
2018
2018
Financial Section 311

Loan transactions with related parties for the years ended December 31, 2019 and 2018, are as follows:
Subsidiary
Subsidiary
KB Investment Co., Ltd.
KB Investment Co., Ltd.
Ending₩ 120,000
Ending\ 50,000
Repayments₩ -
Repayments\ -
Loans₩ 70,000
Loans\ 40,000
Beginning₩ 50,000
Beginning\ 10,000
2019
2018
(In millions of Korean won)
(In millions of Korean won)
Compensation to key management for the years ended December 31, 2019 and 2018, consists of:
The Company paid ₩ 255 million to KB Securities Co., Ltd., a subsidiary, for the underwriting and arrangement of debentures and hybrid securities.
31. Changes in Accounting Policies - Implementation of Korean IFRS 1116 LeasesThe Company applied Korean IFRS 1116 retrospectively as of January 1, 2019. However, the financial statements for the year ended 2018 was not restated
using the method allowed by transitional provisions. Therefore reclassification and adjustments under the new IFRS were recognized in the financial
statements beginning on January 1, 2019.
A lessee shall apply this standard to its leases either:
- retrospectively to each prior reporting period presented applying Korean IFRS 1008 Accounting Policies, Changes in Accounting Estimates and Errors (Full
retrospective application); or
- retrospectively with the cumulative effect of initially applying the standard recognized at the date of initial application.
The Company applied Korean IFRS 1116 retrospectively with recognizing the cumulative effect of initial adoption of the standard as of January 1, 2019. The
Company did not restate any comparative financial statements.
For leases previously classified as ‘finance leases’, the Company recognized the carrying amount of the lease asset and lease liability immediately before
transition as the carrying amount of the right-of-use asset and the lease liability at the date of initial application. The measurement principles of Korean
IFRS 1116 are only applied after that date. The remeasurements to the lease liabilities were recognized as adjustments to the related right-of-use assets
immediately after the date of initial application.
Registered director (executive)
Registered director (non-executive)
Non-registered director
Registered director (executive)
Registered director (non-executive)
Non-registered director
Post-employment benefits
₩ 28
-
147
₩ 175
Post-employment benefits
₩ 21
-
90
₩ 111
Short-term employee benefits
₩ 798
628
3,344
₩ 4,770
Short-term employee benefits
₩ 1,397
623
2,328
₩ 4,348
Share-based payments
₩ 984
-
3,275
₩ 4,259
Share-based payments
₩ 454
-
97
₩ 551
Total
₩ 1,810
628
6,766
₩ 9,204
Total
₩ 1,872
623
2,515
₩ 5,010
2019
2018
(In millions of Korean won)
(In millions of Korean won)
KB Financial Group Annual Report 2019312

Right-of-use asset
Discounts used lessee’s incremental borrowing rate
at the date of current initial application
Add : Financial leased asset recognized at December 31, 2018
Right-of use asset recognized as of the date of initial application
Lease liability
Operating lease commitments disclosed at December 31, 2018
Discounted amount using the lessee’s incremental borrowing rate1 at the date of initial application
Add : Financial leased liability recognized at December 31, 2018
Lease liability recognized as of the date of initial application
\ 684
-
\ 684
\ 468
460
-
\ 460
(In millions of Korean won)
January 1, 2019
1 Incremental borrowing rate of interest is 1.88% to 2.21%
1 It is included in property and equipment of financial statements.2 It is included in other liabilities of financial statements
The difference between the amount of the right-of-use asset and the lease liability is adjusted by the amount of any prepaid or accrued lease payments relating to that lease recognized in the statement of financial position immediately before the date of initial application.
- Lessor accounting
The Company did not need to make any adjustments to the accounting for assets held as lessor as a result of the adoption of Korean IFRS 1116.
The amounts recognized in statement of financial position
The amounts related to lease recognized in statement of financial position as of December 31, 2019 and January 1, 2019, are as follows:
The amounts recognized in statement of profit or loss
The amount related to lease recognized in statement of profit or loss for the year ended December 31, 2019, is as follows:
The total cash outflow for leases in 2019 was \ 594 million.
32. Approval of Issuance of the Financial StatementsThe issuance of the Company’s separate financial statements as of and for the year ended December 31, 2019, was initially approved on February 6, 2020 and re-approved due to revision on March 4, 2020 by the Board of Directors.
Right-of-use assets1
Real estate
Vehicles
Others
Lease liabilities2
Amortization of right-of-use assetsReal estateVehiclesOthers
Interest expenses on the lease liabilitiesShort-term lease paymentsPayments for leases of low-value assets different from short-term leases
\ 193
280
15
488
\ 588
\ 263
406
15
684
\ 460
\ 496627
211,144
1623
\ 3
(In millions of Korean won)
(In millions of Korean won)
December 31, 2019 January 1, 2019
2019
Financial Section 313

Report on Independent Auditor’sAudit of Internal Control over Financial Reporting
To the Board of Directors and Shareholders of KB Financial Group Inc.
Opinion on Internal Control over Financial Reporting
We have audited Internal Control over Financial Reporting of KB Financial Group Inc.(the Company) as of December 31, 2019, based on Conceptual
Framework for Designing and Operating Internal Control over Financial Reporting.
In our opinion, the Company maintained, in all material respects, effective internal control over financial reporting as of December 31, 2019, based on
Conceptual Framework for Designing and Operating Internal Control over Financial Reporting.
We also have audited, in accordance with Korean Standards on Auditing, the financial statements of the Company, which comprise the statement of
financial position as at December 31, 2019, and the statement of comprehensive income, statement of changes in equity and statement of cash flow for
the year then ended, and notes to the financial statements including a summary of significant accounting policies, and our report dated March 5, 2020
expressed an unqualified opinion.
Basis for Opinion on Internal Control over Financial ReportingWe conducted our audit in accordance with Korean Standards on Auditing. Our responsibility under these standards are further described in the Auditor’s
Responsibilities for the Audit of the Internal Control over Financial Reporting section of our report. We are independent of the Company in accordance with the
ethical requirements of the Republic of Korea that are relevant to our audit of internal control over financial reporting and we have fulfilled our other ethical
responsibilities in accordance with the ethical requirements. We believe that the audit evidence we have obtained is sufficient and appropriate to provide a
basis for our audit opinion.
Responsibilities of Management and Those Charged with Governance for Internal Control over Financial Reporting
Management is responsible for designing, implementing and maintaining effective internal control over financial reporting, and for its assessment about the
effectiveness of internal control over financial reporting, included in the accompanying Operating Status Report of the Internal Control over Financial Reporting.
Those charged with governance have the responsibilities for overseeing internal control over financial reporting.
Auditor’s Responsibilities for the Audit of Internal Control over Financial ReportingOur responsibility is to express opinion on the Company’s internal control over financial reporting based on our audit. We conducted the audit in accordance
with Korean Standards on Auditing. Those standards require that we plan and perform the audit to obtain reasonable assurance about whether effective
internal control over financial reporting was maintained in all material respects.
An audit of internal control over financial reporting involves performing procedures to obtain audit evidence about whether a material weakness exists. The
procedures selected depend on the auditor’s judgment, including the assessment of the risks that a material weakness exists. An audit includes obtaining
an understanding of internal control over financial reporting and testing and evaluating the design and operating effectiveness of internal control over
financial reporting based on the assessed risk.
KB Financial Group Annual Report 2019314

Definition and Inherent Limitations of Internal Control over Financial ReportingAn entity’s internal control over financial reporting is a process effected by those charged with governance, management, and other personnel, designed
to provide reasonable assurance regarding the preparation of reliable financial statements in accordance with International Financial Reporting Standards
as adopted by the Republic of Korea. An entity’s internal control over financial reporting includes those policies and procedures that (1) pertain to the
maintenance of records that, in reasonable detail, accurately and fairly reflect the transactions and dispositions of the assets of the entity; (2) provide
reasonable assurance that transactions are recorded as necessary to permit preparation of financial statements in accordance with International Financial
Reporting Standards as adopted by the Republic of Korea, and that receipts and expenditures of the entity are being made only in accordance with
authorizations of management and those charged with governance; and (3) provide reasonable assurance regarding prevention, or timely detection and
correction of unauthorized acquisition, use, or disposition of the entity’s assets that could have a material effect on the financial statements.
Because of its inherent limitations, internal control over financial reporting may not prevent, or detect and correct, misstatements. Also, projections of any
assessment of effectiveness to future periods are subject to the risk that controls may become inadequate because of changes in conditions, or that the
degree of compliance with the policies or procedures may deteriorate.
The engagement partner on the audit resulting in this independent auditor’s report is Yeob Yu, Certified Public Accountant.
Samil PricewaterhouseCoopers
Seoul, Korea
March 5, 2020
This report is effective as of March 5, 2020, the audit report date. Certain subsequent events or circumstances, which may occur between the audit report date and the time of reading this report, could have a material impact on the accompanying consolidated financial statements and notes thereto. Accordingly, the readers of the audit report should understand that there is a possibility that the above audit report may have to be revised to reflect the impact of such subsequent events or circumstances, if any.
Financial Section 315

Operating Status Report ofthe Internal Control over Financial Reporting
To the Shareholders, Board of Directors and Audit Committee of KB Financial Group Inc.
We, as the Chief Executive Officer (“CEO”) and the Internal Control over Financial Reporting(“ICFR”) Officer of KB Financial Group Inc. (“the Company”),
assessed operating status of the Company’s Internal Control over Financial Reporting for the year ended December 31, 2019.
The Company’s management, including ourselves, is responsible for designing and operating ICFR.
We assessed whether the Company effectively designed and operated its ICFR to prevent and detect errors or frauds which may cause a misstatement in
financial statements to ensure preparation and disclosure of reliable financial information.
We used the ‘Conceptual Framework for Designing and Operating Internal Control over Financial Reporting’ established by the Operating Committee
of Internal Control over Financial Reporting in Korea (the “ICFR Committee”) as the criteria for design and operation of the Company’s ICFR. We also
conducted an assessment of ICFR based on the ‘Management Guideline for Evaluating and Reporting Effectiveness of Internal Control over Financial
Reporting’ established by the ICFR Committee.
Based on our assessment, we concluded that the Company’s ICFR is designed and operated effectively as of December 31, 2019, in all material respects, in
accordance with the ‘Conceptual Framework for Designing and Operating Internal Control over Financial Reporting’.
We certify that this report does not contain any untrue statement of a fact, or omit to state a fact necessary to be presented herein. We also certify that
this report does not contain or present any statements which might cause material misunderstandings, and we have reviewed and verified this report with
sufficient care.
February 24, 2020
Jong Kyoo Yoon,
Chief Executive Officer
Ki Hwan Kim,
Internal Control over Financial Reporting Officer
KB Financial Group Annual Report 2019316

317Appendix
Local Subsidiary Local Branch Representative Office
Company Directory
Overseas Network
KB Financial Group Head Office
Kookmin Bank Building, 26, Gukjegeumyung-ro 8-gil, Yeongdeungpo-gu, Seoul, 07331, Korea
TEL. 82-2-2073-7114
IR (Investor Relations)
11F, Kookmin Bank Building 26, Gukjegeumyung-ro 8-gil, Yeongdeungpo-gu, Seoul, 07331, Korea TEL. 82-2-2073-2843 FAX. 82-2-2073-2848 E-mail: [email protected]
Global Strategy Department
11F, Kookmin Bank Building 26, Gukjegeumyung-ro 8-gil, Yeongdeungpo-gu, Seoul, 07331, Korea TEL. 82-2-2073-0630 FAX. 82-2-2073-0610
Kookmin Bank Cambodia PLC.
No. 55, Street 214, Sangkat Boeung Raing, Khan Daun Penh, Phnom Penh, Cambodia
TEL. 855-23-999-202/204/304
FAX. 855-23-999-310
Kookmin Bank(China) Limited
19F, SK Tower, No.6 jia, Jianguomenwai Avenue, Chaoyang District, Beijing, China
TEL. 86-10-5671-2800
FAX. 86-10-5671-2701
KB Microfinance Myanmar
No.306, Thudmar Road, Nga Ward, North Okkalapa Township, Yangon, Myanmar
TEL. 95-1969-0093
Kookmin Bank Gurugram Branch
Unit No.2B/2, 2nd Floor, Two Horizon Centre, Golf Course Road, DLF Phase 5, Sector 43, Gurugram, Haryana-122002, India
TEL. 91-124-453-2222
Kookmin Bank Hanoi Branch
25F, Keangnam Hanoi Landmark Tower, E6 Cau Giay New Town, Me Tri, Nam Tu Liem, Hanoi, Vietnam
TEL. 84-24-3226-3377
FAX. 84-24-3226-3378
Kookmin Bank Ho Chi Minh City Branch
3F, Mplaza Saigon, 39 Le Duan Street, Ben Nghe Ward, District 1, Ho Chi Minh City, Vietnam
TEL. 84-28-3827-9000
FAX. 84-28-3910-7059
Kookmin Bank Hong Kong Branch
Suite 1101 and 1106, 11F, Central Plaza, 18 Harbour Road, Wanchai, Hong Kong
TEL. 852-2530-3633
FAX. 852-2869-6650
Kookmin Bank London Branch
6F, Princes Court, 7 Princes Street, London EC2R 8AQ, U.K.
TEL. 44-20-7710-8300
FAX. 44-20-7726-2808
Kookmin Bank New York Branch
24F, 565 Fifth Avenue, 46 Street, New York, NY 10017, U.S.A.
TEL. 1-212-697-6100
FAX. 1-212-697-1456
KB Kookmin Bank
Kookmin Bank Cambodia Stueng Meanchey Branch
No. 655, Street Monireth (St.217), Village Domnak Thom, Sangkat Steung Meanchey, Khan Meanchey, Phnom Penh, Cambodia
TEL. 855-23-999-431(~433)
Kookmin Bank Cambodia Chbar Ampov Branch
No.41, National Road No1, Phum Ta Ngov, Sangkat Nirouth, Khan Chbar Ampov Phnom Penh Cambodia (Kookmin Bank Cambodia Chbar Ampov Branch)
TEL. 855-23-999-451(~453)
Kookmin Bank Cambodia Branch Tuek Thla Branch
No.14(Plot No.2252), Street Phnom Penh Hanoi Friendship Blvd. (1019), Village Tuek Thla, Sangkat Tuek Thla, Khan Sen Sok, Phnom Penh, Cambodia
TEL. 855-23-999-422~425
FAX. 855-23-999-310
Kookmin Bank Auckland Branch
Level 19, 135 Albert Street, PO Box 7506, Wellesley, Auckland, New Zealand
TEL. 64-9-366-1000
FAX. 64-9-366-6608
Kookmin Bank Combodia Toul Kork Branch
No. 60A, St. 289, SangkatBoengKak 2, Khan ToulKork, Phnom Penh, Cambodia
TEL. 855-23-999-311~314
FAX. 855-23-999-315
Kookmin Bank Combodia Toul Tompong Branch
145CD, Mao Tse Tong Blvd (Street 245), Phum 6, Sangkat Toul Svay Prey 1, Khan Chamkamon, Phnom Penh, Cambodia
TEL. 855-23-999-411~414
FAX. 855-23-999-415

KB Financial Group Annual Report 2019318
Kookmin Bank Tokyo Branch
14F, Hibiyadai Bldg. 1-2-2 Uchisaiwaicho, Chiyoda-ku, Tokyo 100-0011, Japan
TEL. 81-3-5657-0550
FAX. 81-3-5657-0563
Kookmin Bank(China) Limited Beijing Branch
11F, SK Tower, No.6 jia, Jianguomenwai Avenue, Chaoyang District, Beijing, China
TEL. 86-10-5671-2904
FAX. 86-10-5671-2944
Kookmin Bank(China) Limited Guangzhou Branch
Room 601, Taikoo Hui Tower1, 385 Tianhe Rd. Tianhe District, Guanzhou, China
TEL. 86-20-3877-0566
FAX. 86-20-3877-0569
KB Microfinance Myanmar Co., Ltd. Thanlyin Branch
No4, Pyitawthar Street, Myothit (East) Ward, Thanlyin, Yangon, Myanmar
TEL. 95-99558-39868, 95-99558-39878
KB Microfinance Myanmar Co., Ltd. Thaketa Branch
1405, Myintawthat Street, Htuparyone(1) Ward, Thaketa T/S, Yangon, Myanmar
TEL. 95-99788-55714, 95-99788-55734
KB Microfinance Myanmar Co., Ltd. Hlaingtharya Branch
No. 37, 14 Ward, Nyaung Done Road(Beside), Hlaingtharya Township(MOC DUHD 10), Yangon, Myanmar
TEL. 95-164-5025
Kookmin Bank(China) Limited Harbin Branch
16F, Development Zone Mansion No.368, Changjiang Road, Nangang District, Harbin 150090, China
TEL. 86-451-8722-2801
FAX. 86-451-8722-2806
Kookmin Bank(China) Limited Suzhou Branch
Room 201-1, No.1 Huachi Road, Suzhou Industrial Park 215021 China
TEL. 86-512-6296-7500
FAX. 86-512-6292-7117
Kookmin Bank(China) Limited Shanghai Branch
Room 02-04, 2F, Shanghai Arch. Tower1, 523 Loushanguan Road, Changning District, Shanghai, China
TEL. 86-21-5231-9100
FAX. 86-21-5231-9112
KB Microfinance Myanmar Co., Ltd. Shwepyithar Branch
1124/A, Mahar Bandula Road, Pan Chan(8), Ta/15 Ward, Shwepyithar, Yangon, Myanmar
TEL. 95-99515-82010, 95-99515-82013
KB Microfinance Myanmar Co., Ltd. Pyinmana Branch
No(1005/1006), 17 Street, Paunglaung Ward, Pyinmana Township, Naypyitaw, Myanmar
TEL. 95-99572-63323, 95-99572-63343
KB Microfinance Myanmar Co., Ltd. Twantay Branch
No.80, Myot Shaung Road, Twantay Township, Yangon, Myanmar
TEL. 95-99654-64814, 95-99654-64909
KB Microfinance Myanmar Co., Ltd. Shwebo Branch
Tha Khout Taw, College Street, 6 Ward, Shwebo Township, Sagaing, Myanmar
TEL. 95-99671-36416, 95-99671-36427
Kookmin Bank Yangon Representative Office
No.306, Thudmar Road, Nga Ward, North Okkalapa Township, Yangon, Myanmar
TEL. 95-97670-48158
KB Microfinance Myanmar Co., Ltd. Magway Branch
No.16/4, Floor rooms/Three Strory Building(shop house), ChanMyaetharyar Housing, Beside Magway-Mandalay High-way
TEL. 95-99788-55956, 95-99788-55962
KB Microfinance Myanmar Co., Ltd. Chanmyatharzi Branch
No.F18(A), Yadanabon Street, Between 65 & 66 Street, ChanMyaTharZi T/S, Mandalay, Myanmar
TEL. 95-99788-55956, 95-99788-55962
KB Microfinance Myanmar Co., Ltd. Pakokku Branch
No.(43), Bogyoke Street, No.(5) Ward, Pakokku Township, Magway Myanmar
TEL. 95-99700-51540, 95-99700-51614
KB Microfinance Myanmar Co., Ltd. Kyaukse Branch
No (240/Sa), Kan Oo Ward, Kyaukse T/S, Mandalay, Myanmar
TEL. 95-99700-51185, 95-99700-51256
KB Microfinance Myanmar Co., Ltd. Tatkon Branch
No.11/1(Ka), Padouk Street, Myawaddy Ward, Tatkon T/S, NayPyiTaw, Myanmar
TEL. 95-99700-51769, 95-99700-51796
KB Microfinance Myanmar Co., Ltd. Lewe Branch
No(5) Ward, Lewe Township, NayPyiTaw, Myanmar
TEL. 95-99700-51407, 95-99700-54137
KB Microfinance Myanmar Co., Ltd. Salin Branch
Kyone Phit Sreet, Zay Ma Ward, Salin Township, Magway, Myanmar
TEL. 95-99671-36437, 95-99671-36438
KB Microfinance Myanmar Co., Ltd. Singu Branch
No.291, Beside of Mandalay-Mogok Road, Letpanhla Village Track, Singu Township, Mandalay, Myanmar
TEL. 95-99741-66423, 95-99741-66270
KB Microfinance Myanmar Co., Ltd. Monywa Branch
No.(6/211), Bo Tay Za Street, Nanda Win Ward, Monywa Township, Sagaing, Myanmar
TEL. 95-99741-66042, 95-99741-67031
KB Kookmin Bank

319
Kookmin Best Insurance Co., Ltd. US Branch
15F, 400 Kelby Street, Fort Lee, NJ 07024, U.S.A.
TEL. 1-201-720-2100 FAX. 1-201-720-2119
KB Insurance., Ltd. Los Angeles Liaison Office
505 North Brand Boulevard, Suite 1025 Glendale, CA 91203, U.S.A. TEL. 1-818-254-1040
KB Insurance., Ltd. Hanoi Liaison Office
Rm. 801, Hanoi Tung Shing Square, 2 Ngo Quyen St., Hanoi, Vietnam TEL. 84-4-3935-0814~5
PT. KB Insurance Indonesia Jayakarta Branch Office.
Jl. Pangeran Jayakarta, No. 129 Blok B 18-20, Jakarta, Indonesia
TEL. 62-21-624-5848
FAX. 62-21-624-5850~1
PT. KB Insurance Indonesia Kebon Jeruk Branch Office.
Jl. Pangeran Jayakarta, No. 129 Blok B 18-20, Jakarta, Indonesia
TEL. 62-21-624-5848
FAX. 62-21-624-5850~1
KB Insurance (China) Co., Ltd. Guangzhou Branch
2407, BaoliZhongying Building, 9, Huaqiang-Road, Tianhe-District, Guangzhou, Guangdong Province, China
TEL. 86-20-3855-6500
FAX. 86-185-6535-1088
KB Insurance., Ltd. Ho Chi Minh Liaison Office
Rm.15, 16th Floor, Vincom Center 72 Le Thanh Ton St. & 47 Ly Tu Trong St. Dist 1, HCMC, Vietnam TEL. 84-8-3821-9968
PT. KB Insurance Indonesia
Suit 2501, 25F, Sinarmas Land Plaza Tower 2, JL.M.H. Thamrin No. 51, Jakarta, Indonesia
TEL. 62-21-391-3101
FAX. 62-21-391-3115
LIG Insurance (China) Co., Ltd.
27F, No.2701-2703, Sunnyworld Center, 188, Lushan Road, Nanjing, Jiangsu Province, China
TEL. 86-25-8778-0888
FAX. 86-25-8778-0880
Leading Insurance Services, Inc.
15F, 400 Kelby Street, Fort Lee, NJ 07024, U.S.A.
TEL. 1-201-720-2100
FAX. 1-201-720-2119
KB Insurance
KB Daehan Specialized Bank
9 St 360, Phnom Penh, Cambodia TEL. 855-23-991-555
KB Kookmin Card Co., Ltd. (Yangon Representative Office)
No.306, Thudmar Road, Nga Ward, North Okkalapa Township, Yangon, Myanmar TEL. 070-5214-1303
KB Kookmin Card
KB KOLAO Leasing Co., Ltd.
7F, Alounmai Tower 23 Singha Rd, Vientiane, Laos TEL. 021-417-900 FAX. 021-417-901
KB Capital
KBFG Securities America Inc
Suite 1900, 1370 Avenue of the Americas, New York, NY 10019, U.S.A
TEL. 212-265-2333
FAX. 212-265-2676
KB Securities Hong Kong Ltd.
Suite 1105, 11F, Central Plaza, 18 Harbour Road, Wan Chai, Hong Kong
TEL. 852-2869-0559
FAX. 852-2521-5215
KB Securities Vietnam Joint Stock Company
2 Floor, Sky City Tower, 88 Lang Ha Street, Dong Da Ward, Ha Noi city, Vietnam
TEL. 84-24-3776-5929
FAX. 84-24-3822-3131
KB Asset Management Singapore Pte. Ltd.
3 Church Street, #21-01 Samsung Hub, Singapore 049483 TEL. 65-6580-2660 FAX. 65-6580-2669
KBAM Shanghai Advisory Services Co., Ltd.
2205, No.161, Lujiazui East Road, Pudong New Area, Shanghai, China TEL. 86-21-5864-7156 FAX. 86-21-5047-8605
KBAM Vietnam Representative Office
Unit 702B, 7th Floor, 37 Ton Duc Thang Street, Ben Nghe Ward, Ho Chi Minh City, Vietnam
TEL. 84-90-988-5343
KB Asset Management
KB Securities
Appendix

KB Financial Group Annual Report 2019320
Forward Looking Statements
This document contains forward-looking statements. Words and phrases such as “will,” “aim,” “will likely result,” “will continue,”“contemplate,” “seek to,”
“future,” “objective,” “goal,” “should,” “will pursue,” “anticipate,” “estimate,” “expect,” “project,” “intend,” “plan,”“believe” and words and terms of similar
substance used in connection with any discussion of future operating or financial performance identify with forward-looking statements. All forward-
looking statements are management’s present expectations of future events and are subject to a number of factors and uncertainties that could cause
actual results to differ materially from those described in the forward looking statements.
The factors that could cause actual results to differ include, but are not limited to, the following:
· KB Financial Group’s ability to successfully implement its strategy;
· future levels of non-performing loans;
· KB Financial Group’s growth and expansion;
· adequacy of allowance for credit and investment losses;
· technological changes;
· investment income;
· availability of funding and liquidity;
· cash flow projections;
· KB Financial Group’s exposure to market risks; and
· adverse market and regulatory conditions.
By their nature, certain disclosures relating to these and other risks are only estimates and could be materially different from what actually occurs in
the future. As a result, actual future gains, losses or impact on KB Financial Group’s income or results of operations could materially differ from those
that have been estimated.
In addition, other factors that could cause actual results to differ materially from those estimated by the forward-looking statements contained in
this document could include, but are not limited to:
· general economic and political conditions in Korea or other countries that have an impact on KB Financial Group’s business activities or investments;
· Korea’s monetary and interest rate policies;
· inflation or deflation;
· foreign exchange rates;
· prices and yields of equity and debt securities;
· performance of the financial markets in Korea and internationally;
· changes in domestic and foreign laws, regulations and taxes;
· changes in competition and the pricing environments in Korea; and
· regional or general changes in asset valuations.
KB Financial Group cautions the reader not to place undue reliance on the forward-looking statements, which speak only as of the date of this
document.
Except as required by law, we are not under any obligation, and expressly disclaim any obligation, to update or alter any forward-looking statements,
whether as a result of new information, future events or otherwise. All subsequent forwardlooking statements attributable to KB Financial Group
or any person acting on its behalf are expressly qualified in their entirety by the cautionary statements contained or referred to in this document.


Kookmin Bank Building, 26, Gukjegeumyung-ro 8-gil, Yeongdeungpo-gu, Seoul, Korea, 07331 Tel: +82-2-2073-7114www.kbfg.com