
Incentivizing Energy Efficiency: Explaining Local Commitment to Energy Efficiency in Cities with...
29
1 Incentivizing Energy Efficiency: Explaining Local Commitment to Energy Efficiency in Cities with Municipal-Owned Utilities Hongtao Yi Askew School of Public Administration and Policy Florida State University Phone:1-850-980-2315 Email: [email protected] David S. T. Matkin Askew School of Public Administration and Policy Florida State University [email protected] Richard C. Feiock Askew School of Public Administration and Policy Florida State University [email protected] Abstract: Municipal-owned utilities perform an important role in local government efforts to implement energy-efficiency strategies and practices. Utility ownership provides unique opportunities for local governments to involve citizens in “green” initiatives. This paper seeks to understand why some governments with municipal-owned utilities invest resources on energy-efficiency strategies while others do not. We investigate this question by examining the use of energy-efficiency initiatives by municipal-owned utilities in American local government. We argue that spending on energy-efficiency strategies is affected by (1) cost considerations, (2) city political and fiscal conditions, and (3) citizen pressures. With data collected for the 145 municipal-owned utilities in cities with populations over 25,000, we test these relationships with a Heckman Selection Model. We find that the decision to adopt an energy-efficiency program is associated with siting difficulties and available generation capacity. The level of energy-efficiency expenditures is associated with a jurisdiction’s form of government and the availability of local retail partners. The implications of these findings for theory and practice are discussed in conclusion. Key Words: Energy Efficiency; Demand-side Management; Municipal-Owned Utilities Currently under review in Energy Policy Paper presented at the annual meeting of the American Political Science Association Annual Meeting, Seattle WA, September 1-4, 2011.
Transcript of Incentivizing Energy Efficiency: Explaining Local Commitment to Energy Efficiency in Cities with...

1
Incentivizing Energy Efficiency: Explaining Local Commitment to Energy Efficiency
in Cities with Municipal-Owned Utilities
Hongtao Yi Askew School of Public Administration and Policy
Florida State University Phone:1-850-980-2315
Email: [email protected]
David S. T. Matkin Askew School of Public Administration and Policy
Florida State University [email protected]
Richard C. Feiock
Askew School of Public Administration and Policy Florida State University
Abstract: Municipal-owned utilities perform an important role in local government efforts to implement energy-efficiency strategies and practices. Utility ownership provides unique opportunities for local governments to involve citizens in “green” initiatives. This paper seeks to understand why some governments with municipal-owned utilities invest resources on energy-efficiency strategies while others do not. We investigate this question by examining the use of energy-efficiency initiatives by municipal-owned utilities in American local government. We argue that spending on energy-efficiency strategies is affected by (1) cost considerations, (2) city political and fiscal conditions, and (3) citizen pressures. With data collected for the 145 municipal-owned utilities in cities with populations over 25,000, we test these relationships with a Heckman Selection Model. We find that the decision to adopt an energy-efficiency program is associated with siting difficulties and available generation capacity. The level of energy-efficiency expenditures is associated with a jurisdiction’s form of government and the availability of local retail partners. The implications of these findings for theory and practice are discussed in conclusion.
Key Words: Energy Efficiency; Demand-side Management; Municipal-Owned Utilities
Currently under review in Energy Policy
Paper presented at the annual meeting of the American Political Science Association Annual Meeting, Seattle WA, September 1-4, 2011.
2
Incentivizing Energy Efficiency
Introduction Energy efficiency and climate protection are among the most complex and
challenging policy areas in modern governance, and efforts to improve energy
efficiency and conservation take increasingly prominent positions on the policy
agendas of international, national, state and local governments. The popularity of
energy-efficiency programs comes, in part, from the various societal benefits that are
anticipated and promoted by policy advocates. For example, energy efficiency
strategies are thought to have the potential to (1) reduce the emission of greenhouse
gases and thereby mitigate global climate change, (2) reduce costs associated with
maintaining reliable energy supplies for peak periods of electrical power demand, (3)
reduce or eliminate the economic and political costs of siting new energy
infrastructure, and (4) induce energy-efficient technological innovations (Brennan,
2010). In addition, as a result of the recent economic downturn and the fiscal stress
that many U.S. cities have experienced, local government policy makers have
increasingly turned to energy efficiency as a mechanism to ease financial constraints
(Francis and Feiock, 2010).
Local governments, however, are not equally equipped to implement
energy-efficiency strategies. The presence of municipal-owned utilities may play a
critical role in the availability and desirability of various policy options. But utility
ownership may also create incentives to resist or delay the use of energy-efficiency
strategies. This is because owning a municipal utility can be a double-edged sword.
On the one hand, owning a utility can possibly slow down a city’s commitment to
climate protection, due to the high costs that are often associated with
climate-protection strategies (Krause, 2010). On the other hand, owning a utility can
3
present an opportunity for local governments to involve citizens in efforts to pursue
“green” initiatives. For example, cities with municipal-owned utilities can directly
engage in efforts to inform citizens of how much they can save in their monthly bills
through improving their energy efficiency, inform citizens of their green-house gas
emissions, and sponsor strategies to reduce those emissions though various rebate
programs (Byrne et al., 2007). If city officials intend to pursue energy-efficiency
programs, owning a utility can provide distinct advantages. However, not all cities
are committed to climate protection and energy efficiency, and not all cities own
their own utilities.
Even among those cities with municipal-owned utilities, there is significant
variation in the use of energy-efficiency programs. Some governments with
municipal-owned utilities spend millions of dollars on energy-efficiency programs
while others don’t spend anything. This begs the question of why some cities with
municipal-owned utilities spend financial resources on energy efficiency while
others do not? We will answer this question by investigating the underlying factors
behind the use of energy-efficiency incentives.
Energy Efficiency at the Local Level
Energy-efficiency programs attempt to reduce the overall electricity
consumption by creating incentives for consumers to engage in actions to make
existing buildings and equipment more efficient (e.g., proper insulations, smart
climate controls) or by creating an incentive to substitute more efficient equipment
for less efficient equipment. For example, equipment replacement incentives often
include high-efficiency appliances, high-efficiency lighting systems, and
high-efficiency heating and air conditioning (HVAC) systems. Local governments
4
and municipal-owned utilities promote energy efficiency by providing incentives, in
the forms of rebates and loans, for residents, commerce and industries to buy
energy-efficient equipment and engage in load management programs.
Several streams of literature inform this study. First, studies of utility-operated
energy-efficiency programs are found in the literature on demand-side management.
Demand-side management includes “the planning, implementation, and monitoring
of utility activities designed to encourage consumers to modify patterns of electricity
usage, including the timing and level of electricity demand” (EIA, 2011).
Utility-operated energy-efficiency programs are one type of demand-side
management program. Demand-side management can significantly improve energy
efficiency through information audits, labeling, rebate, loans and leasing,
performance contracting, load switching, direct-load controls, time-of-use pricing
and use of smart metering (Nadel and Geller, 1996; Strbac, 2008).
Studies of demand-side management programs are generally concerned with the
cost and effectiveness of those programs (Loughran and Kulick, 2004; Auffhammer
et al., 2008; Wirl, 2000; Hill and Brown, 1995; Hobbs, 1991), the design of
incentives (Eto et al., 1998), and the impact of demand-side programs on greenhouse
gas emissions (Garg et al., 2011). Most studies focus on investor-owned utilities, but
a few have studied the energy-efficiency programs of municipal-owned utilities. For
example, Wilson et al. (2008) reported on a survey that examined the challenges and
opportunities for energy-efficiency programs in rural electric co-operatives and small
municipal utilities. Wilson et al. (2008) systematically summarized the differences
between investor and municipal ownership of utilities in their institutional structure,
ownership form, customers and demand, revenue systems, and the role of state
regulation. The findings suggest that the major benefits of demand-side management
5
programs are in improved customer relations and public image, and that local
partnerships are salient to the success of demand-side management programs. The
work of Wilson et al. (2008) is based on a case study of policy efforts in a single
state (Minnesota), but their analysis suggests the potential contribution from
quantitatively evaluating the reasons behind the use of energy-efficiency programs
by governments with municipal-owned utilities across the U.S.
The major difference between investor-owned utilities and municipal-owned
utilities is that investor-owned utilities are typically regulated by state public
utilities/service commissions, while municipal-owned utilities have much more
discretion in making decisions related to rate designing and energy efficiency
(Wilson et al., 2008; Bachrach et al., 2004). The state green energy policies, such as
renewable portfolio standards and energy efficiency resource standards, among other
policy tools, generally apply to investor-owned utilities, instead of municipal utilities.
The “unregulated” or “less regulated” nature of municipal utilities poses interesting
questions as to why and how they make commitment to energy efficiency with much
less regulation from upper level government.
An emerging literature on the local climate actions is tied to research on
energy-efficiency programs in several ways. Local climate protection involves the
use of inventories, reduction strategies and monitoring of greenhouse gases (ICLEI,
2011). Research shows that energy-efficiency programs are among the most
common policy instruments that local officials consider in their efforts to address
local climate protection (Francis and Feiock, 2010; Krause, 2010). Also, local
government decisions to adopt local climate policies are driven by localized policy
benefits such as air pollution reduction and economic benefits (Betsill, 2001). The
factors that are expected to influence local climate policy adoption include:

6
• expectations of cost savings (Kousky and Schneider, 2003; Lindseth, 2004),
• community wealth (Van Liere and Dunlap, 1981; Scott and Willits, 1994; Brody et al. 2003; Tang and Brody, 2009; Tang et al., 2009),
• economic development opportunities (Kousky and Schneider, 2003;
Lindseth, 2004; Engel and Orbach, 2008),
• co-benefits such as air quality improvement, public health protection and traffic congestion alleviation (Kousky and Schneider, 2003; Lindseth, 2004),
• the presence of policy entrepreneurs (Kousky and Schneider, 2003; Engel
and Orbach, 2008),
• citizen demand (Betsill, 2001; Bassett and Shandas, 2010),
• state mandates (Berke et al., 1996),
• climate risks (including coastal distance, population density and hazard damage) (Brody et al., 2008; Zahran et al., 2008),
• climate stress variables such as light transportation, emissions per capita,
carbon intensive industry (Brody et al., 2008; Tang et al., 2010),
• and the influence of neighboring governments (Krause, 2010).
In studies of local climate action, counties or large cities are typically included
in the sample frame, and the role of municipal-owned utilities in local climate
actions and energy efficiency is emphasized. Understanding the circumstances under
which cities with their own utilities will commit to energy-efficiency strategies and
at what level they commit to those strategies is also of practical values to local
officials who wish to coordinate their efforts for climate protection and energy
efficiency.
Explaining Local Energy Efficiency Effort

7
Several factors are thought to be associated with the efforts of municipal-owned
utilities to engage in energy-efficiency programs. These include: energy supply-side
conditions, the characteristics of municipal-owned utilities sales, the institutional
form and fiscal capacity in the city, the presence and nature of relevant
public-private partnerships, and various citizen characteristics. The use of
energy-efficiency programs by municipal-owned utilities may be affected by (1) a
variety of cost considerations, (2) political and fiscal conditions in the city, (3) the
cooperation of external private partners, and (4) pressures from the citizens.
Cost Considerations and Supply-Side Conditions
Utility services perform an important role in balancing between energy supply
and energy demand. As such, supply-side factors (i.e., the scarcity or abundance of
energy) are likely to directly affect local government decisions to invest in
energy-efficiency programs. This is particularly relevant when energy-efficiency
programs are viewed as viable alternatives to efforts to increase energy supply, such
as with the siting and development of new power plants (Nadel and Geller, 1996)
and the expansion of existing power plants. In addition to possibly reducing financial
costs by delaying or reducing the need for additional energy supply,
energy-efficiency programs are favorably viewed because they can defer the
environmental costs of building and operating additional power plants (Hirst et al.,
1996).
Supply-side challenges are manifested in several ways. First, difficulties in
siting new energy infrastructure are driving forces behind government efforts to
implement demand-side management. For example, a 2010 proposal for a biomass
power station in Tallahassee met substantial neighborhood opposition and split
environmental constituencies, leading to the proposal’s ultimate rejection.

8
Common forms of energy infrastructure include power plants, wind farms,
transmission lines, and petroleum refineries, all of which require significant land. In
the 1980s, the number of baseload power plants steadily increased to meet the rising
demand for energy (Hirst et al., 1996). That growth was made possible by relatively
affordable land and low levels of conflict among stakeholders involved in siting
decisions, and much has changed since then. In recent decades, siting new energy
infrastructures has become increasingly difficult (Casper and Wellstone, 1981;
Halvorsen, 1999). A recent public opinion survey found the majority of Americans
oppose the location of coal, natural gas, and nuclear power plants in their area
(Ansolabehere and Konisky, 2009).
The siting difficulty sometimes presents itself with NIMBY
(not-in-my-back-yard) issues, with the siting of new power plants delayed by local
environmental groups as well as neighborhood and homeowner organizations. For
example, Michigan's first large coal-fired power plants since 1984 was delayed by
local citizen groups with the help of the Sierra Club, and a citizens group has sued to
stop state environmental regulators from issuing air quality permits for new plants
until they regulate carbon dioxide emissions (Michigan Business, 2008). Similar
stories have been repeated throughout the county. For example, Loftis (2010)
documents the mobilization of local environmental groups protests against the
establishment of new power plant in west Texas.
Siting issues are different for each community and can vary depending on the
community and the type of infrastructure. If there is a desire to increase energy
supply by enlarging transmission capacities, the barriers often lie in the siting of
transmission lines. For communities that plan to develop new power plants, the
problems are to site both the plant and the transmission lines. The political and
9
financial pressures against the expansion of energy infrastructure in order to increase
the supply of energy is likely to create electoral and administrative incentives to shift
policy efforts away from supply-side solutions for energy needs and toward efforts to
reduce energy demand.
Another supply-side factor to consider is whether cities generate their own
electricity. Unlike many investor-owned utilities, municipal-owned utilities often do
not generate their own electricity. Instead, they purchase electricity from a wholesale
electricity market and from other power generators in order to satisfy the demands of
its jurisdiction. A municipal-owned utility with electricity generation has a greater
stake in balancing the supply and demand of the electricity, therefore, making it
more likely to implement a demand-side management program. By contrast, a
municipal-owned utility without electricity generation is faced with less risks and
costs involved in keeping the energy demand stable and below the supply capacity,
because the risks and costs are partially shifted to consumers. Municipal-owned
utilities without generation are retailers of electricity and can avoid the high peak
demand price by shifting the cost to the consumers. Even if they refrain from this,
considering the political risks, the cost difference between peak and normal period is
larger for municipal-owned utilities with generation capacities than those without
generation capacities. Furthermore, the generation capacity of municipal-owned
utilities are much smaller compared with the large generators in the wholesale
market and thus are vulnerable to fluctuations in the demand. Utilities without
generation capacity are insulated from risks by connecting to a larger and more
stable electricity network. We test these relationships with the following hypotheses
(stated in their alternative form).

10
Hypothesis 1: As new energy infrastructure becomes more difficult to site, municipal-owned utilities will be more likely to engage in energy-efficiency programs.
Hypothesis 2: Municipal-owned utilities with their own electricity generation
function will be more likely to engage in energy-efficiency programs. Sale Characteristics
Electricity is needed by all sectors of a local economy (i.e., residential, industrial
and commercial). The proportion of the electricity consumed by each sector,
however, differs widely among utilities. Some municipal-owned utilities sell the vast
majority of their electricity to residential properties, while others have more balanced
portfolios of residential, industrial and commercial sales. This is important because
the electricity sold to industrial and commercial facilities is generally more profitable,
because these customers have fewer accounts and thereby less operating expenses
associated with account management. Furthermore, it is argued that public
ownership of the electric utilities would favor the residential customers
overindustrial customers (Kwoka, 1996) with residential customers paying less and
industrial customers paying more compared with customers of investor-owned
utilities. This suggests that municipal-owned utilities subsidize residential customers
with profits generated from the industrial accounts. A higher percentage of
residential accounts for a municipal-owned utility means it has more customers to
serve than to extract, leaving less slack resources for the utilities to spend on
energy-efficiency programs. In addition, savings-to-expenditures ratios are lower for
residential demand-side management programs than for commercial or industrial
programs (Joskow and Marron, 1992).
Municipal-owned utilities that generate their own electricity use that power to
meet the needs of its own jurisdiction and sell the excess production to other
11
jurisdictions. The resale of the electricity can provide significant revenues for
municipal-owned utilities with excess capacity. The potential to sell excess
electricity has implications for decisions to pursue energy-efficiency programs.
Utilities with excess electrical capacity may be less likely to invest in
energy-efficiency programs in order to reduce local demand. This is because their
jurisdiction has a lower risk of exceeding electrical capacity resulting in blackouts or
the need to purchase expensive electricity from other utilities. Although utilities with
excess electrical capacity might also be more likely to invest in energy-efficiency
programs in order to capitalize on possible arbitrage opportunities through selling
their electricity to other jurisdictions or corporations. We test these relationships with
the following hypotheses (stated in their alternative form).
Hypothesis 3: The more dependent a municipal-owned utility is on the residential electricity sales, the less it will spend on energy-efficiency programs.
Hypothesis 4: The more a municipal-owned utility’s revenue is derived from the
resale of electricity to other utilities, the less it will spend on energy-efficiency programs.
City Government and Energy-Efficiency Programs
While municipal-owned utilities are generally more independent from city
management than conventional city departments, their administration is not wholly
independent of policy choices made by city governments. Municipal-owned utilities
provide a direct benefit to their cities in the form of payments and contributions.
Specifically, these payments and contributions are made in property-like taxes,
payments in lieu of taxes, and transfers to the general funds. According to the data of
American Public Power Association, a median municipal-owned utility contributed
4.7 percent of its electric operating revenues to its local community. This means that

12
the managers of those utilities must consider issues of political feasibility and
city-level budgetary considerations in addition to issues of profitability.
Previous research demonstrates that one of the most important local political
institutions is the form of government. In the U.S., there are two major municipal
government types: mayor-council and council-manager government forms. Extant
research concludes that a key difference between the two forms lies in the ways they
respond to different interests and prioritize different policy issues (Clingermayer and
Feiock 2001). Mayor-council form of government has been observed to be more
open to organized interest group influences, while council-manager form of
government tends to be more insulated from some of these pressures (Lubell et al.,
2008; Sharp et al., 2011). The influence of the forms of government on local
government use of energy-efficiency programs results from their different
approaches to the options in the supply of energy generation. Because officials in
cities with mayor-council form of government tend to be highly concerned about
electoral outcomes (e.g., reelection), they are more easily influenced by constituency
interest groups opposition to new energy infrastructures. Faced with a choice
between supply-side and demand-side strategies, officials in mayor-council cities are
anticipated to choose politically safe energy-efficiency programs. By contrast, the
career ambitions of city managers are likely to favor efficiency and economic
development considerations in infrastructure decisions. Thus mayor-council
governments may be less likely to invest on new energy infrastructures that may
crowd out energy-efficiency program efforts.
Local government fiscal conditions also has implications for energyprograms.
Energy-efficiency programs require varying levels of direct expenditures (e.g.,
purchase of energy-efficient light bulbs for trade-in programs) or indirect

13
expenditures (e.g., tax incentives). Governments experiencing fiscal stress are likely
to have limited resources to devote to energy-efficiency programs. Even though
municipal-owned utilities are considered proprietary enterprises and, as such, are
generally expected to be financially self-sufficient, the financial systems of
municipal propriety enterprises and general government activities are closely
connected. General governments often subsidize enterprise functions, especially
public transit enterprises, but electrical utilities are more self-sufficient and
frequently subsidize general government functions, usually through charges for
general government overhead. When cities are in fiscal deficit or have increases in
liabilities, city officials may be more likely to transfer utility revenues toward
general government functions rather than energy-efficiency programs (Bachrach et
al., 2004). Therefore, we expect that officials in cities in strong fiscal condition
spend more on energy-efficiency programs than officials in cities in poor fiscal
condition.We test these relationships with the following hypotheses (stated in their
alternative form).
Hypothesis 5: Cities with mayor-council form of government are likely to spend more on energy-efficiency programs than those with a council-manager form of government.
Hypothesis 6: The fiscal condition of a city government is positively associated with
their level of spending on energy-efficiency programs.
Public-Private Partnerships and Energy Efficiency
Modern trends in government administration have moved from a focus on direct
provision of public goods to a greater reliance on public-private partnerships in
policy implementation (Kettl, 1993). This trend is well demonstrated in the area of
energy efficiency. Local utilities often provide incentives for the consumers to buy
energy-efficient appliances, light bulbs and equipment. However, public utilities

14
have to rely on local retail stores to provide these items (Wilson et al., 2008). If a
utility provider lacks these partners, it can significantly impede their efforts to
implement energy-efficiency programs, because the limited supply of private
providers (e.g., retail stores or retail stores of necessary capacity) may significantly
reduce the effectiveness of incentive programs. As such, decisions to engage in
energy-efficiency programs often require careful consideration into the availability
of qualified private partners. In addition, private providers of energy-efficiency
solutions are likely to function as interest groups for various energy-efficiency
programs. As such, they may lobby for energy-efficiency expenditures. Therefore,
we anticipate a positive relationship between private providers of energy-efficiency
solutions and municipal-owner utility expenditures for energy-efficiency programs.
We test this relationship with the following hypothesis (stated in its alternative
form).
Hypothesis 7: The presence of local private partners for energy-efficiency products is positively associated with local energy-efficiency program expenditures.
Citizen Characteristics and Energy-Efficiency Programs
Environmental interests are active participants in local politics. The
environmental benefits of energy-efficiency programs attract the support of local
environmental groups in several ways. First, the expected reduction in emissions of
the greenhouse gases resulted by the implementation of demand-side management
programs are consistent with the climate protection theme of the environmental
movement. Second, if demand-side options are seen as substitutive to supply-side
deployment of new energy infrastructures, the promotion of demand-side alternatives
will be highly attractive to environmental interest groups since they may mitigate the
need to build additional power plants or transmission lines.
15
Citizens’ ideological positions are also likely to affect the use of
energy-efficiency programs. Liberal ideology is generally associated with
pro-environmental policy positions, and it could be expected that governments with
more liberally oriented populations will favor the adoption and implementation of
energy-efficiency programs (Sharp et al., 2011). Even if liberal residents do not
actively lobby for the use of energy-efficiency programs, officials in more liberal
communities may view energy-efficiency programs as a tool to improve customer
relations and public image (Wilson et al., 2008). We test these relationships with the
following hypotheses (stated in their alternative form).
Hypothesis 8: The greater the number of environmental interest groups in a city, the more the city will spend on energy-efficiency programs.
Hypothesis 9: The higher the percentage of citizens in a city who vote for
Democrat-party candidates, the more the city will spend on energy-efficiency programs.
Methodology
We examine the population of cities with populations of 25,000 or more
residents in 2000 that operate a municipal-owned utility. The decision to investigate
energy-efficiency programs in cities with municipal-owned utilities reflects their
significant different from the decision in cities that don’t own their own utilities.
The sample is limited to cities with populations over 25,000 is due to data
availability. Information on municipal-owned utilities is based on reports included in
the Energy Information Agency (EIA) Form-861 on the Demand Side Management
programs. EIA conducts an annual survey of the operations and activities of the
electricity utilities by asking them to fill Form-861, generating a rich data set of
utility revenues, sales, and demand side management. This procedure generates a
sample of 145 cities.
16
Dependent Variable
The dependent variable, Energy Efficiency Expenditure (EEEXP), measures the
annual incentive payment for energy efficiency. The data is coded from the 2007
version of EIA Form-861, which collects annual information on electric utility
characteristics, operations, revenues, generations and demand side management. The
2007 data is used because it is the most comprehensive EIA demand-side
management data available over the last ten years. The summary statistics show
that municipal-owned utilities spend $261,000 on energy-efficiency programs per
year, with the largest annual spending $9 million (Huntsville, AL).
Energy Supply Variables
Two variables measuring the characteristics of energy supply in the MOUs are
Siting Difficulty (SITINGDIFF) and Net Generation (NETGEN). Siting Difficulty
measures the level of difficulty in siting new energy infrastructure, like power plants
and transmission lines. There are multiple indicators of siting difficulty in the
literature (Vajjhala and Fischbeck, 2007), including economic indicators, geographic
indicators, construction indicators and respondents assessments. A survey based
measure of siting difficulty collected through surveys conducted by Vajjhala and
Fischbeck (2007) is used. Their survey elicits expert opinions from siting experts and
professionals across the U.S. regarding the siting difficulties and constraints in their
given state. Siting difficulties are rated on a 10-point scale, where 1 was the easiest
and 10 was the hardest. The weighted average of all respondents was used as the
measurement of siting difficulty in this study. The scores indicate that Florida has the
highest score of 8.08, making it the hardest state to site new energy facilities and
Ohio is the easiest state to site a new utility project, with a score of 5.69.

17
Net Generation measures whether an MOU has its own generation capacity. It is
measured with a dummy variable, with 1 indicating an MOU has its own generation
capacity and 0 indicating an MOU does not have its own generation capacity. The
data on Net Generation is gathered from EIA Form-861 (2007).
Sales Characteristics Variables
Two variables measure the sales characteristics of municipal-owned utilities.
Percent Residential Sales (RESISALE) measures the percentage of electricity sales
from the residential sector to the total sales. Both residential sales and total sales data
were obtained from EIA Form-861 (2007). Percent Residential Sales was calculated
for each municipal-owned utility by dividing residential sales over total sales.
Another variable is Resale Revenue (RESALEREV), which measures the revenue
received for the sale of wholesale power to other electric utilities. The data on Resale
Revenue was also obtained from EIA Form-861 (2007).
City Government Variables
Two city government variables are Form of Government (FOG) and Fiscal
Capacity (FISCAL). Form of Government measures the institutional structure of the
executive branch in the municipal government. A city government dummy variable
was coded as 1 if the city has a mayor-council form of government, and was coded
as 0 if the city has a council-manager form of government based on International
City Management Association (ICMA) surveys in 1991, 1996, 2001 and 2006.
Missing survey data was supplemented by searches of websites of these governments.
Fiscal Capacity variable is measured by per capita difference between the city’s
general revenue and general expenditure. The city fiscal data were obtained from
Census (2000).
Local Retail Partners and CitizenVariables
18
The Local Retail Partner (REPART) variable is measured with a dummy
variable, with 1 indicating there is 1 or more local energy-efficiency retailers within
5 miles of the city center, and 0 indicating there is 0 retail stores within the 5 mile
range. The local retailers include chained stores like Home Depot and Best Buy, as
well as local-based stores. The logic behind using a dummy variable instead of
continuous variable is that once the supply of private partners passes a minimum
threshold, the decision on energy efficiency might not be dependent on the
oversupply of retailers. The data is retrieved from Department of Energy’s Energy
Star programs.
Two variables measure citizens’ environmental orientation. Environmental
Nonprofits (ENVNPO) measures the number of nonprofit environmental
organizations in the county where the city is located as of September 2007.
Nonprofit organizations are defined as organizations that are required to file
Form-990 with Internal Revenue Service. Data on nonprofit status were retrieved
from National Center for Charitable Statistics.
In addition, we include another measure for the citizen’s ideological orientations,
the Percent Voting Democrat (VOTEDEM) variable. This variable measures the
percent of citizens voting for the Democratic Party in the Presidential election in a
county in 2004.
Control Variables
A set of variables are also included as controls in the statistical analysis.
Household Median Income (INCOME) measures the median household income in a
city. Percent White (WHITE) and Percent Black (BLACK) measure the percentage of
white and black population in a city separately. Peak Energy Consumption Days
(PEAK) measures the sum of cooling degree days and heating degree days. This
19
variable is an indicator of the energy consumption intensity in the city. The control
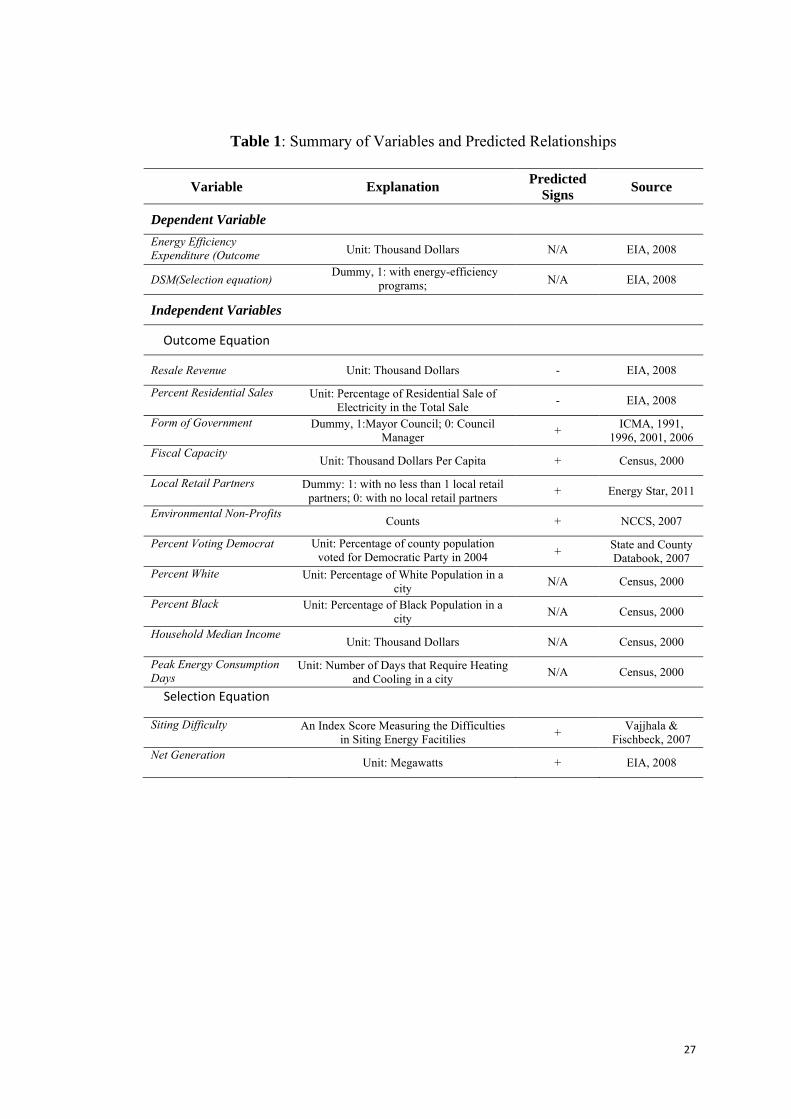
variables were obtained or calculated based on the Census data (2000). Explanations
of the variable measurement and data sources are presented in Table 1.
Table 1 here
Method
Considering the data generation procedures on the dependent variable, whether a
utility responds to EIA Form-861 is probably nonrandom. The relative completeness
of the dataset on the dependent variable does not guarantee its randomness in
selection into the sample frame. Therefore, we decided to estimate the Heckman
Selection Model where the selection equations uses the energy supply variables to
predict whether a utility will have a demand side program, and the outcome
equations uses sales characteristics variables, city government variables, local retail
partners, citizen characteristics variables and other control variables to predict the
level of demand side management expenditures. The reason for using the energy
supply variables in the selection equation is that if a municipal-owned utility is faced
with the constraint from the supply side, it does not have many alternatives other
than implementing the energy-efficiency programs. This means that the supply side
constraints dominate the decision in implementing the demand-side programs. The
Heckman Selection Model is specified as follows.
Selection Equation: Pr(DSM=1) = Ф(γ0 + γ1 SITINGDIFF + γ2 NETGEN) Outcome Equation:
EEEXP = β0 + β1 RESISALE + β2 RESALEREV + β3 REPART + β4 FOG + β5 FISCAL + β6 ENVNPO + β7 VOTEDEM + β8 INCOME + β9 WHITE+ β10 BLACK + β11 PEAK
In the selection equation, an indicator variable DSM is used as dependent
variable, with 1 indicating that there are energy-efficiency programs in the city and 0
20
indicating no such programs in the city. The 30 cities that have implemented
energy-efficiency programs are coded as 1, and theother 115 cities are coded as 0.
Both two-step procedures and Maximum Likelihood Estimation (MLE) were applied
to estimate the model. Given that the two methods generate similar results, we use
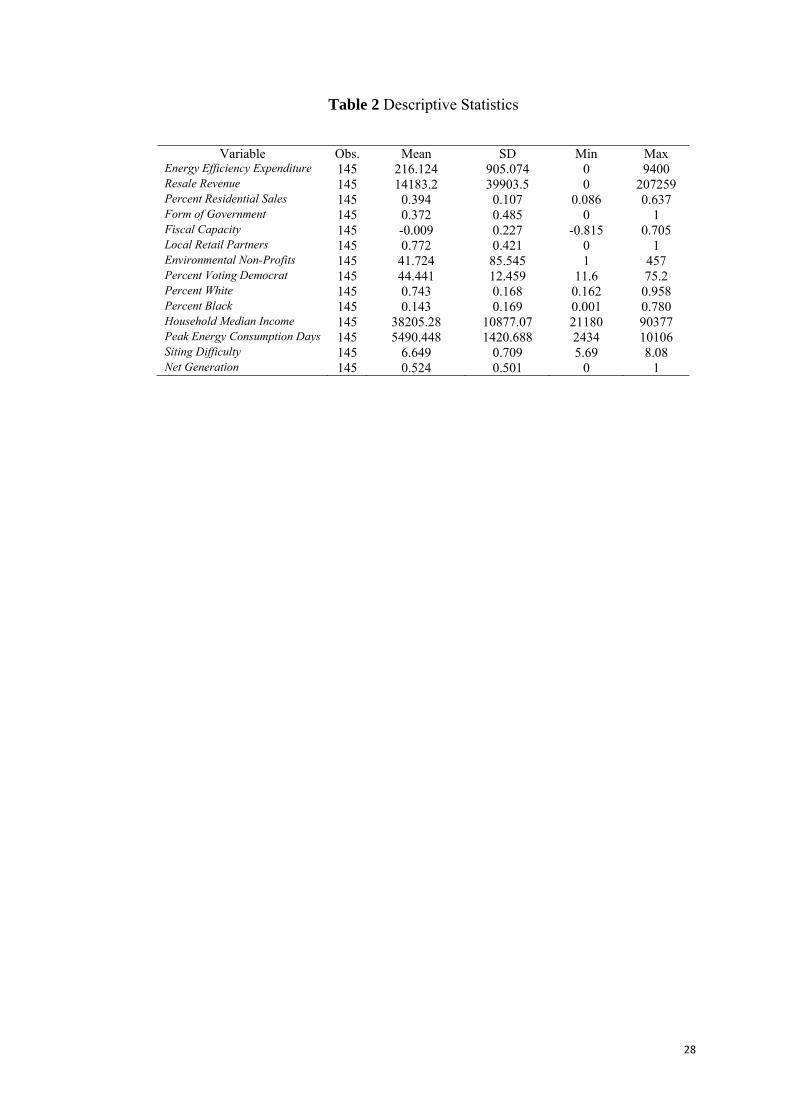
MLE as our estimation strategy. Table 2 reports the descriptive statistics for all the
variables.
Table 2 here
Results and Discussion
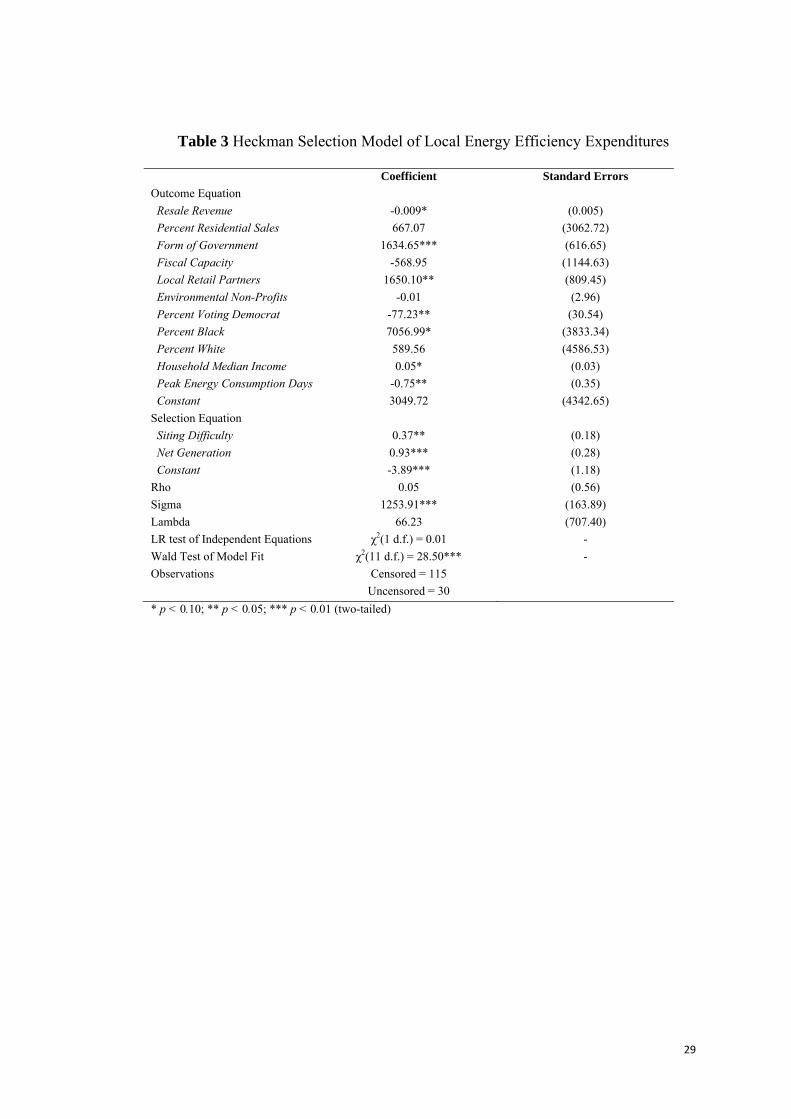
Table 3 reports the results of the Heckman Selection Model for the
energy-efficiency expenditures. The Wald test (χ2(11 d.f.) = 28.50) confirms that
coefficients of the outcome equation are significantly different from zero. To test the
validity of the choice of the Heckman Selection Model, we need to test the
hypothesis that the selection and outcome equations are independent. A Likelihood
Ratio test of Independent Equations was performed, and the test statistics fails to
achieve significance at the 0.05 level (χ2(1 d.f.) = 0.01). This indicates that the
standard regression analysis applied to the outcome equation could have yielded
biased results.
The first results to note are the significant effects of Siting Difficulty and Net
Generation in the selection model. The coefficient of Siting Difficulty is positively
significant at the 0.05 level (p-value = 0.035). This indicates that the more difficult
the new energy infrasture’s siting decisions, the more likely the municipal-owned
utility is going to start an energy-efficiency program. The effect of Net Generation is
positively significant at the 0.01 level (p-value = 0.001). This indicates that city with
its own generation capacity is more likely to start a DSM program. This confirms our
21
hypotheses that the supply side constraints are the major driving forces underlying
the decision to develop energy-efficiency programs at the first place.
The sale characteristics of municipal-owned utilities present complicated results.
On the one hand, the coefficient of Resale Revenue was negatively significant
(p-value=0.08), consistent with our hypothesis. This means that the more revenue a
city can get from selling electricity to other utilities, the less likely it will spend on
energy efficiency. On the other hand, the variable Percent Residential Sales was not
statistically significant.
Table 3 here
The effects of city characteristics on the level of local energy-efficiency
expenditures are also noticeable. The coefficient of Form of Government is
positively significant (p-value = 0.008, consistent with our hypothesis. Cities with
mayor-council form of government invest more on energy efficiency, if the cities
have already started the demand-side management program. However, the
coefficient of the Fiscal Capacity failed to achieve significance.
Consistent with our hypothesis, the coefficient of Retail Partners is positively
significant (p-value=0.041), indicating that local energy-efficiency expenditure is
dependent on the presence of local private partners. The effects of citizen
characteristics are surprising. The coefficient of Percent Voting Democrat was
negatively significant, contrary to our hypothesis that cities with more Democratic
Party voters spend more on energy efficiency. To the contrary, the negative
coefficient means that cities with more citizens voting for Republican Party spend
more on energy-efficiency projects. A possible explanation for this relationship is
that energy efficiency might be a cast as different from other green policy issues and
thus support does not follow traditional ideological differences. Given that

22
conservative ideology promotes savings for government and individuals, energy
efficiency could be a policy option that attracts more conservative supporters.
Several control variables also show significant results, with Household median
income and percentage black population having positively significant coefficients,
and Peak Energy Consumption Days having negatively significant coefficient.
Conclusions
Energy-efficiency is a policy option increasingly implemented as a
multi-purpose solution to the environmental and economic sustainability in the local
communities. For local government, owning a municipal utility provides special
opportunities as well as challenges in implementing energy-efficiency strategies. To
date, few studies attempted to understand the role of municipal-owned utilities in the
implementation of energy-efficiency in the community and why there are
pronounced differences in commitment to energy-efficiency across communities. We
provide some preliminary answers to these questions by examining the driving
forces for the adoption and implementation of energy-efficiency incentives in local
governments with municipal-owned utilities.
With data collected for 145 municipal-owned utilities in cities with population
over 25,000, we test these relationships with a Heckman Selection Model. We find
that whether a city has energy-efficiency programs is determined by the energy
supply factors, including siting difficulties of new energy infrastructure and whether
municipal-owned utilities have generation capacities. More stringent regulations
over land use regarding energy infrastructure might lead local communities to
demand-side options of energy efficiency. Municipal-owned utilities are also more
inclined to implement energy-efficiency programs if they own generation capacities.

23
We also find that the level of local energy-efficiency expenditure is associated with
the resale revenues, the form of government in the city and the availability of local
retail partners. These findings reveal an important connection between utility
decisions and the larger community for which it is serving. The commitment to
energy-efficiency in the municipal-owned utilities is affected by local politics as well
as economics. A city’s political structure can shape the decisions of the public
utilities, and public-private partnership is very important for some municipal-owned
utilities to successfully implement its energy-efficiency strategies.

24
References Ansolabehere, S., Konisky, D. M., 2009. Public attitudes toward construction of new power plants. Public Opinion Quarterly 73 (3), 566-577. Auffhammer, M., Blumstein, C., Fowlie, M., 2008. Demand-side management and energy efficiency revisited. The Energy Journal 29 (3), 91-104. Bachrach, D., Carter, S., Jaffe, S., 2004. Do portfolio managers have an inherent conflict of interest with energy efficiency? The Electricity Journal 17, 52-62. Bassett, E., Shandas, V., 2010. Innovation and Climate Action Planning. Journal of the American Planning Association 76 (4), 435-450. Berke, P.R., Roenigk, D. J., Kaiser, E. J., Burby, R., 1996. Enhancing plan quality: evaluating the role of state planning mandates for natural hazard mitigation. Journal of Environmental Planning and Management 39, 79-96. Betsill, M., 2001. Mitigating climate change in U.S. cities: opportunities and obstacles. Local Environment 4, 393-406. Brennan, T. J., 2010. Optimal energy efficiency policies and regulatory demand-side management tests: How well do they match? Energy Policy 38 (8), 3874-3885. Brody, S.D., Godschalk, D.R., Burby, R.J., 2003. Mandating citizen participation in plan making: six strategic planning choices. Journal of the American Planning Association 69, 245-264. Brody, S. D., Zahran, S., Himanshu, G., Vedlitz, A., 2008. A spatial analysis of local climate change policy in the United States: Risk, stress, and opportunity. Landscape and Urban Planning 87, 33-41. Byrne,J., Hughes, K., Rickerson, W., Kurdgelashvili, L., 2007. American policy conflict in the greenhouse: Divergent trends in federal, regional, state, and local green energy and climate change policy. Energy Policy 35(9), 4555-4573. Casper, B.M., Wellstone, P.D., 1981. Powerline: The First Battle of America’s Energy War. The University of Massachusetts Press, Amherst. EIA, 2011. EIA Energy Glossary Accessed on May 27, 2011, Washington, DC <http://www.eia.doe.gov/glossary/>. Engel, K. H., Orbach, B. Y., 2008. Micro-motives and state and local climate change initiatives. Harvard Law & Policy Review 2,119-137. Eto, J., Stoft, S., Kito, S., 1998. DSM shareholder incentives: recent designs and economic theory. Utilities Policy 7, 47-62. Francis, Nathan., Feiock, R.C., 2010. A Guide for Local Government Executives on Energy Efficiency and Sustainability. IBM Center for The Business of Government. Garg, A., Maheshwari, J., Mahapatra, D., Kumar, S., 2011. Economic and environmental implications of demand-side management options. Energy Policy 39 (6), 3076-3085. Halvorsen, J.V., 1999. Understanding NIMBY: a study of protests against gas pipeline projects. Public Utilities Fortnightly 137 (16), 70-73. Hill, L. J., Brown, M. A., 1995. Issues in assessing the costeffectiveness of coordinated DSM programs. Utilities Policy 5 (1), 47-53.
25
Hirst, E., Cavanagh, R. Miller, P., 1996. The future of DSM in a restructured US electricity industry. Energy Policy 24 (4), 303-315. Hobbs, B.F., 1991. The most value’ test: Economic evaluation of electricity demand-side management considering customer value. Energy, The International Journal 12 (2), 67-91. ICLEI, 2011. ICLEI Climate Program. http://www.iclei.org/index.php?id=800. Retrieved June, 1, 2011. Joskow, P., Marron, D., 1992. What does a negawatt really cost? Evidence from utility conservation programs. Energy Journal 13, 41-74. Kettl, D. F., 1993. Sharing Power: Public Governance and Private Markets. Arcadia Publicshing, Charlston, SC. Kousky, C., Schneider, S. H., 2003. Global climate policy: will cities lead the way? Climate Policy 3, 359-372. Krause, K. M., 2011. Policy innovation, intergovernmental relations, and the adoption of climate protection initiatives by U.S. cities. Journal of Urban Affairs 33(1), 45-60. Kwoka, J. E., 1996. Power Structure: Ownership, Integration, and Competition in the U.S. Electricity Industry. Springer, Norwell, MA. Lindseth, G., 2004. The cities for Climate Protection Campaign (CCPC) and the framing of local climate policy. Local Environment 9 (4), 325-336. Loftis, R. L., 2010. Environmental group drops opposition to new coal power plant in West Texas. The Dallas Morning. http://www.dallasnews.com/business/headlines/20100419-Environmental-group-drops-opposition-to-new-8242.ece Retrieved June 1, 2011. Loughran, D.S., Kulick, J., 2004. Demand-side management and energy efficiency in the United States. Energy Journal 25, 19-43. Lubell, M., Feiock, R. C., de la Cruz, E. E. R., 2009. Local institutions and the politics of urban growth. American Journal of Political Science 53 (3), 649-665. Michigan Business, 2008. http://blog.mlive.com/tricities/2008/04/new_coalfired_power _plants_opp.html. Retrieved June 1, 2011. Nadel, S., Geller, H., 1996. Utility DSM: what have we learned? Where are we going? Energy Policy 24, 289-302. Scott, D., Willits, F.K., 1994. Environmental attitudes and behavior. Environment and Behavior 26 (2), 239-261. Sharp, E. B., Daley, D. M., Lynch, M. S., 2011. Understanding local adoption and implementation of climate change mitigation policy. Urban Affairs Review 47, 433-457. Strbac, G., 2008. Demand side management: Benefits and challenges. Energy Policy 36 (12), 4419-4426. Tang, Z., Brody, S.D., 2009. Link planning theories with factors influencing local environmental plan quality. Environmental and Planning B: Planning and Design 36, 522-537. Tang, Z., Bright, E., Brody, S.D., 2009. Evaluating California local land use plans’ environmental impact reports. Environmental Impact Assessment Review 29, 96-106.

26
Tang, Z., Brody, S.D., Quinn, C., Chang, L., Wei, T., 2010. Moving from agenda to action: evaluating local climate change action plans. Journal of Environmental Planning and Management 53 (1), 41-62. Vajjhala,S. P., Fischbeck, P. S., 2007. Quantifying siting difficulty: A case study of US transmission line siting. Energy Policy 35, 650-671. Van Liere, K.D., Dunlap, R.E., 1981. Environmental concern–does it make a difference how it’s measured? Environmental Behavior 13, 651-676. Wilson, E. J., Plummer, J., Fischlein, M., Smith, T. M., 2008. Implementing energy efficiency: Challenges and opportunities for rural electric co-operatives and small municipal utilities. Energy Policy 36 (9), 3383-3397. Wirl, F., 2000. Lessons from utility conservation programs. Energy Journal 21, 87-108. Zahran, S., Himanshu, G., Brody, S. D., Vedlitz, A., 2008. Risk, stress, and capacity: explaining metropolitan commitment to climate protection. Urban Affairs Review 43 (4), 447-474.
27
Table 1: Summary of Variables and Predicted Relationships
Variable Explanation Predicted Signs Source
Dependent Variable Energy Efficiency Expenditure (Outcome Unit: Thousand Dollars N/A EIA, 2008
DSM(Selection equation) Dummy, 1: with energy-efficiency
programs; N/A EIA, 2008
Independent Variables
Outcome Equation
Resale Revenue Unit: Thousand Dollars - EIA, 2008
Percent Residential Sales Unit: Percentage of Residential Sale of Electricity in the Total Sale - EIA, 2008
Form of Government Dummy, 1:Mayor Council; 0: Council Manager + ICMA, 1991,
1996, 2001, 2006Fiscal Capacity
Unit: Thousand Dollars Per Capita + Census, 2000
Local Retail Partners Dummy: 1: with no less than 1 local retail partners; 0: with no local retail partners + Energy Star, 2011
Environmental Non-Profits Counts + NCCS, 2007
Percent Voting Democrat Unit: Percentage of county population voted for Democratic Party in 2004 + State and County
Databook, 2007 Percent White Unit: Percentage of White Population in a
city N/A Census, 2000
Percent Black Unit: Percentage of Black Population in a city N/A Census, 2000
Household Median Income Unit: Thousand Dollars N/A Census, 2000
Peak Energy Consumption Days
Unit: Number of Days that Require Heating and Cooling in a city N/A Census, 2000
Selection Equation
Siting Difficulty An Index Score Measuring the Difficulties in Siting Energy Facitilies + Vajjhala &
Fischbeck, 2007 Net Generation Unit: Megawatts + EIA, 2008
28
Table 2 Descriptive Statistics
Variable Obs. Mean SD Min Max Energy Efficiency Expenditure 145 216.124 905.074 0 9400 Resale Revenue 145 14183.2 39903.5 0 207259 Percent Residential Sales 145 0.394 0.107 0.086 0.637 Form of Government 145 0.372 0.485 0 1 Fiscal Capacity 145 -0.009 0.227 -0.815 0.705 Local Retail Partners 145 0.772 0.421 0 1 Environmental Non-Profits 145 41.724 85.545 1 457 Percent Voting Democrat 145 44.441 12.459 11.6 75.2 Percent White 145 0.743 0.168 0.162 0.958 Percent Black 145 0.143 0.169 0.001 0.780 Household Median Income 145 38205.28 10877.07 21180 90377 Peak Energy Consumption Days 145 5490.448 1420.688 2434 10106 Siting Difficulty 145 6.649 0.709 5.69 8.08 Net Generation 145 0.524 0.501 0 1
29
Table 3 Heckman Selection Model of Local Energy Efficiency Expenditures Coefficient Standard Errors Outcome Equation Resale Revenue -0.009* (0.005) Percent Residential Sales 667.07 (3062.72)
Form of Government 1634.65*** (616.65) Fiscal Capacity -568.95 (1144.63) Local Retail Partners 1650.10** (809.45) Environmental Non-Profits -0.01 (2.96) Percent Voting Democrat -77.23** (30.54) Percent Black 7056.99* (3833.34)
Percent White 589.56 (4586.53) Household Median Income 0.05* (0.03) Peak Energy Consumption Days -0.75** (0.35) Constant 3049.72 (4342.65) Selection Equation Siting Difficulty 0.37** (0.18) Net Generation 0.93*** (0.28) Constant -3.89*** (1.18) Rho 0.05 (0.56) Sigma 1253.91*** (163.89) Lambda 66.23 (707.40) LR test of Independent Equations χ2(1 d.f.) = 0.01 - Wald Test of Model Fit χ2(11 d.f.) = 28.50*** - Observations Censored = 115
Uncensored = 30 * p < 0.10; ** p < 0.05; *** p < 0.01 (two-tailed)