
In vivo mapping of functional domains and axonal connectivity in cat visual cortex using magnetic...
10
In vivo mapping of functional domains and axonal connectivity in cat visual cortex using magnetic resonance imaging Dae-Shik Kim a, *, Mina Kim a , Itamar Ronen a , Elia Formisano b , Keun-Ho Kim a , Kamil Ugurbil a , Susumu Mori c , Rainer Goebel b a Center for Magnetic Resonance Research, Radiology, University of Minnesota Medical School, Minneapolis, MN, USA b University of Maastricht, Maastricht, The Netherlands c Department of Radiology, Johns-Hopkins School of Medicine, Baltimore, MD, USA Received 15 August 2003; received in revised form 22 August 2003; accepted 23 August 2003 Abstract Noninvasive cognitive neuroimaging studies based on functional magnetic resonance imaging (fMRI) are of ever-increasing importance for basic and clinical neurosciences. The explanatory power of fMRI could be greatly expanded, however, if the pattern of the neuronal circuitry underlying functional activation could be made visible in an equally noninvasive manner. In this study, blood oxygenation level-dependent (BOLD)-based fMRI and diffusion tensor imaging (DTI) were performed in the same cat visual cortex, and the foci of fMRI activation utilized as seeding points for 3D DTI fiber reconstruction algorithms, thus providing the map of the axonal circuitry underlying visual information processing. The methods developed in this study will lay the foundation for in vivo neuroanatomy and the ability for noninvasive longitudinal studies of brain development. © 2003 Elsevier Inc. All rights reserved. Keywords: fMRI; DTI; Visual cortex 1. Introduction Since its introduction in 1992 [1-3], the blood oxygen- ation level-dependent (BOLD) functional magnetic reso- nance imaging (fMRI) has revolutionized cognitive neuro- sciences by allowing the foci of cortical “activity” to be visualized in vivo in a noninvasive manner. The BOLD contrast originates from the intravoxel magnetic field inho- mogeneity induced by paramagnetic deoxyhemoglobin (deoxyHb) sequestered in red blood cells that are compart- mentalized within blood vessels. The magnetic susceptibil- ity differences between the deoxyHb-containing compart- ments and the surrounding space generate magnetic field gradients around the boundaries of these compartments. Therefore, perturbation of regional deoxyHb content alters the signal intensities in MR images sensitized to BOLD contrast. Such regional perturbation occurs as the result of enhanced neuronal activity and metabolism during sensory [4], motor [5], or cognitive [6] functions. While functional neuroimaging based on BOLD contrast provides detailed information about the “where” of the brain’s functional architecture noninvasively, such localiza- tion information alone, however, must leave pivotal ques- tions about the brain’s information processing (the “how” of the processing) unanswered, as long as the underlying pat- tern of neuronal connectivity cannot be mapped in an equally noninvasive manner. The explanatory power of the current functional MRI studies could be greatly expanded, therefore, if the same MRI framework could be utilized to assess the pattern of neuronal connectivity in vivo. The newly developed magnetic resonance imaging technique known as diffusion-tensor-imaging (DTI) based on diffu- sion weighted imaging (DWI) has the potential to serve as such a method. DWI MRI is one of the most widely used MRI methods for investigating the microscopic structure of water-contain- ing material in general, and living tissue in particular [7]. As suggested by Stjeskal and Tanner [8], the MR image is sensitized to diffusion in a given direction using a couple of temporally separated magnetic field gradients in the desired * Corresponding author. Current address: Department of Anatomy and Neurobiology, Boston University School of Medicine, Boston, MA, USA. Tel.: 1-617-638-4200; fax: 1-617-638-4216. E-mail address: [email protected] (D.-S. Kim). Magnetic Resonance Imaging 21 (2003) 1131–1140 0730-725X/03/$ – see front matter © 2003 Elsevier Inc. All rights reserved. doi:10.1016/j.mri.2003.08.014
-
Upload
kimkuypers -
Category
Documents
-
view
6 -
download
0
Transcript of In vivo mapping of functional domains and axonal connectivity in cat visual cortex using magnetic...
In vivo mapping of functional domains and axonal connectivity in catvisual cortex using magnetic resonance imaging
Dae-Shik Kima,*, Mina Kima, Itamar Ronena, Elia Formisanob, Keun-Ho Kima,Kamil Ugurbila, Susumu Moric, Rainer Goebelb
aCenter for Magnetic Resonance Research, Radiology, University of Minnesota Medical School, Minneapolis, MN, USAbUniversity of Maastricht, Maastricht, The Netherlands
cDepartment of Radiology, Johns-Hopkins School of Medicine, Baltimore, MD, USA
Received 15 August 2003; received in revised form 22 August 2003; accepted 23 August 2003
Abstract
Noninvasive cognitive neuroimaging studies based on functional magnetic resonance imaging (fMRI) are of ever-increasing importancefor basic and clinical neurosciences. The explanatory power of fMRI could be greatly expanded, however, if the pattern of the neuronalcircuitry underlying functional activation could be made visible in an equally noninvasive manner. In this study, blood oxygenationlevel-dependent (BOLD)-based fMRI and diffusion tensor imaging (DTI) were performed in the same cat visual cortex, and the foci of fMRIactivation utilized as seeding points for 3D DTI fiber reconstruction algorithms, thus providing the map of the axonal circuitry underlyingvisual information processing. The methods developed in this study will lay the foundation for in vivo neuroanatomy and the ability fornoninvasive longitudinal studies of brain development. © 2003 Elsevier Inc. All rights reserved.
Keywords: fMRI; DTI; Visual cortex
1. Introduction
Since its introduction in 1992 [1-3], the blood oxygen-ation level-dependent (BOLD) functional magnetic reso-nance imaging (fMRI) has revolutionized cognitive neuro-sciences by allowing the foci of cortical “activity” to bevisualized in vivo in a noninvasive manner. The BOLDcontrast originates from the intravoxel magnetic field inho-mogeneity induced by paramagnetic deoxyhemoglobin(deoxyHb) sequestered in red blood cells that are compart-mentalized within blood vessels. The magnetic susceptibil-ity differences between the deoxyHb-containing compart-ments and the surrounding space generate magnetic fieldgradients around the boundaries of these compartments.Therefore, perturbation of regional deoxyHb content altersthe signal intensities in MR images sensitized to BOLDcontrast. Such regional perturbation occurs as the result of
enhanced neuronal activity and metabolism during sensory[4], motor [5], or cognitive [6] functions.
While functional neuroimaging based on BOLD contrastprovides detailed information about the “where” of thebrain’s functional architecture noninvasively, such localiza-tion information alone, however, must leave pivotal ques-tions about the brain’s information processing (the “how” ofthe processing) unanswered, as long as the underlying pat-tern of neuronal connectivity cannot be mapped in anequally noninvasive manner. The explanatory power of thecurrent functional MRI studies could be greatly expanded,therefore, if the same MRI framework could be utilized toassess the pattern of neuronal connectivity in vivo. Thenewly developed magnetic resonance imaging techniqueknown as diffusion-tensor-imaging (DTI) based on diffu-sion weighted imaging (DWI) has the potential to serve assuch a method.
DWI MRI is one of the most widely used MRI methodsfor investigating the microscopic structure of water-contain-ing material in general, and living tissue in particular [7]. Assuggested by Stjeskal and Tanner [8], the MR image issensitized to diffusion in a given direction using a couple oftemporally separated magnetic field gradients in the desired
* Corresponding author. Current address: Department of Anatomy andNeurobiology, Boston University School of Medicine, Boston, MA, USA.Tel.: �1-617-638-4200; fax: �1-617-638-4216.
E-mail address: [email protected] (D.-S. Kim).
Magnetic Resonance Imaging 21 (2003) 1131–1140
0730-725X/03/$ – see front matter © 2003 Elsevier Inc. All rights reserved.doi:10.1016/j.mri.2003.08.014
direction. The first gradient labels the spin phase of thewater molecule protons along the gradient direction, whilethe second gradient rephrases the spin phase. If no diffusionhas occurred during the time period between the two gra-dients, the initial phase is fully restored, while the initialphase is not fully recovered if water molecule displacementhas taken place. In such a case, the resulting image intensityis attenuated. The amount of image attenuation, or “diffu-sion weighting,” is given by the relation S(b) � S0
exp(�biDi) where S is the signal intensity and S0 is thesignal intensity without diffusion weighting. Di is the dif-fusion coefficient of water in the direction on which of themagnetic field gradient was applied, and b is given by: b ��2 g2 �2(� � �/3) in a spin-echo experiment, where g is thegradient strength, � is the gyromagnetic ratio of protons, �is the gradient duration time, and � is the gradient separa-tion time.
Because the parameters g, �, �, and � are all known,from the amount of signal decrease (S/S0), diffusion con-stants at each voxel can be derived. Such measurementshave revealed that diffusion of brain water has strong di-rectionality (anisotropy), which is attributed to the existenceof natural boundaries, such as axons and/or myelination.The properties of such water diffusion can be expressed asan ellipsoid [9]. Such “diffusion ellipsoids” can be charac-terized by six parameters: diffusion constants along thelongest, middle, and shortest axes (�1, �2, and �3, calledprincipal axes); and the direction of the three principal axes.Once the diffusion ellipsoid is fully characterized at eachpixel of the brain images, local fiber structure can be de-rived. For example, if �1 �� �2 � �3 (diffusion is aniso-tropic), it suggests the existence of dense and aligned fiberswithin each pixel, whereas isotropic diffusion (�1 � �2 ��3) suggests sparse or unaligned fibers.
If one assumes that the orientation of the axis associ-ated with �1 is co-linear with the direction of the axonalfibers dominant within the imaging voxel, then DTI canreconstruct the presumed fiber trajectories from a discreteset of diffusion tensors [9,10]. Mori et al. [11] developedone of the earliest and most commonly employed algo-rithms for DTI-based 3D fiber tracking (called FACT).This scheme is based on extrapolation of continuousvector lines from discrete DTI data. The reconstructedfiber direction within each voxel is parallel to the diffu-sion tensor eigenvector associated with the greatest eig-envalue (�1). Within each voxel the fiber tract is a linesegment defined by the input position, the direction of theeigenvector, and an output position at the boundary withthe next voxel. The track is propagated from voxel to voxel.Tracking is terminated when a sharp turn in the fiber ori-entation occurs. In algorithms developed by Basser et al.[10], Conturo et al. [12], and Pajevic [13] a continuousrepresentation of the diffusion tensor and principal eigen-vector are interpolated from the discrete voxel data. Thefiber track direction at any location along the track is givenby the continuous eigenvector. Typically, the tracking al-
gorithm stops when the fiber radius of curvature or theanisotropy factor falls below a threshold.
In the past few years, numerous other DTI fiber recon-struction algorithms have been proposed that reveal spec-tacular images of axonal connectivity patterns in vivo inhumans [10,12,14], rodents [9,15], and cats [16]. The dif-ferences in detailed fiber reconstruction algorithms notwith-standing, all DTI-based fiber reconstructions are faced witha fundamental and peculiar problem: unlike conventionalneurotracing techniques (e.g., using DiI, HRP, biocytin etc.;see Discussion), each DTI experiment has the potential toprovide the complete set of connectivity across all imagedvoxels. Consequently, if the fiber reconstructions are notlimited to particular regions of interest (ROI), the resultingpattern of fiber connections would be rendered useless. Akey in making DTI an outstanding technique for cognitiveneurosciences is therefore to develop selection criteria todetermine the seeding region of interest (ROI) for DTI fibertracing. To this end, in the majority of fiber-tracking algo-rithms, tracking starts at a user-defined seeding point orregion of interest. Such “seeding points” are selected eitherbased on the quality of the underlying DWI, or based on apriori anatomic criteria that are known from postmortemstudies. Such anatomically motivated tracking strategies areof greatest importance for testing for anatomic irregularitiesin vivo. However, in normal subjects, strictly anatomicallydefined DTI fiber reconstructions have the tendency to sim-ply “rediscover” what has been known from conventionalanatomic and histologic techniques, thus resulting in par-tially tautological statements.
An alternative way of DTI fiber reconstruction is to usethe foci of functional activity—such as obtained withBOLD contrast—as the “initial” and “termination” ROIs.This is a more natural choice for most questions in cognitiveneurosciences, as the main interest here is to elucidate thepattern of neuronal circuitry underlying the observed func-tional activation for a particular task.
In this study, BOLD-based fMRI and DTI were per-formed in the same cat visual cortex at 9.4 Tesla magneticfields, and the foci of fMRI activation utilized as seedingpoints for 3D DTI fiber reconstruction algorithms, thusproviding the map of the axonal circuitry underlying visualinformation processing. The methods developed in thisstudy will lay foundation for in vivo neuroanatomy and theability for non-invasive longitudinal studies of brain devel-opment.
2. Materials and methods
2.1. Animal preparation
Juvenile cats were treated with atropine sulfate (0.05mg/kg, subcutaneous (s.c.)) and initially anesthetized with aketamine/xylazine cocktail (10-25 mg/kg ketamine hydro-chloride; 2.5 mg/kg xylazine hydrochloride; both intramus-
1132 D.-S. Kim et al. / Magnetic Resonance Imaging 21 (2003) 1131–1140
cular). A venous catheter was placed in one of the forearmveins (V. cephalica antebrachii), a urinary catheter wasplaced, and a tracheal tube was inserted for artificial venti-lation. Expiratory CO2 content was monitored continuouslyby a capnometer (Datex Ohmeda) and kept at about 3.5% byvarying ventilation volume and frequency. Gaseous anes-thesia (isoflurane (0.6-1.5%) in a mixture of 70% nitrousoxide and 30% oxygen) was induced and maintainedthrough the scan. The eyes were refracted, and correctivecontact lenses placed if necessary. Animals were paralyzedwith pancronium bromide (dose 0.1 mg/kg i.v. every 30min). The animal’s head position was fixed by a mouth-barand head-holder. A quadrature surface RF coil was placedabove area 18 (AP3 on Horsley-Clark coordinate) of the catvisual cortex. Visual stimuli were generated using the VSG(Cambridge Research Systems, UK), and displayed on arear-projection screen using a video projector (NEC; reso-
lution 1040 � 890). The rear-projection screen was posi-tioned 15 cm from the animal’s eyes, covering about 37° ofthe visual field. Stimuli were presented binocularly. Con-ventional retinotopic stimuli were employed.
2.2. MRI data acquisition methods
MR experiments were performed on a 9.4-T/31-cmhorizontal MRI scanner (Magnex, UK) equipped with aUnityINOVA console (Varian, CA), and a 30-G/cm activelyshielded gradient insert (ID � 11 cm) capable of 300-�srisetime (Magnex, UK). Magnetic field homogeneity wasoptimized using automatic shimming routines (FASTMAP).The MR parameters for T2*-based BOLD functional MRIwere: gradient-echo echo-planar imaging (GRE-EPI) withfield of view of 3.4 � 3.5 � 2.0 cm3 and 64 � 64 � 13 datamatrix; TE � 14 msec, image TR � 1.5 sec. For diffusion-
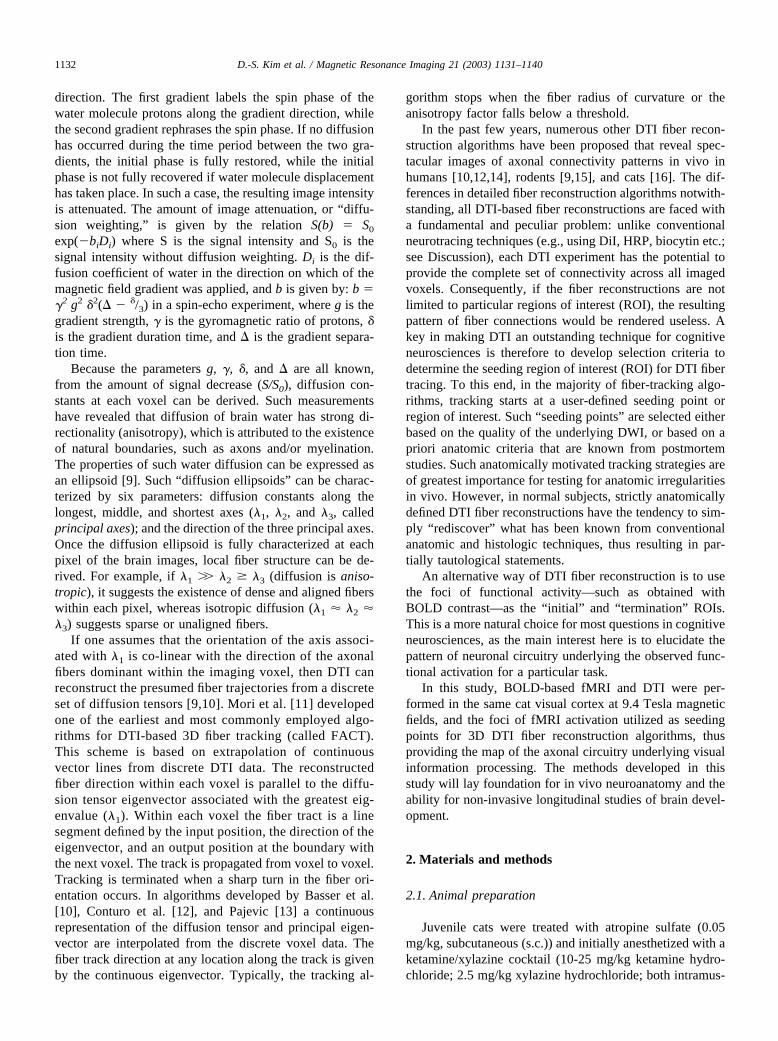
Fig. 1. High-resolution diffusion tensor imaging (DTI) in cat visual cortex. All images are from the same coronal slice around anterior-posterior 0 of the catcortex (i.e., primary visual cortex). a, the anisotrophy maps in which the FA were color-coded on a voxel-by-voxel basis (bright, high FA; dark, low FA).Note that the regions of the highest fractional anisotrophy are confined to areas of white matter consisting of large fiber bundles. b and c, vector and colorrepresentations of the local anisotrophy, respectively. In c, fibers running in medio-lateral direction are coded in blue, and fibers running in ventro-dorsaldirections are coded in green. Areas coded in red correspond to fibers that are running orthogonal to the imaging plane (i.e., they are running inanterior-posterior direction).
1133D.-S. Kim et al. / Magnetic Resonance Imaging 21 (2003) 1131–1140
weighted MRI, a 3D double spin-echo echo-planar imaging(SE-EPI) sequence with four segments was used. DW MRimages were acquired using the following parameters; g �17 gauss/cm, � � 0.006 s, � � 0.015 s (b � 1584 s/mm2 foreach direction). The field of view (FOV) was 5 � 5�3 cm3,the matrix size was 128 � 128 � 64. The gradient schemeused for the present study is given in the following table:
Here, Gx, Gy, Gz code for the applied gradient in readout,phase-encoding, and slice selection directions, respectively.The numbers “1,” “�1,” and “0” stand for the presence ofpositive, negative, and no gradients, respectively.
2.3. Diffusion tensor calculation
Diffusion tensor elements were calculated using the fol-lowing set of equations. Here, the letters X, Y, and Z inparentheses denote the directions along which the gradientswere applied, and the subscript of D denotes the respectiveelement of the diffusion tensor D� , S0 is the image withoutdiffusion weighting, and Sxyz are the diffusion-weightedimages where the gradients are applied along the directiondefined in the subscript:
�X,Y,0: �Dxx � Dyy � 2Dxy � �lnS110/S0
b
(1-1)
�X,�Y,0: �Dxx � Dyy � 2Dxy � �lnS1�10/S0
b
(1-2)
�X,0,Z: �Dxx � Dzz � 2Dxz � �lnS101/S0
b
(1-3)
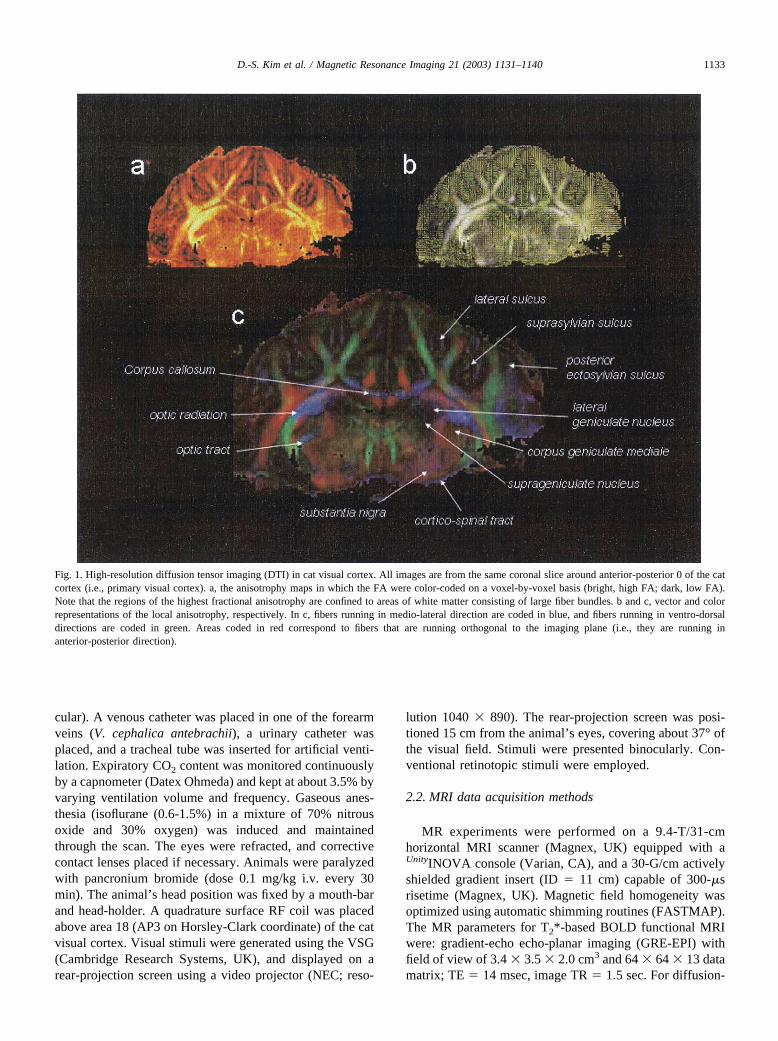
Fig. 2. Lower left, 3-D rendering of the cat cortex around the occipital pole. The gyri and sulci of are displayed in bright and dark blue colors, respectively.Upper left, resliced view of the same rendered cortex. Here, the corresponding FA map from the DTI experiment was projected onto a coronal slice. Theregions of largest FA are confined to the white matter areas consisting of large fiber bundles. Right, vector representation of anisotrophy from the same cortex.
Gx Gy Gz
1 1 01 0 10 1 1
�1 0 11 �1 00 1 �10 0 0
1134 D.-S. Kim et al. / Magnetic Resonance Imaging 21 (2003) 1131–1140
��X,0,Z: �Dxx � Dzz � 2Dxz � �lnS�101/S0
b
(1-4)
�0,Y,Z: �Dyy � Dzz � 2Dyz � �lnS011/S0
b
(1-5)
�0,Y,�Z: �Dyy � Dzz � 2Dyz � �lnS01�1/S0
b
(1-6)
From the equations (1-1)- (1-6), we can form a tensormatrix [20]:
D� � � Dxx Dxy Dxz
Dxy Dyy Dyz
Dxz Dyz Dzz
� (2)
Since the tensor matrix D� is symmetric along the diag-onal, the eigenvalues and eigenvectors can be obtained by
diagonalizing the matrix using the Jacobi transformation.
The resulting eigenvalues � � � �1 0 00 �2 00 0 �3
� and cor-
responding eigenvectors P� � �p1� p2� p3� � can then be used todescribe the directionality of water diffusion within a givenvoxel. There are several different methods for how this canbe achieved. For the present study, the directionality ofwater diffusion was estimated by computing the fractionalanisotropy (FA) on a voxel-by-voxel basis [17].
FA �1
�2
���1 � �22 � ��2 � �3
2 � ��3 � �12
�12 � �2
2 � �32
(3)
The fractional anisotropy (FA) is a measure of the direc-tionality of the water diffusion within a given voxel.
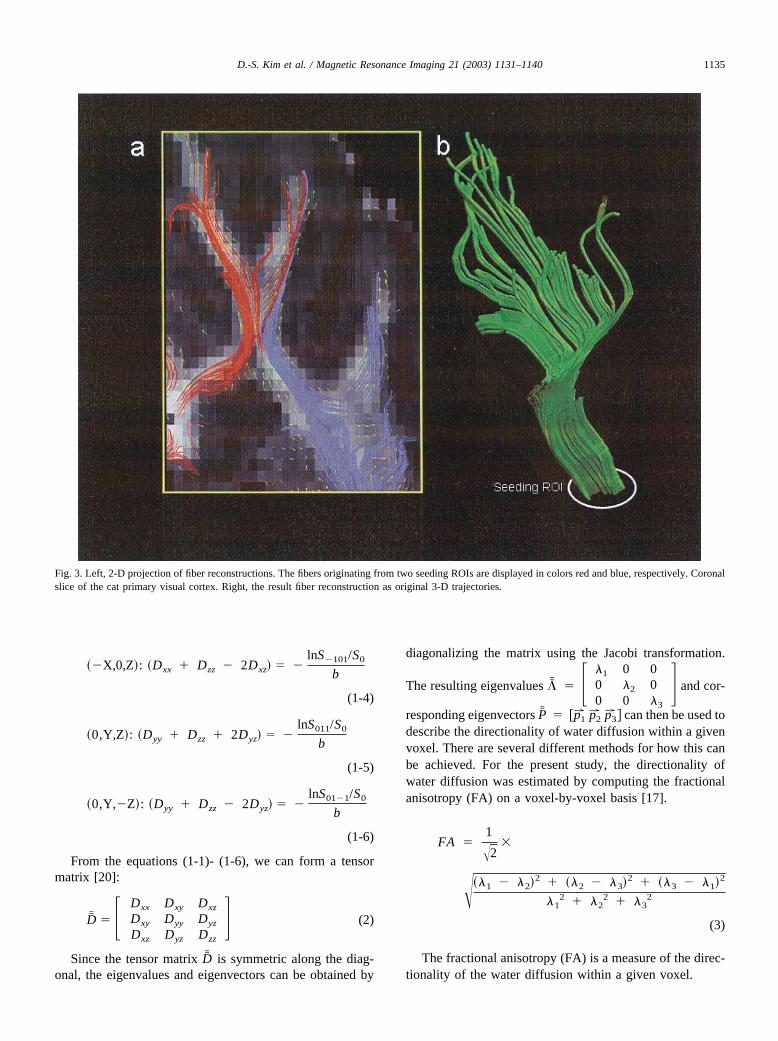
Fig. 3. Left, 2-D projection of fiber reconstructions. The fibers originating from two seeding ROIs are displayed in colors red and blue, respectively. Coronalslice of the cat primary visual cortex. Right, the result fiber reconstruction as original 3-D trajectories.
1135D.-S. Kim et al. / Magnetic Resonance Imaging 21 (2003) 1131–1140
2.4. DTI fiber reconstruction
Based on the diffusion tensors, a fiber-tracking algorithmwas applied to the data using custom-written C�� or Mat-lab (Mathworks, MA) codes. The algorithm of choice wasone based on the Frenet equation, similar to Basser’s algo-rithm [10], additionally modified to include a criterion forthe vector field interpolation in order to remove noise andbackground effects (see [18] for details). The FA thresholdfor stopping the tracking procedure was set to 0.2. ROIs forseeding the tracking algorithm were chosen either manuallyor based on BOLD fMRI activation foci. In either case, theseeding ROIs were chosen close to the fiber termini, in orderto ensure that they included white matter areas.
2.5. Functional image construction
BrainVoyager (Brain Innovation, The Netherlands) wasused for functional image construction and projection intothe flattened anatomic cortical map. After preprocessing(mean intensity adjustment, interscan slice time-correction,
3D motion correction), functional time-series were co-reg-istered to 3D anatomic images. 3D anatomic images wereused for cortical surface reconstruction, inflation, and flat-tening [19]. Overall, conventional methods of statisticalparametric mapping (cross-correlation, GLM etc.) wereused for functional image construction. Subsequently, cus-tom-written C2� and MATLAB routine were used to co-register DTI fiber reconstructions with either fMRI raw dataor with inflated/flatted anatomic images. To this end, theareas of high BOLD activity (cross-correlation thresholdabove 0.1; cluster size, 4 voxels) were imported in DWIdata as binary masks on which the fiber reconstructionseeding points were then placed.
3. Results
Fig. 1 displays the results of high-resolution DTI studiesin cat visual cortex obtained at 9.4 Tesla magnetic fields. Allimages are from the same coronal slice around anterior-posterior 0 of the cat cortex (i.e., primary visual cortex).
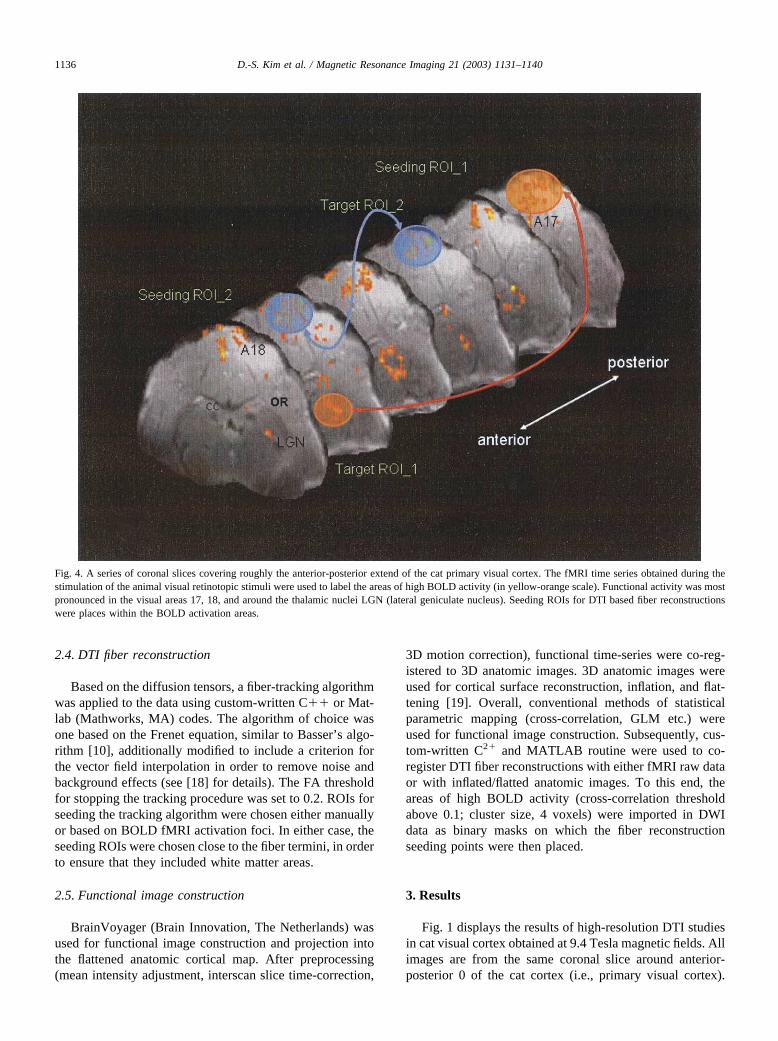
Fig. 4. A series of coronal slices covering roughly the anterior-posterior extend of the cat primary visual cortex. The fMRI time series obtained during thestimulation of the animal visual retinotopic stimuli were used to label the areas of high BOLD activity (in yellow-orange scale). Functional activity was mostpronounced in the visual areas 17, 18, and around the thalamic nuclei LGN (lateral geniculate nucleus). Seeding ROIs for DTI based fiber reconstructionswere places within the BOLD activation areas.
1136 D.-S. Kim et al. / Magnetic Resonance Imaging 21 (2003) 1131–1140
Panel a depicts the anisotrophy maps in which the FA werecolor-coded on a voxel-by-voxel basis (bright, high FA;dark, low FA). Note that the regions of the highest fractionalanisotropy are confined to areas of white matter consistingof large fiber bundles. The diagonalized tensor informationP� can be represented as a vector. Fig. 1b displays such avector field map from the cat primary visual cortex. In Fig.1c, the anatomic details of the cat cortex can be identified inthis color-coded map of anisotropy. Here, fibers running inmedio-lateral direction are coded in blue, and fibers runningin ventro-dorsal directions are coded in green. Areas codedin red correspond to fibers that are running orthogonal to theimaging plane (i.e., they are running in anterior-posteriordirection). Note that the areas of large fiber bundles (e.g.,running ventro-dorsally into the gray matter) are character-ized by bright colors (i.e., high FA) while this is not the casefor voxels located within cortical gray matter and/or aroundthe thalamic nuclei.
Fig. 2 shows the strategies employed for the DTI fiberreconstruction. The left panel of Fig. 2 depicts the 3Drendering of the cat cortex around the occipital pole. Here,the gyri and sulci of the are displayed in bright and dark
blue colors, respectively. The primary visual areas 17 and18 of the cat cortex can be identified through their vicinityto the lateral and suprasylvian sulci. The upper left panel ofFig. 2 also shows the resliced view of the same renderedcortex. Here, the corresponding FA map from the DTIexperiment (performed during the same MRI study) is—after thresholding—projected onto a coronal slice. The re-gions of largest FA are confined to the white matter areasconsisting of large fiber bundles. The right panel of Fig. 2shows the vector representation from the same cortex.
For fiber reconstructions, the individual vectors (as dis-played in the right panel of Fig. 2) were, starting from aseeding point, concatenated to yield a continuous progressline as described in the method section above. Fig. 3adisplays the results of two of such fiber reconstructions.Here, the fibers originating from two seeding ROIs aredisplayed in colors red and blue, respectively. The fibertrajectories were originally reconstructed in the full 3-Dspace of the cortex frame. For the display in panel a of Fig.3, the 3-D fibers were projected onto the 2-D plane of thedisplayed coronal slice. Fig.3b shows the 3-D trajectory forone of the two fiber bundles depicted in Fig. 3a.
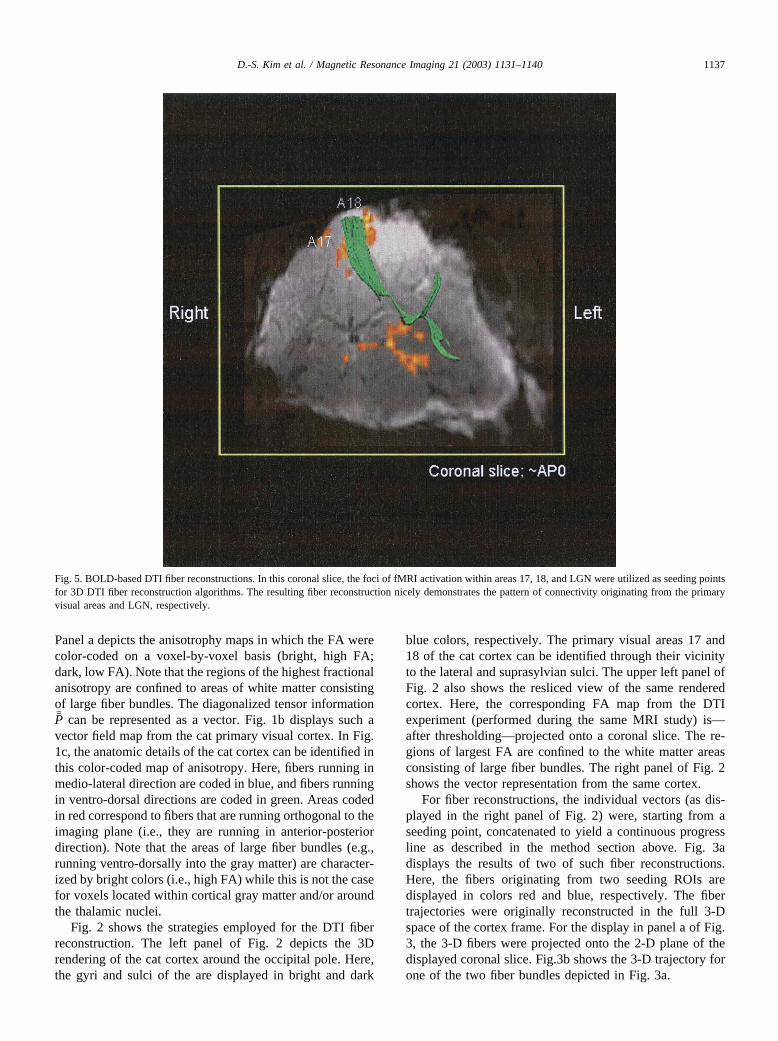
Fig. 5. BOLD-based DTI fiber reconstructions. In this coronal slice, the foci of fMRI activation within areas 17, 18, and LGN were utilized as seeding pointsfor 3D DTI fiber reconstruction algorithms. The resulting fiber reconstruction nicely demonstrates the pattern of connectivity originating from the primaryvisual areas and LGN, respectively.
1137D.-S. Kim et al. / Magnetic Resonance Imaging 21 (2003) 1131–1140
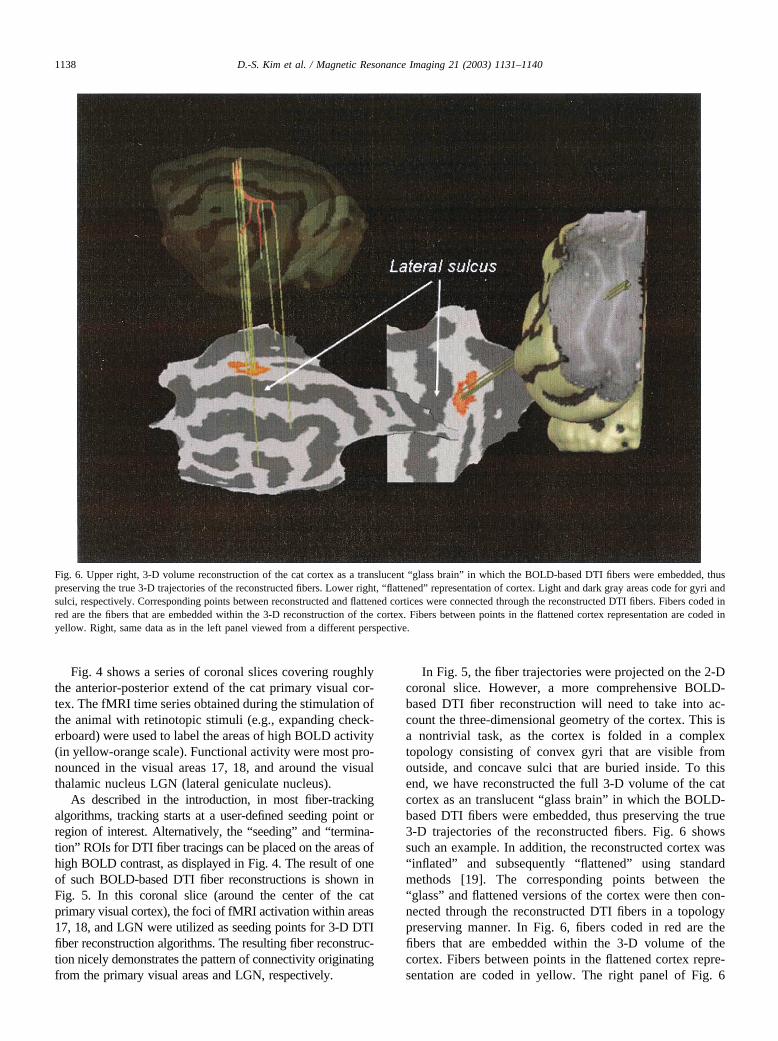
Fig. 4 shows a series of coronal slices covering roughlythe anterior-posterior extend of the cat primary visual cor-tex. The fMRI time series obtained during the stimulation ofthe animal with retinotopic stimuli (e.g., expanding check-erboard) were used to label the areas of high BOLD activity(in yellow-orange scale). Functional activity were most pro-nounced in the visual areas 17, 18, and around the visualthalamic nucleus LGN (lateral geniculate nucleus).
As described in the introduction, in most fiber-trackingalgorithms, tracking starts at a user-defined seeding point orregion of interest. Alternatively, the “seeding” and “termina-tion” ROIs for DTI fiber tracings can be placed on the areas ofhigh BOLD contrast, as displayed in Fig. 4. The result of oneof such BOLD-based DTI fiber reconstructions is shown inFig. 5. In this coronal slice (around the center of the catprimary visual cortex), the foci of fMRI activation within areas17, 18, and LGN were utilized as seeding points for 3-D DTIfiber reconstruction algorithms. The resulting fiber reconstruc-tion nicely demonstrates the pattern of connectivity originatingfrom the primary visual areas and LGN, respectively.
In Fig. 5, the fiber trajectories were projected on the 2-Dcoronal slice. However, a more comprehensive BOLD-based DTI fiber reconstruction will need to take into ac-count the three-dimensional geometry of the cortex. This isa nontrivial task, as the cortex is folded in a complextopology consisting of convex gyri that are visible fromoutside, and concave sulci that are buried inside. To thisend, we have reconstructed the full 3-D volume of the catcortex as an translucent “glass brain” in which the BOLD-based DTI fibers were embedded, thus preserving the true3-D trajectories of the reconstructed fibers. Fig. 6 showssuch an example. In addition, the reconstructed cortex was“inflated” and subsequently “flattened” using standardmethods [19]. The corresponding points between the“glass” and flattened versions of the cortex were then con-nected through the reconstructed DTI fibers in a topologypreserving manner. In Fig. 6, fibers coded in red are thefibers that are embedded within the 3-D volume of thecortex. Fibers between points in the flattened cortex repre-sentation are coded in yellow. The right panel of Fig. 6
Fig. 6. Upper right, 3-D volume reconstruction of the cat cortex as a translucent “glass brain” in which the BOLD-based DTI fibers were embedded, thuspreserving the true 3-D trajectories of the reconstructed fibers. Lower right, “flattened” representation of cortex. Light and dark gray areas code for gyri andsulci, respectively. Corresponding points between reconstructed and flattened cortices were connected through the reconstructed DTI fibers. Fibers coded inred are the fibers that are embedded within the 3-D reconstruction of the cortex. Fibers between points in the flattened cortex representation are coded inyellow. Right, same data as in the left panel viewed from a different perspective.
1138 D.-S. Kim et al. / Magnetic Resonance Imaging 21 (2003) 1131–1140
shows the same data from a different view angle “through”the reconstructed 3-D cortex.
4. Discussion
The results of our study suggest that high-resolutionBOLD MRI and DTI can be obtained from the same corticaltissue in vivo at 9.4 Tesla magnetic fields. Furthermore, inour study, the foci of fMRI activation were successfullyutilized as seeding points for 3-D DTI fiber reconstructionalgorithms, thus providing the map of the axonal circuitrybetween neuronal populations participating in a commoncortical information processing.
Traditionally, connectivities between individual neuronsor groups of neurons have been studied using a variety oftechniques. These include post mortem methods, such asdissection of white matter, strychnine neuronography [20],and the Nauta [21] methods of tracing degeneration afterlocalized lesions. More recently, implantation of carbocya-nine dyes, such as DiI and DiA [22], has replaced the olderdegeneration methods. However, besides the long durationneeded for passive labeling of axonal fibers (often severalmonths), post mortem methods inherently fail to yield acorrelation to the foci of functional activation. There areother modern in vivo labeling methods that can be used totrack patterns of neuronal connectivity, including trans-neuronal markers, such as horseradish peroxidase (HRP),rhodamine- and fluorescein-conjugated latex microspheres[23], biocytin [24], and biotinylated dextran amine (BDA).However, all current postmortem and in vivo tracing tech-niques suffer from common limitations: 1) an extremely lownumber of labeled tracts can be identified; 2) short tracingdistance (across 1-3 synapses); 3) the need for invasiveinjection of the tracer, and most importantly, 4) the need tosacrifice the animal before the labeling pattern can be visu-alized. Such limitations rule out the use of these methods forhuman and/or longitudinal studies.
An alternative method to label axonal connectivity invivo has been recently proposed [25]. In this method, man-ganese ion Mn2� is used as a MRI-sensitive in vivo fibertract tracer. However, while Mn2� acts as an excellent MRIcontrast agent through shortening of tissue T1 (“spin-latticerelaxation”), at the same time it is a potent calcium analog,and topical application leads to epileptic discharge of neu-ronal activity, contaminating the stimulus induced pattern ofcortical activity. Furthermore, Mn2� is paramagnetic. Assuch, the accumulation of Mn2� in cell somata, dendrites,and axons will attenuate and/or corrupt the quality of T2*-weighted images used for BOLD fMRI studies. These notonly prohibit the use of Mn2� for studying neural connec-tions in humans, but it also invalidates its use in animalsystems where simultaneous assessment of the functionalactivity (e.g., BOLD-based) is required.
The BOLD-based DTI fiber reconstruction method de-scribed in this study allows the local orientation of fiber
bundles in the white matter to be determined in an abso-lutely noninvasive manner, thus enabling in vivo neuroanat-omy in both animals and humans. If the full potential offMRI-based DTI for tracking fiber pathways noninvasivelyin human and animal brains can be realized, the impact onneuroscience will be substantial. Knowing which functionalareas are connected to which, and in what manner, canprovide vital constraints on high-level models of globalcortical organization. In short, the methods developed inthis study will lay foundation for in vivo neuroanatomy andthe ability for non-invasive longitudinal studies of braindevelopment.
Acknowledgments
The authors thank Drs. Mathieu Ducros and ChristophKayser for their helpful discussions. Supported by the Na-tional Institutes of Health (Grant PR08079), The KeckFoundation, and the Human Frontiers Science Program.
References
[1] Ogawa S, Tank DW, Menon R, Ellermann JM, Kim SG, Merkle H,Ugurbil K. Intrinsic signal changes accompanying sensory stimula-tion: functional brain mapping with magnetic resonance imaging.Proc Natl Acad Sci USA 1992;89:5951-5.
[2] Bandettini PA, Wong EC, Hinks RS, Tikofsky RS, Hyde JS. Timecourse EPI of human brain function during task activation. MagnReson Med 1992;25:390–7.
[3] Kwong KK, Belliveau JW, Chesler DA, et al. Dynamic magneticresonance imaging of human brain activity during primary sensorystimulation. Proc Natl Acad Sci USA 1992;89:5675–9.
[4] Engel SA, Rumelhart DE, Wandell BA, Lee AT, Glover GH, Chich-ilnisky EJ, Shadlen MN. fMRI of human visual cortex. Nature 1994;396:525.
[5] Kim SG, Ashe J, Georgopoulos AP, Merkle H, Ellermann JM, MenonRS, Ogawa S, Ugurbil K. Functional imaging of human motor cortexat high magnetic field. J Neurophysiol 1993;69:297–302.
[6] Wagner AD, Schacter DL, Rotte M, Koutstaal W, Maril A, Dale AM,Rosen BR, Buckner RL. Building memories: remembering and for-getting of verbal experiences as predicted by brain activity. Science1998;281:1188–91.
[7] Moseley ME, Cohen Y, Mintorovitch J, Kucharczyk J, Weinstein PR.Early detection of regional cerebral ischemia: comparison of diffu-sion- and T2-weighted MRI and spectroscopy. Magn Reson Med1990;14:330–6.
[8] Stejskal EO, Tanner JE. Restricted self-diffusion of protons in col-loidal systems by the pulse-gradient, spin-echo method. J Chem Phys1968;49:1768–77.
[9] Mori S, Barker PB. Diffusion magnetic resonance imaging: its prin-ciple and applications. Anat Rec 1999;257:102–9.
[10] Basser PJ, Pajevic S, Pierpaoli C, Duda J, A. Aldroubi A. In vivo fibertractography using DT-MRI data. Magn Reson Med 2000:44;625-32.
[11] Mori S, Crain BJ, Chacko VP, van Zijl PC. Three-dimensional track-ing of axonal projections in the brain by magnetic resonance imaging.Ann Neurol 1999;45:265–9.
[12] Conturo TE, Lori NF, Cull TS, Akbudak E, Snyder AZ, Shimony JS,McKinstry RC, Burton H, Raichle ME. Tracking neuronal fiber path-ways in the living human brain. Proc Natl Acad Sci USA 1999;96:10422–7.
1139D.-S. Kim et al. / Magnetic Resonance Imaging 21 (2003) 1131–1140

[13] Pajevic S, Basser P. A continuous tensor field approximation forDT-MRI data. Ninth Annul Conference of the ISMRM, 2001.
[14] Poupon B, Clark CA, Frouin V, Regis J, Bloch I, Le Bihan D, ManginJ. Regularization of diffusion-based direction maps for the tracking ofbrain white matter fascicles. Neuroimage 2000;12:184–95.
[15] Xue R, van Zijl PC, Crain BJ, Solaiyappan M, Mori S. In vivothree-dimensional reconstruction of rat brain axonal projections bydiffusion tensor imaging. Magn Reson Med 1999;42:1123–7.
[16] Kim D-S, Ronen I, Formisano E, Ugurbil K, Mori S, Goebel R.Simultaneous, in vivo visualization of axonal connectivity and func-tional activity in cat visual cortex using MRI. Presented at Soc.Neurosci. Abstr. 783.3, 2001.
[17] Mori S, van Zijl PC. Diffusion weighting by the trace of the diffusiontensor within a single scan. Magn Reson Med 1995;33:41–52.
[18] Kim K-H, Ronen I, Formisano E, Mori S, Ugurbil K, Goebel R, KimD-S. A novel fiber-tracking method using vector criterion and pre-dictive directionality in diffusion tensor imaging. Presented atISMSM, 2002.
[19] Kriegeskorte N, Goebel R. An efficient algorithm for topologicallycorrect segmentation of the cortical sheet in anatomical MR volumes.Neuroimage 2001;14:329–46.
[20] Pribram K, MacLean P. Neuronographci analysis of medial and basalcerebral cortex. J Neurophysiol 1953;16:324–40.
[21] Whitlock CG, Nauta WJH. Subcortical projections from temporalneocortex in macaca mulata. J Comp Neurol 1956;106:183–212.
[22] Galuske RA, Schlote W, Bratzke H, Singer W. Interhemisphericasymmetries of the modular structure in human temporal cortex.Science 2000;289:1946–9.
[23] Katz LC, Iarovici DM. Green fluorescent latex microspheres: a newretrograde tracer. Neuroscience 1990;34:511–20.
[24] Kisvarday ZF, Kim DS, Eysel UT, Bonhoeffer T. Relationshipbetween lateral inhibitory connections and the topography of the orien-tation map in cat visual cortex. Eur J Neurosci 1994;6:1619–32.
[25] Pautler RG, Silva AC, Koretsky AP. In vivo neuronal tract tracingusing manganese-enhanced magnetic resonance imaging. Magn Re-son Med 1998;40:740–8.
1140 D.-S. Kim et al. / Magnetic Resonance Imaging 21 (2003) 1131–1140