IN VITRO ANALYSES OF MERKEL CELL POLYOMAVIRUS ...
247
IN VITRO ANALYSES OF MERKEL CELL POLYOMAVIRUS CELL BIOLOGY by Anna Guastafierro Bachelors of Science in Biological Science, Holy Names University, 2007 Submitted to the Graduate Faculty of University of Pittsburgh School of Medicine Program in Integrative Molecular Biology in partial fulfillment of the requirements for the degree of Doctor of Philosophy University of Pittsburgh 2013
-
Upload
khangminh22 -
Category
Documents
-
view
1 -
download
0
Transcript of IN VITRO ANALYSES OF MERKEL CELL POLYOMAVIRUS ...
IN VITRO ANALYSES OF MERKEL CELL POLYOMAVIRUS CELL BIOLOGY
by
Anna Guastafierro
Bachelors of Science in Biological Science, Holy Names University, 2007
Submitted to the Graduate Faculty of
University of Pittsburgh School of Medicine
Program in Integrative Molecular Biology
in partial fulfillment of the requirements for the degree of
Doctor of Philosophy
University of Pittsburgh
2013

ii
UNIVERSITY OF PITTSBURGH
SCHOOL OF MEDICINE
This dissertation was presented
by
Anna Guastafierro
It was defended on
August 13th, 2013
and approved by
Jeffrey L. Brodsky, Ph.D., Professor, Department of Biological Sciences
James M. Pipas, Ph.D., Professor, Department of Biological Sciences
Frank J. Jenkins, Ph.D., Associate Professor, Department of Pathology
Anthony Schwacha, Ph.D., Associate Professor, Department of Biological Sciences
Dissertation Advisor: Patrick S. Moore, MD, MPH, Professor, Department of
Microbiology and Molecular Genetics

iii
Copyright © by Anna Guastafierro
2013

iv
The work described in this dissertation was initiated in 2008, shortly after the discovery
of Merkel cell polyomavirus (MCV). MCV was discovered as clonally integrated in 80%
of Merkel cell carcinoma (MCC) and tumor-derived viral genomes were found to harbor
individual large T antigen (LT) truncating deletions. The work presented in this thesis
focuses on two main features associated with MCV cell biology: (1) Viral replication
requirements that promote viral origin replication in the context of full length MCV LT
(chapter 3) and (2) cellular targets that enhance human fibroblast proliferation in the
presence of tumor-derived full length LT (chapter 4). As part of these studies, the novel
MCV-positive MCC cell line MS-1 was generated, and its cellular and viral features are
presented here (chapter 2). MCC cell lines are useful tools that can be used to study
MCV biology, and test therapeutic compounds in vitro, as well as in a xenograft setting
in vivo as described in the appendix of this thesis. Within the past 6 years, 8 new human
polyomaviruses have been identified through basic biological approaches, highlighting
the possibility that other human malignancies may be associated with polyomaviral
infections. The identification of MCV in association with an aggressive human cancer
also underscores the relevance of basic research in understanding human disease.
IN VITRO ANALYSES OF MERKEL CELL POLYOMAVIRUS CELL BIOLOGY
Anna Guastafierro
University of Pittsburgh, 2013

v
TABLE OF CONTENTS
ACKNOWLEDGMENTS .............................................................................................. XVI
1.0 INTRODUCTION ..................................................................................................... 1
1.1 VIRUSES AND CANCER ................................................................................ 1
1.1.1 History of tumor viruses ..................................................................... 1
1.1.2 Viruses and human cancer ................................................................. 2
1.2 POLYOMAVIRUS BIOLOGY ......................................................................... 11
1.2.1 History and phylogeny ...................................................................... 11
1.2.2 Association with human cancer ....................................................... 12
1.2.3 Human polyomaviruses .................................................................... 13
1.2.4 Genome organization ........................................................................ 19
1.2.5 Viral life cycle ..................................................................................... 21
1.2.6 Permissive vs. non-permissive infection ........................................ 23
1.2.7 Cell transformation assays ............................................................... 25
1.2.7.1 Loss of contact inhibition ...................................................... 26
1.2.7.2 Immortalization ........................................................................ 26
1.2.7.3 Anchorage-independent growth ............................................ 27
1.2.7.4 Growth under nutrient deprivation ........................................ 27
1.2.7.5 Tumor formation in animal hosts .......................................... 27

vi
1.3 SV40 EARLY REGION .................................................................................. 29
1.3.1 SV40 T antigen interactions with cellular proteins ......................... 29
1.3.1.1 SV40 LT interaction with Rb family ....................................... 29
1.3.1.2 SV40 LT interaction with p53 ................................................. 30
1.3.1.3 Other SV40 LT cellular targets ............................................... 33
1.3.1.4 SV40 sT .................................................................................... 38
1.3.2 SV40 transgenic mouse models ....................................................... 40
1.4 MERKEL CELL CARCINOMA ...................................................................... 43
1.4.1 Origin and pathology ......................................................................... 43
1.4.2 Incidence and clinical manifestation ............................................... 44
1.4.3 Treatment ........................................................................................... 46
1.4.4 Molecular features ............................................................................. 46
1.5 MERKEL CELL POLYOMAVIRUS ................................................................ 49
1.5.1 Discovery of MCV .............................................................................. 49
1.5.2 MCV genome organization ................................................................ 51
1.5.3 Large T antigen truncations in MCC tumors ................................... 53
1.5.4 MCV genome copy number and integration ................................... 55
1.5.5 MCV Serology and transmission ...................................................... 56
1.5.6 T antigen expression in MCC ........................................................... 58
1.5.7 MCV T antigen interactions with cellular proteins ......................... 59
1.5.8 Cellular transformation by MCV T antigens .................................... 61
1.5.9 Evidence for causality ....................................................................... 63

vii
2.0 CHARACTERIZATION OF AN EARLY PASSAGE MERKEL CELL
POLYOMAVIRUS-POSITIVE MERKEL CELL CARCINOMA CELL LINE, MS-1, AND
ITS GROWTH IN NOD SCID GAMMA MICE ................................................................ 65
2.1 INTRODUCTION ............................................................................................ 67
2.2 MATERIALS AND METHODS ....................................................................... 69
2.2.1 Preparation of tumor biopsy and cell culture conditions .............. 69
2.2.2 Real time quantitative PCR ............................................................... 69
2.2.3 MCV genome sequencing ................................................................. 70
2.2.4 Phage library screen of MCV integration site ................................. 71
2.2.5 RACE analysis ................................................................................... 71
2.2.6 Southern blot ..................................................................................... 72
2.2.7 Immunoblotting .................................................................................. 72
2.2.8 Xenograft model ................................................................................ 73
2.2.9 Immunohistochemistry ..................................................................... 73
2.3 RESULTS ....................................................................................................... 75
2.3.1 MS-1 cell culture morphology and immunohistochemistry .......... 75
2.3.2 MCV status ......................................................................................... 77
2.3.3 T antigen truncations and corresponding protein sizes ................ 79
2.3.4 Viral genome integration site ........................................................... 82
2.3.5 Tumorigenicity of MS-1 cells in vivo ................................................ 83
2.4 DISCUSSION ................................................................................................. 85

viii
3.0 THE MINIMUM REPLICATION ORIGIN OF MERKEL CELL POLYOMAVIRUS
HAS A UNIQUE LARGE T-ANTIGEN LOADING ARCHITECTURE AND REQUIRES
SMALL T-ANTIGEN EXPRESSION FOR OPTIMAL REPLICATION ........................... 91
3.1 INTRODUCTION ............................................................................................ 93
3.2 MATERIALS AND METHODS ....................................................................... 96
3.2.1 Plasmids ............................................................................................. 96
3.2.2 Generation of Antibodies .................................................................. 97
3.2.3 MCV origin replication assay ............................................................ 97
3.2.4 Immunoprecipitation ......................................................................... 98
3.2.5 shRNA knockdown ............................................................................ 99
3.2.6 Chromatin immunoprecipitation (ChIP) ........................................... 99
3.2.7 Molecular modeling ......................................................................... 100
3.3 RESULTS ..................................................................................................... 101
3.3.1 The minimum MCV replication origin is defined by a 71 nucleotide
genomic region ............................................................................................ 101
3.3.2 Pentanucleotide requirements for MCV replication. .................... 105
3.3.3 Effects of Tumor-derived LT mutations on origin binding and
replication .................................................................................................... 109
Other factors influencing MCV replication ............................................... 110
3.4 DISCUSSION ............................................................................................... 115
ix
4.0 MERKEL CELL CARCINOMA-DERIVED MERKEL CELL POLYOMAVIRUS T
ANTIGEN INDUCES HUMAN CELL PROLIFERATION THROUGH ITS RB
TARGETING DOMAIN BUT IS INSUFFICIENT TO TRANSFORM HUMAN
FIBROBLASTS ............................................................................................................ 119
4.1 INTRODUCTION .......................................................................................... 120
4.2 MATERIALS AND METHODS ..................................................................... 123
4.2.1 Cell culture ....................................................................................... 123
4.2.2 Generation of stable cell lines ........................................................ 123
4.2.3 Lentivirus production ...................................................................... 123
4.2.4 Overexpression and short hairpin RNA (shRNA) constructs ...... 124
4.2.5 Cell counting and doubling time determination ........................... 124
4.2.6 Immunoblotting ................................................................................ 124
4.2.7 Semi quantitative RT-PCR .............................................................. 126
4.2.8 Soft agar assay ................................................................................ 126
4.2.9 Microarray ........................................................................................ 126
4.3 RESULTS ..................................................................................................... 128
4.3.1 The effect of MCV T antigens on BJ-hTERT proliferation ............ 128
4.3.2 Transformation assays ................................................................... 129
4.3.3 Microarray gene expression profile in BJ-TERT cells expressing
MCV T antigens ........................................................................................... 133
4.3.4 Confirmation of LXCXE-motif dependent up-regulation of cyclin E
and CDK2 transcript levels ......................................................................... 139

x
4.3.5 Validation of increased Cyclin E and CDK2 protein expression in
BJ-hTERT ..................................................................................................... 140
4.3.6 Cell cycle analysis of BJ-hTERT stable cells ................................ 143
4.4 DISCUSSION ............................................................................................... 144
5.0 CONCLUSIONS AND PERSPECTIVES ............................................................. 148
5.1 MS-1 CELL LINE ......................................................................................... 148
5.2 MCV ORIGIN REPLICATION ...................................................................... 148
5.3 PROLIFERATION AND TRANSFORMATION STUDIES ........................... 150
APPENDIX A................................................................................................................ 154
APPENDIX B ................................................................................................................ 160
APPENDIX C ................................................................................................................ 187
BIBLIOGRAPHY .......................................................................................................... 208

xi
LIST OF TABLES
Table 1. Human tumor viruses ......................................................................................... 6
Table 2. Immunohistochemical features of MCC cell lines ............................................. 76
Table 3. MCV genome copy number and viral RNA expression .................................... 77
Table 4. Chromosomal integration sites in MCC ............................................................ 82
Table 5. Biological functions affected by 339LT expression in BJ-hTERT ................... 137
Table 6. Cell cycle regulatory genes differentially regulated by 339LT ........................ 138
Table 7. Microarray analysis of p53 transcriptional targets .......................................... 158
Table 8. EC50 (µM) concentrations for MCC cell lines .................................................. 180
Table 9. Average tumor growth kinetics ....................................................................... 198

xii
LIST OF FIGURES
Figure 1. MCV, JCV, BKV , and SV40 T antigen splice isoforms ................................... 19
Figure 2. The polyomavirus lifecycle .............................................................................. 22
Figure 3. Possible outcomes of SV40 infection in different cell types ............................ 24
Figure 4. Targeting of the Rb-E2F and p53 pathways by SV40 LT ................................ 31
Figure 5. SV40 LT domains and cellular interactors ...................................................... 33
Figure 6. SV40 sT domains and cellular interactors ....................................................... 38
Figure 7. Location of Merkel cells ................................................................................... 44
Figure 8. Pathology and clinical manifestation of MCC .................................................. 45
Figure 9. Digital transcriptome subtraction ..................................................................... 50
Figure 10. MCV 350 prototype genome organization ..................................................... 51
Figure 11. MCV T antigen locus ..................................................................................... 54
Figure 12. MCV Seroprevalence .................................................................................... 57
Figure 13. MCV T antigen expression in MCC ............................................................... 58
Figure 14. Morphological features of MCC cell lines ...................................................... 75
Figure 15. MS-1 harbors clonally integrated MCV and expresses viral T antigens ........ 79
Figure 16. MCV genome comparison ............................................................................. 81
Figure 17. MS-1 xenograft model ................................................................................... 83

xiii
Figure 18. Mapping of the MCV core origin ................................................................. 103
Figure 19. Definition of the minimal MCV core origin ................................................... 104
Figure 20. Pentanucleotide requirements .................................................................... 105
Figure 21. Single base pair mutational analysis of pentanucleotides ........................... 107
Figure 22. Reconstitution of pentanucleotide sequence to GAGGC ............................ 108
Figure 23. Chromatin immunoprecipitation (ChIP) analysis ......................................... 110
Figure 24. Other factors influencing MCV replication ................................................... 112
Figure 25. MCV origin replication assay with TAg mutants in DnaJ domain and PP2A
binding site ................................................................................................................... 114
Figure 26. Model of the MCV OBDs on the MCV origin ............................................... 116
Figure 27. Tumor-derived MCV LT promotes human fibroblast proliferation through it
LXCXE RB targeting domain ........................................................................................ 129
Figure 28. Generation of BJ-hTERT stable cell lines for transformation assays .......... 130
Figure 29. BJ-hTERT SV40ER and hRas stable cell line soft agar positive control ..... 131
Figure 30. BJ-hTERT stable cells soft agar colony formation result ............................ 132
Figure 31. Microarray gene expression profile of E2F targets ..................................... 133
Figure 32. Transcriptome modulation by 339LT ........................................................... 134
Figure 33. Heatmap of cell proliferation related genes ................................................. 135
Figure 34. Semi quantitative RT-PCR analysis confirms up-regulation of cyclin E and
CDK2 transcripts by tumor-derived LTs ....................................................................... 140
Figure 35. Cyclin E and CDK2 protein levels are preferentially up-regulated by tumor-
derived MCV LT ........................................................................................................... 141

xiv
Figure 36. BJ-hTERT 339LT expressing cells show a greater percentage of cells
entering the cell cycle ................................................................................................... 143
Figure 37. Endogenous Ras protein levels are decreased in the presence of 339LT .. 155
Figure 38. MCV LT stabilizes p53 protein levels resulting in p21 induction ................. 157
Figure 39. Survivin oncoprotein mRNA expression is increased in MCV-positive MCC
...................................................................................................................................... 172
Figure 40. MCV sT knockdown in MCC cell lines does not affect survivin expression 173
Figure 41. MCV LT induces survivin oncoprotein expression in primary BJ cells through
its RB targeting domain ................................................................................................ 175
Figure 42. The survivin promoter inhibitor YM155 inhibits MCV-positive MCC cell growth
...................................................................................................................................... 176
Figure 43. Cell death phenotype of MCV-positive MCC cells treated with YM155 ...... 178
Figure 44. YM155 inhibits growth of MKL-1 xenografts in NSG mice .......................... 183
Figure 45. MCC mouse xenograft treatment groups and experimental outline ............ 194
Figure 46. Mouse weights on saline and YM155 treatment groups ............................. 195
Figure 47. Survival of various MCC xenograft models on different treatments ............ 197
Figure 48. Tumor volume response to YM155 is dose, duration, and cell line dependent
...................................................................................................................................... 199
Figure 49. Immunohistochemistry of MCV LT in a MKL-1 xenograft tumor and liver
metastasis .................................................................................................................... 202
Figure 50. Immunohistochemistry of MCV LT in various MCC xenograft tumors and
metastases ................................................................................................................... 203

xv
Figure 51. Various chemotherapeutics induce MCC cell death in an additive, but not
synergistic manner, when combined with YM155 in vitro ............................................. 205

xvi
ACKNOWLEDGMENTS
First and foremost, I would like to thank my mentors Dr. Patrick Moore and Dr. Yuan
Chang. I am in deep gratitude to you for providing me with the opportunity to grow in my
profession and establish myself as an independent scientist in your lab. I appreciate
your patience and insightful advice on scientific matters. My graduate student
experience in your lab has been invaluable for my future career. Thank you!
Next, I want to thank the current and past members of the Chang-Moore lab, who
have provided me not only with a professional environment that was very supportive in
my development as a scientist, but also have become a family away from home. I
appreciate your guidance and will cherish memories of our times together in and outside
of the lab for the rest of my life. I especially want to thank Masa for being a great mentor
to me. I have learned so much from you.
I would like to thank my thesis committee members for your valuable advice
throughout the past years. I have benefited from your scientific expertise, and I
appreciate the time you have taken out of your busy schedules to serve on my thesis
committee.
Last but not least, I would like to thank family and friends who have been a
strong support of mine throughout the years. I want to thank my parents, Lena, Ciro,
Luisa and Kensington for always believing in me and supporting me in whatever I

xvii
decided to do. You are my foundation in life, without which I could not have done any of
this. I love you guys! Thank you Gene for being my best friend and confidant
extraordinaire. You keep my spirits lifted and I appreciate every minute we spend
together. I will miss you, but I know this is not the end of the road for us. You have a
friend in me for life. I would like to thank Alex, Nathalie and Sarah for being my friends
throughout the years and keeping in touch even when we are far away from each other.
I also want to thank my PIMB friends, for a great graduate school experience. I
especially want to thank Jelena and Reety for being awesome friends during my stay in
Pittsburgh. I could not have made it without your advice and friendship. I will miss you!

1
1.0 INTRODUCTION
1.1 VIRUSES AND CANCER
1.1.1 History of tumor viruses
The field of tumor virology dates back to the 1911 discovery of the Avian Rous sarcoma
virus (RSV) by Francis Peyton Rous (1, 2). Rous discovered that a chicken sarcoma
could be transmitted from one chicken to another using a filtered cell-free tumor extract
(3). This novel finding of an infectious agent that induces cancer represented an
unrecognized concept in the field of cancer research at the time. Even though it was
known since the 19th century that cancer was a cellular disease, its specific etiology was
still unclear. The theory of an infectious cause was disregarded for over fifty years due
to a failure to experimentally verify microbial pathogens as cancer causing agents. Even
after Rous reported his findings of RSV-induced sarcomas in chickens, the scientific
community at the time was not convinced that tumor viruses existed, or that they
represented the causative agent for a number of human cancers. Opponents of this
theory claimed that the cell-free extracts used by Rous to transmit sarcomas in
chickens, were in fact not cell-free, or that chickens are not an appropriate model
system to study human cancer.

2
However, Ludwik Gross’ discoveries of the acutely transforming mouse leukemia
retrovirus and the mouse polyomavirus (PyV), which causes many (poly) tumors (oma)
in newborn mice (4, 5), lead to wider acceptance of the concept of viral tumorigenesis in
the 1950s. In 1966 Rous finally received recognition for his groundbreaking work, and
was awarded the Nobel Prize. Since then, studies centered around RSV and PyV, as
well as other subsequently discovered tumor viruses, have contributed to major
scientific advances including the discoveries of reverse transcriptase, as well as a
number of cellular oncogenes and tumor suppressors.
1.1.2 Viruses and human cancer
Since the 1911 discovery of the avian tumor virus RSV, a total of seven tumor viruses
have been discovered to cause human cancer. Viruses cause a total of 10-15% of
cancers worldwide, including cancers of diverse cellular origins. Viral etiology of a
cancer provides the unique opportunity to develop preventative, diagnostic and
therapeutic tools that target viral proteins specifically. This has been utilized in
developing vaccines against hepatitis B virus (HBV) and human papillomavirus (HPV)
infections, resulting in a decrease of respective liver and cervical tumor incidents.
Anthony Epstein, Yvonne Barr, and Bert Anchong discovered the first human tumor
virus called Epstein-Barr virus (EBV) in 1964 (6). EBV is a herpesvirus found by
electron microscopy of cell lines derived from Burkitt’s lymphoma (Table 1). Burkitt’s
lymphoma is a cancer which predominately affects children from equatorial Africa and it
is more common in immunosuppression, which is often related to malaria in this
geographically confined area. Subsequent serological studies revealed the seemingly

3
contradictory fact that persistent EBV infection is ubiquitous, yet asymptomatic in adults
worldwide. This posed the question of how such a common viral infection could cause a
rare, geographically confined cancer (7, 8). In addition, a small number of Burkitt’s
lymphoma arising in developed countries are not associated with EBV (9). Shortly after
its discovery, the research team surrounding Gertrude and Werner Henle demonstrated
that EBV is capable of transforming primary B-cells (10). Nevertheless, it was not until
1997 that the International Agency for Research on Cancer (IARC) officially declared
EBV as a human carcinogen (7). To understand the debate that resulted in a 30-year
time delay until EBV was finally recognized as a human carcinogen, one must
understand which criteria are used in order to demonstrate disease association.
To evaluate causality of an infectious agent in the context of a disease state,
there are several standards that are used to examine the evidence at hand. These
include Koch’s postulates published in 1890 as well as Hill’s criteria published in the
1960’s. Koch’s postulates originate from his work on bacterial pathogens including
anthrax and tuberculosis (11). They include the following requirements: 1) The
infectious agent has to occur in every case of the disease, 2) it does not occur in any
other disease, and 3) it can be isolated as pure cultures in vitro, and when re-introduced
into susceptible laboratory animals results in the same disease outcome (11). Koch’s
postulates cannot be applied in the case of EBV or other tumor viruses, since it is not
always possible to isolate them as pure cultures or introduce them into experimental
animals and always observe the same disease state. Hill’s criteria to evaluate the
observed association of a pathogen with a disease state include 1) strength, 2)
consistency, 3) specificity, 4) temporality, 5) biological gradient, 6) plausibility, 7)

4
coherence, and 8) experimental evidence of association (12). Hill’s criteria were
established to evaluate the relationship between smoking cigarettes and lung cancer,
but in the field of tumor virology some aspects are not applicable.
With our current knowledge of cancer being a multi-step disease that results from
a combination of cellular changes and environmental factors, we can explain how a
common viral infection may cause a rare cancer in a subset of individuals. In the case of
EBV and other tumor viruses, the immune status of the infected individual plays a major
role in determining disease state. In immunocompetent individuals, the viral infection is
contained and regulated by the immune cells. However, in the case of
immunosuppression, as seen in elderly people, as well as transplant and AIDS patients,
the virus is able to re-emerge, and viral protein expression may lead to cell
transformation and consequent tumorigenesis.
As more human tumor viruses were discovered over time (Table 1), it became
apparent that tumor viruses usually do not replicate as virions within the tumor cells, but
instead exist either as latent episomes or integrate into the host cell genome. To date, 7
human tumor viruses have been identified using different experimental techniques
(Table 1). They belong to different classes of viruses, and cause tumors in a number of
different cell types (Table 1). The following paragraphs will provide a brief description of
each tumor virus discovered subsequent to EBV.
Shortly after the discovery of EBV, Blumberg and colleagues identified a new
antigen named Australia (Au) antigen in the serum of an Australian aborigine (13). They
found the Au antigen to be present in the sera of patients with acute or chronic hepatitis
(14), and in 1968 Alfred Prince demonstrated that Au is the surface antigen of HBV (15),

5
the virus that causes serum hepatitis. Due to persistent, yet asymptomatic HBV
infection in healthy individuals, linking HBV infection to hepatocellular carcinoma (HCC)
proved to be difficult once again. In 1975 Blumberg and colleagues described a link
between HBV infection and HCC development, and proposed vaccination against HBV
using the Au antigen (16). Merck eventually started producing an HBV vaccine
commercially using recombinant Au subunit produced in yeast, which is still used today.
Vaccination efforts worldwide have reduced HBV-induced acute and chronic hepatitis,
as well as HCC incidents (17, 18). HBV-induced liver disease causes > 300,000 deaths
each year, but expanding routine vaccination regimens during early childhood
worldwide will likely reduce this death toll further in the future. Previous to the
identification of HBV, Feinstone and colleagues identified the picornavirus hepatitis A
virus (HAV) in 1973 as an infectious agent that induces acute hepatitis (19). However, in
contrast to HBV, HAV infection is not persistent, and not involved in HCC (20).
The mechanism by which HBV contributes to HCC is not exactly clear. Lack of
an appropriate experimental model system that mimics the human host has hindered
research progression in this field. However, it is well known that chronic viral infection
with HBV leads to active viral replication in liver cells and viremia. The production of
viral proteins in chronically infected hepatocytes leads to a persistent immune response
and destruction of these cells. This leads to a much more rapid turnover of liver cells,
which are usually long-lived with half-lives of 6-12 months (21). Some studies have
indicated the HBV protein HBx as a potential viral oncogene, but studies utilizing
different experimental systems have failed to yield reproducible results (21, 22).

6
Tab
le 1
. H
um
an T
um
orv
iru
ses
Virus
G
enom
eM
etho
d of
Id
entif
icat
ion
Ass
ocia
ted
canc
ers
Year
id
entif
ied
Ref
eren
ce
Epst
ein-
Bar
r vi
rus
(EBV)*
Dou
ble-
stra
nded
DN
A
herp
esvi
rus
Elec
tron
mic
rosc
opy
Bur
kitt
's ly
mph
oma
1964
Epst
ein
et a
l., 1
964
Hep
atiti
s B v
irus
(H
BV)
Sin
gle-
and
dou
ble-
stra
nded
D
NA h
epad
enov
irus
Ser
olog
ySom
e he
pato
cellu
lar
carc
inom
a19
65Blu
mbe
rg e
t al
., 19
65H
uman
T-l
ymph
otro
pic
viru
s-I
(HTL
V-I)
Posi
tive-
stra
nd,
sing
le-
stra
nded
RN
A r
etro
viru
sTi
ssue
cul
ture
Adu
lt T
cell
leuk
emia
1980
Poie
sz e
t al
., 19
80
Hig
h-risk
hum
an p
apill
omav
irus
es
(HPV
) 16
and
18
Dou
ble-
stra
nded
DN
A
papi
llom
avirus
DN
A c
loni
ngM
ost
cerv
ical
and
pen
ile c
ance
rs;
som
e ot
her
anog
enita
l and
hea
d an
d ne
ck c
ance
rs19
83-8
4D
urst
et
al.,
1983
Bos
hart
et
al.,
1983
Hep
atiti
s C v
irus
(H
CV)
Posi
tive-
stra
nd,
sing
le-
stra
nded
RN
A fla
vivi
rus
cDN
A c
loni
ngSom
e he
pato
cellu
lar
carc
inom
a an
d so
me
lym
phom
as19
89Cho
o et
al.,
198
9
Kapo
si's
sar
com
a he
rpes
viru
s (K
SH
V)*
Dou
ble-
stra
nded
DN
A
herp
esvi
rus
Rep
rese
ntat
iona
l di
ffer
ence
ana
lysi
s
Kapo
si's
sar
com
a, p
rim
ary
effu
sion
lym
phom
a; s
ome
mul
ticen
tric
Cas
tlem
an's
dis
ease
1994
Cha
ng e
t al
., 19
94
Mer
kel c
ell p
olyo
mav
irus
(M
CV)
Dou
ble-
stra
nded
DN
A
poly
omav
irus
Dig
ital t
rans
crip
tom
e su
btra
ctio
n (D
TS)
Mos
t M
erke
l cel
l car
cino
ma
2008
Feng
et
al.,
2008
* EB
V is
als
o kn
own
as h
uman
her
pesv
irus
4 (
HH
V4)
and
KSH
V is
als
o kn
own
as h
uman
her
pesv
irus
8 (
HH
V8)
mk
Table 1. Human tumor viruses

7
Yet another hypothesis that could explain HCC development in the context of HCV
infection is the presence of harmful environmental co-factors such as aflatoxin, which
may result in G-to-T transversions. In 80-90% of HCC that have mutated p53 (~50%)
residue 249 is changed from G to T (21, 23, 24).
In 1989, Choo et al. found that in addition to HBV and HAV associated hepatitis,
they were able to distinguish a third form, non-A, non-B hepatitis (NANBH) (25). They
screened a cDNA library from chimpanzee serum containing the NANBH agent with
serum from a patient diagnosed with NANBH, and they were able to identify an
unknown antigen belonging to a new RNA flavivirus, which was named hepatitis C virus
(HCV) (Table 1). Subsequently, HCV was established as a causal agent in chronic
hepatitis, liver cirrhosis, as well as HCC. HCV infection affects more than 170 million
individuals worldwide, of whom approximately 20% are at risk of developing HCV-
induced HCC. In contrast to HAV and HBV, a vaccine that protects against HCV is not
available at this point, and attempts to develop a vaccine have been challenging due to
the high mutation rate in the HCV RNA genome, resulting in the presence of many
different HCV strains. Nevertheless, research is ongoing in this field, and the company
Inovio is currently testing a plasmid DNA vaccine against HCV in a clinical phase II trial
(www.inovio.com).
Human T-lymphotropic virus-1 (HTLV-1) is the only known human tumor virus
that belongs to the family of retroviruses (Table 1). Its discovery depended heavily on
the identification of reverse transcriptase (RT) in 1970 in independent studies by
Howard Temin, and David Baltimore, who were both able to demonstrate RNA-
dependent DNA polymerase activity in RSV (26, 27). The discovery of RT was awarded
T
a
bl
e
1.
H
u
m

8
with a Nobel price in 1975, and represents one of many examples in which the study of
tumor viruses resulted in a major discovery that influenced science across all
disciplines. In 1979, Bernard Poiesz, a postdoctoral fellow in Robert Gallo’s lab at the
time, was able to detect RT activity in cell lines derived from adult T-cell
lymphoma/leukemia patients and electron microscopy confirmed the presence of
budding HTLV-1 virions (28). Shortly after, Gallo and his team were able to demonstrate
that HTLV-1 was not only able to infect T-cells, but also transformed them in vitro (29,
30), and that proviral DNA could be found integrated into the host cell genome (31). In
addition, they were able to isolate HTLV-1 from additional patient ATL samples and
detect specific antibodies against the virus in patient sera (32). Subsequent studies from
research teams worldwide confirmed HTLV-1 association with ATL (33-35). However,
as is the case with other human tumor viruses, only a small percentage of individuals
infected with HTLV-1 develop ATL throughout their lifetime. Cellular transformation is
associated with expression of the viral oncoprotein Tax, which induces T cell
proliferation and survival (36).
Another groundbreaking, and recently deemed Nobel prize-worthy discovery in
tumor virology is the identification of high-risk papillomaviruses that cause human
cancers. In 1983-84, a research team led by Harald zur Hausen at the University of
Heidelberg identified human papillomavirus (HPV) types 16 and 18 by cross-hybridizing
DNA from other papillomaviruses to DNA from cervical carcinoma biopsies (37, 38).
Cervical cancer is one of the most common cancers in women worldwide, and the
identification of its viral etiology has lead to the successful development of a vaccine
within recent years (39, 40). This vaccine utilizes recombinant HPV capsid proteins L1,

9
and exists in bivalent (protection against HPV 16 and 18) and quadrivalent (protection
against HPV 16, 18, 6, and 11) forms (41). In addition to cervical carcinoma, various
types of HPVs are also linked to genital warts, other anogenital cancers as well as close
to 20% of oropharyngeal cancers in both women and men (42).
With regards to cervical carcinoma, 15 high-risk HPV types have been identified
that are individually necessary, however not sufficient to induce tumorigenesis (43). Of
these, both HPV types 16 and 18 are most commonly associated with squamous cell
carcinoma, whereas HPV 18 shows strong association with adenocarcinoma of the
cervix. High-grade neoplastic lesions and invasive disease are characterized by viral
integration of high-risk HPV types 16 and 18, with integration events that disrupt the E2
gene favoring tumorigenesis due to E2’s repressive effect on E6 and E7 oncogene
expression (43). However, even though the majority of women get infected with HPV,
only a small percentage will actually suffer from invasive neoplastic disease. This
indicates that progression to high-grade cervical neoplasia requires additional changes
within the cervical epithelium, which may include genetic and epigenetic changes that
have to be taken into consideration when tackling this disease. Non-viral risk factors
that contribute to HPV-induced malignant disease progression include a high number of
sexual partners, mutagens, smoking, hormones, immunosuppression, and genetic
predisposition (39).
Most recent efforts to discover new tumor viruses associated with human
cancers have focused on human malignancies that are more prevalent in
immunosuppressed individuals including AIDS and transplant patients as well as the
elderly. Patrick Moore and Yuan Chang have lead the way in scientific endeavors that

10
identified the human tumor viruses Karposi’s sarcoma herpesvirus (KSHV) or Human
herpesvirus 8 (HHV-8) in 1994 as well as Merkel cell polyomavirus (MCV) in 2008
(Table 1). Kaposis’s sarcoma (KS) is an angioproliferative malignancy first reported in
1872 by Moritz Kaposi, who described KS lesions as ‘idiopathic multiple pigmented
sarcomas of the skin’ (44). Even though KS was initially described as endemic in the
Mediterranean and in Africa, the HIV epidemic in Europe and the US in the 1980’s
coincided with increased cases of AIDS-related KS in homosexual men (45). The
elevated occurrence of KS in immunosuppressed individuals initiated a search for an
infectious etiology. KSHV was discovered in 1994 using a PCR-based technique called
representational difference analysis (RDA) (46). Briefly, DNA sequences unique to
AIDS-KS lesions were isolated following PCR amplification and subtractive hybridization
(46). Within a year of its discovery, KSHV had also been indicated in multicentric
Castleman’s disease (MCD), as well as AIDS-related primary effusion lymphoma (PEL)
(47-49).
Merkel cell carcinoma (MCC) is an aggressive skin cancer that arises from
mechanoreceptor Merkel cells in the basal layer of the epidermis (50, 51). It is more
prevalent in immunosuppressed (13.4 fold higher incidence in AIDS patients) as well as
older individuals (52, 53), which prompted the search of an infectious agent that may be
associated with this cancer. In 2008, Feng et al. performed a direct sequencing-based
technique called digital transcriptome subtraction (DTS) analysis (54) on cDNA libraries
derived from four MCC tumors (55). Annotated human sequences were subtracted from
the MCC cDNA libraries to identify candidate reads of non-human origin. Alignment of
non-human reads with viral genome databases identified one transcript with high
11
homology to polyomavirus sequences (55). Subsequently, the whole MCV genome was
sequenced and its association with MCC was confirmed in multiple studies (55-57).
Detailed descriptions of MCV discovery, its viral features and association with MCC can
be found in section 1.4 Merkel cell polyomavirus.
1.2 POLYOMAVIRUS BIOLOGY
1.2.1 History and phylogeny
Polyomaviruses are small, non-enveloped viruses that have double-stranded DNA
genomes of ~5.0-5.4 kb. They have icosahedral capsids of 40-45nm diameter, and have
been shown to infect various species including humans, monkeys, rodents, rabbits and
birds. They can be divided into three major subgroups including the mammalian species
containing groups Wukipolyomaviridae and Orthopolyomaviridae, and the avian group
Avipolyomaviridae. Polyomaviruses encode for viral proteins called tumor (T) antigens,
which have been associated with oncogenic transformation in cell culture experiments
as well as tumor formation in animal models (58).
The first polyomavirus, murine polyomavirus (MPyV), was discovered as a
filterable agent from mouse leukemia cells in 1953. Subsequently, MPyV was shown to
cause cancers in newborn mice, rats, as well as hamsters (59-61), which led the way to
investigating the oncogenic potential of polyomaviruses discovered ever since. Shortly
after the identification of MPyV, simian vacuolating virus 40 (SV40) was discovered
between 1959-1960, and it also was capable of inducing tumors in hamsters during

12
initial experiments (62, 63). SV40’s natural host is the rhesus macaque, and many lots
of poliovirus vaccine produced in rhesus cells between 1955 and 1963 were found
contaminated with SV40 (64). It is estimated that 10-30 million individuals received a
polio vaccine that contained SV40 during that time period, and studies to evaluate the
potential oncogenic risk of SV40 in humans were initiated afterwards.
1.2.2 Association with human cancer
PCR-based studies reported the presence of SV40 DNA in non-Hodgkin lymphomas
(65), osteosarcomas (66), brain tumors (67) as well as meotheliomas (68). However,
subsequent studies failed to repeat these results and they were indicated as false
positives due to PCR template contamination from 293FT cell DNA (HEK293 cells that
were stably transduced to express SV40 T antigen) or common laboratory plasmids
containing SV40 sequences (69, 70). Serologic studies to investigate the presence of
SV40-specific antibodies in the general population as well as in patients with
supposedly SV40-linked cancers, provide more consistent results due to a high
specificity of this assay, and less chances for false positive results. The results indicate
that there is no difference in seroreactivity between the general population and
individuals with supposedly SV40–linked cancers (71-73). Low levels of seroprevalence
across all groups tested can be attributed to cross reactivity of antibodies from human
polyomaviruses BKV and JCV with SV40 peptides (74). In conclusion, there is no
convincing or repeatable evidence linking SV40 exposure to human cancer to this date
(58, 70).

13
The human polyomaviruses BKV and JCV (described in more detail in section
1.2.3) have recently been classified as “possibly carcinogenic to humans” by a WHO
International Agency for Cancer Research Monograph Working Group (75). Single case
reports link BKV infection to renal tubular as well as urothelial tumors in the context of
renal transplantation (76-78). However, other studies failed to detect BKV in these
malignancies, and a causal relationship is still under debate (79, 80). Some reports
indicate the presence of BKV DNA in lymphomas, colorectal, pancreatic, prostate and
brain tumors, but these associations are still controversial (81). In vitro and in vivo
experiments clearly support an oncogenic potential of both BKV and JCV. Inoculation of
either BKV or JCV into newborn rodents induces the formation of tumors in various
tissues, as has been observed in the cases of MPyV and SV40 (82).
1.2.3 Human polyomaviruses
The first human polyomaviruses BKV and JCV (BK and JC stand for the initials of the
patients from which they were isolated) were identified in 1971, and are closely related
to SV40 by phylogenetic analysis of T antigen sequences. BKV was isolated from the
urine sample of a renal transplant patient (83), whereas JCV was isolated from human
brain tissue with progressive multifocal leukoencephalopathy (84). BKV infection is
wide-spread throughout healthy individuals, with an early and rapid seroconversion of
over 50% in children 2 years of age, and over 90% in > 10 year old age groups (82). In
contrast, JCV seroconversion in the general, healthy population can be detected at later
stages in life. Compared to BKV seroreactivity, it increases much slower but steadily
over time, reaching 50-70% among older individuals (82).

14
In 2007, the two closely related human polyomaviruses KIV and WUV were
discovered in children with acute respiratory tract infections (85, 86). Their names
indicate the institutions at which they were identified: Karolinska intitute (KIV) and
Washington University (WUV). NCBI genome database analyses of deep sequencing
derived cDNA lbraries were used to detect non-human sequences and identify these
two novel viral genomes. Serologic studies have detected both KIV and WUV in a large
percentage of healthy individuals, with seroprevalence ranging from 55-98% depending
on age groups evaluated in various geographic locations (87-89). A slightly higher
prevalence is observed in immunosuppressed individuals, but thus far, experimental
evidence links neither KIV nor WUV to any disease phenotypes, and infection seems to
be asymptomatic (82).
Shortly after the identification of KIV and WUV, MCV was discovered in
association with MCC in 2008. MCV biology is the focus of this thesis and literature
reviews on MCC and MCV are described in subsequent sections 1.3 and 1.4.
Schowalter et al. investigated the presence of MCV on human skin by taking forehead
skin swabs, and not only revealed that MCV is frequently shed from healthy skin, but
also identified two novel human polyomaviruses also present on the skin, HPyV6 and 7
(90). Both of these viruses were less prevalent than MCV in the 35 skin samples tested
by rolling circle amplification (RCA) in this study (MCV = 14/35; HPyV6 = 5/35; HPyV7 =
4/35), and serologic evaluation of 95 serum samples revealed a seroprevalence of 69%
for HPyV6 and 35% for HPyV7 (90). Interestingly, a study testing the presence of
HPyV6 and 7 in MCV-negative MCCs did not find any association (91). At this point, no

15
disease development has been linked to HPyV6 or 7 infections, and further
experimental analyses are necessary.
RCA was also used to identify the 8th human polyomavirus called trichodysplasia
spinulosa-associated polyomavirus (TSV) in nose spicules collected from a transplant
patient suffering from trichodysplasia spinulosa (TS) (92), and this viral association was
subsequently confirmed (93). Seroprevalence of TSV was determined in 528 healthy
individuals, and ranges from 10% in children to 80% in older adults, with an average
seroreactivity of 70% (94). TSV viral protein expression is specifically associated with
affected hair follicles, suggesting a possible role of this virus in TS development (95,
96). Other disease associations have not been reported, yet, and require further
investigation.
In 2011, the 9th human polyomavirus (HPyV9) was identified by generic PCR
utilizing primers designed against conserved VP1 regions of known polyomaviruses.
Screening of 597 clinical samples not only detected the above-described human
polyomaviruses in 84 cases, but also identified HPyV9 in the serum of an
immunosuppressed kidney transplant patient (97). HPyV9 shares high homology with
the African green monkey lymphotropic polyomavirus (LPV), which may explain human
seroreactivity to LPV due to cross reactivity (98). Seroprevalence of HPyV9 lies
between 21-53% in healthy individuals, and disease associations have not been
reported at this point (98, 99).
In 2012, three independent studies identified the 10th human polyomavirus
referred to as Malawi polyomavirus (MWPyV) (100), human Polyomavirus 10 (HPyV10)
(101), or MX polyomavirus (MXPyV) (102). Siebrasse et al. identified this new

16
polyomavirus by shotgun pyrosequencing of DNA from virus particles isolated from a
stool sample from a healthy child from Malawi, and named it MWPyV (100).
Subsequently, they screened 514 diarrhea samples from children in the United States,
and found MWPyV present in 12 (2.3%) cases. The MWPyV viral genomes isolated in
the United States varied from the Malawi viral genome by 5.3% by nucleotide sequence
comparison (100).
In the same year, Buck et al. published the identification of HPyV10, which was
found to share 95-99% nucleotide identities with the MWPyV viral strains, and therefore
is considered the same virus (82, 101). HPyV10 was discovered by RCA on DNA
isolated from virions purified from condyloma samples from a patient suffering from a
genetic disorder known as warts, hypogammaglobulinemia, infections, and
myelokathexis (WHIM) syndrome (101). It is not clear whether HPyV10 infection
contributed to the development of warts in this patient, since papillomavirus 6 infection
was also found, which is known to cause genital warts.
Yet another group identified the 10th human polyomavirus in acute diarrheal
samples from children in the United States, Mexico and Chile in 2012 (102). The virus
was named MXPyV and its genome was found to contain almost identical nucleotide
sequence to MWPyV and HPyV10, confirming that these three independent viral
discoveries describe geographic variants of the same new member of the human
polyomavirus family (82, 102). MXPyV was found in 23 (3.4%) out of 834 fecal samples,
but not in blood or urine samples of immunocompromised individuals (102). Whether or
not the tenth human polyomaviruses is associated with diarrhea or other disease
phenotypes in humans remains to be elucidated.

17
In 2013, 454 pyrosequencing identified a novel polyomaviral genome in a stool
sample from a healthy child from Malawi (103), which was named STL polyomavirus
(STLPyV). It encodes for a 229 amino acid long T antigen splice variant (229T), which
utilizes distinct splice donor and acceptor sites downstream of the LT splicing sites
(103). STLPyV is closely related to MWPyV and subsequent PCR analysis indicates the
presence of this novel polyomavirus in pediatric stool samples from St. Louis as well as
Gambia. However, neither MWPyV nor STLPyV were detected in 237 fecal samples
from adult transplant patients. Disease associations with this novel human polyomavirus
remain to be explored.
Finally, HPyV12 represents the latest human polyomavirus identified to date (July
2013). It was identified by PCR using generic polyomavirus primers targeting the VP1
region (104). 242 specimens from various body sites were tested and a novel
polyomavirus genome with low homology (51-67%) to known polyomaviruses was
identified in 4 liver samples (104). Subsequent re-evaluation of the 242 samples by
PCR using HPyV12 specific primers revealed viral genome presence in 11% of liver
samples and to a lesser extent in organs of the gastrointestinal tract and feces (104).
Seroprevalence of HPyV12 lies at 12% in young children (2-5 years) with a rising
seroreactivity of 15-33% in older adults (104). Interestingly, HPyV12 is the first human
polyomavirus identified that lacks an LXCXE Rb family targeting domain. Disease
associations have to be evaluated in future studies.
Overall, it is noteworthy to mention that the past 6 years have brought about a
new era of human polyomavirus research with the discovery of 10 new human
polyomaviruses in addition to BKV and JCV. Two of the newly identified polyomaviruses

18
(MCV and TSV) have been convincingly linked to human disease. A great contribution
to these discoveries was the completion of the human genome project in 2003. It
allowed for the development of new techniques to identify non-human sequences in
diseased tissue, which ultimately lead to the identification of novel viral agents. Studies
that center on the epidemiology of polyomavirus infections in humans have revealed
that humans are frequently infected with multiple polyomaviruses from an early age (74,
87, 88, 94, 98, 99, 105). Multiple common human polyomaviruses are chronically shed
from the skin of healthy individuals (90), and have been identified in human serum,
urine, and cerebrospinal fluid, as well as nasopharyngeal, respiratory, and fecal
samples thus far (97, 100-102, 106, 107). Most human polyomaviral infections seem to
be asymptomatic, but further studies are needed to investigate possible disease
phenotypes. It is apparent that immunosuppression poses a risk factor in the
development of polyomavirus-induced malignancies such as MCC and TS. Given that
polyomaviruses seem to be part of normal human flora, it is likely that more human
polyomaviruses will be discovered in the future. Careful investigations are needed to
identify human diseases associated with common polyomaviral infections most likely in
the context of immunosuppression.

19
1.2.4 Genome organization
Polyomaviral genomes are composed of circular, covalently closed, double-stranded
DNA, and range from 4.6 kb to 5.4 kb in length. They are divided into three distinct
regions, which contain genome features common to all polyomaviruses: the non-coding
regulatory region (NCRR), as well as the early and late transcript regions. Early and late
designations refer to the timely expression of transcripts during the viral infectious cycle.
The NCRR, which divides early and late regions, contains the viral origin of replication
as well as early and late promoter elements. Early transcripts include T antigen
Figure 1. MCV, JCV, BKV , and SV40 T antigen splice isoforms The splicing patterns of JCV, BKV , and SV40 early regions are compared to MCV T antigen splice variants. Different colors represent individual T antigen isoforms: Orange (LT), Lavender (sT), and Green (additional virus unique isoforms). Dottet lines represent intronic regions and nucleotide positions are indicated with respect to genome position for each respective virus. (Modified from Gjoerup and Chang, 2010)
20
isoforms, which are expressed before the onset of viral replication. Late transcripts are
expressed afterwards and encode VP gene products involved in viral genome
packaging and capsid formation.
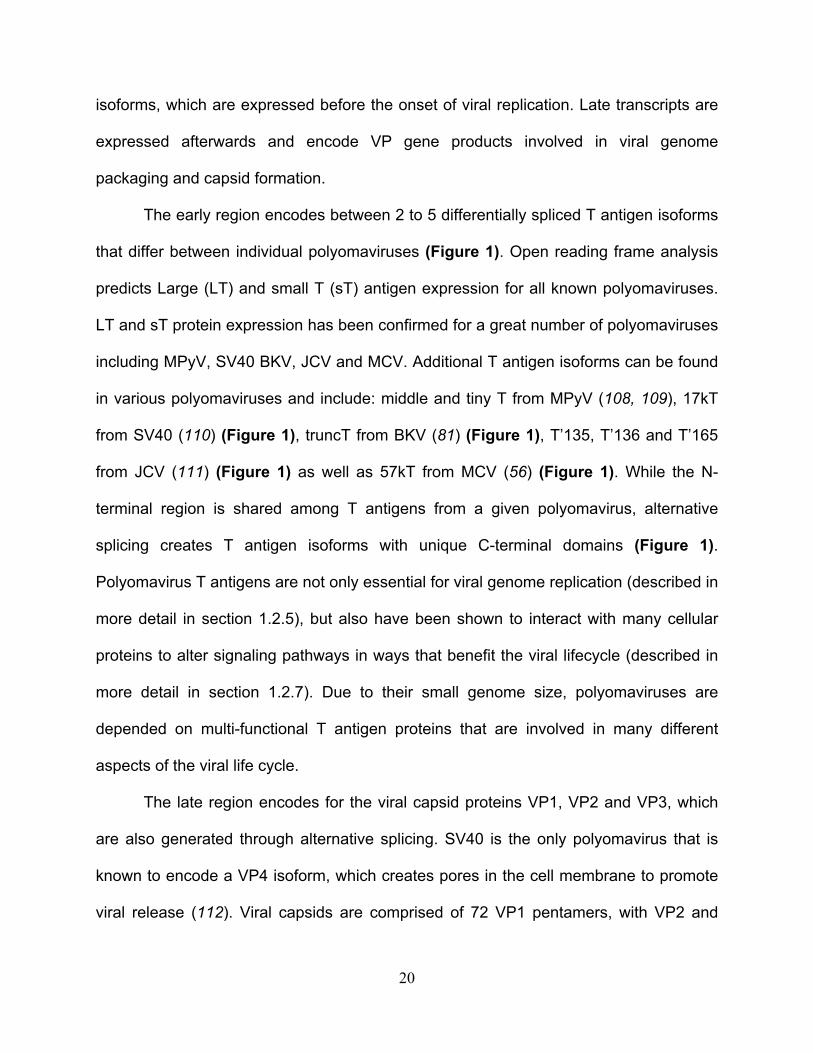
The early region encodes between 2 to 5 differentially spliced T antigen isoforms
that differ between individual polyomaviruses (Figure 1). Open reading frame analysis
predicts Large (LT) and small T (sT) antigen expression for all known polyomaviruses.
LT and sT protein expression has been confirmed for a great number of polyomaviruses
including MPyV, SV40 BKV, JCV and MCV. Additional T antigen isoforms can be found
in various polyomaviruses and include: middle and tiny T from MPyV (108, 109), 17kT
from SV40 (110) (Figure 1), truncT from BKV (81) (Figure 1), T’135, T’136 and T’165
from JCV (111) (Figure 1) as well as 57kT from MCV (56) (Figure 1). While the N-
terminal region is shared among T antigens from a given polyomavirus, alternative
splicing creates T antigen isoforms with unique C-terminal domains (Figure 1).
Polyomavirus T antigens are not only essential for viral genome replication (described in
more detail in section 1.2.5), but also have been shown to interact with many cellular
proteins to alter signaling pathways in ways that benefit the viral lifecycle (described in
more detail in section 1.2.7). Due to their small genome size, polyomaviruses are
depended on multi-functional T antigen proteins that are involved in many different
aspects of the viral life cycle.
The late region encodes for the viral capsid proteins VP1, VP2 and VP3, which
are also generated through alternative splicing. SV40 is the only polyomavirus that is
known to encode a VP4 isoform, which creates pores in the cell membrane to promote
viral release (112). Viral capsids are comprised of 72 VP1 pentamers, with VP2 and

21
VP3 buried internally (113, 114). When expressed alone, the major capsid protein VP1
forms virus-like particles (VLPs) that are successfully used in serological studies to
determine the prevalence of a given polyomavirus in a population.
1.2.5 Viral life cycle
The infectious cycle of polyomaviruses can be divided into 8 distinct phases (Figure 2).
The first step involves the interaction of the major capsid protein VP1 with the host cell
membrane. Host cell specificity depends on the receptors utilized by polyomaviruses,
which include ganglioside receptors with differentially linked sialic acids. SV40 has been
shown to bind to ganglioside GM1 (115, 116), whereas MPyV specifically interacts with
GD1a and GT1b (116). BKV utilizes GD1b as well as GT1b gangliosides (117), and
JCV has been shown to require both the 5HT2A family of serotonin receptors as well as
gangliosides with alpha 2-6–linked sialic acids to successfully infect cells (118). The
MCV mode of entry is still controversial. A 2009 report indicated that MCV VP1 binds to
GT1b, with the unique feature of binding sialic acids on both branches of this
ganglioside (119). However, subsequent studies refute the requirement of sialylated
glycans for MCV attachment to cultured cells (120, 121), and identified a linear Neu5Ac-
α2,3-Gal disaccharide as a specific MCV binding motif (120).
22
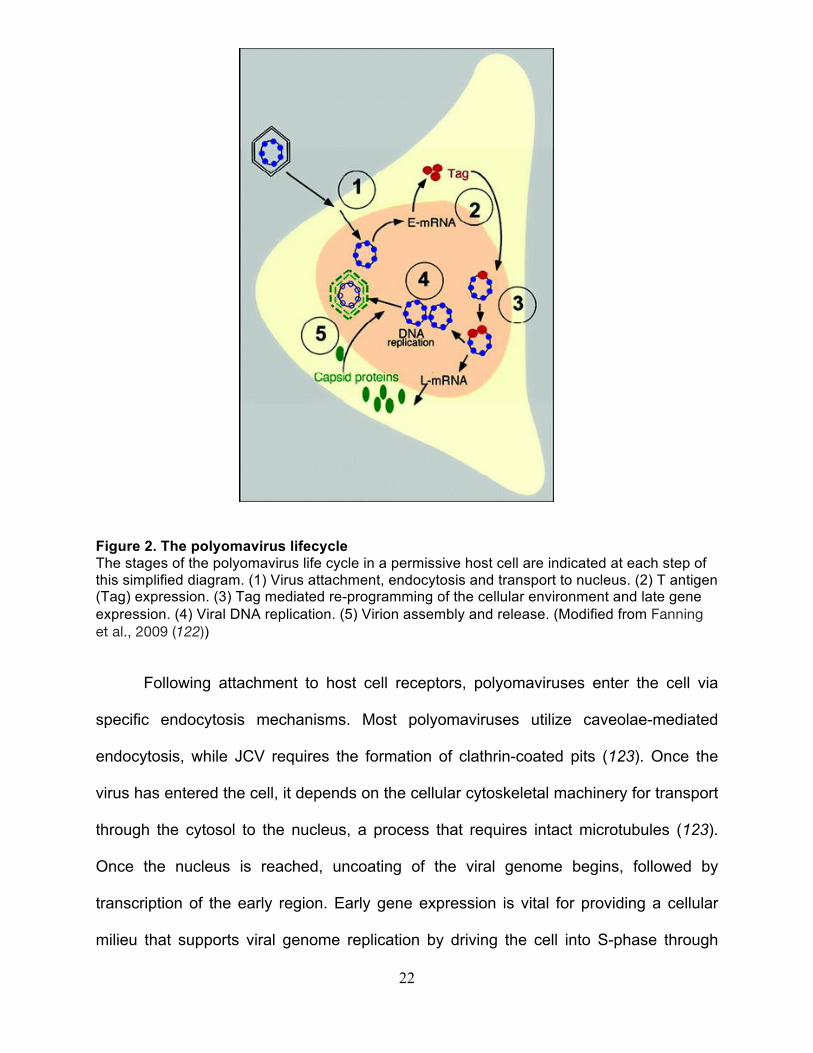
Figure 2. The polyomavirus lifecycle The stages of the polyomavirus life cycle in a permissive host cell are indicated at each step of this simplified diagram. (1) Virus attachment, endocytosis and transport to nucleus. (2) T antigen (Tag) expression. (3) Tag mediated re-programming of the cellular environment and late gene expression. (4) Viral DNA replication. (5) Virion assembly and release. (Modified from Fanning et al., 2009 (122))
Following attachment to host cell receptors, polyomaviruses enter the cell via
specific endocytosis mechanisms. Most polyomaviruses utilize caveolae-mediated
endocytosis, while JCV requires the formation of clathrin-coated pits (123). Once the
virus has entered the cell, it depends on the cellular cytoskeletal machinery for transport
through the cytosol to the nucleus, a process that requires intact microtubules (123).
Once the nucleus is reached, uncoating of the viral genome begins, followed by
transcription of the early region. Early gene expression is vital for providing a cellular
milieu that supports viral genome replication by driving the cell into S-phase through

23
interactions with various cellular proteins (described in detail in section 1.2.7). LT
assembles into a hexameric helicase unit that initiates bi-directional replication from the
viral origin in the NCRR (124). After complete viral DNA replication, LT subsequently
inhibits early gene expression, while promoting late gene transcription. Capsid protein
expression leads to capsid assembly and viral genome encapsidation. The new viral
progeny then lyses the cell and exits to infect more cells. A simplified diagram of the
polyomavirus lifecycle is depicted in Figure 2.
1.2.6 Permissive vs. non-permissive infection
The successful completion of the viral life cycle depends on several host cell factors,
and can therefore only be accomplished in the appropriate cell type of the species that
is considered the natural host for the virus (permissive cell). Factors that influence
species tropism include available receptor molecules on the cell surface (as described
in section 1.2.5) as well as the appropriate DNA replication machinery to facilitate viral
DNA synthesis. Viral DNA replication requires the cooperation of T antigen with cellular
replication factors including replication protein A (RPA) and DNA polymerase alpha
primase (polα) (125). The Pol interaction in particular has been shown to be functional
in a species-specific manner (126). SV40 genome replication for example cannot
successfully proceed in rodent cells (non-permissive), due to insufficient primosome
assembly and primer synthesis on SV40 origin DNA (126). Therefore, only infection of a
permissive cell leads to virion production followed by cell lysis (Figure 3A).

24
Figure 3. Possible outcomes of SV40 infection in different cell types (A) Infection of a permissive cell results in virus particle production and cell lysis. (B) SV40 infection of some rodent cells fails to support viral DNA replication or virion production and eventually leads to loss of the viral genome. (C) Infection of a non-permissive cell rarely leads to integration of the viral genome into the host genome generating a stably transformed clone. (Modified from Ahuja et al., Oncogene 2005)
There are two possible outcomes upon infection of a non-permissive cell type
(Figure 3 B-C). SV40 infection of rodent cells for example results in expression of the
early region T antigens, while the late transcripts and virion production are missing. T
antigen expression leads to an increase S-phase entry followed by mitosis, which
promotes cell proliferation even in quiescent mouse fibroblasts. Since the viral genome
cannot be replicated, the majority of rodent cells infected with SV40 will initially go
through increased rounds of proliferation, but eventually lose the viral DNA through

25
step-wise dilution or degradation, and revert to their normal state (127) (Figure 3B).
Various cell types allow for polyomavirus entry upon infection, but fail to support the late
phase of the infectious cycle resulting in what is called an abortive infection.
Infection of a non-permissive host cell can also involve the integration of viral
genomic DNA into the host cell DNA, which provides a mechanism to pass on the viral
genome to daughter cells even after multiple cell division cycles (Figure 3C). During
this process, which is considered a “biological accident” because it is a dead end
scenario for the virus, the viral DNA integrates randomly with regards to the cellular as
well as the viral genome. Integration events that preserve intact T antigen sequences
promote T antigen driven cell proliferation, and in the context of a replication defective
environment can result in the outgrowth of transformed clones (128). With regards to
MCV induced tumorigenesis, viral genome integration is a signature feature in MCC,
indicating that even though humans are considered the natural host for MCV, Merkel
cells may not be a permissive cell type and therefore are susceptible to transformation.
Details about MCV genome integration in MCC can be found in section 1.5.4.
1.2.7 Cell transformation assays
Polyomaviruses provide excellent tools for studying the molecular basis of neoplastic
transformation, which is characterized by the extended proliferation potential or
increased survival of a cell (127). In cell culture systems it is possible to evaluate the
effects that viral proteins have on the host cell, and determine specific cellular pathways
that contribute to the transformation phenotype. The SV40 interactions with host cell
proteins described in section 1.3.1 have been useful in identifying genes that are altered

26
in many human cancers (for example p53), highlighting the relevance of studying
tumorviruses like SV40. Cellular pathways perturbed by SV40 (described in section
1.3.1) have been assessed for their contributions to oncogenic transformation by a
number of different in vitro and in vivo assays described below.
1.2.7.1 Loss of contact inhibition
Focus formation assays demonstrate the loss of contact inhibition that can be observed
in cancer cells of diverse origins. Upon oncogenic signaling, adherent cells that usually
would grow in a one cell-thick monolayer start to pile-up and grow on top of each other,
forming visual foci on the dish. SV40 transformed rodent fibroblast cells readily form foci
when co-cultured with, or plated on top of a monolayer of non-transformed, growth-
arrested cells (127). In addition to focus formation, saturation density measurements
can also indicate loss of contact inhibition. Transformed cells exceed the maximum
number of cells per unit area and fail to undergo growth arrest upon contact with
adjacent cells.
1.2.7.2 Immortalization
Primary cells cannot be passaged in culture indefinitely. After a certain number of
population doublings, they undergo growth arrest and senesce irreversibly. Rodent
fibroblasts that are infected with SV40, however, are capable of dividing indefinitely, and
are considered immortalized (127). Human fibroblasts on the other hand do not behave
this way upon expression of SV40 T antigens, and require additional expression of
human telomerase reverse transcriptase (hTERT) to maintain telomere length and
escape senescence (127).

27
1.2.7.3 Anchorage-independent growth
Soft agar growth has been established as another in vitro technique that tests the
oncogenic potential of cells. In this assay cells are plated in a semi-solid agar medium in
which non-transformed cells cannot grow. Cancer cells however, are able to grow
anchorage-independently in this soft agar environment, forming sphere-like clumps
called colonies. Cell transformation studies using rodent fibroblast cells have identified
several polyomaviruses that are capable of inducing soft agar growth in addition to
focus formation and immortalization (127, 129-131).
1.2.7.4 Growth under nutrient deprivation
In addition to focus formation and soft agar assays, serum starvation through culture
medium provides insight into another characteristic specific to cancer cells, which is
growth under nutrient deprivation. Non-cancerous cells usually stop dividing when they
are placed in an environment with decreased serum growth factors (growth conditions
are typically changed from 10% to 1 or 0.1% serum). Transformed cells however still
continue to proliferate, overcoming environmental signals that would normally indicate
growth arrest.
1.2.7.5 Tumor formation in animal hosts
The ultimate experimental evidence that supports the presence of a cellular transformed
state is growth after xenograft transplantation into an immunocompromised host. In
mouse experiments, cell lines are often injected subcutaneously and monitored for
tumor formation at the site of the injection. However, transformed cells do also
metastasize and form nodules at other body sites indicating an increased

28
aggressiveness of the transformed clone. Non-transformed cells do not grow in a
xenograft setting due to a competitive environment for nutrients and blood supply with
the host’s cells that has to be overcome to settle into a niche and support the growth of
a colony of cells. Xenograft experiments are especially useful in pre-clinical studies
(such as described in Appendix A and B), to test drug efficacy and dosing regimens for
cancers where a transgenic model is not available. Transgenic models that have been
established for SV40 T antigen expression are described in detail in section 1.3.2.

29
1.3 SV40 EARLY REGION
1.3.1 SV40 T antigen interactions with cellular proteins
SV40 is one of the most well studied tumor viruses, and since its discovery in the late
1950’s a wealth of information has been collected that has uncovered important
pathways involved in basic cell biology. In its natural host the rhesus macaque, SV40
infects quiescent epithelial cells in the kidney, which enter the cell cycle upon SV40 T
antigen expression (127). An important feature of SV40 T antigen expression therefore
includes its effect on cellular S-phase entry to create an environment that allows for viral
genome replication. Highlights from studies of SV40 interactions with cellular proteins
include the discovery of the important cellular tumor suppressor p53 and dissection of
the retinoblastoma protein (pRB) pathway (132-135). In addition, SV40 LT has been
shown to interact with a number of other cellular targets including p107, p130,
p300/CBP, Hsc70, Cul7, Bub1, IRS1, and FBW7 (Figure 5) (136-145).
1.3.1.1 SV40 LT interaction with Rb family
It is well established that SV40 as well as all other polyomaviral large T antigens contain
an LXCXE consensus motif, which targets the Rb family proteins pRB, p107 and p130.
Other oncoproteins from various tumorviruses (HPV E7, Adenovirus E1A, or KSHV
LANA2) also share this common motif, emphasizing the importance of the Rb pathway
in regulating cellular growth (146, 147). Rb family members control the cell cycle by

30
inhibiting the E2F transcription factors including E2F1, E2F2, and E2F3a (activating
factors) as well as E2F4 and E2F5 (repressive factors). E2F-responsive genes are
involved in many pathways including cell cycle control, apoptosis, DNA repair and
replication as well as nucleotide synthesis.
The repressive E2F factors 4 and 5 preferentially bind p130 within a large
complex called the DREAM complex that inhibits responsive promoters during G0 and
in quiescent cells (148). The E2F4/5-p130 complex is also thought to recruit histone
deacetylase (HDAC) to promoters, which additionally represses transcription through
chromatin remodeling (149). SV40 LT can disrupt this repressive complex by targeting
p130 for degradation, which allows for activation of genes involved in cell cycle entry
(150) (Figure 4A). The ubiquitination and consequent degradation of p130 depends on
chaperone functions mediated by the DnaJ domain of LT, which recruits cellular Hsc70
(151, 152).
In addition to mitigating E2F repressive effects, LT also induces transcription of
E2F target genes by releasing activating E2Fs. E2F1/2/3a factors are usually bound to
hypophosphorylated pRb until cyclin/cyclin dependent kinase complexes phosphorylate
Rb (153). LT binding to pRb releases E2F1/2/3a resulting in E2F-mediated transcription
of genes involved in S-phase entry, which contributes to LT mediated cell proliferation
and transformation (Figure 4A). The exact role of p107 in cell cycle progression is less
well understood.
1.3.1.2 SV40 LT interaction with p53
To prevent abnormal S-phase entry and maintain genome integrity, cells have
established mechanisms to intervene with aberrant up regulation of E2F targets. This

31
process usually involves an increase in p53 protein level, which is generally low in cells
due to p53 ubiquitination by Mdm2 (154). Activation of p53 by DNA damage, oxidative
stress, or oncogene signaling leads to p53 stabilization and phosphorylation/acetylation,
which allows for the transcriptional activation of genes involved in apoptosis and
senescence (155). SV40 LT binds the p53 DNA binding domain through a bipartite site
Figure 4. Targeting of the Rb-E2F and p53 pathways by SV40 LT (A) SV40 LT inhibits Rb-family pocket proteins pRb, p107 and p130 through its LXCXE motif. This leads to release of E2F transcription factors, which activate genes that induce S-phase entry. (B) Aberrant cell cycle entry leads to p53 activation to facilitate DNA repair or induce apotosis. SV40 LT counteracts this by binding to p53 and inhibiting activation of p53 responsive genes. (Modified from Sáenz Robles and Pipas, Ann. Rev. Microbiology, 2013)

32
in its C-terminal ATPase domain (residues 351-450 and 533-626), which prevents
tetramerization of p53, and therefore prohibits its transcriptional activity (156) (Figure
4B). In contrast to other viral oncoproteins that either target p53 for proteasomal
degradation (i.e. HPV E6) (157) or repress its transcription (i.e. adenovirus E1B 55k)
(158), SV40 LT stabilizes p53 levels in the cell, while inactivating its transcriptional
activity (159). In 1979, p53 was discovered in complex with SV40 LT (135, 160), and it
was initially mistaken for an oncogene due to its increased protein level in SV40
transformed cells.
Even though it is clear that SV40 inactivates p53-mediated apoptosis in response
to aberrant S-phase entry, the complete extent of the LT-p53 interaction still remains to
be worked out. p53 has a diverse range of downstream targets, some of which may be
involved in different aspects of the SV40 cellular reprogramming (161). Studies that
evaluated the growth promoting effects of SV40 LT in rodent cells discovered that
transformation efficiency was markedly reduced in the absence of wildtype p53,
indicating a gain-of-function modality for the SV40 LT interaction with p53 (162). Results
from a transgenic model of SV40 LT induced beta cell carcinogenesis (Rip1Tag2)
support this data, with lower tumor volumes observed in mice crossed to p53 deficient
mice (163). The possible role of a gain-of-function by redirecting wildtype p53 activity
may also explain why SV40 LT does not degrade p53 protein, but instead stabilizes it.
One explanation that has been proposed is that LT binds wildtype p53 to recruit the
CREB binding protein (CBP)/p300 coactivators to allow for posttranscriptional
modification (acetylation) on LT (164). The significance of this modification or other
functions achieved by the LT-p53 complex remains to be identified.

33
1.3.1.3 Other SV40 LT cellular targets
In addition to the pRb family proteins and p53, SV40 LT interacts with a number of other
cellular proteins, demonstrating its multifunctional nature (Figure 5). Several of these
interactors have been implicated in LT-mediated transformation. The following
paragraphs provide a brief overview of the additional SV40 LT cellular targets.
Figure 5. SV40 LT domains and cellular interactors SV40 LT is a multifunctional protein that binds to a variety of cellular interactors through conserved motifs. Cellular binding partners are indicated in brackets (orange letters) and their respective amino acid binding sites on LT are shown (black numbers). (Modified from Gjoerup and Chang, 2010)
J Domain
The N-terminal region of SV40 T antigen, shared by both LT and sT, contains a J-
domain ranging from amino acids 1 to 82 (165), which is functionally conserved in all
polyomavirus T antigens. The J domain is similar to that of molecular chaperones called
DnaJ proteins, which interact with cellular heat shock (Hsc) proteins to mediate
chaperone functions including protein folding and transport. The J domain of SV40 and
other polyomaviral T antigens consists of a conserved HPDKGG motif and the CR1-like

34
region (141). The CR1 motif is similar to that found in adenovirus E1A and contributes
to cellular transformation. E1A targets pRb and p300 through its CR1 (166) but this has
not been confirmed for polyomavirus T antigens, for which the cellular target of this
region remains to be discovered.
Both LT and sT bind to the cellular DnaK family member Hsc70 through the
HPDKGG motif and this interaction is important for both viral replication as well as
transformation functions of T antigen (141). The ATPase activity of Hsc70 is required for
LT binding to pRb, p107 or p130 by releasing heterodimeric E2F-DP complexes, which
are then freed to facilitate cell cycle progression (141, 142, 152). The sT interaction with
Hsc70 facilitates sT binding to the heterotrimeric protein phosphatase 2A (PP2A) by
replacing its regulatory B subunit (141). Mutations of the HPDKGG motif reveal the
importance of this domain for viral replication and transformation. D44N and H24Q are
two classic mutants that are used in molecular studies to study the significance of this
motif. The D44N mutant does not bind Hsc70, is defective for viral replication, and
shows decreased transforming activity (141).
CBP/p300
Cyclic AMP response element binding (CREB)- protein (CBP) as well as p300 are
cellular tumor suppressors that possess intrinsic histone acetylase (HAT) activity
through which they mediate a wide range of cellular processes involved in cell growth
and transformation (167). SV40 LT binds to the co-activators CBP/p300 (168) and this
interaction contributes to the transforming activity of LT (137) through an unknown
mechanism (150). The association of LT with CBP/p300 leads to acetylation of LT on

35
residue K697 through CBP and is dependent on LT binding to p53 (164, 169). The
significance of K697 acetylation remains to be elucidated. Adenovirus E1A also binds
CBP/p300 resulting in a changes in histone modification patterns (170) and global re-
localization of RB family members and CBP/p300 on cellular promoters (150). This
leads to a change in the cellular transcriptional program that results in cell cycle entry
and progression (150, 171). SV40 LT can rescue non-transforming E1A mutants that
are incapable of binding to CBP/p300 (143), indicating a similar role for SV40 LT on
chromatin remodeling and transcriptional reprogramming.
p400
The chromatin remodeling ATPase p400 is a member of the SWI2/SNF2 family of
proteins. Adenovirus E1A binds to p400 as well as the scaffolding protein TRRAP,
which results in stable association of p400 with c-Myc and subsequent stabilization of c-
Myc protein levels (172). This increase of c-Myc protein results in transcriptional
activation of c-Myc target genes in the presence of E1A (172). SV40 LT has been
shown to bind to p400 as well (144), but the significance of this interaction with regards
to T antigen mediated transformation is not well understood.
Cul7
The molecular scaffold cullin 7 (Cul7) is part of an SCF (Skp1, cullin, F-box) E3 ubiquitin
ligase complex containing Skp1, ROC1 and Fbw8, which targets specific cellular
proteins for proteasomal degradation (173). Cul7 was first identified in association with
SV40 LT (amino acids 69-83) and LT mutants incapable of binding Cul7 are defective in

36
transformation assays even though binding to pRB and p53 remains unchanged (138,
174). Cellular proteins that are targeted for degradation through Cul7-SCF complexes
include cyclin D1 (175) as well as insulin receptor substrate 1 (IRS1) (176). Further
studies are needed to determine whether or not alterations in the degradation of these
two known Cul7-SCF targets is essential in LT mediated transformation.
Bub1
The mitotic checkpoint kinase Bub1 ensures appropriate attachment of kinetochores to
microtubules during the metaphase to anaphase transition (177). A yeast two-hybrid
screen discovered Bub1 as a cellular binding partner of SV40 LT and genetic mapping
experiments revealed LT amino acid residues 89-97 as the responsible interaction
domain (139). Other polyomaviral T antigens that share the Bub1 binding site include
JCV, BKV, and bovin polyomavirus LTs. Bub1 inactivation by SV40 LT de-regulates the
cellular DNA damage response (178) and results in cellular senescence in the absence
of pRb and p53 targeting by LT (179).
IRS1
Insulin receptor substrate 1 (IRS1) is a docking protein for both insulin and insulin
growth factor-I receptor (IGF-IR) (180) whose downstream signaling involves PI3K/Akt
activation (181). SV40 LT binds to IRS1 and this interaction is required for efficient
transformation by LT (180). While LT is incapable of transforming IRS1 deficient cells,
its transforming activity can be restored by exogenous expression of wildtype IRS1;
however, IRS1 that is mutated in its PI3K binding site does not restore transformation.

37
Both SV40 as well as JCV LTs have been shown to interact with and translocate IRS1
from the cytoplasm to the nucleus (182, 183).
Nbs1
The Nijmegen breakage syndrome 1 (Nbs1) protein is part of the MRN complex, which
is composed of Mre11, Rad50 and Nbs1. This complex has been implicated in DNA
double-strand break repairs (184) and its dysfunction due to Nbs1 mutations in the
Nijmengen breakage syndrome leads to chromosomal instability, which in turn
increases cancer incidence. SV40 LT binds to Nbs1 through its origin-binding domain,
which facilitates unlicensed firing of the viral origin (185). Whether or not the LT-Nbs1
interaction is important for transformation remains to be uncovered.
Fbw7
The F-box protein Fbw7 is the substrate recognition component of the SCF-Fbw7
ubiquitin ligase complex that targets specific proteins for degradation by the
proteasome. Known targets of this complex include cyclin E (186), c-Myc (187), c-Jun
(188), and Notch (189). SV40 LT binds to Fbw7 through a conserved Cdc4 phospho-
degron (CPD) site that usually binds cellular target proteins (190). Despite binding to
this site LT does not get degraded and is thought to compete with cellular targets such
as cyclin E (190), which are stabilized in the presence of LT due to decreased targeting
by the SCF-Fbw7 complex. Given that Fbw7 regulates the proteolysis of a number of
oncoproteins, SV40 LT targeting of the SCF-Fbw7 complex likely plays a role in its
transformation activity.

38
1.3.1.4 SV40 sT
SV40 sT shares the N-terminal portion (82 amino acids) with LT, which includes a
functional J domain (described in section 1.3.1.3). sT is a 147 amino acid long protein
that can be found in both the nucleus as well as the cytoplasm. The C-terminal region is
unique to sT and contains two Zinc-binding CXCXXC domains that provide
conformational stability (191) (Figure 6).
Figure 6. SV40 sT domains and cellular interactors Cellular binding partners of SV40 sT are indicated in brackets (orange letters) and their respective amino acid binding sites are shown (black numbers). (Modified from Gjoerup and Chang, 2010)
SV40 sT cooperates with LT to fully transform cells. Rodent cells that only
express LT acquire lack of contact inhibition and form foci, but they do not grow
anchorage independently without the presence of sT (192, 193). Human cells require
oncogenic signaling events in addition to LT and sT expression to become transformed.
Hahn et al. demonstrated that BJ fibroblast cells that expressed LT and sT were
anchorage independent and grew in immuocompromised mice only in the presence of

39
human telomerase reverse transcriptase (hTERT) as well as mitogenic hRas (V12
mutant) (194). The contribution of sT to transformation depends on sT’s interaction with
the protein phosphatase 2A (PP2A).
PP2A is a ubiquitously expressed heterotrimeric serine-threonine protein
phosphatase that is involved in various proliferation and apoptosis related signaling
pathways within the cell. It is composed of a scaffold subunit A, a regulatory subunit B,
and a catalytic subunit C. The PP2A holoenzyme can be composed of different
variations of splice isoforms of the individual subunits. Subunit A and C each have two
splice variants α and β, whereas at least 20 different B subunits have been identified
thusfar (195). Combinations of the different subunits can assemble into over 100
different complexes, with the B subunits conferring substrate specificity (195, 196).
SV40 sT binds to the scaffolding subunit A through sT-unique residues 97-103
(197). This interaction inhibits binding of the B subunit in a concentration dependent
manner, and compromises PP2A activity (195, 198). In addition to the direct interaction
of sT with PP2A through residues 97-103, the J domain of sT, located in the N-terminal
region of sT, directly contributes to PP2A B subunit displacement and sT binding to the
A subunit (198). sT preferentially inhibits certain subsets of PP2A complexes but the
nature of how this selection process occurs is still poorly understood (199). Cellular
targets that are altered by PP2A inhibition by sT include c-Myc, which is stabilized
through S62 dephosphorylation (200), as well as Akt, which gets phosphorylated
leading to mTOR pathway activation and increased cap dependent translation (201,
202). sT targets a variety of cellular kinases involved in cell proliferation that are
controlled by PP2A. Examples of these in addition to Akt include MAP kinase signaling

40
(203) and PKCξ activation, which in turn leads to NFκB activation (204). The fact that
PP2A regulates more than 30 kinases in the cell indicates that sT may have access to
control a wide range of signaling pathways, which are likely to contribute to sT-mediated
transformation.
1.3.2 SV40 transgenic mouse models
Transgenic mouse models are powerful tools to study the contribution of specific
genetic elements to tumor formation in an animal host. They provide the opportunity to
analyze transgene expression in specific tissue types and at different stages during
development. The SV40 early region has been expressed in a variety of tissues in the
mouse. Depending on the specific tissue environment, expression of LT, sT, or both can
lead to the development of hyperplasia, dysplasia, carcinoma, or even malignant
metastatic disease (127, 205). On the other hand, some tissues show no proliferative
stimulation at all, underscoring the importance of the specific cell type for tumorigenesis
(199). A well-characterized SV40 transgenic mouse model targets LT expression to the
choroid plexus epithelium (CPE) in the brain, which leads to rapid tumor formation
(206). The aggressiveness of this particular tumor development is emphasized by the
short life expectancy of only 1-2 months in this mouse model.
Functional dissection of LT domains responsible for tumor development in this
model revealed that expression of a N-terminal fragment including amino acids 1
through 121 (LT1-121) is sufficient for tumor development; however, tumors progress
much slower compared to full length LT (207, 208). This observation can be attributed
to the p53 targeting domain, which is present in full length LT but not in LT1-121. p53

41
targeting by full length LT prevents the induction of apoptosis by LT expression, and
therefore promotes more rapid tumor development (209, 210). Consequently, in a p53
deficient mouse strain, expression of LT1-121 is able to induce tumor development at
the same rate as full length LT (210). The LXCXE Rb family-targeting domain is
essential for tumor development in the context of LT1-121 expression, highlighting the
importance of pocket protein inhibition for malignant progression in vivo. These results
point out that while Rb family targeting is required for cell proliferation through
promoting cell cycle entry and progression, p53 targeting prevents subsequent
apoptosis induction due to checkpoint activation in response to abnormal cell cycle
entry. Therefore, full malignant tumor development in the CPE requires both, the Rb as
well as p53 targeting domains of LT. This was confirmed in the mammary gland, where
expression of LT1-121 induces tumors to a lesser extend than full length LT due to p53
mediated apoptosis induction (211). In addition, p53 targeting by full length LT is also
required for the formation of B and T cell lymphomas in respective transgenic model
systems (207, 208).
Interestingly, the requirement of p53 inactivation for tumorigenesis highly
depends on the specific cell type that is targeted for transgenic LT expression. In
intestinal enterocytes for example, LT1-121 or LT1-136 expression induces hyperplastic
development that progresses to dysplasia with age (212) and this is unchanged in a p53
deficient background (213, 214). Hyperplasia development in enterocytes is however
dependent on an intact LXCXE Rb family-targeting motif as well as a functional J
domain, both of which collaborate to bind to pocket proteins and release E2F
transcription factors, which in turn promote cell cycle entry and progression. Microarray

42
analysis in the context of full length LT and LT1-136 expression in enterocytes revealed
that the transcriptional profile was almost identical, emphasizing the essential role of the
Rb-E2F axis for hyperplastic development in the intestine (153). Other cell types in
which p53 targeting by full length LT is dispensable include astrocytes, the pancreatic
epithelium as well as hepatocytes. In astrocytes, induction of apoptosis by LT
expression is mediated through PTEN. Expression of LT1-121 in the context of PTEN
loss accelerates astrocytomas in this transgenic model (215). Similar results can be
observed in the pancreas, where tumor evolution is associated with PTEN loss and
does not depend of p53 inactivation by LT (216). In a liver specific transgenic model, a
functional J domain and intact Rb family-targeting domain are sufficient to induce
hepatocellular carcinomas upon expression of LT1-121 (217).
Overall, it is clear that SV40 LT targeting of the Rb-E2F pathway is necessary for
tumor formation in all cell types tested thus far. In contrast, p53 inactivation by LT is
dispensable in some cell types. There are several possibilities that could explain
heterogeneous requirements for tumor formation in different cell types. It may be
possible that LT interacts with diverse sets of proteins in different cell types, which in
turn have differential affects on tumor formation (205). On the other hand, it is also
possible that LT interacts with the same cellular proteins in all cell types, but that the
signaling pathways that these proteins are involved in are regulated differently in each
cell type (205). Either way, SV40 T antigen transgenic mouse models undoubtedly
recapitulate the heterogeneity of the disease they are modeling, which is cancer.

43
1.4 MERKEL CELL CARCINOMA
1.4.1 Origin and pathology
The first description of Merkel cells (MCs) dates back to 1875, when the German
pathologist Friedrich Sigmund Merkel identified them as “Tastzellen” or “touch cells”
(51). Merkel’s early observations already predicted the mechanoreceptor function of
MCs and their role in sensory sensation in the skin, which was established much later
(218). Located in the basal layer of the epidermis and hair follicle bulges, MCs are
closely associated with nerve endings, which is essential in their function of transmitting
mechanical stimuli (219) (Figure 7).
For a long time, the exact cellular origin of MCs was a topic heavily debated, but
recent lineage-tracing studies indicate that MCs arise from epidermal stem cells rather
than neuronal progenitors (220). MCs give rise to Merkel cell carcinoma (MCC), an
aggressive, cutaneous neoplasm, which resembles both basal cell carcinoma and small
cell lung carcinoma (SCLC) in its morphology (221, 222). Interestingly, MCC is positive
for both epithelial as well as neuroendocrine markers. The most distinguishing
immunohistochemical markers that are used in the identification of MCC in the clinic
include perinuclear staining of cytokeratin 20 (CK20) (Figure 8B), and negative staining
for thyroid transcription factor-1 (TTF-1) as well as leukocyte common antigen (LCA)
(223).

44
Figure 7. Location of Merkel cells Merkel cells (in light blue) are located in the basal layer of the epidermis as well as hair follicle bulges, where they make connections with nerve endings. (Modified from Spurgeon and Lambert, Virology, 2013)
1.4.2 Incidence and clinical manifestation
MCC is more common in immunosuppressed individuals such as AIDS and transplant
patients as well as the elderly (53). The chance of developing MCC is increased 13-fold
in AIDS patients compared to the general population (52). Ultraviolet (UV) exposure
poses an additional risk factor for developing MCC, as is seen in melanoma and other
skin cancers (224). The majority of MCC patients are Caucasian with a slightly higher
frequency in males (225). MCC incidence has risen within the past two decades
reaching approximately 1,500 cases per year in the United States (226). Elevated UV
exposure in many parts of the world as well as increasing older populations may result
in even more MCC cases in the future. Potentially due to its association with UV

45
radiation, MCC often arises in the extremities including legs, arms, and the head.
Figure 8C depicts a MCC lesion on the arm of a patient.
Figure 8. Pathology and clinical manifestation of MCC (A) Hematoxylin and Eosin (H&E) and (B) diagnostic cytokeratin (CK) 20 perinuclear stain of MCC tumor tissue (C) Red MCC nodule on a patient arm. (Modified from Chang and Moore, Annual Review of Pathology, 2012)
Clinically, MCC is divided into four stages classifying disease severity and
prognosis (227). Stages I and II include cases that present as local lesions at the
primary site on the skin. Stage I encompasses lesions up to 2 cm in diameter, and stage
II includes lesions that exceed this 2 cm mark (228). MCC cases that involve metastasis
to local lymph nodes are classified as stage III. Stage IV, the most severe form, consists
of metastatic MCC beyond the lymph nodes (228). Staging at diagnosis predicts
disease outcome, and determines the treatment regimen. Survival of MCC patients
depends on the stage of the tumor at diagnosis. Patients that are diagnosed with stage I
MCC have a 5-year survival average of 60%, whereas only 18% of stage IV patients
survive 5 years (229). These statistics highlight the aggressiveness of MCC as well as
the limited treatment options of progressed disease stages.

46
1.4.3 Treatment
The standard treatment regimen for local MCC primary tumors includes wide surgical
excision followed by adjuvant radiotherapy. In addition, sentinel lymph node biopsies
are necessary to evaluate regional metastases, which are treated by complete lymph
node resection followed by radiation therapy (227). There is a high recurrence rate of
30-40%, and primary tumors frequently metastasize to distant sites (230). Distant
metastatic MCC as well as inoperable primary tumors are often treated with
chemotherapeutic regimens used for SCLC patients. Chemotherapeutics used for MCC
include a combination therapy with doxorubicin, cisplatin, and vincristine, or with
platinum and etoposide (231). These treatment regimens yield a good response only
within the first 8 months, resulting in a poor survival prognosis (231). The median
survival time for patients with advanced disease is only 10 months. For a long time, the
lack of knowledge about the molecular pathways involved in MCC hindered the design
of a more targeted chemotherapeutic treatment regimen. However, with the 2008
discovery of MCV as the causative agent of the majority of MCC (55), new studies have
already utilized this viral etiology as a target for therapy in pre-clinical studies (232)
(detailed description in Appendix A and B).
1.4.4 Molecular features
Several studies have found karyotypic abnormalities in MCC. These include deletions or
rearrangements in chromosomes 3p, 4, 5q, 7, 10q, 13q and 17q, as well as
amplifications of 1q, 3q, 5p, 6 and 8q (233-235). Even though chromosomal aberrations

47
are not consistent across MCC cases, genetic elements that may potentially play a role
in tumorigenesis include L-Myc as well as pRB1 (235). However, studies linking these
abnormalities to the development of MCC are missing.
Gene mutations involved in oncogenic or tumor suppressor signaling have also
been evaluated as potential links to MCC. The tumor suppressor p53, which is
frequently mutated in skin cancers due to UV exposure (236), is mutated only in a
subset of MCC, with a large number of MCC tumors having wildtype p53 sequence
(237, 238). Both Ras (Ha-, Ki- and N-Ras) and CDKN2A (INK4a-ARF locus encoding
p14 and p16) point mutations have been implicated in skin tumorigenesis including
squamous cell carcinoma (SCC) and melanoma (239-241). In the case of MCC
however, neither could be detected thus far (237, 242).
Activating B-raf mutations, which can be observed in melanoma as well as other
human cancers (243), were not present in a study that tested 49 MCC cases; in
contrast, classical MAP kinase signaling was reported as silenced in this set of MCC
(244). Additionally, the Wnt/βcatenin pathway as well as c-Kit expression have been
evaluated in MCC for possible mutations; however neither show consistent de-
regulation that could explain tumorigenic development (245, 246). Finally, expression of
the anti-apoptotic protein Bcl-2 was reported in 15 out of 20 MCC cases (247, 248),
which may explain evasion from apoptotic cell death, but does not indicate pathways
involved in cell proliferation in MCC.
Up until 2007, many studies identified pathways that are not involved in MCC
tumorigenesis; however, the molecular signaling that does play a role in MCC was still a

48
mystery (226). This all changed with the 2008 discovery of an infectious agent
associated with MCC.

49
1.5 MERKEL CELL POLYOMAVIRUS
1.5.1 Discovery of MCV
In 2008, Feng et al. reported the discovery of a clonally integrated polyomaviral genome
present in 8 out of 10 MCC samples tested (55). In this study, DTS was used to screen
MCC cDNA libraries for the presence of non-human sequences, which could indicate
the presence of a viral agent. Two MCC cDNA libraries were created from a total of 4
MCC tumor samples and pyro-sequencing generated a total of 216,599 and 179,135
cDNA sequences of ~150 to 200 bp each (55). A high-fidelity (HiFi) dataset of 382,747
sequences from both libraries was generated and subjected to DTS analysis (55)
(Figure 9). In silico subtraction of annotated RefSeq RNA, mitochondrial, assembled
chromosomes and immunoglobulin sequences from National Center for Biotechnology
Information (NCBI) databases, yielded a total of 2394 non-human sequences, which
represented candidates for viral genome sequences (55) (Figure 9).
Utilizing the Basic Local Alignment Search Tool (BLAST), one candidate cDNA
sequence DTS1 indicated high homology to T antigen sequences from both African
green monkey lymphotropic polyomavirus (LPyV) as well as human BK polyomavirus
(55) (Figure 9). The novel polyomavirus was called Merkel cell polyomavirus (MCV)
due to its connection with MCC. DTS analysis also identified a second cDNA sequence
DTS2 aligning with the MCV genome, which showed no homology to any other known
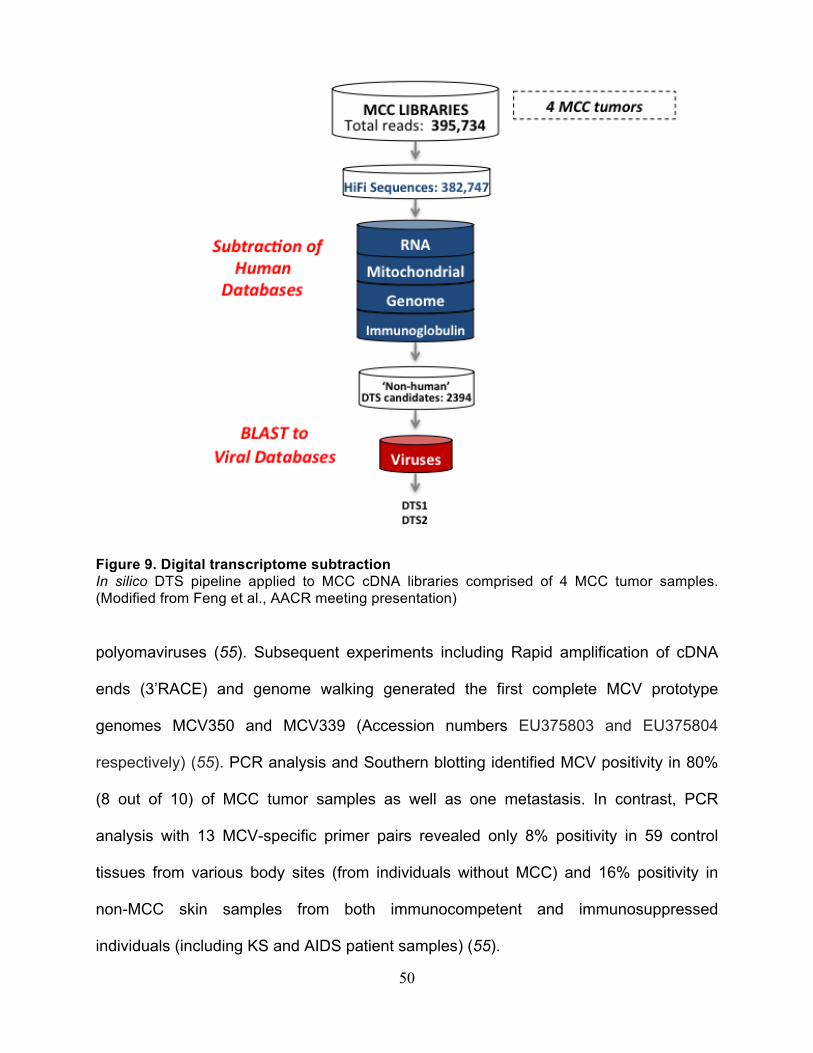
50
Figure 9. Digital transcriptome subtraction In silico DTS pipeline applied to MCC cDNA libraries comprised of 4 MCC tumor samples. (Modified from Feng et al., AACR meeting presentation)
polyomaviruses (55). Subsequent experiments including Rapid amplification of cDNA
ends (3’RACE) and genome walking generated the first complete MCV prototype
genomes MCV350 and MCV339 (Accession numbers EU375803 and EU375804
respectively) (55). PCR analysis and Southern blotting identified MCV positivity in 80%
(8 out of 10) of MCC tumor samples as well as one metastasis. In contrast, PCR
analysis with 13 MCV-specific primer pairs revealed only 8% positivity in 59 control
tissues from various body sites (from individuals without MCC) and 16% positivity in
non-MCC skin samples from both immunocompetent and immunosuppressed
individuals (including KS and AIDS patient samples) (55).

51
1.5.2 MCV genome organization
MCV is a double-stranded DNA virus with a genome length ranging from 5.2 to 5.4 kb.
Like other polyomaviral genomes, the MCV genome can be divided into an early and a
late region divide by a non-coding regulatory region (NCRR) (Figure 10). This NCRR
contains the MCV origin of replication (described in detail in Chapter 3 of this thesis), as
well as a bi-directional early and late promoter element. The early region transcribes
Figure 10. MCV 350 prototype genome organization MCV350 has a circular double stranded-DNA (5387 bp) genome including a non-coding regulatory region (NCRR), which includes the viral replication origin and a bi-directional early and late promoter element. The early region includes T antigen transcripts (LT, sT and 57kT); the late region includes viral proteins 1, 2, and 3 (VP1-3). The MCV encoded miRNA miR-M1 is indicated with a black arrowhead. (Modified from Chang and Moore, Annual Review of Pathology, 2012)

52
alternatively spliced T antigen sequences encoding large T (LT) and small T (sT)
antigens similar to other polyomaviruses. In addition, MCV encodes a 57 kT splice
isoform comparable to SV40 17kT (110) (Figure 10 and 11). Initially it was thought that
neither the middle T (MT) antigen transcript observed in murine polyomavirus (249), nor
an agnoprotein as seen in other polyomaviruses (250, 251) were encoded by MCV. A
recent report however describes a novel MCV MT-like T antigen isoform named ALTO,
which is translated from an internal start codon in LT exon 2 with an alternative ORF
(252).
The MCV late region encodes for the 3 capsid proteins VP1, VP2 and VP3,
which are capable of self assembly into virus-like particles (VLPs) of icosahedron
structure (253). Late gene expression has been linked to active replication of viral DNA.
A tumor-derived point mutation in the origin of the MCV-HF molecular clone abolishes
viral replication and diminishes late gene expression (254). The viral origin of replication
is described in detail in chapter 3 of this thesis.
Members of the polyomavirus family including PyV, SV40, BK and JC have been
shown to encode viral micro RNAS (miRNAs) that regulate early gene expression (255,
256). In the case of MCV, the miRNA miR-M1 (Figure 10) has been demonstrated to
regulate LT expression in vitro as well as in MCV-positive MCC tumors (257, 258).
Therefore, its function may involve regulation of LT expression to evade immune
surveillance. Cellular targets of miR-M1 have not been identified at this point.

53
1.5.3 Large T antigen truncations in MCC tumors
Sequencing of additional LT genomes from MCC tumors revealed a consistent pattern
of C-terminal truncations due to pre-mature stop codons generated by deletion,
substitution, frame shift, or missense mutations (56, 259-261). This feature is unique to
tumor-derived LT genomes, and LT sequences isolated from asymptomatically infected
tissues (i.e. LT206 derived from appendix) are full length (56). All sT sequences isolated
from MCC tumors thus far are unaffected by truncation mutations. Figure 11 indicates
the C-terminal genomic region in LT that harbors tumor specific truncation mutations.
The LT domain that is eliminated in MCC tumors includes the ATPase/helicase domain,
which is essential in facilitating viral DNA replication. Thus, tumor-derived truncated LT
proteins are defective in initiating viral origin replication (56). Recently, the C-terminal
exon 3 of LT has been shown to have a growth-inhibitory function independent of viral
replication features (260). Both the viral replication function as well as the growth
inhibitory effect of the C-terminal portion of LT may explain the selective pressure to
mutate and eliminate this domain during the process of tumorigenesis. Additionally,
mutations in the viral origin as well as VP1 region have been observed, both of which
prevent viral particle formation in tumor cells (254, 262).
Tumor-derived MCV genomes conserve N-terminal domains that are shared with
other members of the polyomavirus family as well as other DNA tumor viruses. These
include the conserved region 1 (CR1), DnaJ domain, PP2A binding site in sT, as well as
the pocket protein (Rb, p107, p130) binding (LXCXE) motif (Figure 11) (56). In addition,
the MCV unique region immediately N-terminal to the LXCXE contains an hVam6p
binding site, which sequesters hVam6p to the nucleus, consequently disrupting

54
lysosome clustering (263). The functional importance of this interaction has not been
addressed yet. All tumor LT truncating mutations described thus far appear after the
LXCXE motif (56, 259, 260), which indicates that this interaction domain is important in
facilitating tumorigenic development and maintenance.
Figure 11. MCV T antigen locus Alternatively spliced transcripts from the MCV early region include LT, sT1, sT2 and 57kT. mRNA splicing is indicated by the dotted line. Conserved protein interaction domains CR1 (conserved region 1), DnaJ, Rb (retinoblastoma) binding, hVam6p binding and a nuclear localization signal are located in the N-terminal portion of LT. The C-terminal region, which is affected by tumor truncations (indicated by arrows for prototypes MCV350 and MCV339) contains an origin binding domain (OBD), Zinc finger, leucine zipper and ATPase/helicase domain required for viral replication. MCV sT has a PP2A (protein phosphatase 2A) binding motif as seen in other polyomaviral sT proteins. The positions of antibody epitopes CM8E6, CM2B4, and 5E1.6 are shown within different T antigen isoforms.

55
1.5.4 MCV genome copy number and integration
When MCV was initially discovered, it was found clonally integrated in MCC tumors
(55), indicating that MCV infection and genome integration precedes carcinogenesis.
MCV T antigen copies per cell are usually detected at a level of >1 by qPCR, with some
MCCs having more than 10 copies per cell (55, 57, 264). VP region copy number
determinations repeatedly yield higher copy numbers by qPCR than assays targeting
the T antigen region (57, 265). At this point the significance of this is unknown, but
important experimental limitations that have to be taken into account include potential
differences in primer efficiencies for either VP or T antigen amplification. Viral MCV
genome copies >1 per cell indicates either multiple cellular integration sites, or viral
concatenation in a single integration site. Southern blotting analyses have shown that
viral concatamers are present in some MCV-positive MCC cell lines (56, 265).
A common cellular integration site in MCC would indicate the interruption or
activation of a cellular gene by the viral genome as a factor contributing to MCC
tumorigenesis. Multiple groups have mapped integration sites in MCC, but no consistent
gene location has been identified (259, 266, 267). This indicates that viral protein
expression in fact is a key mediator of tumor development. Further details regarding
viral copy number and genome integration in MCC cell lines are described in Chapter 2
of this thesis.

56
1.5.5 MCV Serology and transmission
The fact that low copies of MCV DNA could be detected in healthy tissues of non-MCC
patients raised the question whether or not MCV infection is ubiquitous in humans, as
seen with other human tumor viruses. Rolling circle amplification (RCA) as well as
nested PCR on DNA isolated from skin swabs of healthy individuals revealed that MCV
is part of the normal human skin flora (90, 268), and serologic studies confirmed 25-
88% seroprevalence in healthy individuals (87, 253, 269, 270). However, when
comparing healthy individuals to MCV-positive MCC patients, it is clear that MCC
patients have significantly higher antibody titers against MCV (Figure 12B) (269). The
wide range of MCV seroprevalence in healthy individuals observed between different
studies could in part be contributed to differences in antigens used. Analyses utilizing
GST-VP1 fusion proteins detect 25-59% seroprevalence (87, 270), whereas the use of
VLP-derived VP1 epitopes as antigens detects MCV antibodies with higher sensitivity of
60-88% in individuals (105, 269, 271). Antibodies against MCV can be detected in
children as young as 2 years of age, and a study comparing sera from Langerhans cell
histiocytosis (LCH) patients of different age groups reveals an increase of
seroprevalence over time, with 80% of people 50 years and older testing positive for
MCV exposure (269) (Figure 12A).

57
Figure 12. MCV Seroprevalence (A) MCV seroprevalence can be detected early in life, and increases with age in Langerhans cell histiocytosis (LCH) patients. (Reproduced from Tolstov et al., International journal of cancer, 2009) (B) Neutralization assays reveal significantly higher anti-MCV antibody levels in MCV+MCC patients compared to healthy controls. (Adapted from Pastrana et al., PLOS Pathogens, 2009)
No children under the age of 1 showed any MCV seroprevalence, indicating that
vertical transmission is not likely; yet the fact that young children between the ages of 2-
5 have detectable levels of antibodies against MCV, suggests a casual route of
transmission (269). MCV, as well as KIV and WUV, may be transmitted by respiratory
route since DNA from these viruses can be detected in the respiratory tract (272-274).
In addition, MCV is also found in sewage samples (275), but the possible role of this in
transmission remains to be elucidated.

58
1.5.6 T antigen expression in MCC
Immunohistochemical analyses of 51 MCC tumors using either the LT specific antibody
CM2B4 or an antibody against sT 5E1.6, reveal that 73% of tumors express both T
antigens (129) (antibody epitopes indicated in Figure 11). In this particular study 75% of
tumors were positive for LT, whereas 92% were positive for sT expression (129). MCC
tumor cells uniquely express T antigens, which cannot be detected in healthy tissue
adjacent to the tumor (Figure 13 A-B) (129). MCV-positive MCC cell lines express both
individually truncated versions of LT as well as sT protein (see chapter 2). MCC tumors
specifically express MCV T antigens, and immunohistochemical staining with an
antibody recognizing SV40 LT shows no positivity (Figure 13C).
Figure 13. MCV T antigen expression in MCC Immunohistochemical evaluation of a MCC tumor tissue demonstrates (A) MCV sT expression using 5E1.6 and (B) MCV LT expression using CM2B4 in tumor cells but not normal adjacent tissue. MCC specifically expresses MCV T antigens; (C) SV40 LT expression cannot be detected using the antibody Pab419. Original magnification x100; insets x1000. (Modified from Shuda et al., Journal of clinical investigation, 2011)

59
To elucidate whether or not MCV-positive MCC cancer cell lines are dependent
on T antigen protein expression, knockdown studies were performed that evaluated the
effect of simultaneous knockdown of LT and sT (panT), or sT knockdown alone. panT
knockdown results in non-apoptotic cell death as well as markedly reduced cell cycle
entry of MCV-positive MCC cell lines (129, 276). The mechanism of cell death is still
unknown. On the other hand, sT knockdown alone (targeting the sT unique region in
intron 1) does not induce cell death, but rather results in growth arrest with moderate
inhibition of cell cycle entry (129). It is difficult to knockdown LT independently of sT,
due to an overlap of mRNA sequence of these two transcripts (Figure 11). However,
one report describes the successful knockdown of LT alone by targeting the splice site
between exons 1 and 2 (277). LT-specific knockdown results in growth retardation of
MCV-positive MCC cell lines in vitro, and in a mouse xenograft experiment. Ectopic
shRNA-insensitive LT expression rescues this phenotype in an LXCXE-dependent
manner, highlighting the importance of this domain in MCC tumors.
1.5.7 MCV T antigen interactions with cellular proteins
Like SV40 and other tumor viruses, the MCV genome contains an LXCXE-pocket
protein-binding motif in LT, which is essential for interactions with Rb family members
pRB, p107 and p130 as well as other LXCXE-motif containing proteins. Tumor-derived
as well as full length MCV LT bind pRB in an LXCXE-dependent manner, and mutation
of this motif to LXCXK abolishes the interaction (56). As seen with other tumor viruses,
this interaction is thought to induce cell cycle entry and therefore is probably important
in MCV induced tumorigenesis. MCV LT has been shown to indirectly target the inhibitor

60
of apoptosis protein (IAP) family member survivin, most likely via E2F transcriptional
activation of the survivin promoter as this effect is LXCXE motif-dependent (232). MCV-
positive MCC cells are dependent on survivin expression and a survivin inhibitor shows
promising effects in mouse xenograft studies (232) (details can be found in Appendix B
and C).
Interestingly, neither full length, nor tumor-derived LT binds to p53, a common
cellular target of polyomaviruses and other tumor viruses (260). The C-terminal domain,
which is responsible for p53 interaction with SV40 LT, is deleted in tumor-derived MCV
LT indicating that MCV-induced tumorigenesis is either independent of p53 status or
requires additional cellular mutations in the p53 signaling pathway.
A study aimed to discover MCV exclusive interactions utilized the MCV unique
region (nt. 861-1565) in a tandem affinity purification (TAP) assay, and identified human
Vam6p (hVam6p) bound to MCV LT in close proximity to the LXCXE motif (263). This
interaction re-localizes hVam6p from the cytoplasm to the nucleus in the presence of
MCV LT proteins with an intact NLS, including full length LT and the majority of tumor-
derived LTs. One of the observed effects of hVam6p sequestration to the nucleus is the
disruption of lysosome clustering in the cytoplasm. Whether or not hVam6p exhibits a
gain-of-function in the nucleus, and whether or not this interaction is significant in MCV-
positive MCC cancers remains to be uncovered.
As seen with SV40, MCV T antigen interacts with Hsc70 through its HPDK motif
in the DnaJ domain, and this interaction is important for viral replication (described in
detail in chapter 3 of this thesis) (278). MCV sT contains a consensus PP2A binding site
found in other polyomaviral small T antigens that inhibit PP2A activity. Neither the PP2A

61
nor the DnaJ interaction domains of MCV sT contribute to its transforming activity in
rodent cells (described in section 1.5.8) (129).
1.5.8 Cellular transformation by MCV T antigens
The strong dependency of MCV-positive MCC cells on T antigen expression for survival
posed the question whether or not MCV T antigens are capable of transforming cells. In
vitro assays revealed that MCV sT is able to transform rodent cell lines and promote
serum-free human cell proliferation (129). Transforming activities were measured by
anchorage-independent growth (growth in soft agar) and loss of contact inhibition (focus
formation). Neither full-length, nor truncated MCV LT however, showed any
transforming activity in these assays. This was a rather surprising result, given the
model of SV40-induced cell transformation in which LT is the dominant contributor to
the transformation phenotype, and sT alone has no transforming activities. These
results highlight unique molecular interactions of MCV T antigens with cellular proteins
in comparison to the well-studied SV40 T antigens.
Interestingly, MCV sT transformation is independent of its PP2A interaction
domain, which has been implicated as essential in SV40 sT contribution to
transformation in the context of SV40 LT. A feature that is necessary for MCV sT-
induced transformation is sT downstream targeting of the mammalian target of
rapamycin (mTOR) signaling pathway. sT induces mTORC1/mTORC2 independent
hyper-phosphorylation and subsequent inactivation of the 4E binding protein 1 (4E-
BP1), which results in de-regulation of cap-dependent translation (129). In the presence
of a constitutively active mutant of 4E-BP1, which cannot be phosphorylated, the

62
transformation phenotype is diminished. This molecular pathway remains to be explored
with regards to potential clinical applications in MCC management.
In vitro human fibroblast transformation by MCV T antigens has not been
reported. However, in the context of SV40 T antigen defined human fibroblast.
transformation, the additional expression of both hTERT as well as mutated HRas
(HRasV12) is required. Chapter 4 of this thesis will present data assaying human
fibroblast transformation in the context of MCV T antigens with the addition of defined
oncogenic elements. Recently published results by Cheng et al. show that expression of
tumor-derived MCV LT and sT in human fibroblasts induces growth proliferation, and
that full-length LT contains a growth inhibitory domain in the C-terminal exon 3 (260).
Expression of a 100 bp exon 3 fragment inhibited cell growth of MCV-positive MCC cell
lines and reduced soft agar colony formation of transformed human fibroblasts
expressing SV40 LT + sT, hTERT, and HRasV12 (260). This data has implications with
regards to the tumor evolution model for MCV-positive MCC. It indicates that LT
truncations are not only selected for because of the replication function of LT, which lies
within the C-terminus, but also because there is an anti-proliferative domain in this
region. This is further supported by the fact that the MCV tumor genome MCV350,
which has a point mutation in the viral origin that abolishes origin replication, still
contains a C-terminal truncation of LT (278, 279). In addition, Cheng et al.
demonstrated that unlike SV40 LT, MCV LT does not bind to the tumor suppressor p53,
providing further evidence for differences in molecular targets between MCV and SV40
(260). Characterization of the functional pathways involved in the growth promoting
effect of truncated MCV T antigens is described in chapter 4 of this thesis.

63
1.5.9 Evidence for causality
A vast amount of scientific evidence can be used to argue for a causal relationship
between MCV infection and the development of MCV-positive MCC. Applying Hill’s
criteria (12) to this scenario reveals that all of Hill’s criteria are met, with exception of his
3rd criterion of ‘specificity’. MCV infection is not specifically associated with MCC
patients, since healthy individuals are also infected; however, our current knowledge of
the cancer phenotype as a multi step process explains how MCV can be required, but
may not be sufficient to induce MCC tumorigenesis. Additional factors including
immunosuppression, as well as viral genome mutations and integration, possibly
induced by UV radiation, are needed. Therefore, Hill’s criterion of ‘specificity’ may not
be useful in establishing causal relationships with regards to cancer development
associated with tumor viruses.
Hill’s 1st criterion ‘strength of association’ has been established by the detection
of MCV DNA in ~80 % of MCC tumors (55). His 2nd criterion of ‘consistency’ is met by
repeated results that confirm the presence of MCV in MCC from different groups
worldwide (reviewed by Coursaget et al., 2013 (280)). The 4th criterion of ‘temporality’ is
supported by the fact that MCV genomes are clonally integrated in MCC (55), indicating
that MCV infection precedes tumor cell outgrowth. Presence of a ‘biological gradient’,
Hill’s 5th criterion, can be observed in immunohistochemical evaluations of MCC tumors,
which show that only MCC tumor cells are positive for viral protein expression, but not
the adjacent healthy tissue (281). The 6th criterion asks for biological ‘plausibility’, which
is provided by the fact that other polyomaviruses are capable of transforming cells and
inducing tumors in respective animal models. MCV, which shares many protein

64
interaction domains that are functionally important for polyomavirus transformation, is
therefore a plausible agent for tumorigenic development. The 7th criterion of ‘coherence’
asks that the causal association under evaluation be in agreement with biological and
epidemiological aspects already known about the disease. In the case of MCV
association with MCC, it is coherent for MCC to have a viral etiology, since it is a cancer
associated with immunosuppression, which suggests an infectious cause. Finally, the
8th criterion of experimental evidence has been strengthened by various studies that
show the transforming activity of sT in rodent cells (129), dependency of MCV-positive
MCC cell lines on T antigen expression (276), as well as growth promoting activities of
both tumor LT as well as sT in rodent and human fibroblasts (chapter 4) (129, 260).
Overall, the collective evidence strongly supports a causal link between MCV
infection and MCC development, but additional factors are needed for clinically
presented MCC to emerge. MCV-negative MCC arise from an unknown etiology, and
therefore should be classified as a distinct type of tumor with a differential
chemotherapeutic treatment regimen. MCV T antigen status in MCC therefore could
prove useful as a diagnostic marker that can be utilized to distinguish different MCC
types, and it may even be used to make prognostic evaluations about disease outcome
(282, 283).

65
2.0 CHARACTERIZATION OF AN EARLY PASSAGE MERKEL CELL
POLYOMAVIRUS-POSITIVE MERKEL CELL CARCINOMA CELL LINE, MS-1, AND
ITS GROWTH IN NOD SCID GAMMA MICE
Work described in this chapter was published in the Journal of Virological Methods
J Virol Methods. 2013 Jan;187(1):6-14.
with authors Guastafierro A, Feng H, Thant M, Kirkwood JM, Chang Y, Moore PS,
and Shuda M.
A. Guastafierro, H. Feng and M. Shuda contributed equally to this work.
A. Guastafierro and M. Shuda performed qPCR and RT-qPCR experiments and
analyses. A. Guastafierro performed immunoblotting, xenograft experiments and
CM2B4 immunohistochemistry of xenograft tumors. M. Shuda performed Southern
blotting. H.Feng performed MCV genome sequencing and T antigen transcript mapping.
H. Feng and M.Thant determined MCV integration sites in MS-1 and MCC tumors by
Phage library screening and RACE analysis. Ms. Marie Acquafondata, Ms. Susan
Sharp and the UPMC Presbyterian Clinical IPEX Laboratory performed
immunohistochemical staining for MCC cell lines. A. Guastafierro, M.Shuda, Y. Chang
and P.S. Moore conceived the project, analyzed results and wrote the manuscript.

66
This chapter describes the characterization of an early passage MCV-positive MCC cell
line MS-1, and compares its cellular, immunohistochemical, and virological features to
previously derived MCV-negative (UISO, MCC13, and MCC26) and MCV-positive cell
lines (MKL-1 and MKL-2). The MS-1 cellular genome harbors integrated MCV, which
preserves an identical viral sequence from its parental tumor. Neither VP2 gene
transcripts nor VP1 protein are detectable in MS-1 or other MCV-positive MCC cell lines
tested. Mapping of viral and cellular integration sites in MS-1 and MCC tumor samples
demonstrates no consistent viral or cellular gene integration locus. All MCV-positive cell
lines show cytokeratin 20 (CK20) positivity and grow in suspension. When injected
subcutaneously into NOD scid gamma (NSG) mice, MS-1 forms a discrete macroscopic
tumor. Immunophenotypic analysis of the MS-1 cell line and xenografts in mice show
identical profiles to the parental tumor biopsy. Hence, MS-1 is an early passage cell line
that provides a useful in vitro model to characterize MCV-positive MCC.

67
2.1 INTRODUCTION
Due to the limited availability of patient samples and the lack of an animal model, MCC
cell lines are critical in investigating MCV-dependent Merkel cell carcinogenesis in vitro
(264, 276, 279, 284). Historically, MCC cell lines have been divided into classic and
variant subtypes based on the expression of immunohistochemical markers including
neuron specific enolase (NSE) and chromogranin A, as well as their neurosecretory
granule status (285, 286). Further division of MCC into subtypes I-IV has been based on
SCLC morphology, aggregation, and colony shape in culture (287). Subtypes I and II
grow in dense, floating, spherical aggregates, with type I showing central necrosis
(287). Type III cells are aggregated loosely with a 2-dimensional appearance, and type
IV cells grow in an adherent monolayer (284, 285). Most MCV-positive cell lines studied
to date are of the classic phenotype and have class III growth morphology in culture,
while MCV-negative cell lines mostly fall into the variant class IV phenotype (284).
However, some MCC cell lines diverge from this grouping, and the discovery of MCV in
2008 has provided a more meaningful classification of MCC cell lines to approach the
molecular study of MCC.
Although a number of MCC cell lines have been established from MCC tumors
(264, 287-289), detailed characterization of features associated with virus positivity, e.g.
integration sites, viral sequence and truncation patterns, as well as viral protein
expression in MCV-positive cell lines, has not been performed. In addition, many
previously derived cell lines are adapted to cell culture conditions as a result of

68
extended passages, which could lead to the accumulation of spontaneous mutations in
the viral or cellular genomes. Such culture-derived changes can only be detected if the
sequence of the parental tumor biopsy is known. The establishment of a new cell line
allows the comparison of viral sequences as well as protein expression data from the
MS-1 cell line to the patient tumor tissue from which it was derived. This aids in
determining whether or not this cell line is an appropriate surrogate for its in vivo tumor.
Comparison of MS-1 phenotypic and genotypic features to previously derived MCV-
positive as well as MCV-negative MCC cell lines in this study supports that MCV-
positive MCC cell lines are distinct from MCV-negative cell lines in their
immunohistochemical profile as well as cell culture morphology. Additionally, MS-1 is
tumorigenic in immunocompromised mice, forming xenograft tumors that retain T
antigen expression as well as phenotypic markers of the cell line in vivo.
In summary, the MS-1 cell line is a well-characterized early passage MCC cell
line, which manifests characteristics of the parental MCC tumor tissue, providing a
valuable tool for studying MCV-induced MCC carcinogenesis in vitro. We describe MCV
genome copy number, viral and host cell integration sites, as well as the LT antigen
truncation pattern and viral protein expression in this cell line. The establishment of a
MS-1 xenograft model that recapitulates features of the original tumor biopsy provides a
novel tool for in vivo studies of MCV-positive MCC.

69
2.2 MATERIALS AND METHODS
2.2.1 Preparation of tumor biopsy and cell culture conditions
The MCC tumor biopsy (R08-05) was minced in RPMI 1640 with (filtered) 10% FBS, 1%
Pen-Strep, 1% L-Glutamine, and 1% MEM Hepes buffer. Digestion media (0.1%
Hyaluronidase, 0.02% DNase, 1.0% Collagenase in PBS, Sigma-Aldrich, St. Louis, MO)
was added, and the specimen was placed at 37°C for 30-40 min. After incubation, the
suspension was passed through a cell strainer to remove undigested tissue. Cells were
initially cultured in RPMI medium with 20% human serum, 0.01% Pen Strep, 0.01%
Fungison, 0.01% Insulin-transferrin-selenous-acid, 50 uM bathocuproine disulfate, and
1 M L-Cystein. After 5 passages, serum was switched from 20% human to 20% fetal
bovine (FBS), and following passage 10, serum concentration was reduced to 10% FBS
in RPMI for culture. Experimental analyses in this this study were performed using MS-
1 cells of passage <40.
2.2.2 Real time quantitative PCR
Quantitative PCR was performed using primers amplifying the MCV T antigen promoter
region (pTAg 98-184 nt; forward primer: 5’-CCC AAG GGC GGG AAA CTG-3’, reverse
primer: 5’-GCA GAA GGA GTT TGC AGA AAC AG-3’) and VP2 locus (4563–4472 nt,
forward primer: 5’-AGT ACC AGA GGA AGA AGC CAA TC-3’, reverse primer: 5’-GGC
CTT TTA TCA GGA GAG GCT ATA TTA ATT-3’) with internal TaqMan probes (pTAg:
5’-CCA CTC CTT AGT GAG GTA GCT CAT TTG C-3’, VP2: 5’-GCA GAG TTC CTC-3’)

70
labeled with FAM and BGH quencher for pTAg (Biosearch Technologies, Carlsbad,
CA), and MGB quencher for VP2 (Applied Biosystems, Novato, CA). Standard curves
for copy number calculations were generated for TAg and VP2 primers separately using
values from serial dilutions of known copy numbers of the full-length MCV-HF genomic
clone (254). Water was used as control and no evidence of PCR template
contamination was observed. An RNase P primer probe mixture (Applied Biosystems)
was used to determine cell genome copy number. qPCR reaction was performed in
triplicates as described previously (281). Results are expressed as numbers of viral
copies per cell calculated from Ct values of viral and cellular gene standards. To
determine T antigen and VP2 mRNA expression levels, the expression of the human
RNase P gene was used as a reference, and RNAs from MCV-negative cell lines were
used as controls.
2.2.3 MCV genome sequencing
Genomic DNA from MCV-positive MCC cell lines as well as the MS-1 tumor biopsy
R08-05 was extracted by the standard phenol chloroform extraction method. 13 PCR
primer sets (contig 1- contig 13) were used for PCR amplification of the MCV genome
as described before. All PCR reactions were performed with High Fidelity Platinum Taq
DNA polymerase (Invitrogen, Carlsbad, CA). Standard Sanger sequencing of PCR
products was performed using DNA analyzers from Applied Biosystems.

71
2.2.4 Phage library screen of MCV integration site
Ten micrograms of genomic DNA extracted from MKL-1 and MS1 cells were digested
with EcoRI (New England Biolabs, Ipswich, MA), and ligated into Lambda Zap II
predigested EcoRI/CIAP-treated vector using the Gigapack III Gold Packaging Extract
(Stratagene, Santa Clara, CA) to construct the phage library. After titer optimization, 7
µl of a 1:10 dilution of phage library mixed with 600 µl MRF’ cells at an OD600 of 0.500
were plated on NZY agar, and incubated at 37°C overnight. Two rounds of screens of
virus-positive clones were performed with a32P dCTP-labeled MCV DNA probes
according our previously published protocol (55). Positive clones were isolated, and
inserts were sequenced.
2.2.5 RACE analysis
Both 5'-RACE and 3'-RACE were used to identify integration sites in MCC cases with
GeneRacer Kit (Invitrogen) according to the manufacturer's instructions. For
MCC347/348 tumor cases, primer sequences were described previously (55). For
MCC350, 5'-GCT AGA TTT TGC AGA GGT CCT G-3' and 5'-TTT CCT TGG GAA GAA
TAT GGA A-3' primers were used to identify a viral integration site by 3'-RACE analysis.
For MCC345, 5'-AAA CAA CAG AGA AAC TCC TGT TCC-3' and 5'-TGA TCT TTC
TGA TTA TCT TAG CCA TGC TG-3' primers were used in 3'-RACE analysis. For
MCC352, 5'-GGG AGG CTC AGG GGA GGA AA-3' and 5'-TCC AGA GGA TGA GGT
GGG TTC C-3' primers were used in 5'-RACE analysis. PCR fragments were isolated

72
from 1.2% agarose gel, extracted with QIAEX II Gel Extraction Kit (Qiagen, Valencia,
CA), and ligated into pCR2.1 vector (Invitrogen) for DNA sequencing.
2.2.6 Southern blot
Genomic DNA was extracted by the standard phenol chloroform extraction method.
Fifteen micrograms of genomic DNA from cell lines were digested with MCV genome
single cut enzymes EcoRI and BamHI separately or together. Digested DNA was
separated on 0.7 % agarose-TBE gel, followed by denaturation for 45 min (1.5M NaCl,
0.5M NaOH), and neutralization for 1h (3.0M NaCl, 0.5M Tris-HCl pH7.4). RNA was
extracted using Trizol (Invitrogen). Genomic DNA was transferred onto a Hybond-C
nitrocellulose membrane (GE Healthcare) with 10X SSC. To generate a32P dCTP-
labeled probes for Southern hybridization, five MCV DNA fragments (contig1, contig3,
contig6, contig9 and contig12) described previously (55) were used as templates for the
Amersham Rediprime II Random Prime Labeling kit (GE Healthcare). Hybridization was
performed as described previously (279).
2.2.7 Immunoblotting
Cells were lysed in radioimmunoprecipitation assay (RIPA) buffer containing 50mM Tris,
150 mM NaCl, 0.1% SDS, 0.5% Na Deoxycholate, 1% NP40, and protease inhibitors
(Complete cocktail, Roche, Indianapolis, IN). Lysates were kept on ice for 15 minutes,
and then centrifuged 20,000 x g for 10 minutes at 4°C. Supernatants were mixed with
5X sodium dodecyl sulfate (SDS) loading dye, and denatured at 100°C for 5 minutes.

73
Proteins were separated by SDS-polyacrylamide gel electrophoresis (PAGE), and
transferred onto a Hybond-C nitrocellulose membrane (GE Healthcare). Proteins were
detected using CM2B4, CM8E6, CM5E1 and 9B2 antibodies as described before (129,
254, 281, 290)
2.2.8 Xenograft model
Triple immunodeficient NOD scid gamma (NSG) mice (Jackson laboratories, Bar
Harbor, MN) were housed in a specific pathogen-free area at the Division of Laboratory
Animal Research (DLAR) facility at the Hillman Cancer Center, University of Pittsburgh
according to University of Pittsburgh Institutional Animal Care and Use Committee
(IACUC) regulations (IACUC protocol #1102226). At 6 weeks of age, mice were injected
in the flank with 2x10^7 cells in 100 ul PBS subcutaneously. For MS-1 and MKL-1 cell
lines, 5 mice were injected each. Mice were sacrificed when tumors reached a diameter
of 2 cm. Tumor volumes were calculated according to the following formula: (width) 2 x
(length/2).
2.2.9 Immunohistochemistry
For immunohistochemical staining of paraffin embedded xenograft tumor tissues,
epitope retrieval was performed using 1mM EDTA buffer pH 8.0 at 125°C for 3:15 min
after deparaffinization and hydrogen peroxide treatment. After blocking with Protein
Block (Dako, Carpinteria, CA), primary antibody was applied for 30 min at room
temperature with dilutions described below. After washing, samples were incubated with

74
Mouse Envision Polymer (Dako) for 30 min at room temperature for subsequent
deaminobenzidine (DAB) reaction. Antibodies and dilutions used for
immunohistochemistry were: CM2B4 (1:1000; Santa Cruz, Santa Cruz, CA), CK20
(1:50; Dako), CK7 (1:50; Dako), Chromogranin A (1:600; Dako), TTF-1 (1:50; Dako),
AE1/3 (1:100; Dako), CAM5.2 (1:10; Becton Dickinson, Franklin Lakes, NJ),
Synaptophysin (1:100; Biogenex, Fremont, CA), NSE (pre-dilute; Ventana, Tucson, AZ),
and LCA (pre-dilute; Ventana). Each cell line was stained once for every marker, and
negative human control tissue was stained with the same antibody dilutions for each
marker to ensure minimal background reactivity.

75
2.3 RESULTS
2.3.1 MS-1 cell culture morphology and immunohistochemistry
The MS-1 tumor biopsy was obtained from a MCC metastasis to the right adrenal gland
of a 59-year-old woman. In culture, the cells form floating aggregates of 3-dimensional
cell clusters similar to other MCV-positive MCC cell lines including MKL-1, and MKL-2
(Figure 14 and Table 2). In contrast, the MCV-negative MCC cell lines UISO, MCC13,
and MCC26 grow in an adherent monolayer (Figure 14 and Table 2).
Figure 14. Morphological features of MCC cell lines MCV-positive cell lines MS-1 (A), MKL-1 (B), and MKL-2 (C) grow in floating aggregates in cell culture, whereas MCV-negative cell lines UISO (D), MCC13 (E), and MCC26 (F) are adherent cells.

76
As described before (276), immunohistochemical analyses of MCC cell lines
reveal differences in various markers diagnostic for MCC between MCV-positive and -
negative cell lines (Table 2). In comparison to data published previously (276), this
immunohistochemical analysis of MCC cell lines is expanded to include MCC 26, as
well as the negative markers CK-7, TTF-1, and LCA. Cytokeratin 20 (CK 20) is a low
molecular weight cytokeratin with perinuclear distribution in MCC, which is used to
distinguish MCC from other small cell carcinomas (291). MCV-positive cell lines MS-1,
MKL-1 and MKL-2 are positive for CK20 by immunohistochemistry, whereas the MCV-
negative cell lines UISO, MCC13 and MCC26 are not (Table 2). MS-1, MKL-1, MKL-2
and MCC13 are positive for the pan-keratin markers, AE1/3 (anion exchanger 1/3), and
CAM5.2 (cytokeratin 8 and 18). Cytokeratin 7 (CK7), which has been reported to stain
!
!CK20 AE1/AE3 CAM5.2
CK7 Chromogranin A Synaptophysin
NSE LCA
TTF-1
MS-1 MKL-1 MKL-2 UISO MCC13 MCC26
+ + + - - + + - -
+ + + - - - + - -
- - - - - - + - -
- + + + - - + - -
- - - - - - - - -
Table 2. Immunohistochemical features of MCC cell lines
Markers MCV positive MCV negative MCC
diagnostic Profilea b
+ + + -
+/-c +/-c
+ - -
a Koljonen, 2006 b Goessling et al., 2002
c +/- mostly positive
+ + + - + + + - -
"##$%&'()*+,-!./012!345*6%$()+!017!"89:"8;2! !<(+=345*6%$()+7!.">?@02!<(+=345*6%$()+7!./A2!345*6%$()+! A7! BC82! +%D$*+=,<%3'E3! %+*F(,%7! G."2! F%D3*345%! 3*HH*+! (+)I%+7! JJK=92! 5L4$*'M!5$(+,3$'<)*+!N(35*$!9!
J(#F%!9!
Table 2. Immunohistochemical features of MCC cell lines

77
negative in MCC (292), is positive only in MCC 13 tumor cells. All MCV-positive and –
negative cell lines except MCC26 express neuron-specific enolase (NSE), and only
MKL-2 expresses chromogranin A (Table 2). All cell lines are negative for leukocyte
common antigen (LCA) and thyroid transcription factor 1 (TTF-1) (Table 2), markers
that have been described as negative in MCC biopsies (292, 293).
2.3.2 MCV status
MCV copy number per cell was determined by qPCR in three separate experiments
(Table 3) for the MCV-positive cell lines MS-1, MKL-1, and MKL-2. MS-1 harbors an
average of 2.1 copies of T antigen per cell, whereas MKL-1 and MKL-2 harbor 3.5 and
1.7 copies per cell respectively. No positivity was detected in the three MCV-negative
MCC cell lines UISO, MCC13, and MCC26 used as controls. VP2 specific primers
consistently detect higher genomic copy numbers than T antigen specific primers with
MS-1 containing an average of 3.6 VP2 copies per cell. MKL-1 and MKL-2 contain 8.6
and 3.0 copies, respectively (Table 3).
!"#$%&'&
Table 3. MCV genome copy number, and viral RNA expression
Relative MCV RNA
expressiona
MS-1 MKL-1 MKL-2 UISO MCC13 MCC26
MCV genome copies per cell
TAg VP2 TAg VP2
2.1 ± 0.1b 3.5 ± 0.4b 1.7 ± 0.5b
NDc NDc NDc
3.6 ± 0.9b 8.6 ± 1.2b 3.0 ± 0.6b
NDc NDc NDc
0.069a
0.073a 0.014a
NDc NDc NDc
NDc NDc NDc NDc NDc NDc
a normalized to RNase P RNA expression b standard deviation of three independent experiments c not detected
MC
V –
ve
MC
V +
ve
MCC cell line
Table 3. MCV genome copy number and viral RNA expression

78
To determine whether there is any correlation between viral DNA load and viral
mRNA expression in the MCV-positive cell lines, total RNA was extracted from the MCC
cell lines and treated with DNase to eliminate genomic DNA amplification. Quantitative
RT-PCR was performed with the same primers used to determine T antigen and VP2
copy numbers per cell. All three MCV-positive cell lines express T antigen mRNA
transcripts at different levels, whereas none of them express VP2 transcripts (Table 3).
MS-1 mRNA levels are 0.069-fold RNaseP expression, whereas MKL-1 and MKL-2 are
0.073-, and 0.014-fold respectively (Table 3). There is no apparent evidence for a linear
correlation between DNA copy number and mRNA levels.
Southern blot analysis using previously described MCV probes that cover the
entire viral genome (55), reveals a ~1.6 kb band in the MCV-positive cell lines MS-1,
MKL-1, and MKL-2, when digested with the restriction enzymes BamHI and EcoRI. Both
enzymes are single cutters within the MCV genome sequence, and double digestion
cleaves a ~1.6 kb internal virus sequence (Figure 15A). Consistent with qPCR results
(Table 3), the intensities of viral internal 1.6 kb bands were similar between MS-1 and
MKL-2, whereas MKL-1 shows a 1.6 kb band of higher intensity. Single digestions with
either BamHI or EcoRI generate multiple MCV-related bands in MS-1 (BamHI), MKL-1
(EcoRI), and MKL-2 (EcoRI) consistent with random clonal integration in different cell
lines, as has been shown in MKL-1 previously (279). Single digestion with either BamHI
or EcoRI yields a 5.4 kb band representing the whole MCV genome in MKL-1 and MKL-
2, demonstrating virus concatenation in these cell lines.

79
Figure 15. MS-1 harbors clonally integrated MCV and expresses viral T antigens (A) Southern blot analysis of MCV-positive cell lines shows clonally integrated viral genomes. (B) The MCV-positive MCC cell lines MS-1, MKL-1 and MKL-2 have C-terminal LT truncations as determined by direct sequencing performed on genomic DNA. LT protein sizes correspond to 428 aa, 330 aa, and 275 aa, respectively. (C) Western blotting using antibodies CM2B4 for LT and CM8E6 as well as CM5E1 for sT shows differences in size of LT proteins from different MCV-positive MCC cell lines, whereas sT size is the same. The CM2B4 antibody picks up a faint non-specific band in MCV-negative MCC cell lines (marked *).
2.3.3 T antigen truncations and corresponding protein sizes
Next, we sought to determine the T antigen truncation pattern in MS-1 as well as MKL-
2. The MKL-1 LT truncation (GenBank accession no. FJ173815.1) has been mapped
previously (279). Genomic DNA was isolated from MS-1, MKL-1 and MKL-2, and
subjected to direct sequencing using MCV contiguous primer pairs spanning the whole

80
MCV genome (55). Sequencing of the PCR products revealed premature stop codons
in all three cell lines (Figure 15B). MS-1 LT terminates at nucleotide position 1910,
whereas the MKL-1 and MKL-2 LT truncations can be found at positions 1618 and 1495
respectively (Figure 15B).
The differential LT truncation patterns of MCV-positive cell lines are reflected by
varying LT migration speeds by immunoblotting (Figure 15C). MS-1 expresses the
largest LT protein among the MCV-positive MCC cell lines in this study, with the
truncation occurring after the origin-binding domain (OBD) of LT, yielding a 428 amino
acid (aa) long protein. MKL-1 (330 aa) and MKL-2 (275 aa) LT truncations are N-
terminal to the MS-1 truncation mutation, while all three truncated LT proteins maintain
the LXCXE Rb binding motif (Figure 15B). This truncation pattern and conservation of
the N-terminal motifs is consistent with LT sequences derived from MCC tumor tissues
in various studies (279, 294, 295). In agreement with the truncation patterns in Figure
15B, MS-1 expresses a 60 kDa truncated LT protein as compared to a 105 kDa full
length LT expressed exogenously in 293 FT cells (Figure 15C compare lane 3 to lane
2). MKL-1 and MKL-2 also express shorter forms of LT, which migrate at 50 kDa and 40
kDa, respectively. Even though sequencing results reveal intact splice donor and
acceptor sites for the 57 kT isoform, neither MS-1 nor MKL-2 express a 57 kT protein
that is detectable by immunoblotting (Figure 15C). MKL-1 has already been reported to
have a deletion in the second splice donor site of 57 kT (279), which explains the
absence of this isoform. All MCV-positive cell lines consistently express an intact 19
kDa sT protein (Figure 15C). While sT protein size does not differ between cell lines
(Figure 15B-C), sequencing results reveal one single nucleotide polymorphism, which

81
results in a difference in amino acid 20 of sT between cell lines. MS-1 and MKL-1 have
an alanine at this position, whereas MKL-2 has a serine.
Viral sequence comparison between the MS-1 cell line and its parental tumor
biopsy (R08-05) reveals the same pre-mature stop codon mutation of LT as well as an
identical MCV genome sequence with a deletion from nucleotide 1912 to 1951 and a 5
base pair insertion at position 5218 (Figure 16). As described previously, the MKL-1
viral genome has a deletion at nucleotide position 1612-1657 (FJ173815.1). The MKL-2
Figure 16. MCV genome comparison MCV genomes from published clones MCV-HF, MCV 350 and MKL-1 were compared to MCV genomes from MKL-2, MS-1 and the R08-05 tumor biopsy based on genomic sequence alignments. Genomic deletions (black box) as well as insertions (vertical dotted line) are indicated for early (gray) and late (white) regions.
MKL-2
MCV350
MKL-1
MCV-HF
Genomic insertion
Genomic deletion
Large T antigen
Small T antigen
MCV late region
Tumor biopsy R08-05
MS-1
5bp insert
Splicing site
!"#$%&'()'

82
genome has two deletions at nucleotide positions 3082-3083 and 4828-5348 (Figure
16). MCV viral genome sequences have been deposited to GenBank with
corresponding accession numbers JX045709 (MS-1) and JX045708 (MKL-2).
2.3.4 Viral genome integration site
To determine the integration site of the MCV genome within the cellular genome of MS-
1, a lambda phage library was constructed from MS-1 genomic DNA and used for
library screening. The MCV genome integration in MS-1 maps to a non-coding DNA
region on human chromosome 5 (5q11.2). In the MCV genome, the integration event
occurs after base pair 2843, which maps to the ATPase/helicase domain of LT (Table
4). Four MCC tumor samples (347/348, 345, 350, and 352), identified previously as
MCV-positive (55), were tested for MCV integration sites by RACE, and no common
cellular or viral integration sites were found (Table 4), consistent with previous studies
(259, 294, 296).
Table 4. Chromosomal integration sites in MCC
!"#$%&'()*
MCC MS-1 347/348 345 350 352
Type cell line tumor tissue tumor tissue tumor tissue tumor tissue
Methods Phage library 3’RACE 3’RACE 3’RACE 5’RACE
Chromosome 5q11.2 3p14.2 6p24.3 3q26.33 10q23.1
Locusa 2,282,589 61,561,985 9,842,760 88,824,524 36,041,150
Gene Non-coding region PTPRG (intron1) MRDS1 (intron6) Non-coding region Unidentified ORF
MCV breakpoint 2843 2140 1836 596 491
+!,-.*&*
Table 4. Chromosomal integration sites in MCC

83
2.3.5 Tumorigenicity of MS-1 cells in vivo
The MCV-positive cell line MKL-1 (288) has been shown to induce tumors in
immunocompromised mice. The established MS-1 cell line was tested in NSG mice for
in vivo growth. After injecting MS-1 cells subcutaneously in the flank, tumor formation
was observed at injection sites after 30 days (Figure 17A). This represents a 14-day
delay in tumor onset as compared to MKL-1, and a slower growth behavior
subsequently (Figure 17A). The mice did not develop metastasis during the 80-day
observation period, and were killed when the tumor reached a diameter of 2cm. LT and
Figure 17. MS-1 xenograft model (A) Tumor volume graph represents average tumor volumes of 5 animals for each MS-1 and MKL-1 cell lines. (B) Immunoblot analysis of MS-1 and MKL-1 xenograft tumors shows LT as well as sT protein expression in vivo. Three separate xenograft tumor lysates were prepared for each cell line; one representative is shown here. (C) Immunohistochemical analysis of MS-1 xenograft tumors validates LT protein expression and nuclear localization (CM2B4), as well as CK20 positivity in vivo.
84
sT protein sizes were unchanged in vivo as demonstrated by immunoblot (Figure 17B).
Nuclear localization of LT protein expression was maintained, as shown by
immunohistochemistry (Figure 17C), as was perinuclear distribution of CK 20 in the
MS-1 xenograft tissue (Figure 17C).

85
2.4 DISCUSSION
Tumor-derived MCV-positive MCC cell lines represent a valuable tool for in vitro
analyses of MCV related MCC carcinogenesis. For example, Houben et al.
demonstrated that T antigen knockdown in MCV-positive MCC cell lines results in
growth arrest and cell death (297) underscoring the critical role of viral T antigen
expression in MCC tumorigenesis.
The MS-1 cell line is a newly established MCC cell line that has been maintained
in culture for few passages (<40 passages). MS-1 is positive for MCV, and displays a
tumor specific C-terminal LT truncation pattern. Using RNase P as a cellular reference
gene, T antigen copy number in MS-1 was determined by qPCR, to be 2.1 copies per
cell, which could be explained by either multiple viral integration events or virus
concatenation. At this point however, we do not have experimental evidence that would
suggest multiple integration events nor virus concatenation in MS-1. MCV-positive MCC
cell lines MKL-1 and MKL-2 also have T antigen copy numbers >1 (Table 3), and
southern blot data (Figure 15A) supports the presence of concatenated viral genomes
in these cell lines. In addition, southern blot analysis confirms higher genome copies in
MKL-1 cells than MS-1 and MKL-2 cells, which is consistent with qPCR results. In
agreement with our results, Fischer et al. have also described variations in MCV copy
number per cell in other MCC cell lines (264). However, the use of different reference
genes for qPCR copy number determination has to be taken into account since cancer
cells often harbor chromosomal aberrations. In MCC, specific chromosomal aberrations

86
for chromosomes 1, 3-8, 10, 13, and 17 have been reported (234, 235). However, there
is no reported data that suggests deletion or amplification of the RNase P reference
gene, located on chromosome 14, in MCC.
T antigen copy number per cell corresponds to LT protein expression by
immunoblot, which shows a stronger protein band for MKL-1 LT as compared to MS-1,
which has a lower copy number of T antigen per cell compared to MKL-1. One
explanation for the variations in LT expression levels observed between cell lines may
be due to a difference in protein stability caused by different truncations. However,
further studies are needed to investigate this. Even though VP2 copy numbers in the
three MCV-positive MCC cell lines are higher than the T antigen, neither VP1 protein
immunoblot (data not shown) nor quantitative RT-PCR on VP2 transcripts (Table 3)
detect expression of late gene products. These results do not support one reported
observation of viral particle production in MCC by electron microscopy (298). Instead,
our data suggests that late gene expression or viral particle production of MCV is
absent in MCC tumors.
LT proteins expressed in the MCV-positive MCC cell lines migrate at higher
molecular weights than the predicted sizes from their individual truncations. MS-1 LT is
truncated after 428 amino acids and has a predicted molecular weight of 48 kDa, but it
migrates at ~60 kDa on SDS-PAGE (Figure 15B-C). MKL-1 and MKL-2 LT protein have
predicted molecular weights of 37 kDa and 31 kDa, respectively, but they migrate at ~
50 kDa, and ~ 40 kDa. Explanations for this difference in migration may include aberrant
migration due to charge as well as post-translational modifications of LT such as
phosphorylation or acetylation, both of which have been reported previously for T

87
antigens of other polyomaviruses including murine polyomavirus middle T antigen and
SV40 LT (299, 300). Phosphorylation of LT in MKL-1 has been confirmed
experimentally (data not shown), and results in higher molecular weight of LT on SDS-
PAGE. Other modifications are likely, and require further experimental analyses.
The MCV integration site within the cellular genome of MS-1 as well as several
other MCC tumor samples was determined. A common integration site could point
toward the disruption of a cellular gene as a factor in MCC tumorigenesis. However, the
MCC tumor samples including MS-1, did not show any common integration sites nor
any interruptions of tumor suppressor genes (Table 4). Therefore, it is less likely that
the interruption of a common host cell gene by viral integration contributes to
tumorigenesis in most MCV-associated MCC.
Sequence comparison between the MS-1 cell line and its parental tumor biopsy
reveals identical viral sequences and LT truncation patterns (Figure 16). This suggests
that additional mutations of the viral genome acquired during cell culture are not
necessary to maintain the tumorigenic phenotype of MS-1 neither in culture nor in an in
vivo xenograft setting. All three MCV-positive cell lines conserve the LXCXE Rb binding
motif in LT as observed in other MCC tumor-derived LT (279). Experimentally, the
importance of LT binding to Rb has been demonstrated by Houben et al. in vitro and in
an in vivo xenograft model using the MCV-positive MCC cell lines WaGa and MKL-1
(297). However, another report demonstrates that MCV LT cannot transform rodent NIH
3T3 and Rat-1 cells in contrast to MCV sT, which alone is sufficient to transform rodent
cells (129). Therefore, LT’s Rb-targeting function may play an essential role in human

88
cell transformation in concert with sT’s oncogenic function, which is expressed intact in
all three MCC cell lines (Figure 15C).
Morphological comparison between MCV-positive and -negative cell lines
demonstrates a significant difference in appearance as has been described before
(276). Immunohistochemical analysis of the MCV-positive and MCV-negative MCC cell
lines shows that only the MCV-positive lines conform to diagnostic criteria that
distinguish MCC tumors from other neuroendocrine cancers (Table 2). These results
are in concordance with published data (276) for CK20, pan-CK as well as NSE
markers in the MCC cell lines studied. In contrast, the immunohistochemical data for
chromogranin, as well as synaptophysin presented in this study, show differences from
published results (276) for the cell lines MS-1, MKL-1, and MCC13. These differences
may be a result of different experimental techiques used, as Houben et al. determined
their results by qPCR instead of immunohistochemistry.
Despite a report by Fischer et al. of the adherent MCV-positive MCC cell line
MCCL12 (264), all MCV-positive MCC cell lines tested in this report demonstrate a
suspension growth pattern in culture. The MCV-negative cell lines used in this study are
not only immunophenotypically different from MCC they also grow adherently in vitro. In
SCLC, adherent cell growth is associated with loss of neuroendocrine marker
expression and adherent growth (286). Despite the data on UISO, MCC13 and MCC26,
the MCV-negative cell line MaTi, was found to grow in suspension similar to MCV-
positive cell lines. However, MaTi neither expresses CK20 nor other cytokeratin
markers similar to the MCV-negative cell lines studied by us. Among the MCV-negative
MCC cell lines analyzed, one cell line, MCC26, lacks expression of all neuroendocrine

89
markers examined. Those markers could be attenuated by de-differentiation of cells
associated with tumor progression. However, the difference in growth morphology and
the lack of CK20 positivity in UISO, MCC13, MCC26, and MaTi raises concern whether
they were originally derived from correctly diagnosed MCC tumors. Alternatively,
outgrowth of another cell population during the process of culturing is possible, and
could explain the difference in morphology as well as phenotypic markers by
immunohistochemistry. This is an important factor to take into account when using
MCV-negative putative MCC cell lines as controls for MCV-positive MCC cell lines.
In vivo analysis of the MS-1 cell line confirms its tumorigenic growth potential by
forming tumors in immunocompromised mice as has been shown in other MCC
xenograft studies before (277, 301, 302). MS-1 cells maintain viral T antigen expression
and LT nuclear localization, as well as CK20 positivity in vivo, demonstrating the validity
of this xenograft model with regard to MCC tumorigenesis. In vivo, MS-1 xenografts are
less tumorigenic compared to MKL-1, with a 14-day delayed onset of tumor growth as
well as a slower growth rate after tumor onset. In concurrence, xenograft models
described in the literature for different cancer cell lines show varying onsets of tumor
growth as well as differential levels of metastasis (303, 304). It is possible that higher
protein expression of LT in MKL-1 compared to MS-1 (Figure 15C) is a factor
contributing to increased tumorigenicity in vivo. Surprisingly, no metastatic growth was
observed in mice injected with MS-1 despite the aggressive nature of MCC in humans,
and the fact that MS-1 was derived from a metastasis.
The data presented in this study emphasizes that MS-1 and MCV-positive MCC
cell lines in general, represent important tools to understand MCV biology and potential

90
mechanisms of viral tumorigenesis in MCC. MS-1 in particular is a good cell culture
model due to its low passage number, and well-characterized viral features. Importantly,
MS-1 has identical features to the parental MCC tumor from which it was derived. To
conduct translational research focusing on the viral etiology of MCC, having an accurate
model system that reproduces the virus-associated features of clinical disease is
essential. MS-1 is a cell line that provides these benefits and shows great potential in
pre-clinical applications including drug screening of chemotherapeutic agents.

91
3.0 THE MINIMUM REPLICATION ORIGIN OF MERKEL CELL POLYOMAVIRUS
HAS A UNIQUE LARGE T-ANTIGEN LOADING ARCHITECTURE AND REQUIRES
SMALL T-ANTIGEN EXPRESSION FOR OPTIMAL REPLICATION
Work described in this chapter was published in the Journal of Virology
J Virol. 2009 Dec;83(23):12118-28.
with authors Kwun HJ, Guastafierro A, Shuda M, Meinke G, Bohm A, Chang Y,
and Moore P.S.
H.J. Kwun, A. Guastafierro, and M. Shuda contributed equally to this work.
H.J. Kwun, A. Guastafierro, and M. Shuda performed plasmid construction and cloning.
A. Guastafierro performed origin replication experiments and analyses. H.J. Kwun
performed immunoblotting, immunoprecipitation and ChIP experiments. M. Shuda
performed knockdown studies and immunoblotting. Dr. Mary Ann Accavitti produced
antibodies. G. Meinke performed molecular modeling. H.J. Kwun, A. Guastafierro,
M.Shuda, Y. Chang and P.S. Moore conceived the project, analyzed results and wrote
the manuscript.

92
This chapter describes the genomic mapping of the 71 bp minimal MCV replication core
origin that is sufficient for initiating eukaryotic DNA replication in the presence of wild-
type MCV large T (LT) protein. The origin includes a poly (T) rich tract and eight
variably oriented, GAGGC-like pentanucleotide sequences (PS) that serve as LT
recognition sites. Mutation analysis shows that only four of the eight PS are required for
origin replication. A single point mutation in one origin PS from a naturally occurring,
tumor-derived virus reduces LT assembly on the origin and eliminates viral DNA
replication. Tumor-derived LT having mutations truncating either the origin-binding
domain or the helicase domain also prevent LT-origin assembly. Optimal MCV
replication requires co-expression of MCV small T (sT) protein together with LT. An
intact DnaJ domain on the LT is required for replication but is dispensable on the sT. In
contrast, PP2A targeting by sT is required for enhanced replication. The MCV origin
provides a novel model for eukaryotic replication from a defined DNA element and
illustrates the selective pressure within tumors to abrogate independent MCV
replication.

93
3.1 INTRODUCTION
Unlike human cellular DNA replication origins, polyomavirus replication origins are
discrete and well-defined yet retain many features of eukaryotic cellular origins. For this
reason, polyomavirus replication origins, particularly the SV40 origin, have been used
as easily tractable models to define eukaryotic replication requirements (305).
Polyomaviruses are small, double-stranded DNA viruses with circular genomes
functionally divided into coding and noncoding regions (306). The early coding region
for all polyomaviruses encodes large tumor (LT) and small T (sT) antigens that serve as
viral oncoproteins and a late coding region that produces viral structural proteins. Aside
from LT and ST, other T antigen isoforms, such as middle T antigen (MT) and
17kT/57kT, may be present and are virus-specific. LT has pleiotropic functions that
include initiation and maintenance of viral DNA replication, regulation of early and late
genes transcription, and virion assembly (307-313). Expression of LT also leads to the
transformation of susceptible cell lines mediated in part by functional regions such as
the DnaJ, pocket protein binding, and p53 binding domains that target growth-
suppressing and cell cycle regulatory proteins (314). Additionally, sT has been shown
to play an important role in LT mediated cell transformation in SV40 (315-319) and has
been reported to increase virus replication efficiency in JCV (320).
Polyomavirus origins are situated within a noncoding site, located between early
and late viral coding regions, which also contains promoters for early and late
transcriptional units and enhancers that mediate cis-activation of early gene

94
transcription (306). Polyomavirus replication origins contain a central region, referred to
as Site 1/2 in murine polyomavirus (Py) and Site II in SV40, with variable numbers of
LT-binding pentanucleotide sequences. Since MCV is more closely related to Py, we
will use the Py nomenclature in this chapter. Site 1/2 is flanked by AT-rich regions: the
homopolymeric T tract on the late side of MCV Site 1/2 is called the AT-rich tract and is
an initial site for polyomavirus DNA melting during replication (321). For SV40, the AT-
rich region on the opposite, early side of Site 1/2 is palindromic and referred to as the
early palindrome (EP). While this region is also AT-rich in the MCV origin, no
palindrome is present (55).
An initial step in polyomavirus DNA replication is seeding of LT at consensus
DNA 5'-G(A/G)GGC-3' pentanucleotide sequences (PS) in the LT binding site 1/2 region
followed by oligomerization of double LT hexamers in a head-to-head orientation (306).
Three structural domains of SV40 LT, the DnaJ domain, the origin-binding domain
(OBD), and the helicase domain, have all been subjects of structural studies (322, 323).
Although precise mechanistic details remain unclear, it is known that the helicase
domain works in concert with the OBD to initially melt dsDNA in the AT-rich tracts. In
SV40, the melted DNA is believed to be threaded through the double hexamer of TAg
such that the two 3' ends leaving Site II (Site 1/2 in Py) pass through the centers of two
opposing hexameric rings formed by the LT helicase domain. Once loaded, LT
functions as an ATPase-driven DNA pump that also recruits cellular machinery
(replication protein A, topoisomerase, and the polymerase alpha complex) for DNA
replication (322-329). Sequence analysis shows that the MCV origin has a comparable
arrangement of sequence motifs to the replication origins of Py subgroup

95
polyomaviruses (55). In contrast to the SV40 origin, which has a minimum, definable
boundary, the replication functions of the origin of Py are more diffusely distributed
(330-333). Despite similarities between MCV and SV40 origins, neither MCV nor SV40
T antigen initiate replication of the heterologous origins from the other virus (279).
In this study, we identify an MCV core origin and define the requirement for
individual PS in LT-mediated replication that suggests the possibility of a more complex
orchestration of LT seeding for MCV than the head-to-head double hexameric
arrangement for SV40. Further, a single origin point mutation in a tumor-derived MCV
strain at a critical PS outside of the canonical LT interaction region (Site II for SV40 and
Site 1/2 for Py) abrogates MCV origin replication. We show that optimal LT initiation of
MCV replication requires both viral sT protein expression and intact cellular Hsc70
binding by LT to fully support efficient viral DNA replication.

96
3.2 MATERIALS AND METHODS
3.2.1 Plasmids
Construction of genomic (TAg206.wt, TAg350, TAg339) and cDNA (57kT.wt) TAg
expression plasmids were described previously (279, 281). For the LT cDNA constuct,
cDNA was first amplified by PCR (281) followed by site directed mutagenesis to delete
the 57kT exon 3 splice acceptor site using PCR primers 5'-CAC TTT TCC CCA AAA
GCA AAT CTA AGA GAT TCC C-3' and 5'-GGG AAT CTC TTA GAT TTG CTT TTG
GGG AAA AGT G-3'. To generate sT-eGFP, the open reading frame of sT was
amplified from MCC350 (55) using primers (LT.EcoRV.S: CCG ATA TCA TGG ATT
TAG TCC TAA ATA GG, sT.XhoI.AS: GGG CTC GAG TAG AAA AGG TGC AGA TGC
AG) and cloned into pcDNA6/V5-HisB (Invitrogen) using EcoRV and XhoI restriction
sites. The sT fragment was then transferred into pEGFP-N1 (Clontech) using the NheI
and SacII sites.
For DnaJ domain mutants of LT genomic constructs, D44H and D44N were
generated by a QuikChange Lightning Site-Directed Mutagenesis Kit (Stratagene) using
TAg206.wt (279) as a template and the following primer pairs: T.D44H(S) (5'-GCT TAA
AGC ATC ACC CTC ATA AAG GGG GAA ATC C-3') and T.D44H(AS) (5'-GGA TTT
CCC CCT TTA TGA GGG TGA TGC TTT AAG C-3'); T.D44N(S) (5'-GCT TAA AGC
ATC ACC CTA ATA AAG GGG GAA ATC C-5') and T.D44N(AS) (5'-GGA TTT CCC
CCT TTA TTA GGG TGA TGC TTT AAG C-3'). For LXCXK.D44N, primers T.D44N(S)

97
and T.D44N(AS) was used for PCR reaction using TAg206.wt.LXCXK (279) as a
template.
MCV replication origin plasmids were amplified by PCR from MCC339 genomic
DNA (GenBank # EU375804) with published primer sets (278) and cloned into pCR2.1
(Invitrogen).
3.2.2 Generation of Antibodies
Monoclonal antibodies, CM8E6 and CM2B4 (281), were generated by standard
methods of immunizing mice with KLH-derivatized MDLVLNRKERREALC or
CSRSRKPSSNASRGA peptide that correspond to the MCV TAg exon 1 and 2,
respectively (Epitope Recognition Immunoreagent Core facility, University of Alabama).
3.2.3 MCV origin replication assay
Human embryonic kidney (HEK) 293 cells were maintained in DMEM supplemented
with 10% FBS, 2 mM glutamine and penicillin/streptomycin. 293 Cells were transfected
with MCV origin constructs and either empty vector or TAg expression vector by
Lipofectamine 2000 (Invitrogen). Cells were harvested 48 h after transfection, lysed with
TE/0.6% SDS buffer (10 mM Tris-HCl (pH 8.0), 1 mM EDTA and 0.6% SDS) for 10 min
and then NaCl was added at a final concentration of 1 M. Lysates were centrifuged at
14,000 rpm for 30 min at 4°C to collect episomal DNA. After phenol-chloroform
extraction, 5 µg of the collected DNA was double digested overnight with 10 units each
of DpnI and BamHI. Digested DNA was loaded on 0.8% agarose gel, transferred onto

98
nitrocellulose membrane, and subjected to Southern hybridization (279). Replication
efficiency was detected by Southern hybridization with 32P-labeled probe produced by
PCR with primer pairs (Rep-S, 5'-GCC GCC AAG GAT CTG ATG-3'; pCR2.1-AS, 5'-
CTG CGC AAG GAA CGC CCG TCG-3') and analyzed by PhosphorImager (Typhoon
9400, GE Healthcare) and ImageQuant software (GE Healthcare). All replication assays
were performed at least twice and a representative experiment is shown. Expression
levels for LT and sT-eGFP were confirmed in each transfection by immunoblotting using
anti-V5 (Invitrogen), CM2B4, or anti-GFP (B-2) (SantaCruz).
3.2.4 Immunoprecipitation
293 cells were cotransfected with pCMV-myc/Hsc70 (334) and either pcDNA6/V5-
His/lacZ plasmid (Invitrogen) or TAg plasmid (TAg206.wt, D44H and D44N) using
Lipofectamine 2000 (Invitrogen). Cells were harvested 48 h after transfection,
suspended in lysis buffer (50 mM Tris-HCl, 0.15 M NaCl, 1% Triton-X100, pH 7.4)
supplemented with protease inhibitors. Precleared lysates were immunoprecipitated
with either mouse monoclonal anti-c-myc (9E10) (SantaCruz) or rabbit anti-V5 (Bethyl)
overnight at 4°C. Lysates were incubated with Protein A sepharose beads (Amersham)
for 3 h at 4°C, collected and washed with lysis buffer. Beads were resuspended in
2SDS loading buffer and proteins were separated by SDS/PAGE. Immunoblotting was
performed with either anti-c-myc (SantaCruz) or anti-V5 (Invitrogen).

99
3.2.5 shRNA knockdown
Short hairpin RNA (shRNA) sequences targeting TAg (shT) and sT (shsT) alone were
designed and inserted into a short hairpin RNA expressing plasmid pLKO.1-TRC
(Addgene). Sequences for shT (sense strands, 5'-CCG GAA GAG AGG CTC TCT GCA
AGC TCT CGA GAG CTT GCA GAG AGC CTC TCT TTT TTG-3') and shsT (sense
strand, 5'-CCG GAA GTT GTC TCG CCA GCA TTG TTC AAG AGA CAA TGC TGG
CGA GAC AAC TTT TTT TG-3') were cloned using AgeI and EcoRI sites in the shRNA
cassette of pLKO.1, respectively. A scrambled non-targeting short-hairpin RNA plasmid
(scr) (Addgene) was used as control shRNA. For origin replication assay, 2 µg of TAg
expression construct, 1 µg of origin construct were cotransfected with 2 µg of short
hairpin construct into 293 cells grown in 6 well plate by Lipofectamine 2000 (Invitrogen).
Cells were harvested and processed as described above.
3.2.6 Chromatin immunoprecipitation (ChIP)
TAg expression plasmids (TAg206.wt, TAg339, TAg350) or pcDNA6/V5-His empty
vector (Invitrogen) were transfected with Ori339(97) or Ori350(97) plasmid into 293 cells
using Lipofectamine 2000 (Invitrogen). Cells were cross-linked with 1% formaldehyde in
PBS and DNA was sheared by sonication in lysis buffer (50 mM Tris (pH 8.0), 1% SDS,
10 mM EDTA (pH 8.0) with protease inhibitors). Cell lysates were diluted 10 times with
dilution buffer (20 mM Tris (pH 8.0), 1 % Triton X-100, 2 mM EDTA (pH 8.0), 150 mM
NaCl with protease inhibitors) and one third of diluted lysates was precleared with
protein A sepharose (GE Healthcare)/ 2 µg of sonicated salmon sperm DNA

100
(Stratagene) for 2 h at 4°C. Cell lysates were incubated overnight at 4°C with anti-V5
(Bethyl) antibody and then with Protein A sepharose beads/2 µg salmon sperm DNA for
2 h at 4°C. Beads were washed 4 times with buffer I (20 mM Tris-HCl (pH 8.0), 150 mM
NaCl, 1% Triton X-100, 2 mM EDTA, 0.1% SDS), buffer II (20 mM Tris-HCl (pH 8.0),
500 mM NaCl, 1% Triton X-100, 2 mM EDTA, 0.1% SDS), buffer III (10 mM Tris-HCl
(pH 8.0), 500 mM LiCl, 1% NP40, 1% deoxycholate, 1 mM EDTA) and TE (10 mM Tris-
HCl (pH 8.0), 1 mM EDTA). DNA was extracted with buffer (100 mM NaHCO3, 1% SDS)
and incubated at 65°C overnight to reverse cross-linking. DNA was purified and
resuspended in distilled water followed by real time quantitative PCR (qPCR) performed
with primers, Rep-S 5'-GCC GCC AAG GAT CTG ATG-3' and Rep-AS, 5'-GAG AAC
CTG CGT GCA ATC-3' using Smart Cycler 5RX4Z01 (Cepheid) and SYBR GreenER
qPCR SuperMix reagents (Invitrogen) according to manufacturer’s instruction.
3.2.7 Molecular modeling
The model of the MCV origin-binding domains on DNA was generated in COOT (335).
A homology model of the MCV TAg OBD on a fragment of double-stranded GAGGC-
containing DNA was generated using the SV40 OBD structure (PDB code 2NCG) as a
template. Copies of the MCV OBD model were placed on idealized B-form DNA with
the MCV origin sequence by superimposing the GAGGC sequence within the homology
model onto each of the GAGGC-like sites in the model of the origin. The figure shown
was generated in Pymol (http://www.pymol.org).

101
3.3 RESULTS
3.3.1 The minimum MCV replication origin is defined by a 71 nucleotide genomic
region
MCV is more closely related to the Py subgroup of polyomaviruses than to other human
polyomaviruses or SV40 (55). We aligned the sequences of the MCV origin with
presumptive origin sequences of SV40 and Py (Figure 18A). The common features of
the core origin in the SV40 subgroup are the presence of the AT-rich tracts contributing
to DNA melting (321, 336), flanked by a Site 1/2 region containing six GAGGC
pentanucleotide repeats. An early promoter region containing additional GAGGC
binding sites is also present. This region is required for Py virus replication but is
dispensable for SV40 origin replication (337-339). The entire origin of MCV contains ten
potential LT binding sequences (PS1-PS10, Figure 20A), six on one strand and four on
the opposite strand. Eight of these pentanucleotides match the most common LT
binding sequence 5'-GAGGC-3', while two, PS2 and PS3, in Site 1/2 have imperfect
consensus sequences: 5'-GGGGC-3' and 5'-GAGCC-3', respectively.
To define the elements required for LT-mediated replication of MCV, deletions
were generated for a tumor-derived MCV origin construct (Ori339(589), nt 4669 to 269)
from MCV clone 339 (GenBank # EU375804) (Figure 18A). This origin fragment is
perfectly conserved in most tumor and all nontumor-derived MCV strains thus far
sequenced. Origin constructs were cloned into pCR2.1 (Invitrogen) and co-transfected

102
together with a full-length wild-type T antigen genomic expression construct
(TAg206.wt, isolated from intestine tissue of a patient without MCC) into 293 cells. In
this study, we refer to the genomic T antigen cassette as TAg, which expresses small T
(sT) and 57kT proteins from alternatively spliced mRNAs in addition to LT protein (279).
Origin replication was determined by Southern hybridization in which DpnI-resistant
(replicated) signal is normalized to DpnI-sensitive (unreplicated) signal. In contrast to
Py but similar to SV40, the MCV origin can be reduce to a discrete region such that
constructs encompassing only an 80 bp origin show efficient replication by MCV TAg
(Figure 18B). Replication is completely abolished for a shorter 69 bp origin construct.
The 80-bp fragment (nt. 5356-nt 48) contains, in addition to the AT-rich tract, eight of
the identifiable LT binding PS (Figure 18A) indicating that PS9 and PS10 are not
required for origin replication.
4669 5356 65 269
Fig.1
SV: CTGACTAATTTTTTTTATTTATGCAGAGGCCGAGGCCGCCTCGGCCTCTGAGCTATTCCAGAAGTAGTGAGGAGGCTTTTTTGGAGGCC !
Py: ACAGCTGTTTTTTTTAGTATTAAGCAGAGGCCGGGGGCCCCTGGCCTCCGCTTACTCTGGAAAAAGAAGAGAGGCATTGTAGAGGCTTCCAGAGGCA!
MC: GTGACTTTTTTTTTTCAAGTTGGCAGAGGCTTGGGGCTCCTAGCCTCCGAGGCCTCTGGAAAAAAAAGAGAGAGGCCTCTGAGGCTTAAGAGGCTTA!
Ori339(589)
Ori339(232)
Ori339(97)
Ori339(80)
Ori339(69) 5356 37
5356 48
5356 65
5221 5356 65
A. AT-rich tract Site II EP Early enhancer
LATE EARLY
SV40 core origin B.
DpnI resistant
1.0 0.8 0.6 0.4 0.2
0 Rep
licat
ion
Effi
cien
cy
TAg206.wt - +
Site 1/2

103
Figure 18. Mapping of the MCV core origin (A) Comparison of the origin sequences among polyomavirus family. The straight and dotted arrow heads indicate complete (GAGGC) or incomplete pentanucleotide sequences (GXGGC, GAGXC) serving for LT binding sites, respectively. The origin of SV40 subgroup (GenBank# EF59667.1) consists of highly conserved region, including AT-rich tract on the late gene side, Site II GAGGC repeats, early palindrome (EP), and early enhancer region on the early gene side. MCV origin (GenBank# EU375804) is closely related to the origin of Py (GenBank# J02288). MCV origin constructs of different lengths (589 bp-69 bp) were cloned into pCR2.1 vector (Invitrogen) to identify the core origin sequence. (B) Deletion analysis of MCV origin. The origin constructs were cotransfected into 293 cells with either TAg206.wt or empty vector as a negative control and the replication from the MCV origin was analyzed by Southern blotting. The autoradiogram was quantified using ImageQuant software (GE Healthcare). The DpnI sensitive DNA band was used as an internal standard for the amount of input DNA.
To define a minimal core origin, we successively truncated single-base pairs from
the early and late sides of the 80 bp origin until replication was completely abolished
(Figure 19). A significant decline in MCV replication efficiency occurs only after deletion
of four of the ten thymidines in the polyT tract (dN70). This is in contrast to the SV40
origin which requires an intact polyT tract for efficient replication (321). MCV origin
replication also declines sharply starting at the dC78 deletion that truncates PS8 on the
early side of the origin. Thus, unlike Py, a minimal MCV core origin consisting of the 71-
bp region from nucleotides 5364 through 47 can efficiently sustain LT-mediated DNA
replication.
4669 5356 65 269
Fig.1
SV: CTGACTAATTTTTTTTATTTATGCAGAGGCCGAGGCCGCCTCGGCCTCTGAGCTATTCCAGAAGTAGTGAGGAGGCTTTTTTGGAGGCC !
Py: ACAGCTGTTTTTTTTAGTATTAAGCAGAGGCCGGGGGCCCCTGGCCTCCGCTTACTCTGGAAAAAGAAGAGAGGCATTGTAGAGGCTTCCAGAGGCA!
MC: GTGACTTTTTTTTTTCAAGTTGGCAGAGGCTTGGGGCTCCTAGCCTCCGAGGCCTCTGGAAAAAAAAGAGAGAGGCCTCTGAGGCTTAAGAGGCTTA!
Ori339(589)
Ori339(232)
Ori339(97)
Ori339(80)
Ori339(69) 5356 37
5356 48
5356 65
5221 5356 65
A. AT-rich tract Site II EP Early enhancer
LATE EARLY
SV40 core origin B.
DpnI resistant
1.0 0.8 0.6 0.4 0.2
0 Rep
licat
ion
Effi
cien
cy
TAg206.wt - +
Site 1/2

104
Figure 19. Definition of the minimal MCV core origin Single-base pair deletions from both sides of the origin sequence (late-nt 5356, early-nt 48) were performed to define a minimal core origin. The expression level of TAg was observed by Western blotting (data not shown) and autoradiogram of replication was quantified as in Fig. 1B (middle panel).
Fig. 2
1.2
1.0
0.8
0.6
0.4
0.2
0
Nor
mal
ized
R
eplic
atio
n E
ffici
ency
GAGGCCTCTGAGGCTTAAGAGGCTTA dC80 GTGACTTTTTTTT--GAGGCCTCT ! dC79 GTGACTTTTTTTT--GAGGCCTC! dC78 GTGACTTTTTTTT--GAGGCCT ! dC77 GTGACTTTTTTTT--GAGGCC! dC76 GTGACTTTTTTTT--GAGGC! dC75 GTGACTTTTTTTT--GAGG! dN76 ACTTTTTTTT--GAGGCCTC! dN75 CTTTTTTTT--GAGGCCTC! dN74 TTTTTTTT--GAGGCCTC! dN73 TTTTTTT--GAGGCCTC! dN72 TTTTTT--GAGGCCTC! dN71 TTTTT--GAGGCCTC! dN70 TTTT--GAGGCCTC! dN69 TTT--GAGGCCTC! dN68 TT--GAGGCCTC!
Ori339(97) GTGACTTTTTTTT--
+ - TAg206.wt
DpnI sensitive
DpnI resistant
dN76
dN
75
dN74
dN
73
dN72
dN
71
dN70
dN
69
dN68
dC75
dC
76
dC77
dC
78
dC79
dC
80
Ori3
39(9
7)
Ori3
39(9
7)

105
3.3.2 Pentanucleotide requirements for MCV replication.
Four LT binding sites (Figure 18A) are present in the SV40 core origin, and all four
pentanucleotides are necessary for origin DNA unwinding and replication events with
pentanucleotides 1 and 3 needed for double hexamer formation (340, 341). These
pentanucleotides are arranged on opposite strands allowing the double SV40 LT
hexamer to form in a head-to-head orientation (342).
Figure 20. Pentanucleotide requirements (A) Mutation of each pentanucleotide in 97-bp origin was generated by PCR-based direct mutagenesis (AT to GC) to define the essential pentanucleotides for MCV origin replication. Replication efficiency was examined by Southern blotting (B).
Fig. 3
B.
1.0
0.8
0.6
0.4
0.2
0 Rep
licat
ion
Effi
cien
cy
Ori3
39(9
7)
Ori3
39(9
7)
mt1
m
t2
mt3
m
t4
mt5
m
t6
mt7
m
t8
DpnI resistant
DpnI sensitive
TAg206.wt - +
mt1 AGAAT!mt2 AAAAT!mt3 AATCT!mt4 ATTCT!mt5 AGAAT!mt6 ATTCT!mt7 AGAAT!mt8 ATTCT!
Ori339(97) GTGACTTTTTTTTTTCAAGTTGGCAGAGGCTTGGGGCTCCTAGCCTCCGAGGCCTCTGGAAAAAAAAGAGAGAGGCCTCTGAGGCTTAAGAGGCTTA!
DNA Replication
+++
- - - +
+++ +++
- -
8
7
6
5
4 3
2 1 A.
9 10

106
To determine whether a similar pentanucleotide arrangement is needed for MCV
replication, mutations were introduced that disrupted all five nucleotides of
pentanucleotide sequences PS1-8 in the 97-bp origin (Figure 20A). Mutations in three
pentanucleotides within the region most analogous to Site II (PS1-4) (Figure 18A) and
two pentanucleotides (PS7, 8) near the early enhancer region abolish replication. The
PS4 mutant significantly diminishes replication. In contrast, PS5 and PS6 are
dispensable (Figure 20B).
Since PS2 and PS3 partially overlap, as do PS7 and PS8, complete
pentanucleotide substitutions affect overlapping elements because of shared
nucleotides. We therefore investigated critical nucleotides in these four elements (PS 2,
3, 7, 8) by introducing single mutations to determine which of the overlapping PS
sequences are essential (Figure 21A) as well as critical nucleotides in PS1. Figure
21B shows that single base pair mutations in three pentanucleotides (PS1, 2 and 7)
impair efficient replication. In the non-consensus PS2 element, a single substitution
mutation that reconstitutes a canonical GAGGC site remains competent for replication
(Figure 22B). Single mutations unique to the PS3 site that do not overlap with the
opposite strand PS2 have no effect on replication suggesting that PS2 is the critical LT
binding element in this overlapping pair. A PS3 (S3-2C) mutation that creates the same
head-to-head LT binding site as in the Py origin (GGGGCCCC) (Figure 18A) has no
replication capacity (Figure 22B), indicating that the MCV LT replication complex may
form assemblies on the DNA that are distinct from Py and SV40.

107
Figure 21. Single base pair mutational analysis of pentanucleotides (A) Each sequence of Pentanucleotides 1, 2-3 and 7-8 was mutated by AT to GC substitutions to disrupt TAg binding site. To avoid reconstitution of T Ag binding site (5'-G(A/G)GGC-3') by mutation, AG to T substitutions were introduced in S7-2, S8-2, S2-2 and S3-2. (B) Southern blot results demonstrate that single base mutations in pentanucleotides 1, 2 and 7 can abolish replication efficiently indicating that these pentanucleotides sites are critical for MCV origin replication as a functional unit.
Fig. 4
B. TAg206.wt - + - +
1.0
0.8
0.6
0.4
0.2
0 Rep
licat
ion
Effi
cien
cy R
eplication Efficiency
1.2 1.0 0.8 0.6 0.4 0.2 0
Ori3
39(9
7)
Ori3
39(9
7)
S1-1
S1
-2
S1-3
S1
-4
S1-5
S2
-1
S2-2
S2
-3
S2-4
S2
-5
S3-2
S3
-1
Ori3
39(9
7)
Ori3
39(9
7)
S7-1
S7
-2
S7-3
S7
-4
Ori3
50(9
7)
S8-3
S8-2
S8
-1 DpnI resistant
DpnI sensitive
A. GTGACTTTTTTTTTTCAAGTTGGCAGAGGCTTGGGGCTCCTAGCCTCCGAGGCCTCTGGAAAAAAAAGAGAGAGGCCTCTGAGGCTTAAGAGGCTTA!
8
7
6
5
4 3
2 1!
+++ + - - - - - - + -
+++ +++
+ - - - -
+++ +++ +++
DNA Replication
+++ Ori339(97)!
S1-1 A!S1-2 T!S1-3 A!S1-4 A!S1-5 A!S2-1 A!S2-2 T!S2-3 A!S2-4 A!S2-5 T!S3-2 A!S3-1 T !S7-1 A!S7-2 T!S7-3 A !S7-4 A ! A !S8-3 T!S8-2 A!S8-1 T!
Ori350(97)!
9 10

108
Figure 22. Reconstitution of pentanucleotide sequence to GAGGC (A) In the non-consensus PS2 element (GGGGC), a single substitution mutation that reconstitutes a canonical GAGGC site (S2-2A) by A:T to G:C base pair substitutions remains competent for replication. (B) Southern hybridization results.
DpnI resistant
1.0 0.8
0.60.4
0.20 R
eplic
atio
n E
ffici
ency
TAg206.wt - +
DpnI sensitive
Ori3
39(9
7)
Ori3
39(9
7)
S7-1
S7
-2G
S7
-3
S7-4
O
ri350
(97)
S8
-3
S8-2
C
S8-1
S2
-1
S2-2
A
S2-3
S2
-4
S2-5
S3
-2C
S3
-1
A.
B.
Ori339(97) GTGACTTTTTTTTTTCAAGTTGGCAGAGGCTTGGGGCTCCTAGCCTCCGAGGCCTCTGGAAAAAAAAGAGAGAGGCCTCTGAGGCTTAAGAGGCTTA!8
7
6
5
4 3
2 1 DNA
Replication +++
A! G! A ! A! A ! T! C! T! A! A! A! A! T! C ! T !
S7-1 !S7-2G!S7-3!S7-4!Ori350(97)!S8-3!S8-2C!S8-1!S2-1!S2-2A !S2-3!S2-4 !S2-5!S3-2C!S3-1!
+ +++
- - -
+++ +++ +++
- +++
- - - -
+++
9 10

109
The importance of PS7 to MCV replication is illustrated by naturally arising
mutations at the viral origin (Ori350(97) lane of Figure 21B). We sequenced MCV
origins from one non-tumor tissue, 8 MCC tumors and 2 cell lines (55). Only the origin
sequence from one tumor, MCV350 (GeneBank# EU375803), has a C to A substitution
in position 5 of PS7 that also alters the sequence of the overlapping PS8. This natural
mutation completely abrogates origin replication in the presence of TAg (Figure 21B).
The TAg gene from this virus also possesses a TAg locus truncation mutation (279) that
eliminates both the LT OBD and helicase domain.
3.3.3 Effects of Tumor-derived LT mutations on origin binding and replication
As shown here (Figure 21B), and described previously (279), tumor-derived MCV TAg
is unable to initiate MCV origin replication due to truncating mutations in the LT protein.
We compared origin-binding properties for wild-type LT protein (TAg206.wt) on the wild-
type origin (Ori339(97)) and the mutated Ori350 (Ori350(97)), as well as mutant LT
proteins from tumor derived viral strains (MCV339 and MCV350) (Figure 23). MCV339
LT protein retains the OBD but has a truncated helicase domain, whereas the MCV350
LT mutation eliminates both the OBD and helicase domains (279). Quantitative
chromatin immunoprecipitation (ChIP) assays demonstrate that wild-type TAg206
efficiently binds to the wild-type origin Ori339 but binding to Ori350, possessing the
PS7/PS8 mutation, is reduced ~50%. Origin-binding by MCV339 and MCV350 TAg
proteins is comparable to vector alone controls for both viral origins suggesting that
structural or enzymatic features of the MCV LT helicase domain are required for
efficient recognition of the DNA element.

110
Figure 23. Chromatin immunoprecipitation (ChIP) analysis (A) The binding efficiency of both non-tumor and tumor-derived TAg to MCV origin in vivo was examined using ChIP assay. The 97 bp origin-containing plasmid (Ori339(97) or Ori350(97)) and the TAg constructs from non-tumor (TAg206.wt) or tumor (TAg350, TAg339) tissues (279) were co-transfected into 293 cells and the binding of LT to the origin was investigated by quantitative PCR (qPCR). All experiments were repeated at least three times. Error bars indicate the standard deviation. (B) Immunoblot analysis confirming protein expression of TAg206, TAg350 and TAg339 using the LT specific antibody CM2B4.
Other factors influencing MCV replication
Four major TAg transcripts (T1-T4) have been identified using RACE and Northern
blotting that correspond to LT, sT, and 57kT (279) (Figure 24A). The sT of MCV shares
exon 1 with LT, which contains the conserved CR1 (LXXLL motif) and DnaJ (HPDK
motif) domains, but lacks the LT OBD required for DNA recognition. The sT also
encodes a PP2A binding site (CXCXXC) that is spliced out of LT and 57kT cDNAs. To
test the effect of sT and other transcripts on viral origin replication, each cDNA transcript
was cloned to express a unique TAg isoform. Each cDNA construct, singly and in
combination, was then transfected into 293 cells to assess effects on origin replication.
As seen in Figure 24B, LT cDNA expression alone is not sufficient for fully efficient
replication, but replication efficiency is restored to that of the wild type genomic TAg by

111
coexpression of LT with sT. Coexpression of LT with 57kT does not increase replication
over LT alone, and neither MCV sT nor 57kT individually have replication capacity.
To confirm the importance of sT in replication, we generated two short hairpin
RNA (shRNA) constructs: shT targets all TAg transcripts and shsT targets only sT
(Figure 24A) (279). We also generated a monoclonal antibody, CM8E6, directed
against an exon 1 peptide shared by all TAg isoforms. Western blotting shows that shT
down-regulates LT, sT, and 57kT protein expression as expected, whereas shsT only
reduces sT expression (19 kDa) (Figure 24C). Knockdown of TAg proteins by either
shT or shsT results in inhibition of origin replication compared to shScr control,
confirming the functional importance of sT expression to MCV origin replication (24D).

112
Figure 24. Other factors influencing MCV replication (A) Alternative spliced products (T1-T4) of the early region give rise to large T (LT), small T (sT), and 57kT. Arrows indicate the position of shRNAs, shT and shsT. shT targets all TAg transcripts while shsT targets only sT transcripts. Asterisk and star show epitope sites of CM8E6 and CM2B4 antibodies, which detect LT/57kT/sT or LT/57kT proteins, respectively. The predicted MCV LT gene sequence retains all major conserved features of other polyomavirus LTs, including DnaJ, Rb-targeting, origin-binding, and helicase/ATPase domains. (B) LT, 57kT, and sT expression plasmids were cotransfected in combination into 293 cells to test contribution of origin replication. The genomic TAg construct (TAg206.wt) was used to express all three transcripts (LT, sT, 57kT). For the sT expression, EGFP fused sT expressing plasmid was used. Western blotting was performed to monitor the expression level of each transcript product using V5 antibody (Invitrogen) for LT and 57kT, and anti-GFP (SantaCruz) antibody for sT. Knockdown of LT, 57kT, and/or sT expression (C) and the effect on replication (D) by shRNA was examined. A scrambled non-targeting short-hairpin RNA plasmid (scr) was used as a control. Three specific bands (120, 57, 19 kDa) are detected by Western blotting using CM8E6 antibody in 293 cells transfected with genomic TAg expression constructs (TAg206.wt) (C, right panel). CM2B4 detected both ~120 kDa and ~57 kDa bands corresponding to the full-length LT and 57kT protein products, respectively (281) (C, left panel). (E) Interaction of TAg with Hsc70. To examine the interaction between TAg and Hsc70, Myc-tagged Hsc70 construct (pCMV-myc-Hsc70) was transfected into 293 cells with either V5-tagged wt TAg (TAg206.wt) or mt TAg (D44H, D44N). Lysates were immunoprecipitated with anti-myc or anti-V5 antibody and immunoblotted with anti-V5 or anti-myc antibody in a reciprocal way, respectively. The LacZ gene expressing vector, pcDNA6/V5-His/LacZ (Invitrogen) was used as a negative control for binding and 2% of the lysate was used for input control (~115 kDa). (F) Hsc70 binding to TAg promotes efficient viral replication. For the replication assay, TAg206.wt or mutants (Rb binding mutant, LXCXK; Hsc70 binding mutant, D44N; Rb/Hsc70 binding mutant, LXCXK/D44N) were cotransfected with MCV origin plasmid (Ori339(97)) into 293 cells. Replication efficiency was measured and quantified using ImageQuant (GE Healthcare).

113
Both MCV LT and sT contain DnaJ motifs encoded by exon 1 that are conserved
among polyomaviruses and recruit interaction with chaperone heat-shock proteins
(343). SV40 TAg association with Hsc70 (344) is mediated through the HPDK motif
within the DnaJ domain (334, 345) which is required for efficient origin replication. We
confirmed that this motif in MCV is a site for Hsc70 interaction by coimmunoprecipitation
of V5-tagged wild-type (TAg206.wt) and DnaJ domain mutant (D44H and D44N)
proteins with myc-tagged Hsc70 (Figure 24E).
To test whether Hsc70 interaction with MCV TAg is required for efficient viral
DNA replication, wild type (TAg 206.wt) and the LT DnaJ mutant D44N were tested for
origin replication using the Ori339(589) (Figure 24F). Mutation of the LT DnaJ domain
markedly decreases origin replication compared to wild-type MCV TAg, whereas
mutation of the MCV LT retinoblastoma-binding motif (LXCXE) does not, similar to
results found for SV40 TAg (334). The MCV D44N LT mutant is less stable than wild-
type MCV LT but enhanced expression to generate comparable levels of both proteins
does not increase replication with the DnaJ-binding deficient protein (data not shown).
In contrast, mutation of the DnaJ domain in sT has no effect on the ability of sT to
enhance wild-type LT replication efficiency. In addition, mutation in the PP2A domain of
sT abolishes its ability to enhance LT-mediate origin replication (Figure 25).

114
Figure 25. MCV origin replication assay with TAg mutants in DnaJ domain and PP2A binding site The HPDK motif in the LT DnaJ domain was mutated (D44N) in constructs, gTAg206.wt, cLT206.wt and sT.wt. A PP2A binding site mutant of sT was generated by substituting Cys 109 to Ser. Origin plasmid (Ori339(97)) was cotransfected with wild type or various mutant TAgs into 293 cells and Southern blotting was performed. Mutation of the DnaJ domain in sT (sT.DnaJ.D44N) has no effect on wild-type LT replication efficiency. In contrast, the PP2A site mutant of sT (sT.PP2A.C109S) abolishes contribution of sT to enhance origin replication efficiency.

115
3.4 DISCUSSION
We find that a minimal MCV 71 bp core origin sequence is sufficient for TAg-directed
DNA replication. Like other polyomaviruses, this MCV core origin contains three
subdomains: an AT-rich tract, a LT-binding domain, and an early enhancer region. The
AT-rich tract for SV40 directs DNA bending that may be a structural signal for LT
binding (321). Adjacent to the AT-rich tract, pentanucleotides sequences are arranged
as two pairs of imperfect repeat sequences (PS 1-4) inverted with respect to each other.
These repeats are similar, but more closely spaced than those in SV40. Of these four,
only three (PS1, PS2, and PS4) are required for origin replication. In addition to these
three PS elements, the MCV origin has an additional LT binding site at PS7, which is
required for origin replication and if disrupted, as found in a naturally-occurring tumor-
derived strain, markedly reduces LT binding to the origin element in our quantitative
ChIP assay and completely ablates origin replication. Mutational substitution analysis
shows that even single point mutations on other essential PS also disrupt origin
replication.
The origin binding domains of MCV, Py and SV40 are similar in sequence, and
the residues shown to bind GAGGC pentamers are highly conserved in the three
viruses. Sequence comparison reveals that the MCV OBD is 49% identical to Py and
48% identical to SV40 (data not shown). To better understand why MCV requires fewer
GAGGC binding sites than other viruses for its replication, the crystal structure of the
SV40 OBD on DNA was used to model the interaction of MCV TAg with the MCV origin.

116
As shown in Figure 26, the closely spaced PS sites also position the OBD of LT closely
to one another. Given this proximity, it is likely that OBD-OBD interactions occur while
apposing LT molecules are bound to the DNA. Such interactions are not observed in
SV40, where the GAGGC sequences are farther separated, but they do occur in the
more distantly related bovine papilloma virus (BPV) system (346, 347). In BPV, the
analogous domain is part of the E1 protein and is not capable of recognizing its binding
site without the help of the virally-encoded E2 protein. MCV origin recognition may
share features of both SV40 and BPV.
Figure 26. Model of the MCV OBDs on the MCV origin A model of the MCV OBD was placed on each of the putative binding sites. OBDs positioned at the required PS1, PS2, PS4 and PS7 are shown in blue. The remainder are yellow. The GAGGC sequences are shown in cyan. The AT-rich tracts of DNA that flank Site 1/2 are shown in purple.
MCV is similar to SV40 in that replication does not require an E2-like protein, but
like BPV, interactions among the OBDs may help stabilize the complex on the DNA,
perhaps alleviating the need for well-formed binding sites at all positions. Based on our
modeling, two sets of OBD-OBD interactions may occur on the DNA, both of which are

117
head-to-head interactions. The first is between the OBDs bound to PS2 and PS3, and
the putative protein-protein interface involves amino acids within the major groove of the
DNA. The second potential interaction involves residues well outside of the DNA-
binding cleft and could occur between OBDs on PS1 and PS3 and between OBDs on
PS2 and PS4.
We also examined non-origin factors related to viral replication efficiency.
Previously, several studies using SV40, Py and JCV sT defective viruses or constructs
have demonstrated that the absence of a functional sT reduces replication efficiency
(320, 348, 349). In this report, we generated separate cDNA constructs for each early
gene transcript product (LT, 57kT, sT) to clarify the role and contribution of sT in viral
replication. We find that sT, but not 57kT, has a major role in enhancing LT mediated
replication in MCV. The mechanism for sT replication enhancement in MCV remains
poorly understood but it is likely that sT does not act directly in the LT-origin replication
complex. Like other polyomavirus sT, MCV sT binds PP2A (129), a serine/threonine
phosphatase critical to development, growth control and tumorigenesis (350). MCV sT
might stimulate cell cycle entry through PP2A binding thus providing conditions for
origin replication. Alternatively, sT expression might selectively affect the
phosphorylation state of LT to enhance its binding affinity to the origin DNA binding site
(351, 352). Intriguingly, both MCV LT and sT possess DnaJ domains that recruit
Hsp70; while an intact LT DnaJ domain is required for efficient replication, an intact sT
DnaJ domain is not. Site-directed mutagenesis of DnaJ domain residues reveals that
this domain is necessary for LT and MT stability (353). We also find that MCV TAg
DnaJ domain mutants are destabilized. While reduced protein expression may account

118
for some of the reduced activity of LT having DnaJ domain mutations, replication
remains reduced even when the mutant protein is expressed at comparable levels to
the wild-type protein.
The minimal replication origin of MCV provides a novel model for a defined
genetic replication element. Our studies suggest that there is strong selective pressure
within MCV-infected MCC tumors to eliminate independent viral DNA replication.
Tumor-derived mutant MCV TAgs and origins may prove useful for structural and
functional studies dissecting steps involved in TAg-dependent DNA replication.

119
4.0 MERKEL CELL CARCINOMA-DERIVED MERKEL CELL POLYOMAVIRUS T
ANTIGEN INDUCES HUMAN CELL PROLIFERATION THROUGH ITS RB
TARGETING DOMAIN BUT IS INSUFFICIENT TO TRANSFORM HUMAN
FIBROBLASTS
Work described in this chapter is unpublished. Parts of the data presented here are in
preparation for manuscript submission
with authors Anna Guastafierro, Masahiro Shuda, Huichen Feng, Yuan
Chang and Patrick S. Moore.
A. Guastafierro, M. Shuda, and H. Feng contributed equally to this work. A. Guastafierro
performed the generation of stable cell lines, cell-counting experiments, RNA isolation
and microarray analysis, soft agar colony formation assays, FACS analysis and
immunoblots. M. Shuda cloned the shRNA constructs used here and H. Feng analyzed
microarray data and generated heat map images. All authors contributed to data
interpretation and manuscript preparation.

120
4.1 INTRODUCTION
The study of tumor viruses has elucidated a large number of protein signaling networks
that are involved in cancers of diverse cellular origins (354, 355). Despite the fact that
oncogenic viruses cause only a small percentage of all human cancers, experimental
models have defined gene elements required for human cell transformation by using
viral oncogenes as tools to target specific combinations of intracellular pathways in vitro
(194). The cancer phenotype is a multi-step process of genetic changes that lead to a
loss of homeostasis in cellular mechanisms responsible for controlling diverse protein
signaling networks. During this process normal cells acquire mutations that allow them
to replicate indefinitely (immortalization), escape apoptosis, and promote cell cycle
progression (356).
Hahn et al. described the creation of a human tumor cell by expressing simian
vacuolating virus 40 (SV40) T antigens, as well as the telomerase catalytic subunit
hTERT and oncogenic hRas (hRasV12) in BJ primary human fibroblasts (357).
Immortalization of primary human cells can be achieved by hTERT expression, which
elongates telomeres and therefore allows for an indefinite replicative lifespan of a cell
(358, 359). SV40 large T antigen (LT) has been extensively studied and was crucial in
the discovery of p53 as well as dissection of the Rb family pathways (360, 361). SV40
LT contains a conserved LXCXE motif, which can be found in a number of oncoproteins
from other tumor viruses including HPV E7, adenovirus E1A and MCV LT (55, 362). The

121
LXCXE motif facilitates binding of Rb family members pRb, p107 and p130, which
results in E2F-mediated cell cycle entry and progression (362, 363). In addition, SV40
LT binds to p53 through a C-terminal bi-partite binding site (364). This interaction has
been shown to contribute to SV40 LT-mediated transformation of rodent cells not only
by inactivating p53 transcriptional activity, but also by inducing a gain-of-function as a
result of this interaction (162). In contrast, neither MCV full length LT nor tumor-derived
truncated LT bind to p53 directly (260). SV40 small T antigen (sT) binds and perturbs
the serine/threonine phosphatase PP2A through a conserved motif (197, 365). This
interaction contributes to human cell transformation in combination with SV40 LT in
human fibroblasts (194).
Recent data from our group shows that, in contrast to to SV40, MCV sT is
capable of transforming rodent fibroblasts independent of its PP2A binding motif, as
evaluated by soft agar as well as focus formation assays in Rat-1 and NIH3T3 cells
(129). Neither MCV full length LT nor MCC-derived, truncated LT are capable of fully
transforming rodent cells in these assays even though small cell aggregates are
observed in soft agar. Nevertheless, tumor-derived MCV LT has growth promoting
effects in both rodent as well as human fibroblasts (260). Most MCC tumors express
both MCV LT as well as sT proteins, which indicates that both viral proteins are
essential in MCC tumorigenesis (129).
In MCC tumors the MCV genome is clonally-integrated, which demonstrates that
the viral integration event precedes tumor cell outgrowth, and therefore supports a
causal relationship between the two processes (55). In addition to viral genome
integration, all MCV genomes isolated from tumors have been shown to have truncating

122
deletions in the C-terminal ATPase/helicase domain of MCV LT, which is necessary for
viral replication (56). Recent data from Cheng et al. demonstrates that the terminal
exon 3 domain of LT, which is always deleted in MCC, has a growth inhibitory effect in
human fibroblasts as well as MCV-positive MCC cells expressing a truncated LT (260).
The mechanism that leads to this inhibitory activity of the C-terminus was recently
associated with a DNA damage response resulting in p53 protein stabilization and
phosphorylation, as well as downstream p21 activation in U2OS cells (366).
In this study, we show that tumor-derived MCV LT enhances human fibroblast
proliferation in an LXCXE-dependent manner, and that MCV sT only minimally
contributes to proliferation. In addition, we performed a microarray analysis, which
indicates that G1/S phase transition regulators are specifically up-regulated by
truncated LT, resulting in an increased percentage of cells entering S-phase. Additional
expression of oncogenic hRasV12 and p53 knockdown in BJ-hTERT are required to
induce soft agar colony formation in the presence of MCV sT; however, we did not
observe soft agar colony formation in the presence of 339LT.

123
4.2 MATERIALS AND METHODS
4.2.1 Cell culture
The Merkel cell lines were grown in RPMI 1640 supplemented with 10% fetal calf
serum. BJ and BJ-hTERT fibroblasts were grown in DMEM supplemented with 10%
fetal calf serum, penicillin and streptomycin. All cells were grown at 37 °C in humidified
air containing 5% CO2.
4.2.2 Generation of stable cell lines
BJ-hTERT cells were infected with lentiviruses in the presence of 6ug/mL polybrene.
Medium was changed after 24 hours, and antibiotic selection was added (puromycin =
1ug/mL; G418 = 400ug/mL; blasticidin = 5ug/mL) on day 3 after infection. Cells were
grown under selection medium until all mock infected cells died.
4.2.3 Lentivirus production
Lentiviruses for pLKO knockdown as well as pLVX and pSMPUW overexpression
constructs were produced in HEK293FT cells (Invitrogen) using pPax2 and pMD2.G
helper constructs that were obtained from Addgene. At 3 days following transfection,
virus supernatants were harvested and filtered through 0.45 µm pore size filters.

124
4.2.4 Overexpression and short hairpin RNA (shRNA) constructs
Overexpression constructs for 339LT, 339LT.LXCXK and sT were described previously.
An shRNA sequences designed to target human cyclin E (shCyclinE: sense strand, 5’-
CCT CCA AAG TTG CAC CAG TTT CTC GAG AAA CTG GTG CAA CTT TGG AGG
TG -3’) was cloned into AgeI and EcoRI sites of the pLKO.1.puro lentiviral vector. An
shRNA designed to target to human p53 (shp53: sense strand, 5’- CAC CAT CCA CTA
CAA CTA CAT CTC GAG ATG TAG TTG TAG TGG ATG GTG-3’) was cloned into
pLKO.1.neo lentiviral vector. The control pLKO.1 plasmid, having a scrambled non-
targeting short-hairpin RNA sequence, was obtained from Addgene.
4.2.5 Cell counting and doubling time determination
To evaluate cell proliferation in different stable cell lines, cells were seeded in triplicates
in 6 well plates at a density of 2.5 x 10^4 cells per well. Each day cells were counted in
triplicates. Cells were treated with Trypsin (Millipore), collected, mixed with equal
volume of Trypan blue (Lonza, 0.4%) and counted using a hemocytometer under the
microscope. Doubling times were calculated using an exponential regression calculator
(Roth V. 2006 http://www.doubling-time.com/compute.php)
4.2.6 Immunoblotting
Cells were lysed in radioimmunoprecipitation assay (RIPA) buffer containing 50mM Tris,
150 mM NaCl, 0.1% SDS, 0.5% Na Deoxycholate, 1% NP40, and protease inhibitors

125
(Complete cocktail, Roche, Indianapolis, IN). Lysates were kept on ice for 15 minutes,
and then centrifuged 20,000 x g for 10 minutes at 4°C. Supernatants were mixed with
5X sodium dodecyl sulfate (SDS) loading dye, and denatured at 100°C for 5 minutes.
Proteins were separated by SDS-polyacrylamide gel electrophoresis (PAGE), and
transferred onto a Hybond-C nitrocellulose membrane (GE Healthcare). Viral proteins
were detected using CM2B4 (LT), CM8E6 (sT), and CM5E1 (sT) antibodies as
described before (129, 254, 281, 290). SV40 LT and sT were detected using the mouse
monoclonal antibody Pab419 (Santa Cruz) at 1:1000. Cyclin E was detected using the
rabbit polyclonal antibody C19 (Santa Cruz) at 1:1000. CDK2 was detected using the
mouse monoclonal antibody clone SC-6248 (Santa Cruz) at 1:1000. Cyclin A was
detected using the rabbit polyclonal antibody SC-596 (Santa Cruz) at 1:1000. Cyclin D1
was detected using the rabbit polyclonal antibody M20 (Santa Cruz) at 1:1000. p53 was
detected using the mouse monoclonal antibody clone D-O1 (Santa Cruz) at 1:1000. p21
was detected using the mouse monoclonal antibody clone OP64 (Calbiochem) at
1:1000. Ras was detected using the rabbit monoclonal antibody clone 27H5 (Cell
Signaling) at 1:1000. Alpha tubulin was detected with either the mouse monoclonal
antibody clone B-5-1-2 (Sigma) at 1:10000, or with the rabbit monoclonal antibody clone
11H10 (Cell Signaling) at 1:2000. For secondary antibody detection the Odyssey
Infrared Imaging system (LI-COR) was used with IRDye 680- or 800-conjugated
secondary antibodies (1:8000 dilution, Rockland Immunochemicals). SV40 LT and sT
were detected using the mouse monoclonal antibody Pab419 (Santa Cruz) at 1:1000.

126
4.2.7 Semi quantitative RT-PCR
RNA was extracted from BJ-hTERT stable cell lines using Trizol reagent (Invitrogen).
RNA was DNaseI treated and cDNA was synthesized using SuperScript III First Strand
Synthesis (Invitrogen). Primer sequences were as follows: Cyclin E (forward:
AGTGCTACTGCCGCAGTATC; reverse: TGCTTCTTACCGCTCTGTGG), CDK2
(forward: ACAGCTGTGGACATCTGGAGC; reverse: GCTATCAGAGTCGAAGATGG),
Cyclin D1 (forward: CCGTCCATGCGGAAGATC; reverse:
GAAGACCTCCTCCTCGCACT), and GAPDH (forward: CTGCCCAGAACATCATCC;
reverse: AGCCGTATTCATTGTCATACC). PCR reaction was performed using Taq
polymerase (Invitrogen) for 30 cycles.
4.2.8 Soft agar assay
BJ-hTERT stable cell lines were trypsinized to single cells, counted, suspended in
complete medium containing 0.3% agarose (Sigma-Aldrich), and seeded over a 0.6%
agar layer in 6 well plates (2.5 × 10⁴ cells/well) in triplicates. After 4 weeks, plates were
photographed at a magnification of 100X.
4.2.9 Microarray
RNA was extracted from biological triplicate stable cell lines BJ-hTERT empty, 339LT,
339LT.LXCXK, and 339LT+sT using Trizol reagent (Invitrogen). RNA was DNaseI
treated, and RNA integrity was assessed. For microarray analysis, RNA samples had to
127
have a RNA integrity number (RIN) of 6 or above. We used a Human HT-12 v4
Expression BeadChip from Illumina, which was processed at the University of
Pittsburgh Genomics and Proteomics Core facility. Microarray data was normalized to
total fluorescence intensity using cubic spline normalization. For multiple probes per
gene, averages of all probes were used for individual gene analyses. All values used for
analysis represent averages of three biological replicas. Standard deviations were
calculated for genes that were detected with ≥3 probes.

128
4.3 RESULTS
4.3.1 The effect of MCV T antigens on BJ-hTERT proliferation
To test whether the proliferative effect of truncated MCV T antigens in human fibroblast
cells depends on its LXCXE motif and whether sT contributes to this phenotype, we
generated BJ-hTERT stable cells that express different combinations of MCV T antigen
cDNA codon-optimized constructs by lentiviral transduction, and evaluated cell
proliferation. We expressed a truncated MCV LT (339LT) previously described (56)
(also see Figures 11 and 34 for truncation pattern), and a LXCXK domain mutant of
339LT (339LT.LXCXK), which lacks RB-family pocket protein binding. 339LT was
chosen because it represents one of the longest truncated MCV LT proteins described
thus far. Protein expression of 339LT, 339LT.LXCXK, and sT was confirmed by
immunoblot (Figure 27A). Cell counts over a 10-day period revealed that tumor-derived
339LT expression provides a significant growth advantage over empty vector control
(Figure 27B). In addition, we observed that mutation of the LXCXE pocket protein-
binding motif reverses this growth advantage, and MCV co-expression of sT slightly
enhances proliferation of empty vector or 339LT expressing cells (Figure 27B). The
doubling times and saturation densities of BJ-TERT stable cells reflect this LXCXE-
dependent, growth promoting effect of tumor-derived 339LT (Figure 27C).

129
Figure 27. Tumor-derived MCV LT promotes human fibroblast proliferation through it LXCXE RB targeting domain (A) Immunoblot analysis of BJ-hTERT stable cell lines was performed to detect truncated MCV 339 LT, 339 LT.LXCXK (339LT.XK) and sT using CM2B4 for 339LT and CM8E6 for sT detection. Tubulin blot serves as a loading control. (B) Proliferation assay of stable cell lines was performed twice in 10 % serum. This graph depicts one representative experiment of technical triplicates. (C) Doubling times Saturation densities of BJ-hTERT stable cell lines were measured on day 12 after seeding. Counts represent two replica in triplicates in a 6 well plate format.
4.3.2 Transformation assays
Given the strong proliferative effect of MCV T antigens, we evaluated whether MCV T
antigens could be substituted for SV40 T antigens in the context of defined human cell
transformation studies. Hahn et al. have previously identified elements capable of
inducing human fibroblast transformation using SV40 LT (Rb and p53 inactivation;
!!"#$%%%!!"#$&#'(')%
*$%
#$%
*$%
+$,-,./0%
1%%%%%%2%%%%%%1%%%%%%1%%%%%%2%%%%%1%%%%1%%%%%%1%%%%%%2%%%%%%1%%%%%%1%%%%%%2%%%%%1%%%%%%1%%%%%%1%%%%%%2%%%%%%2%%%%%2%%%%
3&% 4&%
(&%567-.8%(8..%#/08% 9:,-./0;%<=8%>?@%
A=B6C%2%8=B6C% D!&E%
!!"#$&#'(')%2%8=B6C% DE&"%
!!"#$&#'(')%2%*$% DF&G%
A=B6C%2%*$% FD&E%
!!"#$%2%*$% HE&I%
!!"#$%2%8=B6C% HG&D%
J%K8..%0,=-8L%MNIOE%P%*670Q7LQ%Q8R/7<:0%
J%0:01*B8K/SK%!!"%#$%
0 2 4 6 8 100.0
2.5
5.0
7.5
10.0
12.5
15.0empty/empty
339LT/empty
339XK/empty
empty/sT
339LT/sT
339XK/sT
Time (days)
Ce
ll n
um
be
r (x
10
^5
)
576,L7<:0%980*/6CJ%
H&E%P%N&G%
H&E%P%N&E%
D&T%P%N&E%
"&T%P%N&G%
NI&T%P%I&"%
NG&I%P%!&!%

130
possible gain of function due to p53 interaction), SV40 sT (PP2A inactivation),
hRasV12, and hTERT (316). Since MCV LT does not bind p53 (260), we reasoned that
p53 knockdown might be necessary in addition to MCV LT and sT as well as hRasV12
expression to transform BJ-hTERT cells.
Figure 28. Generation of BJ-hTERT stable cell lines for transformation assays (A) BJ-hTERT cells were infected with shscr and shp53 lentiviruses and selected to create stable cell lines. Immunoblot analysis using a p53 antibody shows knockdown efficiency. (B) BJ-hTERT shscr and shp53 stable cell lines were infected with empty, 339LT or 339LT.LXCXK (339LT.XK) lentiviruses and selected to create stable cell lines. LT expression was confirmed by immunoblotting using the CM2B4 antibody. (C) Stable cell lines used for soft agar seeding (Figure 30) were analyzed for p53 and Ras protein expression.
!"#$%&
''()*&
''()*+,-
&
!"#$%&
''()*&
''()*+,-
&
)*&
.*/0/123&
4567*!8*&979:;&
4567*!8*&97#<'&
979:;&
97#<
'&
#<'&&
.*/0/123&
4567*!8*&
6&&&=&&&6&&&6&&=&&&6&&&&6&&&6&&&=&&&6&&&6&&&=&&&&6&&&6&&&6&&&=&&=&&&=&&&&
6&&&=&&&6&&&6&&=&&&6&&&&6&&&6&&&=&&&6&&&6&&&=&&&&6&&&6&&&6&&&=&&=&&&=&&&&
''()*:>&&&''()*:>?,-&
9*:>&78@A?BCD& 6&&&6&&&6&&&6&&&6&&&&6&&&&=&&=&&=&&=&&&=&&&=&
6&&&=&&&6&&&6&&=&&&6&&&&6&&&6&&&=&&&6&&&6&&&=&&&&6&&&6&&&6&&&=&&=&&&=&&&&
6&&&=&&&6&&&6&&=&&&6&&&&6&&&6&&&=&&&6&&&6&&&=&&&&6&&&6&&&6&&&=&&=&&&=&&&&
6&&&6&&&6&&&6&&&6&&&&6&&&&=&&=&&=&&=&&&=&&&=&
''()*:>&&&''()*:>?,-&9*:>&78@A?BCD&
#<'&
8E9&
.*/0/123&
97#<'& 979:;&
@+& 4+&
F+&
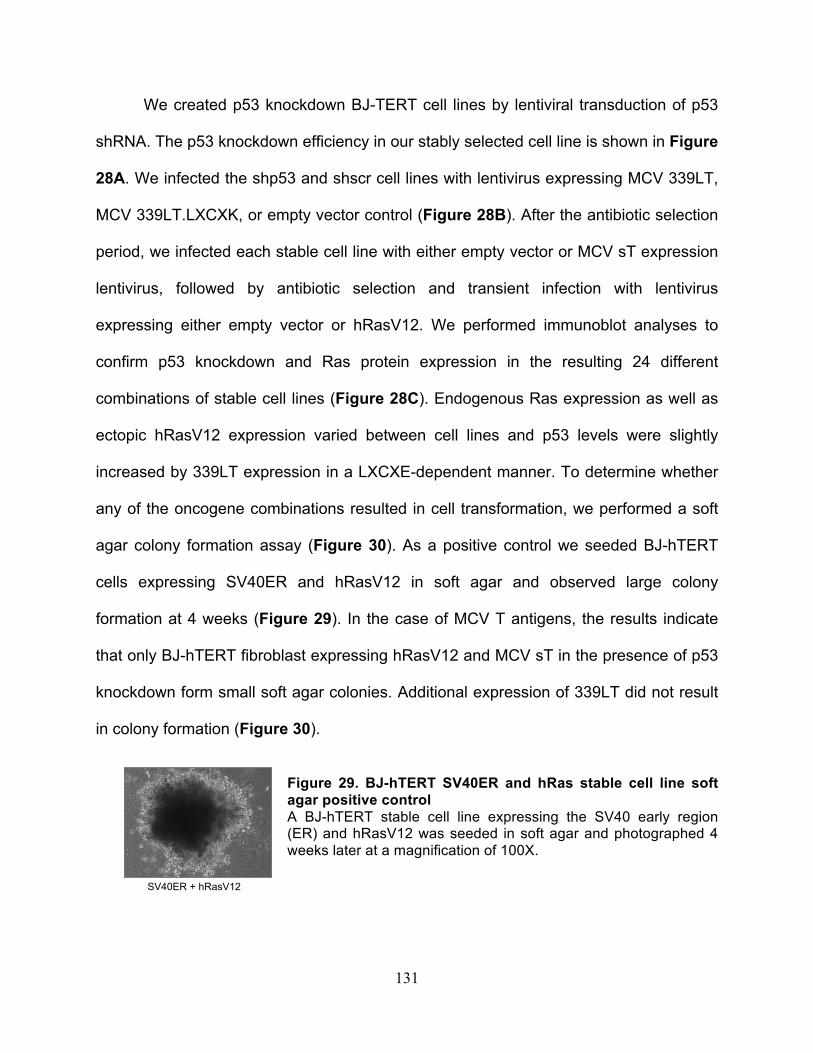
131
We created p53 knockdown BJ-TERT cell lines by lentiviral transduction of p53
shRNA. The p53 knockdown efficiency in our stably selected cell line is shown in Figure
28A. We infected the shp53 and shscr cell lines with lentivirus expressing MCV 339LT,
MCV 339LT.LXCXK, or empty vector control (Figure 28B). After the antibiotic selection
period, we infected each stable cell line with either empty vector or MCV sT expression
lentivirus, followed by antibiotic selection and transient infection with lentivirus
expressing either empty vector or hRasV12. We performed immunoblot analyses to
confirm p53 knockdown and Ras protein expression in the resulting 24 different
combinations of stable cell lines (Figure 28C). Endogenous Ras expression as well as
ectopic hRasV12 expression varied between cell lines and p53 levels were slightly
increased by 339LT expression in a LXCXE-dependent manner. To determine whether
any of the oncogene combinations resulted in cell transformation, we performed a soft
agar colony formation assay (Figure 30). As a positive control we seeded BJ-hTERT
cells expressing SV40ER and hRasV12 in soft agar and observed large colony
formation at 4 weeks (Figure 29). In the case of MCV T antigens, the results indicate
that only BJ-hTERT fibroblast expressing hRasV12 and MCV sT in the presence of p53
knockdown form small soft agar colonies. Additional expression of 339LT did not result
in colony formation (Figure 30).
Figure 29. BJ-hTERT SV40ER and hRas stable cell line soft agar positive control A BJ-hTERT stable cell line expressing the SV40 early region (ER) and hRasV12 was seeded in soft agar and photographed 4 weeks later at a magnification of 100X.
SV40ER + hRasV12

132
Figure 30. BJ-hTERT stable cells soft agar colony formation result BJ-hTERT stable cell lines were seeded into soft agar at a density of 2.5x10^4 per 6 well plate well in triplicates. Pictures were taken 4 weeks after seeding at a magnification of 100X.
!"!#$%&&'()%*+%,-./0%,-./01 !".2&%&&'()%*+%,-./0%,-./01 !".2&%&&'()%*+%,-./0%"34!5671!"!#$%&&'()%*+%,-./0%"34!5671
!"!#$%&&'()%*+%!)%,-./01 !".2&%&&'()%*+%!)%,-./01 !".2&%&&'()%*+%!)%"34!5671!"!#$%&&'()%*+%!)%"34!5671
!"!#$%&'()*%&'()*%&'()*+ !"(,-%&'()*%&'()*%&'()*+ !"(,-%&'()*%&'()*%"./!012+!"!#$%&'()*%&'()*%"./!012+
!"!#$%--345%&'()*%&'()*+ !"(,-%--345%&'()*%&'()*+ !"(,-%--453%&'()*%"./!012+!"!#$%--345%&'()*%"./!012+
!"!#$%&'()*%!5%&'()*+ !"(,-%&'()*%!5%&'()*+ !"(,-%&'()*%!5%"./!012+!"!#$%&'()*%!5%"./!012+
!"!#$%--345%!5%&'()*+ !"(,-%--345%!5%&'()*+ !"(,-%--345%!5%"./!012+!"!#$%--345%!5%"./!012+

133
4.3.3 Microarray gene expression profile in BJ-TERT cells expressing MCV T
antigens
To obtain mechanistic insights into the growth promoting effect of tumor-derived LT, we
characterized the transcriptional gene profiles of the BJ-hTERT stable cells used in the
cell proliferation studies (Figure 27). We performed a whole human microarray analysis
using an Illumina-based Human BeadChip on three biological replicates of BJ-hTERT
stable cell lines empty, 339LT, 339LT.LXCXK and 339LT+sT. To validate the integrity of
our microarray, we analyzed a subset of E2F activated genes. As shown in Figure 31,
Figure 31. Microarray gene expression profile of E2F targets Cubic spline normalized microarray expression data from biological triplicate averages for E2F target genes is represented as fold expression over empty control BJ-hTERT cells. Fold changes for E2F2 represent values from a single probe detection. Fold changes for all other genes shown here represent averages of 2 probes each.
!"
#"
$"
%"
&"
'"
("
)"
*"
+"
#!"
,$-$"" ./01"" /230$1" /45$" 657(" .897#" :87$" -;<#"
;7=>?"
%%+@A"
%%+@ABC3"
%%+@A"D"EA"

134
this subset of E2F responsive genes is induced by 339LT expression in an LXCXE-
dependent manner. This confirms that our microarray gene expression profile behaves
accurately for gene changes already known to occur through LXCXE targeting.
We then plotted average gene expression values for each 339LT or
339LT.LXCXK against empty control and determined the number of up- and down-
regulated genes in each case. This analysis reveals that 339LT expression has a
significant affect on the cellular transcriptome in BJ-hTERT cells, with 549 probes up-
regulated and 278 probes down-regulated over empty control (Figure 32). In contrast,
mutation of the LXCXE motif results in a drastic reversal of this transcriptional
modulation. 339LT.LXCXK cells have a transcriptional profile most closely resembling
empty control cells, with only 23 probes up-regulated and 11 probes down-regulated
(Figure 32). This highlights the notion that LT exhibits most of its transcriptional
regulation through pocket protein binding and presumably E2F mediated transcription.
Figure 32. Transcriptome modulation by 339LT Microarray data points from the 339LT or 339LT.LXCXK (339LT.XK) expressing BJ-hTERT cells were plotted against empty control. All data points represent averages of biological triplicates. Probes are considered up- or down-regulated if the fold change compared to empty is equal or greater to 2.
!!"
!#!!
"#!$%&%'!()!
**!$%&%'!+,-&!
!!"
!#!!
./0!$%&%'!()!
"12!$%&%'!+,-&!
!"#$%&'%()*+,-(!"#$%&'%()*+,-(
!"#$%&'%
(../
0%(
!"#$%&'%
(../
0%123(
!"#$%&'()#*$#
++#$%&'()#,&-.#
/01#$%&'()#*$#
!23#$%&'()#,&-.# !"#$%&'%
())*+%,+-.
-/(
!"#$%&'%
())*+%(
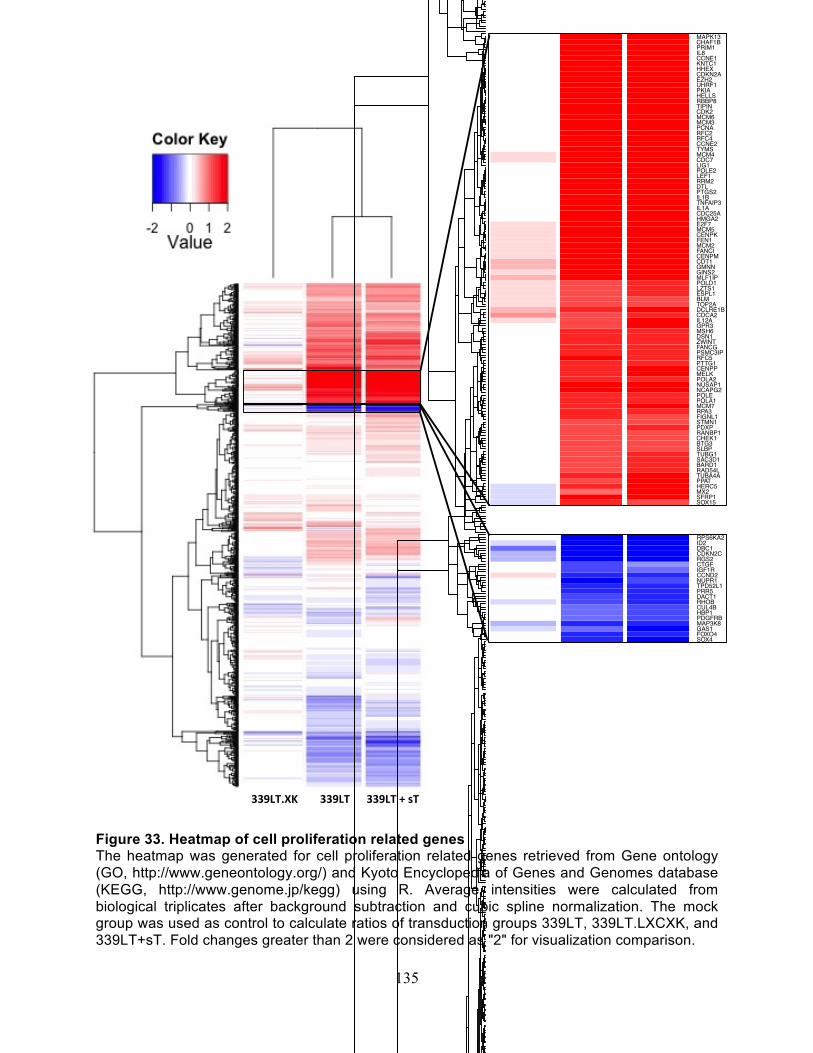
135
Figure 33. Heatmap of cell proliferation related genes The heatmap was generated for cell proliferation related genes retrieved from Gene ontology (GO, http://www.geneontology.org/) and Kyoto Encyclopedia of Genes and Genomes database (KEGG, http://www.genome.jp/kegg) using R. Average intensities were calculated from biological triplicates after background subtraction and cubic spline normalization. The mock group was used as control to calculate ratios of transduction groups 339LT, 339LT.LXCXK, and 339LT+sT. Fold changes greater than 2 were considered as "2" for visualization comparison.
!!"#$%&'((((((((!!"#$((((((!!"#$()(*$(
X339
LTXK
_Avg
X339
LT_A
vg
X339
LTsT
_Avg
PTENDYNLL1CEP63ARL8BPRDM9THAP1PRKAG1POGZSYCP3CUL4AEP300SMARCB1SONATMJTBMNTUSP16CSNK2A2MLL5KIF25SH2B1USP3WDR6FBXL15MLF1CDKN1BFNTBPRKAR1AAXIN2DYRK1APDCD6IPSTAT5ACDC14BKLHL9SRPK2CCNI2RBL2GOLGA2ACVR1FZR1TSC2SBDSCUL5MLH3TADA3BECN1ACTR8FAM58AUSP8CDC16NANOS3POLD4KCTD11BLCAPSPIN1GSPT2CEP135ARL8AKANK2CDKN1CAPPL2CITED2NUMA1CLIP1FOXC1DMC1EVI5TCF7L2VCPIP1GORASP1ZMYND11TUBGCP6LZTS2NUDT16PRKAB2SASS6B9D2ANXA1RB1CC1PPP2R4DSTNKLHL21NEDD9DUSP3FAM175ASIK1CHFRTDRD1PKP4PRMT2TSC1CROCCDIXDC1SRCXRCC2TLK1SERTAD1PTPRKMAELRAD50DCTN1RARAMAPRE3VASH1THBS1CCNDBP1HES1DMRT1ID3FBXL7TP53ING4HDAC8FMN2CCNG2HOXA13BRDTSOX11INHAJMYSPASTWNT5ASETDB2SPG20RASSF2PKD1CLOCKFHL1MUC1PKD2ANXA11CCPG1CDKN2BCCNA1EYA1TAF1LHUS1RSPH1HEXIM1IGF2SMPD3ANAPC2CGREF1EDN1CDC27PTPRCNME6STAT5BAKAP8YY1AP1SEH1LLILRB1HMG20BCHMP1BAHRMAP9BAP1YWHAGMBD4PSMD9PPP6CCLASP1TTC19PRDM5GNAI3SSNA1CDC23RPS6KB1FLCNLRP5BNIP2HTTRPTORCALM1MACF1PSMD8WBP2NLCD28C9ORF69TAOK2MAP4FBXO31UTP14CLRRC6DDX3XNUP133CTCFNIPBLKIF3BMCM8KLHDC3GTF2H1NCOR1UBE2BC6ORF89FERUSP47FLNAPNPT1APPL1PARD3PSMA5INCA1BLZF1KRT18CHD3BIRC6SUPT5HDDIT3BIN3CTDP1BTRCFBXO6FBXW5STK11PRKAG2TLK2CEP164ZFYVE26TERF1PTCH1KIF13AOVOL1DUSP1NPM1RGS14SPIRE1GADD45BWNT4NGFRNF212NPM2FOXN3ASNSCCDC87STAMBPSUGT1PIK3C3TRRAPCOPS5FBXW11BRETSPYL2TUBGCP2PIM1LIG4GNB2L1PRDM4PSMB10TUSC2ANAPC1USP19CDK5ANKRD54DMTF1PSMD5ARAP1FAM5CDUSP13AKT2TAF6PTPN6CGRRF1CUL1UBCTSG101TMEM8BMAPK3NEDD1E2F4PSMG2PLAGL1UBA52RHOACSNK2A1INO80PSMB6CEP72NUP214KIF2BLIN37PHIPIL12BMED1GFI1BPLD6ABL1PRCCDMWDBCL2L1PHACTR4CCNKCETN1TEX14PDCD2LPDPNTXNL4BJUNBTOP2BPDCD4INTS3TRIM32RAD17HINFPUSP22ILKLSM10EIF4G2SIRT2DCTN2HCFC1ACVR1BUSP44USO1GAKSKP1DYNC1I2TGFANDE1PSMF1PTP4A1CAB39LNDEL1DYNLT3CTBP1SIRT1SYCE2NEK1APPRNF8NEK6GORASP2JAG2TIMP2EHMT2TAF1USP9XBRD4LIG3ZC3H12DMADDZNF318PTPN11PLCB1WASLLEMD3DDB1ANAPC4DAB2IPNINLPLA2G16SYCP1PROX1CLASP2CNTD2ZNF703PDS5ALLGL2KATNA1STAG1TACC2CCNYPSMA2UPF1TFAP4TIPRLOPTNSEC13CIB1CFL1HACE1GNAI2TRIAP1LATS1MAPK4WACANAPC7NEK3PSMD6PRKAB1TTC28GPS1ASPMPHGDHCEP76SENP5MEN1EIF4G3CAMK2DVPS4ACHMP1ADNM2PSME3AATFHUS1BROCK2PSMD12MAPRE2CREBL2BCRRFWD2PPP2R1AMAPK6ACTR1ACDC34H1FOOLFNGCDK7FBXW7NESGIGYF2CDC42GTPBP8RCC2MFN2OFD1CDC73SIAH2LIN54MYH9UHMK1CDC14ADAPK3TAOK1PSME4ESX1CDK6SESN2KLHL13PGGT1BPES1STK10TUBE1BRSK2ARHGEF2MYBL2PSMD3HIPK2CREB3NOTCH2NACC2ABCB1SYCP2TGFB1CUL3SIRT7RAB1ADBF4THAP5RAD9BSMC1BUBE2SUSP2TUBGCP4SF1INHBACCNYL2IGF1MDM4SMC5PHF8SART1IRF6TAL1PPP1R9BSPIN2ADLG1PSMB11KLK10HORMAD2GAS2STARD9PARD6BSPO11BRIP1CITTBX3SIAH1UBR2MYH10FAM32AE4F1VPS4BTBRG1EPS8CDC26NSMCE2RASSF4RAB2ASENP6MAP2K6RAD1PMS2MAEACEP57AKAP9CTNNB1DCTN3LCMT1RALBPSMD10TMEM67CDK3FGF8CCNL2CAMK2GLMLNINSL6CCNB3ZNF830PIWIL4RANBP2HPGDPIWIL3IKZF1HSF1TUBB1PRKACBALOX15BCDK10CSNK1A1HGFCRYAAALMS1RBM7MCTS1TTNANK3PMF1SMC4GFI1NR2F2SPIN2BPYHIN1CETN2PCNPDTYMKSYCE1BCL2L11NDRG1MAGI2CDK5R2PDE3AGPR132GADD45GGATA6FGF10CTCFLTGFBR1SLC6A4CEP250TNFTRIM21FGFR2MYOCDRNF2PCID2PARD3BAVPI1UBA3STAG2CRLF3FOXG1MAPK14PIWIL2EGFL6CHTF8INSAPBB1IFNW1DRD3RAD51CSPP1FGFR1EDN3NEUROG1CCNL1BTG4PPM1ATRNP1HAUS5PSMA7WEE1GAS2L2PPP5CINSRSUV39H2CAMK2ADDX11TFDP2BUB1BERHBCCIPUSH1CKIF15BRCA2RINT1HORMAD1UHRF2SMC3CYP26B1PARD6GNAE1BUB3RAD9ARIF1SGOL1MSH5TUBA1ADIAPH2SGOL2IRF1PSMB8SKA2ETS1CSNK1ENUDCAHCTF1PSMA6PSMC3TPRTRIM35NUP160CEP192CENPHXPCCDK4STRADBSKA1CLSPNMIFPSMA1RFC1CDKN2DING2CDC5LSYCE1LERCC6LRCC1SCRIBPRNPCSNK2BRUVBL1PSMB2CSRP2BPTUBB3KAT2BSIN3APIN1ECT2FANCACDC123ANAPC5ZW10TUBGCP5PFDN1KIF2AEML4RNF4PLK1PSMA3TGFB2BEX2LSM11BAK1SPHK1CCAR1RPRMUSP28IFNGID4KCNH5CENPC1OSME2F8NEK7BMP7HSPA2NR2E1PSMA8DHHUBE2D1NANOS2KIF20ACUZD1PHF13INCENPSESN1NCAPHTET2APCMOSNEK4CECR2DNAJC2TEX15FEM1BMYBBP1ASETD8CASC5RAD52ZNF655SKILGAS7ASZ1ZFP42ERCC4PPP1R1CCNTROBLRP6ENSAPDS5BBANF1TAF2CETN3AK1DIS3L2PPP1CCTFDP3AFAP1L2ANAPC10SPDYAMIS12PRKAG3MITD1CCNG1TUBG2GNAI1ARL3PDGFBHEXIM2SSSCA1RAB11BWAPALSLC26A8AIF1KIF18BFBXO43PKN2NR4A3CEP120ANAPC11GINS1RASSF1BOLLPRKAR2BASCL1PRKACARABGAP1ERN2HSPA8SPTBN1MLXIPLCDK9STRA8E2F6RPS27UIMC1RPS27ABBS4CCNT2PSMD4ARL2SDCCAG8BADTERF2RPRD1BEGFRBACH1ING1PSMC6PPP2R5CERBB2IPKLHL22WEE2LMNARPS15AEMDITGB1CINPDIRAS3RPS27LSETMARPPP1CBMAPK1WNT9ATNKSEID1EIF4ECEP70RAB11ADICER1APBB2MRPL41PSMD7CCNHPSMC2MSH3MAPK12CDK2AP1TBRG4PCBP4PPP2CANUP98PSMD13DBF4BARHGEF1ERCC3MDM2ATRPRMT5NSUN2PSMC1PMLPSMD1RHOCTAOK3GPS2INSCGrand TotalGAS2L1HAUS6CSNK1DMED25PRKAA1CKAP5PELOPPP2R3BCHORDC1PPP2R2DILF3ZC3HC1RAB8APCM1BRD7HDAC3ACTR3SPAG5TUBGCP3CALRBANPSKP2MEI1RANGAP1RAB35PSMB1CAV2STRADAUBE2E1TADA2ASOX2ODF2TEX11BRSK1REC8GTPBP4PSMA4LIN52PAK4RRS1PSME1PIM3KHDRBS1NBNECDHDAC1HDAC2CAMK2BCDC25BPRKCADSTRALABIRC2CYLDPAPD5MTA3AKT1ESCO1PSMB7PRPF40ATP53BP2ROPN1BNUP43IQGAP3TCF3GATA3ERFRPS6KA3PKHD1USP39SMAD3TACC1PSMB5PSMB4CCNCNR2C2PSMC5TJP3RAD21DDX4UBBXPO1RASA1UBE2IMAPK7PINX1NSL1MAPRE1RHEBCUL2PCNTSLC2A8NFATC1PRKCDPPP1CAANAPC13PBRM1USP33PSMC4ARPP19PSMD11CLTCL1FANCMRCBTB1SESN3CLTCANKLE2TRIM71SGSM3RPA4GAS2L3AURKCLATS2E2F1E2F3DGKZPIWIL1NEK11SPDYCRAB6CADAM17PPP2R2AMAD1L1PSMB3CEP290ILKAPE2F5CCNT1BCAT1CDC37YWHAEDYNLT1CENPTZBTB17STAG3RRP8DYNC1H1GSK3BBOP1PLK2ATRIPPRKCESMC1AGSPT1MAP3K11NGFRBIDCCNYL1FGFR1OPHRASCAB39SOX4FOXO4GAS1MAP3K8PDGFRBHBP1CUL4BRHOBDACT1PRR5TPD52L1NUPR1CCND2IGF1RCTGFRGS2CDKN2CDBC1ID2RPS6KA2SOX15SFRP1MX2HERC5PPATTUBA4ARAD54LBARD1SAC3D1TUBG1SLBPBTG3CHEK1RANBP1PDXPSTMN1FIGNL1RPA3MCM7POLA1POLENCAPG2NUSAP1POLA2MELKCENPPPTTG1RFC5PSMC3IPFANCGZWINTDSN1MSH6GPR3IL12ACDCA2DCLRE1BTOP2ABLMESPL1LZTS1POLD1MLF1IPGINS2GMNNCDT1CENPMFANCIMCM2FEN1CENPKMCM5E2F7HMGA2CDC25AIL1ATNFAIP3IL1BPTGS2DTLRRM2LEF1POLE2LIG1CDC7MCM4TYMSCCNE2RFC4RFC2PCNAMCM3MCM6CDK2TIPINRBBP8HELLSPKIAUHRF1EZH2CDKN2AHHEXKNTC1CCNE1IL8PRIM1CHAF1BMAPK13ADCYAP1ESCO2TP73BMP2ITGB3BPSOX9RUNX3RBL1CENPQPOLD3RFC3SLFN11RFWD3YEATS4MKI67FAM83DMTBPTP63HJURPNEK2DLGAP5NEUROD1TTKFANCD2GTSE1GAS6BUB1DAZLNPATMCM10CCNFNCAPGE2F2AURKAAURKBKIFC1CDC20EXO1PLK4PRC1CHTF18DNA2CCNB2CENPFMYBCENPNDCLRE1ACDKN3UBE2CNUP85TFDP1FBXO5CEP152APEX2RPA1RAD54BCEP78ANLNMND1CDCA5USP37CAMK1FGF2PIM2SFNCHAF1AEGFLIFCASP3GADD45APTPN3CCND3PSMB9FOSL1RPS6KA1PSME2CENPVFSD1NKX3−1STEAP3DHFRCDC25CSPIRE2STRA13NCAPD3VRK1OSGIN2CDC6PRIM2ERN1PARD6AMASTLTPX2HAUS8NOLC1TACC3FGFR3PPM1GBCL2CENPOTOP3APID1PPP3CACENPIMSH2MLH1NUF2TTYH1NEK9RB1PSRC1RBBP4HAUS4MDKCRADDCABLES2GPSM2HTRA2MAD2L1CKS1BCENPAPBKADARB1CABLES1CKS2CASP2NASPMNS1LRRCC1APITD1CKAP2RHOUCD2APSIPA1NDC80SMC2KIF18AKIF20BBRCA1KIF22KIF2CSPC25TUBBRAD51CCHEK2MAD2L2CCNOEPGNDPEP3MSH4CCNB1WNT10BBRCC3FKBP6PMS1PRKAA2GMLCDCA3PPM1DCCND1TDRD9H2AFXBIRC5PSMD14CENPJBAXMNAT1RPA2KPNA2MAP2K1NCAPD2NUP37TXNIPKLF11MDC1RBM38FOXM1PA2G4PSMD2GSG2FOXA1PLK3HEPACAMEREGNOX5LRWD1DAXXBMP4KATNB1RNF167ERCC2POLD2PKMYT1JUNCDCA8AZI1WTAPSFI1RANMYCDHCR24MRE11ACENPLFAM111ADSCC1RACGAP1CCNA2KIF23OVOL2INTS7NUP107SPC24TXNL4AGINS4TRIP13CDKN1ALIN9SUV39H1CDK5R1CEP55OIP5ZWILCHCENPEKIF11
−2 0 2Value
Color Key
X339
LTXK
_Avg
X339
LT_A
vg
X339
LTsT
_Avg
PTENDYNLL1CEP63ARL8BPRDM9THAP1PRKAG1POGZSYCP3CUL4AEP300SMARCB1SONATMJTBMNTUSP16CSNK2A2MLL5KIF25SH2B1USP3WDR6FBXL15MLF1CDKN1BFNTBPRKAR1AAXIN2DYRK1APDCD6IPSTAT5ACDC14BKLHL9SRPK2CCNI2RBL2GOLGA2ACVR1FZR1TSC2SBDSCUL5MLH3TADA3BECN1ACTR8FAM58AUSP8CDC16NANOS3POLD4KCTD11BLCAPSPIN1GSPT2CEP135ARL8AKANK2CDKN1CAPPL2CITED2NUMA1CLIP1FOXC1DMC1EVI5TCF7L2VCPIP1GORASP1ZMYND11TUBGCP6LZTS2NUDT16PRKAB2SASS6B9D2ANXA1RB1CC1PPP2R4DSTNKLHL21NEDD9DUSP3FAM175ASIK1CHFRTDRD1PKP4PRMT2TSC1CROCCDIXDC1SRCXRCC2TLK1SERTAD1PTPRKMAELRAD50DCTN1RARAMAPRE3VASH1THBS1CCNDBP1HES1DMRT1ID3FBXL7TP53ING4HDAC8FMN2CCNG2HOXA13BRDTSOX11INHAJMYSPASTWNT5ASETDB2SPG20RASSF2PKD1CLOCKFHL1MUC1PKD2ANXA11CCPG1CDKN2BCCNA1EYA1TAF1LHUS1RSPH1HEXIM1IGF2SMPD3ANAPC2CGREF1EDN1CDC27PTPRCNME6STAT5BAKAP8YY1AP1SEH1LLILRB1HMG20BCHMP1BAHRMAP9BAP1YWHAGMBD4PSMD9PPP6CCLASP1TTC19PRDM5GNAI3SSNA1CDC23RPS6KB1FLCNLRP5BNIP2HTTRPTORCALM1MACF1PSMD8WBP2NLCD28C9ORF69TAOK2MAP4FBXO31UTP14CLRRC6DDX3XNUP133CTCFNIPBLKIF3BMCM8KLHDC3GTF2H1NCOR1UBE2BC6ORF89FERUSP47FLNAPNPT1APPL1PARD3PSMA5INCA1BLZF1KRT18CHD3BIRC6SUPT5HDDIT3BIN3CTDP1BTRCFBXO6FBXW5STK11PRKAG2TLK2CEP164ZFYVE26TERF1PTCH1KIF13AOVOL1DUSP1NPM1RGS14SPIRE1GADD45BWNT4NGFRNF212NPM2FOXN3ASNSCCDC87STAMBPSUGT1PIK3C3TRRAPCOPS5FBXW11BRETSPYL2TUBGCP2PIM1LIG4GNB2L1PRDM4PSMB10TUSC2ANAPC1USP19CDK5ANKRD54DMTF1PSMD5ARAP1FAM5CDUSP13AKT2TAF6PTPN6CGRRF1CUL1UBCTSG101TMEM8BMAPK3NEDD1E2F4PSMG2PLAGL1UBA52RHOACSNK2A1INO80PSMB6CEP72NUP214KIF2BLIN37PHIPIL12BMED1GFI1BPLD6ABL1PRCCDMWDBCL2L1PHACTR4CCNKCETN1TEX14PDCD2LPDPNTXNL4BJUNBTOP2BPDCD4INTS3TRIM32RAD17HINFPUSP22ILKLSM10EIF4G2SIRT2DCTN2HCFC1ACVR1BUSP44USO1GAKSKP1DYNC1I2TGFANDE1PSMF1PTP4A1CAB39LNDEL1DYNLT3CTBP1SIRT1SYCE2NEK1APPRNF8NEK6GORASP2JAG2TIMP2EHMT2TAF1USP9XBRD4LIG3ZC3H12DMADDZNF318PTPN11PLCB1WASLLEMD3DDB1ANAPC4DAB2IPNINLPLA2G16SYCP1PROX1CLASP2CNTD2ZNF703PDS5ALLGL2KATNA1STAG1TACC2CCNYPSMA2UPF1TFAP4TIPRLOPTNSEC13CIB1CFL1HACE1GNAI2TRIAP1LATS1MAPK4WACANAPC7NEK3PSMD6PRKAB1TTC28GPS1ASPMPHGDHCEP76SENP5MEN1EIF4G3CAMK2DVPS4ACHMP1ADNM2PSME3AATFHUS1BROCK2PSMD12MAPRE2CREBL2BCRRFWD2PPP2R1AMAPK6ACTR1ACDC34H1FOOLFNGCDK7FBXW7NESGIGYF2CDC42GTPBP8RCC2MFN2OFD1CDC73SIAH2LIN54MYH9UHMK1CDC14ADAPK3TAOK1PSME4ESX1CDK6SESN2KLHL13PGGT1BPES1STK10TUBE1BRSK2ARHGEF2MYBL2PSMD3HIPK2CREB3NOTCH2NACC2ABCB1SYCP2TGFB1CUL3SIRT7RAB1ADBF4THAP5RAD9BSMC1BUBE2SUSP2TUBGCP4SF1INHBACCNYL2IGF1MDM4SMC5PHF8SART1IRF6TAL1PPP1R9BSPIN2ADLG1PSMB11KLK10HORMAD2GAS2STARD9PARD6BSPO11BRIP1CITTBX3SIAH1UBR2MYH10FAM32AE4F1VPS4BTBRG1EPS8CDC26NSMCE2RASSF4RAB2ASENP6MAP2K6RAD1PMS2MAEACEP57AKAP9CTNNB1DCTN3LCMT1RALBPSMD10TMEM67CDK3FGF8CCNL2CAMK2GLMLNINSL6CCNB3ZNF830PIWIL4RANBP2HPGDPIWIL3IKZF1HSF1TUBB1PRKACBALOX15BCDK10CSNK1A1HGFCRYAAALMS1RBM7MCTS1TTNANK3PMF1SMC4GFI1NR2F2SPIN2BPYHIN1CETN2PCNPDTYMKSYCE1BCL2L11NDRG1MAGI2CDK5R2PDE3AGPR132GADD45GGATA6FGF10CTCFLTGFBR1SLC6A4CEP250TNFTRIM21FGFR2MYOCDRNF2PCID2PARD3BAVPI1UBA3STAG2CRLF3FOXG1MAPK14PIWIL2EGFL6CHTF8INSAPBB1IFNW1DRD3RAD51CSPP1FGFR1EDN3NEUROG1CCNL1BTG4PPM1ATRNP1HAUS5PSMA7WEE1GAS2L2PPP5CINSRSUV39H2CAMK2ADDX11TFDP2BUB1BERHBCCIPUSH1CKIF15BRCA2RINT1HORMAD1UHRF2SMC3CYP26B1PARD6GNAE1BUB3RAD9ARIF1SGOL1MSH5TUBA1ADIAPH2SGOL2IRF1PSMB8SKA2ETS1CSNK1ENUDCAHCTF1PSMA6PSMC3TPRTRIM35NUP160CEP192CENPHXPCCDK4STRADBSKA1CLSPNMIFPSMA1RFC1CDKN2DING2CDC5LSYCE1LERCC6LRCC1SCRIBPRNPCSNK2BRUVBL1PSMB2CSRP2BPTUBB3KAT2BSIN3APIN1ECT2FANCACDC123ANAPC5ZW10TUBGCP5PFDN1KIF2AEML4RNF4PLK1PSMA3TGFB2BEX2LSM11BAK1SPHK1CCAR1RPRMUSP28IFNGID4KCNH5CENPC1OSME2F8NEK7BMP7HSPA2NR2E1PSMA8DHHUBE2D1NANOS2KIF20ACUZD1PHF13INCENPSESN1NCAPHTET2APCMOSNEK4CECR2DNAJC2TEX15FEM1BMYBBP1ASETD8CASC5RAD52ZNF655SKILGAS7ASZ1ZFP42ERCC4PPP1R1CCNTROBLRP6ENSAPDS5BBANF1TAF2CETN3AK1DIS3L2PPP1CCTFDP3AFAP1L2ANAPC10SPDYAMIS12PRKAG3MITD1CCNG1TUBG2GNAI1ARL3PDGFBHEXIM2SSSCA1RAB11BWAPALSLC26A8AIF1KIF18BFBXO43PKN2NR4A3CEP120ANAPC11GINS1RASSF1BOLLPRKAR2BASCL1PRKACARABGAP1ERN2HSPA8SPTBN1MLXIPLCDK9STRA8E2F6RPS27UIMC1RPS27ABBS4CCNT2PSMD4ARL2SDCCAG8BADTERF2RPRD1BEGFRBACH1ING1PSMC6PPP2R5CERBB2IPKLHL22WEE2LMNARPS15AEMDITGB1CINPDIRAS3RPS27LSETMARPPP1CBMAPK1WNT9ATNKSEID1EIF4ECEP70RAB11ADICER1APBB2MRPL41PSMD7CCNHPSMC2MSH3MAPK12CDK2AP1TBRG4PCBP4PPP2CANUP98PSMD13DBF4BARHGEF1ERCC3MDM2ATRPRMT5NSUN2PSMC1PMLPSMD1RHOCTAOK3GPS2INSCGrand TotalGAS2L1HAUS6CSNK1DMED25PRKAA1CKAP5PELOPPP2R3BCHORDC1PPP2R2DILF3ZC3HC1RAB8APCM1BRD7HDAC3ACTR3SPAG5TUBGCP3CALRBANPSKP2MEI1RANGAP1RAB35PSMB1CAV2STRADAUBE2E1TADA2ASOX2ODF2TEX11BRSK1REC8GTPBP4PSMA4LIN52PAK4RRS1PSME1PIM3KHDRBS1NBNECDHDAC1HDAC2CAMK2BCDC25BPRKCADSTRALABIRC2CYLDPAPD5MTA3AKT1ESCO1PSMB7PRPF40ATP53BP2ROPN1BNUP43IQGAP3TCF3GATA3ERFRPS6KA3PKHD1USP39SMAD3TACC1PSMB5PSMB4CCNCNR2C2PSMC5TJP3RAD21DDX4UBBXPO1RASA1UBE2IMAPK7PINX1NSL1MAPRE1RHEBCUL2PCNTSLC2A8NFATC1PRKCDPPP1CAANAPC13PBRM1USP33PSMC4ARPP19PSMD11CLTCL1FANCMRCBTB1SESN3CLTCANKLE2TRIM71SGSM3RPA4GAS2L3AURKCLATS2E2F1E2F3DGKZPIWIL1NEK11SPDYCRAB6CADAM17PPP2R2AMAD1L1PSMB3CEP290ILKAPE2F5CCNT1BCAT1CDC37YWHAEDYNLT1CENPTZBTB17STAG3RRP8DYNC1H1GSK3BBOP1PLK2ATRIPPRKCESMC1AGSPT1MAP3K11NGFRBIDCCNYL1FGFR1OPHRASCAB39SOX4FOXO4GAS1MAP3K8PDGFRBHBP1CUL4BRHOBDACT1PRR5TPD52L1NUPR1CCND2IGF1RCTGFRGS2CDKN2CDBC1ID2RPS6KA2SOX15SFRP1MX2HERC5PPATTUBA4ARAD54LBARD1SAC3D1TUBG1SLBPBTG3CHEK1RANBP1PDXPSTMN1FIGNL1RPA3MCM7POLA1POLENCAPG2NUSAP1POLA2MELKCENPPPTTG1RFC5PSMC3IPFANCGZWINTDSN1MSH6GPR3IL12ACDCA2DCLRE1BTOP2ABLMESPL1LZTS1POLD1MLF1IPGINS2GMNNCDT1CENPMFANCIMCM2FEN1CENPKMCM5E2F7HMGA2CDC25AIL1ATNFAIP3IL1BPTGS2DTLRRM2LEF1POLE2LIG1CDC7MCM4TYMSCCNE2RFC4RFC2PCNAMCM3MCM6CDK2TIPINRBBP8HELLSPKIAUHRF1EZH2CDKN2AHHEXKNTC1CCNE1IL8PRIM1CHAF1BMAPK13ADCYAP1ESCO2TP73BMP2ITGB3BPSOX9RUNX3RBL1CENPQPOLD3RFC3SLFN11RFWD3YEATS4MKI67FAM83DMTBPTP63HJURPNEK2DLGAP5NEUROD1TTKFANCD2GTSE1GAS6BUB1DAZLNPATMCM10CCNFNCAPGE2F2AURKAAURKBKIFC1CDC20EXO1PLK4PRC1CHTF18DNA2CCNB2CENPFMYBCENPNDCLRE1ACDKN3UBE2CNUP85TFDP1FBXO5CEP152APEX2RPA1RAD54BCEP78ANLNMND1CDCA5USP37CAMK1FGF2PIM2SFNCHAF1AEGFLIFCASP3GADD45APTPN3CCND3PSMB9FOSL1RPS6KA1PSME2CENPVFSD1NKX3−1STEAP3DHFRCDC25CSPIRE2STRA13NCAPD3VRK1OSGIN2CDC6PRIM2ERN1PARD6AMASTLTPX2HAUS8NOLC1TACC3FGFR3PPM1GBCL2CENPOTOP3APID1PPP3CACENPIMSH2MLH1NUF2TTYH1NEK9RB1PSRC1RBBP4HAUS4MDKCRADDCABLES2GPSM2HTRA2MAD2L1CKS1BCENPAPBKADARB1CABLES1CKS2CASP2NASPMNS1LRRCC1APITD1CKAP2RHOUCD2APSIPA1NDC80SMC2KIF18AKIF20BBRCA1KIF22KIF2CSPC25TUBBRAD51CCHEK2MAD2L2CCNOEPGNDPEP3MSH4CCNB1WNT10BBRCC3FKBP6PMS1PRKAA2GMLCDCA3PPM1DCCND1TDRD9H2AFXBIRC5PSMD14CENPJBAXMNAT1RPA2KPNA2MAP2K1NCAPD2NUP37TXNIPKLF11MDC1RBM38FOXM1PA2G4PSMD2GSG2FOXA1PLK3HEPACAMEREGNOX5LRWD1DAXXBMP4KATNB1RNF167ERCC2POLD2PKMYT1JUNCDCA8AZI1WTAPSFI1RANMYCDHCR24MRE11ACENPLFAM111ADSCC1RACGAP1CCNA2KIF23OVOL2INTS7NUP107SPC24TXNL4AGINS4TRIP13CDKN1ALIN9SUV39H1CDK5R1CEP55OIP5ZWILCHCENPEKIF11
−2 0 2Value
Color Key

136
Next, we focused on pathways involved in cell proliferation. Figure 33 shows a
heat map of genes involved in controlling cellular proliferation and cell cycle regulation.
The heatmap reveals a cluster of genes that is strongly regulated by tumor-derived LT,
whereas 339LT.LXCXK only has a minimal effect on the transcription of these genes.
Additional expression of sT did not greatly affect transcription of the majority of genes
analyzed here. Zoomed-in regions highlight gene clusters that are up or down regulated
by 339LT. Genes highlighted by the heatmap analysis (Figure 33) that are affected by
339LT expression include genes involved in a variety of biological functions related to
cell cycle progression, DNA synthesis, mitosis, DNA repair, DNA damage response,
embryonic development, differentiation and immune signaling (Figure 33 and Table 5).
In addition to genes required for cell proliferation and DNA replication, 339LT also
induces or represses genes to regulate apoptosis or other forms of cell death (Figure
33). Tumor necrosis factor alpha induced protein 3 (TNFAIP3) for example, which is
known to be an inhibitor of programmed cell death, is increased 4.3 fold by 339LT
according to our microarray data. In addition, the tumor protein D52-like 1 (TPD52L1),
which positively regulates MAP3K5-induced apoptosis, is down-regulated 2.9 fold by
339LT expression. This data highlights the wide variety of genes that are modulated by
339LT to change the cellular milieu allowing for increased DNA replication without
triggering an unfavorable response such as cell death.

137
Table 5. Biological functions affected by 339LT expression in BJ-hTERT
Biological Function Genes regulated by 339LT*Cyclin E (CCNE1 and CCNE2)Ubiquitin-like with PHD and ring finger domain 1 (UHRF1)Cyclin-dependent kinase 2 (CDK2)Cell division cycle 7 (Cdc7)Cell division cycle 25A (Cdc25A)Deleted in bladder cancer 1 (DBC1)Growth arrest-specific 1 (GAS1)Cyclin-dependent kinase inhibitor 2C (CDKN2C/p18)Primase I (PRIMI)Minichromosome maitenance proteins (MCM2-7)Proliferating cell nuclear antigen (PCNA)Replication factor complex (RFC2,4)Thymidylate synthetase (TYMS)Ligase 1 (LIG1)Polymerase epsilon 2 (POLE2)Ribonucleotide reductase M2 (RRM2)Flap structure-specific endonuclease 1 (FEN1)Chromatin licensing and DNA replication factor 1 (CDT1)GINS complex subunit 2 (GINS2)Polymerase delta 1, catalytic subunit (POLD1)Topoisomerase (DNA) II alpha (TOP2A)Polymerase 2A (POL2A)Polymerase epsilon, catalytic subunit (POLE)Polymerase alpha 1, catalytic subunit (POLA1)Replication protein 3 (RPA3)Kinetochore associated 1 (KNTC1)Centromere protein K (CENPK)Centromere protein M (CENPM)MLF1 interacting protein 1 (MLF1IP)Extra spindle pole bodies homolog 1 (ESPL1)Cell division cycle associated 2 (CDCA2)MIND kinetochore complex component homolog (DSN1)ZW10 interactor, kinetochore protein (ZWINT)Centromere protein P (CENPP)Nucleolar and spindle associated protein 1 (NUSAP1)non-SMC condensin II complex, subunit G2 (NCAPG2)Pyridoxal phosphatase (PDXP)SAC3 domain containing 1 (SAC3D1)RAD54-like (RAD54L)Retinoblastoma binding protein 8 (RBBP8)Fanconi anemia, complementation group I (FANCI)Fanconi anemia, complementation group G (FANCG)MutS homolog 6 (MSH6)Checkpoint kinase 1 (CHEK1)BRCA1 associated RING domain 1 (BARD1)RAD54-like (RAD54L)Hematopoietically expressed homeobox (HHEX)Lymphoid enhancer binding factor 1 (LEF1)Secreted frizzled-related protein 1 (SFRP1)SRY box 15 (SOX15)Dapper, antagonist of beta catenin, homolog 1 (DACT1)Forkhead box O4 (FOXO4)SRY box 4 (SOX4Interleukin 8 (IL8)Interleukin 1 beta (IL1B)Interleukin 1 alpha (IL1A)Interleukin 12A (IL12A)
Immune signaling
* Genes are considered regulated by 339LT if the average fold change from 3 biological replicates is greater or equal to 2 when compared to empty control
Table 5. Biological functions affected by 339LT expression in BJ-hTERT
DNA replication machinery
Mitosis and cytokinesis
DNA damage and DNA repair
Embryonic development and differentiation
G1/S transition

138
It is well known that E2F transcription factors induce genes involved in cell cycle
entry. We therefore analyzed our data set for genes related to cell cycle regulation.
Table 6 lists fold changes of cell cycle regulatory genes that are changed greater than 2
fold in 339LT expressing BJ-hTERT cells in comparison with empty control cells. Cyclin
E is the highest up-regulated gene of this group with a 9.9 fold induction (CCNE2) over
empty BJ-hTERT. Cyclin-dependent kinase 2 (CDK2), which complexes with cyclin E to
induce G1/S transition is up-regulated 3.8 fold over empty control (Table 6). Cell
division cycle 25 A homolog (Cdc25A), which is also required for G1/S transition is up-
regulated 2.9 fold in 339LT expressing cells (Table 6). Curiously, cyclin D2, which also
acts to promote G1/S transition, is the highest down-regulated gene of this group (Table
6). Cyclin-dependent kinase inhibitor 2C (p18), which counteracts G1/S transition, is
down-regulated 2.2 fold by 339LT. All gene changes listed in Table 6 are
LXCXEdependent, indicating the importance of LT pocket protein binding in modulating
the cellular environment to promote S-phase entry.
!"#$%&'()*+,-+../01 2-3,)% 4*'5"6+#"*"+*&3" ../+01 ../+0170898: ../+01+;+<199=4> !"!#$%&'( )*+&,&-*(. (*(&,&/*-. 0*1&,&1*/.
9?:=@A !"!#$%23454%34%6&7$%894&$%:$;$6<=&+>&&?5(0@5(1A 1*1&,&+*B. (*(&,&/*(. -*0&,&+*(.
99=4@ !"!#$%&'+ 1*( (*( )
9?:@ !"!#$%23454%34%6&7$%894&+ -*C ( -*)
9?9@BA !4##&3$D$9$<%&!"!#4&+)&:<E<#<F&>&?G*&5<E;4A +*B /*B -*C
9?:=>A !"!#$%23454%34%6&7$%894&$%:$;$6<=&(>&?5+(H&I$5(A +*1 (*- +*0
4@C@ '+J&6=8%9!=$56$<%&K8!6<=&+ +*1 (*+ +*)
99=?@ !"!#$%&L+ /*- (*+ /*1
9?:=@9 !"!#$%23454%34%6&7$%894&$%:$;$6<=&+I&?5(CH&$%:$;$69&ILM1A /*) /*C /*)
DD+AE"5&#"+F)%G+HI&*#"<+)E"5+"3J'-+H)*'5)%+F5)3+,()%)#(H&%+'5(J%(H&'"<+F)5+#"*"<+K('I+L@+F)%G+HI&*#"+(*+../01+H)3J&5"G+')+H)*'5)%&?J<#3&!:8%F49&=45=494%6&5=<;4&8D4=8F49&K<=&F4%49&3464!643&;"&EN#6$5#4&5=<;49&?IIO'(&3464!643&;"&1&5=<;49P&ILMO+>&3464!643&;"&-&5=<;49P&
+&'+J+&3464!643&;"&(&5=<;4P&8##&<6:4=&F4%49&3464!643&;"&+&5=<;49&AD+2'&*G&5G+G"E(&'()*+F)5+#"*"<+G"'"H'"G+,-+M.+(*G(E(G$&%+J5),"<+G$5(*#+3(H5)&55&-+&*&%-<(<
+C)%G+HI&*#"DD+
+++++++++++++++++$J
G)K*
Table 6. Cell cycle regulatory genes differentially regulated by 339LT

139
4.3.4 Confirmation of LXCXE-motif dependent up-regulation of cyclin E and
CDK2 transcript levels
To validate the microarray result, which demonstrates up regulation of cyclin E and
CDK2 transcripts (Tables 5, 6), we performed semi-quantitative RT-PCR on a panel of
BJ-hTERT stable cell lines expressing different MCC-derived LTs (350, 339 and MKL-1
truncations, Figure 34A) and saw increased cyclin E and CDK2 transcript levels with all
three truncated LT proteins (Figure 34C). Expression of an experimentally cloned LT
construct that deletes LT sequence C-terminally from the start of the LXCXE motif
(∆LXCXE) or expression of 339LT.LXCXK show no change of cyclin E transcript levels
compared to empty control (Figure 34C). Cyclin D1 transcripts, which showed no
increase in our microarray analysis (data not shown), shows no consistent change
across cell lines. GAPDH transcript levels serve as controls and are not significantly
increased in the different stable cell lines (Figure 34C).
!"#
epitopes
Helicase domain Leucine Zipper
2000 3000
3080 429 861
1000 5387/1
LXCXE DnaJ OBD Zn Finger
C2H2 ATPase domain
nt 196
CM8E6
FL-LT
MKL- LT
CM2B4
339LT
350LT
1841 1208 1619
!LXCXE

140
Figure 34. Semi quantitative RT-PCR analysis confirms up-regulation of cyclin E and CDK2 transcripts by tumor-derived LTs (A) Diagram indicating different LT truncation constructs (∆LXCXE, 339LT, 350LT and MKL-1 LT) as well as full length LT (FL-LT). (B) BJ-hTERT stable cell lines expressing different tumor-derived MCV LTs or the ∆LXCXE truncation mutant were immunoblotted for LT expression using the CM2B4 antibody as well as αTubulin as a loading control. (C) RT-PCR analysis of BJ-hTERT stable cell lines using cyclin E, CDK2 and cyclin D1 primer pairs. GAPDH was amplified as a housekeeping gene control.
4.3.5 Validation of increased Cyclin E and CDK2 protein expression in BJ-hTERT
To confirm that up-regulated Cyclin E and CDK2 transcripts in tumor LT
expressing cells correlates with increased protein expression, we immunoblotted lysates
from BJ-hTERT stable cell lines used for proliferation assays (Figure 27) and
microarray analyses (Figures 31-33), and checked for cell cycle regulatory proteins. As
published previously by our group (367), Cyclin E protein level is increased in an
LXCXE-dependent manner by 339LT (Figure 35A). This increase is slightly enhanced
by sT co-expression, and coincides with CDK2 protein induction (Figure 35A). Cyclin
D1 and cyclin A protein levels are not significantly altered by 339LT expression (Figure
!"#
epitopes
Helicase domain Leucine Zipper
2000 3000
3080 429 861
1000 5387/1
LXCXE DnaJ OBD Zn Finger
C2H2 ATPase domain
nt 196
CM8E6
FL-LT
MKL1 LT
CM2B4
339 LT
350 LT
1841 1208 1619
!LXCXE
$%&%'#
(%)*
)+#
,-.#%'#
/0%&1#%'
#
,,2#%'#
34567#
,,2#%'"%)*
)0#
8'9:9;<=#
%'# >#=?=&@53A<BA#
C"# *"#
*7A;<=#+#
*D0E#
*7A;<=#D1#
F!GDH#
+4567#
,,2#%'#
,,2#%'"%)*
)0#
,-.#%'#
(%$*D+#%'##
/0%&1#%'
#HEI
#
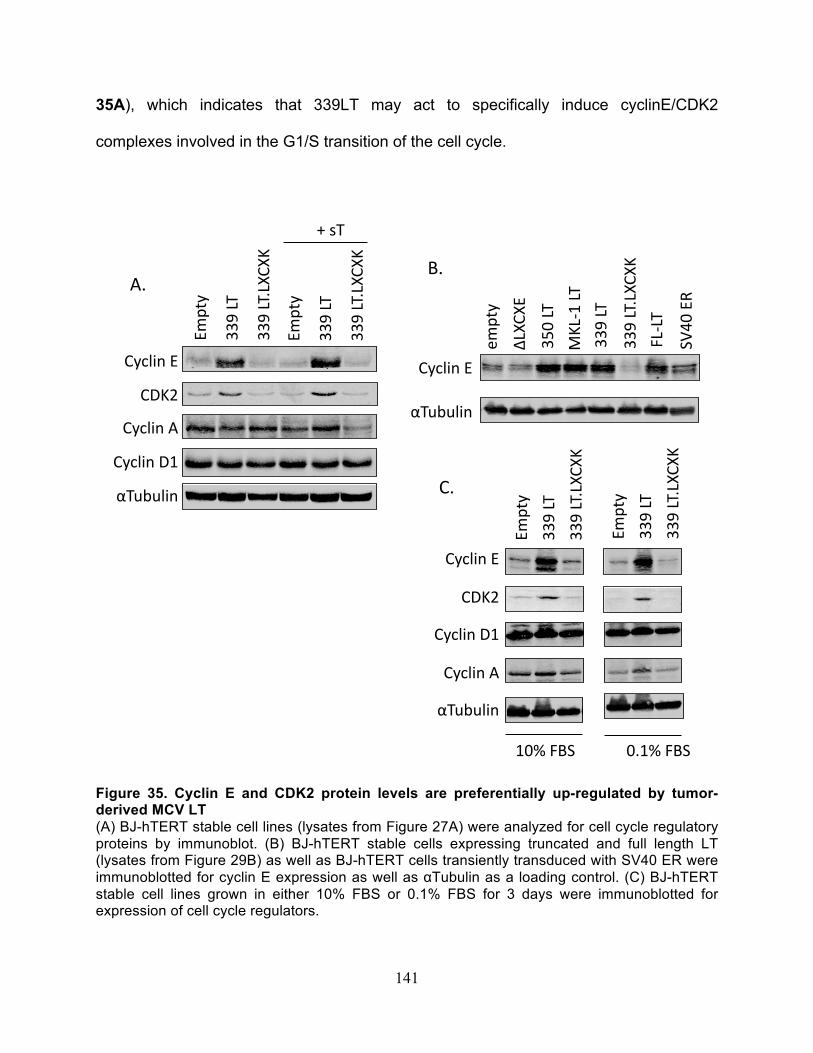
141
35A), which indicates that 339LT may act to specifically induce cyclinE/CDK2
complexes involved in the G1/S transition of the cell cycle.
Figure 35. Cyclin E and CDK2 protein levels are preferentially up-regulated by tumor-derived MCV LT (A) BJ-hTERT stable cell lines (lysates from Figure 27A) were analyzed for cell cycle regulatory proteins by immunoblot. (B) BJ-hTERT stable cells expressing truncated and full length LT (lysates from Figure 29B) as well as BJ-hTERT cells transiently transduced with SV40 ER were immunoblotted for cyclin E expression as well as αTubulin as a loading control. (C) BJ-hTERT stable cell lines grown in either 10% FBS or 0.1% FBS for 3 days were immunoblotted for expression of cell cycle regulators.
!"#"$%
&"'(
')%
*+,%"$%
-."#/%"$%
**0%"$%
12345%
(56789%)%
:$;<;789%
=>%
(56789%)%
(?.@%
(56789%=%
(56789%?/%
:$;<;789%
)2345%
**0%"$%
**0%"$>"'(
'.%
A%B$%
)2345%
**0%"$%
**0%"$>"'(
'.%
**0%"$>"'(
'.%
CDE,%)F%
G>%
)2345%
**0%"$%
**0%"$>"'(
'.%
)2345%
**0%"$%
**0%"$>"'(
'.%
%(56789%)%
%(?.@%
%(56789%?/%
%(56789%=%
%:$;<;789%
/,H%!GC%%%%%%%%%%%%%,>/H%!GC%
(>%

142
We then confirmed induction of cyclin E protein levels in the BJ-hTERT stable
cell lines that express either full length LT (FL-LT) or different truncated LT proteins
(350LT, MKL-1LT and 339LT) (Figure 35A-B). Stable expression of FL-LT did not
increase cyclin E protein levels to the same extend as tumor-derived LTs (Figure 35B).
Expression of the ∆LXCXE construct or 339LT.LXCXK shows no change in cyclin E
protein compared to empty control (Figure 35A-B) consistent with microarray results.
The SV40 early region (SV40 ER) was transiently transduced into BJ-hTERT by
lentiviral infection and SV40 LT and sT protein levels were checked by immunoblot
(data not shown). Interestingly, expression of SV40 ER, which also contains an LXCXE
motif, did not alter cyclin E expression (Figure 35B). We also wanted to determine
whether or not the effect of 339LT is seen in serum starvation conditions. After serum
starving BJ-hTERT cells in 0.1% FBS, we confirmed up regulation of cyclin E and CDK2
even under nutrient deprivation (Figure 35C). Notably, the levels of cyclin A were also
increased in 339LT expressing cells compared to empty and 339LT.LXCXK during
serum starvation, which is not apparent during normal growth conditions (Figure 35C).

143
4.3.6 Cell cycle analysis of BJ-hTERT stable cells
To confirm functional consequences of up-regulated cyclin E and CDK2 levels
we analyzed cell cycle profiles in BJ-hTERT 339LT as well as 339LT.LXCXK cells by
BrDU incorporation as well as propidium iodide (PI) stain and compared them to empty
control cells. Unsynchronized BJ-hTERT 339LT stable cells showed an increase in cells
entering the cell cycle compared to empty and 339LT.LXCXK cells (Figure 36). This
data supports the hypothesis that tumor-derived MCV LT induces S-phase entry in an
LXCXE-dependent manner, presumably through increased cyclinE/CDK2 complexes.
Figure 36. BJ-hTERT 339LT expressing cells show a greater percentage of cells entering the cell cycle BJ-hTERT stable cell lines empty, 339LT and 339LT.LXCXK were analyzed for BrDU incorporation and PI staining by FACS. S-phase populations are indicated by red boxes in the top panel.
!"!#$ %&"&#$ '"%#$
!"
()*+,-,./$0*-,-1$2345$6*781789$
:0;<
$2=7>
?@)3A9$
<*.7
8$
B/+8C$ ''DE;$ ''DE;"EF<FG$
144
4.4 DISCUSSION
In this report, we further investigate the proliferative effect that tumor-derived MCV LT
has on human fibroblast growth. Growth stimulation is dependent on LXCXE-mediated
signaling, and increased by sT expression to a minimal extend. The growth promoting
effect of tumor-derived MCV T antigen in human BJ-hTERT cells as well as mouse
embryonic fibroblasts (MEFs) was reported previously (260), however, the contribution
of the small T antigen isoform, as well as LXCXE dependence was not addressed. In
addition, a recent report by Li et al. indicates that truncated LT does not have a growth
promoting effect in U2OS cells (366), which may be due to the fact that U2OS is a
transformed cancer cell line with oncogenic signaling already in place. Additional MCV
LT expression therefore may not further increase the growth rate of this highly
proliferative cell line. Li et al. did not observe a growth promoting effect of truncated
MCV LT in MEFs (366), as was reported by Cheng et al. (260), however Li et al. did not
express sT in addition to truncated LT, and this discrepancy in results may be due in
part to sT expression. Therefore, sT may be critical in enhancing growth in rodent
fibroblasts. This is supported by data demonstrating transforming activity of sT in Rat-1
cells (129). Our results indicating LXCXE-dependence for tumor-derived LT
enhancement of growth proliferation are in line with a previous report indicating loss of
MCV-positive MCC xenograft growth upon LXCXE mutation (297)
The fact that we do not observe soft agar colony formation in BJ-hTERT
fibroblasts expressing 339LT, sT and hRasV12 in the context of p53 knockdown is most

145
likely due to insufficient hRasV12 transduction efficiency in this cell line (Figure 36C).
Despite the fact that endogenous Ras levels are decreased in the presence of 339LT,
the ectopically over-expressed hRasV12 is expressed strongly in most cell lines even in
the presence of 339LT. Further investigations are needed to distinguish the effect that
339LT has on endogenous Ras or overexpressed hRasV12, and whether this has any
effect on transformation.
When studying cumulative oncogenic events that lead to a transformed
phenotype, it is important to keep in mind that the specific combination of oncogenic
pathways that are deregulated in a cell and the specific cell type influence the ultimate
fate of that cell. In contrast to SV40 T antigen mediated transformation, tumor-derived
MCV LT may require a different combination of oncogenic hits to induce human
fibroblast transformation. My findings emphasize further differences between SV40 LT
and MCV LT and their modulation of the cellular milieu. In addition to MCV LT’s possible
inhibitory effect on Ras, SV40 induced human fibroblast transformation may also differ
in that SV40 LT interaction with p53 has been indicated to contribute to transformation
not only by inactivating p53, but also through a gain of function activity in rodent cells
(162). Targeting of cellular proteins through the LCXCE motif also seems to differ in part
between SV40 LT and MCV LT. While MCV tumor-derived LT induces cyclin E
transcript and protein levels in an LXCXE-dependent manner, SV40 LT expression in
BJ-hTERT cells does not result in cyclin E protein induction despite the presence of the
LXCXE motif.
Microarray analysis reveals strong up-regulation of cell cycle regulators, with
cyclin E and CDK2 among the top up-regulated genes in this group (Table 6). This

146
indicates that 339LT mainly modulates the cell cycle to promote G1/S transition. This is
also supported by the fact that Cdc25A, which functions to regulate G1/S transition by
dephosphorylating CDK2 (368), is also up-regulated in 339LT expressing cells (Table
6). In addition, the G1/S transition inhibitor p18 is down-regulated in BJ-hTERT 339LT
cells (Table 6). D-type cyclins are known to partner with CDK4 or CDK 6 to
phosphorylate RB family proteins resulting in E2F release to promote S-phase entry
(369). Cyclin D2 is the highest down-regulated cell cycle regulator in 339LT expressing
cells (Table 6), which could be explained by a negative feedback loop through p16
(CDKN2A), which is up-regulated by 339LT expression (Table 6). In addition, Cyclin D2
function may be compensated by Cyclins D1 and D3, which are unchanged in 339LT
expressing cells compared to empty control cells (data not shown). However, D-type
cyclin function in general may be dispensable in 339LT expressing cells, due to RB
family proteins being bound to LT, freeing E2F transcription factors in the absence of
RB phosphorylation through Cyclin D CDK4/6 complexes.
In addition to cell cycle regulators, our microarray analysis also identified other
growth-promoting genes that are affected by by 339LT expression in BJ-hTERT cells,
with especially high up-regulation of CXC family chemokines (data not shown). CXCL1,
a CXC family chemokine that has been indicated in proliferation as well as migration
(370), is highly up-regulated by 339LT (68 fold induction with single probe detection,
data not shown). The highest up-regulated gene in the presence of 339LT in BJ-hTERT
cells is IL-8, which is up-regulated 116 fold (average of 2 individual probes, data not
shown) in an LXCXE-dependent manner. IL-8 is also a family member of the CXC
chemokines that is known to stimulate cell proliferation and migration in various cell

147
types (371, 372). The proliferation and migration promoting effects of IL-8 is associated
with EGFR transactivation as well as increased expression and activity of
metalloproteinases (MMPs) (373), several of which are up-regulated in 339LT
expressing cells as well (MMP1 = 18.4 fold induction from single probe detection, MMP3
= 4.3 fold induction from single probe detection; MMP7 = 2.5 fold induction from 2 probe
detection). Like IL-8 up-regulation, induction of MMPs is LXCXE-dependent.
Interestingly, a study reports that HPV 16 E6 induces IL-8 production and subsequent
up-regulation of MMPs (374), indicating that this pathway may be commonly targeted by
tumorviruses. However, we have not confirmed CXCL1, IL-8 or MMP transcriptional up-
regulation by additional experimental techniques, and we do not know whether 339LT
expressing BJ-hTERT cells secrete CXCL1 or IL-8. Future experimental analyses are
needed to elucidate whether or not our microarray results can be validated and proven
significant in MCV biology.

148
5.0 CONCLUSIONS AND PERSPECTIVES
5.1 MS-1 CELL LINE
In the pursuit to uncover novel features of MCV cell biology in vitro, we have developed
the new MCV-positive MCC cell line MS-1, which provides a valuable tool for future
studies related to this virus (described in chapter 2). MS-1 has clonally integrated MCV
genome identical to the tumor biopsy from which it was derived with a tumor signature T
antigen truncation. It exhibits markers characteristic for MCC in the clinic, and is
tumorigenic in immunocompromised mice, which makes it a good candidate for
preclinical chemotherapeutic studies (as described in Appendix B and C of this thesis).
5.2 MCV ORIGIN REPLICATION
As part of our quest to study MCV biology, we focused on several functions of the viral
T antigen proteins that are either absent or conserved during MCC tumorigenesis. In
chapter 3, we focused on aspects related to MCV genome replication, which is deleted
in MCC-derived MCV genomes due to T antigen helicase domain truncations as well as
origin point mutations. We identified domains required for efficient viral origin replication
and defined a minimal core origin sequence of 71 nucleotides that is needed. We show

149
that the minimal origin region contains 4 essential GAGGC pentanucleotide sequences
that are known to serve as LT binding sites in other polyomaviruses. The essential MCV
pentanucleotide sequences however show a different orientation and spacing than is
known for the well-studied SV40 and PyV origin sequences, which may provide the
opportunity to study a unique origin replication mechanism in MCV. Further studies are
needed to determine how LT forms a complex on the MCV origin, and whether or not it
forms a double hexamer as other polyomaviral LTs do.
In addition to origin features required for MCV replication, we also evaluated non-
origin viral functions. We find that sT expression is required for efficient origin replication
by LT; however, additional experiments were needed to determine the precise
mechanism by which sT expression contributes to replication. Subsequent studies by
Kwun et al. (Cell Host & Microbe, in press) show that sT’s PP2A targeting function is not
necessary to enhance replication, but rather a sT domain responsible for stabilizing LT
protein (LSD) is required. These results stand in conflict with data presented here,
which indicate that a PP2A binding mutant of sT (C109S) is insufficient to promote
origin replication. Further evaluation of the C109S sT mutant however demonstrated
compromised protein stability as compared to wild-type sT protein, which may explain
its lack of an enhancing effect on replication. Other PP2A mutants used in the follow-up
study by Kwun et al. include R7A and L142A, which have comparable expression levels
to wild-type sT and do not compromise sT’s effect on replication. In addition, treatment
with the PP2A inhibitor Okadaic acid also does not have any effect on sT-mediated
enhancement of origin replication (data not shown). Kwun et al. show that sT stabilizes

150
LT protein by targeting the cellular ubiquitin ligase complex SCFFbw7, which targets LT
for proteasomal degradation otherwise (Cell Host & Microbe, in press).
We also found that Hsc70 binding by LT through its J-domain is essential for its
replication function. In SV40, the J domain is required for various functions including
viral replication, as well as transformation, transcriptional activation, and virion assembly
(136). It was discovered that instead of having a direct effect in which the J domain
would recruit a Hsc70 homologue and facilitate viral DNA replication through physically
rearranging the DNA replication machinery, the J domain acts indirectly through RB-
family members and E2Fs (136). Published results support an indirect model of DnaJ
domain functionality in replication, in which the DnaJ domain facilitates T antigen’s
interaction with RB family members in an ATP-dependent manner to promote E2F-
mediated transcription to induce S-phase entry (152). Whether or not MCV LT mediated
replication functions through a direct or an indirect mechanism remains to be
uncovered. Future experiments are needed to investigate ATP dependence as well as
the requirement to interact with RB family members to elucidate the role of the DnaJ
domain in MCV replication.
5.3 PROLIFERATION AND TRANSFORMATION STUDIES
To further uncover mechanisms that lead to transformation, we investigate the role of
tumor-derived MCV T antigens in the cellular environment. Chapter 4 focuses on one
truncated LT, 339LT, which represents one of the longest tumor-derived MCV LT
proteins identified in MCC tumors thus far. We show that 339LT expression promotes
151
human fibroblast (BJ-hTERT) proliferation in an LXCXE-dependent manner, and that sT
only minimally contributes to this effect. Transformation studies presented here, which
aimed to re-capitulate defined human transformation experiments performed by Hahn et
al. (316, 357) in the context of SV40 T antigens, reveal that MCV T antigens do not
transform BJ-hTERT cells. Additional knockdown of the tumor suppressor p53, as well
as mitogenic hRasV12 expression resulted in small soft agar colony growth of cells
expressing sT and hRasV12 in p53 knockdown conditions. In cells expressing p53
(shscr control cell line) that are transduced with sT and hRasV12, small soft agar colony
formation was observed at 4 weeks (Figure 30); however, subsequent evaluation of soft
agar plates at 8 weeks revealed degradation of the colonies (data not shown), indicating
that p53 knockdown is required for soft agar colony maintenance.
Surprisingly, additional expression of 339LT did not result in soft agar colony
growth in the presence of sT and hRasV12 (Figure 30). Protein expression analysis by
immunoblotting however reveals that this result may be due to an insufficient
transduction efficiency of hRasV12 in this particular cell line (condition shp53, 339LT,
sT, hRasV12, Figure 28). In addition, endogenous Ras expression was consistently
decreased in cells expressing 339LT (Figure 28, and Appendix A). Future studies are
necessary to elucidate the effect that 339LT may have on endogenous Ras signaling.
Since we utilized a pan-Ras antibody here, which detects N-, K-, and H-Ras, it would be
important to perform additional analyses to distinguish endogenous expression between
the different isoforms in the presence of 339LT to uncover mechanistic insight. Our
microarray result indicates no difference in N-, K-, or H-Ras transcriptional expression in
339LT stable cells compared to empty controls (data not shown). Therefore, future

152
experiments may also include cyclohexamide treatment in order to determine whether
or not 339LT has any effect on Ras protein turnover. It would also be beneficial to
transduce a HA-tagged version of the hRasV12 to distinguish endogenous and
ectopically expressed Ras by different antibodies, and determine the effect of 339LT on
either. If 339LT shows no effect on hRasV12 overexpression in follow up experiments,
it is necessary to repeat the experiment to ensure proper transduction efficiency of
hRasV12 to be able to re-evaluate transformation under this condition (BJ-hTERT
shp53, 339LT, sT, hRasV12).
Additional efforts aimed at defining genetic elements capable of transforming
human fibroblasts in the context of MCV T antigen expression should also focus on
different oncogenes that could replace hRasV12 expression in this set-up. Possible
candidates include constitutively active forms of c-Myc or Akt, both of which are
downstream targets of Ras-mediated signaling that promote oncogenesis (375-377).
Transduction of c-Myc in the presence of MCV T antigens represents a promising
avenue for transformation studies, since sT has been shown to stabilize c-Myc protein
levels by inihibiting its proteasomal degradation through SCFFbw7 (Kwun et al., Cell host
& Microbe, in press). In addition, Rat-1 transformation by sT is in part dependent on c-
myc stabilization (unpublished data, Dr. Shuda). BJ-hTERT express rather low levels of
c-myc, which are only slightly elevated by sT expression (unpublished data, Dr. Shuda);
therefore higher, exogenous expression of c-myc may contribute to sT transforming
activities in BJ-hTERT.
Expression of constitutively active Akt, may provide another genetic element to
achieve human fibroblast transformation in the presence of MCV T antigens. MCV sT

153
has been shown to induce 4EBP-1 hyperphosphorylation, by an unknown mechanism,
leading to Rat-1 transformation (129). It is clear that mTOR activity, which is a
downstream target of Akt (378), is necessary for sT to induce transformation in this
setting (129). If 339LT in fact does inhibit endogenous Ras signaling, this may affect
downstream Akt activation, which in turn would lead to a loss of mTOR activity.
Therefore, expression of activated Akt, may result in BJ-hTERT transformation in the
presence of MCV T antigens.
Our microarray analysis revealed many additional pathways that are regulated by
339LT expression in BJ-hTERT cells. Several of these represent promising starting
points in further investigating MCV biology in human fibroblasts. The highly up-regulated
chemokine IL-8 has been implicated in proliferation and migration in several cell types.
Further experiments that are needed to validate microarray results include RT-qPCR to
confirm transcript up-regulation in the presence of 339LT, as well as ELISA analysis to
confirm secretion of IL-8 by BJ-hTERT stable cell lines. If BJ-hTERT 339LT cells do
secrete IL-8, it would be interesting to supply empty and BJ-hTERT 339.LXCXK cells
with IL-8 in their medium to determine whether or not proliferation is induced. In
addition, it would be possible to assay for an increased migratory potential of 339LT
expressing cells, since IL-8 is known to promote metastasis through up-regulation of
MMPs (379), some of which are also induced by 339LT. Therefore, performing matrigel
invasion assays or gap closure assays would provide mechanistic insights into the
migratory potential of 339LT expressing cells.

154
APPENDIX A
A.1 MOLECULAR FUN FACTS ABOUT BJ-HTERT STABLE CELL LINES
This section describes additional, unpublished data that was accumulated during
experimental analyses of BJ-hTERT stable cell lines. Even though this data still leaves
many questions unanswered, it presents interesting pieces of information on MCV LT
effects on the cellular environment. Experimental methods are included in section 4.2 of
this thesis. A. Guastafierro performed all experiments described in Appendix A. A.
Guastafierro, M. Shuda, Y. Chang, and P.S. Moore interpreted the data.
A.1.1 Endogenous Ras protein levels are decreased in 339LT expressing BJ-
hTERT human fibroblasts
Given the result that endogenous Ras and hRasV12 expression varied among the
different BJ-hTERT stable cell lines with endogenous Ras always reduced in the
presence of 339LT (Figure 28C), we checked Ras protein levels in our stable cell lines
used for proliferation and microarray analyses (lysates used in Figure 27). We again
observed decreased levels of endogenous Ras by MCV 339LT but not 339LT.XK
(Figure 37). Interestingly, our microarray data did not reveal any transcriptional effect of
339LT expression on N-, K, or H-Ras (data not shown).

155
A previous report that analyzed the Ras/Raf/MEK/ERK signaling axis before
MCV was discovered found that only two out of 44 MCC tumor samples showed
downstream activation of this pathway by phospho-ERK IHC evaluation (244). In line
with this data, our results indicate that MCV LT may inhibit endogenous Ras protein
levels, which may result in downstream silencing of this pathway, but further studies are
needed to demonstrate this. Nevertheless, the discovery of MCV in association with
MCC, may provide an explanation for why this pathway, which is frequently activated in
other skin cancers including melanoma (243), may not play a role in MCV-positive MCC
tumors.
Figure 37. Endogenous Ras protein levels are decreased in the presence of 339LT BJ-hTERT stable cells (lysates from Figure 27) were immunoblotted for endogenous Ras expression using an antibody that detects N-,K-, and H-Ras.
!"#$
%&'(')*+$
,-./0$
112$3&$
112$3&4356
57$
112$3&$8$#&$
!"##$%&%'()*+,-."*%,/0,1"&2*34%*56%4,71,%8#*%9952',*%9"$(9,5',4%:*%)9%4,$%6%$9,2;,%'42.%'2"9,<)9,

156
A.1.2 Tumor-derived MCV LT expression increases p53 protein levels resulting in
p21 protein up-regulation in BJ as well as BJ-hTERT human fibroblasts
Unlicensed DNA replication due to increased cell cycle entry induced by oncogenes,
such as cyclin E, have been shown to induce a DNA damage type response leading to
enhanced p53 protein levels. This prompted us to evaluate p53 protein levels in the BJ-
hTERT stable cell lines. We observed an increase in p53 protein levels in BJ-hTERT
stable cells expressing 339LT but not the 339LT.LXCXK (Figure 38A). Addition of MCV
sT expression did not alter p53 protein levels in the presence of 339LT. Knockdown of
cyclin E resulted in a reversion of p53 protein to basal levels in BJ-hTERT cells.
Knockdown of cyclin E was not complete in cells expressing 339LT, and showed higher
residual levels in cells expressing both 339LT as well as sT (Figure 38A). We also
checked p53 and p21 protein levels in BJ primary human fibroblasts, which have a
lower basal expression level of p53 protein than BJ-hTERT fibroblasts (Figure 38B).
We introduced 339LT as well as FL-LT, each with either an intact or mutated LXCXE
motif, by transient lentiviral transduction. We observed increased levels of both p53 as
well as the p53 downstream target p21 in the presence of 339LT as well as FL-LT (to a
lesser extend) in an LXCXE-dependent manner (Figure 38B). We show that p21
induction is mediated through increased p53 protein since knocking down p53 reverses
p21 protein up regulation (Figure 38B). We noticed that knockdown of p53 was less
efficient in cells expressing 339LT, which results in residual p21 protein expression
even under p53 knockdown conditions (Figure 38B). Transcriptional up-regulation of
p21 in the presence of 339LT was confirmed by microarray results (Table 6). p53

157
transcripts are unchanged in 339LT expressing cells compared to empty control (data
not shown).
We were struck by the result that tumor-derived 339LT increases p53 protein
levels with subsequent p21 activation in human fibroblasts, while still enhancing cell
cycle entry and promoting cell proliferation. In contrast, SV40 LT binds and stabilizes
p53 protein levels without full p21 induction, circumventing cell cycle arrest (380).
Another example of a viral protein that induces p53 mediated p21 protein level is HPV
E7, which can initiate S-phase entry through cyclin E/CDK2 despite p21 up-regulation
(381). Nevertheless, p53 regulates a wide range of genes other than p21 including
transcriptional activation of genes involved in apoptosis.
Figure 38. MCV LT stabilizes p53 protein levels resulting in p21 induction (A) BJ-hTERT stable cell lines used for microarray analysis were transiently transduced with shscr or shCyclinE and immunoblotted for cyclin E, p53 and αTubulin as a loading control. (B) BJ fibroblast stable cells expressing full length (FL-) LT or tumor-derived 339 LT with either an intact or mutated LXCXE-motif were transiently transduced with shscr or shp53 lentivirus. Lysates were immunoblotted for LT (data not shown), p53, p21 and aTubulin as a loading control.
!"#
$%&#
'($)*#
+,-,.#
+,-,./,010
2#&&3#,.#
&&3#,./,01
02#
45467##################45$%&#
$89#
!.:;:<=>#
'($)*#
+,-,.#
+,-,./,010
2#&&3#,.#
&&3#,./,01
02#
1*6<=>#'#
$%&#
!":;:<=>#
'($)*#
&&3,.#
&&3,./,010
2#
&&3,.#?#4.#
'($)*#
&&3,.#
&&3,./,010
2#
&&3,.#?#4.#
45467###################451*6<=>'#@"#

158
We therefore sought to analyze our microarray data for downstream p53
signaling pathways to determine whether p53 protein stabilization by 339LT results in
up-regulation of p53 transcriptional targets other than p21. We analyzed 129 confirmed
p53 target genes (382) from our microarray set, and only 14 genes (including p21) were
transcriptionally affected greater than 2 fold by 339LT expression in BJ-hTERT
fibroblasts. Out of these 14 genes we identified 3 genes that are typically repressed by
p53 including cell division cycle 25 homolog C (Cdc25C), DNA (cytosine-5-
)methyltransferase 1 (DNMT1), and immediate early response 3 (IER3); however, they
were conversely activated in 339LT expressing cells (Table 7, top column). Discoidin
domain receptor family member 1 (DKK1), Insulin-like growth factor binding protein 3
(IGFBP3), and matrix metallopeptidase 2 (MMP2) are genes usually activated by p53,
but showed transcriptional repression by 339LT (Table 7, top column), indicating that
out of the 14 p53 target genes de-regulated by 339 LT expression, only 7 genes were
regulated in a way usually thought of by p53 (Table 7, bottom column). This indicates
that even though p53 protein is induced in human fibroblasts, only selective target
!"!#$! !"##$%&'&(&)*$+,+#"$-.$/)0)#)1$!$234$5)06"7 89:;;<=>;4?@$89:;--A;>4-@$89:;;<=>;4? B"5B"((&'" -4<-$C$;4A<D ;4A>$C$;4-<D -4<E$C$;4=-D"%%& F&(+)&%&*$%)0G&*$B"+"5H)B$IG0&#,J$0"06"B$< 89:;<--E-4- G+H&'GH&*1 ;4.; ;4>= ;4?;"'()& F8K$2+,H)(&*"L.L7$0"H/,#HBG*(I"BG("$< 89:;;<?=>4< B"5B"((&'" -4>M <4;- -4A>*+,- N00"%&GH"$"BG#,$B"(5)*("$? 89:;;?A>=4? B"5B"((&'" -4?E <4;. .4E>*./01- N*(O#&*L#&P"$1B)QH/$IG+H)B$6&*%&*1$5B)H"&*$? 89:;;;.>A4E@$89:;;<;<??>A4< G+H&'GH&*1 ;4<E <4?= ;4;E((1# 9GHB&R$0"HG##)5"5H&%G("$- 89:;;E.?;4- G+H&'GH&*1 ;4EE <4<E ;4?=2!3,3- 3+G'"*1"B$B"+"5H)B$+#G(($KJ$0"06"B$? 89:<A-A-M4<@$89:;<M-E;4- O*P*)Q* E4<-$C$;4.=D <4;-$C$;4<<D -4>.$C$<4<.D!"4# !FA-$0)#"+O#" 89:;;<;-EAEE4<@$89:;;--?<4? G+H&'GH&*1 ?4EA <4;; E4.>!"%'&3567#& !,+#&*L%"5"*%"*H$P&*G("$&*/&6&H)B$<K$25-<J$!&5<7 89:;=AEM=4<@$89:;;;?A>4- G+H&'GH&*1 -4?? <4-A -4.-""0# FG0G1"L(5"+&I&+$F8K$6&*%&*1$5B)H"&*$-J$EAPFG 89:;;;<;=4< G+H&'GH&*1 -4E> <4-= -4;./3'!! SG*+)*&$G*"0&G$+)05#"0"*HGH&)*$1B)O5$! 89:;;;<?M4- G+H&'GH&*1 -4;A <4-E <4=?1!'3 TB)#&I"BGH&*1$+"##$*O+#"GB$G*H&1"* 89:<A-ME>4<@$89:;;-.>-4- G+H&'GH&*1 -4>A$C$-4;<D ;4>E$C$;4<MD -4<<$C$<4E?D2/'56&89-9-:;<=> (HBGH&I&* 89:;;M<E-4? G+H&'GH&*1 -4<< ;4ME <4=;)'/,2/&?356",8 UO0)B$*"+B)(&($IG+H)B$B"+"5H)B$(O5"BIG0&#,$<;$K 89:;;?AEE4- G+H&'GH&*1 -4-? <4<< -4E?
@@6";AABCBDE;>F6>GGB::;HD6DI=JBC:6GHCCB:7HDK;D<6EH6=IFE;7FB67CHJB:6>CB6;DK;G>EBK6
@@@63LBC><B6AHFK6GM>D<B:6HA6J;HFH<;G>F6EC;7F;G>EB:6AHC6<BDB:6N;EM6O#6AHFK6GM>D<B6;D6--P6Q)6GH=7>CBK6EH6GHDECHF
@62E>DK>CK6KBL;>E;HD6AHC6<BDB:6KBEBGEBK6JR6-6;DK;L;KI>F67CHJB:6KIC;D<6=;GCH>CC>R6>D>FR:;:
3LBC><B6AHFK6GM>D<B:@@@
.BDB6'>=B 2MHCE6"B:GC;7E;HD 7$-6CB<IF>E;HD --P6Q) --PSQT!T% --P6Q)6U6:)3GGB:;HD6VW:@@
Table 7. Microarray analysis of p53 transcriptional targets

159
genes are transcriptionally regulated in response. The mechanism by which p53
mediated transcription is inhibited remains to be explored. The microarray dataset
revealed that the gene encoding pituitary tumor-transforming 1 (PTTG1) is up-regulated
3.3 fold by 339LT expression. PTTG1 is known to stabilize p53 protein levels, while
negatively regulate the transcriptional activity of p53 (383, 384), this may be a possible
explanation of why p53 protein is enhanced in the presence of 339LT yet not fully
transcriptionally active. In addition, we did not observe p53 Serine 15 phosphorylation in
the presence of 339LT (data not shown), indicating limited p53 activation despite
increased p53 protein levels in BJ-hTERT fibroblasts.

160
APPENDIX B
SURVIVIN IS A THERAPEUTIC TARGET IN MERKEL CELL CARCINOMA
Work described in Appendix B was published in Science Translational Medicine
Sci Transl Med. 2012 May 9;4(133):133ra56.
with authors Reety Arora, Masahiro Shuda, Anna Guastafierro, Huichen Feng,
Tuna Toptan, Yanis Tolstov, Daniel Normolle, Laura L. Vollmer, Andreas Vogt,
Alexander Dömling, Jeffrey L. Brodsky, Yuan Chang, and Patrick S. Moore
R. Arora and M. Shuda performed T antigen and survivin knock down experiments,
immunoblots and cell cycle analysis. H. Feng performed DTS analysis. T. Toptan and
R. Arora created stable cell lines and tested and confirmed protein expression by
immunoblotting. R. Arora, Y. Tolstov, and L. Vollmer performed the drug screen. R.
Arora tested individual drugs and performed cell titer glo studies. A. Guastafierro and R.
Arora performed mouse xenograft experiments and qRT-PCR studies. D. Normolle
performed xenograft tumor volume analysis. A. Vogt, J. Brodsky, and A. Dömling
provided compounds and supervision on drug screen. R. Arora, Masahiro Shuda, A.
Guastafierro, Y. Chang, and P.S. Moore interpreted the data and wrote the manuscript.

161
B.1 INTRODUCTION
By comparing digital transcriptome subtraction (DTS) deep-sequencing profiles, we
found cellular survivin oncoprotein (BIRC5a) transcripts up-regulated seven-fold in
virus-positive compared to virus-negative MCC tumors. MCV T antigen knock-down in
MCV positive MCC cell lines decreased survivin mRNA and protein expression.
Exogenously-expressed MCV large T antigen (LT) increased survivin protein expression
in non-MCC primary cells. This required an intact retinoblastoma protein-targeting
domain that activated survivin gene transcription as well as expression of other G1/S-
phase proteins including E2F1 and Cyclin E. Survivin expression is critical to MCV-
positive MCC cell survival and a small molecule survivin inhibitor, YM155, is a highly
potent and selective agent for initiating irreversible, non-apoptotic, programmed MCV-
positive MCC cell death. Of 1360 other chemotherapeutic and pharmacologically-active
compounds screened in vitro, only bortezomib (Velcade) was found to be similarly
potent, but not selective, for killing MCC cells. YM155 was nontoxic and halted MCV-
positive MCC xenograft tumor growth in mice while bortezomib had significant toxicity
and was not active in vivo. Xenograft tumors resumed growth once YM155 treatment
was stopped suggesting that YM155 may be cytostatic rather than cytotoxic in vivo.
Identifying the cellular circuits, such as survivin, that are targeted by tumor viruses can
lead to rapid and rational identification of drug candidates for viral cancers that are
otherwise difficult to treat.

162
B.2 MATERIALS AND METHODS
B.2.1 Cell culture
Seven Merkel cell carcinoma cell lines: MKL-1, MKL-2, MS-1, UISO, MCC13, MCC26
and WaGa (gift of Jurgen Becker); NCI-H69 small cell lung cancer cell line (ATCC); 293
human embryonic kidney cells (ATCC); U2OS osteosarcoma cell line (gift of Ole
Gjoerup); BJhTERT immortalized foreskin fibroblast cell line (gift of Ole Gjoerup); and
BJ primary foreskin fibroblasts (ATCC) were used to screen and evaluate the small
molecules examined in this study. The Merkel cell lines and NCI-H69 were grown in
RPMI 1640 supplemented with 10% fetal calf serum, penicillin and streptomycin at 37
°C in humidified air containing 5% CO2. The remaining cell lines were grown in DMEM
supplemented with 10% fetal calf serum.
B.2.2 Compounds
A total of 1,360 compounds were used in the screening survey (232): 1,280 compounds
from LOPAC1280 library (Sigma Aldrich, accessed through University of Pittsburgh
Drug Discovery Institute), 89 compounds from NCI’s Approved Oncology Drug Set II
(from The NCI/DTP Open Chemical Repository, http://dtp.cancer.gov), 6 LT ATPase
inhibitors (MAL2-11B, MAL3-101, MAL2-51, DMT3084, bithionol and hexachlorophene
(385)) and 4 compounds that target and inhibit p53 and MDM2 binding (Nutlin-3,
YH264A, Y2H265A and KK_NW_16A (386, 387). 19 compounds that were in common
between the LOPAC 1280 and the NCI Approved Oncology Drug Set II library were

163
screened twice with comparable results. NCI Approved Oncology Drug Set II, SV40 LT
ATPase inhibitors and MDM2 inhibitors were reconstituted as recommended by
supplier. YM155 (4,9-Dihydro-1-(2-methoxyethyl)-2-methyl-4,9-dioxo-3-(2-
pyrazinylmethyl)-1H-naphth[2,3-d]imidazolium bromide) was purchased from Active
Biochemicals Co. Ltd. (Hong Kong, China). Reconstituted compounds were diluted in
cell culture media to obtain a 100x stock concentration prior to addition to cells.
Doxorubicin (positive control) was obtained from Sigma-Aldrich and DMSO (negative
control) was obtained from Fisher Bioreagents.
For EC50 measurements, dose-response curves were established for 17
drugs obtained individually in bulk stocks. Iodoacetamide (I1149), sanguarine chloride
(S5890), NSC95397 (N1786), chelerythrine chloride (C2932), calmidazolium chloride
(C3930), tetraethylthiuram disulfide (T1132), bay 11-7085 (B5681), quinacrine
dihydrochloride (Q3251), ellipticine (E3380), amsacrine hydrochloride (A9809) and
nutlin-3 (N6287) were purchased from Sigma Aldrich, USA. Mitoxantrone (NSC279836),
daunorubicin HCl (NSC82151), valrubicin (NSC246131), topotecan HCl (NSC609699),
teniposide (NSC122819) and bortezomib (NSC681239) were kindly provided by the
NCI/DTP Open Chemical Repository, http://dtp.cancer.gov.
B.2.3 MKL-1 cytotoxicity screen
MKL-1 cells were seeded at a density of 6000 cells in 50 ml of medium per well (120
cells/ml) in opaque polypropylene 384-well microplates (#781080, Greiner Bio-One,
Germany). Cells were incubated at 37°C in humidified air containing 5% CO2 for 24
hours. Thereafter, 25 ml of medium containing 3X drug per well was added to the

164
plates, which were incubated for an additional 48 hours. Cell viability was measured
using Cell Titer Glo (Promega) following manufacturer’s instructions. The validity of Cell
Titer Glo results in measuring cell viability was confirmed by trypan blue exclusion
staining and WST-1 assays (Roche) in pilot studies.
The LOPAC1280 library was screened at a final concentration of 10 mM for
each compound and the NCI library was screened at a final concentration of 1 mM for
each compound. MAP-C (Titertek Instruments Inc) and Janus MDT (PerkinElmer Inc)
were used for automated resuspension and the addition of LOPAC library drugs to
assay plates. NCI library compounds were added to wells by manual pipetting.
Cell Titer Glo assays were performed in duplicate using 384 well plates, each
containing 24 wells with 1% DMSO (negative control) and 32 wells with 200 mM
doxorubicin (positive control). Screening results were evaluated on the basis of
percentage cell survival normalized to the DMSO control (100%). Positive candidates
were identified using a cut-off value of <10% cell survival. The average Z factor was
0.61 (range 0.34-0.74) for the LOPAC library screen and 0.82 for the NCI library screen
(range 0.75-0.91).
B.2.4 Dose-response studies
Compounds that met the selection criteria < 10% cell survival were purchased or
obtained in bulk from NCI/NIH Developmental Therapeutics Program. Serial drug
dilutions from 10-4 M to 10-9 M were used on MCC and non-MCC cell lines. Cells were
seeded into 384-well plates at 6000 cells in 50 ml of medium per well. After 24 hours, 25
ml of 3X drugs were added at increasing concentration to each well. Cell viability was

165
then measured using Cell Titer Glo (Promega) kit following manufacturer’s instructions
as described previously. Each drug concentration was tested in triplicate for each cell
line and experiments were repeated twice. EC50 doses for the drugs were calculated
using a four parameter logistic equation (GraphPad Prism).
B.2.5 Trypan blue dye exclusion assay
Cells were equally seeded and treated with YM155 for 48 hours. To quantitate cell
death, cells were treated with Accutase (Millipore), collected, resuspended in PBS,
mixed with equal volume of Trypan blue (Lonza, 0.4%) and counted using a
hemocytometer under the microscope. Counting was performed three times, in
triplicate.
B.2.6 Expression and shRNA lentivirus construction
To express codon optimized full-length MCV large T antigen, the gene was synthesized
(DNA2.0) from the MCV-HF strain large T antigen sequence template (254) (GenBank
ID: JF813003) and cloned into the lentiviral pLVX EF puro vector (129). Truncated
tumor LT339 (representing the MCV339 strain, amino acid 1-455) and LT339.LXCXK
were cloned by site-directed mutagenesis from the codon-optimized full-length LT into
pSMPUW-hygro vector (Cell Biolabs Inc.) (129). MCV small T codon optimized was also
cloned into the lentivirus vector. Cells were infected with lentiviruses in the presence of
1-4 mg/ml polybrene for 24 hours, followed by media change. Stable selection with

166
either puromycin (1 mg/ml) or hygromycin (200 mg/ml) was initiated 48 hours after
infection.
shRNA for MCV T antigen knock-down was generated and used as previously
described (388), we renamed shT1 in Houben et al. to panT1 in this study. To knock-
down survivin gene expression, shRNA sequence (shsur1-5’
ccggCCGCATCTCTACATTCAAGAACTCGAGTTCTTGAATGTAGAGATGCGGtttttg-3’
and shsur2- 5’
ccggCCTTTCTGTCAAGAAGCAGTTCTCGAGAACTGCTTCTTGACAGAAAGGtttttg-3’
(Lower cased nucleotides indicate linker sequences used for cloning)) was cloned into a
pLKO.1puro lentiviral vector. shCntrl is a nontargeting shRNA negative control(388).
Cells were infected with lentiviruses, washed after 24 hours and then harvested for
immunoblotting six days after infection.
B.2.7 Immunoblotting
Cells were lysed in buffer (RIPA or 10mM Tris-HCl pH 8.0, 0.6% SDS) containing
protease inhibitor cocktail (Roche). Lysates were electrophoresed in 10% SDS-PAGE,
transferred to nitrocellulose membrane (Amersham) and reacted with specific antibodies
CM2B4 (1:5000 dilution)(281), CM8E6 (1:500 dilution), cleaved PARP, cleaved
caspase3, survivin, XIAP, p53, Bcl-2, Bax (1:1000 dilution, Cell Signalling
Technologies), E2F1, cyclin E (1:1000 dilution, Santa Cruz Biotechnology), LC3 (1:1000
dilution, Novus Biologicals) or α-tubulin (1:5000 dilution, Sigma)) overnight at 4°C,
followed by anti-mouse (1:5000 dilution, Amersham) or anti-rabbit IgG-HRP conjugates
(1:3000 dilution, Cell signaling) for 1 hour at room temperature. Peroxidase activity was

167
detected using Western Lightning plus-ECL reagent (Perkin Elmer). For quantitative
immunoblotting, Odyssey Infrared Imaging system (LI-COR) was used with IRDye 800-
conjugated secondary antibodies (1:5000 dilution, Rockland Immunochemicals).
B.2.8 qRT-PCR
RNA was extracted from cell lysates using Trizol reagent (Invitrogen) and cDNA was
synthesized using SuperScript III First Strand Synthesis (Invitrogen). Quantitative real-
time PCR for survivin was performed on cDNA using the SYBR green method (based
on manufacturer’s protocol, Applied Biosystems). Primers used were 5’-
CTGCCTGGCAGCCCTTT-3’ (Forward) and 5’-CCTCCAAGAAGGGCCAGTTC-3’
(reverse) for survivin (389) and 5’-CACTGGCTCGTGTGACAAGG-3’ and 5’-
CAGACCTACTGTGCGCCTACTTAA-3’ for b-actin. The relative change in expression
was calculated using the Pffal method (390) Experiments for MCC cell lines were
repeated six times (2 biological repeats done in triplicate). Experiments for BJ cell lines
were repeated six times (3 biological repeats done in duplicate). Mean and standard
error of mean was calculated and plotted as column graphs for comparison.
B.2.9 Cell cycle analysis
MKL-1 cells were treated with Accutase (Millipore) to break clumps and then
resuspended in fresh medium containing drug and treated for 12 hours.
Bromodeoxyuridine (10 mM concentration) was added three hours before harvesting.
Cells were then harvested and fixed in chilled 70% ethanol overnight. The cells were

168
then washed, resuspended in 200 ml of 2M HCl/Triton X (1%) and incubated for 30
mins at room temperature. Cells were centrifuged at 2000 rpm for 10 mins and
neutralized in 200ml of 0.1M sodium tetraborate (pH 8.5). Cells were then washed,
suspended in 20ml of PBS containing 0.5% tween20, 1% donkey serum and 2ml of anti-
BrdU antibody (1:10 diution, BD Biosciences) and incubated overnight at 4°C. Cells
were washed and incubated with secondary anti-mouse IgG Alexa488 (1:1000) for 1
hour at room temperature. Cells were washed, suspended in PBS containing 100mg/ml
of RNase A, 50mg/ml of PI (propidium iodide) and 0,05% Triton X and incubated for 30
mins at 37°C in the dark and then analyzed using an Accuri C6 flow cytometer.
B.2.10 Cell death evaluation by CFDA and PI staining
After harvesting, cells were resuspended in 2 ml of PBS containing 4mg/ml PI
(propidium iodide, Sigma) and 10 mM CFDA (Carboxy fluorescin diacetate, Invitrogen)
at room temperature for 10 mins. Cells were then rinsed in 1X PBS and examined under
the microscope. Quantitation was performed using ImageJ software.
B.2.11 Mouse xenograft studies
Compounds
For in vivo experiments, clinical-grade bortezomib (Velcade) was purchased from the
University of Pittsburgh Cancer Institute Pharmacy and YM155 was purchased from
Active Biochemicals Ltd. (Hong Kong, China). Compounds were dissolved in sterile
0.9% saline solution for administration to animals.

169
Animals
Six-week-old female triple immune-deficient NSG (NOD scid gamma) mice (Jackson
Laboratory) were maintained in a specific pathogen-free environment at the Hillman
Cancer Center Mouse Facility, University of Pittsburgh. All animal studies were
conducted according to protocols approved by the Animal Ethics Committee of the
University of Pittsburgh (IACUC Protocol # 1102226).
Xenograft Drug Treatments
MCC cells were checked for viability >90% by trypan blue staining resuspended in PBS
(2 × 10⁷ cells in 100 µl) and inoculated subcutaneously into the right flank of mice. Once
tumors were palpable (2-4 weeks after injection), mice were assigned sequentially into
receiving either bortezomib, YM-155 or saline treatment arms.
All treatments were delivered for three consecutive weeks. Bortezomib
treatment was delivered subcutaneously twice weekly at 1 mg/kg per mouse. To avoid
previously observed side effects, mice were given hydrogel (ClearH2O) and kept at
30°C (using a heating blanket to heat up half of the cage) during bortezomib treatment.
YM-155 (2 mg/kg) was given intraperitoneally on five consecutive days, followed by a
two-day treatment-free interval. The control group received saline alone (21 mice on
the same dosing schedule as bortezomib and 20 mice on the same dosing schedule as
YM155. Day 19 was the last day of drug delivery for both schedules and hence the end
of treatment. Caliper measurements of the longest perpendicular tumor diameters were
performed every other day and tumor volumes were calculated using the formula:
(width) 2 × (length/2). Animals were sacrificed when tumors reached 2 cm in any
dimension, >20% weight loss or when they became moribund. Survival was defined as

170
time from the first day of treatment until death/sacrifice.
Statistical analysis
Two-tailed paired Student’s t test was used to analyze statistical differences in qRT-
PCR results. Mouse survival curves were estimated using the Kaplan–Meier product-
limit method and were compared using the log-rank test (GraphPad Software, La Jolla,
CA). A piecewise linear hierarchical Bayesian model (391) was used to characterize
differences in tumor volumes and growth between treatments.
Immunohistochemistry
Immunohistochemical staining of mouse tumor tissues was performed as previously
described (281).

171
B.3 RESULTS
B.3.1 Survivin Expression in MCV-positive MCC
To identify pathways perturbed by MCV infection in MCC, we analyzed DTS datasets to
identify cellular genes differentially regulated between MCV-positive and MCV-negative
MCC (55). We compared 400,000 cellular transcripts from MCV-positive and MCV-
negative MCC tumors and found 1096 of 11,531 (9.5%) genes elevated >3 fold for the
MCV-positive compared to the MCV-negative library.
We next identified sixty-four genes using Gene Ontology (GO) gene definitions
directly involved in programmed cell death or cell cycle regulation (Figure 39A).
BIRC5a (Baculoviral inhibitor of apoptosis repeat-containing 5) mRNA encoding the
survivin oncoprotein were increased 7 fold (p=2.90xe-10) for virus-positive compared to
virus-negative MCC tumors (Figure 39A). Other genes regulating programmed cell
death, including TP53, cIAP2, XIAP, BAX, BCL2 and Caspase 3/6 transcripts, were not
differentially expressed (Figure 39A). Notably, some genes including TRAF2 and PI3K
were significantly reduced in virus-positive compared to virus-negative MCC tumor
libraries.

172
Figure 39. Survivin oncoprotein mRNA expression is increased in MCV-positive MCC (A) DTS comparison of 64 genes involved in programmed cell death and cell cycle regulation, showing that survivin (BIRC5) mRNA transcripts (highlighted in bold) were seven-fold higher in a MCV-positive than an MCV-negative MCC DTS cDNA library. The relative expression of genes was normalized to total sequence reads for each MCC library (also see Table S1 for more details). (B) MCV T antigen is required for survivin expression. Lentiviral MCV T antigen exon1 knock-down (panT1) decreased survivin protein expression among four MCV-positive MCC cell lines (left panel). shCntrl is a scrambled shRNA control lentivirus. No consistent changes in XIAP, BCL-2, Bax or p53 protein levels are seen after MCV T antigen knock-down among MCC cell lines (right panel). MKL-1, MKL-2, MS-1 and WaGa are MCV positive and UISO is MCV negative. (C) MCV T antigen is required for survivin transcription. Survivin mRNA levels were reduced in MKL-1 but not UISO cells after T antigen knock-down indicating that T antigen acts survivin transcription. Survivin mRNA was measured by qRT-PCR and normalized to β-actin mRNA. The experiments were performed in triplicate and repeated two times (mean+SEM). (D) Survivin expression is required for MCV-positive MCC cell survival. Survivin was targeted for knock down with two shRNA lentiviral vectors, shsur1 and shsur2 in MKL-1 cells and UISO cells. MKL-1 cells initiate apoptosis after survivin knock-down, with increased expression of cleaved polyADP ribose polymerase (cPARP) and caspase 3 (cCasp3), whereas UISO cells are resistant to survivin knock down-induced apoptosis. a-Tubulin is used as a loading control.
UISO
Survivin
XIAP
Bcl-2
Bax
p53
!-Tubulin
Survivin
!-Tubulin
MCV LT
MKL-2 MS-1 WaGa MKL-1
shC
ntrl
panT
1
75
50
37
(kDa)
panT
1
panT
1
panT
1
MKL-2 MS-1 WaGa MKL-1
panT
1
panT
1
panT
1
panT
1
panT
1
shC
ntrl
shC
ntrl
shC
ntrl
shC
ntrl
shC
ntrl
shC
ntrl
shC
ntrl
shC
ntrl B
C
A
Survivin
!-Tubulin
cCasp3
cPARP
MKL-1
shC
ntrl
UISO
shC
ntrl
shsu
r1
shsu
r2
shsu
r1
shsu
r2
D
Figure 1

173
B.3.2 MCV Large T Induces Survivin Through Retinoblastoma Protein Targeting
To determine if MCV T antigen increases survivin expression in MCC, we used a short-
hairpin (shRNA) lentivirus (panT1) to perform RNAi targeting of the MCV T antigen
exon1 sequence that selectively knocks down all MCV T antigen isoforms in MCC cells
(388). MCV-positive MCC cells infected with this lentivirus undergo non-apoptotic cell
death (necroptosis) when MCV oncoprotein expression is inhibited (388). MCV T
antigen reduction correlated with survivin reduction in all MCV-positive MCC cell lines,
but not in any of the MCV-negative cell lines (Figure 39B). The degree of survivin
decrease with T antigen knock-down ranged from modest in MS-1 to near complete in
WaGa cell lines (Figure 39B). This effect is at the level of transcription rather than
translation since BIRC5a mRNA is significantly reduced by T antigen knock-down
(Figure 39C).
Figure 40. MCV sT knockdown in MCC cell lines does not affect survivin expression UISO and MKL-1 cells infected with either sT1, which knocks down sT alone (Shuda et al., JCI 2011), or panT1 shRNA lentiviruses were immunoblotted for survivin and α-tubulin.

174
Use of an shRNA lentivirus that selectively targets only the small T antigen
isoform (129), however, did not affect survivin expression (Figure 40), indicating that
increased survivin transcription was dependent on MCV LT but not small T antigen
(knock-down of LT alone is difficult due to the overlapping structure of the T antigen
cistron). In contrast to survivin, no consistent changes in protein expression for p53,
XIAP, Bcl-xL, Mcl-1, Bad, Bik, Bmf, Bim, Puma, Bcl-2 or Bax proteins (Figure 39B and
ref. (388)) or for cleaved polyADP ribose polyomerase (PARP), cleaved caspase 3 or
cleaved caspase 9 proteins was seen after panT1 knock down in MCV-positive cells.
These results are consistent with our DTS findings suggesting that MCV T antigen
selectively activates BIRC5a transcription. We next sought to determine the importance
of survivin expression to survival of MCV-positive and MCV-negative MCC cells.
Although only partial suppression of survivin expression was achieved by shRNA
BIRC5a targeting, MCV-positive MKL-1 cells, but not MCV-negative UISO cells,
underwent apoptosis (Figure 39D).
To confirm that LT is the MCV T antigen isoform responsible for survivin
activation, we cloned and transduced a tumor-derived LT (LT339) cDNA into
nontransformed, primary human BJ fibroblasts. Survivin protein levels increased three-
fold when LT was expressed compared to the empty vector control (as measured by
quantitative LICOR immunoblotting, Figures 41A-B). Also consistent with our knock-
down experiments (Figure 39C), LT directly activates BIRC5a promoter transcription in
BJ cells (Figure 41C). The LXCXE domain in LT responsible for sequestration of RB1
mediates survivin activation. Both cyclin E and E2F1, required for cell cycle S phase
entry (392) are repressed by active RB1 and were used as markers for RB-regulated

175
gene expression. MCV LT339 activates expression of both cyclin E and E2F1 proteins
in BJ cells whereas LT339 having a point mutation that prevents RB1 binding (changing
LFCDE to LFCDK) (279) abolishes induction of cyclin E, E2F1 and survivin (Figure
41A). MCV small T expressed alone in BJ cells did not increase survivin oncoprotein
expression (data not shown) In contrast to primary BJ fibroblasts, we did not find that
MCV LT markedly increased survivin expression in cell lines that had been already
transformed, including 293HEK and U2OS cells (data not shown).
Figure 41. MCV LT induces survivin oncoprotein expression in primary BJ cells through its RB targeting domain (A) BJ cells were transduced with either empty vector, a tumor-derived LT cDNA (LT.339) or an LT cDNA with an inactive RB binding domain (LT.339LFCDK). Immunoblotting reveals that MCV LT.339 induces survivin expression but LT.339LFCDK does not. A similar pattern is seen for other S phase cell cycle proteins such E2F1 and cyclin E that are also transcriptionally repressed by RB. (B) LICOR quantitative immunoblotting for survivin in (A), normalized to a-tubulin (arbitrary units). (C) Survivin mRNA levels increased in BJ cells expressing LT.339 protein but not in cells expressing the RB1 binding mutant LT.339LFCDK. BJ cells expressing either empty, LT.339 or LT.339LFCDK were serum starved for 48 hours and then harvested for RNA. Survivin mRNA was measured by qRT-PCR and normalized to β-actin mRNA. The experiments performed three times in duplicate (mean+SEM).
Survivin
MCV LT
!-Tubulin
Empt
y
LT.3
39
LT.3
39.L
FCD
K
Cyclin E
E2F1
A B C
Figure 2
BJ cells

176
B.3.3 Survivin as a target for MCC chemotherapy
Given the apparent importance of MCV-induced survivin expression to MCC cell
survival, we examined YM155, an imidazolium small molecule inhibitor of the survivin
promoter that is currently undergoing Phase II trials for prostate cancer (389, 393).
YM155 is both highly active and selective for inhibiting MCV-positive MCC cell growth in
vitro as measured by Cell-Titer Glo assays (EC50 1.34 nM to 12.2 nM) (Figure 42A).
Figure 42. The survivin promoter inhibitor YM155 inhibits MCV-positive MCC cell growth (A) Dose-dependent growth curves at 48 h for YM155-treated cell lines. MCV-negative MCC13, BJ and BJhTERT cells showed relative resistance to YM155 treatment, whereas all MCV-positive cell lines (MKL-1, MKL-2, MS-1 and WaGa) were sensitive to YM155. MCV-negative UISO and MCC26 had intermediate sensitivity to the YM155. (B) Trypan blue vital dye exclusion assay showed dose-dependent cell killing at 48 h for MKL-1 cells (blue bars) whereas UISO cells (red bars) are relatively less sensitive and BJ cells (green bars) are resistant to YM155. (C)
A
Survivin
!-Tubulin
YM155 (nM)
0 1 10 100 1000
B
Figure 3
C

177
Dose-dependent decrease in MKL-1 cell survivin protein expression after 12 h YM155 treatment. MCV-negative MCC cell line growth is also inhibited by YM155 but this occurs at
concentrations 1-2 orders of magnitude higher than for MCV-positive MCC cells. YM155
treatment for 48 hours at 10-100 nM preferentially killed MCV-positive MKL-1 compared
to MCV-negative UISO cells as measured by trypan blue staining (Figure 42B).
Survivin protein was reduced in MKL-1 cells after YM155 treatment, consistent with
YM155’s proposed mechanism of action in inhibiting the BIRC5a promoter (Figure
42C).
We next examined mechanisms of cell killing by YM155 in MCV-positive MCC
cells (Figure 43). Survivin plays a role in mitotic progression and loss of survivin can
lead to cell death through mitotic catastrophe in some tumor cells (394). MCV-positive
MCC, however, are slowly cycling cells (doubling time of 3 days (388)) and do not
undergo G1 arrest or G2/M pileup as would occur with mitotic checkpoint activation in
rapidly cycling cells (Figure 43A, top panels). Instead, bromo-deoxyuridine (BrdU)
incorporation into DNA reveals a profound inhibition of DNA synthesis by YM155.
Figure 43A (boxes, bottom left panel) shows the normal inverted-U pattern for BrdU
incorporation during S phase DNA synthesis in MKL-1 cells. When the topoisomerase I
inhibitor camptothecin is added (Figure 43A, bottom right panel), accumulation of BrdU-
positive cells in G1 and G2/M/G1-tetraploid becomes evident, and S phase
incorporation is lost, consistent with repair polymerase activation during DNA damage
response signaling. YM155 treatment, however, ablates BrdU incorporation (Figure
31A, center panel), most consistent with disruption of DNA replication forks and
inhibition of new S phase and repair DNA synthesis, but not mitotic catastrophe.

178
Figure 43. Cell death phenotype of MCV-positive MCC cells treated with YM155 (A) Cell cycle analysis reveals YM155 treated cells do not undergo mitotic catastrophe. MKL-1 cells were treated with DMSO, YM155 (100nM) and camptothecin (CPT, 1mM) for 12 h and then subjected to PI (upper panel) and BrdU staining (lower panel). Boxes show S phase BrdU incorporation without treatment, accumulation at G1 and G2/M/G1 tetraploid during CPT treatment, and near-complete loss of BrdU incorporation during YM155 treatment. Box a represents G1 phase, box b represents S phase and box c represents G2/M phase (B) YM155 induces nonapoptotic cell death associated with autophagy in MKL-1 cells. MKL-1 cells were treated with DMSO, YM155 (100nM) or bortezomib (100nM) and immunoblotted for (c) cleaved PARP, cCaspase 3, LC3 and a-tubulin. In contrast to YM155, the bortezomib proteasome inhibitor activates MKL-1 cell apoptosis (also see Fig S2). (C) YM155 treatment initiates programmed cell death within 12-24 hours after treatment. MKL-1 cells were co-stained with CFDA (green, live) and PI (red, dead). Column graphs (right panel) represent mean and range of % CFDA-positive (green) and % PI-positive cells (red).
Moc
k Y
M15
5 (1
00nM
)
6h 12h
Figure 4
A
cCasp3
cPARP
LC3-II
Moc
k
YM
155
100n
M
Bor
tezo
mib
100
nM
B
!-Tubulin
C
Cou
nt v
s P
I B
rdU
vs
PI
Mock YM155 (100nM) CPT (1 µM)
24h

179
YM155 treatment results in early commitment to nonapoptotic programmed cell
death. No evidence of apoptosis was present, measured by caspase 3 and PARP
cleavage (Figure 43B), when MKL-1 cells were treated with 100 nM YM155 for 48
hours, but YM155 did initiate LC3-II accumulation, a marker for cell autophagy (395).
This is not due to loss of apoptosis pathway signaling since treatment with the
proteasome inhibitor bortezomib (Velcade) activated PARP and caspase cleavage
(Figure 43B). Commitment to YM155-dependent cell death occurs relatively quickly and
irreversibly: when MKL-1 cells were treated with 100 nM YM155 for 3, 6 or 12 hours,
followed by wash out with complete cell culture medium, only 51%, 3% and 1.8% of
cells respectively, remained viable at 48 hours, as measured by trypan blue dye
exclusion. This was confirmed by a cell viability assay using propidium iodide (PI, dead)
and carboxyfluorescein diacetate (CFDA, alive) co-staining (Figure 43C). Twelve to 24
hours of 100 nM YM155 treatment causes MKL-1 cells to lose membrane integrity,
becoming positive for PI and negative for CFDA staining.
To search for other MCC chemotherapeutics, we performed a two-stage
cytotoxicity library screen on 1,360 pharmacologically-active drug compounds including
1,280 drugs from the Library of Pharmacologically Active Compounds (LOPAC) (Sigma
Aldrich), 89 drugs from the National Cancer Institute’s Approved oncology drug set II
(19 compounds in common with LOPAC1280), 6 compounds targeting SV40 LT
ATPase activity, and 4 compounds targeting MDM2 to activate p53. These compounds
were screened at 10-5 M for >90% inhibition of MKL-1 cell growth in a Cell-Titer Glo
assay (Promega). Notably, mTOR inhibitors (everolimus, rapamycin etc), antiviral
compounds (ribavirin, acyclovir) and MDM-2 inhibitors active in other viral cancers (e.g.,

180
nutlin-3 (396, 397)) were not active in our screen (data not shown). This is consistent
with previous findings that MCV loses replication activity (279) and activates cap-
dependent translation downstream of mTOR in MCC tumor cells (129).
Eighteen (1.3%) of these 1360 drugs met our initial screening criterion for anti-
MCC activity and were selected for secondary dose-dependent screening on MCV-
positive and MCV-negative cell lines (Table 8). Only the proteasome-inhibitor
bortezomib (398) was active in vitro at low doses with an EC50 of 1.3-13.2 nM; however,
this activity was not selective for MCV-positive cells. Other agents, particularly
topoisomerase I and II inhibitors, also inhibited MCC cell growth but were generally far
less potent or had variable activity among different MCC cell lines (Table 8).
Table 5 EC50 (μM) concentrations for MCC cell lines
Drugs MKL-1 MKL-2 MS-1 WaGa UISO PROTEASOME INHIBITOR
Bortezomib 0.013 0.005 0.002 0.001 0.003 TOPOISOMERASE INHIBITORS
Ellipticine 3.2 6.5 6.9 3.0 1.1 Amsacrine hydrochloride 0.11 3.0 7.5 0.25 2.6
Teniposide 0.010 2.8 3.0 0.026 7.3 Valrubicin 0.23 2.8 9.9 0.32 4.0
Mitoxantrone 0.006 1.3 1.6 0.014 0.97 Daunorubicin 0.015 0.086 0.15 0.018 1.4 Doxorubicin 0.21 0.022 0.37 0.022 0.25 Topotecan 0.028 0.43 0.62 0.015 0.17 OTHERS
Iodoacetamide 0.29 0.30 0.64 0.37 2.5 Sanguinarine chloride 5.3 8.4 4.9 2.5 6.5
NSC 95397 1.2 1.5 1.8 0.73 2.8 Chelerythrine chloride 0.60 0.65 0.52 0.70 3.7
Calmidazolium chloride 2.2 1.7 2.1 2.1 2.0 Tetraethylthiuram disulfide 0.49 0.19 6.3 1.1 13
Bay 11-7085 1.4 1.7 2.7 1.2 4.5 Quinacrine dihydrochloride 5.1 4.6 4.9 5.2 7.1
!
Table 8. EC50 (µM) concentrations for MCC cell lines

181
B.3.4 Effect of YM155 on Human MCC Xenografts in Mice
We developed an MKL-1 xenograft model to test the in vivo efficacy of YM155 and
bortezomib on human MCC in NOD scid gamma (NSG) mice. Subcutaneous injection of
MKL-1 cells generates tumors that are positive for MCV LT and the MCC diagnostic
marker CK20 (Figure 44A), and progress to endpoint (2 cm tumor diameter) within 2-4
weeks after tumors are first detected. We treated these mice with bortezomib, YM155 or
saline for three weeks once tumors became palpable. Bortezomib was administered at
levels effective on multiple myeloma xenografts (399) (1 mg/kg, twice-weekly
subcutaneous injections). This did not significantly affect MCC tumor progression or
volume compared to treatment with saline alone (p=0.53, log-rank test). Bortezomib
administration at this level was associated with mouse lethargy and weight loss,
requiring temporary use of heat blankets and Hydrogel (ClearH2O) to prevent animal
loss during initial treatment.
In contrast to bortezomib, YM155 (2 mg/kg, subcutaneous 5 times weekly)
markedly delayed MKL-1 xenograft growth and significantly prolonged survival
compared to either saline or bortezomib (p<0.0001, log-rank test, Figures 44B-C). This
YM155 treatment regimen is the standard dosing for mouse xenograft experiments
based on pharmacokinetic and treatment response studies of Nakahara et al. on six
different human cancer xenografts (prostate, bladder, melanoma, breast and lung
cancer) in mice and >100 human tumor cell lines (229, 389, 400). While 66.7-74.2% of
bortezomib or saline-treated mice reached the euthanasia endpoint during the three-
week treatment period, none of the YM155-treated mice reached this endpoint during
treatment. Partial tumor regression occurred among some YM155-treated mice but all

182
tumors resumed growth once YM155 was stopped, indicating that a single 3-week
treatment course was insufficient for tumor eradication (Figure 44B). For the majority of
the mice, MKL-1 tumor volumes were unchanged or showed delayed growth during
YM155 treatment, suggesting this drug may be cytostatic rather than cytocidal for MKL-
1 xenografts (Figure 44C). YM155 was well-tolerated and no adverse effects or acute
toxicities were noted. In smaller cohorts of mice bearing MS-1 (MCV-positive) and UISO
(MCV-negative) cell xenografts, final tumor volumes for YM155-treated mice were 43-
55% (median) of saline-treated control mice at the end of the three-week treatment
period (Figure 44D).

183
Figure 44. YM155 inhibits growth of MKL-1 xenografts in NSG mice (A) MKL-1 xenograft tumors stained with hematoxylin and eosin, MCV LT (CM2B4 antibody) and CK20 (magnification 40X). (B) MKL-1 xenograft survival curves after drug treatment. Mice were subcutaneously injected with 20 million MKL-1 cells and assigned to a three-week drug treatment after tumors became palpable (see text). No significant difference was found between saline and bortezomib treatment. Tumor progression was significantly delayed by YM155, with none of the YM155-treated mice dying during treatment (up to day 19) compared to 23 of 31 (74%) saline and 14 of 21 (67%) bortezomib-treated mice. Tumor progression recurred for all YM155-treated mice once treatment was stopped. (C) Piecewise linear hierarchical Bayesian model for tumor volumes in treated mice (391) (see supplemental appendix for details). Colored lines show estimated central population tumor volumes with shaded regions representing 95% credible intervals. Actual tumor volumes (grey lines) for each mouse are shown for comparison. YM155 treatment retards tumor growth compared to saline or bortezomib treatment. (D) Table showing day of termination and tumor volumes for MS-1 and UISO xenograft mice treated with YM155 or saline.
A
D
H&E
MCV LT
CK20
B C
Figure 5

184
B.4 DISCUSSION
We show here that discovery of a viral cause for most MCC in February 2008, followed
by the description of the virus’ oncogenes one year later, has now been used to
rationally identify a survivin inhibitor that may have activity against this cancer. Our
library screen of 1360 drugs, including the entire NCI Approved Oncology Drug Set II,
confirmed that MCC is very chemoresistant and identified only one drug (bortezomib)
that was highly active in vitro. Bortezomib however was not active in vivo against MCC
xenografts. DTS, a quantitative cDNA deep sequencing method, not only identified MCV
as a new human polyomavirus in MCC but also helped to uncover cell signaling
pathways that are potential targets for MCV-positive MCC treatment.
Survivin, an inhibitor of apoptosis protein (IAP) family member (401), contributes
to chemoresistance of melanoma (402) and is overexpressed in many cancers including
MCC (403). It increases during non-neoplastic JC polyomavirus infection (404), and by
SV40 LT through an E2F-regulated mechanism (405, 406). Our MCV T antigen knock-
down and expression experiments confirm survivin to be activated by MCV LT’s
sequestration of RB-family transcription repressors. Survivin has pleiotropic activities in
both preventing apoptosis and activating cell cycle entry (407). Our findings are
consistent with retinoblastoma protein or other pocket proteins repressing survivin
expression in primary cells (405), which can be relieved when MCV LT is expressed.
MCV LT did not further increase survivin levels for transformed cells having the
retinoblastoma protein pathway signaling blocked by mutation or E1A. MCV activation

185
of survivin through retinoblastoma protein targeting may typically serve to promote virus
replication but is aberrantly activated during MCV-tumorigenesis (10).
YM155 is highly cytotoxic in vitro to MCV-positive MCC cells, causing these cells
to initiate a necroptotic cell death routine. Loss of survivin is commonly linked to mitotic
catastrophe in cancer cells (408); however, we did not find this to significantly contribute
to MCC cell death. There was no distinct G1 or G2-M phase accumulation of cells
during YM155 treatment and irreversible commitment to cell death occurs too quickly for
most MCC cells to have an opportunity to transit the cell cycle. YM155 does increase
LC3-II, implicating autophagy in YM155-induced cell death, but may reflect a
consequence rather than a cause for cell death (409). Intriguingly, a very similar cell
death phenotype occurs when T antigens are knocked down in MCV-positive MCC cells
(388), whereas we found that knock-down of survivin alone causes apoptosis rather
than necroptosis. As with YM155 treatment, this effect was predominant in an MCV-
positive but not MCV-negative MCC cell line. Since knock-down of survivin causes
apoptosis rather than necroptosis, we cannot exclude the possibility that YM155 targets
other molecules in addition to survivin, or that different levels of survivin inhibition by
YM155 and survivin knock-down result in different programmed cell death responses.
There are several important caveats to our current study. While YM155 was
highly active in vitro, it was only cytostatic—not cytotoxic—in most mouse xenografts.
Once YM155 treatment was stopped, tumors re-emerged in all of the treated mice.
Either prolonged YM155 treatment or combined use with other drugs (e.g., bortezomib,
topoisomerase inhibitors) may more effectively control MCC. YM155 was relatively
nontoxic in our study, making it potentially more suitable for prolonged or combined

186
therapy. Practical limitations prevented us from extensively measuring YM155 activity
on a variety of MCC cell line xenografts and we cannot exclude the possibility of
resistance among other MCC. But it is encouraging that YM155 reduced tumor masses
in two additional MCC xenografts, including one from a MCV-negative tumor. Finally,
MCV sT (also expressed in MCC cells) increases cap-dependent protein translation
(129), and could contribute to YM155 resistance through a transcription-independent
mechanism of survivin induction (410).
DTS (54) is a useful method to discover (55) or exclude (54) viruses being
present in human cancers. In this study, we show that DTS is also useful in measuring
cellular gene expression by demonstrating that BIRC5 transcription is activated in MCV-
positive MCC. If carefully performed and rigorously analyzed, DTS data yields useful
information even when no cancer viruses are discovered (54). Prior to discovery of
MCV, few clues were available about the molecular causes for MCC (411). Now that
MCV has been shown to be central to most MCC, rational targeting of survivin and other
cellular pathways perturbed by MCV may lead to discovery of additional treatments that
may be more effective and less toxic than current therapies.

187
APPENDIX C
RESPONSE OF MERKEL CELL POLYOMAVIRUS-POSITIVE MERKEL CELL
CARCINOMA XENOGRAFTS TO YM155
The work described in Appendix C has been submitted to Cancer Research in July
2013
with authors Lindsay R. Dresang, Anna Guastafierro, Reety Arora, Daniel
Normolle, Yuan Chang, and Patrick S. Moore
L.R. Dresang performed immunohistochemistry. L.R. Dresang and R. Arora performed
CellTiter-Glo studies. L.R. Dresang, A. Guastafierro, and R. Arora performed mouse
xenograft experiments. D. Normolle performed the statistical analyses of survival and
tumor volume data. All authors interpreted the data and wrote the manuscript.

188
C.1 INTRODUCTION
We confirm here that YM155, a survivin suppressor, is cytotoxic to MCV-positive MCC
cells in vitro at nanomolar levels. Mouse survival was significantly improved for NOD-
Scid-Gamma mice treated with YM155 in a dose and duration dependent manner for 3
of 4 MCV-positive MCC xenografts. One MCV-positive MCC xenograft (MS-1) failed to
significantly respond to YM155, which corresponds with in vitro dose-response activity.
Combination treatment of YM155 with other chemotherapeutics resulted in additive but
not synergistic cell killing of MCC cell lines in vitro. These results suggest that survivin
targeting is a promising therapeutic approach for most but not all MCV-positive MCCs.

189
C.2 MATERIALS AND METHODS
C.2.1 Cell Lines and Tissue Culture
The MCC cell lines MKL-1 (412), MS-1 (265), MKL-2 (234), and WaGa (gift of J.
Becker) (297) were cultured in RPMI 1640 with 10% fetal calf serum, and primary
human fibroblasts, BJ (American Type Culture Collection), were cultured in Dulbecco’s
modified Eagle’s medium with 10% fetal calf serum, as described previously (232, 265).
All cells were maintained at 37°C in humidified air containing 5% CO2.
C.2.2 NOD-Scid-Gamma Mice
The animals used for these studies are as described previously (232). NSG female
mice (413), strain #005557 (Jackson Laboratory), were received at 6-weeks of age and
maintained in a specific, pathogen-free environment at the Hillman Cancer Center
Mouse Facility, University of Pittsburgh, for at least one week prior to cell line injection.
All animal studies were performed with approval from the Animal Ethics Committee of
the University of Pittsburgh (Institutional Animal Care and Use Committee Protocol
#12020149).

190
C.2.3 Xenografts and Treatment
MCC xenografts were generated as previously described (Appendix B (232)). MCC cell
lines were optimally grown at >90% cell viability as determined by trypan blue dye
exclusion. MCC cells were washed with phosphate-buffered saline (PBS) and
resuspended at 2x10⁷cells per 100uL in PBS and injected into the right flanks of NSG
mice. Treatment regimens began as individual animals developed palpable tumors
(~2mm x 2mm), as outlined in Figure 45. All treatments followed a five day on, two day
off regimen of daily intraperitoneal (I.P.) injections. Three-week treatments ended on
day 19 of I.P. injection. Continuous treatments were carried out until the animals
reached the experimental endpoint. The experimental endpoint was evaluated by tumor
burden, with at least one measurable diameter of 20mm, or by the presence of multiple
signs of distress (respiratory rate elevation, wheezing, hypothermia, behavioral
changes, inactivity, >20% weight loss, vertebral protrusion, or ruffled fur). Saline-
treated mice were injected with a fixed volume of 100uL 0.9% Sodium Chloride USP
Normal Saline (Nurse Assist) per injection. YM155 was administered at either 2mg/kg,
4mg/kg, or 6mg/kg, resuspended in 0.9% Sodium Chloride USP Normal Saline and filter
sterilized. Tumor volumes were measured three times weekly and at the time of
euthanization according to the following formula: width2 x (length ÷ 2). Mouse weights
were monitored at least once per week throughout the experiment. Observations,
including weight measurements, were recorded daily on an individual mouse basis if
signs of distress were observed.

191
C.2.4 Statistical Analysis of Survival and Tumor Volume Data
Mixed-effects ANOVA was used for batch-adjusted times to 50% survival per cell line
and treatment group, with 95% confidence intervals. Pairwise comparisons between
treatments or between cell lines were estimated (with 95% confidence intervals) by
linear contrasts on the estimated ANOVA parameters . Between-batch variation was
taken into account for all analyses. Tumor volumes were assessed for differential
growth across treatment groups using an extension to the piecewise linear hierarchical
Bayesian model that accounts for batch effects (391). All analyses were performed
using SAS (SAS Institute), R (R Development Core Team) and JAGS software. Average
tumor growth kinetics with 95% confidence intervals were estimated as described
previously (232). Briefly, a delay in tumor growth (or re-growth) is estimated by a hinge
point, called nadir, where the volume at nadir (α) is expressed as a log2(volume) and the
time at nadir (ρ) is expressed in days. An initial decrease in growth is estimated as β1,
where log2(volume) = α+β1*(ρ-day). Final increase in tumor growth is estimated as β2,
where log2(volume) = α+β2*(day-ρ). These four parameters are estimated for each
animal and for each treatment and cell line.
C.2.5 Immunohistochemistry
Immunohistochemistry was performed as described previously (57). Tumor and/or
normal mouse tissue was cut to size for optimal formalin infusion (10% neutral-buffered
solution; Sigma) for at least 24hrs prior to paraffin embedding. Paraffin embedding,
preparation of unstained slides, and H&E processing was performed by Research

192
Histology Services at the Thomas E. Starzl Transplantation Institute core facilities at the
University of Pittsburgh. Unstained slides were baked at 60°C for 1hr under vacuum.
Deparaffinization continued with xylene treatment (2-3 incubations, 10min). Slides were
gradually rehydrated moving from 100% ethanol (2 incubations, 10min), to 95% ethanol
(2 incubations, 10min), to 80% ethanol with agitation, to 70% ethanol with agitation, and
finally moving to deionized water. Slides were treated with 3% hydrogen peroxide to
quench endogenous peroxidases, rinsed several times with deionized water, and then
placed in 1mM EDTA pH8.0 for heat-induced epitope retrieval (125°C for 3min and 15s,
followed by 90°C for 15s). After 45-60min of gradual cooling, slides were briefly rinsed
several times with deionized water, rinsed with TBS (68mM NaCl, 10mM Tris pH7.5),
treated with Protein Block (DAKO) for 5min, and then incubated with CM2B4 (57)
primary antibody (diluted 0.5-1.5ug/mL) for 30min (PBS pH7.4, 1% BSA, 0.1% gelatin,
0.5% Triton-X-100, 0.05% sodium azide). Slides were washed 3 times with agitation in
TBS. Secondary mouse-HRP antibody (Mouse Envision Polymer; DAKO) was
incubated on the slides for 30min. Slides were again washed 3 times with agitation in
TBS. Colorimetric detection with 3,3-diaminobenzidine and chromagen was quenched
with deionized water. Slides were counter-stained with Mayer’s hemotoxylin, Lillie’s
modification (DAKO), rinsed several times in tap water, blued in 1% lithium carbonate,
rinsed several times in tap water, and then dehydrated through 95% ethanol (twice with
agitation) to 100% ethanol (twice with agitation). Slides were incubated twice in xylene
for 5min and coverslips were adhered using Permount (Fisher Scientific).

193
C.2.6 Chemotherapeutic Compounds
YM155 was purchased from Active Biochemicals Ltd. Docetaxel, carboplatin,
etoposide, topotecan HCl, and bortezomib were provided by the NCI/DTP Open
Chemical Repository (http://dtp.cancer.gov).
C.2.7 Dose-Response Studies
Dose-response studies were performed as previously described (232). Briefly, 6000
cells were seeded per well in 384 well plates at a volume of 50uL and allowed to
incubate overnight at 37°C in a 5% CO2 humidified chamber. A log range of drug
concentrations from 10-4 to 10-10 was resuspended in culture medium (with or without a
fixed amount of YM155) at 3X concentration and then added at a volume of 25uL. After
48 hours further incubation in a humidified chamber, cells were treated with 25uL
CellTiter-Glo Luminescent reagent (Promega) and cell viability was measured as per
manufacturer’s instructions. No-drug control wells served as normalization controls per
cell line. Each concentration per cell line was plated in triplicate. Three or more
biological replicates per cell line were tested with YM155 alone, two or more biological
replicates were tested with all other single drugs, and combination studies were tested
independently with either 1nM YM155 or 3nM YM155, with representative analysis at
3nM YM155 combination shown. Empty wells were used to separate different cell lines
and treatment groups to reduce error from luminescent bleed-over. EC50 values were
calculated from a four-parameter logistic equation fit to the surviving proportions of cells
per dose.

194
C.3 RESULTS
C.3.1 MCV-positive MCC cell line xenograft model experimental outline
NSG mice were injected with MCV-positive MCC cell lines (Figure 45A) and were
monitored for tumor growth, weight, and overall health. Once palpable tumors were
detected (Figure 45B), NSG mice were intraperitoneally (I.P.) injected (once per day for
five days, followed by two days of rest) with either saline treatment, 2mg/kg YM155
treatment for three weeks, or were continuously treated with YM155 (2mg/kg or 4mg/kg)
until the tumor attained a diameter of 20mm or the mouse exhibited multiple signs of
distress (Figure 45C).
Figure 45. MCC mouse xenograft treatment groups and experimental outline (A) NSG mice were subcutaneously injected in the right flank with 2x10⁷ MCV-positive, MCC cells (MKL-1, MS-1, WaGa, or MKL-2). (B) NSG mice were monitored for palpable tumors (~2mm x 2mm) to determine start of treatment. (C) Mice with palpable tumors were randomly assigned to either saline treatment, YM155 treatment for 3-weeks at 2mg/kg, YM155 continuous treatment at 2mg/kg, or YM155 continuous treatment at 4mg/kg. Each week of treatment consisted of a single intraperitoneal injection per day for 5 days, followed by 2 days of rest.

195
YM155 at 6mg/kg was tested in two mice, but both mice had >20% weight loss
and additional signs of distress (ruffled fur, inactivity, and behavioral changes) within the
first week of treatment and were euthanized (as per Institutional Animal Care and Use
Committee protocol #12020149). Mice receiving saline treatment or YM155 treatment
at 2mg/kg do not lose weight (Figure 46A and 46B, respectively) or show signs of
distress, whereas mice receiving YM155 at 4mg/kg lose weight (Figure 46C) and
display minimal signs of distress (only ruffled fur, normal behavior). This toxicity
dissipates after the first 1-2 weeks of treatment (Figure 46C). Thus, 4mg/kg YM155 is
the maximum tolerated dose in NSG mice when administered by single daily I.P.
injection.
Figure 46. Mouse weights on saline and YM155 treatment groups Average mouse weights with standard deviations are reported according to treatment regimen, where weights were normalized to day zero of treatment (100%): (A) mouse weights on saline, continuous-treatment (green line); (B) mouse weights on YM155, continuous-treatment (purple line); and (C) mouse weights on YM155 double-dose, continuous-treatment (orange line). Mouse weights were adjusted to remove the weight of tumors prior to normalization. Weights from mice with significant liver metastases were not included as metastatic-tumor weights could not be determined during the course of treatment.

196
C.3.2 Survival of mice with MCC xenografts is prolonged by increasing YM155
duration of treatment, as well as by increasing the dosage of YM155, in a cell line
dependent manner
Estimated mean survival times with 95% confidence intervals are presented in Figure
47A according to treatment group and cell line. Batch variations from independent
replicates per treatment group and cell line were taken into account for the reported
statistical analyses. Figure 47B shows a Kaplan-Meier survival curve for MKL-1
xenografts treated for a single 3-week course (2mg/kg YM155) or continuously until
sacrifice (data from this figure include mice treated in preliminary studies, Appendix B
(232)). Extending the duration of YM155 treatment prolongs survival (relative to saline
or 3-week treatment, P<0.0001; Figure 47B), which is prolonged further by doubling the
YM155 dose to 4mg/kg (relative to all treatment arms, P<0.0001; Figure 47B). The
EC50 values for YM155 in vitro range from 1.3nM to 12nM for different MCV-positive
MCC cell lines (232); MKL-1 and MS-1 are at opposite ends of this range, respectively.
MS-1 was tested in mice to assess the degree of response to YM155 in vivo. Mice
were treated with either saline, 2mg/kg YM155 continuously, or 4mg/kg YM155
continuously. In contrast to MKL-1, Figure 47C shows that MS-1 does not significantly
respond to YM155 treatment in vivo, despite extended duration of treatment or
increased dosage. This is in contrast to two other MCV-positive MCC cell lines, WaGa
and MKL-2 (Figures 47D-E). Both WaGa and MKL-2 xenografts responded to YM155
(4mg/kg) relative to saline treatment (P=0.0034 and P<0.0001, respectively; Figure
47D-E).

197
Figure 47. Survival of various MCC xenograft models on different treatments (A) Estimated survival means and 95% confidence intervals are reported along compressed survival summaries per cell line and treatment arm, where open circles correspond survival of individual mice. (B) Mice with MKL-1 xenografts exhibit significantly prolonged survival (****P < 0.0001) on any of the three YM155 treatment groups (3-weeks at 2mg/kg = red; continuous treatment at 2mg/kg = purple; continuous treatment at 4mg/kg = orange) relative to saline treatment (green). Increasing the duration of YM155 treatment from 3-weeks to continuous treatment at the 2mg/kg dose significantly prolongs survival (****P < 0.0001). Increasing the dose of YM155 from 2mg/kg to 4mg/kg on continuous treatment significantly prolongs survival (****P < 0.0001). (C) Mice with MS-1 xenografts do not exhibit prolonged survival with YM155 continuous treatment (either at 2mg/kg or 4mg/kg) relative to saline treatment (NS = not significant). One mouse on saline treatment spontaneously regressed for over 5-weeks and was euthanized early (as indicated by x). (D) Mice with WaGa xenografts exhibit significantly prolonged survival (**P = 0.0034) with continuous YM155 treatment at 4mg/kg relative to saline treatment. (E) Mice with MKL-2 xenografts exhibit significantly prolonged survival (****P < 0.0001) with continuous YM155 treatment at 4mg/kg relative to saline treatment. Two mice did not reach the final 20mm tumor dimension by day 105 and were euthanized early (as indicated by ##).
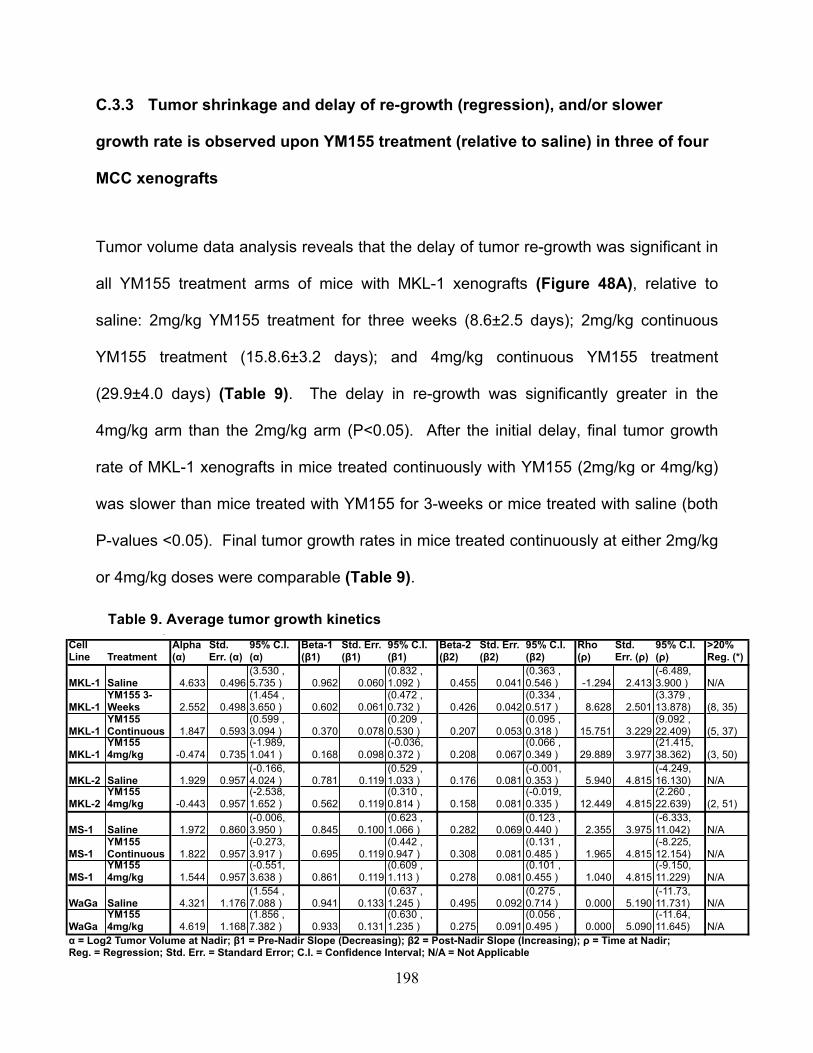
198
C.3.3 Tumor shrinkage and delay of re-growth (regression), and/or slower
growth rate is observed upon YM155 treatment (relative to saline) in three of four
MCC xenografts
Tumor volume data analysis reveals that the delay of tumor re-growth was significant in
all YM155 treatment arms of mice with MKL-1 xenografts (Figure 48A), relative to
saline: 2mg/kg YM155 treatment for three weeks (8.6±2.5 days); 2mg/kg continuous
YM155 treatment (15.8.6±3.2 days); and 4mg/kg continuous YM155 treatment
(29.9±4.0 days) (Table 9). The delay in re-growth was significantly greater in the
4mg/kg arm than the 2mg/kg arm (P<0.05). After the initial delay, final tumor growth
rate of MKL-1 xenografts in mice treated continuously with YM155 (2mg/kg or 4mg/kg)
was slower than mice treated with YM155 for 3-weeks or mice treated with saline (both
P-values <0.05). Final tumor growth rates in mice treated continuously at either 2mg/kg
or 4mg/kg doses were comparable (Table 9).
Cell Line Treatment
Alpha (!)
Std. Err. (!)
95% C.I. (!)
Beta-1 ("1)
Std. Err. ("1)
95% C.I. ("1)
Beta-2 ("2)
Std. Err. ("2)
95% C.I. ("2)
Rho (#)
Std. Err. (#)
95% C.I. (#)
>20% Reg. (*)
MKL-1 Saline 4.633 0.496(3.530 , 5.735 ) 0.962 0.060
(0.832 , 1.092 ) 0.455 0.041
(0.363 , 0.546 ) -1.294 2.413
(-6.489, 3.900 ) N/A
MKL-1YM155 3-Weeks 2.552 0.498
(1.454 , 3.650 ) 0.602 0.061
(0.472 , 0.732 ) 0.426 0.042
(0.334 , 0.517 ) 8.628 2.501
(3.379 , 13.878) (8, 35)
MKL-1YM155 Continuous 1.847 0.593
(0.599 , 3.094 ) 0.370 0.078
(0.209 , 0.530 ) 0.207 0.053
(0.095 , 0.318 ) 15.751 3.229
(9.092 , 22.409) (5, 37)
MKL-1YM155 4mg/kg -0.474 0.735
(-1.989, 1.041 ) 0.168 0.098
(-0.036, 0.372 ) 0.208 0.067
(0.066 , 0.349 ) 29.889 3.977
(21.415, 38.362) (3, 50)
MKL-2 Saline 1.929 0.957(-0.166, 4.024 ) 0.781 0.119
(0.529 , 1.033 ) 0.176 0.081
(-0.001, 0.353 ) 5.940 4.815
(-4.249, 16.130) N/A
MKL-2YM155 4mg/kg -0.443 0.957
(-2.538, 1.652 ) 0.562 0.119
(0.310 , 0.814 ) 0.158 0.081
(-0.019, 0.335 ) 12.449 4.815
(2.260 , 22.639) (2, 51)
MS-1 Saline 1.972 0.860(-0.006, 3.950 ) 0.845 0.100
(0.623 , 1.066 ) 0.282 0.069
(0.123 , 0.440 ) 2.355 3.975
(-6.333, 11.042) N/A
MS-1YM155 Continuous 1.822 0.957
(-0.273, 3.917 ) 0.695 0.119
(0.442 , 0.947 ) 0.308 0.081
(0.131 , 0.485 ) 1.965 4.815
(-8.225, 12.154) N/A
MS-1YM155 4mg/kg 1.544 0.957
(-0.551, 3.638 ) 0.861 0.119
(0.609 , 1.113 ) 0.278 0.081
(0.101 , 0.455 ) 1.040 4.815
(-9.150, 11.229) N/A
WaGa Saline 4.321 1.176(1.554 , 7.088 ) 0.941 0.133
(0.637 , 1.245 ) 0.495 0.092
(0.275 , 0.714 ) 0.000 5.190
(-11.73, 11.731) N/A
WaGaYM155 4mg/kg 4.619 1.168
(1.856 , 7.382 ) 0.933 0.131
(0.630 , 1.235 ) 0.275 0.091
(0.056 , 0.495 ) 0.000 5.090
(-11.64, 11.645) N/A
! = Log2 Tumor Volume at Nadir; "1 = Pre-Nadir Slope (Decreasing); "2 = Post-Nadir Slope (Increasing); # = Time at Nadir;Reg. = Regression; Std. Err. = Standard Error; C.I. = Confidence Interval; N/A = Not Applicable
Table 9: Average Tumor Growth KineticsTable 9. Average tumor growth kinetics

199
Figure 48. Tumor volume response to YM155 is dose, duration, and cell line dependent Tumor volumes (mm3) are reported on a Log2 scale according to treatment group. Non-palpable (NP) tumors are indicated at baseline corresponding to tumor regression. (A) Tumor volumes of MKL-1 xenografts undergo an initial regression period with YM155 treatment where >20% of mice lack palpable tumors (as indicated by *), which is extended with increased dose and duration of YM155 treatment. Overall tumor growth rate is reduced with increased YM155 duration and dosage. A total of 9 mice were euthanized before a diameter of 20mm was measured on the primary tumor due to distress associated with liver metastasis (as indicated by o). (B) Tumor volumes of MS-1 xenografts are unaffected by YM155 treatment. A spontaneous regression was observed on saline treatment (as indicated by x). (C) Tumor volumes of WaGa xenografts do not undergo an initial regression, but have a reduced growth rate. (D) Tumor volumes of MKL-2 xenografts undergo an initial regression period with YM155 treatment where >20% of mice lack palpable tumors (as indicated by *). Overall tumor growth rate is reduced on YM155 treatment relative to saline treatment. Two mice did not reach the final 20mm tumor dimension by day 105 (as indicated by #).
There was no shrinkage in tumor volume, delay of tumor re-growth, or reduction
in growth rate observed in mice with MS-1 xenografts comparing saline treatment to

200
YM155 treatment at either 2mg/kg or 4mg/kg (Figure 48B and Table 8). WaGa
xenografts in mice treated continuously with 4mg/kg YM155 grew slower than mice
treated with saline (P<0.05), but there was no evidence of initial tumor shrinkage or
delay of re-growth in these mice (Figure 48C and Table 8). There was evidence of
initial tumor shrinkage in YM155-treated mice with MKL-1 (Figure 48A) and MKL-2
(Figure 48D) xenografts (all P-values <0.05), but the absolute amount of shrinkage was
small (Table 8). The delay of tumor re-growth was significantly longer in mice with
MKL-1 xenografts than in mice with MKL-2 xenografts (P<0.05); tumor shrinkage and
delayed tumor re-growth correlate with a regression period in which >20% of mice no
longer had palpable tumors (Table 6, Figure 48A and D, mared by asterisks).
However, all mice were eventually euthanized due to progressive disease. Thus, while
YM155 continuous treatment at 4mg/kg prolongs survival in NSG mice with three of the
four MCC xenografts, this treatment regimen does not eradicate tumor cells.
C.3.4 MCV-positive MCC xenograft mouse models develop metastases at
different locations in a cell line dependent manner
MKL-1, MS-1, and WaGa cell lines are each derived from metastatic lesions (265, 276,
412); the site of MKL-2 derivation is unknown. Common sites of metastasis include
skin, lymph nodes, liver, lung, bone, and brain (reviewed by Eng et al. (414)). Autopsy
was performed on each mouse reaching experimental endpoint to assess the metastatic
capability of each cell line in our mouse xenograft models. Mice with MKL-1, MS-1, or
MKL-2 xenografts developed at least one or more metastases. LT-staining of primary
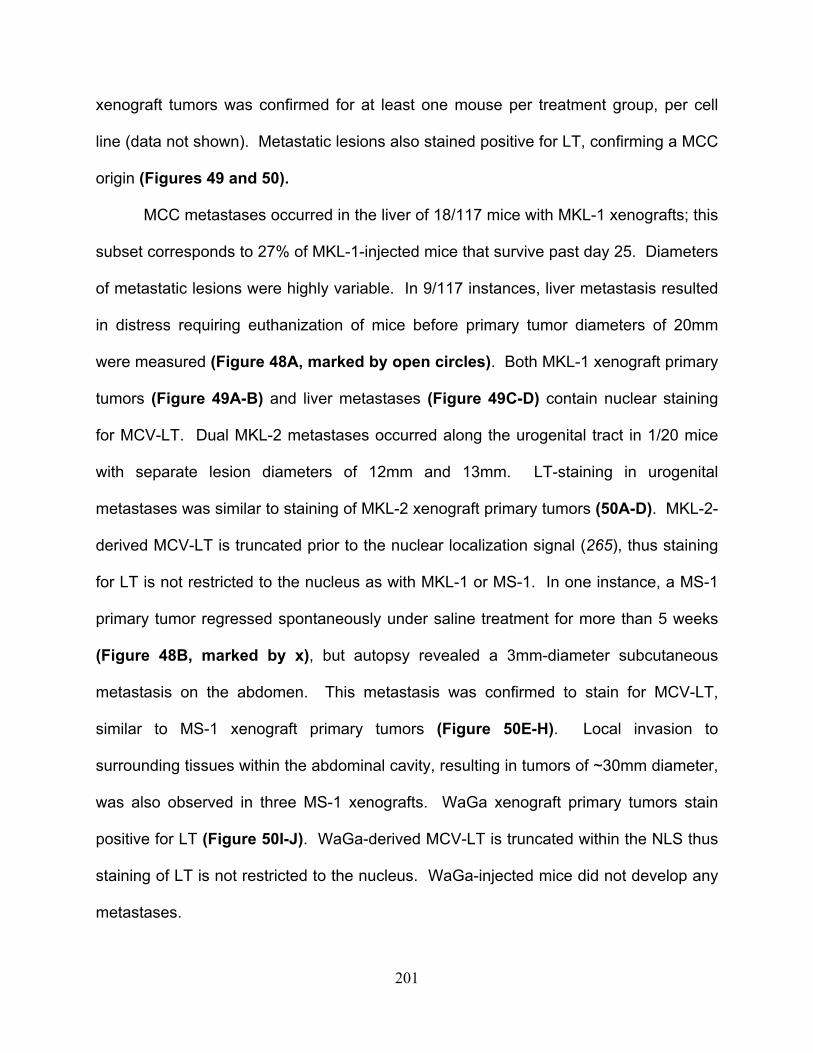
201
xenograft tumors was confirmed for at least one mouse per treatment group, per cell
line (data not shown). Metastatic lesions also stained positive for LT, confirming a MCC
origin (Figures 49 and 50).
MCC metastases occurred in the liver of 18/117 mice with MKL-1 xenografts; this
subset corresponds to 27% of MKL-1-injected mice that survive past day 25. Diameters
of metastatic lesions were highly variable. In 9/117 instances, liver metastasis resulted
in distress requiring euthanization of mice before primary tumor diameters of 20mm
were measured (Figure 48A, marked by open circles). Both MKL-1 xenograft primary
tumors (Figure 49A-B) and liver metastases (Figure 49C-D) contain nuclear staining
for MCV-LT. Dual MKL-2 metastases occurred along the urogenital tract in 1/20 mice
with separate lesion diameters of 12mm and 13mm. LT-staining in urogenital
metastases was similar to staining of MKL-2 xenograft primary tumors (50A-D). MKL-2-
derived MCV-LT is truncated prior to the nuclear localization signal (265), thus staining
for LT is not restricted to the nucleus as with MKL-1 or MS-1. In one instance, a MS-1
primary tumor regressed spontaneously under saline treatment for more than 5 weeks
(Figure 48B, marked by x), but autopsy revealed a 3mm-diameter subcutaneous
metastasis on the abdomen. This metastasis was confirmed to stain for MCV-LT,
similar to MS-1 xenograft primary tumors (Figure 50E-H). Local invasion to
surrounding tissues within the abdominal cavity, resulting in tumors of ~30mm diameter,
was also observed in three MS-1 xenografts. WaGa xenograft primary tumors stain
positive for LT (Figure 50I-J). WaGa-derived MCV-LT is truncated within the NLS thus
staining of LT is not restricted to the nucleus. WaGa-injected mice did not develop any
metastases.
202
Figure 49. Immunohistochemistry of MCV LT in a MKL-1 xenograft tumor and liver metastasis Shown are paired hemotoxylin & eosin (H&E) stained slides and adjacent sections stained with CM2B4, the MCV-LT antibody (LT-IHC), in mice with MKL-1 xenografts: (A) MKL-1 xenograft primary tumor, H&E; (B) MKL-1 xenograft primary tumor, LT-IHC; (C) MKL-1 xenograft liver metastasis, H&E; and (D) MKL-1 xenograft liver metastasis, LT-IHC. MKL-1 cells contains nuclear staining of LT, consistent with an intact nuclear localization signal (NLS). Original magnification = 200X; insets = 600X.

203
Figure 50. Immunohistochemistry of MCV LT in various MCC xenograft tumors and metastases Shown are paired hemotoxylin & eosin (H&E) stained slides and adjacent sections stained with CM2B4, the MCV-LT antibody (LT-IHC), in mice with MCC xenografts: (A) MKL-2 xenograft primary tumor, H&E; (B) MKL-2 xenograft primary tumor, LT-IHC; (C) MKL-2 xenograft urogenital metastasis, H&E; (D) MKL-2 xenograft urogenital metastasis, LT-IHC; (E) MS-1 xenograft primary tumor, H&E; (F) MS-1 xenograft primary tumor, LT-IHC; (G) MS-1 xenograft subcutaneous metastasis, H&E; (H) MS-1 xenograft subcutaneous metastasis, LT-IHC; I) WaGa xenograft primary tumor, H&E; and (J) WaGa xenograft primary tumor, LT-IHC. MS-1 cells contain nuclear staining of LT, consistent with an intact nuclear localization signal (NLS). Both MKL-2 and WaGa lack an intact NLS, thus LT staining is not restricted to the nucleus. Original magnification = 200X; insets = 600X.

204
C.3.5 Combination drug treatments with YM155 act additively, but not
synergistically, to reduce MCC cell line viability in vitro
YM155 was tested alone (Figure 51A) and in combination with other chemotherapeutic
agents to identify a treatment strategy that may kill MCC cells synergistically.
Bortezomib, docetaxel, carboplatin, etoposide, and topotecan were tested alone or in
combination with a fixed concentration of YM155 (Figure 51B-I). Bortezomib is a
proteasomal inhibitor that has been shown previously to efficiently kill MCC cells at sub-
micromolar concentrations (232). However, primary human fibroblasts, BJ, are also
efficiently killed by bortezomib treatment (Figure 51B-C). Docetaxel was previously
tested in melanoma xenografts with YM155 to induce cancer-specific mitotic
catastrophe and cell death (415). Docetaxel treatment does not decrease cell viability
of MCC cell lines (Figure 51D-E). Carboplatin, a platinum-based chemotherapeutic,
also does not decrease cell viability of MCC cell lines (data not shown). Etoposide, a
topoisomerase type II inhibitor, with or without carboplatin (data not shown), decreases
cell viability of MCC cell lines at micromolar concentrations (Figure 51F-G). Topotecan,
a topoisomerase type I inhibitor, decreases cell viability at sub-micromolar
concentrations (Figure 51H-I). However, none of these chemotherapeutic agents
decrease cell viability of MCC cells in a synergistic manner when combined with
YM155—the effect is merely additive.

205
Figure 51. Various chemotherapeutics induce MCC cell death in an additive, but not synergistic manner, when combined with YM155 in vitro CellTiter-GLO assays were performed using multiple MCC cell lines as well as the control primary human fibroblast, BJ. Corresponding EC50 curves are shown for the following chemotherapeutic agents and drug combinations: (A) YM155; (B) Bortezomib; (C) Bortezomib + 3nM YM155; (D) Docetaxel; (E) Docetaxel + 3nM YM155; (F) Etoposide; (G) Etoposide + 3nM YM155 (H) Topotecan; and (I) Topotecan + 3nM YM155.

206
C.4 DISCUSSION
In this study we assessed the sensitivity of four MCV-positive MCCs to YM155. Three
of the four xenografts responded to YM155 treatment. YM155 efficacy is enhanced by
extending the duration of treatment as well as by increasing YM155 dosage. However,
the degree of YM155 efficacy is cell line dependent. Response to YM155 in vivo
reflects YM155 response in vitro (Figure 51A); WaGa and MKL-2 xenografts respond to
YM155 treatment intermediately to MKL-1 and MS-1 when assessing in vivo estimated
survival data between YM155 double-dose treatment and saline treatment and they also
have intermediate EC50 values determined from in vitro cell viability data (Figure 51A).
MKL-1 is the most sensitive to YM155 both in vivo and in vitro, whereas MS-1 is the
least sensitive to YM155 in vitro and does not respond to YM155 in vivo.
For MCC xenografts, regression, growth rate, and even metastatic escape are
highly cell line dependent. Liver metastasis was only observed with MKL-1 xenografts,
and metastasis was only observed after survival was significantly prolonged with YM155
treatment. While WaGa does not undergo regression or even tumor shrinkage upon
YM155 treatment, survival was significantly prolonged relative to saline treatment owing
to a reduced tumor growth rate. Why MCC xenografts stop responding to YM155
treatment and what determines overall response to YM155 for a given MCC cell line
remains unknown.
Previous studies using MCV-positive MCC cell lines identified bortezomib as a
potent in vitro chemotherapeutic, but not in vivo (232). Topoisomerase type I and type II

207
inhibitors were also shown to induce death of MCC cell lines (232). Although we again
verified in vitro efficacy of bortezomib, etoposide, and topotecan, none of these agents
act synergistically with YM155 treatment—the effect is only additive. However, this may
not exclude the possibility that combination therapy of topoisomerase inhibitors with
YM155 will prove beneficial in future studies.
YM155 administered by single daily I.P. injection has a maximum-tolerated dose
of 4mg/kg. No toxicity was observed at the 2mg/kg dose (Figure 47B). In the clinic
YM155 is administered by continuous intravenous (I.V.) injection and is tolerated up to
8mg/kg (416). YM155 has previously been shown to have a 50% clearance by 12
hours from a single injection (417), whereas continuous injection maintains YM155 in
the circulation for an extended period of time (416). Continuous injection also seems to
alleviate the degree of toxicity observed at higher doses of YM155 (400). Combining
these facts with the notion that YM155 was tested in our studies using severely
immunocompromised mice, we are optimistic that YM155 treatment will be met with
greater success in the clinic.

208
BIBLIOGRAPHY
1. R. T. Javier, J. S. Butel, The history of tumor virology. Cancer Res 68, 7693 (Oct 1, 2008).
2. P. K. Vogt, Peyton Rous: homage and appraisal. Faseb J 10, 1559 (Nov, 1996). 3. P. Rous, A Sarcoma of the Fowl Transmissible by an Agent Separable from the Tumor
Cells. J Exp Med 13, 397 (Apr 1, 1911). 4. L. Gross, A filterable agent, recovered from Ak leukemic extracts, causing salivary gland
carcinomas in C3H mice. Proc Soc Exp Biol Med 83, 414 (Jun, 1953). 5. L. Gross, Presence of leukemic agent in normal testes and ovaries of young mice of Ak
line. Acta Haematol 10, 18 (Jul, 1953). 6. M. A. Epstein, B. G. Achong, Y. M. Barr, Virus Particles in Cultured Lymphoblasts from
Burkitt's Lymphoma. Lancet 1, 702 (Mar 28, 1964). 7. Proceedings of the IARC Working Group on the Evaluation of Carcinogenic Risks to
Humans. Epstein-Barr Virus and Kaposi's Sarcoma Herpesvirus/Human Herpesvirus 8. Lyon, France, 17-24 June 1997. IARC Monogr Eval Carcinog Risks Hum 70, 1 (1997).
8. B. E. Griffin, Epstein-Barr virus (EBV) and human disease: facts, opinions and problems. Mutation research 462, 395 (Apr, 2000).
9. G. L. Kelly, A. B. Rickinson, Burkitt lymphoma: revisiting the pathogenesis of a virus-associated malignancy. Hematology Am Soc Hematol Educ Program, 277 (2007).
10. W. Henle, V. Diehl, G. Kohn, H. Zur Hausen, G. Henle, Herpes-type virus and chromosome marker in normal leukocytes after growth with irradiated Burkitt cells. Science 157, 1064 (Sep 1, 1967).
11. D. N. Fredericks, D. A. Relman, Sequence-based identification of microbial pathogens: a reconsideration of Koch's postulates. Clin Microbiol Rev 9, 18 (Jan, 1996).
12. A. B. Hill, The Environment and Disease: Association or Causation? Proc R Soc Med 58, 295 (May, 1965).
13. B. S. Blumberg, H. J. Alter, S. Visnich, A "New" Antigen in Leukemia Sera. Jama 191, 541 (Feb 15, 1965).
14. B. S. Blumberg, J. S. Friedlaender, A. Woodside, A. I. Sutnick, W. T. London, Hepatitis and Australia antigen: autosomal recessive inheritance of susceptibility to infection in humans. Proc Natl Acad Sci U S A 62, 1108 (Apr, 1969).
15. A. M. Prince, An antigen detected in the blood during the incubation period of serum hepatitis. Proc Natl Acad Sci U S A 60, 814 (Jul, 1968).
16. B. S. Blumberg et al., The relation of infection with the hepatitis B agent to primary hepatic carcinoma. Am J Pathol 81, 669 (Dec, 1975).

209
17. E. B. Buynak et al., Vaccine against human hepatitis B. 1976. Jama 276, 1793 (Dec 11, 1996).
18. M. R. Hilleman, Critical overview and outlook: pathogenesis, prevention, and treatment of hepatitis and hepatocarcinoma caused by hepatitis B virus. Vaccine 21, 4626 (Dec 1, 2003).
19. S. M. Feinstone, A. Z. Kapikian, R. H. Purceli, Hepatitis A: detection by immune electron microscopy of a viruslike antigen associated with acute illness. Science 182, 1026 (Dec 7, 1973).
20. A. Martin, S. M. Lemon, Hepatitis A virus: from discovery to vaccines. Hepatology 43, S164 (Feb, 2006).
21. C. Seeger, W. S. Mason, Hepatitis B virus biology. Microbiol Mol Biol Rev 64, 51 (Mar, 2000).
22. M. Seifer, M. Hohne, S. Schaefer, W. H. Gerlich, In vitro tumorigenicity of hepatitis B virus DNA and HBx protein. J Hepatol 13 Suppl 4, S61 (1991).
23. B. Bressac, M. Kew, J. Wands, M. Ozturk, Selective G to T mutations of p53 gene in hepatocellular carcinoma from southern Africa. Nature 350, 429 (Apr 4, 1991).
24. I. C. Hsu et al., Mutational hotspot in the p53 gene in human hepatocellular carcinomas. Nature 350, 427 (Apr 4, 1991).
25. Q. L. Choo et al., Isolation of a cDNA clone derived from a blood-borne non-A, non-B viral hepatitis genome. Science 244, 359 (Apr 21, 1989).
26. H. M. Temin, S. Mizutani, RNA-dependent DNA polymerase in virions of Rous sarcoma virus. Nature 226, 1211 (Jun 27, 1970).
27. D. Baltimore, RNA-dependent DNA polymerase in virions of RNA tumour viruses. Nature 226, 1209 (Jun 27, 1970).
28. B. J. Poiesz et al., Detection and isolation of type C retrovirus particles from fresh and cultured lymphocytes of a patient with cutaneous T-cell lymphoma. Proc Natl Acad Sci U S A 77, 7415 (Dec, 1980).
29. M. Popovic, G. Lange-Wantzin, P. S. Sarin, D. Mann, R. C. Gallo, Transformation of human umbilical cord blood T cells by human T-cell leukemia/lymphoma virus. Proc Natl Acad Sci U S A 80, 5402 (Sep, 1983).
30. M. Popovic et al., Isolation and transmission of human retrovirus (human t-cell leukemia virus). Science 219, 856 (Feb 18, 1983).
31. M. S. Reitz, Jr., B. J. Poiesz, F. W. Ruscetti, R. C. Gallo, Characterization and distribution of nucleic acid sequences of a novel type C retrovirus isolated from neoplastic human T lymphocytes. Proc Natl Acad Sci U S A 78, 1887 (Mar, 1981).
32. M. Robert-Guroff et al., Natural antibodies to human retrovirus HTLV in a cluster of Japanese patients with adult T cell leukemia. Science 215, 975 (Feb 19, 1982).
33. R. C. Gallo, History of the discoveries of the first human retroviruses: HTLV-1 and HTLV-2. Oncogene 24, 5926 (Sep 5, 2005).
34. Y. Hinuma et al., Adult T-cell leukemia: antigen in an ATL cell line and detection of antibodies to the antigen in human sera. Proc Natl Acad Sci U S A 78, 6476 (Oct, 1981).
35. M. Matsuoka, K. T. Jeang, Human T-cell leukaemia virus type 1 (HTLV-1) infectivity and cellular transformation. Nat Rev Cancer 7, 270 (Apr, 2007).
36. M. Matsuoka, K. T. Jeang, Human T-cell leukemia virus type 1 (HTLV-1) and leukemic transformation: viral infectivity, Tax, HBZ and therapy. Oncogene 30, 1379 (Mar 24, 2011).

210
37. M. Boshart et al., A new type of papillomavirus DNA, its presence in genital cancer biopsies and in cell lines derived from cervical cancer. Embo J 3, 1151 (May, 1984).
38. M. Durst, L. Gissmann, H. Ikenberg, H. zur Hausen, A papillomavirus DNA from a cervical carcinoma and its prevalence in cancer biopsy samples from different geographic regions. Proc Natl Acad Sci U S A 80, 3812 (Jun, 1983).
39. H. zur Hausen, Papillomaviruses and cancer: from basic studies to clinical application. Nat Rev Cancer 2, 342 (May, 2002).
40. A. Beby-Defaux, C. Plouzeau-Jayle, G. Agius, [Papillomaviruses under spotlight: the birth of a cancer vaccine]. Pathol Biol (Paris) 55, 313 (Sep, 2007).
41. D. R. Brown et al., The impact of quadrivalent human papillomavirus (HPV; types 6, 11, 16, and 18) L1 virus-like particle vaccine on infection and disease due to oncogenic nonvaccine HPV types in generally HPV-naive women aged 16-26 years. J Infect Dis 199, 926 (Apr 1, 2009).
42. H. zur Hausen, Papillomaviruses causing cancer: evasion from host-cell control in early events in carcinogenesis. J Natl Cancer Inst 92, 690 (May 3, 2000).
43. C. B. Woodman, S. I. Collins, L. S. Young, The natural history of cervical HPV infection: unresolved issues. Nature reviews. Cancer 7, 11 (Jan, 2007).
44. L. Cancian, A. Hansen, C. Boshoff, Cellular origin of Kaposi's sarcoma and Kaposi's sarcoma-associated herpesvirus-induced cell reprogramming. Trends in cell biology, (May 17, 2013).
45. E. Martro et al., Risk factors for human Herpesvirus 8 infection and AIDS-associated Kaposi's sarcoma among men who have sex with men in a European multicentre study. Int J Cancer 120, 1129 (Mar 1, 2007).
46. Y. Chang et al., Identification of herpesvirus-like DNA sequences in AIDS-associated Kaposi's sarcoma. Science 265, 1865 (1994).
47. P. S. Moore, Y. Chang, KSHV: forgotten but not gone. Blood 117, 6973 (Jun 30, 2011). 48. E. Cesarman, Y. Chang, P. S. Moore, J. W. Said, D. M. Knowles, Kaposi's sarcoma-
associated herpesvirus-like DNA sequences in AIDS-related body-cavity-based lymphomas. N Engl J Med 332, 1186 (May 4, 1995).
49. J. Soulier et al., Kaposi's sarcoma-associated herpesvirus-like DNA sequences in multicentric Castleman's disease. Blood 86, 1276 (Aug 15, 1995).
50. V. E. Gould, R. Moll, I. Moll, I. Lee, W. W. Franke, Neuroendocrine (Merkel) cells of the skin: hyperplasias, dysplasias, and neoplasms. Laboratory investigation; a journal of technical methods and pathology 52, 334 (Apr, 1985).
51. Z. Halata, M. Grim, K. I. Bauman, Friedrich Sigmund Merkel and his "Merkel cell", morphology, development, and physiology: review and new results. The anatomical record. Part A, Discoveries in molecular, cellular, and evolutionary biology 271, 225 (Mar, 2003).
52. E. A. Engels, M. Frisch, J. J. Goedert, R. J. Biggar, R. W. Miller, Merkel cell carcinoma and HIV infection. Lancet 359, 497 (Feb 9, 2002).
53. J. F. Buell et al., Immunosuppression and Merkel cell cancer. Transplantation proceedings 34, 1780 (Aug, 2002).
54. H. Feng et al., Human transcriptome subtraction by using short sequence tags to search for tumor viruses in conjunctival carcinoma. J. Virol. 81, 11332 (Oct, 2007).
55. H. Feng, M. Shuda, Y. Chang, P. S. Moore, Clonal integration of a polyomavirus in human Merkel cell carcinoma. Science 319, 1096 (Feb 22, 2008).

211
56. M. Shuda et al., T antigen mutations are a human tumor-specific signature for Merkel cell polyomavirus. Proc Natl Acad Sci U S A 105, 16272 (Oct 21, 2008).
57. M. Shuda et al., Human Merkel cell polyomavirus infection I. MCV T antigen expression in Merkel cell carcinoma, lymphoid tissues and lymphoid tumors. Int J Cancer 125, 1243 (Sep 15, 2009).
58. D. L. Poulin, J. A. DeCaprio, Is there a role for SV40 in human cancer? J Clin Oncol 24, 4356 (Sep 10, 2006).
59. S. E. Stewart, B. E. Eddy, N. Borgese, Neoplasms in mice inoculated with a tumor agent carried in tissue culture. J Natl Cancer Inst 20, 1223 (Jun, 1958).
60. S. E. Stewart, Neoplasms in mice inoculated with cell-free extracts or filtrates of leukemic mouse tissues. II. Leukemia in hybrid mice produced by cell-free filtrates. J Natl Cancer Inst 16, 41 (Aug, 1955).
61. S. E. Stewart, Neoplasms in mice inoculated with cell-free extracts or filtrates of leukemic mouse tissues. I. Neoplasms of the parotid and adrenal glands. J Natl Cancer Inst 15, 1391 (Apr, 1955).
62. B. E. Eddy, G. S. Borman, G. E. Grubbs, R. D. Young, Identification of the oncogenic substance in rhesus monkey kidney cell culture as simian virus 40. Virology 17, 65 (May, 1962).
63. B. H. Sweet, M. R. Hilleman, The vacuolating virus, S.V. 40. Proc Soc Exp Biol Med 105, 420 (Nov, 1960).
64. B. Kuska, SV40: working the bugs out of the polio vaccine. J Natl Cancer Inst 89, 283 (Feb 19, 1997).
65. N. Shivapurkar et al., Presence of simian virus 40 DNA sequences in human lymphomas. Lancet 359, 851 (Mar 9, 2002).
66. M. Carbone et al., SV40-like sequences in human bone tumors. Oncogene 13, 527 (Aug 1, 1996).
67. D. J. Bergsagel, M. J. Finegold, J. S. Butel, W. J. Kupsky, R. L. Garcea, DNA sequences similar to those of simian virus 40 in ependymomas and choroid plexus tumors of childhood. N Engl J Med 326, 988 (Apr 9, 1992).
68. M. Carbone et al., Simian virus 40-like DNA sequences in human pleural mesothelioma. Oncogene 9, 1781 (Jun, 1994).
69. F. Lopez-Rios, P. B. Illei, V. Rusch, M. Ladanyi, Evidence against a role for SV40 infection in human mesotheliomas and high risk of false-positive PCR results owing to presence of SV40 sequences in common laboratory plasmids. Lancet 364, 1157 (Sep 25-Oct 1, 2004).
70. K. V. Shah, SV40 and human cancer: a review of recent data. Int J Cancer 120, 215 (Jan 15, 2007).
71. H. D. Strickler et al., Simian virus 40 and pleural mesothelioma in humans. Cancer epidemiology, biomarkers & prevention : a publication of the American Association for Cancer Research, cosponsored by the American Society of Preventive Oncology 5, 473 (Jun, 1996).
72. S. de Sanjose et al., Lack of serological evidence for an association between simian virus 40 and lymphoma. Int J Cancer 104, 522 (Apr 20, 2003).
73. E. A. Engels et al., Case-control study of simian virus 40 and non-Hodgkin lymphoma in the United States. J Natl Cancer Inst 96, 1368 (Sep 15, 2004).

212
74. R. P. Viscidi et al., Serological cross-reactivities between antibodies to simian virus 40, BK virus, and JC virus assessed by virus-like-particle-based enzyme immunoassays. Clin Diagn Lab Immunol 10, 278 (Mar, 2003).
75. V. Bouvard et al., Carcinogenicity of malaria and of some polyomaviruses. The lancet oncology 13, 339 (Apr, 2012).
76. L. L. Emerson, H. M. Carney, L. J. Layfield, J. R. Sherbotie, Collecting duct carcinoma arising in association with BK nephropathy post-transplantation in a pediatric patient. A case report with immunohistochemical and in situ hybridization study. Pediatric transplantation 12, 600 (Aug, 2008).
77. D. Geetha, B. C. Tong, L. Racusen, J. S. Markowitz, W. H. Westra, Bladder carcinoma in a transplant recipient: evidence to implicate the BK human polyomavirus as a causal transforming agent. Transplantation 73, 1933 (Jun 27, 2002).
78. M. Narayanan et al., BK virus associated renal cell carcinoma: case presentation with optimized PCR and other diagnostic tests. American journal of transplantation : official journal of the American Society of Transplantation and the American Society of Transplant Surgeons 7, 1666 (Jun, 2007).
79. S. Loghavi, S. Bose, Polyomavirus infection and urothelial carcinoma. Diagnostic cytopathology 39, 531 (Jul, 2011).
80. J. Y. Kausman, G. R. Somers, D. M. Francis, C. L. Jones, Association of renal adenocarcinoma and BK virus nephropathy post transplantation. Pediatr Nephrol 19, 459 (Apr, 2004).
81. J. R. Abend, M. Jiang, M. J. Imperiale, BK virus and human cancer: innocent until proven guilty. Seminars in cancer biology 19, 252 (Aug, 2009).
82. T. Dalianis, H. H. Hirsch, Human polyomaviruses in disease and cancer. Virology 437, 63 (Mar 15, 2013).
83. S. D. Gardner, A. M. Field, D. V. Coleman, B. Hulme, New human papovavirus (B.K.) isolated from urine after renal transplantation. Lancet 1, 1253 (Jun 19, 1971).
84. B. L. Padgett, D. L. Walker, G. M. ZuRhein, R. J. Eckroade, B. H. Dessel, Cultivation of papova-like virus from human brain with progressive multifocal leucoencephalopathy. Lancet 1, 1257 (Jun 19, 1971).
85. T. Allander et al., Identification of a third human polyomavirus. J Virol 81, 4130 (Apr, 2007).
86. A. M. Gaynor et al., Identification of a novel polyomavirus from patients with acute respiratory tract infections. PLoS Pathog 3, e64 (May 4, 2007).
87. J. M. Kean, S. Rao, M. Wang, R. L. Garcea, Seroepidemiology of human polyomaviruses. PLoS pathogens 5, e1000363 (Mar, 2009).
88. N. L. Nguyen, B. M. Le, D. Wang, Serologic evidence of frequent human infection with WU and KI polyomaviruses. Emerging infectious diseases 15, 1199 (Aug, 2009).
89. T. Dalianis, T. Ramqvist, K. Andreasson, J. M. Kean, R. L. Garcea, KI, WU and Merkel cell polyomaviruses: a new era for human polyomavirus research. Seminars in cancer biology 19, 270 (Aug, 2009).
90. R. M. Schowalter, D. V. Pastrana, K. A. Pumphrey, A. L. Moyer, C. B. Buck, Merkel cell polyomavirus and two previously unknown polyomaviruses are chronically shed from human skin. Cell Host Microbe 7, 509 (Jun 25, 2010).

213
91. E. J. Duncavage, J. D. Pfeifer, Human polyomaviruses 6 and 7 are not detectable in Merkel cell polyomavirus-negative Merkel cell carcinoma. Journal of cutaneous pathology 38, 790 (Oct, 2011).
92. E. van der Meijden et al., Discovery of a new human polyomavirus associated with trichodysplasia spinulosa in an immunocompromized patient. PLoS Pathog 6, e1001024 (2010).
93. M. R. Matthews, R. C. Wang, R. L. Reddick, V. A. Saldivar, J. C. Browning, Viral-associated trichodysplasia spinulosa: a case with electron microscopic and molecular detection of the trichodysplasia spinulosa-associated human polyomavirus. Journal of cutaneous pathology 38, 420 (May, 2011).
94. E. van der Meijden et al., Seroprevalence of trichodysplasia spinulosa-associated polyomavirus. Emerging infectious diseases 17, 1355 (Aug, 2011).
95. B. H. Tan, K. J. Busam, Virus-associated Trichodysplasia spinulosa. Advances in anatomic pathology 18, 450 (Nov, 2011).
96. S. Kazem et al., Trichodysplasia spinulosa is characterized by active polyomavirus infection. J Clin Virol 53, 225 (Mar, 2012).
97. N. Scuda et al., A novel human polyomavirus closely related to the african green monkey-derived lymphotropic polyomavirus. J Virol 85, 4586 (May, 2011).
98. F. Trusch et al., Seroprevalence of human polyomavirus 9 and cross-reactivity to African green monkey-derived lymphotropic polyomavirus. The Journal of general virology 93, 698 (Apr, 2012).
99. J. T. Nicol et al., Seroprevalence and cross-reactivity of human polyomavirus 9. Emerging infectious diseases 18, 1329 (Aug, 2012).
100. E. A. Siebrasse et al., Identification of MW polyomavirus, a novel polyomavirus in human stool. J Virol 86, 10321 (Oct, 2012).
101. C. B. Buck et al., Complete genome sequence of a tenth human polyomavirus. J Virol 86, 10887 (Oct, 2012).
102. G. Yu et al., Discovery of a novel polyomavirus in acute diarrheal samples from children. PLoS One 7, e49449 (2012).
103. E. S. Lim et al., Discovery of STL polyomavirus, a polyomavirus of ancestral recombinant origin that encodes a unique T antigen by alternative splicing. Virology 436, 295 (Feb 20, 2013).
104. S. Korup et al., Identification of a novel human polyomavirus in organs of the gastrointestinal tract. PLoS One 8, e58021 (2013).
105. T. Chen et al., Serological evidence of Merkel cell polyomavirus primary infections in childhood. J Clin Virol 50, 125 (Feb, 2011).
106. E. A. Siebrasse et al., Human polyomaviruses in children undergoing transplantation, United States, 2008-2010. Emerging infectious diseases 18, 1676 (Oct, 2012).
107. R. J. Rockett et al., Detection of Novel Polyomaviruses, TSPyV, HPyV6, HPyV7, HPyV9 and MWPyV in Feces, Urine, Blood, Respiratory Swabs and Cerebrospinal Fluid. PLoS One 8, e62764 (2013).
108. Y. Ito, N. Spurr, B. E. Griffin, Middle T antigen as primary inducer of full expression of the phenotype of transformation by polyoma virus. J Virol 35, 219 (Jul, 1980).
109. M. I. Riley, W. Yoo, N. Y. Mda, W. R. Folk, Tiny T antigen: an autonomous polyomavirus T antigen amino-terminal domain. J Virol 71, 6068 (Aug, 1997).

214
110. J. Zerrahn, U. Knippschild, T. Winkler, W. Deppert, Independent expression of the transforming amino-terminal domain of SV40 large I antigen from an alternatively spliced third SV40 early mRNA. Embo J 12, 4739 (Dec, 1993).
111. P. W. Trowbridge, R. J. Frisque, Identification of three new JC virus proteins generated by alternative splicing of the early viral mRNA. J Neurovirol 1, 195 (Jun, 1995).
112. S. Raghava, K. M. Giorda, F. B. Romano, A. P. Heuck, D. N. Hebert, SV40 Late Protein VP4 Forms Toroidal Pores To Disrupt Membranes for Viral Release. Biochemistry 52, 3939 (Jun 4, 2013).
113. R. C. Liddington et al., Structure of simian virus 40 at 3.8-A resolution. Nature 354, 278 (Nov 28, 1991).
114. T. Stehle, Y. Yan, T. L. Benjamin, S. C. Harrison, Structure of murine polyomavirus complexed with an oligosaccharide receptor fragment. Nature 369, 160 (May 12, 1994).
115. U. Neu, K. Woellner, G. Gauglitz, T. Stehle, Structural basis of GM1 ganglioside recognition by simian virus 40. Proc Natl Acad Sci U S A 105, 5219 (Apr 1, 2008).
116. B. Tsai et al., Gangliosides are receptors for murine polyoma virus and SV40. Embo J 22, 4346 (Sep 1, 2003).
117. J. A. Low, B. Magnuson, B. Tsai, M. J. Imperiale, Identification of gangliosides GD1b and GT1b as receptors for BK virus. J Virol 80, 1361 (Feb, 2006).
118. G. F. Elphick et al., The human polyomavirus, JCV, uses serotonin receptors to infect cells. Science 306, 1380 (Nov 19, 2004).
119. K. D. Erickson, R. L. Garcea, B. Tsai, Ganglioside GT1b is a putative host cell receptor for the Merkel cell polyomavirus. J Virol 83, 10275 (Oct, 2009).
120. U. Neu et al., Structures of Merkel cell polyomavirus VP1 complexes define a sialic acid binding site required for infection. PLoS pathogens 8, e1002738 (2012).
121. R. M. Schowalter, D. V. Pastrana, C. B. Buck, Glycosaminoglycans and sialylated glycans sequentially facilitate Merkel cell polyomavirus infectious entry. PLoS pathogens 7, e1002161 (Jul, 2011).
122. X. Z. a. X. J. Ellen Fanning, in DNA Tumor Viruses. (Springer Science, 2009). 123. S. Eash, K. Manley, M. Gasparovic, W. Querbes, W. J. Atwood, The human
polyomaviruses. Cell Mol Life Sci 63, 865 (Apr, 2006). 124. E. Fanning, K. Zhao, SV40 DNA replication: from the A gene to a nanomachine.
Virology 384, 352 (Feb 20, 2009). 125. P. Taneja et al., Timed interactions between viral and cellular replication factors during
the initiation of SV40 in vitro DNA replication. Biochem J 407, 313 (Oct 15, 2007). 126. C. Schneider, K. Weisshart, L. A. Guarino, I. Dornreiter, E. Fanning, Species-specific
functional interactions of DNA polymerase alpha-primase with simian virus 40 (SV40) T antigen require SV40 origin DNA. Mol Cell Biol 14, 3176 (May, 1994).
127. D. Ahuja, M. T. Saenz-Robles, J. M. Pipas, SV40 large T antigen targets multiple cellular pathways to elicit cellular transformation. Oncogene 24, 7729 (Nov 21, 2005).
128. Y. Gluzman, B. Ahrens, SV40 early mutants that are defective for viral DNA synthesis but competent for transformation of cultured rat and simian cells. Virology 123, 78 (Nov, 1982).
129. M. Shuda, H. J. Kwun, H. Feng, Y. Chang, P. S. Moore, Human Merkel cell polyomavirus small T antigen is an oncoprotein targeting the 4E-BP1 translation regulator. J Clin Invest 121, 3623 (Sep, 2011).

215
130. L. Raptis, H. Lamfrom, T. L. Benjamin, Regulation of cellular phenotype and expression of polyomavirus middle T antigen in rat fibroblasts. Mol Cell Biol 5, 2476 (Sep, 1985).
131. S. H. Ali, J. A. DeCaprio, Cellular transformation by SV40 large T antigen: interaction with host proteins. Semin Cancer Biol 11, 15 (Feb, 2001).
132. J. M. Pipas, Common and unique features of T antigens encoded by the polyomavirus group. J Virol 66, 3979 (Jul, 1992).
133. J. S. Butel, J. A. Lednicky, Cell and molecular biology of simian virus 40: implications for human infections and disease. J Natl Cancer Inst 91, 119 (Jan 20, 1999).
134. L. V. Crawford et al., Characterization of the complex between SV40 large T antigen and the 53K host protein in transformed mouse cells. Cold Spring Harb Symp Quant Biol 44 Pt 1, 179 (1980).
135. D. P. Lane, L. V. Crawford, T antigen is bound to a host protein in SV40-transformed cells. Nature 278, 261 (Mar 15, 1979).
136. C. S. Sullivan, J. M. Pipas, T antigens of simian virus 40: molecular chaperones for viral replication and tumorigenesis. Microbiol Mol Biol Rev 66, 179 (Jun, 2002).
137. D. Ahuja, A. V. Rathi, A. E. Greer, X. S. Chen, J. M. Pipas, A structure-guided mutational analysis of simian virus 40 large T antigen: identification of surface residues required for viral replication and transformation. J Virol 83, 8781 (Sep, 2009).
138. S. H. Ali, J. S. Kasper, T. Arai, J. A. DeCaprio, Cul7/p185/p193 binding to simian virus 40 large T antigen has a role in cellular transformation. J Virol 78, 2749 (Mar, 2004).
139. M. Cotsiki et al., Simian virus 40 large T antigen targets the spindle assembly checkpoint protein Bub1. Proc Natl Acad Sci U S A 101, 947 (Jan 27, 2004).
140. Z. L. Fei, C. D'Ambrosio, S. Li, E. Surmacz, R. Baserga, Association of insulin receptor substrate 1 with simian virus 40 large T antigen. Mol Cell Biol 15, 4232 (Aug, 1995).
141. A. Srinivasan et al., The amino-terminal transforming region of simian virus 40 large T and small t antigens functions as a J domain. Mol Cell Biol 17, 4761 (Aug, 1997).
142. H. Stubdal et al., Inactivation of pRB-related proteins p130 and p107 mediated by the J domain of simian virus 40 large T antigen. Mol Cell Biol 17, 4979 (Sep, 1997).
143. P. Yaciuk, M. C. Carter, J. M. Pipas, E. Moran, Simian virus 40 large-T antigen expresses a biological activity complementary to the p300-associated transforming function of the adenovirus E1A gene products. Mol Cell Biol 11, 2116 (Apr, 1991).
144. N. L. Lill, M. J. Tevethia, R. Eckner, D. M. Livingston, N. Modjtahedi, p300 family members associate with the carboxyl terminus of simian virus 40 large tumor antigen. J Virol 71, 129 (Jan, 1997).
145. J. A. DeCaprio et al., SV40 large tumor antigen forms a specific complex with the product of the retinoblastoma susceptibility gene. Cell 54, 275 (Jul 15, 1988).
146. A. M. Helt, D. A. Galloway, Mechanisms by which DNA tumor virus oncoproteins target the Rb family of pocket proteins. Carcinogenesis 24, 159 (Feb, 2003).
147. L. Marcos-Villar et al., Kaposi's sarcoma-associated herpesvirus lana2 protein interacts with the pocket proteins and inhibits their sumoylation. Oncogene, (Jan 14, 2013).
148. L. Litovchick, L. A. Florens, S. K. Swanson, M. P. Washburn, J. A. DeCaprio, DYRK1A protein kinase promotes quiescence and senescence through DREAM complex assembly. Genes & development 25, 801 (Apr 15, 2011).
149. P. Stiegler, A. De Luca, L. Bagella, A. Giordano, The COOH-terminal region of pRb2/p130 binds to histone deacetylase 1 (HDAC1), enhancing transcriptional repression of the E2F-dependent cyclin A promoter. Cancer Res 58, 5049 (Nov 15, 1998).

216
150. P. An, M. T. Saenz Robles, J. M. Pipas, Large T antigens of polyomaviruses: amazing molecular machines. Annual review of microbiology 66, 213 (2012).
151. J. Y. Lin, J. A. DeCaprio, SV40 large T antigen promotes dephosphorylation of p130. J Biol Chem 278, 46482 (Nov 21, 2003).
152. C. S. Sullivan, P. Cantalupo, J. M. Pipas, The molecular chaperone activity of simian virus 40 large T antigen is required to disrupt Rb-E2F family complexes by an ATP-dependent mechanism. Mol Cell Biol 20, 6233 (Sep, 2000).
153. A. V. Rathi, M. T. Saenz Robles, P. G. Cantalupo, R. H. Whitehead, J. M. Pipas, Simian virus 40 T-antigen-mediated gene regulation in enterocytes is controlled primarily by the Rb-E2F pathway. J Virol 83, 9521 (Sep, 2009).
154. S. Y. Fuchs, V. Adler, T. Buschmann, X. Wu, Z. Ronai, Mdm2 association with p53 targets its ubiquitination. Oncogene 17, 2543 (Nov 12, 1998).
155. C. A. Brady et al., Distinct p53 transcriptional programs dictate acute DNA-damage responses and tumor suppression. Cell 145, 571 (May 13, 2011).
156. H. M. Sheppard, S. I. Corneillie, C. Espiritu, A. Gatti, X. Liu, New insights into the mechanism of inhibition of p53 by simian virus 40 large T antigen. Mol Cell Biol 19, 2746 (Apr, 1999).
157. M. Scheffner, B. A. Werness, J. M. Huibregtse, A. J. Levine, P. M. Howley, The E6 oncoprotein encoded by human papillomavirus types 16 and 18 promotes the degradation of p53. Cell 63, 1129 (1990).
158. P. R. Yew, A. J. Berk, Inhibition of p53 transactivation required for transformation by adenovirus early 1B protein. Nature 357, 82 (May 7, 1992).
159. F. Tiemann, W. Deppert, Stabilization of the tumor suppressor p53 during cellular transformation by simian virus 40: influence of viral and cellular factors and biological consequences. J Virol 68, 2869 (May, 1994).
160. D. I. Linzer, A. J. Levine, Characterization of a 54K dalton cellular SV40 tumor antigen present in SV40-transformed cells and uninfected embryonal carcinoma cells. Cell 17, 43 (1979).
161. R. Zhao et al., The transcriptional program following p53 activation. Cold Spring Harb Symp Quant Biol 65, 475 (2000).
162. A. Hermannstadter, C. Ziegler, M. Kuhl, W. Deppert, G. V. Tolstonog, Wild-type p53 enhances efficiency of simian virus 40 large-T-antigen-induced cellular transformation. J Virol 83, 10106 (Oct, 2009).
163. M. Herzig, M. Novatchkova, G. Christofori, An unexpected role for p53 in augmenting SV40 large T antigen-mediated tumorigenesis. Biological chemistry 380, 203 (Feb, 1999).
164. D. R. Borger, J. A. DeCaprio, Targeting of p300/CREB binding protein coactivators by simian virus 40 is mediated through p53. J Virol 80, 4292 (May, 2006).
165. K. S. Campbell et al., DnaJ/hsp40 chaperone domain of SV40 large T antigen promotes efficient viral DNA replication. Genes & development 11, 1098 (May 1, 1997).
166. A. J. Berk, Recent lessons in gene expression, cell cycle control, and cell biology from adenovirus. Oncogene 24, 7673 (Nov 21, 2005).
167. N. G. Iyer, H. Ozdag, C. Caldas, p300/CBP and cancer. Oncogene 23, 4225 (May 24, 2004).
168. R. Eckner et al., Association of p300 and CBP with simian virus 40 large T antigen. Mol Cell Biol 16, 3454 (Jul, 1996).

217
169. D. L. Poulin, A. L. Kung, J. A. DeCaprio, p53 targets simian virus 40 large T antigen for acetylation by CBP. J Virol 78, 8245 (Aug, 2004).
170. G. A. Horwitz et al., Adenovirus small e1a alters global patterns of histone modification. Science 321, 1084 (Aug 22, 2008).
171. R. Ferrari et al., Epigenetic reprogramming by adenovirus e1a. Science 321, 1086 (Aug 22, 2008).
172. G. Chinnadurai, Opposing oncogenic activities of small DNA tumor virus transforming proteins. Trends Microbiol 19, 174 (Apr, 2011).
173. A. Sarikas, X. Xu, L. J. Field, Z. Q. Pan, The cullin7 E3 ubiquitin ligase: a novel player in growth control. Cell Cycle 7, 3154 (Oct, 2008).
174. J. S. Kasper, H. Kuwabara, T. Arai, S. H. Ali, J. A. DeCaprio, Simian virus 40 large T antigen's association with the CUL7 SCF complex contributes to cellular transformation. J Virol 79, 11685 (Sep, 2005).
175. H. Okabe et al., A critical role for FBXW8 and MAPK in cyclin D1 degradation and cancer cell proliferation. PLoS One 1, e128 (2006).
176. X. Xu et al., The CUL7 E3 ubiquitin ligase targets insulin receptor substrate 1 for ubiquitin-dependent degradation. Mol Cell 30, 403 (May 23, 2008).
177. P. Meraldi, P. K. Sorger, A dual role for Bub1 in the spindle checkpoint and chromosome congression. Embo J 24, 1621 (Apr 20, 2005).
178. S. Boichuk, L. Hu, J. Hein, O. V. Gjoerup, Multiple DNA damage signaling and repair pathways deregulated by simian virus 40 large T antigen. J Virol 84, 8007 (Aug, 2010).
179. O. V. Gjoerup et al., Surveillance mechanism linking Bub1 loss to the p53 pathway. Proc Natl Acad Sci U S A 104, 8334 (May 15, 2007).
180. T. DeAngelis, J. Chen, A. Wu, M. Prisco, R. Baserga, Transformation by the simian virus 40 T antigen is regulated by IGF-I receptor and IRS-1 signaling. Oncogene 25, 32 (Jan 5, 2006).
181. Y. Yu, J. C. Alwine, Interaction between simian virus 40 large T antigen and insulin receptor substrate 1 is disrupted by the K1 mutation, resulting in the loss of large T antigen-mediated phosphorylation of Akt. J Virol 82, 4521 (May, 2008).
182. M. Prisco et al., Nuclear translocation of insulin receptor substrate-1 by the simian virus 40 T antigen and the activated type 1 insulin-like growth factor receptor. J Biol Chem 277, 32078 (Aug 30, 2002).
183. A. Lassak et al., Insulin receptor substrate 1 translocation to the nucleus by the human JC virus T-antigen. J Biol Chem 277, 17231 (May 10, 2002).
184. J. H. Lee, T. T. Paull, ATM activation by DNA double-strand breaks through the Mre11-Rad50-Nbs1 complex. Science 308, 551 (Apr 22, 2005).
185. X. Wu et al., SV40 T antigen interacts with Nbs1 to disrupt DNA replication control. Genes Dev 18, 1305 (Jun 1, 2004).
186. D. M. Koepp et al., Phosphorylation-dependent ubiquitination of cyclin E by the SCFFbw7 ubiquitin ligase. Science 294, 173 (Oct 5, 2001).
187. M. Welcker et al., The Fbw7 tumor suppressor regulates glycogen synthase kinase 3 phosphorylation-dependent c-Myc protein degradation. Proc Natl Acad Sci U S A 101, 9085 (Jun 15, 2004).
188. A. S. Nateri, L. Riera-Sans, C. Da Costa, A. Behrens, The ubiquitin ligase SCFFbw7 antagonizes apoptotic JNK signaling. Science 303, 1374 (Feb 27, 2004).

218
189. G. Wu et al., SEL-10 is an inhibitor of notch signaling that targets notch for ubiquitin-mediated protein degradation. Mol Cell Biol 21, 7403 (Nov, 2001).
190. M. Welcker, B. E. Clurman, The SV40 large T antigen contains a decoy phosphodegron that mediates its interactions with Fbw7/hCdc4. J Biol Chem 280, 7654 (Mar 4, 2005).
191. B. Turk, A. Porras, M. C. Mumby, K. Rundell, Simian virus 40 small-t antigen binds two zinc ions. J Virol 67, 3671 (Jun, 1993).
192. M. J. Sleigh, W. C. Topp, R. Hanich, J. F. Sambrook, Mutants of SV40 with an altered small t protein are reduced in their ability to transform cells. Cell 14, 79 (May, 1978).
193. S. Mungre et al., Mutations which affect the inhibition of protein phosphatase 2A by simian virus 40 small-t antigen in vitro decrease viral transformation. J Virol 68, 1675 (Mar, 1994).
194. W. C. Hahn et al., Enumeration of the simian virus 40 early region elements necessary for human cell transformation. Mol Cell Biol 22, 2111 (Apr, 2002).
195. A. A. Sablina, W. C. Hahn, SV40 small T antigen and PP2A phosphatase in cell transformation. Cancer Metastasis Rev 27, 137 (Jun, 2008).
196. E. Sontag, Protein phosphatase 2A: the Trojan Horse of cellular signaling. Cell Signal 13, 7 (Jan, 2001).
197. D. C. Pallas et al., Polyoma small and middle T antigens and SV40 small t antigen form stable complexes with protein phosphatase 2A. Cell 60, 167 (Jan 12, 1990).
198. Y. Chen et al., Structural and biochemical insights into the regulation of protein phosphatase 2A by small t antigen of SV40. Nature structural & molecular biology 14, 527 (Jun, 2007).
199. O. Gjoerup, Y. Chang, Update on human polyomaviruses and cancer. Advances in cancer research 106, 1 (2010).
200. E. Yeh et al., A signalling pathway controlling c-Myc degradation that impacts oncogenic transformation of human cells. Nature cell biology 6, 308 (Apr, 2004).
201. J. J. Zhao et al., Human mammary epithelial cell transformation through the activation of phosphatidylinositol 3-kinase. Cancer cell 3, 483 (May, 2003).
202. P. Rodriguez-Viciana, C. Collins, M. Fried, Polyoma and SV40 proteins differentially regulate PP2A to activate distinct cellular signaling pathways involved in growth control. Proc Natl Acad Sci U S A 103, 19290 (Dec 19, 2006).
203. E. Sontag et al., The interaction of SV40 small tumor antigen with protein phosphatase 2A stimulates the map kinase pathway and induces cell proliferation. Cell 75, 887 (Dec 3, 1993).
204. E. Sontag, J. M. Sontag, A. Garcia, Protein phosphatase 2A is a critical regulator of protein kinase C zeta signaling targeted by SV40 small t to promote cell growth and NF-kappaB activation. Embo J 16, 5662 (Sep 15, 1997).
205. M. T. Saenz Robles, J. M. Pipas, T antigen transgenic mouse models. Seminars in cancer biology 19, 229 (Aug, 2009).
206. R. L. Brinster et al., Transgenic mice harboring SV40 T-antigen genes develop characteristic brain tumors. Cell 37, 367 (Jun, 1984).
207. M. T. Saenz Robles, H. Symonds, J. Chen, T. Van Dyke, Induction versus progression of brain tumor development: differential functions for the pRB- and p53-targeting domains of simian virus 40 T antigen. Mol Cell Biol 14, 2686 (Apr, 1994).

219
208. H. S. Symonds, S. A. McCarthy, J. Chen, J. M. Pipas, T. Van Dyke, Use of transgenic mice reveals cell-specific transformation by a simian virus 40 T-antigen amino-terminal mutant. Mol Cell Biol 13, 3255 (Jun, 1993).
209. S. A. McCarthy, H. S. Symonds, T. Van Dyke, Regulation of apoptosis in transgenic mice by simian virus 40 T antigen-mediated inactivation of p53. Proc Natl Acad Sci U S A 91, 3979 (Apr 26, 1994).
210. H. Symonds et al., p53-dependent apoptosis in vivo: impact of p53 inactivation on tumorigenesis. Cold Spring Harb Symp Quant Biol 59, 247 (1994).
211. K. Simin et al., pRb inactivation in mammary cells reveals common mechanisms for tumor initiation and progression in divergent epithelia. PLoS biology 2, E22 (Feb, 2004).
212. S. H. Kim, K. A. Roth, C. M. Coopersmith, J. M. Pipas, J. I. Gordon, Expression of wild-type and mutant simian virus 40 large tumor antigens in villus-associated enterocytes of transgenic mice. Proc Natl Acad Sci U S A 91, 6914 (Jul 19, 1994).
213. J. A. Markovics et al., Intestinal dysplasia induced by simian virus 40 T antigen is independent of p53. J Virol 79, 7492 (Jun, 2005).
214. A. V. Rathi, M. T. Saenz Robles, J. M. Pipas, Enterocyte proliferation and intestinal hyperplasia induced by simian virus 40 T antigen require a functional J domain. J Virol 81, 9481 (Sep, 2007).
215. A. Xiao, H. Wu, P. P. Pandolfi, D. N. Louis, T. Van Dyke, Astrocyte inactivation of the pRb pathway predisposes mice to malignant astrocytoma development that is accelerated by PTEN mutation. Cancer cell 1, 157 (Mar, 2002).
216. R. Hill, Y. Song, R. D. Cardiff, T. Van Dyke, Heterogeneous tumor evolution initiated by loss of pRb function in a preclinical prostate cancer model. Cancer Res 65, 10243 (Nov 15, 2005).
217. M. Bennoun et al., The amino-terminal region of SV40 large T antigen is sufficient to induce hepatic tumours in mice. Oncogene 17, 1253 (Sep 10, 1998).
218. S. M. Maricich et al., Merkel cells are essential for light-touch responses. Science 324, 1580 (Jun 19, 2009).
219. M. E. Spurgeon, P. F. Lambert, Merkel cell polyomavirus: a newly discovered human virus with oncogenic potential. Virology 435, 118 (Jan 5, 2013).
220. A. Van Keymeulen et al., Epidermal progenitors give rise to Merkel cells during embryonic development and adult homeostasis. The Journal of cell biology 187, 91 (Oct 5, 2009).
221. N. J. Ball, G. Tanhuanco-Kho, Merkel cell carcinoma frequently shows histologic features of basal cell carcinoma: a study of 30 cases. J Cutan Pathol 34, 612 (Aug, 2007).
222. M. Bobos, P. Hytiroglou, I. Kostopoulos, G. Karkavelas, C. S. Papadimitriou, Immunohistochemical distinction between merkel cell carcinoma and small cell carcinoma of the lung. Am J Dermatopathol 28, 99 (Apr, 2006).
223. V. Koljonen, Merkel cell carcinoma. World journal of surgical oncology 4, 7 (2006). 224. R. W. Miller, C. S. Rabkin, Merkel cell carcinoma and melanoma: etiological similarities
and differences. Cancer epidemiology, biomarkers & prevention : a publication of the American Association for Cancer Research, cosponsored by the American Society of Preventive Oncology 8, 153 (Feb, 1999).
225. M. P. Pulitzer, B. D. Amin, K. J. Busam, Merkel cell carcinoma: review. Advances in anatomic pathology 16, 135 (May, 2009).

220
226. B. Lemos, P. Nghiem, Merkel cell carcinoma: more deaths but still no pathway to blame. J Invest Dermatol 127, 2100 (Sep, 2007).
227. P. J. Allen et al., Merkel cell carcinoma: prognosis and treatment of patients from a single institution. Journal of clinical oncology : official journal of the American Society of Clinical Oncology 23, 2300 (Apr 1, 2005).
228. A. A. Sarnaik, M. H. Lien, P. Nghiem, C. K. Bichakjian, Clinical recognition, diagnosis, and staging of merkel cell carcinoma, and the role of the multidisciplinary management team. Current problems in cancer 34, 38 (Jan-Feb, 2010).
229. B. D. Lemos et al., Pathologic nodal evaluation improves prognostic accuracy in Merkel cell carcinoma: analysis of 5823 cases as the basis of the first consensus staging system. Journal of the American Academy of Dermatology 63, 751 (Nov, 2010).
230. D. Mercer, P. Brander, K. Liddell, Merkel cell carcinoma: the clinical course. Annals of plastic surgery 25, 136 (Aug, 1990).
231. C. K. Bichakjian et al., Merkel cell carcinoma: critical review with guidelines for multidisciplinary management. Cancer 110, 1 (Jul 1, 2007).
232. R. Arora et al., Survivin is a therapeutic target in Merkel cell carcinoma. Science translational medicine 4, 133ra56 (May 9, 2012).
233. J. H. Leonard, P. Leonard, J. H. Kearsley, Chromosomes 1, 11, and 13 are frequently involved in karyotypic abnormalities in metastatic Merkel cell carcinoma. Cancer Genet Cytogenet 67, 65 (May, 1993).
234. M. Van Gele et al., Combined karyotyping, CGH and M-FISH analysis allows detailed characterization of unidentified chromosomal rearrangements in Merkel cell carcinoma. Int J Cancer 101, 137 (Sep 10, 2002).
235. K. G. Paulson et al., Array-CGH reveals recurrent genomic changes in Merkel cell carcinoma including amplification of L-Myc. J Invest Dermatol 129, 1547 (Jun, 2009).
236. A. Ziegler et al., Mutation hotspots due to sunlight in the p53 gene of nonmelanoma skin cancers. Proc Natl Acad Sci U S A 90, 4216 (May 1, 1993).
237. S. Popp, S. Waltering, C. Herbst, I. Moll, P. Boukamp, UV-B-type mutations and chromosomal imbalances indicate common pathways for the development of Merkel and skin squamous cell carcinomas. Int J Cancer 99, 352 (May 20, 2002).
238. M. Van Gele et al., Mutation analysis of P73 and TP53 in Merkel cell carcinoma. Br J Cancer 82, 823 (Feb, 2000).
239. H. N. Ananthaswamy, W. E. Pierceall, Molecular alterations in human skin tumors. Progress in clinical and biological research 376, 61 (1992).
240. J. Carr, R. M. Mackie, Point mutations in the N-ras oncogene in malignant melanoma and congenital naevi. The British journal of dermatology 131, 72 (Jul, 1994).
241. M. Jafari et al., Analysis of ras mutations in human melanocytic lesions: activation of the ras gene seems to be associated with the nodular type of human malignant melanoma. Journal of cancer research and clinical oncology 121, 23 (1995).
242. A. Lassacher, E. Heitzer, H. Kerl, P. Wolf, p14ARF hypermethylation is common but INK4a-ARF locus or p53 mutations are rare in Merkel cell carcinoma. J Invest Dermatol 128, 1788 (Jul, 2008).
243. H. Davies et al., Mutations of the BRAF gene in human cancer. Nature 417, 949 (Jun 27, 2002).
244. R. Houben et al., Absence of classical MAP kinase pathway signalling in Merkel cell carcinoma. J Invest Dermatol 126, 1135 (May, 2006).

221
245. S. Liu, T. Daa, K. Kashima, Y. Kondoh, S. Yokoyama, The Wnt-signaling pathway is not implicated in tumorigenesis of Merkel cell carcinoma. J Cutan Pathol 34, 22 (Jan, 2007).
246. B. L. Swick, L. Ravdel, J. E. Fitzpatrick, W. A. Robinson, Merkel cell carcinoma: evaluation of KIT (CD117) expression and failure to demonstrate activating mutations in the C-KIT proto-oncogene - implications for treatment with imatinib mesylate. Journal of cutaneous pathology 34, 324 (Apr, 2007).
247. M. M. Kennedy, K. Blessing, G. King, K. M. Kerr, Expression of bcl-2 and p53 in Merkel cell carcinoma. An immunohistochemical study. The American Journal of dermatopathology 18, 273 (Jun, 1996).
248. A. Plettenberg, J. Pammer, E. Tschachler, Merkel cells and Merkel cell carcinoma express the BCL-2 proto-oncogene. Experimental dermatology 5, 102 (Apr, 1996).
249. T. L. Benjamin, Polyoma virus: old findings and new challenges. Virology 289, 167 (Oct 25, 2001).
250. I. K. Sariyer, A. S. Saribas, M. K. White, M. Safak, Infection by agnoprotein-negative mutants of polyomavirus JC and SV40 results in the release of virions that are mostly deficient in DNA content. Virology journal 8, 255 (2011).
251. S. Nomura, G. Khoury, G. Jay, Subcellular localization of the simian virus 40 agnoprotein. J Virol 45, 428 (Jan, 1983).
252. J. J. Carter et al., Identification of an overprinting gene in Merkel cell polyomavirus provides evolutionary insight into the birth of viral genes. Proc Natl Acad Sci U S A, (Jul 11, 2013).
253. D. V. Pastrana et al., Quantitation of human seroresponsiveness to Merkel cell polyomavirus. PLoS Pathog 5, e1000578 (Sep, 2009).
254. H. Feng et al., Cellular and viral factors regulating Merkel cell polyomavirus replication. PLoS One 6, e22468 (2011).
255. G. J. Seo, L. H. Fink, B. O'Hara, W. J. Atwood, C. S. Sullivan, Evolutionarily conserved function of a viral microRNA. J Virol 82, 9823 (Oct, 2008).
256. C. S. Sullivan, A. T. Grundhoff, S. Tevethia, J. M. Pipas, D. Ganem, SV40-encoded microRNAs regulate viral gene expression and reduce susceptibility to cytotoxic T cells. Nature 435, 682 (Jun 2, 2005).
257. G. J. Seo, C. J. Chen, C. S. Sullivan, Merkel cell polyomavirus encodes a microRNA with the ability to autoregulate viral gene expression. Virology 383, 183 (Jan 20, 2009).
258. S. Lee et al., Identification and validation of a novel mature microRNA encoded by the Merkel cell polyomavirus in human Merkel cell carcinomas. J Clin Virol 52, 272 (Nov, 2011).
259. C. Martel-Jantin et al., Genetic variability and integration of Merkel cell polyomavirus in Merkel cell carcinoma. Virology 426, 134 (May 10, 2012).
260. J. Cheng, O. Rozenblatt-Rosen, K. G. Paulson, P. Nghiem, J. A. Decaprio, Merkel cell polyomavirus large T antigen has growth-promoting and inhibitory activities. J Virol 87, 6118 (Jun, 2013).
261. M. Schmitt, U. Wieland, A. Kreuter, M. Pawlita, C-terminal deletions of Merkel cell polyomavirus large T-antigen, a highly specific surrogate marker for virally induced malignancy. Int J Cancer 131, 2863 (Dec 15, 2012).
262. A. Kassem et al., Frequent detection of Merkel cell polyomavirus in human Merkel cell carcinomas and identification of a unique deletion in the VP1 gene. Cancer Res 68, 5009 (Jul 1, 2008).

222
263. X. Liu et al., Merkel cell polyomavirus large T antigen disrupts lysosome clustering by translocating human Vam6p from the cytoplasm to the nucleus. J Biol Chem 286, 17079 (May 13, 2011).
264. N. Fischer, J. Brandner, F. Fuchs, I. Moll, A. Grundhoff, Detection of Merkel cell polyomavirus (MCPyV) in Merkel cell carcinoma cell lines: cell morphology and growth phenotype do not reflect presence of the virus. Int J Cancer 126, 2133 (May 1, 2010).
265. A. Guastafierro et al., Characterization of an early passage Merkel cell polyomavirus-positive Merkel cell carcinoma cell line, MS-1, and its growth in NOD scid gamma mice. Journal of virological methods 187, 6 (Jan, 2013).
266. H. C. Laude et al., Distinct merkel cell polyomavirus molecular features in tumour and non tumour specimens from patients with merkel cell carcinoma. PLoS pathogens 6, e1001076 (2010).
267. X. Sastre-Garau et al., Merkel cell carcinoma of the skin: pathological and molecular evidence for a causative role of MCV in oncogenesis. The Journal of pathology 218, 48 (May, 2009).
268. U. Wieland, C. Mauch, A. Kreuter, T. Krieg, H. Pfister, Merkel cell polyomavirus DNA in persons without merkel cell carcinoma. Emerging infectious diseases 15, 1496 (Sep, 2009).
269. Y. L. Tolstov et al., Human Merkel cell polyomavirus infection II. MCV is a common human infection that can be detected by conformational capsid epitope immunoassays. Int J Cancer 125, 1250 (Sep 15, 2009).
270. J. J. Carter et al., Association of Merkel cell polyomavirus-specific antibodies with Merkel cell carcinoma. J Natl Cancer Inst 101, 1510 (Nov 4, 2009).
271. A. Touze et al., Generation of Merkel cell polyomavirus (MCV)-like particles and their application to detection of MCV antibodies. J Clin Microbiol 48, 1767 (May, 2010).
272. L. Ren et al., WU and KI polyomavirus present in the respiratory tract of children, but not in immunocompetent adults. J Clin Virol 43, 330 (Nov, 2008).
273. S. Bialasiewicz, S. B. Lambert, D. M. Whiley, M. D. Nissen, T. P. Sloots, Merkel cell polyomavirus DNA in respiratory specimens from children and adults. Emerg Infect Dis 15, 492 (Mar, 2009).
274. M. Loyo et al., Quantitative detection of Merkel cell virus in human tissues and possible mode of transmission. Int J Cancer 126, 2991 (Jun 15, 2010).
275. S. Bofill-Mas, J. Rodriguez-Manzano, B. Calgua, A. Carratala, R. Girones, Newly described human polyomaviruses Merkel cell, KI and WU are present in urban sewage and may represent potential environmental contaminants. Virology journal 7, 141 (2010).
276. R. Houben et al., Merkel cell polyomavirus-infected Merkel cell carcinoma cells require expression of viral T antigens. J Virol 84, 7064 (Jul, 2010).
277. R. Houben et al., An intact retinoblastoma protein-binding site in Merkel cell polyomavirus large T antigen is required for promoting growth of Merkel cell carcinoma cells. Int J Cancer 130, 847 (Feb 15, 2012).
278. H. J. Kwun et al., The minimum replication origin of merkel cell polyomavirus has a unique large T-antigen loading architecture and requires small T-antigen expression for optimal replication. J Virol 83, 12118 (Dec, 2009).
279. M. Shuda et al., T antigen mutations are a human tumor-specific signature for Merkel cell polyomavirus. Proc. Natl. Acad. Sci. USA 105, 16272 (Oct 21, 2008).

223
280. P. Coursaget, M. Samimi, J. T. Nicol, C. Gardair, A. Touze, Human Merkel cell polyomavirus: virological background and clinical implications. APMIS : acta pathologica, microbiologica, et immunologica Scandinavica 121, 755 (Aug, 2013).
281. M. Shuda et al., Human merkel cell polyomavirus infection I. MCV T antigen expression in merkel cell carcinoma, lymphoid tissues and lymphoid tumors. Int. J. Cancer doi:10.1002/ijc.24510, (2009).
282. A. Touze et al., High levels of antibodies against merkel cell polyomavirus identify a subset of patients with merkel cell carcinoma with better clinical outcome. Journal of clinical oncology : official journal of the American Society of Clinical Oncology 29, 1612 (Apr 20, 2011).
283. K. Bhatia, J. J. Goedert, R. Modali, L. Preiss, L. W. Ayers, Immunological detection of viral large T antigen identifies a subset of Merkel cell carcinoma tumors with higher viral abundance and better clinical outcome. Int J Cancer 127, 1493 (Sep 1, 2010).
284. M. Van Gele et al., Gene-expression profiling reveals distinct expression patterns for Classic versus Variant Merkel cell phenotypes and new classifier genes to distinguish Merkel cell from small-cell lung carcinoma. Oncogene 23, 2732 (Apr 8, 2004).
285. D. N. Carney et al., Establishment and identification of small cell lung cancer cell lines having classic and variant features. Cancer Res 45, 2913 (Jun, 1985).
286. A. F. Gazdar, D. N. Carney, M. M. Nau, J. D. Minna, Characterization of variant subclasses of cell lines derived from small cell lung cancer having distinctive biochemical, morphological, and growth properties. Cancer Res 45, 2924 (Jun, 1985).
287. J. H. Leonard, P. Dash, P. Holland, J. H. Kearsley, J. R. Bell, Characterisation of four Merkel cell carcinoma adherent cell lines. Int J Cancer 60, 100 (Jan 3, 1995).
288. S. T. Rosen et al., Establishment and characterization of a neuroendocrine skin carcinoma cell line. Laboratory investigation; a journal of technical methods and pathology 56, 302 (Mar, 1987).
289. K. Krasagakis et al., Growth and characterization of a cell line from a human primary neuroendocrine carcinoma of the skin (Merkel cell carcinoma) in culture and as xenograft. J Cell Physiol 187, 386 (Jun, 2001).
290. Y. L. Tolstov et al., Human merkel cell polyomavirus infection II. MCV is a common human infection that can be detected by conformational capsid epitope immunoassays. Int. J. Cancer doi:10.1002/ijc.24509, (2009).
291. J. K. Chan et al., Cytokeratin 20 immunoreactivity distinguishes Merkel cell (primary cutaneous neuroendocrine) carcinomas and salivary gland small cell carcinomas from small cell carcinomas of various sites. The American journal of surgical pathology 21, 226 (Feb, 1997).
292. W. Goessling, P. H. McKee, R. J. Mayer, Merkel cell carcinoma. J Clin Oncol 20, 588 (Jan 15, 2002).
293. A. J. Hanly, G. W. Elgart, M. Jorda, J. Smith, M. Nadji, Analysis of thyroid transcription factor-1 and cytokeratin 20 separates merkel cell carcinoma from small cell carcinoma of lung. J Cutan Pathol 27, 118 (Mar, 2000).
294. X. Sastre-Garau et al., Merkel cell carcinoma of the skin: pathological and molecular evidence for a causative role of MCV in oncogenesis. J. Pathol. 218, 48 (May, 2009).
295. T. Nakamura et al., Nuclear localization of Merkel cell polyomavirus large T antigen in Merkel cell carcinoma. Virology 398, 273 (Mar 15, 2010).

224
296. H. C. Laude et al., Distinct merkel cell polyomavirus molecular features in tumour and non tumour specimens from patients with merkel cell carcinoma. PLoS Pathog 6, (2010).
297. R. Houben et al., An intact retinoblastoma protein-binding site in Merkel cell polyomavirus large T antigen is required for promoting growth of Merkel cell carcinoma cells. Int J Cancer, (Mar 16, 2011).
298. C. T. Wetzels et al., Ultrastructural proof of polyomavirus in Merkel cell carcinoma tumour cells and its absence in small cell carcinoma of the lung. PLoS One 4, e4958 (2009).
299. O. Jansen et al., Endovascular therapy of arteriovenous fistulae with electrolytically detachable coils. Neuroradiology 41, 951 (Dec, 1999).
300. M. P. Jansen et al., Morphologically normal, CD30-negative B-lymphocytes with chromosome aberrations in classical Hodgkin's disease: the progenitor cell of the malignant clone? J Pathol 189, 527 (Dec, 1999).
301. B. Jansen et al., Farnesylthiosalicylic acid inhibits the growth of human Merkel cell carcinoma in SCID mice. J Mol Med (Berl) 77, 792 (Nov, 1999).
302. H. Schlagbauer-Wadl et al., Bcl-2 antisense oligonucleotides (G3139) inhibit Merkel cell carcinoma growth in SCID mice. J Invest Dermatol 114, 725 (Apr, 2000).
303. J. H. Hooijberg et al., Antifolate resistance mediated by the multidrug resistance proteins MRP1 and MRP2. Cancer Res 59, 2532 (Jun 1, 1999).
304. M. Gerritsen, J. A. Jansen, J. A. Lutterman, Performance of subcutaneously implanted glucose sensors for continuous monitoring. Neth J Med 54, 167 (Apr, 1999).
305. R. M. Benbow, J. Zhao, D. D. Larson, On the nature of origins of DNA replication in eukaryotes. Bioessays 14, 661 (Oct, 1992).
306. C. N. Cole, S. D. Conzen, Polyomavirinae: the viruses and their replication, p.2141-2174. In D.M. Knipe and P.M. Howley (ed.), Fields Virology K. D. Field BN, Howley PM, Ed., (Lippincott-Raven Publishers, Piladelphia, PA, 2001), pp. 2141-2174.
307. D. Rio, A. Robbins, R. Myers, R. Tjian, Regulation of simian virus 40 early transcription in vitro by a purified tumor antigen. Proc. Natl. Acad. Sci. USA 77, 5706 (Oct, 1980).
308. K. Cowan, P. Tegtmeyer, D. D. Anthony, Relationship of replication and transcription of Simian Virus 40 DNA. Proc. Natl. Acad. Sci. USA 70, 1927 (Jul, 1973).
309. R. Tjian, T antigen binding and the control of SV40 gene expression. Cell 26, 1 (Oct, 1981).
310. R. M. Myers, D. C. Rio, A. K. Robbins, R. Tjian, SV40 gene expression is modulated by the cooperative binding of T antigen to DNA. Cell 25, 373 (Aug, 1981).
311. S. L. Spence, J. M. Pipas, Simian virus 40 large T antigen host range domain functions in virion assembly. J. Virol. 68, 4227 (Jul, 1994).
312. S. L. Spence, J. M. Pipas, SV40 large T antigen functions at two distinct steps in virion assembly. Virology 204, 200 (Oct, 1994).
313. E. Fanning, R. Knippers, Structure and function of simian virus 40 large tumor antigen. Annu. Rev. Biochem. 61, 55 (1992).
314. A. Srinivasan et al., The amino-terminal transforming region of simian virus 40 large T and small t antigens functions as a J domain. Mol. Cell. Biol. 17, 4761 (Aug, 1997).
315. N. Bouck, N. Beales, T. Shenk, P. Berg, G. di Mayorca, New region of the simian virus 40 genome required for efficient viral transformation. Proc. Natl. Acad. Sci. USA 75, 2473 (May, 1978).

225
316. W. C. Hahn et al., Enumeration of the simian virus 40 early region elements necessary for human cell transformation. Mol. Cell. Biol. 22, 2111 (Apr, 2002).
317. L. S. Chang, S. Pan, M. M. Pater, G. Di Mayorca, Differential requirement for SV40 early genes in immortalization and transformation of primary rat and human embryonic cells. Virology 146, 246 (Oct 30, 1985).
318. L. S. Chang, M. M. Pater, N. I. Hutchinson, G. di Mayorca, Transformation by purified early genes of simian virus 40. Virology 133, 341 (Mar, 1984).
319. A. Porras et al., A novel simian virus 40 early-region domain mediates transactivation of the cyclin A promoter by small-t antigen and is required for transformation in small-t antigen-dependent assays. J. Virol. 70, 6902 (Oct, 1996).
320. C. Prins, R. J. Frisque, JC virus T' proteins encoded by alternatively spliced early mRNAs enhance T antigen-mediated viral DNA replication in human cells. J. Neurovirol. 7, 250 (Jun, 2001).
321. S. Deb, A. L. DeLucia, A. Koff, S. Tsui, P. Tegtmeyer, The adenine-thymine domain of the simian virus 40 core origin directs DNA bending and coordinately regulates DNA replication. Mol. Cell. Biol. 6, 4578 (Dec, 1986).
322. G. Meinke et al., The crystal structure of the SV40 T-antigen origin binding domain in complex with DNA. PLoS Biol. 5, e23 (Feb, 2007).
323. D. Li et al., Structure of the replicative helicase of the oncoprotein SV40 large tumour antigen. Nature 423, 512 (May 29, 2003).
324. M. C. San Martin, C. Gruss, J. M. Carazo, Six molecules of SV40 large T antigen assemble in a propeller-shaped particle around a channel. J. Mol. Biol. 268, 15 (Apr 25, 1997).
325. G. Meinke, P. A. Bullock, A. Bohm, Crystal structure of the simian virus 40 large T-antigen origin-binding domain. J. Virol. 80, 4304 (May, 2006).
326. A. Kumar et al., Model for T-antigen-dependent melting of the simian virus 40 core origin based on studies of the interaction of the beta-hairpin with DNA. J. Virol. 81, 4808 (May, 2007).
327. H. Liu, Y. Shi, X. S. Chen, A. Warshel, Simulating the electrostatic guidance of the vectorial translocations in hexameric helicases and translocases. Proc. Natl. Acad. Sci. USA 106, 7449 (May 5, 2009).
328. X. Jiang et al., Structural mechanism of RPA loading on DNA during activation of a simple pre-replication complex. EMBO J. 25, 5516 (Nov 29, 2006).
329. M. Valle, X. S. Chen, L. E. Donate, E. Fanning, J. M. Carazo, Structural basis for the cooperative assembly of large T antigen on the origin of replication. J. Mol. Biol. 357, 1295 (Apr 7, 2006).
330. C. Prives et al., DNA sequence requirements for replication of polyomavirus DNA in vivo and in vitro. Mol. Cell. Biol. 7, 3694 (Oct, 1987).
331. A. Cowie, R. Kamen, Multiple binding sites for polyomavirus large T antigen within regulatory sequences of polyomavirus DNA. J. Virol. 52, 750 (Dec, 1984).
332. A. Cowie, R. Kamen, Guanine nucleotide contacts within viral DNA sequences bound by polyomavirus large T antigen. J. Virol. 57, 505 (Feb, 1986).
333. A. Scheller, C. Prives, Simian virus 40 and polyomavirus large tumor antigens have different requirements for high-affinity sequence-specific DNA binding. J. Virol. 54, 532 (May, 1985).

226
334. K. S. Campbell et al., DnaJ/hsp40 chaperone domain of SV40 large T antigen promotes efficient viral DNA replication. Genes Dev. 11, 1098 (May 1, 1997).
335. P. Emsley, K. Cowtan, Coot: model-building tools for molecular graphics. Acta Crystallogr. D Biol. Crystallogr. 60, 2126 (Dec, 2004).
336. J. A. Borowiec, J. Hurwitz, Localized melting and structural changes in the SV40 origin of replication induced by T-antigen. EMBO J. 7, 3149 (Oct, 1988).
337. Y. C. Peng, N. H. Acheson, Polyomavirus large T antigen binds cooperatively to its multiple binding sites in the viral origin of DNA replication. J. Virol. 72, 7330 (Sep, 1998).
338. S. J. Triezenberg, W. R. Folk, Essential nucleotides in the polyomavirus origin region. J. Virol. 51, 437 (Aug, 1984).
339. I. Weichselbraun, G. Haider, E. Wintersberger, Optimal replication of plasmids carrying polyomavirus origin regions requires two high-affinity binding sites for large T antigen. J. Virol. 63, 961 (Feb, 1989).
340. F. B. Dean et al., Simian virus 40 (SV40) DNA replication: SV40 large T antigen unwinds DNA containing the SV40 origin of replication. Proc. Natl. Acad. Sci. USA 84, 16 (Jan, 1987).
341. S. Deb et al., The T-antigen-binding domain of the simian virus 40 core origin of replication. J. Virol. 61, 2143 (Jul, 1987).
342. W. S. Joo et al., Purification of the simian virus 40 (SV40) T antigen DNA-binding domain and characterization of its interactions with the SV40 origin. J. Virol. 71, 3972 (May, 1997).
343. F. U. Hartl, Molecular chaperones in cellular protein folding. Nature 381, 571 (Jun 13, 1996).
344. E. T. Sawai, J. S. Butel, Association of a cellular heat shock protein with simian virus 40 large T antigen in transformed cells. J. Virol. 63, 3961 (Sep, 1989).
345. Q. Sheng et al., The DnaJ domain of polyomavirus large T antigen is required to regulate Rb family tumor suppressor function. J. Virol. 71, 9410 (Dec, 1997).
346. E. J. Enemark, G. Chen, D. E. Vaughn, A. Stenlund, L. Joshua-Tor, Crystal structure of the DNA binding domain of the replication initiation protein E1 from papillomavirus. Mol. Cell 6, 149 (Jul, 2000).
347. E. J. Enemark, A. Stenlund, L. Joshua-Tor, Crystal structures of two intermediates in the assembly of the papillomavirus replication initiation complex. EMBO J. 21, 1487 (Mar 15, 2002).
348. M. C. Chen, D. Redenius, F. Osati-Ashtiani, M. M. Fluck, Enhancer-mediated role for polyomavirus middle T/small T in DNA replication. J. Virol. 69, 326 (Jan, 1995).
349. C. Cicala et al., Simian virus 40 small-t antigen stimulates viral DNA replication in permissive monkey cells. J. Virol. 68, 3138 (May, 1994).
350. V. Janssens, J. Goris, Protein phosphatase 2A: a highly regulated family of serine/threonine phosphatases implicated in cell growth and signalling. Biochem. J. 353, 417 (Feb 1, 2001).
351. S. I. Yang et al., Control of protein phosphatase 2A by simian virus 40 small-t antigen. Mol. Cell. Biol. 11, 1988 (Apr, 1991).
352. C. Prives, The replication functions of SV40 T antigen are regulated by phosphorylation. Cell 61, 735 (Jun 1, 1990).

227
353. K. A. Whalen, R. de Jesus, J. A. Kean, B. S. Schaffhausen, Genetic analysis of the polyomavirus DnaJ domain. J. Virol. 79, 9982 (Aug, 2005).
354. J. S. Butel, Viral carcinogenesis: revelation of molecular mechanisms and etiology of human disease. Carcinogenesis 21, 405 (Mar, 2000).
355. M. E. McLaughlin-Drubin, K. Munger, Viruses associated with human cancer. Biochim Biophys Acta 1782, 127 (Mar, 2008).
356. D. Hanahan, R. A. Weinberg, Hallmarks of cancer: the next generation. Cell 144, 646 (Mar 4, 2011).
357. W. C. Hahn et al., Creation of human tumour cells with defined genetic elements. Nature 400, 464 (Jul 29, 1999).
358. S. E. Artandi, R. A. DePinho, Telomeres and telomerase in cancer. Carcinogenesis 31, 9 (Jan, 2010).
359. J. W. Shay, W. E. Wright, Ageing and cancer: the telomere and telomerase connection. Novartis Found Symp 235, 116 (2001).
360. J. A. DeCaprio, How the Rb tumor suppressor structure and function was revealed by the study of Adenovirus and SV40. Virology 384, 274 (Feb 20, 2009).
361. L. J. Hofseth, S. P. Hussain, C. C. Harris, p53: 25 years after its discovery. Trends Pharmacol Sci 25, 177 (Apr, 2004).
362. A. Dahiya, M. R. Gavin, R. X. Luo, D. C. Dean, Role of the LXCXE binding site in Rb function. Mol Cell Biol 20, 6799 (Sep, 2000).
363. H. M. Chan, L. Smith, N. B. La Thangue, Role of LXCXE motif-dependent interactions in the activity of the retinoblastoma protein. Oncogene 20, 6152 (Sep 27, 2001).
364. W. Lilyestrom, M. G. Klein, R. Zhang, A. Joachimiak, X. S. Chen, Crystal structure of SV40 large T-antigen bound to p53: interplay between a viral oncoprotein and a cellular tumor suppressor. Genes Dev 20, 2373 (Sep 1, 2006).
365. U. S. Cho et al., Structural basis of PP2A inhibition by small t antigen. PLoS Biol 5, e202 (Aug, 2007).
366. J. Li et al., Merkel Cell Polyomavirus Large T Antigen Disrupts Host Genomic Integrity and Inhibits Cellular Proliferation. J Virol, (Jun 12, 2013).
367. R. Arora et al., Survivin is a therapeutic target in Merkel cell carcinoma. Sci Transl Med 4, 133ra56 (May 9, 2012).
368. L. Busino, M. Chiesa, G. F. Draetta, M. Donzelli, Cdc25A phosphatase: combinatorial phosphorylation, ubiquitylation and proteolysis. Oncogene 23, 2050 (Mar 15, 2004).
369. R. Koyama-Nasu et al., The critical role of cyclin D2 in cell cycle progression and tumorigenicity of glioblastoma stem cells. Oncogene, (Sep 10, 2012).
370. C. Bolitho, M. A. Hahn, R. C. Baxter, D. J. Marsh, The chemokine CXCL1 induces proliferation in epithelial ovarian cancer cells by transactivation of the epidermal growth factor receptor. Endocr Relat Cancer 17, 929 (Dec, 2010).
371. Y. Itoh et al., IL-8 promotes cell proliferation and migration through metalloproteinase-cleavage proHB-EGF in human colon carcinoma cells. Cytokine 29, 275 (Mar 21, 2005).
372. A. Li, S. Dubey, M. L. Varney, B. J. Dave, R. K. Singh, IL-8 directly enhanced endothelial cell survival, proliferation, and matrix metalloproteinases production and regulated angiogenesis. J Immunol 170, 3369 (Mar 15, 2003).
373. M. Jovanovic, I. Stefanoska, L. Radojcic, L. Vicovac, Interleukin-8 (CXCL8) stimulates trophoblast cell migration and invasion by increasing levels of matrix metalloproteinase (MMP)2 and MMP9 and integrins alpha5 and beta1. Reproduction 139, 789 (Apr, 2010).

228
374. M. Y. Shiau et al., Human papillomavirus up-regulates MMP-2 and MMP-9 expression and activity by inducing interleukin-8 in lung adenocarcinomas. PLoS One 8, e54423 (2013).
375. R. Sears et al., Multiple Ras-dependent phosphorylation pathways regulate Myc protein stability. Genes Dev 14, 2501 (Oct 1, 2000).
376. V. K. Rajasekhar et al., Oncogenic Ras and Akt signaling contribute to glioblastoma formation by differential recruitment of existing mRNAs to polysomes. Mol Cell 12, 889 (Oct, 2003).
377. P. T. Wan et al., Mechanism of activation of the RAF-ERK signaling pathway by oncogenic mutations of B-RAF. Cell 116, 855 (Mar 19, 2004).
378. N. Hay, N. Sonenberg, Upstream and downstream of mTOR. Genes Dev 18, 1926 (Aug 15, 2004).
379. M. Luca et al., Expression of interleukin-8 by human melanoma cells up-regulates MMP-2 activity and increases tumor growth and metastasis. Am J Pathol 151, 1105 (Oct, 1997).
380. M. Kohli, T. J. Jorgensen, The influence of SV40 immortalization of human fibroblasts on p53-dependent radiation responses. Biochem Biophys Res Commun 257, 168 (Apr 2, 1999).
381. M. N. Ruesch, L. A. Laimins, Initiation of DNA synthesis by human papillomavirus E7 oncoproteins is resistant to p21-mediated inhibition of cyclin E-cdk2 activity. J Virol 71, 5570 (Jul, 1997).
382. T. Riley, E. Sontag, P. Chen, A. Levine, Transcriptional control of human p53-regulated genes. Nat Rev Mol Cell Biol 9, 402 (May, 2008).
383. J. A. Bernal, A. Hernandez, p53 stabilization can be uncoupled from its role in transcriptional activation by loss of PTTG1/securin. J Biochem 141, 737 (May, 2007).
384. J. A. Bernal et al., Human securin interacts with p53 and modulates p53-mediated transcriptional activity and apoptosis. Nat Genet 32, 306 (Oct, 2002).
385. S. P. Seguin et al., High-throughput screening identifies a bisphenol inhibitor of SV40 large T antigen ATPase activity. Journal of biomolecular screening 17, 194 (Feb, 2012).
386. A. Czarna et al., Robust generation of lead compounds for protein-protein interactions by computational and MCR chemistry: p53/Hdm2 antagonists. Angewandte Chemie 49, 5352 (Jul 19, 2010).
387. G. M. Popowicz et al., Structures of low molecular weight inhibitors bound to MDMX and MDM2 reveal new approaches for p53-MDMX/MDM2 antagonist drug discovery. Cell Cycle 9, 1104 (Mar 15, 2010).
388. R. Houben et al., Merkel cell polyomavirus-infected Merkel cell carcinoma cells require expression of viral T antigens. J Virol 84, 7064 (Jul, 2010).
389. T. Nakahara et al., YM155, a novel small-molecule survivin suppressant, induces regression of established human hormone-refractory prostate tumor xenografts. Cancer Res 67, 8014 (Sep 1, 2007).
390. M. W. Pfaffl, A new mathematical model for relative quantification in real-time RT-PCR. Nucleic Acids Res 29, e45 (May 1, 2001).
391. L. Zhao et al., Bayesian hierarchical changepoint methods in modeling the tumor growth profiles in xenograft experiments. Clinical cancer research : an official journal of the American Association for Cancer Research 17, 1057 (Mar 1, 2011).
392. K. Ohtani, J. DeGregori, J. R. Nevins, Regulation of the cyclin E gene by transcription factor E2F1. Proc Natl Acad Sci U S A 92, 12146 (Dec 19, 1995).

229
393. T. Iwasa et al., Marked anti-tumour activity of the combination of YM155, a novel survivin suppressant, and platinum-based drugs. British journal of cancer 103, 36 (Jun 29, 2010).
394. S. P. Tu et al., Suppression of survivin expression inhibits in vivo tumorigenicity and angiogenesis in gastric cancer. Cancer Res 63, 7724 (Nov 15, 2003).
395. D. J. Klionsky, A. M. Cuervo, P. O. Seglen, Methods for monitoring autophagy from yeast to human. Autophagy 3, 181 (May-Jun, 2007).
396. G. Sarek et al., Reactivation of the p53 pathway as a treatment modality for KSHV-induced lymphomas. J Clin Invest 117, 1019 (Apr, 2007).
397. C. E. Petre, S. H. Sin, D. P. Dittmer, Functional p53 signaling in Kaposi's sarcoma-associated herpesvirus lymphomas: implications for therapy. J Virol 81, 1912 (Feb, 2007).
398. H. Einsele, Bortezomib. Recent results in cancer research. Fortschritte der Krebsforschung. Progres dans les recherches sur le cancer 184, 173 (2010).
399. R. LeBlanc et al., Proteasome inhibitor PS-341 inhibits human myeloma cell growth in vivo and prolongs survival in a murine model. Cancer Res 62, 4996 (Sep 1, 2002).
400. T. Nakahara et al., Broad spectrum and potent antitumor activities of YM155, a novel small-molecule survivin suppressant, in a wide variety of human cancer cell lines and xenograft models. Cancer science 102, 614 (Mar, 2011).
401. G. Ambrosini, C. Adida, D. C. Altieri, A novel anti-apoptosis gene, survivin, expressed in cancer and lymphoma. Nature medicine 3, 917 (Aug, 1997).
402. H. Takeuchi, D. L. Morton, D. Elashoff, D. S. Hoon, Survivin expression by metastatic melanoma predicts poor disease outcome in patients receiving adjuvant polyvalent vaccine. Int J Cancer 117, 1032 (Dec 20, 2005).
403. J. Kim, J. M. McNiff, Nuclear expression of survivin portends a poor prognosis in Merkel cell carcinoma. Modern pathology : an official journal of the United States and Canadian Academy of Pathology, Inc 21, 764 (Jun, 2008).
404. S. Pina-Oviedo et al., Effects of JC virus infection on anti-apoptotic protein survivin in progressive multifocal leukoencephalopathy. Am J Pathol 170, 1291 (Apr, 2007).
405. Y. Jiang, H. I. Saavedra, M. P. Holloway, G. Leone, R. A. Altura, Aberrant regulation of survivin by the RB/E2F family of proteins. J Biol Chem 279, 40511 (Sep 24, 2004).
406. D. Raj, T. Liu, G. Samadashwily, F. Li, D. Grossman, Survivin repression by p53, Rb and E2F2 in normal human melanocytes. Carcinogenesis 29, 194 (Jan, 2008).
407. D. C. Altieri, Survivin in apoptosis control and cell cycle regulation in cancer. Prog Cell Cycle Res 5, 447 (2003).
408. R. Zhang et al., Survivin knockdown by short hairpin RNA abrogates the growth of human hepatocellular carcinoma xenografts in nude mice. Cancer gene therapy 17, 275 (Apr, 2010).
409. G. Kroemer, G. Marino, B. Levine, Autophagy and the integrated stress response. Molecular cell 40, 280 (Oct 22, 2010).
410. A. N. Santhanam et al., Role of 3'UTRs in the translation of mRNAs regulated by oncogenic eIF4E--a computational inference. PLoS One 4, e4868 (2009).
411. B. Lemos, P. Nghiem, Merkel cell carcinoma: more deaths but still no pathway to blame. J Invest Dermatol 127, 2100 (Sep, 2007).

230
412. S. T. Rosen et al., Establishment and characterization of a neuroendocrine skin carcinoma cell line. Laboratory investigation; a journal of technical methods and pathology 56, 302 (Mar, 1987).
413. L. D. Shultz et al., Human lymphoid and myeloid cell development in NOD/LtSz-scid IL2R gamma null mice engrafted with mobilized human hemopoietic stem cells. J Immunol 174, 6477 (May 15, 2005).
414. T. Y. Eng et al., A comprehensive review of the treatment of Merkel cell carcinoma. American journal of clinical oncology 30, 624 (Dec, 2007).
415. K. Yamanaka et al., Antitumor activity of YM155, a selective small-molecule survivin suppressant, alone and in combination with docetaxel in human malignant melanoma models. Clinical cancer research : an official journal of the American Association for Cancer Research 17, 5423 (Aug 15, 2011).
416. T. Satoh et al., Phase I study of YM155, a novel survivin suppressant, in patients with advanced solid tumors. Clinical cancer research : an official journal of the American Association for Cancer Research 15, 3872 (Jun 1, 2009).
417. T. Minematsu et al., Pharmacokinetics, distribution and excretion of YM155 monobromide, a novel small-molecule survivin suppressant, in male and pregnant or lactating female rats. Biopharmaceutics & drug disposition 33, 160 (Apr, 2012).