In-vehicle speed adaptation - Lund University Publications
70
In-vehicle speed adaptation - On the effectiveness of a voluntary system Hjälmdahl, Magnus 2004 Link to publication Citation for published version (APA): Hjälmdahl, M. (2004). In-vehicle speed adaptation - On the effectiveness of a voluntary system. Inger Myhrén, Lunds Tekniska Högskola, Institutionen för Teknik och Samhälle, Box 118, 221 00, Lund, Sverige,. Total number of authors: 1 General rights Unless other specific re-use rights are stated the following general rights apply: Copyright and moral rights for the publications made accessible in the public portal are retained by the authors and/or other copyright owners and it is a condition of accessing publications that users recognise and abide by the legal requirements associated with these rights. • Users may download and print one copy of any publication from the public portal for the purpose of private study or research. • You may not further distribute the material or use it for any profit-making activity or commercial gain • You may freely distribute the URL identifying the publication in the public portal Read more about Creative commons licenses: https://creativecommons.org/licenses/ Take down policy If you believe that this document breaches copyright please contact us providing details, and we will remove access to the work immediately and investigate your claim.
-
Upload
khangminh22 -
Category
Documents
-
view
0 -
download
0
Transcript of In-vehicle speed adaptation - Lund University Publications

LUND UNIVERSITY
PO Box 117221 00 Lund+46 46-222 00 00
In-vehicle speed adaptation - On the effectiveness of a voluntary system
Hjälmdahl, Magnus
2004
Link to publication
Citation for published version (APA):Hjälmdahl, M. (2004). In-vehicle speed adaptation - On the effectiveness of a voluntary system. Inger Myhrén,Lunds Tekniska Högskola, Institutionen för Teknik och Samhälle, Box 118, 221 00, Lund, Sverige,.
Total number of authors:1
General rightsUnless other specific re-use rights are stated the following general rights apply:Copyright and moral rights for the publications made accessible in the public portal are retained by the authorsand/or other copyright owners and it is a condition of accessing publications that users recognise and abide by thelegal requirements associated with these rights. • Users may download and print one copy of any publication from the public portal for the purpose of private studyor research. • You may not further distribute the material or use it for any profit-making activity or commercial gain • You may freely distribute the URL identifying the publication in the public portal
Read more about Creative commons licenses: https://creativecommons.org/licenses/Take down policyIf you believe that this document breaches copyright please contact us providing details, and we will removeaccess to the work immediately and investigate your claim.
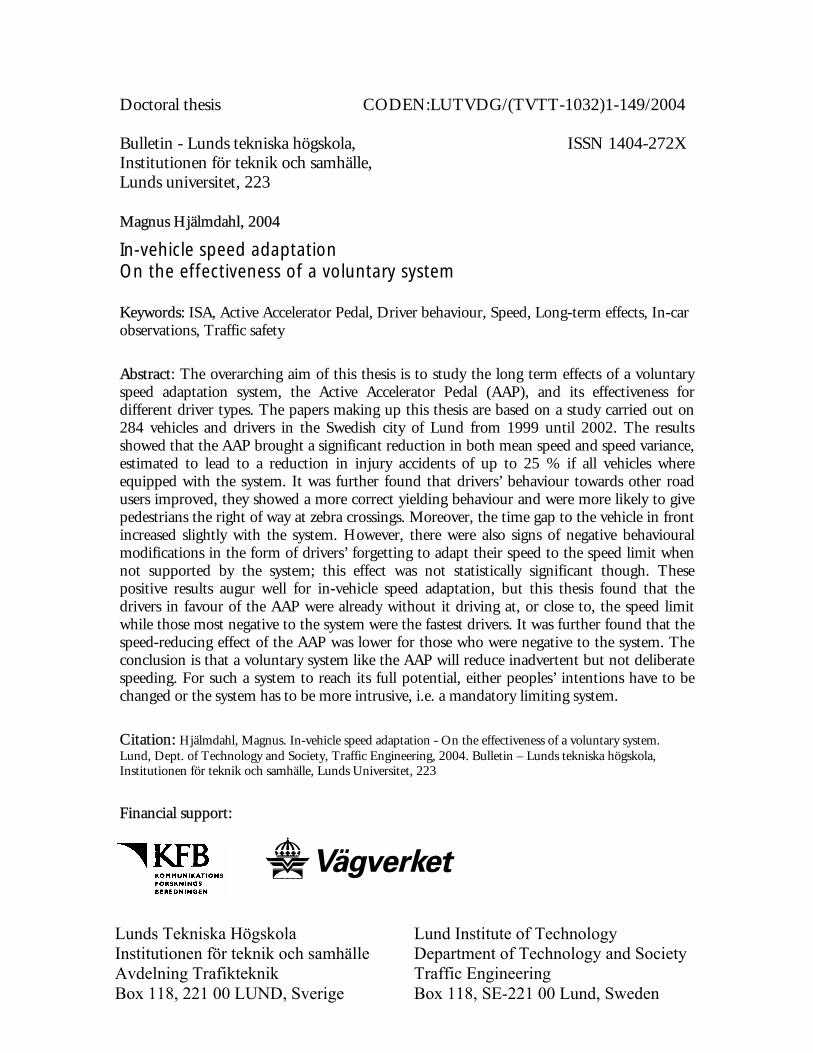
Doctoral thesis CODEN:LUTVDG/(TVTT-1032)1-149/2004 Bulletin - Lunds tekniska högskola, ISSN 1404-272X Institutionen för teknik och samhälle, Lunds universitet, 223 Magnus Hjälmdahl, 2004
In-vehicle speed adaptation On the effectiveness of a voluntary system Keywords: ISA, Active Accelerator Pedal, Driver behaviour, Speed, Long-term effects, In-car observations, Traffic safety
Abstract: The overarching aim of this thesis is to study the long term effects of a voluntary speed adaptation system, the Active Accelerator Pedal (AAP), and its effectiveness for different driver types. The papers making up this thesis are based on a study carried out on 284 vehicles and drivers in the Swedish city of Lund from 1999 until 2002. The results showed that the AAP brought a significant reduction in both mean speed and speed variance, estimated to lead to a reduction in injury accidents of up to 25 % if all vehicles where equipped with the system. It was further found that drivers’ behaviour towards other road users improved, they showed a more correct yielding behaviour and were more likely to give pedestrians the right of way at zebra crossings. Moreover, the time gap to the vehicle in front increased slightly with the system. However, there were also signs of negative behavioural modifications in the form of drivers’ forgetting to adapt their speed to the speed limit when not supported by the system; this effect was not statistically significant though. These positive results augur well for in-vehicle speed adaptation, but this thesis found that the drivers in favour of the AAP were already without it driving at, or close to, the speed limit while those most negative to the system were the fastest drivers. It was further found that the speed-reducing effect of the AAP was lower for those who were negative to the system. The conclusion is that a voluntary system like the AAP will reduce inadvertent but not deliberate speeding. For such a system to reach its full potential, either peoples’ intentions have to be changed or the system has to be more intrusive, i.e. a mandatory limiting system.
Citation: Hjälmdahl, Magnus. In-vehicle speed adaptation - On the effectiveness of a voluntary system. Lund, Dept. of Technology and Society, Traffic Engineering, 2004. Bulletin – Lunds tekniska högskola, Institutionen för teknik och samhälle, Lunds Universitet, 223
Financial support:
Lunds Tekniska Högskola Institutionen för teknik och samhälle Avdelning Trafikteknik Box 118, 221 00 LUND, Sverige
Lund Institute of Technology Department of Technology and Society Traffic Engineering Box 118, SE-221 00 Lund, Sweden

© Magnus Hjälmdahl, 2004
ISBN 91-628-6042-9
Printed by KFS i Lund AB, Sweden 2004

In-vehicle speed adaptation On the effectiveness of a voluntary system
Magnus Hjälmdahl
2004

iv
ACKNOWLEDGEMENTS
To my supervisors
Assoc. Prof. András Várhelyi
Thank you for taking me under your wing, even though you were only eavesdropping when Mohsen was “hiring”. Impressively, you did so without asking the obligatory question about whether I knew how to solder or not. As it turned out I did. Throughout the years you have been an exemplary supervisor, not only with regard to academic supervision, but also in having confidence in me and letting me participate in project meetings, conferences and workshops, allowing me to network with our national and international colleagues. But, most important of all; it has been fun.
Prof. Christer Hydén
You have always been a pillar of support throughout my work and we have had some rather erudite discussions throughout the years; be at supervisor meetings, over a bottle of Canadian whiskey or two in your office in the middle of the night or roaming the streets of Amsterdam looking for our hotel (again in the middle of the night). Speaking of Amsterdam and conferences; as my business-cards will bear the logotype of VTI from now on, you might consider bringing your own in future.
To the participants in the concluding seminar
Dr. Åse Svensson, Prof. Lars Åberg, Prof. Oliver Carsten and Dr Tom Heijer
Thank you for your valuable input and advice on my thesis and special thanks to you Lars for reading the thesis not once, but twice.
To the fellowship of the AAP
Assoc. Prof. András Várhelyi, Prof. Christer Hydén, Emeli Falk, Hossein Ashouri, Dr. Magda Draskóczy, Päivi Elmkvist & Assoc. Prof Ralf Risser
The project which made this thesis possible was unique in many ways, one being that it allowed for a project team of such excellence to be put together. On a regular basis this team had half-day meetings to discuss theories,

v
hypotheses, methodology, validity, reliability and budgets. For a PhD student it was an excellent way of learning how good research is carried out.
To the lunch crew
You know who you are and what you have done; let’s see if I can bring the concept of having luxury lunches once a week to VTI. And, by the way, they do have MAX in Linköping but there’s no faculty club.
To my friends and family
Yehejj, schools out. I did pass my thirtieth birthday before I finished, as you have pointed out on several occasions. But, I hope I have finally convinced you about the importance of keeping the speed-limits. If not, that is always something we can discuss (over and over again).
To my linguist
Jaya Reddy
Thank you for your effort; on some papers I think you wrote more than me. But, at least I now know the difference between where and were, and that various words have different meanings and not the other way around. Or is it vice versa?
To Annika
Five years of commuting is finally over; now we can use the weekends to travel together instead.
Magnus Hjälmdahl
Lund and Linköping, March 2004

vi

vii
Table of contents LIST OF PUBLICATIONS _____________________________________________ IX
ABBREVIATIONS AND DEFINITIONS _________________________________ XI
1. INTRODUCTION _________________________________________________ 11.1. SETTING THE SCENE _______________________________________________ 11.2. SPEED AND RISK__________________________________________________ 21.3. THE SPEEDING DRIVER _____________________________________________ 51.4. MEANS TO IMPROVE SPEED BEHAVIOUR________________________________ 7
1.4.1. Traditional measures_________________________________________ 81.4.2. In-vehicle measures _________________________________________ 10
2. AIM____________________________________________________________ 16
2.1. HYPOTHESES ___________________________________________________ 16
3. METHOD_______________________________________________________ 19
3.1. STUDY DESIGN __________________________________________________ 193.2. TEST DRIVER SELECTION __________________________________________ 203.3. APPARATUS ____________________________________________________ 213.4. TEST AREA _____________________________________________________ 233.5. OBSERVATIONAL AND ANALYTICAL METHODS _________________________ 24
3.5.1. Speed analysis _____________________________________________ 243.5.2. Behavioural observations ____________________________________ 243.5.3. Attitude surveys ____________________________________________ 253.5.4. Safety estimations __________________________________________ 263.5.5. Emission modelling _________________________________________ 273.5.6. Time consumption __________________________________________ 27
4. RESULTS_______________________________________________________ 284.1. EFFECTS ON BEHAVIOUR __________________________________________ 28
4.1.1. Speed behaviour ___________________________________________ 284.1.2. Behaviour in interactions ____________________________________ 344.1.3. Behavioural adaptation ______________________________________ 35
4.2. SAFETY EFFECT _________________________________________________ 364.3. EMISSIONS _____________________________________________________ 374.4. TIME CONSUMPTION______________________________________________ 37
5. DISCUSSION____________________________________________________ 385.1. POLICY AND RECOMMENDATIONS ___________________________________ 445.2. FINAL REMARKS_________________________________________________ 48
REFERENCES _______________________________________________________ 50

viii

ix
LIST OF PUBLICATIONS
This thesis is based on the following publications, referred to by their roman numerals: I. Hjälmdahl, M., Almqvist, S., Várhelyi, A. (2002) Speed regulation by
in-car active accelerator pedal – Effects on speed and speed distribution, IATSS Research Vol. 26, No. 2, pp 60-67.
II. Hjälmdahl, M., Várhelyi, A. (2004) Validation of in-car observations, a method for driver assessment, Transportation Research Part A, Vol 38, no 2, pp127-142.
III. Hjälmdahl, M., Várhelyi, A. (2004) Speed regulation by in-car active accelerator pedal – Effects on driver behaviour, Transportation Research Part F, In press.
IV. Várhelyi, A., Hjälmdahl, M., Hydén, C., Draskóczy, M. (2004) Effects of an active accelerator pedal on driver behaviour and traffic safety after long-term use in urban areas, Accident Analysis and Prevention, In press.
V. Hjälmdahl, M. (2004) Who needs ISA anyway? - An ISA system’s safety effectiveness for different driver types, Submitted for publication.

x

xi
ABBREVIATIONS AND DEFINITIONS
AAP Active Accelerator Pedal
Beep One of the ISA systems used in SNRA’s Large Scale Trial informed speeding drivers via a beep signal and a flashing light: In Swedish it is called “Pip o Blink”, here translated to Beep
DBQ Driver Behaviour Questionnaire
DETR Department of the Environment, Transport and the Regions
EC European Commission
EVSC External Vehicle Speed Control
ETSC European Transport Safety Council
GNP Gross National Product
HMI Human Machine Interface
ISA Intelligent Speed Adaptation
Large Scale Trial A research and demonstration trial with over 4 000 vehicles equipped with various ISA systems. The trial was carried out in four cities in Sweden between 1999 and 2002
NHTSA National Highway Traffic Safety Administration
SNRA Swedish National Road Administration
SIKA Statens institut för kommunikationsanalys (Swedish Institute for Transport and Communications Analysis)
TPB Theory of Planned Behaviour
WHO World Health Organisation

xii
1
1. INTRODUCTION
1.1. Setting the scene Road trauma is today considered one of the world’s major health problems; according to the World Health Organisation (WHO, 2003) road traffic injuries rank second to HIV/AIDS as the leading cause of ill health and premature death of adult men aged 15-44 years, world-wide. In the US more pre-retirement years of life are lost due to traffic crashes than the two leading diseases, cancer and heart disease (Evans, 1991). In Sweden, 532 people were killed in road accidents in 2002 (Vägverket, 2003a) and on European roads there are 1 300 000 injury accidents annually in which 40 000 people are killed (European Commission, 2003a). The costs of road trauma for the society are of significant proportions and are estimated to be 1 – 2 percent of GNP, depending on whether the cost for lost quality of life is included or not (Elvik, 2000). In the European Union this cost is estimated at 160 billion Euros or 2 percent of GNP annually (European Commission, 2003b). There is no doubt that road trauma is a severe burden on our society, and even though a lot has been done to improve the situation there is still much to do.
The last few decades have seen an improvement in traffic safety in Sweden with a concomitant significant reduction in fatal accidents. In 1972, 1 194 people were killed in traffic in Sweden compared to 532 in 2002. A comparison of killed per 100 000 vehicles shows an even more positive development; 45.6 killed per 100 000 vehicles in 1972 compared to 11.9 in 2002 and 14.7 per 100 000 inhabitants in 1972 compared to 6.0 in 2002 (Vägverket, 2003a). This improvement can be attributed to safer roads, safer vehicles and improved driver education; over the last couple of years, however, the positive trend has stagnated somewhat (Nilsson et al., 2002; SIKA, 2003). Nilsson et al. (2002) analysed traffic accidents in Sweden over the period 1994 – 2000 and found that, controlling for confounding factors such as increased traffic, aging driver population and legislative changes, the number of killed were about the same at the end of the period as at the beginning. They conclude that factors contributing to more fatal accidents are: increased speeds; increased traffic, especially heavy vehicles and the increased age of the driver population. These have been compensated for by factors reducing the number of killed in traffic, e.g.: the increased frequency of airbags; traffic safety measures such as motorways, roundabouts and barriers; increased fuel price and the law making the use of winter tyres obligatory.
To be able to reach the target of the Swedish road safety program, called “Vision Zero”, which sets the long-term goal that nobody should be killed or

2
seriously injured in traffic in Sweden (Vägverket, 2004), further improvements have to be made. Improvements of infrastructure such as the central barriers on rural roads currently being installed in Sweden and in some other countries, have the potential to reduce accidents and improved infrastructure and improved crash protection on modern vehicles, including pedestrian crash protection, can reduce the casualties in urban areas. An increased use of seat belts also has the potential to reduce the number of casualties both in urban and rural areas. But these measures are not enough to reach the target and are only effective at moderate speeds. For a pedestrian to have a fair chance of surviving a collision with a car the collision speed should not exceed 30 kph, and for a car passenger (in a modern car) to survive a collision the speeds should not exceed 70 kph in head-on collisions and 50 in side impact collisions (Vägverket, 2003b).
The improvements in road safety so far can, to a large extent, be attributed to road and vehicle improvement, but to be able to reach the long term goal of “Vision Zero” more effort has to be put into improving driver behaviour and adapting the traffic system to the driver and his limitations. For instance, vehicle speeds and the speed limits must be better adapted to the situation and the actual risk.
1.2. Speed and risk There are many factors contributing to why an accident occurs and what its outcome is. Analyses of traffic crashes indicate that human actions are the sole or contributory factor in 90-95 percent of all traffic crashes Rumar (1986). This is confirmed in DETR (2000) where it is concluded that driver-error is a contributory factor in 90 percent of the accidents. An example of driver-error is driving too fast, which is an error in judging what is safe. In an in-depth study of accidents over four years in the city of Växjö, Carlquist et al. (1988) identified the critical behaviour that led to these accidents. They found that too high speed in relation to the environmental and interactional demands accounted for 21 percent of the accidents. They further found that too small headway accounted for 5 percent and erroneous yielding behaviour for 26 percent of the accidents. A study by Risser and Chaloupka (1996) ranked the most common accident causes and erroneous behaviour leading to accidents. The most important factor was “inappropriate speed and driving only slightly over the speed limit (but not so much driving extremely over the speed limit)” followed by “inappropriate keeping of safe headways”, “faulty overtaking out-of-town (mainly on rural roads)”, “right of way infringements” and “driving under the influence of alcohol”. Risser (1997) found a relationship between police-reported accidents and observed behavioural variables such as too short

3
headway to vehicle in front, late lane changes and exceeding the speed limit. The relationship was established both for individuals and for sections of road. A meta analysis (Elvik et al., 1997) of studies investigating the effects of increased and reduced speed limits on accidents concludes that there is a clear and well documented relation between the two, and that small changes in average speed have a large effect on accidents. They also conclude that fatal and severe injury accidents are affected to a higher degree than material and slight injury accidents. Pyne (1997), in a review of the literature on the correlation between speed and accidents also established the relation between the two and that the outcome of an accident is worsened by an increase in speed. From a survey of 800 English car drivers (Stradling et al., 1999) we learn that one in three of those drivers who had been penalised for speeding in the previous three years had also been involved in an accident as a driver in the same period. A study on the effects of the increase of speed limits from 55 mph to 65 mph on the motorways in Washington State shows that the incidence of fatal crashes more than doubled compared with what would have been expected without the increase of speed limits (Ossiander et al. 2002).
There are various models describing what the relationship between speed and accidents looks like, for instance Salusjärvi found (1981) that there was a linear relationship between change in average speed and the number of accidents. Finch et al. (1994) looked at the effects of increases or decreases in average speed on accidents on different roads in various countries. They found that for every 1 mph change in average speed there was an associated change of 5-9 percent in accidents. In Nilsson (2004) a model for estimating the effects of changes in mean speed on traffic safety is presented. According to the model a change in the injury accident rate is equal to the square of the change in mean speed, a change in fatal and serious injury accident rate is equal to the change in mean speed to the power of three and for fatal accidents it is the change in mean speed to the power of four.
These models have been shown to be robust as general predictors of the outcome when the mean speed is changed; for instance, when the speed limit on American motorways increased from 55 mph to 65, mph it was found that the number of accidents increased in accordance with the Nilsson model (NHTSA, 1998). More recent studies have shown a more detailed picture where the effect a decrease of 1 mph will have on accidents can be separated for different roads. It shows that the effect is largest, about 6 percent, on urban main roads and residential roads with low average speeds, about 4 percent for medium speed urban roads and lower speed rural main roads and about 3 percent for the higher speed urban roads and rural single carriageway main roads (DETR, 2000). In relation to the above findings it is worth mentioning

4
that empirical studies have shown that for every 20 kph reduction of the speed limit the average speed is reduced by 4-6 kph (Vägverket, 2000). Finch et al. (1994) came to a similar conclusion when they established that changing the speed limit from 40 mph to 30 mph tended to reduce speed by 2.5 mph.
The above findings show that there is a clear relationship between mean speed and accidents but there is also evidence that shows that variance in speed will have an effect as well. Finch et al. (1994) showed that there is a U-shaped relationship between speed variance and accidents, that is, the more your own speed differs from the mean speed the higher is your risk of being involved in an accident. More recent studies however have shown that it is especially those who drive faster than the mean speed that faces an increased risk. Figure 1 below shows, from Maycock et al. (1998) and Quimby et al. (1999), that drivers who habitually travel faster than the average speed are involved in more accidents in a year’s driving. The graph clearly shows that to improve safety there is a lot to gain if the fastest drivers are targeted with speed-reducing measures.
Figure 1 The relative risk of an accident depending on driving speed in relation to mean traffic speed (From DETR, 2000).

5
Based on the above selection of studies reviewing the relation between speed and accidents, and especially considering Pyne’s (1997) and Elvik et al.’s (1997) comprehensive literature studies, it can be confirmed that speed is a major factor contributing to accidents and that by reducing speeds, especially the highest speeds, considerable safety improvements can be achieved.
The benefits of high speeds, because there are benefits as well, are primarily reduced time consumption and joy of driving. There are studies showing a positive effect on safety of an increase in speeds as well, for instance Lave & Elias (1994) argued that an increase of the speed limit from 55 mph to 65 mph in the US actually reduced the number of fatal accidents. This positive effect was primarily achieved by traffic moving from slower and less safe rural roads to the faster high-standard motorways. There is no evidence, however, that increased speed, without any other changes, leads to improved safety.
1.3. The speeding driver There are a number of studies which have looked into the characteristics of the speeding driver. Fildes et al. (1991) measured the speeds of passing vehicles and thereafter stopped and interviewed the drivers. They found that there was a strong correlation between speeds and individual characteristics such as age, annual mileage, attitude to speed and perception of what a safe speed is, accident involvement, type and age of vehicle plus route-specific variables such as purpose of trip and number of passengers. The most important variables that described the fastest 15 percent of the drivers on rural roads were: young drivers (less than 34 years of age) with high accident involvement, drivers who perceived high speeds as safe, male drivers who travelled long distances (not commuters), drivers of vehicles without trailers and drivers of vehicles which are company owned with no passengers and are driving long distances on business every week. The equivalent variables for urban roads were: young drivers (less than 34 years of age) with high accident involvement, drivers who perceived high speeds as safe, drivers in vehicles less than five years old and business travellers who drive long distances every week. Drivers who were among the slowest 15 percent of the drivers often represented the direct opposite of one or several of the groups above.
Kaufmann (2002) came to a similar result when studying drivers and their behaviour on an Austrian motorway. He found that younger drivers, male drivers and drivers of big cars exceeded the speed limit to a higher extent than their counterparts. He also found that speeding drivers, to a higher extent, showed negative driving behaviour apart from speeding, such as too short headway, overtaking on the inside and speaking on their cell phones more than other drivers. This confirmed findings by Stradling (1999) who found that
6
drivers scoring high as “violators” on the Manchester Driver Behaviour Questionnaire1 were likely to speed and violate other traffic rules such as close following, red-light running, getting angry with other drivers and drinking and driving.
Webster and Wells (2000) studied the characteristics of speeders and could confirm the findings above; that is, young drivers, male drivers, company car drivers, drivers of large cars and high mileage drivers exceed the speed limit to a greater extent than their counterparts.
To change drivers’ “intended” speed behaviour one has to have a clear understanding of the underlying reasons for speeding. Näätänen and Summala (1976) argued that drivers have other motives for driving than just to travel safely from A to B. Examples are pressure of time, norms, “showing off”, and desire to take risks. Rothengatter (1990) established four factors which determined the speed of a driver: joy of driving, risk, travel time and travel cost. Fast drivers’ and slow drivers’ values differed significantly for all four factors; fast drivers thought that the joy of driving increased when one drove faster than the speed limit and that it was not associated with any risk. They also valued the importance of time higher and the driving cost lower than the slow drivers.
An analysis of the risk of an accident for these groups shows that there is a correlation between fast driver groups and driver groups with a high risk. For car drivers men have a 2.2 times higher relative risk of being killed in traffic (adjusted for exposure) than women. For young drivers of both genders at the ages of 18 to 19 and 20 to 24 the relative risk is 4.4 and 3.4 times higher respectively, than for drivers aged 35-44 years (SIKA, 2003).
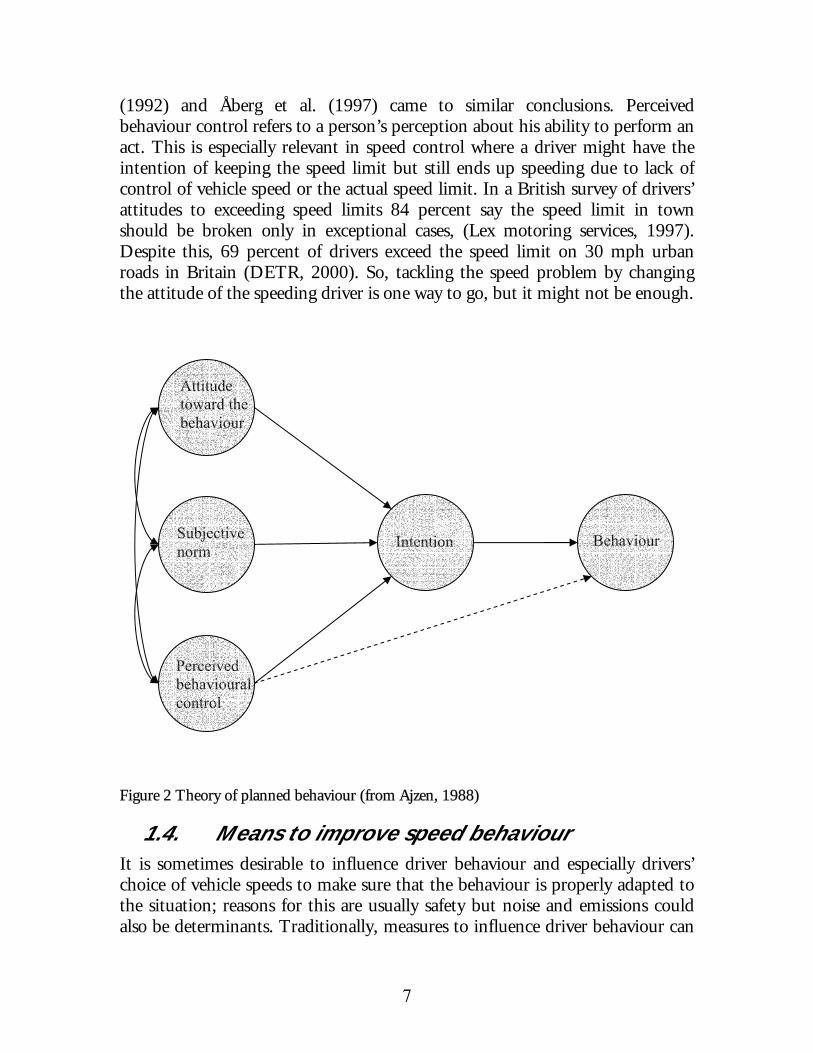
So why do we take risks and behave in a way that is bad for us? A generally accepted theory that explains why we behave in a certain way is the Theory of Planned Behaviour (TPB) (Ajzen, 1988). According to the theory, the way we behave is determined by our intention to do so and this is postulated by three conceptually independent determinants: the attitude towards the behaviour, the subjective norm and the perceived behaviour control (see Figure 2). An example of attitude to the behaviour can be how risky we deem it to be to drive fast. The subjective norm describes the perception of other peoples’ beliefs. With regard to traffic behaviour, Haglund and Åberg (2000) found that the behaviour of other road users played an important role in establishing the subjective norm, that is, we try to follow the rhythm and keep up with other drivers. Zaidel 1 The Manchester Driver Behaviour Questionnaire is a self completion questionnaire where three types of aberrant driver behaviour have been identified. These are lapses, errors and violations; accident liability can be predicted by the tendency to commit violations but not by the tendency to make errors and lapses (Parker et al., 1998).
7
(1992) and Åberg et al. (1997) came to similar conclusions. Perceived behaviour control refers to a person’s perception about his ability to perform an act. This is especially relevant in speed control where a driver might have the intention of keeping the speed limit but still ends up speeding due to lack of control of vehicle speed or the actual speed limit. In a British survey of drivers’ attitudes to exceeding speed limits 84 percent say the speed limit in town should be broken only in exceptional cases, (Lex motoring services, 1997). Despite this, 69 percent of drivers exceed the speed limit on 30 mph urban roads in Britain (DETR, 2000). So, tackling the speed problem by changing the attitude of the speeding driver is one way to go, but it might not be enough.
Figure 2 Theory of planned behaviour (from Ajzen, 1988)
1.4. Means to improve speed behaviour It is sometimes desirable to influence driver behaviour and especially drivers’ choice of vehicle speeds to make sure that the behaviour is properly adapted to the situation; reasons for this are usually safety but noise and emissions could also be determinants. Traditionally, measures to influence driver behaviour can
Attitude toward the behaviour
Perceived behavioural control
Subjective norm Intention Behaviour
8
take the form of education / campaigns, enforcement and engineering measures. Technological progress now makes it possible to add in-vehicle measures to the above list.
1.4.1. Traditional measures
A change in behaviour can be achieved by changing drivers’ attitudes (according to TPB) and attitudes can be changed by information, education, campaigns etc. Carstensen (2002) found that an improved driver education reduced accident involvement for novice drivers. Information and campaigns has also led to reductions in speed and drink driving, especially in conjunction with increased enforcement. Delaney, Lough et al. (2003) reviewed mass media campaigns’ effects on traffic safety and concluded that a decrease in accidents of up to 8.5 percent could be expected. The problem with campaigns is that their effect rapidly decreases when the campaign is over (Liban et al., 1987); therefore the campaigns have to be repeated to be efficient over time at the risk that their messages become worn out. In Elvik et al. (1997) a meta analysis of campaigns is presented and it shows that the more specific the topic of the campaign, the larger the effect. Non-recurrent acts such as putting on the safety belt or “don’t drink and drive” campaigns are easier to affect by campaigns than behaviour that is ongoing over longer periods of time, such as speeding.
Police enforcement is one of the most effective ways to reduce speeds, see for instance Armour (1984). For police enforcement to be effective in reducing speeds the drivers must be aware of the police presence. This has led to police enforcement often being combined with information in the media about where and when the speed control will take place. The latest weapon against speeders is speed cameras and they have shown great potential in reducing accidents. In New Zeeland, for instance, hidden speed cameras led to significant reductions in speed as well as in accidents and number of casualties (Keall & Povey, 2002). They also found a spill over effect to nearby roads that did not have speed cameras. Elvik, et al. (1997) establish in a meta analysis, that the reduction in accidents from implementing automatic speed control is as high as 19 percent for all accidents and 17 percent for injury accidents. There are, however, tendencies for drivers to learn where the cameras are situated and reduce their speed when passing, only to speed up again afterwards. So, to be efficient, cameras have to be implemented on a large scale. Traditionally, speed cameras are installed on rural roads, and even though there are experiments on urban arterials they are generally considered as a solution for the rural speed problem. Another disadvantage is that the cost of enforcement is relatively high, but even if the funds for increasing the level of enforcement become available, there is evidence suggesting that the reduction in speed will not be long-lasting (absence

9
of time-halo). There is also evidence of drivers speeding up again after passing the enforcement site (absence of distance-halo) (Comte et al., 1997).
Engineering measures in the road environment such as road humps, roundabouts, chicanes, road narrowing etc. have been used to control vehicle speeds since the seventies when Watts (1973) tested various types of raised humps and studied their effect on speed and comfort. Towliat (2001) studied a specially designed hump, “speed cushion”, which had the purpose of reducing the speed of all cars but without the discomfort for buses caused by normal humps. He found that speeds at the intersection points, where the speed cushion was implemented, were reduced significantly and that the number and severity of conflicts were also reduced. He also found that, due to the lower vehicle speed, interaction between drivers and unprotected road users was improved; drivers were more willing to give way at crossings. In a meta analysis on the effect of speed humps Elvik et al. (1997) established that they reduced the number of injury accidents by up to 50 %. Hydén and Várhelyi (2000) studied the large scale use of roundabouts and they too found that speed was reduced at interaction points (junctions) and that this in turn led to a reduction in average expected injury accidents and increased road user interaction. Most of the established physical measures are analysed in Elvik et al. (1997) and as a summary one can conclude that they have a clear speed-reducing effect, which in turn has led to a reduction in accidents (especially serious accidents) and improved communication with other road users. The disadvantages of physical measures are that their effect is only local. Elvik (1997) argues that even though the number of accidents are reduced at the treated spot, they will increase on surrounding spots instead, due to a phenomenon called accident migration, and that if confounding factors like accident migration and regression to mean are considered, the net outcome will often be less beneficial. In conclusion, physical measures have a well established local speed-reducing effect, but with possible negative or positive side effects. Their major disadvantage is that to be efficient area-wide an unreasonably high number of measures have to be implemented over the entire area. Further, they have a very low acceptance among drivers and especially among bus drivers, drivers of heavy vehicles and other professional drivers (Falk et al., 2002; Eklund, 2002; Towliat, 2001). One major disadvantage of physical measures is that they are best applied where a low speed is desired, for instance reducing speeds at intersections and crossings where the target speed is 30 kph or less. On arterial roads, which from a safety point of view constitute one of the major problem areas (ETSC, 1999), physical measures are often difficult to implement due to conflicting interests between capacity and safety and special needs for heavy traffic.
10
1.4.2. In-vehicle measures
In-vehicle systems for speed adaptation/influence in various forms have been studied for over twenty years, and the HMI solutions have differed over the years as has the terminology describing the various systems. A consensus of the terminology for the various systems has, however, developed over the last couple of years, mainly due to cooperation in European projects and international exchange between researchers within this field. The systems are commonly known as ISA (Intelligent Speed Adaptation) and three main types of ISA systems can be separated and identified by their level of influence on the driver. Carsten and Fowkes (2000) define the three types of systems as advisory (in-vehicle information on the current speed limit), advisory intervention (information is given to the driver by haptic or audible means when the speed limit is exceeded) and mandatory intervention (the speed of the vehicle is physically limited to the speed limit). In addition, Carsten and Fowkes (2000) differ between speed limit systems: fixed system where the speed limit is set to the legal maximum speed for each stretch of road, variable system in which local speed limits may be set to account for poor road geometry and the like, and a dynamic system where the legal maximum speed can be changed to account for changing road surface, weather and visibility. An estimation of the safety effect of ISA systems varies from a 10 percent reduction of injury accidents for an advisory intervention system, up to 40 percent for a limiting system that limits the speed dynamically (Várhelyi 1996; Carsten and Comte, 1997; Carsten and Fowkes, 2000).
The first study ever carried out with an in-vehicle speed adaptation system was by Saad and Malaterre (1982) in France, when they had test persons drive a vehicle where they themselves could set the maximum speed of the vehicle. This speed could not be exceeded unless the driver actively released the equipment. The findings in this study were that the drivers usually set the maximum speed limit significantly above the legal speed limit so they could adapt to the traffic flow. On faster roads, where they could choose speed more freely, the difference between their set speed and the speed limit was reduced. The drivers felt the system was too effective and that their freedom to manoeuvre was limited.
The first field study in Sweden was carried out in Lund in 1992 with 75 drivers chosen from the public (Persson et al., 1993). The system consisted of a mandatory speed limiter which was switched on/off manually by an observer in the car. The results showed that mean speed decreased on links by between 2% and 8% with the speed limiter. However, there was a slight tendency to compensate for this by driving faster (by 2-3 kph) through the junctions. There was an increase of the proportion of drivers who kept a correct distance to the

11
car ahead. On the other hand, there was a slight increase of incorrect behaviour towards other road-users at junctions. Most of the drivers generally displayed positive attitudes to the speed limiter, but did sometimes experience feelings of impatience. The most often mentioned advantage for drivers was smoother rhythm in traffic and better awareness of unprotected road-users. The most commonly mentioned disadvantage was not having the acceleration to occasionally exceed speed limits.
In another Swedish field trial, the effects of continuous information on the current speed limit, via a speed limit sign below the speedometer on the dashboard, were investigated (Nilsson and Berlin, 1992). The results showed that the average speed was 72 kph with the system and 70 kph without the system, statistically non-significant, but certainly an increase. Speed-limit compliance in a 30 kph school zone was slightly better without the system. The number of glances at the dashboard was on average 3 times higher while driving with the display as compared to driving without it. It was concluded that the system was ineffective and might increase accident risk by distracting the driver and increasing speeds.
Carstensen and Christiansen (1993) found in a questionnaire survey that 36 percent of the respondents were in favour of a speed-limiting system they were free to turn off themselves but the more controlling the system the lower the acceptance, see Table 1. They also found that acceptance of the systems varies for different groups of drivers, for instance women are more in favour of the systems than men.
Table 1 Acceptance of speed limiting systems (from Carstensen and Christiansen, 1993)
Self-operated on/off Allows excess over short periods
Impossible to exceed the speed limit
Yes 36% 32% 22% No 59% 64% 74% Uncertain 5% 4% 4%
In 1992, the effects of information on the actual speed limit, the presence of pedestrians, sharp curves, road works and speed recommendations continuously displayed for the driver were studied (Almqvist and Towliat 1993). The results showed that violations of the speed limits were still frequent when driving with the system.
In a field trial in 1996, 25 passenger cars were equipped with speed limiters for a period of 2 months in a small Swedish town, Eslöv (Almqvist and Nygård 1997). All approach roads to the town were equipped with radio transmitters (on the 50 kph speed limit signs), which activated the speed limiters of

12
approaching cars and deactivated the speed limiters of those leaving the town. Most of the drivers considered the speed limiter function more positive than they had expected before the field trial. Three of four drivers stated that the limiter induced smoother driving and generally lower speeds. More than half thought that driving became more comfortable with the system. In the before situation (without speed limiter) the speed level was often over the speed limit, while in the after situation the limit could not be exceeded. Observations of driver behaviour indicated improved interactions with other road-users, such as improved stopping for pedestrians.
At the same time, a trial with an “Electronic Speed Checker” in 92 vehicles for a period of nine months was conducted in Umeå in 1996 (Marell and Westin, 1999). The system warned the driver with sound and a flashing light when he/she exceeded the speed limit. The results indicated a high acceptance level. The drivers perceived that they had both become more aware of traffic regulations and behaved in accordance with safety regulations. No speed measurements were carried out however.
In 1996, theoretical work on the concept of dynamic speed adaptation was carried out (Várhelyi, 1996). A system for dynamic speed adaptation in adverse conditions, such as wet/slippery roads, decreased visibility, darkness and sharp curves was proposed. Such a system would, in addition to automatically limiting the speed of the car to the speed limits, also reduce speed in hazardous situations. The safety effect of the proposed system was estimated by comparing actual speeds with the maximum allowed speed with the system. He found that the system would result in a 19% - 42% reduction of injury accidents in Sweden. In his thesis Várhelyi (1996) also found, in a nation-wide survey among Swedish driving licence holders, that the majority of the respondents (60%) were in favour of a device which automatically lowered the maximum possible speed of the car in slippery conditions and poor visibility, while a general speed limiter which prevented exceeding the prevailing speed limit was acceptable to a third.
In 1997-98 a project, testing ISA as a means for quality assurance in municipal transport services, was carried out in the city of Borlänge (Myhrberg et al., 2000). The aim was to develop technology for speed adaptation for transport services purchased by the municipality and test methods for implementation of the technique. For 6 months, 14 fleet vehicles were equipped with a system consisting of a display, informing the driver about the actual speed limit, and a warning by beep signal and flashing light when the speed limit was exceeded and a device that registered speeding in a “black box”. The results showed that this technology worked well and it was possible to follow up how the transports were carried out. The drivers seemed to be

13
generally positive to the informative speed adaptation system, but not so enthusiastic about the fact that their speeding was registered. Light signals were experienced by the drivers as less irritating than beep signals, but they meant that the beep signal had a larger effect on speed reduction. More than half of the drivers said the system helped them to keep the speed limit.
In a Dutch study Brookhuis et al. (1999) tested a system with visual and auditory feedback. They had 24 subjects (12 controls) drive along a specified route with an instrumented vehicle. They found that speeds on average were reduced by 4 kph and that the treatment group behaved more in accordance with the traffic rules, in particular speed limits. They also found that speed variance decreased. No significant differences in workload could be found.
Within the framework of an EU-financed project, MASTER, field trials with speed limiters2 in three European countries: Sweden, the Netherlands and Spain were carried out in 1997 (Várhelyi and Mäkinen, 2001). The results revealed that the speed limiter reduced speeds significantly on roads with speed limits between 30 and 70 kph. On the other hand, no significant changes could be shown on 80 - 90 kph roads and motorways due to heavy traffic. Other positive effects found were: a) decreased speed variance, b) smoother approach speeds at roundabouts, intersections and curves, c) increased time-gaps in the speed interval 30 - 50 kph. No significant effects were found on: a) turning speeds, b) give way behaviour towards pedestrians, cyclists and other cars, c) experienced subjective safety when driving a car equipped with a speed limiter. The indicators of negative effects of the speed limiter were: a) shorter time-gaps in car-following situations on rural roads, b) increased travel time, c) greater frustration and stress, less patience. The main conclusion of the study was that automatic speed limiting by an in-car device was promising within built-up areas where drivers’ acceptance of the system was the highest.
In the UK, Carsten and Comte (1997) conducted experiments in a driving simulator; the research area was Automatic Speed Control in Urban Areas. They found that driver behaviour improved when speed was limited, although a riskier gap acceptance was detected. In a simulator study by Comte (1999) great safety benefits from speed limiters were found, but she also found some negative compensational effects in critical conditions. It turned out that drivers using a speed limiter with fixed speed limits actually drove faster in fog and adverse weather than the drivers who were not speed limited at all, and the greatest safety benefit was found for a system with dynamic speed limits. Carsten and Fowkes (2000) summarised the results from the External Vehicle
2 The term speed limiter indicates that the system has no override possibilities, i.e. the car is limited to the set speed.

14
Speed Control project (EVSC), which was an extensive study on speed and speed control issues including literature studies on the speed – accident relationship, simulator studies, acceptance studies, modelling and an on-road study. Systems tested in this project were a voluntary system called driver select in which the driver himself could decide whether he wanted to be speed limited or not, and a mandatory one where the driver was always bound to the speed limit. They also tested a system with variable speed limits in the driving simulator. The interface with the driver was a “dead throttle” 3 and an in-car display. The vehicle was also equipped with braking facilities to automatically slow the car down to, for instance, lowered speed limits. In this project they found effects positive for safety in the form of reduced speeds and a decreased propensity to be involved in critical situations and conflicts with the system engaged. The modelling showed reduced fuel consumption and reduced speed variance between the vehicles, but, the travel time increased slightly with the system. Other negative effects that were found were shorter gap acceptance and reduced minimum time to collision. In conclusion they also stressed the importance of observing behaviour in more long-term use.
In the city of Tilburg, the Netherlands, a 20 vehicle trial with limiting ISA was carried out during 1999 and 2000 (Duynstee et al., 2001). The equipment tested was a version of “dead throttle” and the results showed overall reductions in speed and reduced speed variance. They discovered that mixing ISA vehicles with ordinary vehicles could create some irritation among both ISA drivers and drivers of ordinary cars, but relatively few drivers put forward arguments that should prevent authorities from implementing ISA.
In Denmark, Lahrmann et al. (2001) tested an advisory intervention system where the intervention consisted of a flashing display, a red LED and a friendly female voice saying, for example, “50, you are driving too fast” (in Danish). The study showed positive results for adapting speed and the 85 percentile was reduced by 4-7 kph for the various speed limits.
In Finland Päätalo et al. (2001) carried out a side-by-side comparison of three types of systems, an informative system, a haptic throttle which limited the speed of the vehicle and a recording system where speed infractions were registered. The systems where tested by 24 drivers and it was concluded that the limiting system was the most effective in reducing speeds, but the informative had the highest acceptance.
3 “Dead Throttle” means that there is no feedback in the throttle when the speed limit is reached, so pressing down the throttle further will have no effect (to be compared with “haptic throttle”).

15
In Australia (Regan, 2004) a trial with ISA, as a part of the “SafeCar-project”4, is ongoing. The system tested is a combination of auditory warning and haptic feed-back. The evaluation is not yet finished but preliminary results indicate that the mean speed decreases when driving with the system.
As can be seen from the review of in-vehicle measures above, there is an impressive body of knowledge with regard to speed adaptation systems, their effects and the public acceptance of the systems; overall the results have all been very promising. There are, however, some knowledge gaps that still need to be filled. The trials were all rather short, varying from a without / with test-drive up to two months of driving, so it is reasonable to assume that the drivers were not fully accustomed to the systems at the end of the trials, and possible long-term effects and behavioural modifications were not revealed. There were some conflicting results from earlier studies on the effect on behaviour and this was probably due to the lack of long-term adaptation. Most of the trials were also rather small in size, so it was difficult to trace results based on different groups of drivers and drivers with different attitudes to speed and traffic safety.
4 The SafeCar-project evaluates the effectiveness of several driver assistance systems such as ISA, forward distance warning, seat belt reminder, and rear distance warning.

16
2. AIM
As the review of the literature above showed, little is known of the long-term effects of speed adaptation systems, or the effect on different types of drivers. The aim of this thesis is to study the long term effects of an advisory intervention speed adaptation system, the Active Accelerator Pedal (AAP), on speed, driver behaviour, traffic safety, emissions and travel time. The thesis further aims at studying the system’s effectiveness for different driver types, which is a crucial issue when it comes to implementation.
2.1. Hypotheses The hypotheses to be tested in this thesis were derived from the experiences of earlier studies on the effects of the Active Accelerator Pedal on driver behaviour (Persson et al., 1993; Almqvist and Nygård, 1997; Várhelyi and Mäkinen, 2001) and on theoretical considerations on possible effects of driver assistance systems on driver behaviour.
Hypothesis 1: The speed level will decrease after long-term use of the AAP:
This hypothesis is based on the experience of earlier trials of speed adaptation systems, described in chapter 1.4.2, which showed that the use of such systems leads to a general reduction in speed.
Hypothesis 2: The variance of speed will decrease after long-term use of the AAP:
This hypothesis is also based on earlier findings. Studies have shown that it is the highest speeds that are reduced the most, which would lead to a decreased variance in speed. In addition to the effect from the reduction of the highest speeds, there could be an increase of the lowest speeds due to drivers who, without the AAP, drive under the speed limit “to be on the safe side”. With the help of the AAP they can drive exactly at the speed limit.
Hypothesis 3: There is a difference in chosen speed depending on your attitude to the AAP:
Studies of test drivers’ attitudes that were carried out in earlier trials showed that drivers who often drove over the speed limit were more negative to speed reducing measures, including ISA.
Hypothesis 4: Drivers will not lower their speed in low speed situations or in areas where they are not supported by the AAP to the same extent when driving with the AAP as when driving without the AAP:
The hypothesis is based on the theoretical argument that drivers, who feel stressed and pressured for time because they cannot drive as fast as they want

17
to, will try to “make up for it” by driving faster where the system does not interfere with their speed choice. Support for the hypothesis can also be found in the theories of behavioural adaptation (OECD, 1990) and Wilde’s (1994) risk compensation theory which argues that road users will use up some of the margin afforded by safety improvements by, for example, driving faster.
Hypothesis 5: The drivers of AAP-cars will be more inclined to follow traffic regulations:
This hypothesis also stems from the “behavioural adaptation” theory and the positive change can be attributed to a slower and more relaxed driving pace. The AAP could however have the opposite effect if drivers try to compensate for lost time by, for instance, not stopping at stop signs or running red lights.
Hypothesis 6: Behaviour towards other road users will improve after long-term use of the AAP (the drivers will be more willing to give priority to other vehicles and pedestrians):
This hypothesis originates from the empirical findings that drivers entering an interactive situation at lower speeds are more willing to stop and give priority (Hydén and Várhelyi, 2002; Towliat, 2001)
Hypothesis 7: Drivers get used to the system “taking control” and thereby delegate responsibility for certain driving tasks:
This hypothesis originates in the phenomenon of behavioural adaptation, which is defined as “those behaviours which may occur following the introduction of changes to the road-vehicle-user system and which were not intended by the initiators of the change” (OECD, 1990). A driver supported by an intelligent accelerator pedal is able to devote more attention to the other driving tasks. On the other hand he might become over-reliant on the system. For example, the driver might consider that the system will always know what the speed limit is and will always issue a warning at inappropriate speeds.
Hypothesis 8: The time gap to the vehicle in front will increase:
This hypothesis also gets its origin from the “behavioural adaptation” theory but here the expected effect is positive from a traffic safety point of view. Earlier studies on the effects of speed adaptation systems have shown that there is an effect on car-following behaviour (Persson et al., 1993; Várhelyi et al., 2001). The results are, however, not unanimous so there is a need to study the long-term effects.
Hypothesis 9: Time consumption increases when driving with the AAP:
If mean speeds are decreased, as it is hypothesized, it is reasonable to assume that the driving time increases.

18
Hypothesis 10: Emission volumes decrease in vehicles equipped with the AAP:
Lower speeds will bring smoother acceleration curves since the drivers will not speed up to the same extent, and lower speeds and smoother acceleration curves will bring a reduction in emissions.
19
3. METHOD
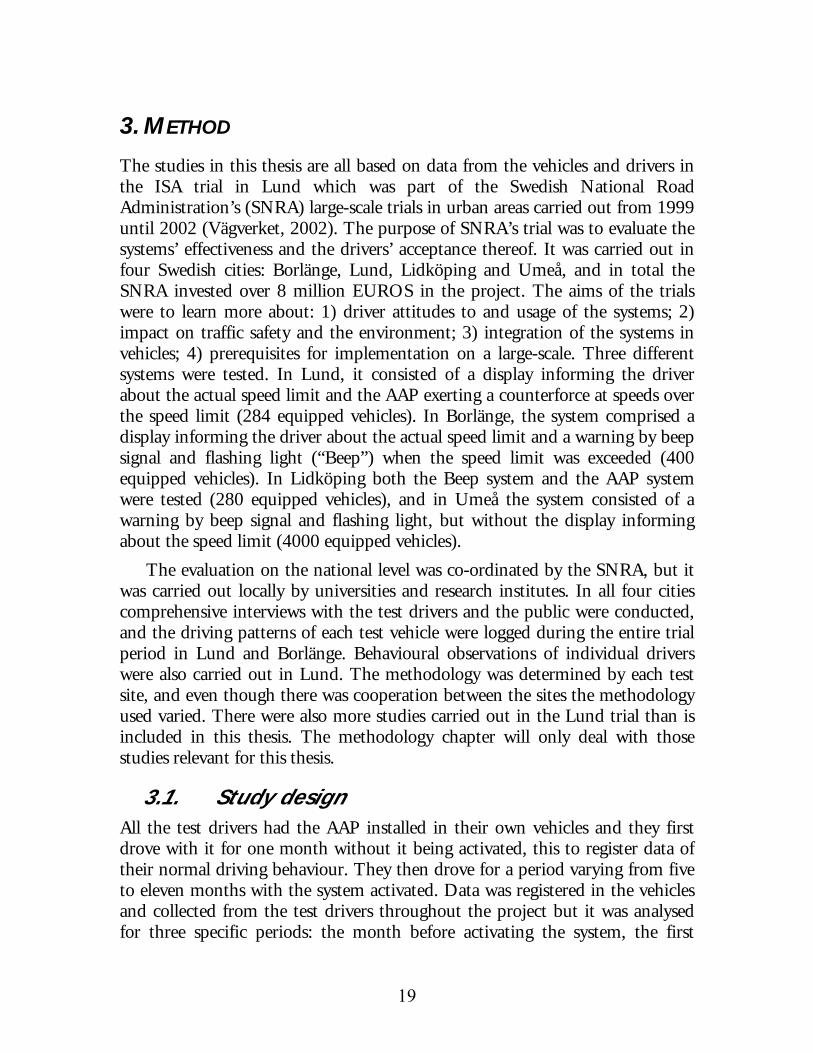
The studies in this thesis are all based on data from the vehicles and drivers in the ISA trial in Lund which was part of the Swedish National Road Administration’s (SNRA) large-scale trials in urban areas carried out from 1999 until 2002 (Vägverket, 2002). The purpose of SNRA’s trial was to evaluate the systems’ effectiveness and the drivers’ acceptance thereof. It was carried out in four Swedish cities: Borlänge, Lund, Lidköping and Umeå, and in total the SNRA invested over 8 million EUROS in the project. The aims of the trials were to learn more about: 1) driver attitudes to and usage of the systems; 2) impact on traffic safety and the environment; 3) integration of the systems in vehicles; 4) prerequisites for implementation on a large-scale. Three different systems were tested. In Lund, it consisted of a display informing the driver about the actual speed limit and the AAP exerting a counterforce at speeds over the speed limit (284 equipped vehicles). In Borlänge, the system comprised a display informing the driver about the actual speed limit and a warning by beep signal and flashing light (“Beep”) when the speed limit was exceeded (400 equipped vehicles). In Lidköping both the Beep system and the AAP system were tested (280 equipped vehicles), and in Umeå the system consisted of a warning by beep signal and flashing light, but without the display informing about the speed limit (4000 equipped vehicles).
The evaluation on the national level was co-ordinated by the SNRA, but it was carried out locally by universities and research institutes. In all four cities comprehensive interviews with the test drivers and the public were conducted, and the driving patterns of each test vehicle were logged during the entire trial period in Lund and Borlänge. Behavioural observations of individual drivers were also carried out in Lund. The methodology was determined by each test site, and even though there was cooperation between the sites the methodology used varied. There were also more studies carried out in the Lund trial than is included in this thesis. The methodology chapter will only deal with those studies relevant for this thesis.
3.1. Study design All the test drivers had the AAP installed in their own vehicles and they first drove with it for one month without it being activated, this to register data of their normal driving behaviour. They then drove for a period varying from five to eleven months with the system activated. Data was registered in the vehicles and collected from the test drivers throughout the project but it was analysed for three specific periods: the month before activating the system, the first

20
month of use and the last month of use (after five to eleven months of using the system). These periods are referred to as Without AAP, Short term use and Long term use. Control measurements were also carried out in the field in Lund and in Helsingborg (a neighbouring city of similar size).
3.2. Test driver selection The test drivers were recruited from the public and from local companies in Lund. The recruitment procedure was somewhat different for the two groups; the drivers from the public (private drivers) were recruited through a letter sent out to 3863 vehicle owners in Lund, while the company car drivers were recruited by personal contacts with managers and people in charge of the vehicle fleets. The letter included information about the project and a questionnaire asking whether they wanted to participate or not. Of the 1607 private drivers who replied to the questionnaire, 625 were interested in participating. Of the 373 cars that showed up at the installation garage the system was installed in 284 of which 38 were company cars. Some cars turned out to be impossible to equip due to lack of space in the engine compartment or other problems.
The test drivers were classified with regard to age, gender and initial attitude to the system. The intention was to have an even distribution among these groups, but despite the large number of drivers contacted, it was difficult to achieve. The easiest groups to find drivers in was positive men between 25 and 64 years; young drivers and female drivers over the age of 65 were more difficult to find, probably due to the fact that the vehicle ownership for these groups was very low. This led to a bias towards middle aged positive men in the sample which may be regarded more representative of the actual driver population. Table 2 presents the test driver distribution.
Table 2 The number of test drivers according to age group, gender and initial attitude to the AAP.
Age group 18-24 25-44 45-64 65-
pos neutr neg pos neutr neg pos neutr neg pos neutr neg ∑
Male 4 1 2 41 7 8 61 13 12 28 3 1 181 Female 5 0 0 26 3 12 28 12 5 5 0 1 97
9 1 2 67 10 20 89 25 17 33 3 2 ∑ 12 97 131 38 278*
* Six of the drivers did not reveal their attitude to the system.

21
3.3. Apparatus The AAP that all the 284 test drivers’ vehicles were equipped with was made up of three components: a navigation unit with a digital map, a data recorder and the driver interface which consisted of a haptic pedal and a display, see Figure 3. The navigation unit was GPS-based, and it continuously identified the position of the vehicle and compared this with a digital map to determine what the speed limit was at that position and time of day5. If the current speed was higher than the speed limit the haptic pedal produced a counter pressure in the accelerator pedal. It was still possible to accelerate but the pedal had to be pressed down with a force three to five times higher than was normally required, which meant that the speed limit could not be overridden inadvertently.
Figure 3 The Active Accelerator Pedal (or Limit Advisor as the manufacturer calls it) with its components. (Published with kind permission of IMITA AB)
5 From the GPS the time was given, making it possible to include time differentiated speed limits in the digital map, e.g. 30 kph outside schools during school hours.

22
The data registered in the vehicles was stored on a flash memory and was extracted to a lap-top via a cable. The variables registered within the test area were: date & time, GPS-position, direction of travel, speed limit, speed, engine revolution, pedal position and travelled distance since trip start6. Outside the test area the registered variables were: date & time, speed, pedal position, travelled distance since trip start and voluntary use of the system. The sampling frequency was five Hz within the test area and 1 Hz outside the test area. Figure 4 shows a schematic picture of how the system worked.
Figure 4 The components included in the AAP and how they are connected.
6 Trip was here defined as the travel from the time the ignition was turned on (and the logging started) until it was turned off (and the logging stoped).
Positioning unit
Central processing unit CPU
Display
Mechanical unit
GPS antenna
Digital map
Log memory 16Mb External
flash computer
Applied speed
Log values
Applied speed
Settings
Odometer pulses
Download log
Update map
Cable to accelerator
Wire package
Ignition Battery

23
3.4. Test area The test area consisted of the entire city of Lund (approximately 70 000 inhabitants during the trial 1999-2002 (Lunds kommun, 2004)), approximately 27 km2 and included 30, 50 and 70 kph speed limits, see Figure 5. There is a motorway running through the city of Lund but it was excluded since the trial was to be an urban one. The system was activated automatically when the vehicle was within the test area and it could not be turned off. Outside the test area the system was not activated but the driver could activate the system manually and set it at a desired speed limit. The digital map of the test area also included a test route outside the city. The AAP was not activated on this route but data was recorded with the same accuracy as within the test area. This route was used for special studies and for analysis of speeds outside the test area.
Figure 5 The test area, the city of Lund with speed limits (red = 30 kph, blue = 50 kph and yellow = 70 kph, green and magenta marks transitions from urban roads and the motorway).
24
3.5. Observational and analytical methods
3.5.1. Speed analysis
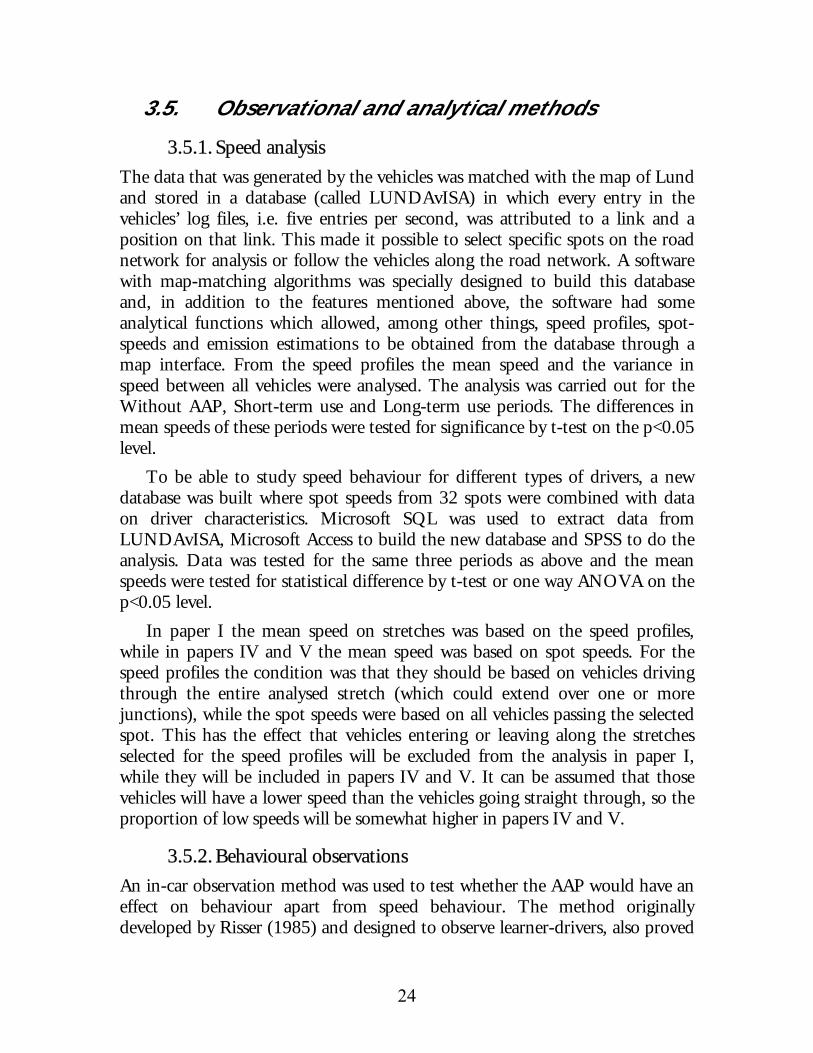
The data that was generated by the vehicles was matched with the map of Lund and stored in a database (called LUNDAvISA) in which every entry in the vehicles’ log files, i.e. five entries per second, was attributed to a link and a position on that link. This made it possible to select specific spots on the road network for analysis or follow the vehicles along the road network. A software with map-matching algorithms was specially designed to build this database and, in addition to the features mentioned above, the software had some analytical functions which allowed, among other things, speed profiles, spot-speeds and emission estimations to be obtained from the database through a map interface. From the speed profiles the mean speed and the variance in speed between all vehicles were analysed. The analysis was carried out for the Without AAP, Short-term use and Long-term use periods. The differences in mean speeds of these periods were tested for significance by t-test on the p<0.05 level.
To be able to study speed behaviour for different types of drivers, a new database was built where spot speeds from 32 spots were combined with data on driver characteristics. Microsoft SQL was used to extract data from LUNDAvISA, Microsoft Access to build the new database and SPSS to do the analysis. Data was tested for the same three periods as above and the mean speeds were tested for statistical difference by t-test or one way ANOVA on the p<0.05 level.
In paper I the mean speed on stretches was based on the speed profiles, while in papers IV and V the mean speed was based on spot speeds. For the speed profiles the condition was that they should be based on vehicles driving through the entire analysed stretch (which could extend over one or more junctions), while the spot speeds were based on all vehicles passing the selected spot. This has the effect that vehicles entering or leaving along the stretches selected for the speed profiles will be excluded from the analysis in paper I, while they will be included in papers IV and V. It can be assumed that those vehicles will have a lower speed than the vehicles going straight through, so the proportion of low speeds will be somewhat higher in papers IV and V.
3.5.2. Behavioural observations
An in-car observation method was used to test whether the AAP would have an effect on behaviour apart from speed behaviour. The method originally developed by Risser (1985) and designed to observe learner-drivers, also proved
25
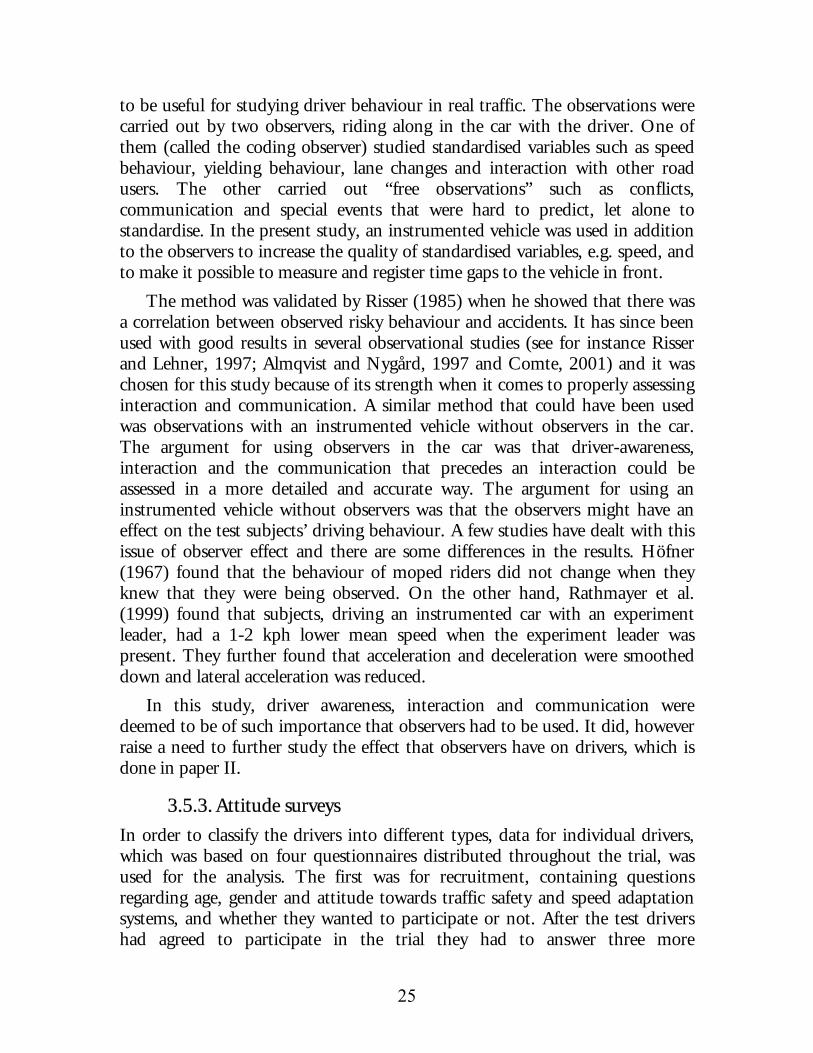
to be useful for studying driver behaviour in real traffic. The observations were carried out by two observers, riding along in the car with the driver. One of them (called the coding observer) studied standardised variables such as speed behaviour, yielding behaviour, lane changes and interaction with other road users. The other carried out “free observations” such as conflicts, communication and special events that were hard to predict, let alone to standardise. In the present study, an instrumented vehicle was used in addition to the observers to increase the quality of standardised variables, e.g. speed, and to make it possible to measure and register time gaps to the vehicle in front.
The method was validated by Risser (1985) when he showed that there was a correlation between observed risky behaviour and accidents. It has since been used with good results in several observational studies (see for instance Risser and Lehner, 1997; Almqvist and Nygård, 1997 and Comte, 2001) and it was chosen for this study because of its strength when it comes to properly assessing interaction and communication. A similar method that could have been used was observations with an instrumented vehicle without observers in the car. The argument for using observers in the car was that driver-awareness, interaction and the communication that precedes an interaction could be assessed in a more detailed and accurate way. The argument for using an instrumented vehicle without observers was that the observers might have an effect on the test subjects’ driving behaviour. A few studies have dealt with this issue of observer effect and there are some differences in the results. Höfner (1967) found that the behaviour of moped riders did not change when they knew that they were being observed. On the other hand, Rathmayer et al. (1999) found that subjects, driving an instrumented car with an experiment leader, had a 1-2 kph lower mean speed when the experiment leader was present. They further found that acceleration and deceleration were smoothed down and lateral acceleration was reduced.
In this study, driver awareness, interaction and communication were deemed to be of such importance that observers had to be used. It did, however raise a need to further study the effect that observers have on drivers, which is done in paper II.
3.5.3. Attitude surveys
In order to classify the drivers into different types, data for individual drivers, which was based on four questionnaires distributed throughout the trial, was used for the analysis. The first was for recruitment, containing questions regarding age, gender and attitude towards traffic safety and speed adaptation systems, and whether they wanted to participate or not. After the test drivers had agreed to participate in the trial they had to answer three more

26
questionnaires, with some questions that were repeated and some that were unique for each. They contained some general questions on traffic safety, speed and speed management as well as on the drivers’ experience and opinion of the AAP. These were distributed before they tested the AAP, after one month’s use and at the end of the trial. The questions used in paper V were repeated in two or more of these questionnaires and the drivers’ answers correlated between the questionnaires (p<0.01), and therefore an average was used. This was to increase the response rate in case some drivers had failed to answer one of the questionnaires. The classification process is described further in paper V where this data was used, and for more details regarding the attitude surveys carried out in Lund see Falk et al. (2002).
3.5.4. Safety estimations
The effect the AAP had on safety was modelled with the Power model (Nilsson, 1997; 2000 and 2004). The objective of the model is to describe how the accident and injury situation changes when the average speed changes in a road network and everything else remains constant. It is validated against empirical data on the effect of changes in speed on accidents. In his thesis Nilsson (2004) also shows that the model coincides well with other models for estimating safety effects.
The advantage of the model is that it is simple to use; given a change in mean speed the model will predict the change in the accident situation. The prerequisite that everything else remains constant is suitable for modelling the safety effect in this trial because the model does not include the effect of other changes (traffic, enforcement etc.), which could influence the traffic situation.
The model is validated for rural roads, primarily because statistical investigations of speed changes in urban areas are rare. However, in his thesis Nilsson (2004) concludes that the experiences of the few investigations of urban areas that exist are in good agreement with the power model and that, if representative accident and speed data are available, the model can be used. In a British study by Taylor et al. (2000) an attempt is made to distinguish between the effects of various road types. For urban roads they find that every mile per hour reduction in mean speed will cut accident frequency by six percent for urban main roads and residential roads with low speeds, by four percent for medium speed urban roads and by three percent for the higher speed urban roads. A back of the envelope calculation shows that the two models will produce similar results, which further strengthens the case for using the model.
The assumption that everything remains constant is, as discussed above, suitable for this trial since apart from mean speed; there are no changes in
27
enforcement and traffic etc., but speed variance is also of interest. Nilsson (2004) argues that there is a strong relationship between speed variance and average speed, but, for a speed adaptation system such as the AAP the decrease in speed variance is likely greater than would be the case if the same reduction in speed was achieved by reduced speed limits. This means that the safety effect predicted by the model will probably be somewhat underestimated due to the positive effect of reduced speed variance, established by Finch et al., 1994; Maycock et al., 1998 and Quimby et al., 1999.
The speed data used as input in the model were average speeds from all drivers and the speeds were attained in mid-section on the selected roads. Mid-section was chosen because it represented the chosen driving speed of the drivers (they had had time to complete their acceleration from the downstream junction and had not yet started to brake for the upcoming junction). This is in line with how spots for speed measurements in the field are usually selected. Hence, the speed data used should represent the speed data used for validation of the Power model. The AAP’s effect on safety is reported in paper I and IV.
3.5.5. Emission modelling
The analysis of changes in emissions was based on the logged speed and acceleration data from the drivers own vehicles. The emissions were modelled using an emission calculating program called VETO, developed by Hammarström and Karlsson (1987). Emissions modelled were CO, NOx and HC. Data used as input in the model were speed and acceleration data from 67 stretches of road varying in length from a little more than a hundred meters up to two kilometres. The results of the emission modelling are presented in paper IV.
3.5.6. Time consumption
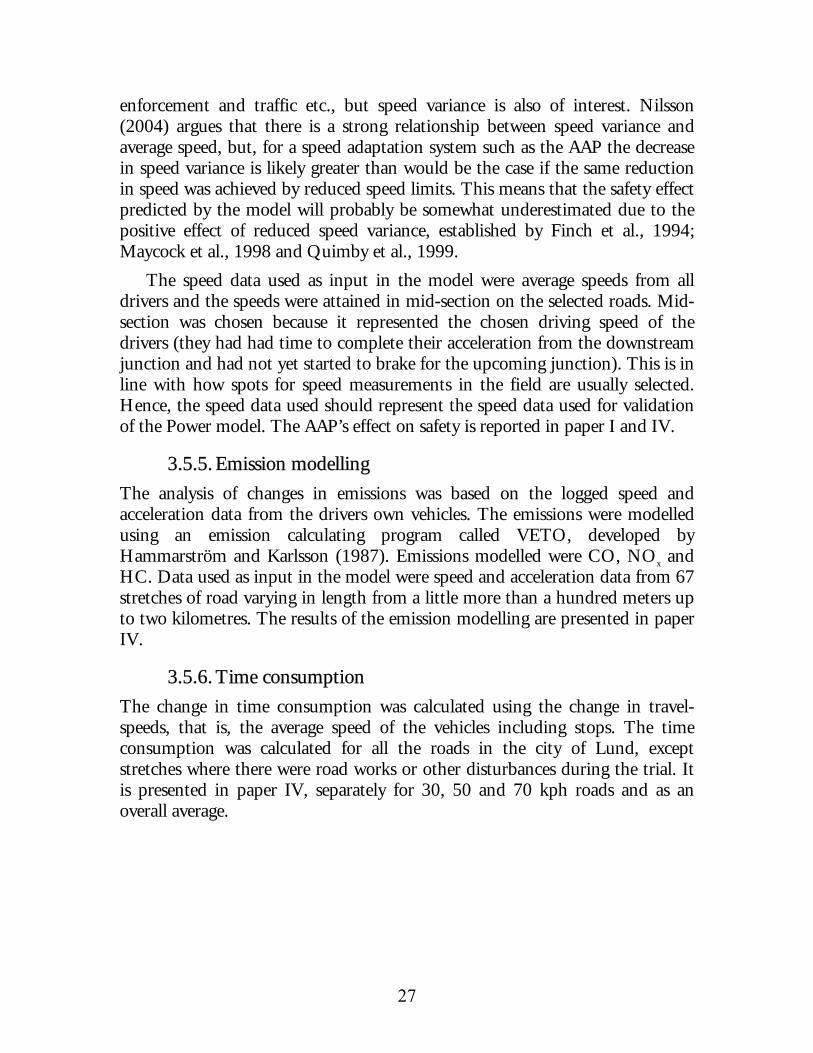
The change in time consumption was calculated using the change in travel-speeds, that is, the average speed of the vehicles including stops. The time consumption was calculated for all the roads in the city of Lund, except stretches where there were road works or other disturbances during the trial. It is presented in paper IV, separately for 30, 50 and 70 kph roads and as an overall average.

28
4. RESULTS
4.1. Effects on behaviour The AAP’s effect on speed behaviour was studied through speed data from the test drivers’ vehicles in papers I, IV and V. Other driver behaviours such as interaction, behavioural adaptation and speed behaviour were studied in paper III by the in-car observations.
4.1.1. Speed behaviour
In papers I and IV the AAP’s effect on the aggregated speed was studied and both studies concluded that the AAP had brought a great reduction in mean speed and an even greater reduction in the 85th percentile speed. Table 3 shows the AAP’s effect on speeds for the various road types studied, and in Figure 6 a profile of the aggregated mean speed on an arterial road, with a speed limit of 70 kph, is presented. As the table and the graph clearly show, the mean speed is significantly reduced and the compliance with the speed limit has improved.
Table 3 The mean speed and 85th percentile speed for all the drivers without the AAP and after long term use (from paper IV).
Without the AAP Long term use
Change in
Street type, Speed limit (kph)
No of stret-ches
N V S 85P N V S 85P V S 85P
Arterial street, 70 Dual carriageway 8 5017 74.5 11.9 83.9 3336 70.8 6.9 76.3 -3.7* -5.0 -7.6 Arterial street, 50 Dual carriageway 10 5265 52.1 7.9 59.0 3839 48.6 6.2 52.9 -3.5* -1.7 -6.1 Arterial street, 50 Single carriageway 19 6462 50.4 8.8 58.0 4370 47.7 6.4 52.2 -2.7* -2.4 -5.8
Main street, 50 12 3381 44.8 9.3 52.2 2570 44.4 7.9 50.0 -0.4 -1.4 -2.2
Main street, mixed traffic, 50 12 2373 36.5 8.3 44.6 1407 35.6 7.6 43.6 -0.9* -0.7 -1.0 Central street, 30
8 1235 24.0 10.3 31.7 857 24.1 7.1 30.3 0.1 -3.2 -1.4 N = The total number of vehicle passages for all stretches. V = Mean speed at mid-block (unweighted average for all stretches), kph. S = standard deviation of mean speed (unweighted average for all stretches), kph. 85P = 85 Percentile speed at mid-block (unweighted average for all stretches), kph. * = Statistically significant difference according to t-test (p<0.05).

29
Dalbyvägen direction west
0
10
20
30
40
50
60
70
80
0-5
m
61-6
5 m
121-
125
m
181-
185
m
241-
245
m
301-
305
m
361-
365
m
421-
425
m
481-
485
m
541-
545
m
601-
605
m
661-
665
m
721-
725
m
781-
785
m
841-
845
m
901-
905
m
961-
965
m
1021
-102
5 m
1081
-108
5 m
1141
-114
5 m
1201
-120
5 m
Distance (m)
Spee
d (k
m/h
) Without AAPCI (min)CI (max)Short time useLong time use
Figure 6 Profile of mean speeds on an arterial road with dual carriageway and speed limit of 70 kph.
The AAP’s effect on speed was found to be greatest on the arterial roads
whereas the effect was very low on the central streets. On the other hand, speeds were already at or below the speed limit without the AAP on these streets. It is likely that the infrastructure and speed reducing measures are working to keep speeds below the speed limit on the central streets while the AAP will be more efficient on the arterial roads where it is difficult to implement other speed management measures.
The mean speeds were analysed for three periods and, as is shown in both Figure 6 above and in Figure 7, the AAP had a large initial effect, but the effect decreased somewhat after long term use. In paper IV it was concluded that the system took some time to get used to, that drivers had got accustomed to it after long term use and that the speed level had stabilised. In paper I it was also found that the lower speeds had increased due to the slower drivers using the system to speed up to the speed limit, which could further explain the increase in speed after long term use. An example is shown in Figure 10 on Page 34. This could indicate that earlier studies, which have not studied the long term
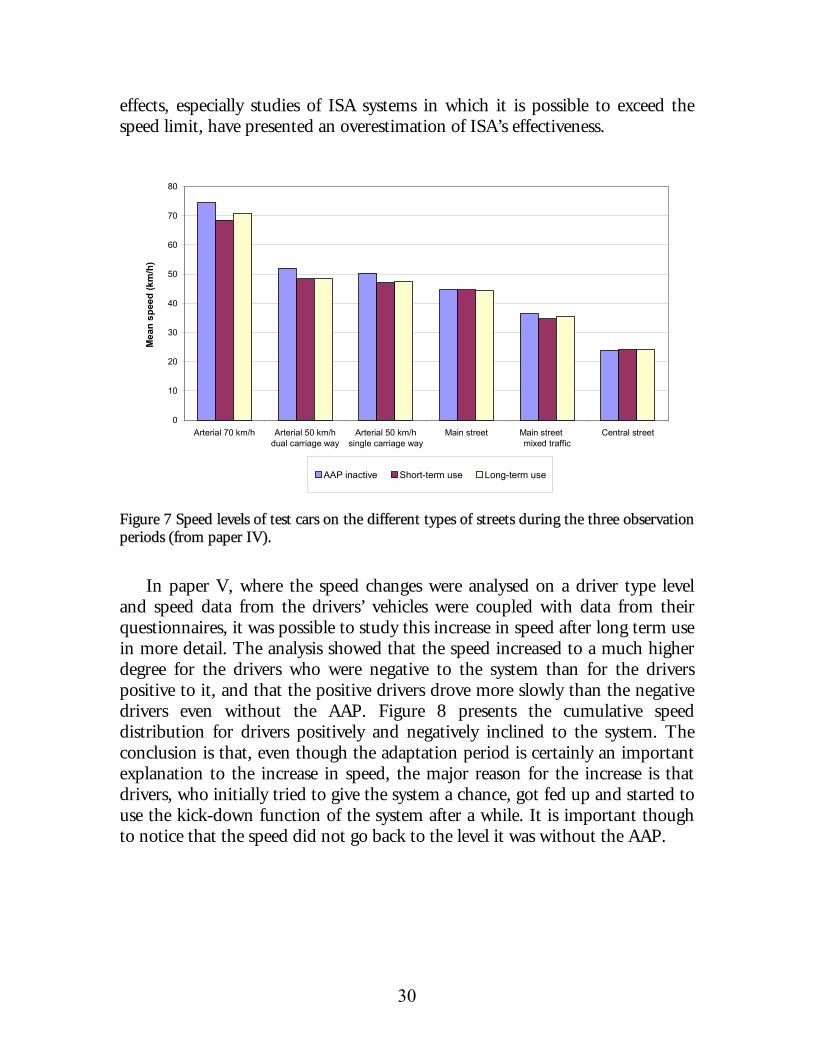
30
effects, especially studies of ISA systems in which it is possible to exceed the speed limit, have presented an overestimation of ISA’s effectiveness.
0
10
20
30
40
50
60
70
80
Arterial 70 km/h Arterial 50 km/hdual carriage way
Arterial 50 km/hsingle carriage way
Main street Main street mixed traffic
Central street
Mea
n sp
eed
(km
/h)
AAP inactive Short-term use Long-term use
Figure 7 Speed levels of test cars on the different types of streets during the three observation periods (from paper IV).
In paper V, where the speed changes were analysed on a driver type level
and speed data from the drivers’ vehicles were coupled with data from their questionnaires, it was possible to study this increase in speed after long term use in more detail. The analysis showed that the speed increased to a much higher degree for the drivers who were negative to the system than for the drivers positive to it, and that the positive drivers drove more slowly than the negative drivers even without the AAP. Figure 8 presents the cumulative speed distribution for drivers positively and negatively inclined to the system. The conclusion is that, even though the adaptation period is certainly an important explanation to the increase in speed, the major reason for the increase is that drivers, who initially tried to give the system a chance, got fed up and started to use the kick-down function of the system after a while. It is important though to notice that the speed did not go back to the level it was without the AAP.
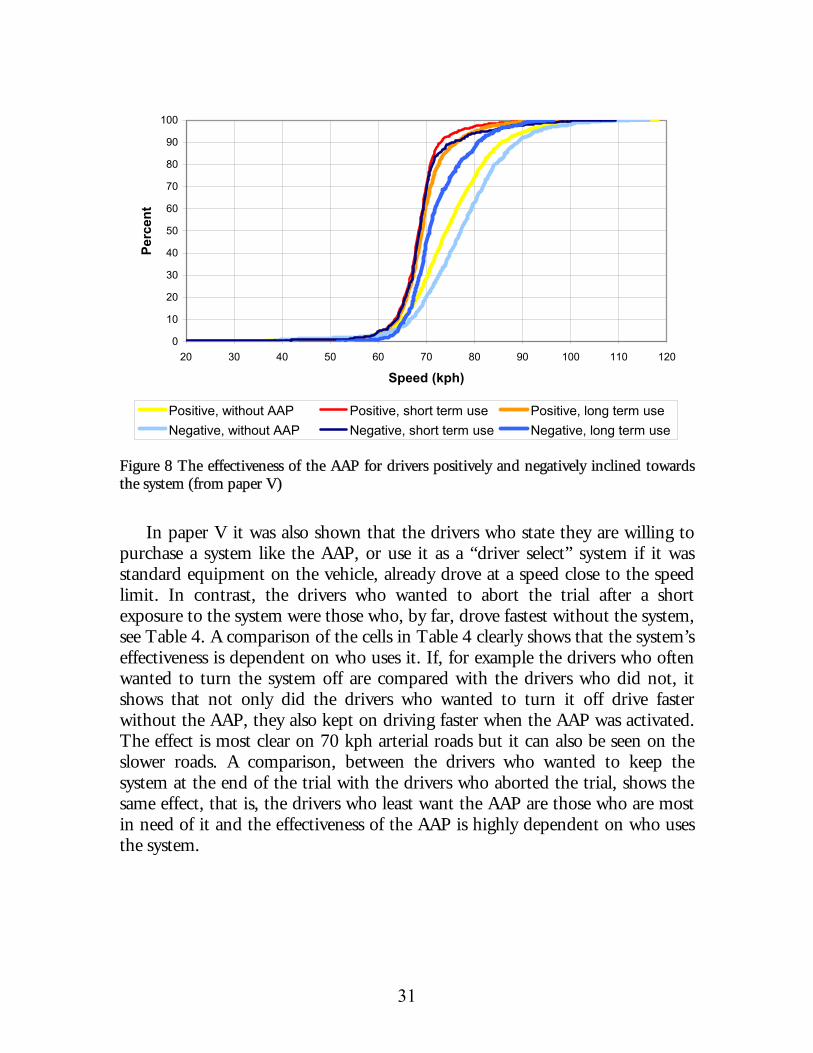
31
0
10
20
30
40
50
60
70
80
90
100
20 30 40 50 60 70 80 90 100 110 120
Speed (kph)
Perc
ent
Positive, without AAP Positive, short term use Positive, long term useNegative, without AAP Negative, short term use Negative, long term use
Figure 8 The effectiveness of the AAP for drivers positively and negatively inclined towards the system (from paper V)
In paper V it was also shown that the drivers who state they are willing to
purchase a system like the AAP, or use it as a “driver select” system if it was standard equipment on the vehicle, already drove at a speed close to the speed limit. In contrast, the drivers who wanted to abort the trial after a short exposure to the system were those who, by far, drove fastest without the system, see Table 4. A comparison of the cells in Table 4 clearly shows that the system’s effectiveness is dependent on who uses it. If, for example the drivers who often wanted to turn the system off are compared with the drivers who did not, it shows that not only did the drivers who wanted to turn it off drive faster without the AAP, they also kept on driving faster when the AAP was activated. The effect is most clear on 70 kph arterial roads but it can also be seen on the slower roads. A comparison, between the drivers who wanted to keep the system at the end of the trial with the drivers who aborted the trial, shows the same effect, that is, the drivers who least want the AAP are those who are most in need of it and the effectiveness of the AAP is highly dependent on who uses the system.

Tab
le 4
The
mea
n sp
eed
(kph
) fo
r dr
iver
s w
ith
rega
rd to
thei
r at
titu
de to
and
exp
erie
nce
of th
e A
AP
(fro
m p
aper
V).
Initi
al a
ttitu
de
Joy
of d
rivin
g St
ress
C
ompl
eted
tria
l W
ishe
d to
turn
off
th
e A
AP
Wan
ts to
kee
p th
e A
AP
Posi
tive
Neg
ativ
e U
ncha
nged
/In
crea
sed
Dec
reas
ed
Unc
hang
ed
/ Dec
reas
ed
Incr
ease
d Y
es
No
Not
ofte
n O
ften
Yes
N
o
With
out t
he
AA
P 74
.9+
77.3
*+ 72
.7+
76.3
*+ 72
.8+
74.9
*+ 73
.9
78.7
* 73
.4+
75.3
*+ 72
.4+
74.0
*+ A
rteria
l roa
d 70
kph
A
fter l
ong
term
use
69
.7
72.2
* 69
.9
71.0
* 70
.8
70.5
-
- 70
.0
71.5
* 70
.4
70.1
With
out t
he
AA
P 51
.0+
52.7
*+ 50
.6+
51.7
*+ 50
.3+
51.4
*+ 50
.9
52.3
* 50
.7+
51.3
*+ 50
.7+
50.7
+ A
rteria
l roa
d 50
kph
A
fter l
ong
term
use
47
.8
49.0
* 48
.1
48.1
48
.0
48.2
-
- 48
.0
48.3
48
.6*
47.7
With
out t
he
AA
P 45
.2+
45.3
44
.3+
45.5
* 45
.4*
44.5
44
.7
45.3
44
.7+
45.2
44
.1
44.9
+ M
ain
stre
et
50 k
ph
Afte
r lon
g te
rm u
se
44.3
45
.9*
43.2
45
.2*
45.0
* 44
..1
- -
43.3
45
.7*
43.9
43
.8
With
out t
he
AA
P 36
.5+
36.9
+ 35
.7
37.8
*+ 36
.1
37.1
*+ 36
.4
37.4
* 36
.4+
37.1
33
.6+
37.6
*+ M
ain
stre
et,
mix
ed tr
affic
50
kph
A
fter l
ong
term
use
35
.5
34.8
35
.1
36.1
* 36
.5*
35.3
-
- 35
.4
36.1
35
.6
35.8
With
out t
he
AA
P 24
.6+
24.8
24
.3+
24.2
23
.7
24.4
23
.9
24.8
23
.8
24.8
23
.7
24.9
C
entra
l stre
et
30 k
ph
Afte
r lon
g te
rm u
se
23.4
26
.3*+
23.0
25
.6*+
24.0
24
.2
- -
23.0
25
.9
23.6
24
.0
* Si
gnifi
cant
ly h
ighe
r mea
n sp
eed
than
thei
r hor
izon
tal c
ount
erpa
rt ac
cord
ing
to t-
test
, p<0
.05
+ Si
gnifi
cant
ly h
ighe
r mea
n sp
eed
than
thei
r ver
tical
cou
nter
part
acco
rdin
g to
t-te
st, p
<0.0
5
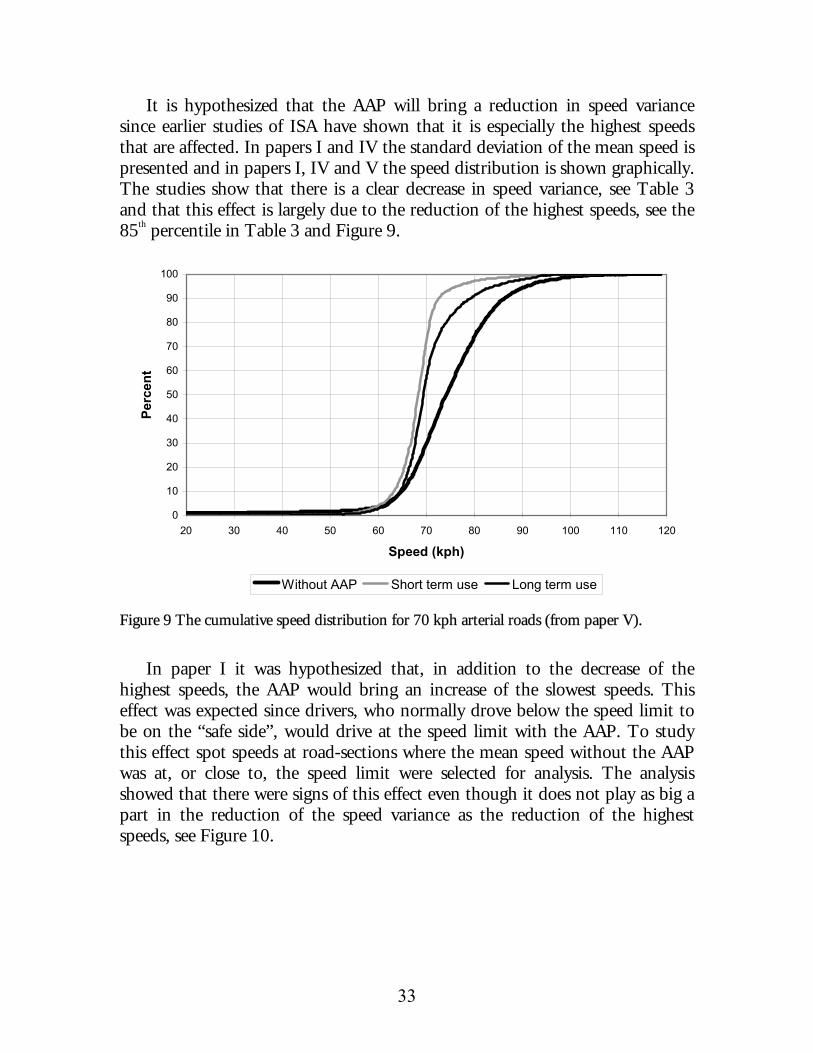
33
It is hypothesized that the AAP will bring a reduction in speed variance since earlier studies of ISA have shown that it is especially the highest speeds that are affected. In papers I and IV the standard deviation of the mean speed is presented and in papers I, IV and V the speed distribution is shown graphically. The studies show that there is a clear decrease in speed variance, see Table 3 and that this effect is largely due to the reduction of the highest speeds, see the 85th percentile in Table 3 and Figure 9.
0
10
20
30
40
50
60
70
80
90
100
20 30 40 50 60 70 80 90 100 110 120
Speed (kph)
Perc
ent
Without AAP Short term use Long term use
Figure 9 The cumulative speed distribution for 70 kph arterial roads (from paper V).
In paper I it was hypothesized that, in addition to the decrease of the
highest speeds, the AAP would bring an increase of the slowest speeds. This effect was expected since drivers, who normally drove below the speed limit to be on the “safe side”, would drive at the speed limit with the AAP. To study this effect spot speeds at road-sections where the mean speed without the AAP was at, or close to, the speed limit were selected for analysis. The analysis showed that there were signs of this effect even though it does not play as big a part in the reduction of the speed variance as the reduction of the highest speeds, see Figure 10.

34
Arterial road, 50 km/h
0
10
20
30
40
50
60
70
80
90
100
30 35 40 45 50 55 60 65 70 75 80
Speed (km/h)
%
Without AAPLong time use
Figure 10 Cumulative speed distribution for arterial roads with 50 kph speed limit (from paper I)
4.1.2. Behaviour in interactions
In paper III the drivers’ behaviour towards other road users was studied and the results showed that their behaviour in interactions improved significantly. The results showed that erroneous yielding when interacting with pedestrians was reduced from 46 percent to 32 percent, see Table 5. The study also showed that the drivers’ yielding behaviour in interactions with other vehicles improved as well. Erroneous yielding decreased from twelve to four percent.
Table 5 Yielding behaviour when driving without and with the AAP (based on paper III)
Without AAP
Long term use
Interaction with pedestrians on pedestrian crossings n % n %
Correct yielding behaviour 64 54 78 68 Erroneous yielding behaviour 54 46 37 32 Total 118 100 115 100
p<0.05
Yielding behaviour when interacting with other vehicles
Correct yielding behaviour 83 88 90 96 Erroneous yielding behaviour 11 12 4 4 Total 94 100 94 100
p<0.1
The instrumented vehicle, used in the in-car observations, made it possible
to measure the distance to the vehicle in front, and since the vehicle registered speed continuously the distance could be converted to time gap. The drivers’

35
chosen time gaps were analysed for the different road types along the test route, but it was only for the 50 kph arterial road that there was sufficient data to trace an effect. The analysis showed that when driving with the AAP they had a larger time gap to the vehicle in front. The difference was small but statistically significant. The average time gap was 1.72 seconds without the AAP and 1.89 seconds with the AAP. The distribution of time gaps is shown in Figure 11. A comparison of time gaps in different speed intervals, regardless of street types, showed that no difference could be found for speeds below 30 kph, but there was a statistically significant increase in the 30-50 kph interval.
0,00
5,00
10,00
15,00
20,00
0 0,2 0,4 0,6 0,8 1 1,2 1,4 1,6 1,8 2 2,2 2,4 2,6 2,8 3
Time gap (sec)
%
Without AAPWith AAP
Figure 11 The distribution of time gaps with and without the AAP for arterial roads (from paper III)
4.1.3. Behavioural adaptation
It was hypothesized that the AAP could have an effect in low speed situations where the drivers drove faster with the AAP than without, due either to compensating for lost time or to driving becoming more automated because of over reliance in the system. In the in-car observations (paper III) there were two observed variables that could have revealed this effect, speed adaptation at obstacles and speed adaptation in low speed situations. For the speed
36
adaptation at obstacles there was a decrease in the proportion of correct speed adaptation, but the decrease was not statistically significant. For speed adaptation with regard to low-speed situations no difference could be found. In paper IV this effect was studied through aggregated speed data in low speed situations such as approach speeds at junctions and turning speeds at junctions. The analysis showed neither higher nor lower speeds in these situations. From paper III we learn that the AAP might have an unwanted effect on behaviour in the form of drivers not lowering their speed in low speed situations, even though the tendencies are weak. From paper IV the conclusion can be drawn that the effect, if it exists, is not large enough to be detected through aggregated speed data.
Another unwanted side effect observed in paper III was the phenomenon of delegation of responsibility. It was found that the drivers, when driving outside the test area, on some occasions forgot to change their speed when the speed limit changed. This effect was found both when the speed limit was lowered and when it was increased. Its occurrence is rare but the difference between the test scenarios is noteworthy. The effect is interpreted as the driver relying too much on the system and therefore making these errors when driving outside the test area where the system does not work automatically. In paper IV the aggregated speeds on these roads were studied but the effect could not be traced in that data, which indicates that the effect was not so frequent that it could be detected through aggregated speed data.
4.2. Safety effect The safety effect of the AAP was estimated using the Power model (Nilsson, 1997; 2000 and 2004) and data used as input to the model was the aggregated speed data for the different road types displayed in Figure 7 on page 30. The decrease in the number of injury accidents after long term use of the AAP was up to 25 percent and for fatal accidents it was up to 32 percent. The relative decrease in speed was greatest on 50 kph arterial roads; thus, it was there that the effect on safety was the greatest, see Table 6.

37
Table 6 The expected decrease in injury and fatal accidents after the introduction of the AAP according to the Power model (from paper I).
Street type / Speed limit (kph)
Mean speed at mid-block (unweighted)
for all stretches (kph)
Expected decrease in the number of injury
accidents %
Expected decrease in the number of fatal
accidents %
V1 V2
(Without
AAP) (Long term
use) (1-(V2/V1)3)*100 (1-(V2/V1)4)*100
Arterial road, 70 kph 76.0 71.1 18 % 23 % Arterial road, 50 kph 55.3 50.3 25 % 32 % Arterial road, 50 kph 52.8 49.1 20 % 25 % Main street, 50 kph 45.2 43.2 13 % 17 % Main street, mixed traffic, 50 kph 38.1 37.1 8 % 10 % Central street, 50 kph 28.7 27.0 17 % 22 %
4.3. Emissions In paper IV emissions were modelled from speed profiles for the different road types studied. It was found that the reduction in emissions was on average 11% for CO, 7% for NOX and 8% for HC. No effects could be found on fuel consumption, but the model is not validated for fuel consumption. The reduction in emissions was statistically significant on 29 stretches for CO, on 27 stretches for NOx and on 21 stretches for HC out of the 67 studied stretches. The largest reduction in emissions was, as for accidents, found on the 50 kph arterial roads with, dual carriageway. It was for this road type that there was a statistically significant reduction in emissions.
4.4. Time consumption In paper IV the speed data from the test vehicles were used to calculate time consumption when driving in the city of Lund, without and with the AAP. The studies on travel times showed a slight increase in travel time on 50 and 70 kph streets and a slight decrease on 30 kph streets. The overall effect was a decrease by 0.6%, which could be considered a marginal effect. The decrease in travel times is assumed to be a result of smoother driving with lower top speeds, which leads to less stopping and waiting at traffic lights.
38
5. DISCUSSION
The concept of ISA has been researched for over twenty years now in more than ten different countries and research projects are currently ongoing in several countries. The studies have all shown significant reductions in speed, estimated to lead to a safety benefit of up to a 40% reduction in injury accidents for a limiting system where the speed limit is dynamically adjusted to the prevailing conditions.
The work carried out in this thesis has shown that the overall effect of the AAP on speed and safety is similar to the systems tested in earlier studies, presented in chapter 1.4.2, which are mainly based on either a limiting speed adaptation system or an audible warning system. It was found that drivers’ speed when driving with the AAP was significantly reduced, especially on the arterial roads where they could choose their speed more freely, without being obstructed by other speed reducing measures. It was further found that the variance in speed was decreased, primarily by the reduction of the highest speeds but also to some extent by an increase of the lowest speeds. This is probably due to the fact that drivers who normally drive below the speed limit speeded up to the speed limit when they were supported by the AAP. These findings support hypothesis 1: The speed level will decrease after long-term use of the AAP, and hypothesis 2: The variance in speed will decrease after long-term use of the AAP. The AAP’s effect on serious injury accidents, based on reductions in mean speed, is estimated to be up to a 25% reduction. In the report summing up the results from all four cities in the large scale trial (Vägverket, 2002) it is concluded that the reduction in the number of road injuries, if everyone had ISA (in this case an AAP or a Beep system), would be at least 20% and as much as 25%. This is based on accident analyses, change in mean speed and speed violations, conflict studies, reduced speed variation and increased consideration shown to unprotected road users.
These estimates are based on the assumption that everyone has ISA, but not everyone wants to have ISA. The studies carried out in this thesis are unique in the sense that there were enough test drivers to allow conclusions to be drawn for various types of drivers. The results were not all positive from a traffic safety point of view. It was found that the drivers who were so in favour of the AAP that they could consider buying a system were already driving at or close to the speed limit. It is likely that they will use this system to support them in driving the way they want to, and in a way that they already do without the AAP. It was further found that the drivers who did not want the system, and who would not use it if it was installed as a driver select system, were the ones in most need of it. The mean speed without the AAP for the drivers who wanted

39
to get rid of the system after trying it for only a few weeks, was more than six kph higher on 70 kph arterial roads than for the drivers who wanted to keep the system. These findings support hypothesis 3: There is a difference in chosen speed depending on your attitude to the AAP. This difference in speed between the various groups of drivers was reduced when driving with the AAP, but it did not disappear altogether. The conclusion of the AAP’s effect on various driver types, based on the Theory of Planned Behaviour (Ajzen, 1988), is that its speed reducing effect is not strong enough to affect drivers who do not have the intention of keeping the speed limit. For a speed adapting system like the AAP to reach its full potential, either peoples’ intentions have to be changed or the system has to be more intrusive, i.e. a mandatory limiting system.
The large scale trials carried out in Sweden were not only unique because of their size, allowing for analyses on a driver type level, but also unique in the sense that the drivers used the system for up to eleven months, making sure that they passed the adaptation period. In this thesis it was shown that speeds initially were reduced when drivers were exposed to the AAP, but then increased somewhat after long term use. In paper I and IV it was assumed that this effect was a result of the drivers getting used to the system, and that they, after some time, learned how to optimize their driving with the system. It was also found that the slower drivers, who without the AAP usually drove below the speed limit, actually speeded up when driving with the system, which further increased the difference between the measurement periods. In paper V, however it was found that the increase was largely due to the speeding up of drivers who were negative to the system and started to use the kick-down function to a higher extent. The assumption in all the studies of this thesis was that, in the long-term measurement period, the speeds had stabilized and would not increase any further. A recent study by Eriksson et al. (2003) however, based on 16 drivers who used the system in their vehicles for one more year after the long term measurement period, shows that speeds increased even more from the long term use (6-11 months) to the “really long term use” (18-23 months), see Figure 12. There were only 16 drivers included in this study (the attitudes of these drivers did not differ significantly from the driver population at large) and the speeds were still lower than without the AAP, but the difference between the measurement periods is so apparent that it further strengthens the statement above that without the driver’s intention of keeping the speed limit, the AAP will not be very efficient.
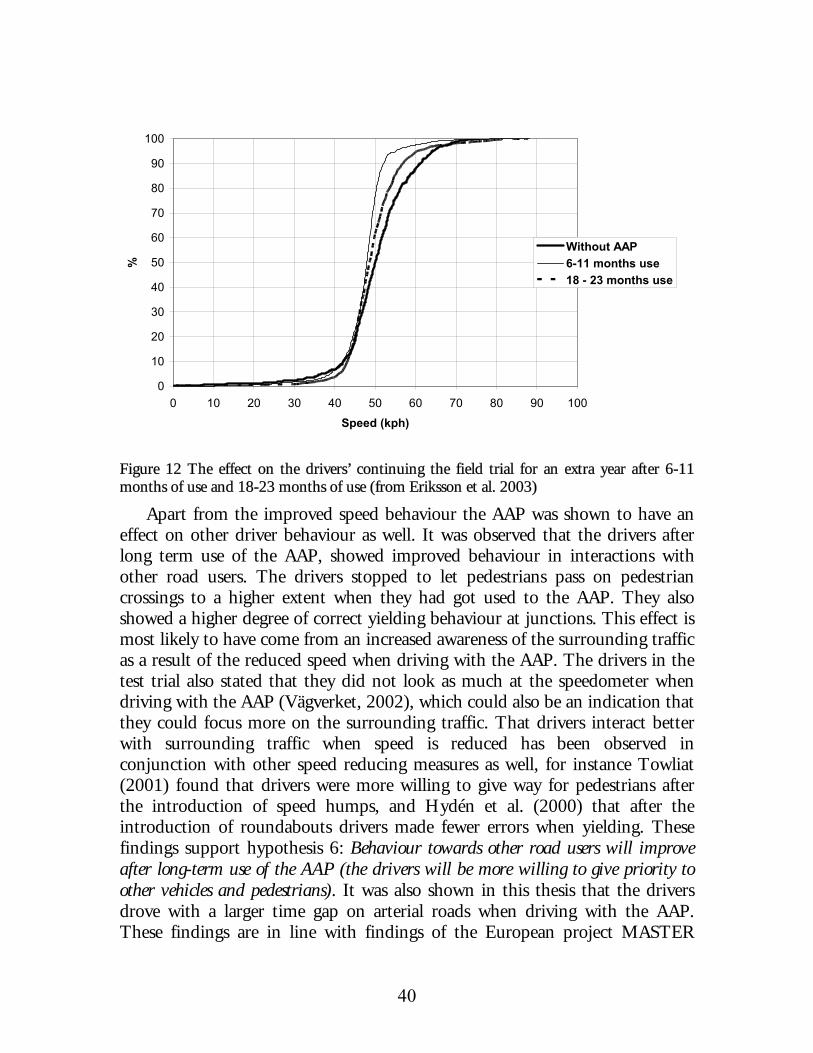
40
0
10
20
30
40
50
60
70
80
90
100
0 10 20 30 40 50 60 70 80 90 100
Speed (kph)
%
Without AAP6-11 months use18 - 23 months use
Figure 12 The effect on the drivers’ continuing the field trial for an extra year after 6-11 months of use and 18-23 months of use (from Eriksson et al. 2003)
Apart from the improved speed behaviour the AAP was shown to have an effect on other driver behaviour as well. It was observed that the drivers after long term use of the AAP, showed improved behaviour in interactions with other road users. The drivers stopped to let pedestrians pass on pedestrian crossings to a higher extent when they had got used to the AAP. They also showed a higher degree of correct yielding behaviour at junctions. This effect is most likely to have come from an increased awareness of the surrounding traffic as a result of the reduced speed when driving with the AAP. The drivers in the test trial also stated that they did not look as much at the speedometer when driving with the AAP (Vägverket, 2002), which could also be an indication that they could focus more on the surrounding traffic. That drivers interact better with surrounding traffic when speed is reduced has been observed in conjunction with other speed reducing measures as well, for instance Towliat (2001) found that drivers were more willing to give way for pedestrians after the introduction of speed humps, and Hydén et al. (2000) that after the introduction of roundabouts drivers made fewer errors when yielding. These findings support hypothesis 6: Behaviour towards other road users will improve after long-term use of the AAP (the drivers will be more willing to give priority to other vehicles and pedestrians). It was also shown in this thesis that the drivers drove with a larger time gap on arterial roads when driving with the AAP. These findings are in line with findings of the European project MASTER
41
(Várhelyi et al., 2001) where it was established that the time gap increased on urban roads. In MASTER it was also shown that the time gap on rural roads decreased, but since the AAP was only active within the city of Lund, that finding could not be tested here. Person et al. (1993) found, in contradiction to these results, that the time gap decreased on urban roads, but it was estimated by observers in the car, not measured like it was in this thesis and in MASTER. So, based on these findings hypothesis 8: The time gap to the vehicle in front will increase can be supported for arterial roads, but for the other road types there is not enough data to support the hypothesis.
Improved speed behaviour, together with other improvements in driver behaviour, augurs well for the AAP’s safety effects, but there are some signs of negative behavioural adaptation effects induced by the system. Effects that can be anticipated when using speed adaptation systems are compensatory effects, i.e. driving at higher speeds with ISA than without in low-speed sections or in areas where the AAP is not active, this to “make up for lost time”. Other negative effects can be automated behaviour and delegation of responsibility to the system, i.e. letting the system control the speed in situations it is not designed for, such as in fog, on slippery roads and when there are unprotected road users in the vicinity. Negative behavioural adaptation effects that have been observed in earlier studies are higher turning speeds (Person et al., 1993) and driving with ISA at a higher speed in adverse weather conditions (Comte, 1999). The latter was observed in a simulator. This is an important phenomenon to study since its occurrence can reduce the safety effect the speed adaptation systems bring; it might also produce “new” accidents which could be disastrous for the acceptance of the system. No behavioural adaptation effects that could have a negative impact on the AAP’s safety potential could be established in this thesis, on the other hand, there were signs of drivers not reducing their speed in low speed areas, and there were also signs of drivers forgetting to change the speed, or changing it late, when entering a new speed limit zone outside the test area where the system was not activated. These events were too rare in the in-car observations to draw any significant conclusions, and also too rare to be revealed by the analysis of speed data from the drivers’ vehicles. Person et al.’s finding that the drivers had a higher speed round corners could not be supported in this study where behaviour after long term use was studied. Hypothesis 4: Drivers will not lower their speed in low speed situations or in areas where they are not supported by the AAP to the same extent when driving with the AAP as when driving without the AAP can therefore not be supported. Still, there are signs of negative behavioural adaptation effects induced by the AAP and this is an area that needs further research.

42
The drivers’ behaviour outside the test area where they were not supported by the AAP was analysed in this thesis to see whether there were any changes induced by the AAP. Changes that could be expected were increased speeds to compensate for the fact that they were restricted within the test area or reduced speeds because they had adapted to the slower driving behaviour from the test area. Their behaviour outside the test area was studied both through the in-car observations and through analysis of their speeds but neither of the studies could reveal any changes in speed behaviour.
The drivers’ law abidance while driving with the AAP was observed as part of the in-car observations. It was assumed that law abidance could be seen as an indicator of behavioural adaptation where an improved law abidance was a sign of a slower more relaxed driving style. The effect could however be negative as a sign of compensatory behaviour, for instance running a red light to make up for lost time. The method used to study this was the in-car observations and one can argue whether or not the drivers were willing to break the law with observers in the car. The argument in favour of it happening is that the drivers would have driven during the in-car observations according to their norm, and, if their norm had changed in this respect during the trial it would have been exposed in their driving behaviour during the observations. The occurrence of these events, however, was low and, even though the results showed a slight decrease in infringements of the law, the severity of the events was too low (consciously driving against yellow and stopping in an area designated for cyclists) to say that there had been a change. The interpretation is that for hypothesis 5: The drivers of AAP-cars will be more inclined to follow traffic regulations: it can not be supported that behaviour has improved, but, it seems that there is no case for the fear that the AAP would bring negative effects either.
One important issue to discuss when studying driver support systems like the AAP is the question of delegation of responsibility, that is, drivers delegating to the system tasks that it is not designed for. This kind of behavioural adaptation effect can appear through change of speed, change of following distance, late braking, change of level of attention, etc. It is also an effect that does not appear immediately when the driving context is changed, but usually appears only after a familiarization period (Draskóczy, 1994). In an OECD report on behavioural adaptation it is concluded that behavioural adaptation to road safety programmes does occur although not consistently (OECD, 1990). In the work done for this thesis it was discovered that the test drivers, after long term use of the AAP, forgot to change their speed in accordance with the speed limit when not supported by the AAP. These events were rare, but the difference between the two test situations was so apparent
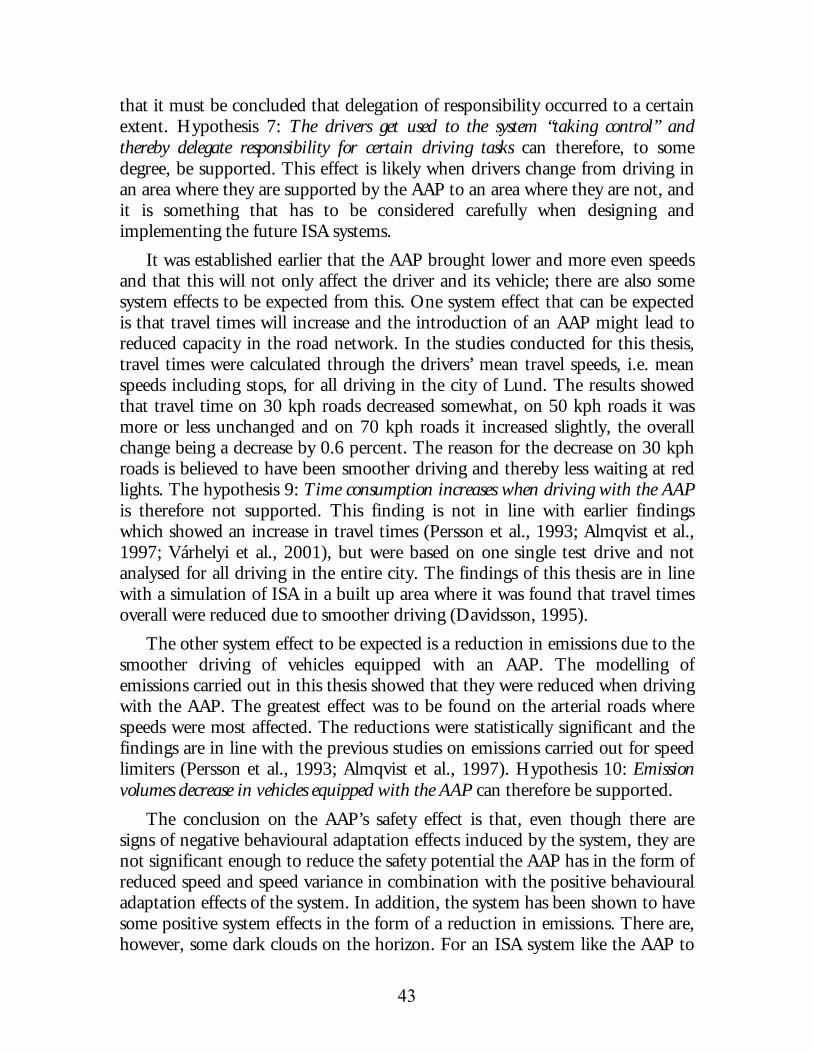
43
that it must be concluded that delegation of responsibility occurred to a certain extent. Hypothesis 7: The drivers get used to the system “taking control” and thereby delegate responsibility for certain driving tasks can therefore, to some degree, be supported. This effect is likely when drivers change from driving in an area where they are supported by the AAP to an area where they are not, and it is something that has to be considered carefully when designing and implementing the future ISA systems.
It was established earlier that the AAP brought lower and more even speeds and that this will not only affect the driver and its vehicle; there are also some system effects to be expected from this. One system effect that can be expected is that travel times will increase and the introduction of an AAP might lead to reduced capacity in the road network. In the studies conducted for this thesis, travel times were calculated through the drivers’ mean travel speeds, i.e. mean speeds including stops, for all driving in the city of Lund. The results showed that travel time on 30 kph roads decreased somewhat, on 50 kph roads it was more or less unchanged and on 70 kph roads it increased slightly, the overall change being a decrease by 0.6 percent. The reason for the decrease on 30 kph roads is believed to have been smoother driving and thereby less waiting at red lights. The hypothesis 9: Time consumption increases when driving with the AAP is therefore not supported. This finding is not in line with earlier findings which showed an increase in travel times (Persson et al., 1993; Almqvist et al., 1997; Várhelyi et al., 2001), but were based on one single test drive and not analysed for all driving in the entire city. The findings of this thesis are in line with a simulation of ISA in a built up area where it was found that travel times overall were reduced due to smoother driving (Davidsson, 1995).
The other system effect to be expected is a reduction in emissions due to the smoother driving of vehicles equipped with an AAP. The modelling of emissions carried out in this thesis showed that they were reduced when driving with the AAP. The greatest effect was to be found on the arterial roads where speeds were most affected. The reductions were statistically significant and the findings are in line with the previous studies on emissions carried out for speed limiters (Persson et al., 1993; Almqvist et al., 1997). Hypothesis 10: Emission volumes decrease in vehicles equipped with the AAP can therefore be supported.
The conclusion on the AAP’s safety effect is that, even though there are signs of negative behavioural adaptation effects induced by the system, they are not significant enough to reduce the safety potential the AAP has in the form of reduced speed and speed variance in combination with the positive behavioural adaptation effects of the system. In addition, the system has been shown to have some positive system effects in the form of a reduction in emissions. There are, however, some dark clouds on the horizon. For an ISA system like the AAP to

44
be efficient in reducing speeds and increasing safety the “right” drivers have to use it in their cars, i.e. the drivers who choose a high driving speed and are negative to the concept of speed adaptation. To further increase the system’s safety effect, the users’ motivation for keeping the speed limit must be increased or the system’s override possibilities must be reduced.
5.1. Policy and recommendations The research carried out in Sweden and throughout the world has shown that there is a clear case for implementing ISA, but there is still nowhere you can buy such a system off the shelf for your car today. Before implementing ISA there are some issues that have to be solved such as technical issues, legal and financial issues and system architecture. Nonetheless it is relevant to discuss how to implement ISA and whether the full possible safety effects should be achieved at the expense of popularity.
A proper comparison of the effectiveness of the systems tested in SNRA’s large scale trial (the Beep system and the AAP) was not carried out, but an effort was made in Vägverket (2002) to draw some comparative conclusions. Figure 13 below shows the speed distribution for an arterial road or a high standard main street with a high degree of “free” vehicles. It shows that both systems reduced speeds significantly and that the reduction in speed and speed variance was somewhat higher for the AAP (in the figure called “active gas”). It should be noted though that the comparison is between drivers of a beep system in the city of Borlänge and drivers of the AAP in the city of Lund.
Figure 13 Frequency diagram for speed of test cars equipped with ISA systems (from Vägverket, 2002)

45
In the large scale trial (where an emphasis was put on drivers’ attitudes and acceptance of the systems) members of the public were asked how interested they were in acquiring various ISA-systems and how efficient they believed them to be in increasing safety (Draskóczy and Hjälmdahl, 2002). The results show that as the level of influence on the driver is increased, the interest is decreased, see Figure 14. Interestingly enough, the systems’ perceived efficiency in increasing safety was in line with the respondents’ interest in acquiring it, that is, the more controlling the system is, the less efficient in increasing safety it is perceived to be, see Figure 15.
1
2
3
4
5
Beep Beep with display AAP with display Speed limiter with display
ISA-system
Figure 14 To what extent would you be interested in obtaining the following. (The answer was on a five grade scale where 1 = not interested and 5 = very interested) (From Draskóczy and Hjälmdahl, 2002)
1
2
3
4
5
Beep Beep with display AAP with display Speed limiter with display
ISA-system
Urban roads
Rural roads
Figure 15 Various ISA-systems’ perceived efficiency to improve safety. (The answers were on a five grade scale where 1 = not efficient and 5 = very efficient) (From Draskóczy and Hjälmdahl, 2002)
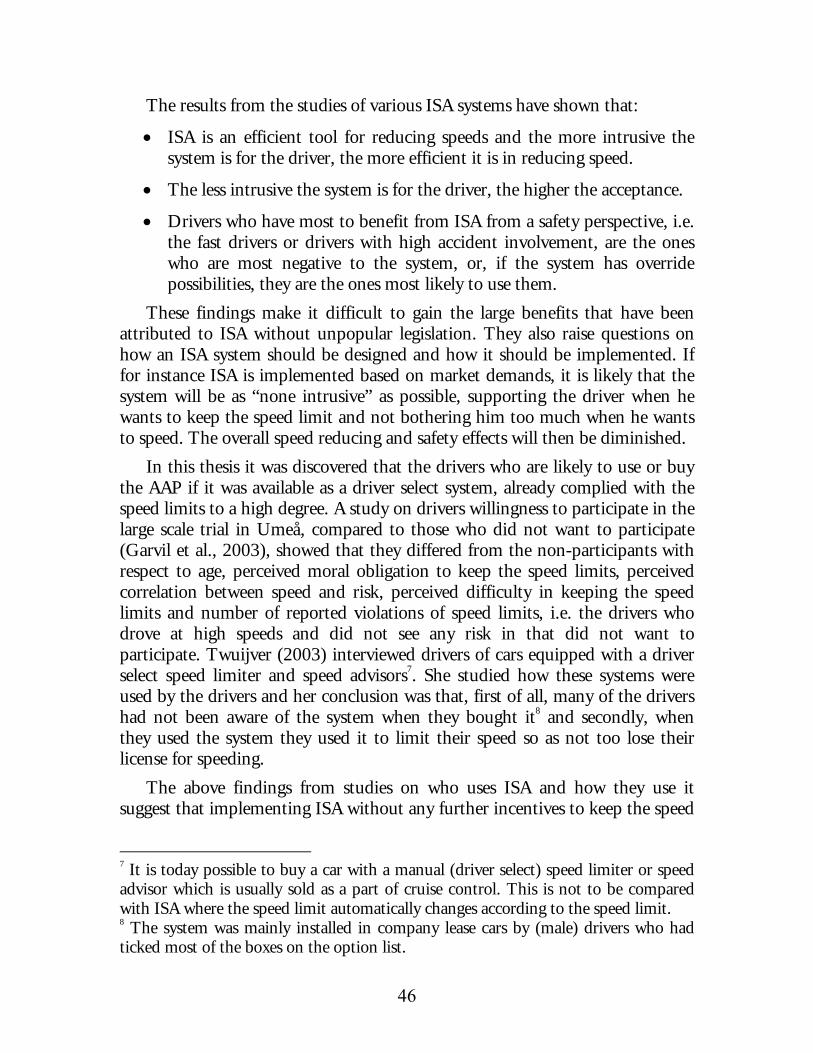
46
The results from the studies of various ISA systems have shown that:
• ISA is an efficient tool for reducing speeds and the more intrusive the system is for the driver, the more efficient it is in reducing speed.
• The less intrusive the system is for the driver, the higher the acceptance.
• Drivers who have most to benefit from ISA from a safety perspective, i.e. the fast drivers or drivers with high accident involvement, are the ones who are most negative to the system, or, if the system has override possibilities, they are the ones most likely to use them.
These findings make it difficult to gain the large benefits that have been attributed to ISA without unpopular legislation. They also raise questions on how an ISA system should be designed and how it should be implemented. If for instance ISA is implemented based on market demands, it is likely that the system will be as “none intrusive” as possible, supporting the driver when he wants to keep the speed limit and not bothering him too much when he wants to speed. The overall speed reducing and safety effects will then be diminished.
In this thesis it was discovered that the drivers who are likely to use or buy the AAP if it was available as a driver select system, already complied with the speed limits to a high degree. A study on drivers willingness to participate in the large scale trial in Umeå, compared to those who did not want to participate (Garvil et al., 2003), showed that they differed from the non-participants with respect to age, perceived moral obligation to keep the speed limits, perceived correlation between speed and risk, perceived difficulty in keeping the speed limits and number of reported violations of speed limits, i.e. the drivers who drove at high speeds and did not see any risk in that did not want to participate. Twuijver (2003) interviewed drivers of cars equipped with a driver select speed limiter and speed advisors7. She studied how these systems were used by the drivers and her conclusion was that, first of all, many of the drivers had not been aware of the system when they bought it8 and secondly, when they used the system they used it to limit their speed so as not too lose their license for speeding.
The above findings from studies on who uses ISA and how they use it suggest that implementing ISA without any further incentives to keep the speed
7 It is today possible to buy a car with a manual (driver select) speed limiter or speed advisor which is usually sold as a part of cruise control. This is not to be compared with ISA where the speed limit automatically changes according to the speed limit. 8 The system was mainly installed in company lease cars by (male) drivers who had ticked most of the boxes on the option list.

47
limit will have a much lower effect than the predicted 20 – 25 % reduction in severe injury accidents. The system will merely serve as a comfort system, making it easier for drivers to comply with the speed limit when and if they want to. On the other hand, implementation of a limiting system through legislation, which would be very efficient in terms of reducing the number of accidents, is a very unpopular and difficult way to go and it is not likely that any government will go down that road in the near future.
For ISA to be implemented and have an impact, I believe that a demand for keeping the speed limit has to be created. According to Theory of Planned Behaviour (Ajzen, 1988), an individual’s behaviour is determined by his/her intentions, which in turn is determined by the attitude to the behaviour and the subjective norm (see Figure 2). So, if drivers do not intend to keep the speed limit, they will not do it unless they are forced to. But even if they want to keep the speed limit, lack of control may prevent them from doing so. Therefore, if a demand for keeping the speed limit is created, ISA will be requested by drivers as a tool to help them with that task. Lindberg (2003) carried out an experiment with ISA drivers in the city of Borlänge, where drivers using an advisory ISA system got a bonus for participating and for each minute they drove above the speed limit, that bonus was reduced. The study showed that drivers with the economic incentive reduced their speed violations more than the “zero priced” ISA drivers (control group). He also found that a group with a higher bonus reduced their speed violations more than a lower priced group. This clearly shows that putting an advisory ISA in the car will only work satisfactorily if drivers are motivated to keep the speed limit. Lindberg’s experimental approach to creating a demand is not a practical solution for a large scale implementation, but there are other ways to create a demand for keeping the speed limit. They can be divided into encouragement (the carrot) or punishment (the whip). The carrot can be tax reductions or fuel price reductions for drivers who can show that they keep the speed limit. It can also be trade advantages for companies that have quality assured their transports by showing that they drive safely; for instance transport purchasers in municipalities or governmental authorities can demand that speed violations are logged and reported when buying transport services. The whip would be to make sure that speed offenders get fined to a higher degree than they do today, for instance by increasing police surveillance or by increasing the number of speed cameras.
Another major obstacle to implementing ISA straight away is that, even though the technology exists today, the basic infrastructure for it is lacking. Myhrberg (2002) lists three target areas that have to be considered for implementation.

48
1. Digital maps
2. Communication with the vehicles
3. In-vehicle HMI
For ISA to work properly all vehicles must have access to a map containing all the speed limits. There are ongoing projects today where accurate maps are being developed; the Swedish National Road Data Base (Vägverket, 2003c) is one example. Progress is rather slow though and there is still a long way to go before an accurate, continuously updated data base exists. The next area is communication with the vehicles; for an ISA system to work on a large scale the map data base in the vehicles must be updated continuously, and for this to work there must be stable communication with the vehicles. In the large scale trial in Sweden, GSM was tested for updating the maps in the vehicles, but the technology did not match the demands. There is new technology in the pipeline, such as 3G telecommunications, allowing faster and more stable data communication, and within a couple of years the technology should be implemented on a broad basis. The last piece of the implementation puzzle is the in-vehicle HMI. Systems tested so far have been custom-made for each research project and retro fitted to the vehicles. The technology has improved over the years, according to the demands of the researchers and feed-back from the end users and there is technology today that works satisfactorily. There has also been some development from vehicle manufacturers and several makes of cars such as Mercedes, Renault and Saab can be bought with a “driver select” speed limiter or speed advisor where the driver manually sets the maximum speed. Development is also ongoing for ISA systems; see for instance Bachmann (2000) for information about BMW’s work in the area. There is no doubt that if there is a demand for ISA vehicle manufacturers will provide customers with an in-vehicle HMI that will meet customer workability demands.
5.2. Final remarks Since the idea was first introduced in the early eighties Intelligent Speed Adaptation systems like the AAP have been considered as a possibility for future speed management and there have always been more problems than solutions, and more questions than answers. In addition there has also been strong opposition to the systems from vehicle manufacturers and implementation has never been anything more than futuristic ideas. In the last couple of years however, both technological development and research on ISA have changed the conditions radically and in Sweden there is now a program being developed by the SNRA on how to implement ISA, starting with the SNRA’s own vehicles in 2004 (Vägverket, 2003d). It has not yet been decided what or which
49
systems are to be used more than that they will be either advisory or advisory intervention systems. The general idea of the program is to let the market decide as much as possible what the system will look like. The findings of this thesis have shown that such an approach will not be very effective unless it is combined with other measures to increase drivers’ intentions of keeping the speed limit. Such measures, for instance more enforcement and demands that the speed limits are followed when purchasing transportation services, are mentioned in SNRA’s program. This thesis has shown that, if a demand for keeping the speed limit is created, an ISA system like the AAP is an efficient tool to increase safety on our roads.

50
REFERENCES
Åberg, L., Larsen, L., Glad, A., Beilinsson, L. (1997) Observed vehicle speed
and drivers' perceived speed of others, Applied Psychology 3(46): 287-302.
Ajzen, I. (1988) Attitudes, personality and behaviour, Open University Press, Ballmoor, USA.
Almqvist, S., Towliat, M. (1993) Aspen track, Estimation of traffic safety benefits by using transmitted road side information to the vehicle, Lund University, Lund, Sweden.
Almqvist, S., Nygård M. (1997) Dynamic Speed Adaptation, Field trials with automatic speed adaptation in an urban area, Lund University, Lund, Sweden.
Armour, M. (1984) A review of the literature on police traffic law enforcement, Australian Road Research Board: 17-25, Australia.
Bachmann, T., Naab, K., Reichart, G., Schraut, M. (2000) Enhancing traffic safety with BMW’s driver assistance approach connected drive, Proceedings of the 7th World Congress on Intelligent Transport Systems, Turin, Italy.
Brookhuis, K., de Waard, D. (1999) Limiting speed, towards an intelligent speed adapter (ISA), Transportation Research Part F: Traffic Psychology and Behaviour 2(2): 81-90.
Carlqvist, T., Persson, H., (1988) Polisrapporterade olyckor, Projekt Växjö (Accidents reported to the police, Project Växjö, In Swedish), Lund University, Lund, Sweden.
Carsten, O., Comte, S. (1997) UK Work on Automatic Speed Control. Proceedings of the ICTCT 97 conference, 5-7 November 1997, Lund, Sweden.
Carsten, O., Fowkes, M. (2000) External Vehicle Speed Control. Executive Summary of Project Results, University of Leeds, Leeds, UK.
Carstensen, G. (2002) The effect on accident risk of a change in driver education in Denmark, Accident Analysis & Prevention 34(1): 111-121.
Carstensen, G., Christiansen, I. (1993) Bilisters holdinger til risiko i trafiken – interviewundersögelse (Car drivers’ view on risk in traffic – interviews, In Danish), Rådet för Trafiksikkerhedsforskning, Notat 3/1993, Copenhagen, Denmark.

51
Comte, S., Várhelyi, A., Santos, J. (1997) The effects of ATT and non-ATT systems and treatments on driver speed behaviour, Working Paper R 3.1.1 in the MASTER project, VTT, Espoo, Finland.
Comte, S.L. (1998) Simulator study on the effects of ATT and non-ATT systems and treatments on driver speed behaviour, Working Paper R 3.1.2 in the MASTER project. VTT, Espoo, Finland.
Comte, S., (2001) Intelligent Speed Adaptation: Evaluating the possible effects of an innovative speed management system on driver behaviour and road safety, University of Leeds, Leeds, UK.
Davidsson, F. (1995) Grönt för smarta signaler (Green light for smart signals, In Swedish), TFK rapport 1995:6, Stockholm, Sweden.
Delaney, A., Lough, B., Whelan, M., Cameron, M. (2003) Review of mass media campaigns in road safety, Monash University Accident Research Centre, Melbourne, Australia.
DETR (2000) New directions in speed management – A review of policy, Eland House, London, UK.
Draskóczy, M. (Ed.), (1994) Guidelines on safety evaluation, DRIVE Project V2002 – HOPES, Lund University, Lund, Sweden.
Draskóczy, M., Hjälmdahl, M. (2002) Lundabornas inställning till trafiksäkerhet, hastighet och hastighetsanpassning. Resultat från enkätundersökningar före- och efter ISA försöket i Lund (The citizens of Lund’s view on traffic safety, speed and speed adaptation, In Swedish), Lund University, Lund, Sweden.
Duynstee, L., Katteler, H., Martens, G. (2001) Intelligent Speed Adaptation: Selected results of the Dutch practical trial, Proceedings of the 8th ITS world congress, Sydney, Australia.
Eklund, A., (2002) Effekter av fysiska åtgärder (Effects of physical measures, In Swedish), Vägverket, Borlänge, Sweden.
Elvik, R. (1997) Evaluations of road accident blackspot treatment: a case of the iron law of evaluation studies?, Accident Analysis & Prevention 29(2): 191-199.
Elvik, R., Mysen, A., Vaa, T. (1997) Trafikksikkerhetshåndbok (Traffic safety handbook, In Norwegian), Transportøkonomisk Institutt, Oslo, Norway.
Elvik, R. (2000) How much do road accidents cost the national economy?, Accident Analysis and Prevention 32 (2000) 849-851.

52
Erikson, A., Hjälmdahl, M., Várhelyi, A., (2003) Långtidseffekt av aktiv gaspedal på hastighetsbeteende – Analys av kömönster hos kvarvarande testförare i LundaISA försöket (Effects on speed behaviour after long term use of active accelerator pedal – Analysis of driving patterns of remaining drivers in the LundaISA trial, In Swedish) Lund University, Lund, Sweden.
ETSC (1999) Exposure data for travel risk assessment: Current practise and future needs in the EU, European Transport Safety Council, Brussels, Belgium.
European Comission (2003a) Energy and transport in figures http://europa.eu.int/comm/energy_transport/etif/index.html downloaded 2003-11-04
European Comission (2003b) Att rädda 20 000 liv på våra vägar – Ett gemensamt ansvar (To save 20 000 lives on our roads – a mutual responsibility, In Swedish) Byrån för Europeiska gemenskapens officiella publikationer, Luxemburg.
Evans, L. (1991) Traffic safety and the driver, Van Nostrand Reinhold, New York, USA.
Falk, E., Hjälmdahl, M., Risser, R. (2002) Testförarnas attityd till ISA: resultat från enkätundersökningar (Test drivers’ attitude to ISA: results from questionnaire studies, In Swedish), Lund University, Lund, Sweden.
Fildes, B., Rumbold, G., Leening, A. (1991) Speed behaviour and drivers' attitude to speeding, Monash University Accident Research Centre, Report 16, Melbourne, Australia.
Finch, D., Kompfner, P. (1994) Speed, speed limits and accidents, TRL, Crowthorne, UK.
Garvill, J., Marell, A., Westin, K. (2003) Factors influencing drivers' decision to install an electronic speed checker in the car, Transportation Research Part F: Traffic Psychology and Behaviour 6(1): 37-43.
Haglund, M., Åberg, L. (2000) Speed choice in relation to speed limit and influences from other drivers, Transportation Research Part F: Traffic Psychology and Behaviour 3(1): 39-51.
Hammarström, U., Karlsson, B. (1987) VETO: Ett datorprogram för beräkning av transportkostnader som funktion av vägstandard, (VETO: A computer program for calculating transport costs as function of road standard In Swedish), VTI meddelande 501, Statens Väg- och Trafikinstitut, Linköping, Sweden.

53
Höfner, K. (1967) Fahrverhalten und Persönlichkeitsbeurteilung junger Mopedfahrer, Eine Gegenüberstellung von wissentlicher und unwissentlicher Beobachtung des Fahrverhaltens, University of Vienna, Vienna, Austria.
Hyden, C., Várhelyi, A. (2000) The effects on safety, time consumption and environment of large scale use of roundabouts in an urban area: a case study, Accident Analysis & Prevention 32(1): 11-23.
Kaufmann, C. (2002). Behaviour of car drivers on Austrian motorways on weekends, ICTCT workshop, Nagoya, Japan.
Keall, M., Povey, L., Frith, W. (2002) Further results from a trial comparing a hidden speed camera programme with visible camera operation, Accident Analysis & Prevention 34(6): 773-777.
Lahrmann, H., Runge, J., Boroch, T. (2001) Intelligent Speed Adaptation – Development of a GPS based ISA-system and field trail of the system with 24 test drivers, Aalborg University, Aalborg, Denmark.
Lave, C., Elias, P. (1994) Did the 65 mph speed limit save lives?, Accident Analysis & Prevention 26(1): 49-62.
Lex Service (1997) 1997 Lex report on motoring: Driving for safety, Lex Service, London, UK. In DETR (2000) New directions in speed management – A review of policy, Eland House, London, UK.
Liban, C., Vingilis, E., Bflegen, H. (1987) The Canadian drinking-driving countermeasure experience Accident Analysis & Prevention 19(3): 159-181.
Lindberg, G. (2003) Intelligent Economic Speed Adaptation, Statens Väg- och Trafikinstitut, Linköping, Sweden.
Lunds Kommun (2004) Lunds kommun, statisitk – Lundastatistik. http://www.lund.se/kommuninformation/03_statistik/01_lundastatistik.asp Downloaded 2004-02-18.
Marell, A., Westin, K. (1999) Intelligent transportation system and traffic safety - drivers perception and acceptance of electronic speed checkers, Transportation Research Part C,1999, 131 -147.
Maycock, G., Brocklebank. P., Hall. (1998) Road layout design standards and driver behaviour, TRL Report 332, Crowthorne, UK. In DETR (2000) New directions in speed management – A review of policy, Eland House, London, UK.

54
Myhrberg, S., Thunquist, C., Holting, S., Rusk, J., (2000) Försök med elektronisk hastighetsuppföljning i Borlänge. Etapp 2 – Försök med 20 fordon (Trial with electronic speed control in Borlänge. Stage 2 – Trial with 20 vehicles), VBB VIAK, SWECO, Sweden.
Myhrberg, S. (2002) ISA Teknikrapport - Slutrapport för delprojekt teknik (ISA report on technology – Final report for sub-project technology, In Swedish), Vägverket, Borlänge, Sweden.
Näätänen, R., Summala, H. (1976) Road user behaviour and traffic accidents, North Holland, Amsterdam, The Netherlands.
National Highway Traffic Safety Administration (1998) The effect of increased speed limits in the post -NMSL era. Report to congress, U.S. Department of Transportation, Washington DC, USA.
Nilsson, L., Berlin, M. (1992) Driver attitudes and behavioural changes related to presentation of roadside information inside the car. A pilot study of the CAROSI system, VTI-meddelande 689 A, Linköping, Sweden.
Nilson, G. Anderson, G. (1997) Speed management in Sweden: Speed, speed limits and safety, VTI, Linköping, Sweden.
Nilsson, G. (2000) Hastighetsförändringar och trafiksäkerhetseffekter – Potensmodellen, VTI notat 76, VTI, Linköping, Sweden.
Nilsson, G. (2004) Traffic safety dimensions and the power model to describe the effect of speed on safety, Bulletin 221, Lund University, Lund, Sweden.
Nilsson, G., Andersson, G., Brüde, U., Larsson, J., Thulin, H. (2002) Trafiksäkerhetsutvecklingen i Sverige fram till år 2001, VTI rapport 486, VTI, Linköping, Sweden
OECD (1990) Behavioural adaptations to changes in the road transport system, OECD Road Transport Research, Paris, France.
Ossiander, E., Cummings, M. (2002) Freeway speed limits and traffic fatalities in Washington State, Accident Analysis & Prevention 34(1): 13-18.
Päätalo, M., Peltola, H., Kallio, M. (2001) Intelligent speed adaptation – effects on driving behaviour. Traffic safety on three continents, Moscow, Russia.
Persson, H., Towliat, M., Almqvist, S., Risser, R., Magdeburg, M. (1993) Hastighetsbegränsare i bil. Fältstudie av hastigheter, beteenden, konflikter och förarkommentarer vid körning i tätort (Speed-limiters in cars. On-road study on speeds, behaviour, conflicts and drivers comments when driving in built up areas, In Swedish), Lund University, Lund, Sweden.
55
Pyne, H. (1997) Review of the literature on the relationship between speed and accidents, Deliverable 1 in External Vehicle Speed Control Project, University of Leeds, Leeds, UK.
Quimby, A., Maycock, G., Palmer,C., Grayson, G. (1999) Drivers’ speed choice – an in depth study, TRL report 326, Crowthorne, UK. In DETR (2000) New directions in speed management – A review of policy, Eland House, London, UK.
Rathmayer, R. Beilinson, L. Kallio, M. Raitio, J. (1999) Kokeenjohtajan ja näkyvien mittalaitteiden yhteys ajokäyttäytymiseen instrumentoidussa autossa (The observers and the visual instruments effect on driving behaviour when driving in an instrumented vehicle), VTT, Esbo, Finland.
Regan, M. (2004) Personal communication with Dr Michael Regan
Risser, R. (1985) Behaviour in traffic conflict situations, Accident Analysis and Prevention 17(2): 179-197.
Risser, R., Chaloupka, C. (1996) The safety priorities catalog of the PROMETHEUS traffic safety group, Lund University, Lund, Sweden.
Risser, R. Ed. (1997) Assessing the Driver. “Der Mensch im Verkehr”, Cologne, Germany.
Risser R., Lehner U. (1997) Evaluation of an ACC (Autonomous Cruise Control) system with the help of behaviour observation, Presentation on the 4th World Congress on Intelligent Transport Systems, Berlin, Germany.
Rothengatter, J. A. (1990) Normative behaviour is unattractive if it is abnormal: Relations between norms, attitudes and traffic law, Paper in proceedings of OECD symposium on enforcement and rewarding: Strategies and effects. Copenhagen
Rumar, K. (1986) The role of perceptual and cognitive filters in observed behaviour, VTI särtryck 111 A, VTI, Linköping, Sweden.
Salusjärvi, M. (1981) Speed limit experiments on public roads in Finland, Technical Research Centre of Finland, Esbo, Finland.
Saad, F., Malaterre, G., (1982) La regulation de la vitesse: Analyse des aides au controle de la vitesse (Regulation of speed, an analysis of aides to control the speed, In French), ONSER, France.
SIKA (2003) Vägtrafikskador 2003 (Road traffic injuries, In Swedish), Statens Institut för kommunikationsanalys, Stockholm, Sweden.

56
Stradling, S., Meadows, M. Beatty, S. (1999) Factors affecting car use choices, Transport Research Institute Report, Napier University, Edinburgh, UK. In DETR (2000) New directions in speed management – A review of policy, Eland House, London, UK.
Towliat, M. (2001) Effects of safety measures for pedestrians and cyclists at crossing facilities on arterial roads, Lund University, Lund, Sweden.
Twuijver, van, M. (2003) Car owners experience with ICC/ACC systems, Presentation on ICTCT workshop in Soesterberg, The Netherlands 30-31 October, 2003.
Várhelyi, A. (1996) Dynamic speed adaptation based on information technology - a theoretical background, Lund University, Lund, Sweden.
Várhelyi, A., Mäkinen, T. (2001) The effects of in-car speed limiters: field studies, Transportation Research Part C: Emerging Technologies 9(3): 191-211.
Várhelyi, A., Hydén, C., Hjälmdahl, M., Almqvist, S., Risser, R., Draskóczy, M. (2002) Effekterna av aktiv gaspedal i tätort. Sammanfattande rapport. LundaISA (The effects of an active accelerator pedal in urban areas, In Swedish), Lund University, Lund, Sweden.
Vägverket (2000) Den eviga hastighetsfrågan - en inblick i Vägverkets sektorsredovisning för 1999 med lärdomar för framtiden (The eternal speed issue – an insight in SNRA’s sector reports with insight for the future, In Swedish), Remissversion 2000-06-22, Borlänge, Sweden.
Vägverket (2002) Intelligent Speed Adaptation (ISA), Results of large-scale trials in Borlänge, Lidköping, Lund and Umeå during the period 1999-2002, Vägverket publication 2002:89, Borlänge, Sweden.
Vägverket (2003a) 1950-1999 http://www.vv.se/traf_sak/statistik/nationell/1950-2002.htm Downloaded 2003-11-04.
Vägverket (2003b) Säker trafik - Nollvisionen på väg http://www.vv.se/publ_blank/bokhylla/trafiksakerhet/nollvisionen/saker_trafik/Nollvisionen.pdf Downloaded 2003-11-05.
Vägverket (2003c) NVDB – Nationell vägdatabas http://www.vv.se/nvdb Downloaded 2003-11-19.

57
Vägverket (2003d) Inriktning för Vägverkets arbete med att få ett brett införande av ISA-system i Sverige (SNRA’s program for a large implementation of ISA-systems in Sweden, In Swedish), Vägverket, Borlänge, Sweden.
Vägverket (2004) Nollvisionen - grunden för svensk trafiksäkerhet http://www.vv.se/tsweb/ts_nollvisionen_grundtrfsak.shtml Downloaded 2004-02-27.
Watts, G., R. (1973) Road humps for the control of vehicle speeds, TRL Report 597, Crowthorne, UK.
Webster, D., Wells, P. (2000) The characteristics of speeders, TRL, Crowthorne, UK.
Wilde, G. (1994) Target risk, PDE Publications, Toronto, Canada.
WHO (2003) World health day 2004 http://www.who.int/world-health-day/2004/en/traffic_facts_en.pdf Downloaded 2003-11-19.
Zaidel, D. (1992) A modeling perspective on the culture of driving, Accident Analysis & Prevention 24(6): 585-597.